
Comparison of Actual and Reference Evapotranspiration Between Seasonally Frozen and Permafrost Soils on the Tibetan Plateau
 , ,
, ,  and
and
Abstract
1. Introduction
2. Sites and Data
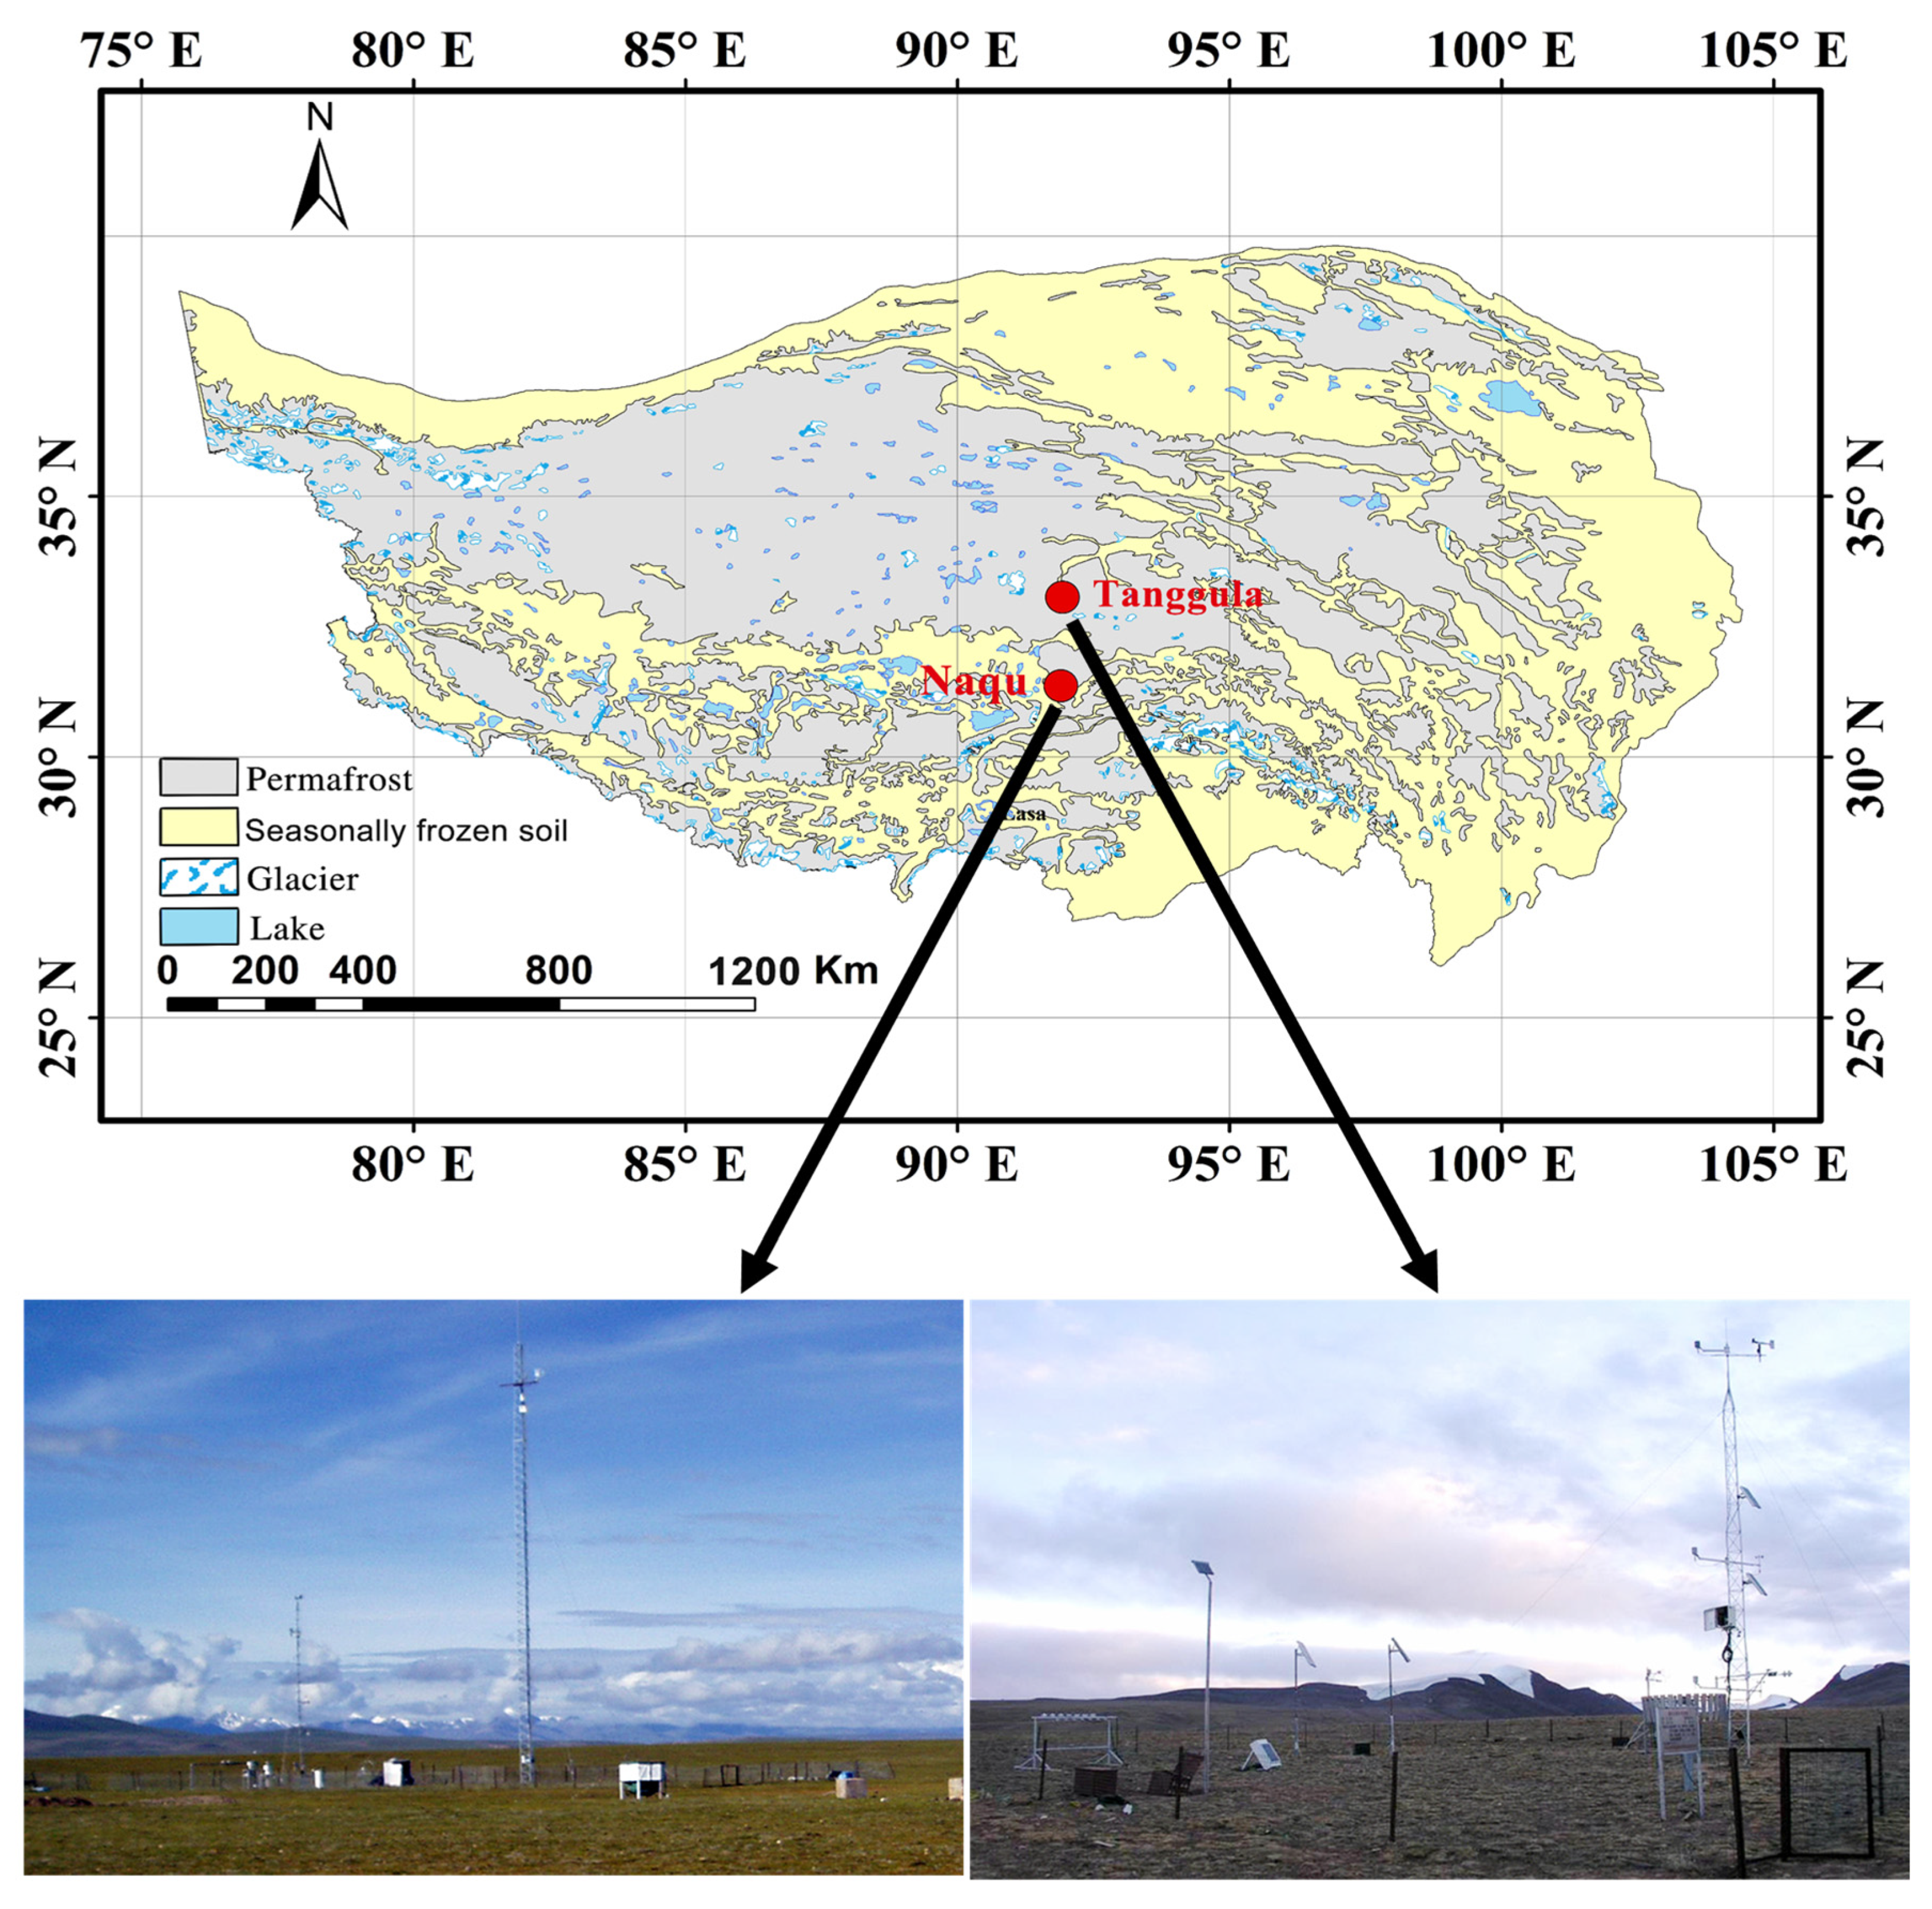
2.1. Sites
2.2. Data
3. Methods
3.1. Calculating ETa
3.2. Calculating ET0
3.3. Calculating Kc
4. Results
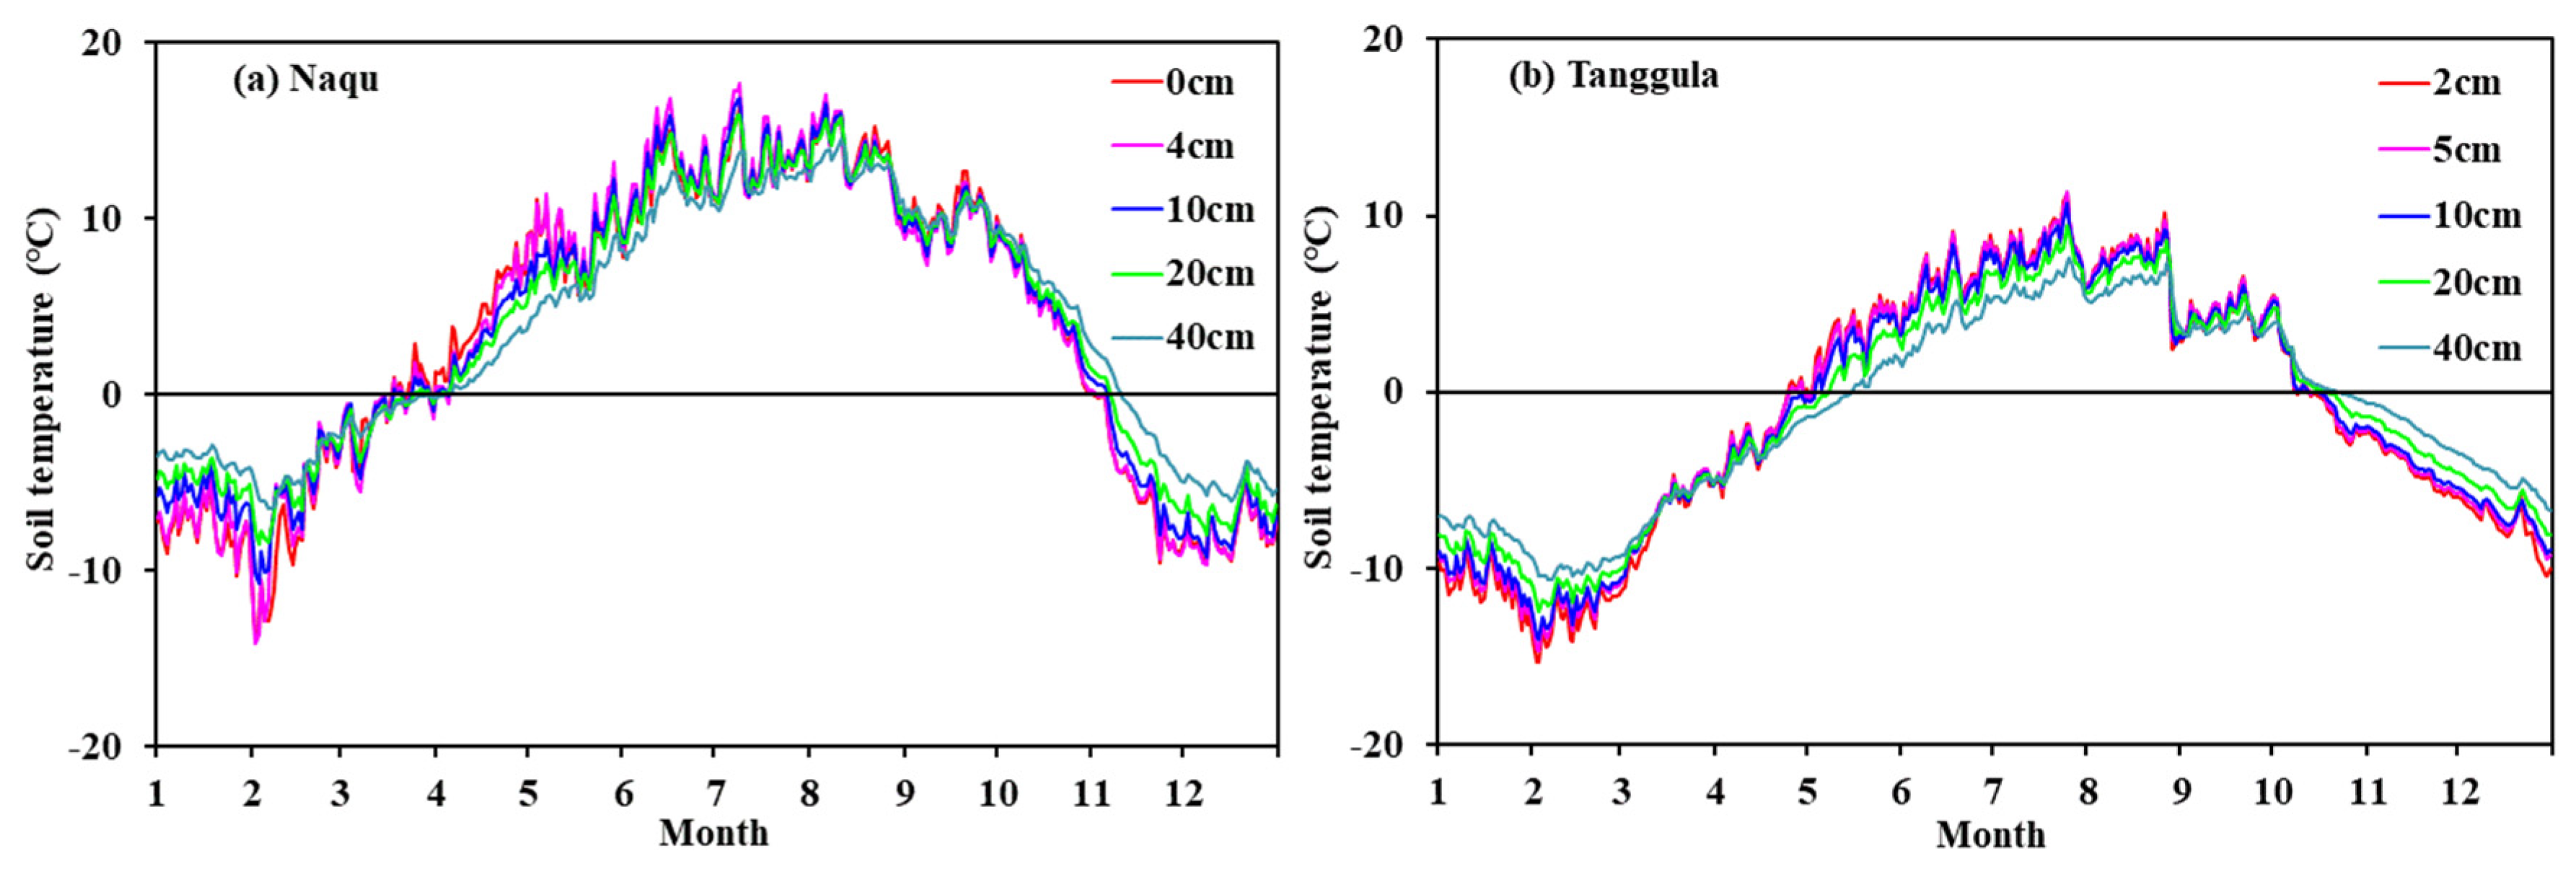
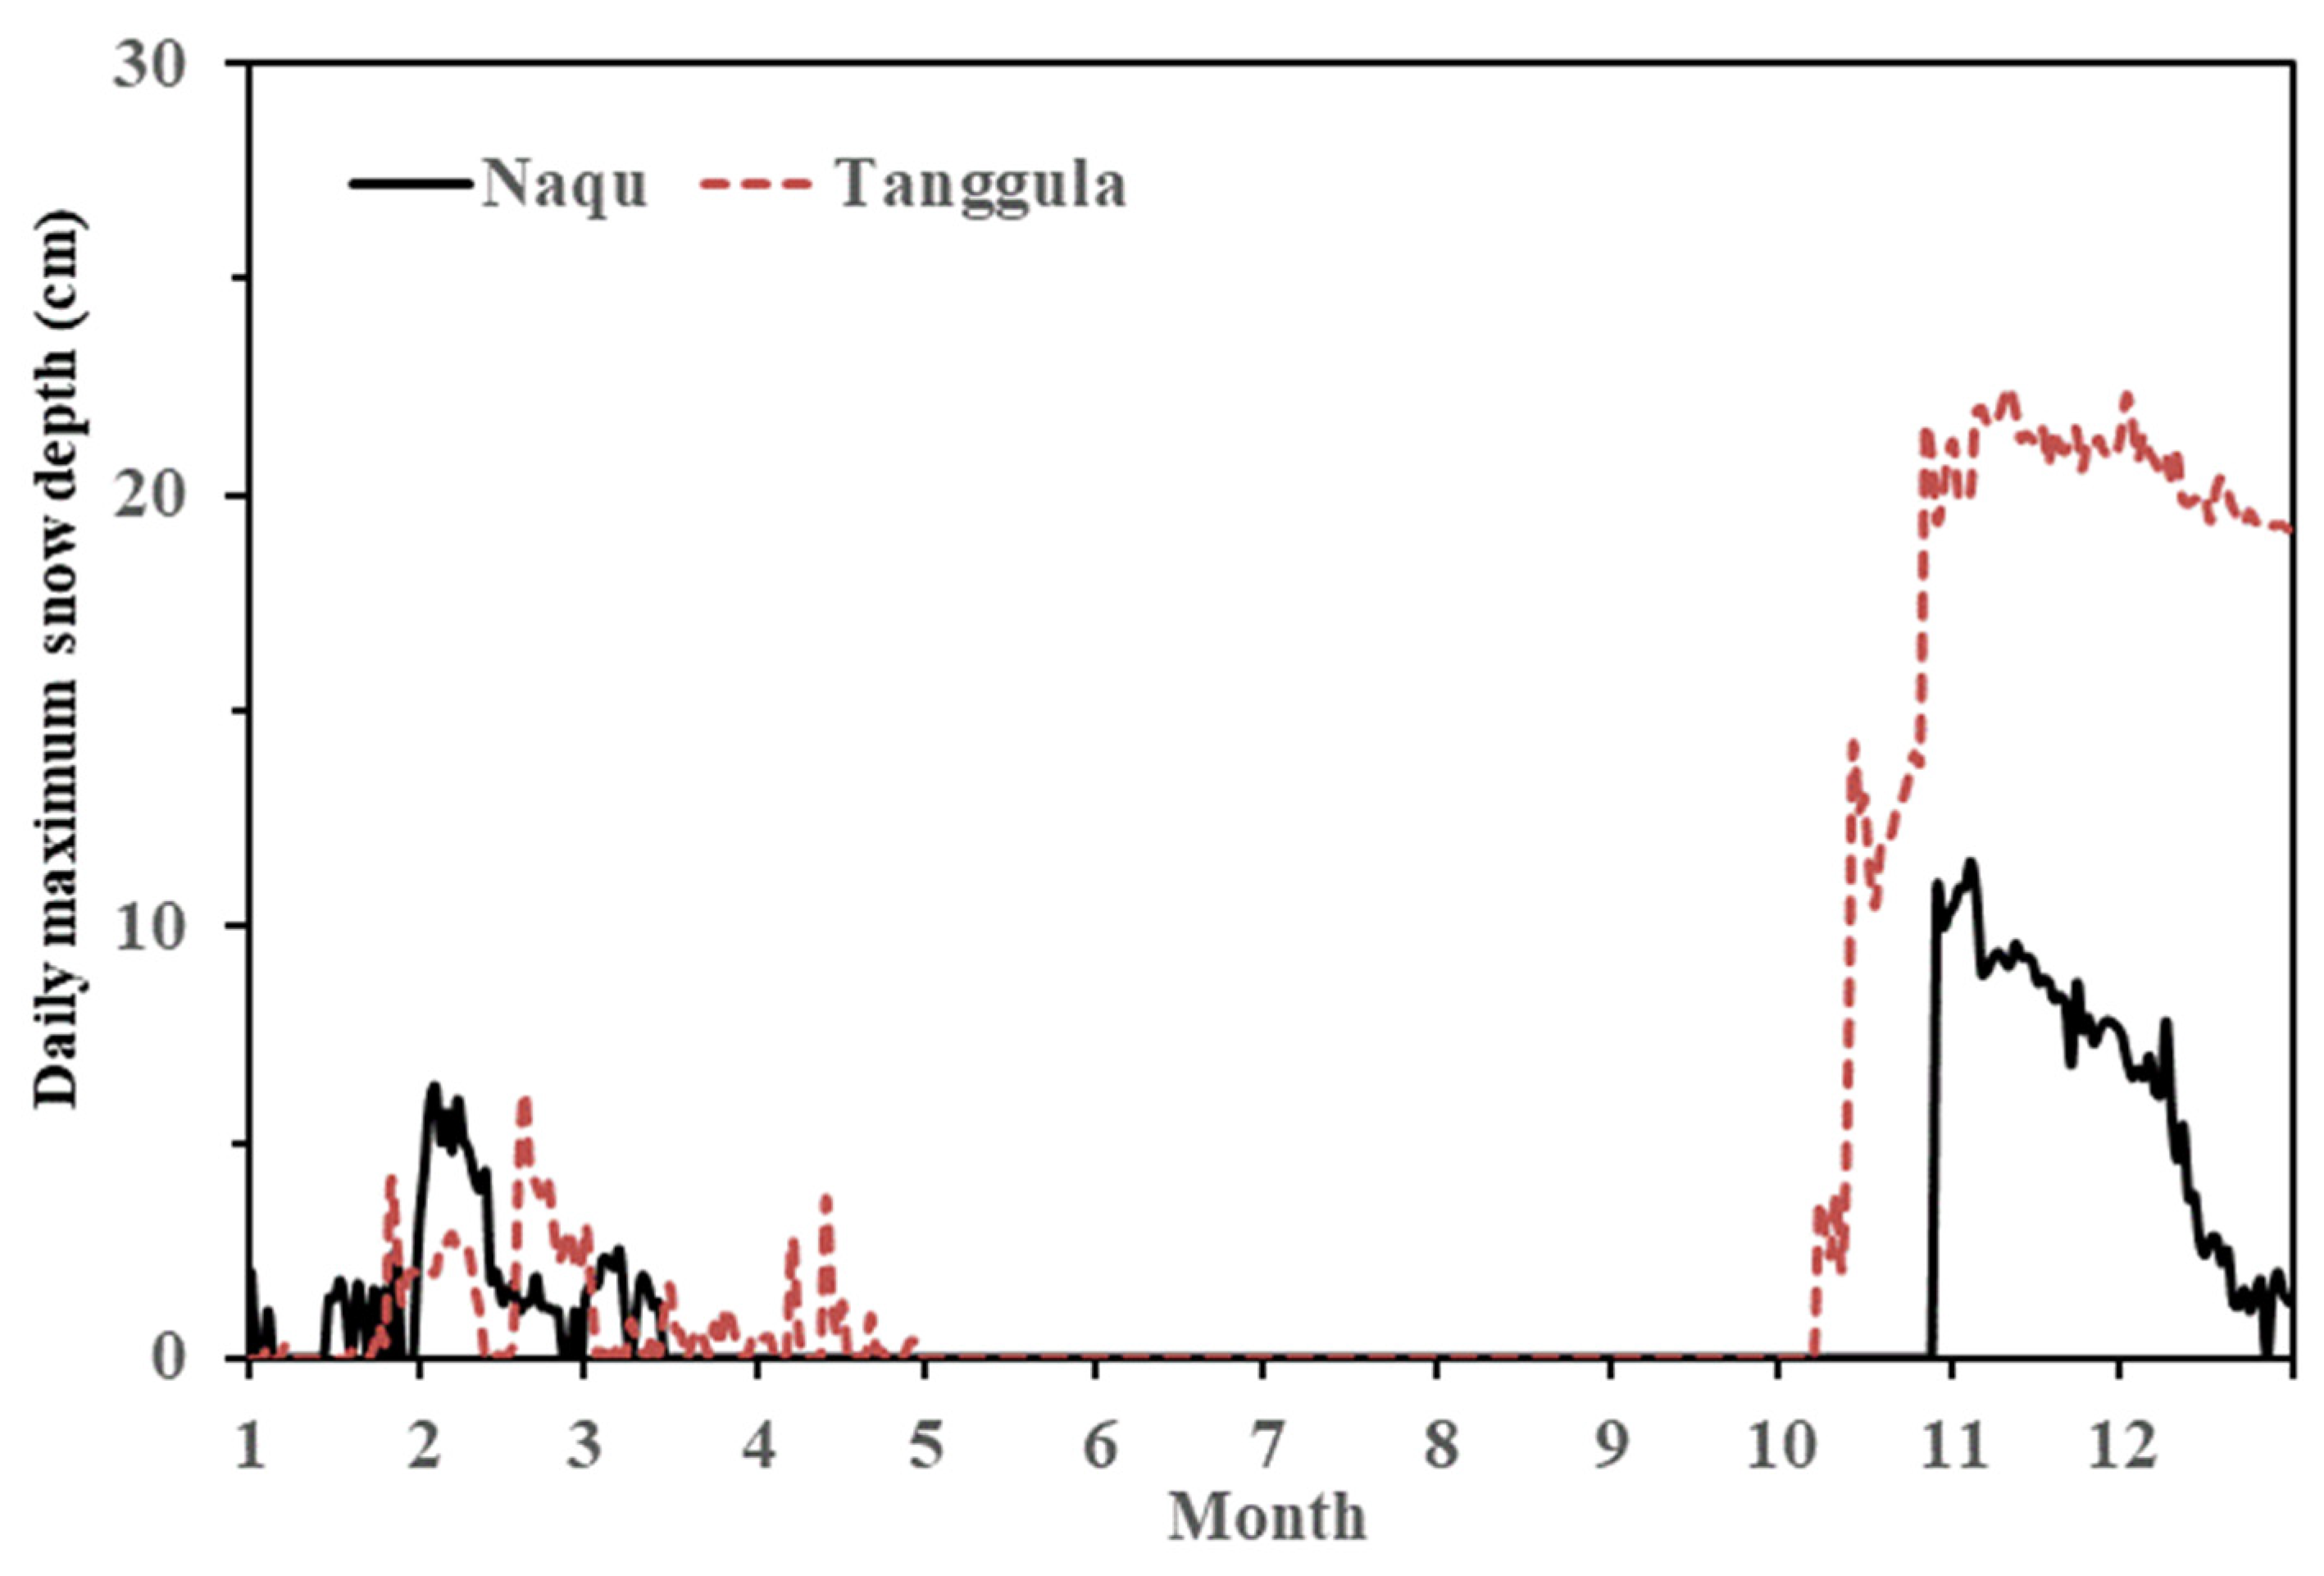
4.1. Variations in Meteorological Elements
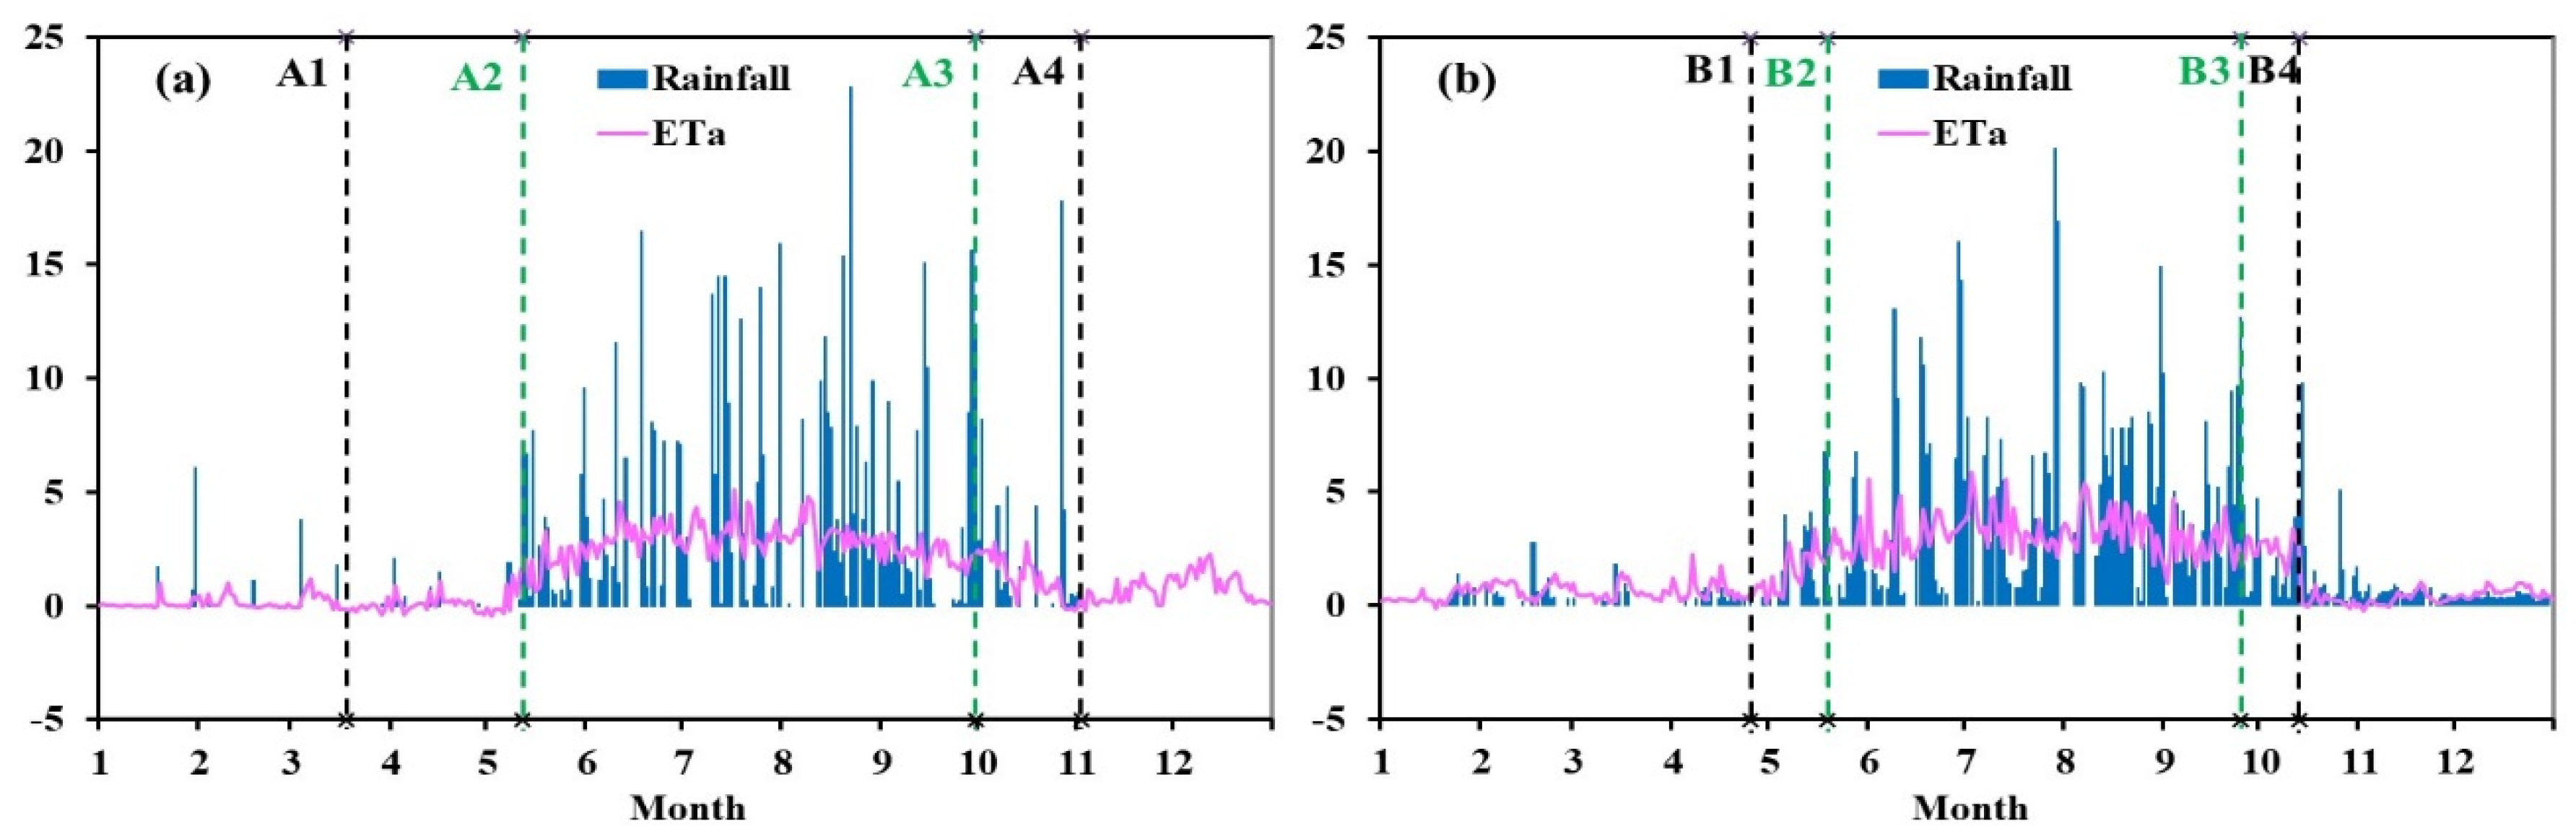
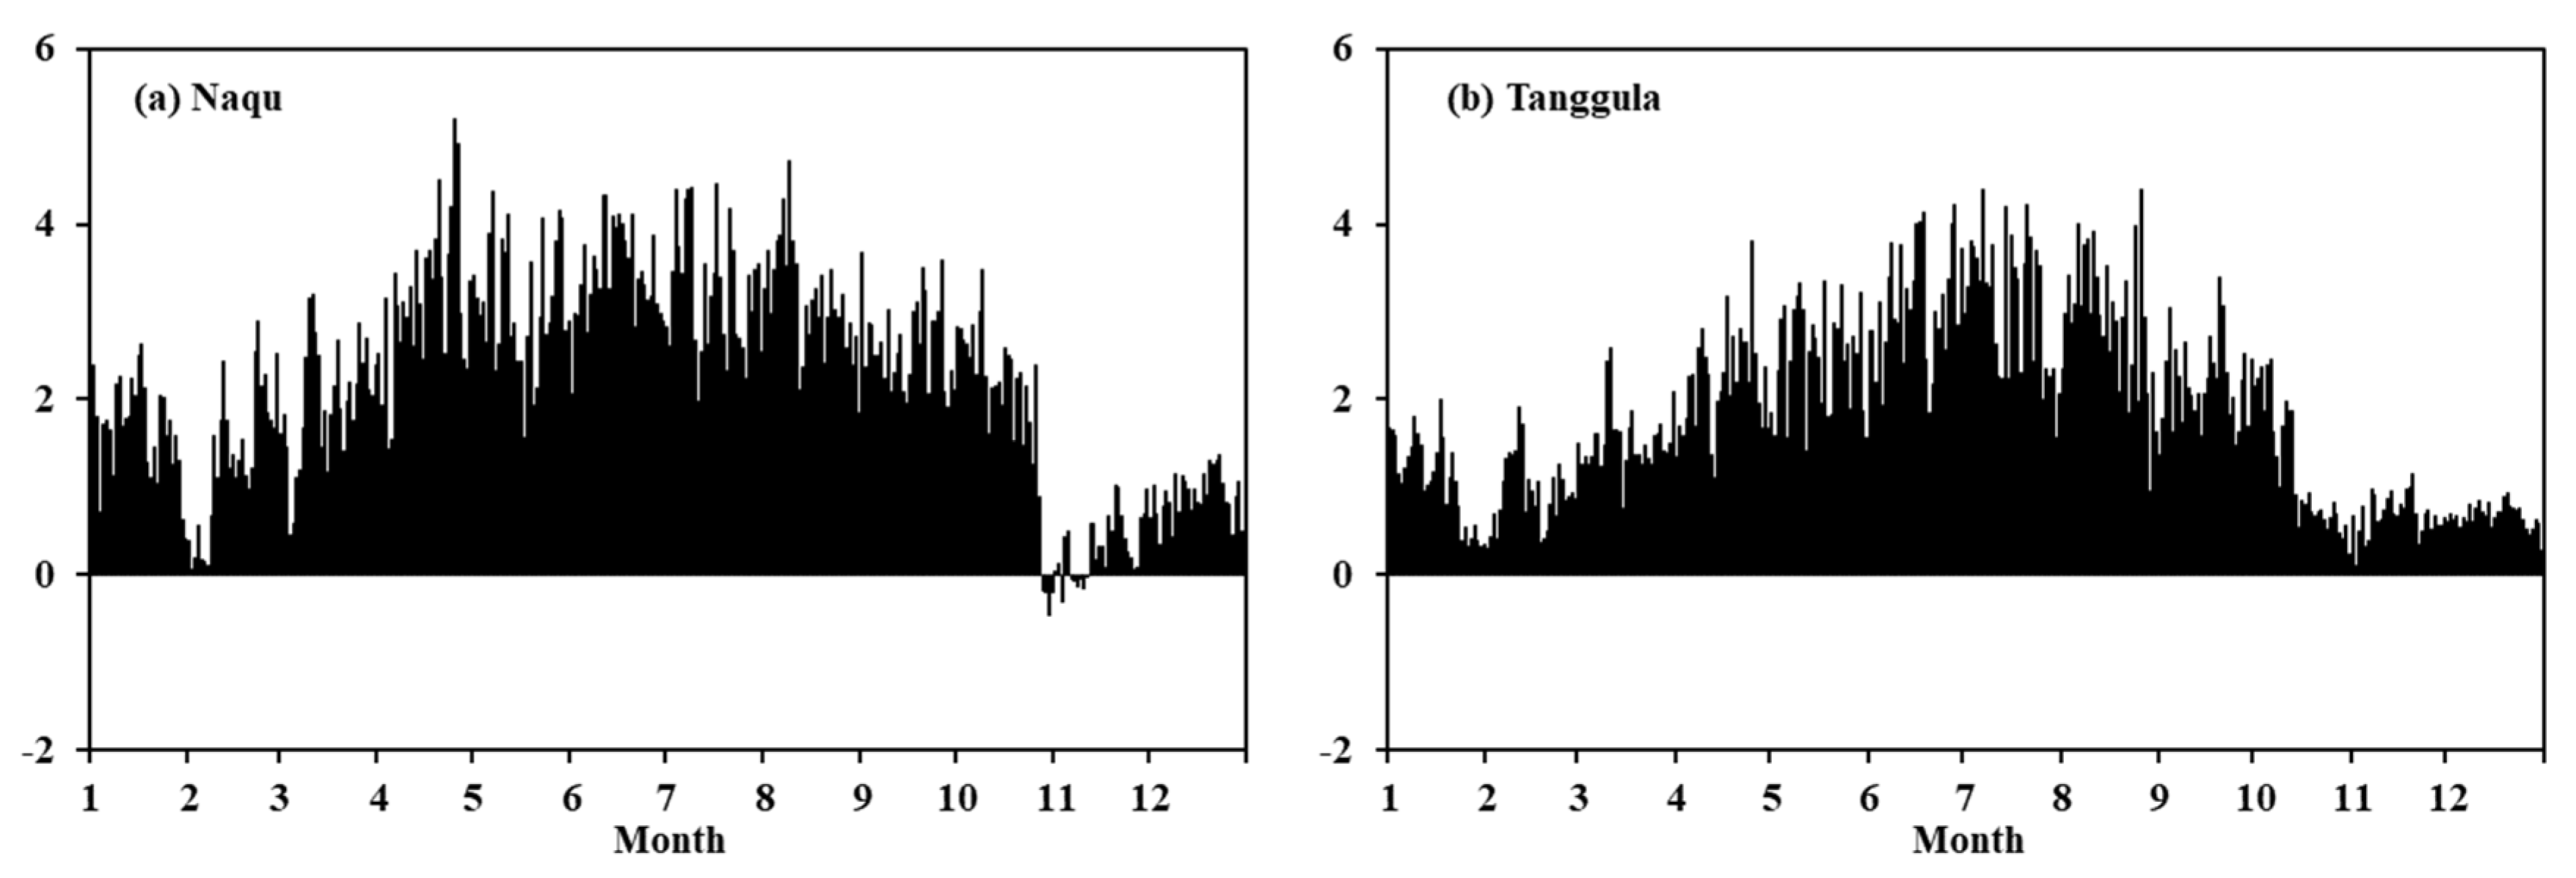
4.2. Variations in ETa
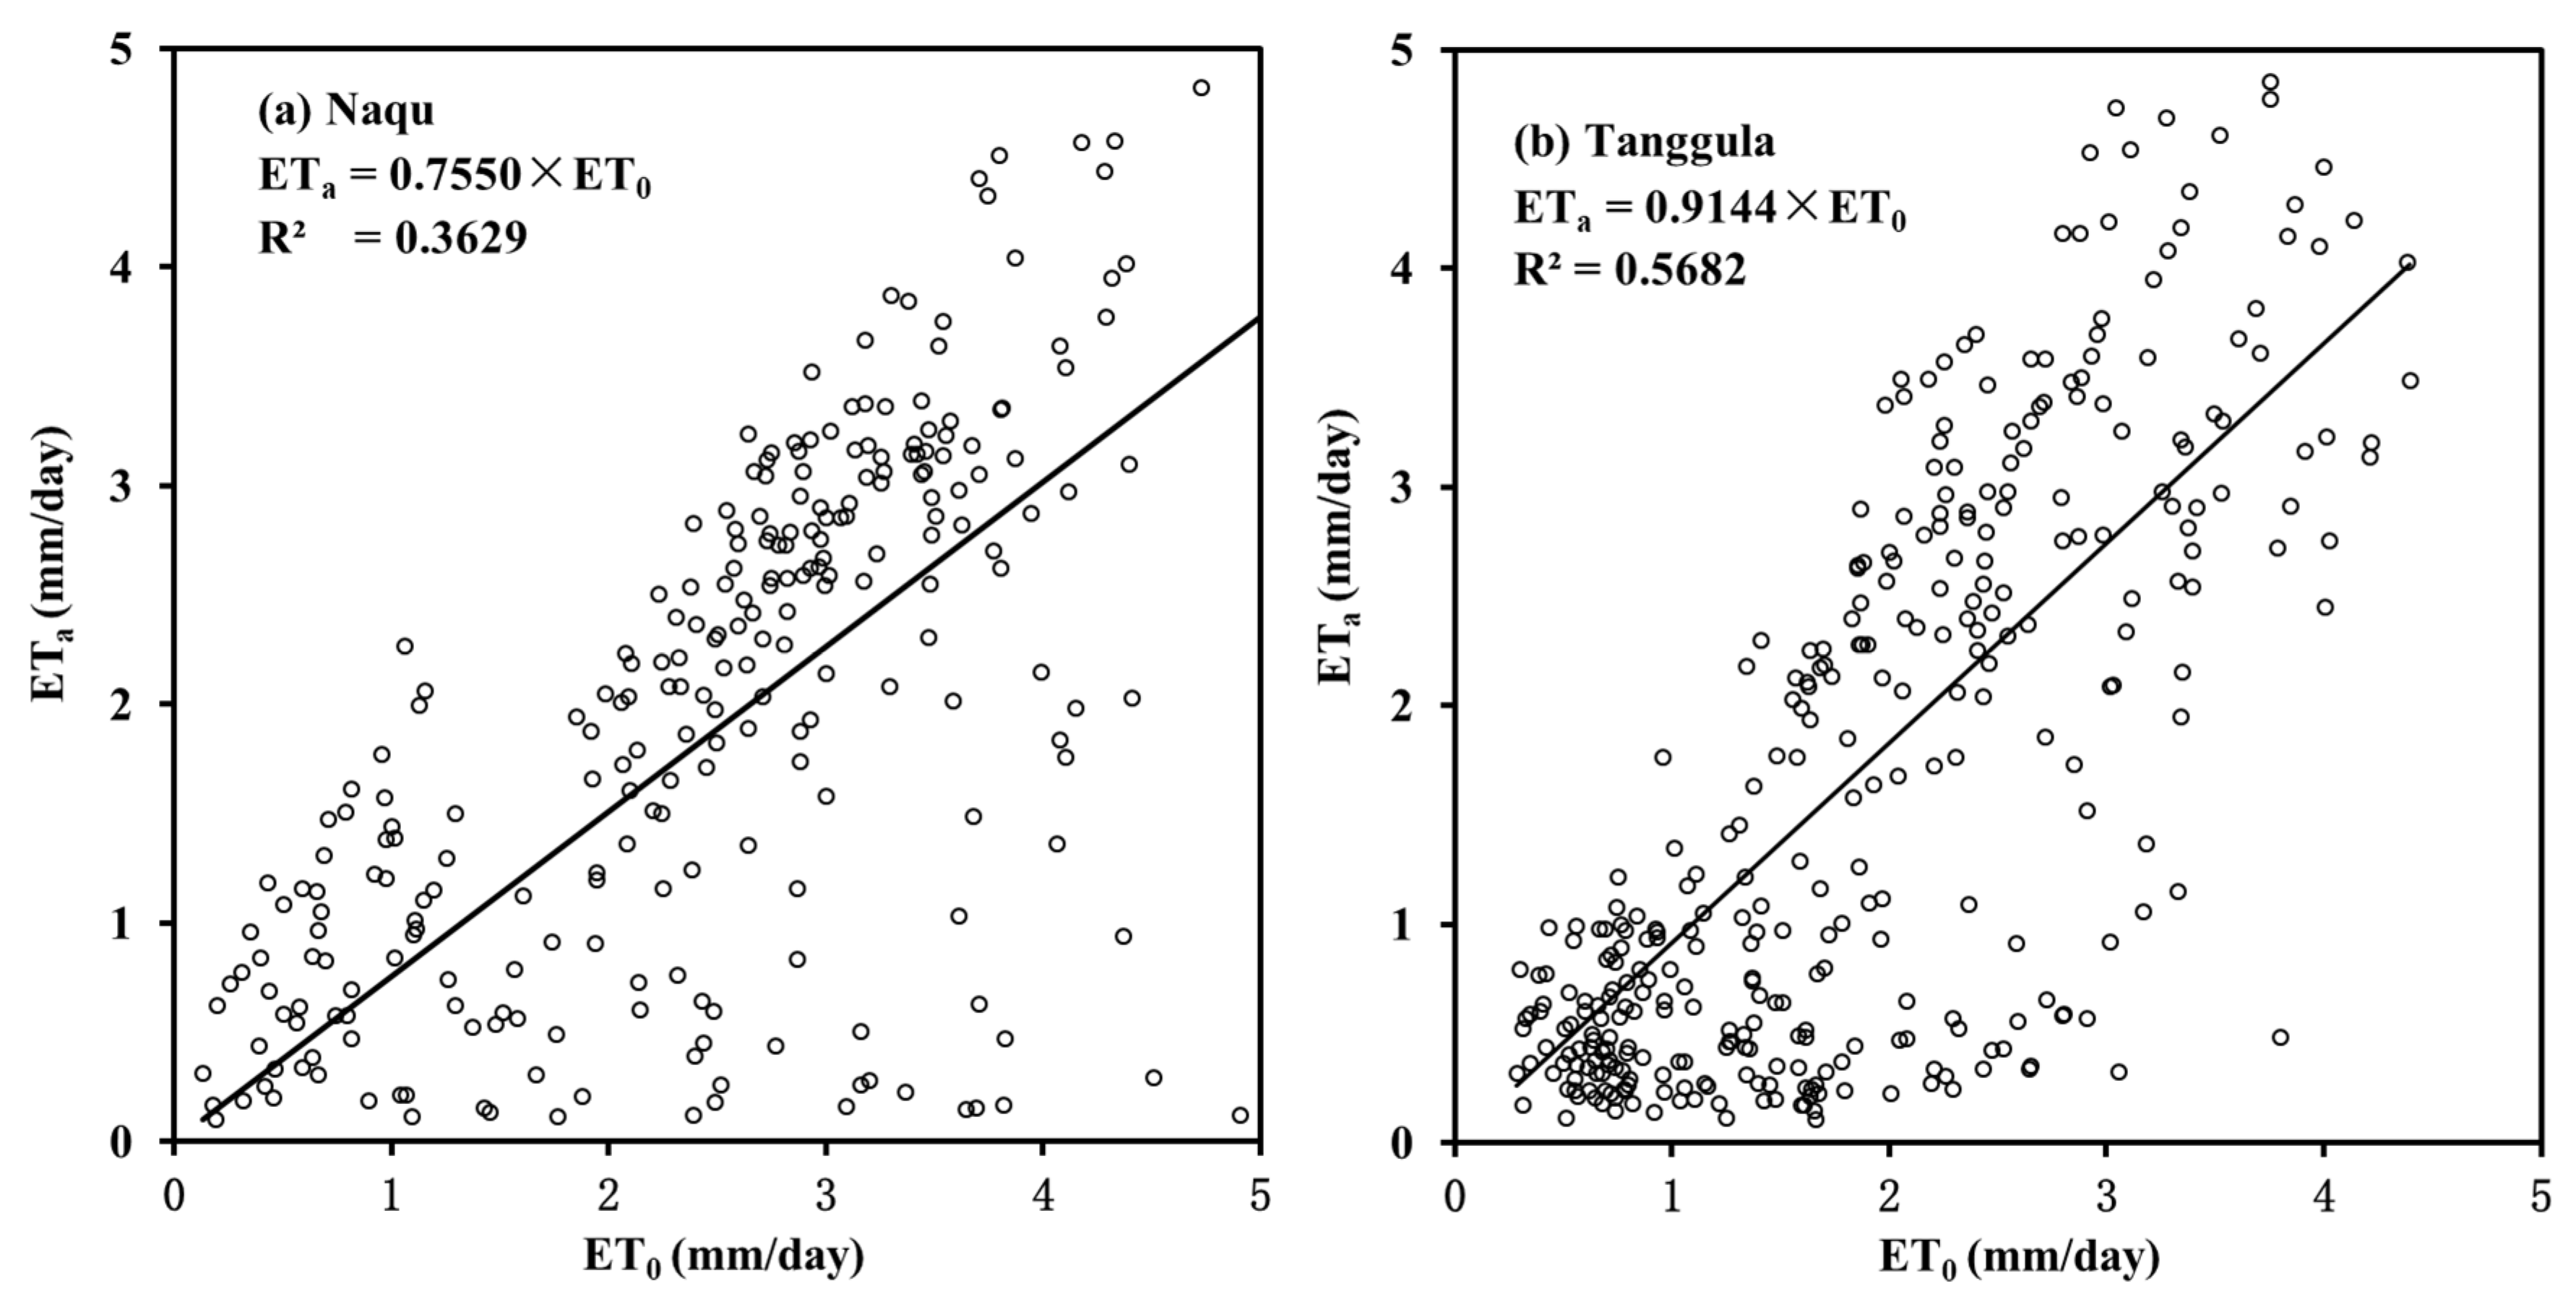
4.3. Variations in ET0
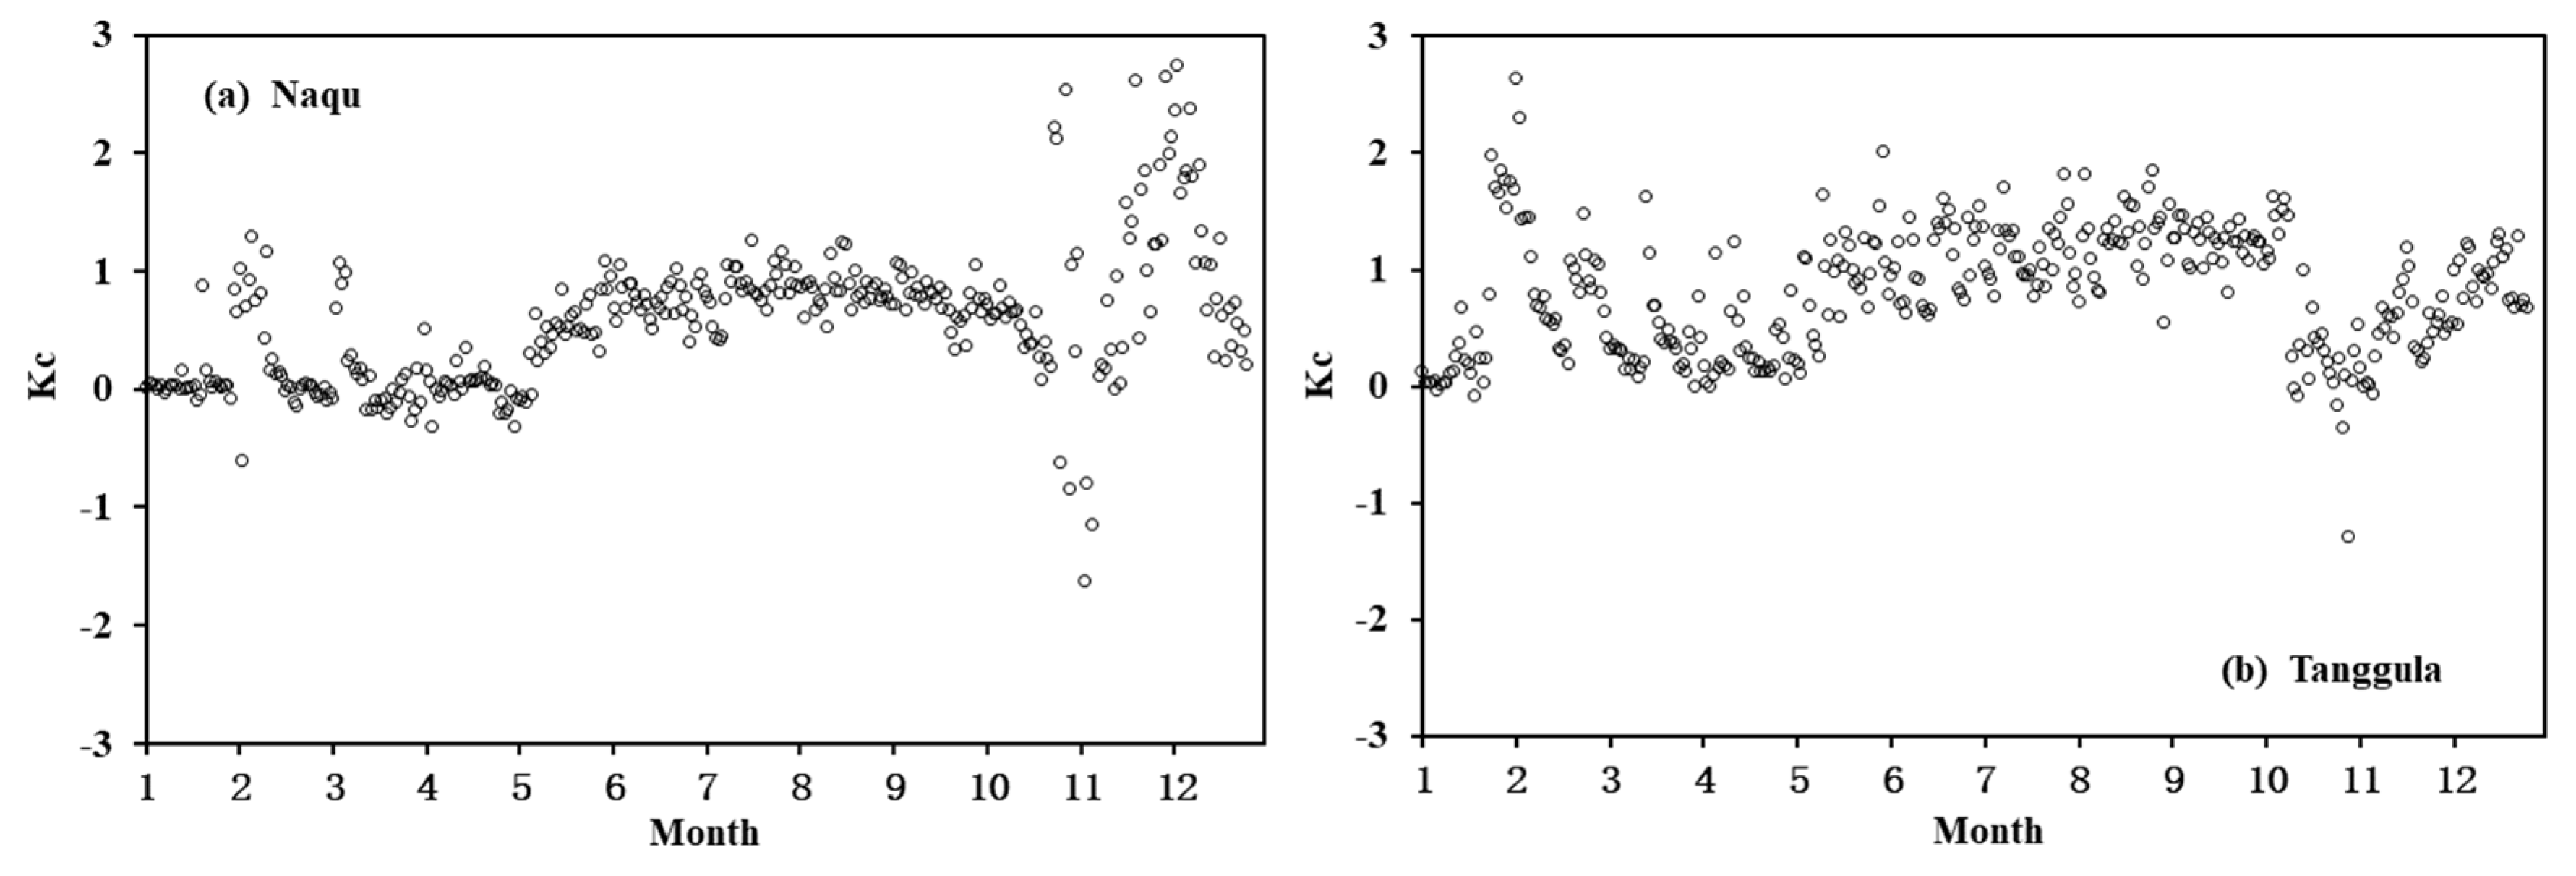
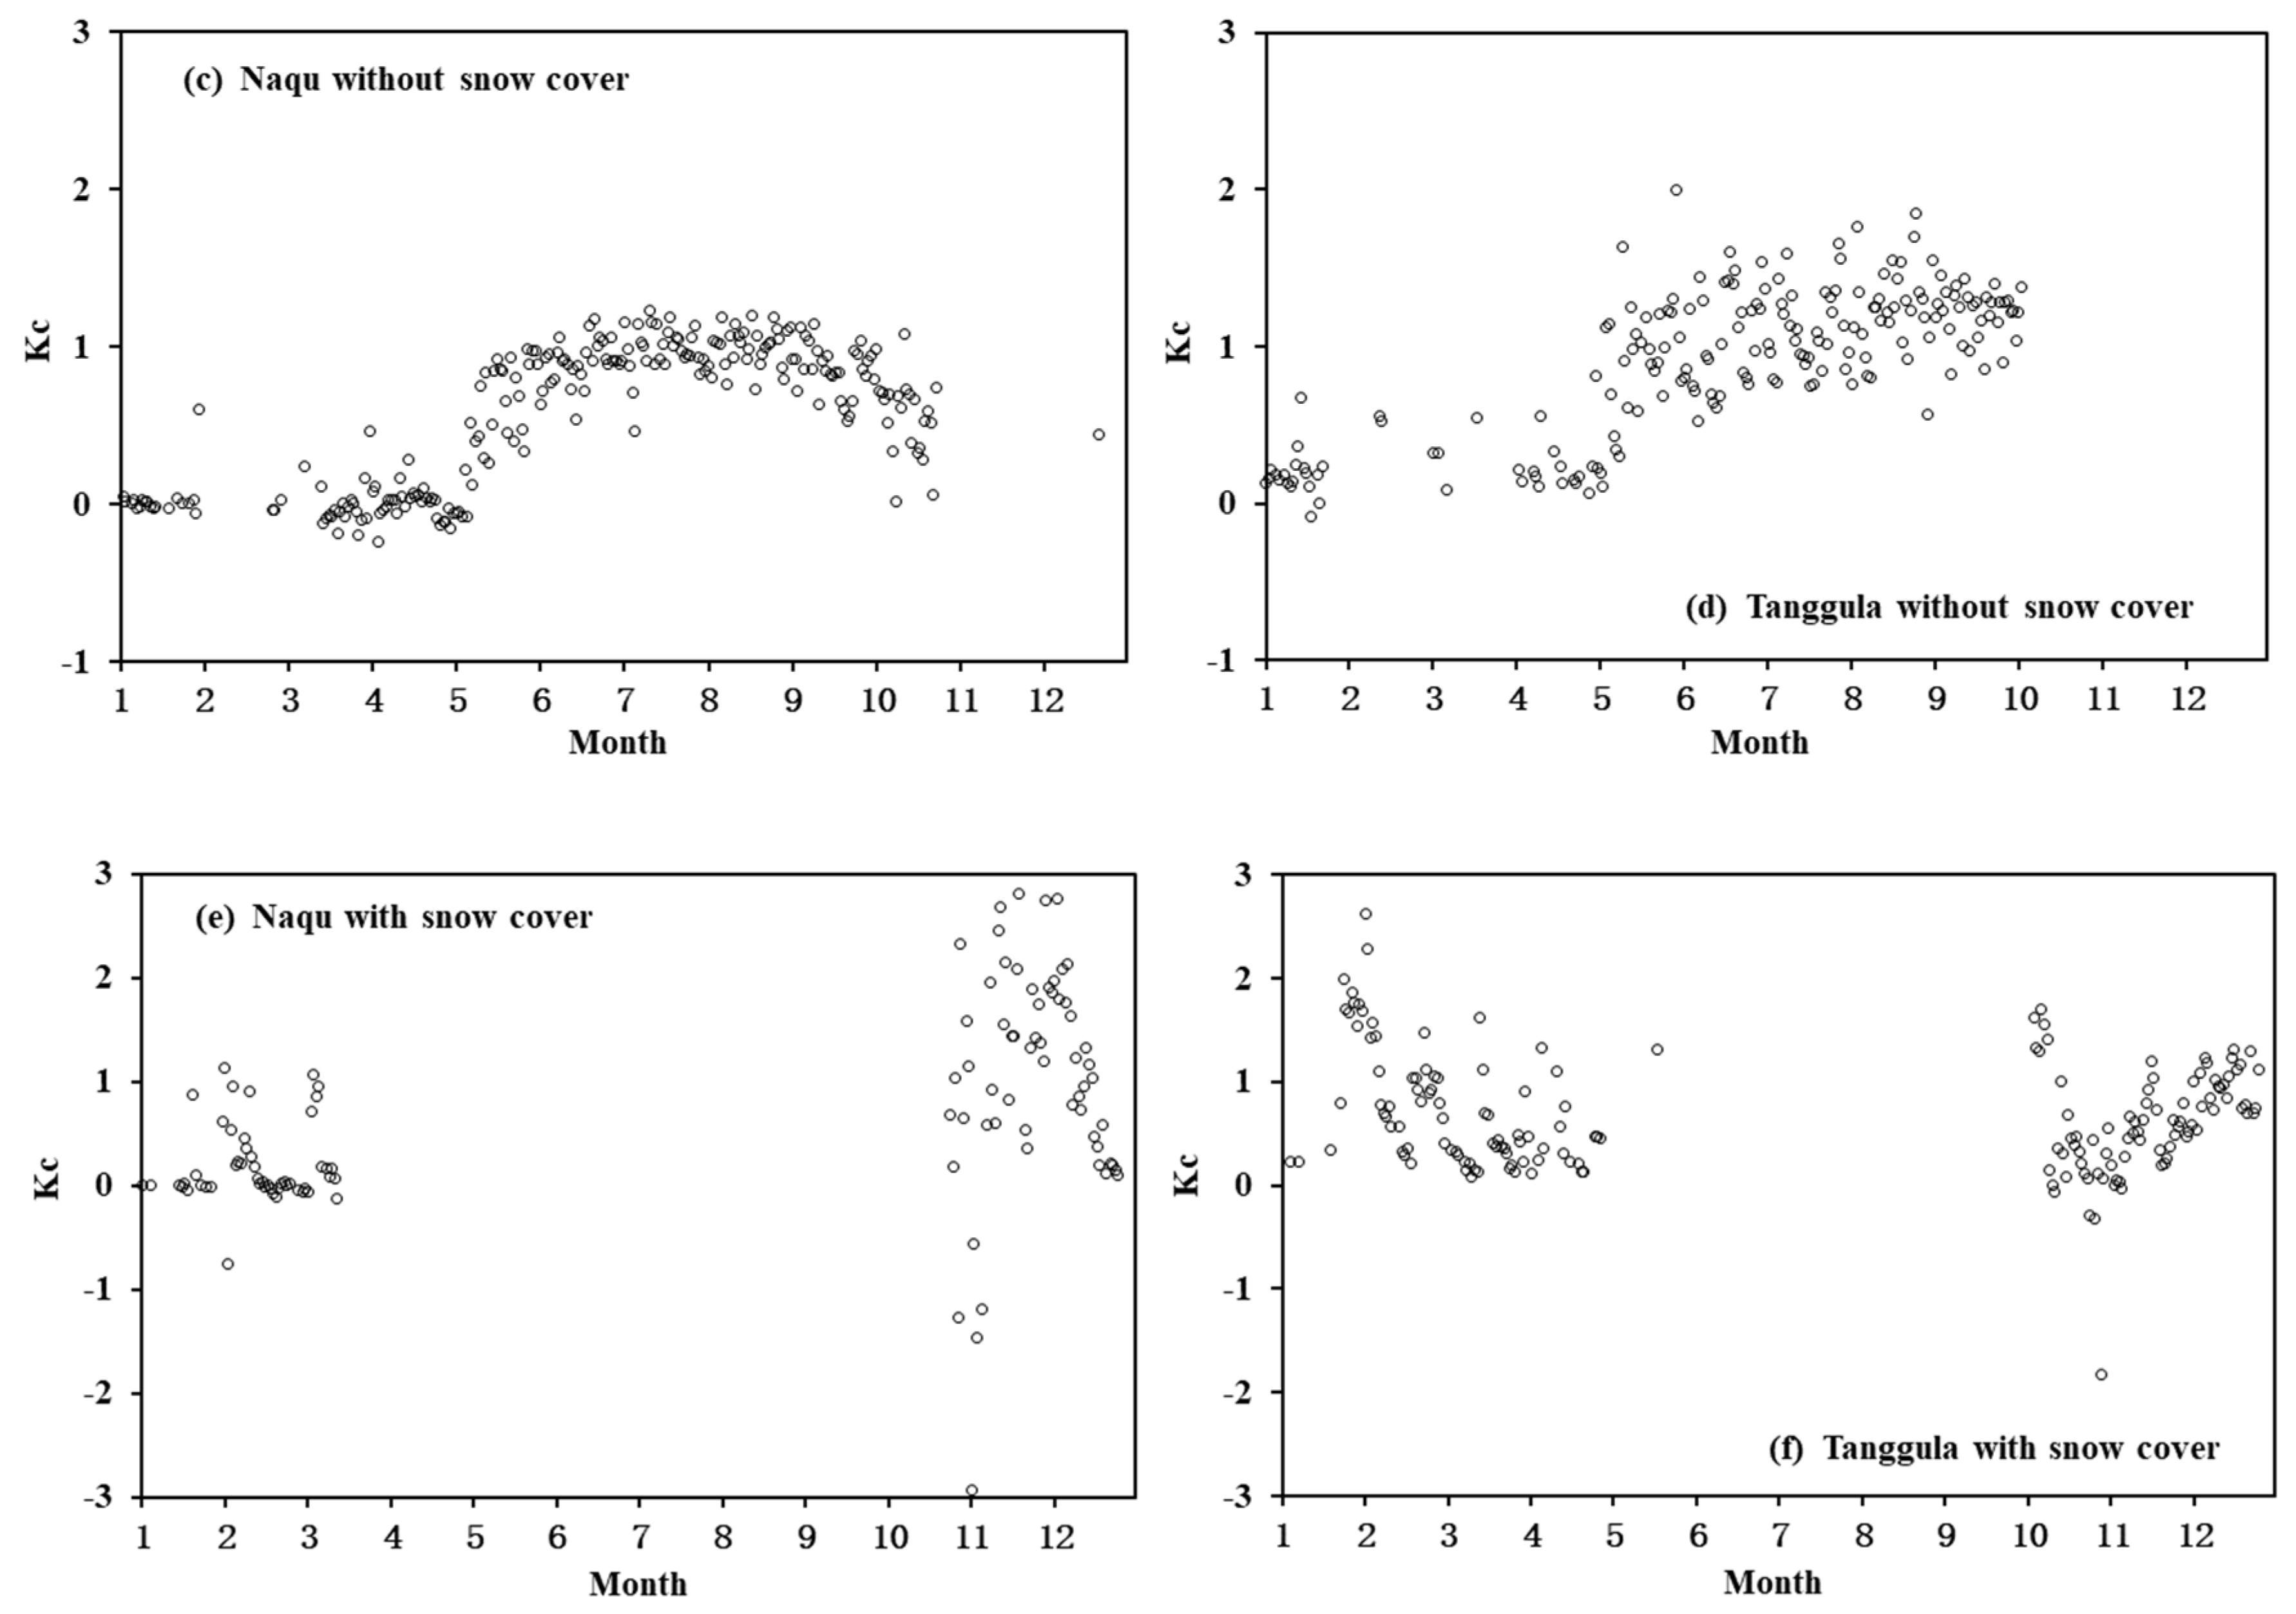
4.4. Variations in Kc
5. Discussion
6. Conclusions
Author Contributions
Funding
Data Availability Statement
Conflicts of Interest
References
- Thornthwait, C.W.; Mather, J.R. The role of evapotranspiration in climate. Arch. Met. Geoph. Biokl. Ser. B 1951, 3, 16–39. [Google Scholar] [CrossRef]
- Kite, G.W.; Droogers, P. Comparing evapotranspiration estimates from satellites, hydrological models and field data. J. Hydrol. 2000, 229, 3–18. [Google Scholar] [CrossRef]
- Chahine, M.T. The hydrological cycle and its influence on climate. Nature 1992, 359, 373–380. [Google Scholar] [CrossRef]
- Anderson, M.C.; Allen, R.G.; Morse, A.; Kustas, W.P. Use of Landsat thermal imagery in monitoring evapotranspiration and managing water resources. Remote Sens. Environ. 2012, 122, 50–65. [Google Scholar]
- Qiu, R.; Kang, S.; Li, F.; Du, T.; Tong, L.; Wang, F.; Chen, R.; Liu, J.; Li, S. Energy partitioning and evapotranspiration of hot pepper grown in greenhouse with furrow and drip irrigation methods. Sci. Hortic. 2011, 129, 790–797. [Google Scholar] [CrossRef]
- Piouceau, J.; Panfili, F.; Bois, G.; Anastase, M.; Dufossé, L.; Arfi, V. Actual evapotranspiration and crop coefficients for five species of three-year-old bamboo plants under a tropical climate. Agric. Water Manag. 2014, 137, 15–22. [Google Scholar] [CrossRef]
- Bormann, H. Sensitivity analysis of 18 different potential evapotranspiration models to observed climatic change at German climate stations. Clim. Change 2011, 104, 729–753. [Google Scholar]
- Webster, P.J. Mechanisms of monsoon low-frequency variability: Surface hydrological effects. J. Atmos. Sci. 1983, 40, 2110–2124. [Google Scholar] [CrossRef]
- Chen, S.; Liu, Y.; Thomas, A. Climatic change on the Tibetan Plateau: Potential Evapotranspiration Trends from 1961–2000. Clim. Change 2006, 76, 291–319. [Google Scholar]
- Ma, Y.; Zhu, Z.; Zhong, L.; Wang, B.; Han, C.; Wang, Z.; Wang, Y.; Lu, L.; Amatya, P.; Ma, W.; et al. Combining MODIS, AVHRR and in situ data for evapotranspiration estimation over heterogeneous landscape of the Tibetan Plateau. Atmos. Chem. Phys. 2014, 14, 1507–1515. [Google Scholar]
- Li, J.; Jiang, S.; Wang, B.; Jiang, W.; Tang, Y.; Du, M.; Gu, S. Evapotranspiration and its energy exchange in alpine meadow ecosystem on the Qinghai–Tibetan Plateau. J. Integr. Agr. 2013, 12, 1396–1401. [Google Scholar]
- Yao, J.; Zhao, L.; Ding, Y.; Gu, L.; Jiao, K.; Qiao, Y.; Wang, Y. The surface energy budget and evapotranspiration in the Tanggula region on the Tibetan Plateau. Cold Reg. Sci. Technol. 2008, 52, 326–340. [Google Scholar] [CrossRef]
- Xue, B.; Wang, L.; Li, X.; Yang, K.; Chen, D.; Sun, L. Evaluation of evapotranspiration estimates for two river basins on the Tibetan Plateau by a water balance method. J. Hydrol. 2013, 492, 290–297. [Google Scholar]
- Yin, Y.; Wu, S.; Zhao, D. Past and future spatiotemporal changes in evapotranspiration and effective moisture on the Tibetan Plateau. J. Geophy. Res. Atmos. 2013, 118, 10850–10860. [Google Scholar]
- Zhu, G.; Su, Y.; Li, X.; Zhang, K.; Li, C. Estimating actual evapotranspiration from an alpine grassland on Qinghai-Tibetan plateau using a two-source model and parameter uncertainty analysis by Bayesian approach. J. Hydrol. 2013, 476, 42–51. [Google Scholar]
- Li, X.; Wang, L.; Chen, D.; Yang, K.; Wang, A. Seasonal evapotranspiration changes (1983–2006) of four large basins on the Tibetan Plateau. J. Geophy. Res. Atmos. 2014, 119, 13079–13095. [Google Scholar]
- Wang, B.; Ma, Y.; Su, Z.; Wang, Y.; Ma, W. Quantifying the evaporation amounts of 75 high elevation large dimictic lakes on the Tibetan Plateau. Sci. Adv. 2020, 6, eaay8558. [Google Scholar]
- Shang, C.; Wu, T.; Ma, N.; Wang, J.; Li, X.; Zhu, X.; Wang, T.; Hu, G.; Li, R.; Yang, S.; et al. Assessment of Different Complementary-Relationship-Based Models for Estimating Actual Terrestrial Evapotranspiration in the Frozen Ground Regions of the Qinghai–Tibet Plateau. Remote Sens. 2022, 14, 2047. [Google Scholar] [CrossRef]
- Lin, S.; Huang, K.; Sun, X.; Song, C.; Sun, J.; Sun, S.; Wang, G.; Hu, Z. Attributing the variations in evapotranspiration and its components of alpine grasslands over the Tibetan Plateau. J. Geophy. Res. Atmos. 2024, 129, 2024JD041165. [Google Scholar]
- Zhang, Y.; Li, B.; Zheng, D. A discussion on the boundary and area of the Tibetan Plateau in China. Geogr. Res. 2002, 21, 1–8. [Google Scholar]
- Zou, D.; Zhao, L.; Sheng, Y.; Chen, J.; Hu, G.; Wu, T.; Wu, J.; Xie, C.; Wu, X.; Pang, Q.; et al. A new map of permafrost distribution on the Tibetan Plateau. Cryosphere 2017, 11, 2527–2542. [Google Scholar]
- Yang, M.; Yao, T.; Gou, X.; Koike, T.; He, Y. The soil moisture distribution, thawing-freezing processes and their effects on the seasonal transition on the Qinghai-Xizang (Tibetan) plateau. J. Asian Earth Sci. 2003, 21, 457–465. [Google Scholar]
- Hu, H.; Wang, G.; Wang, Y.; Liu, G.; Li, T.; Ren, D. Response of soil heat-water processes to vegetation cover on the typical permafrost and seasonally frozen soil in the headwaters of the Yangtze and Yellow Rivers. Chin. Sci. Bull. 2009, 54, 1225–1233. [Google Scholar]
- Luo, D.; Jin, H.; Lü, L.; Wu, Q. Spatiotemporal characteristics of freezing and thawing of the active layer in the source areas of the Yellow River (SAYR). Chin. Sci. Bull. 2014, 59, 3034–3045. [Google Scholar]
- Zhang, Y.; Pu, J.; Ohta, T. Analysis of characteristics evaporation in centre of Tibetan Plateau. J. Glaciol. Geocryol. 1994, 16, 166–172. (In Chinese) [Google Scholar]
- Zhang, X.; Ren, Y.; Yin, Z.; Lin, Z.; Zheng, D. Spatial and temporal variation patterns of reference evapotranspiration across the Qinghai-Tibetan Plateau during 1971–2004. J. Geophy. Res. Atmos. 2009, 114, D15105. [Google Scholar]
- Ma, W.; Ma, Y.; Ishikawa, H. Evaluation of the SEBS for upscaling the evapotranspiration based on in situ observations over the Tibetan Plateau. Atmos. Res. 2014, 138, 91–97. [Google Scholar]
- Yin, Y.; Wu, S.; Zhao, D.; Zheng, D.; Pan, T. Modelled effects of climate change on actual evapotranspiration in different eco-geographical regions in the Tibetan Plateau. J. Geogr. Sci. 2013, 23, 195–207. [Google Scholar]
- Mashabatu, M.; Motsei, N.; Jovanovic, N.; Nhamo, L. A Validation of FruitLook Data Using Eddy Covariance in a Fully Mature and High-Density Japanese Plum Orchard in the Western Cape, South Africa. Water 2025, 17, 324. [Google Scholar] [CrossRef]
- Ratshiedana, P.E.; Abd Elbasit, M.A.M.; Adam, E.; Chirima, J.G. Evaluation of Micrometeorological Models for Estimating Crop Evapotranspiration Using a Smart Field Weighing Lysimeter. Water 2025, 17, 187. [Google Scholar] [CrossRef]
- Gu, L.; Yao, J.; Hu, Z.; Zhao, L. Comparison of the surface energy budget between regions of seasonally frozen ground and permafrost on the Tibetan Plateau. Atmos. Res. 2015, 153, 553–564. [Google Scholar] [CrossRef]
- Monteith, J.L.; Unsworth, M. Principles of Environmental Physics; Edward Asner Publishers: London, UK, 1990. [Google Scholar]
- Allen, R.G.; Pereira, L.S.; Raes, D.; Smith, M. Crop Evaporation: Guidelines for Computing Crop Water Requirements—FAO Irrigation and Drainage Paper 56; Food and Agriculture Organization of the United Nations: Rome, Italy, 1998. [Google Scholar]
- Tanaka, K.; Tamagawa, I.; Ishikawa, H.; Ma, Y.; Hu, Z. Surface energy budget and closure of the eastern Tibetan Plateau during the GAME-Tibet IOP 1998. J. Hydrol. 2003, 283, 169–183. [Google Scholar] [CrossRef]
- Ye, D.; Gao, Y. The Meteorology of the Qinghai–Xizang (Tibet) Plateau; Science Press: Beijing, China, 1979. (In Chinese) [Google Scholar]
- Tang, M.; Shen, Z.; Chen, Y. On climatic characteristics of the Xizang Plateau monsoon. Acta Geogr. Sin. 1979, 34, 33–42. (In Chinese) [Google Scholar]
- Zhou, S.; Jia, L. The beginning and interruption of rainy season over Tibetan Plateau. Meteorol. Mon. 1999, 25, 38–42. (In Chinese) [Google Scholar]
- Dai, L.; Fu, R.; Guo, X.; Ke, X.; Du, Y.; Zhang, F.; Li, Y.; Qian, D.; Zhou, H.; Cao, G. Evaluation of actual evapotranspiration measured by large-scale weighing lysimeters in a humid alpine meadow, northeastern Qinghai-Tibetan Plateau. Hydrol. Process. 2021, 35, e14051. [Google Scholar] [CrossRef]
- Pu, C.; Yang, B.; Zhao, Y.; Luo, L.; Zhang, X.; Duan, Y. Comparison of the Variation Characteristics and Influencing Factors of Evapotranspiration in Two Alpine Grasslands on the Qinghai-Xizang Plateau. Plateau Meteor. 2024, 43, 1102–1112. (In Chinese) [Google Scholar]
- Gu, S.; Tang, Y.; Cui, X.; Kato, T.; Du, M.; Li, Y.; Zhao, X. Energy exchange between the atmosphere and a meadow ecosystem on the Qinghai-Tibetan Plateau. Agric. For. Meteorol. 2005, 129, 175–185. [Google Scholar] [CrossRef]
- Chen, S.; Chen, J.; Lin, G.; Zhang, W.; Miao, H.; Wei, L.; Huang, J.; Han, X. Energy balance and partition in Inner Mongolia steppe ecosystems with different land use types. Agric. For. Meteorol. 2009, 149, 1800–1809. [Google Scholar] [CrossRef]
- Zhang, Y.; Liu, C.; Tang, Y.; Yang, Y. Trends in pan evaporation and reference and actual evapotranspiration across the Tibetan Plateau. J. Geophy. Res. Atmos. 2007, 112, D12110. [Google Scholar] [CrossRef]
- Wang, W.; Xing, W.; Shao, Q.; Yu, Z.; Peng, S.; Yang, T.; Yong, B.; Taylor, J.; Singh, V.P. Changes in reference evapotranspiration across the Tibetan Plateau: Observations and future projections based on statistical downscaling. J. Geophy. Res. Atmos. 2013, 118, 4049–4068. [Google Scholar] [CrossRef]
- Xie, H.; Zhu, X. Reference evapotranspiration trends and their sensitivity to climatic change on the Tibetan Plateau (1970–2009). Hydrol. Process. 2013, 27, 3685–3693. [Google Scholar] [CrossRef]
- Kerr, G.; Pochop, L.; Fornstrom, K.J.; Krall, J.M.; Brown, D. Soil water and ET estimates for a wide range of rainfed and irrigated conditions. Agr. Water Manag. 1993, 24, 147–159. [Google Scholar] [CrossRef]
- Allen, R.G. Using the FAO-56 dual crop coefficient method over an irrigated region as part of an evapotranspiration intercomparison study. J. Hydrol. 2000, 229, 27–41. [Google Scholar] [CrossRef]
- Allen, R.G.; Pruitt, W.O.; Wright, J.L.; Howell, T.A.; Ventura, F.; Snyder, R.; Itenfisu, D.; Steduto, P.; Berengena, J.; Yrisarry, J.B.; et al. A recommendation on standardized surface resistance for hourly calculation of reference ETo by the FAO56 Penman–Monteith method. Agr. Water Manag. 2006, 81, 1–22. [Google Scholar] [CrossRef]
- Gervais, M.; Mkhabela, M.; Bullock, P.; Raddatz, R.; Finlay, G. Comparison of standard and actual crop evapotranspiration estimates derived from different evapotranspiration methods on the Canadian Prairies. Hydrol. Process. 2012, 26, 1467–1477. [Google Scholar] [CrossRef]
- You, Q.; Kang, S.; Tian, K.; Liu, J.; Li, C.; Zhang, Q. Preliminary analysis on climatic features at Mt. Nyainqentanglha, Tibetan Plateau. J. Mt. Sci. 2007, 25, 497–504. (In Chinese) [Google Scholar]
- Ghatak, D.; Sinsky, E.; Miller, J. Role of snow-albedo feedback in higher elevation warming over the Himalayas, Tibetan Plateau and Central Asia. Environ. Res. Lett. 2014, 9, 114008. [Google Scholar] [CrossRef]
- Zhou, Y.; Guo, D.; Qiu, G.; Cheng, G.; Li, S. Geocryology in China; Science Press: Beijing, China, 2000. (In Chinese) [Google Scholar]
- Zuo, H.; Li, D.; Hu, Y.; Bao, Y.; Lü, S. Characteristics of climatic trends and correlation between pan-evaporation and environmental factors in the last 40 years over China. Chin. Sci. Bull. 2005, 50, 1235–1241. [Google Scholar] [CrossRef]
- Zhang, X.; Jin, C.; Guan, D.; Wang, A.; Wu, J.; Yuan, F. Long-term eddy covariance monitoring of evapotranspiration and its environmental factors in a temperate mixed forest in Northeast China. J. Hydrol. Eng. 2012, 17, 965–974. [Google Scholar] [CrossRef]
- Li, G.; Chen, W.; Zhang, X.; Yang, Z.; Wang, Z.; Bi, P. Spatiotemporal changes and driving factors of vegetation in 14 different climatic regions in the global from 1981 to 2018. Environ. Sci. Pollut. Res. 2022, 29, 75322–75337. [Google Scholar] [CrossRef]
- Dai, L.; Fu, R.; Zhao, Z.; Guo, X.; Du, Y.; Hu, Z.; Cao, G. Comparison of Fourteen Reference Evapotranspiration Models with Lysimeter Measurements at a Site in the Humid Alpine Meadow, Northeastern Qinghai-Tibetan Plateau. Front. Plant Sci. 2022, 13, 854196. [Google Scholar]
- Bouchet, R. Évapotranspiration réelle et potentielle signification climatique. Int. Assoc. Sci. Hydrol. 1963, 62, 134–142. [Google Scholar]


| Naqu | Tanggula | |||||
|---|---|---|---|---|---|---|
| ETa | ET0 | Kc | ETa | ET0 | Kc | |
| January | 1.89 | 52.11 | 0.04 | 11.68 | 33.62 | 0.35 |
| February | 3.90 | 38.51 | 0.10 | 23.01 | 27.11 | 0.85 |
| March | 3.65 | 61.12 | 0.06 | 17.26 | 47.64 | 0.36 |
| April | 2.67 | 94.92 | 0.03 | 21.24 | 66.06 | 0.32 |
| May | 41.16 | 95.97 | 0.43 | 62.11 | 77.02 | 0.81 |
| June | 92.48 | 103.05 | 0.90 | 93.35 | 92.59 | 1.01 |
| July | 98.08 | 100.59 | 0.98 | 106.55 | 95.95 | 1.11 |
| August | 95.73 | 97.33 | 0.98 | 107.71 | 90.19 | 1.19 |
| September | 68.09 | 78.96 | 0.86 | 78.25 | 65.44 | 1.20 |
| October | 38.94 | 59.76 | 0.65 | 36.63 | 36.69 | 1.00 |
| November | 16.28 | 9.60 | 1.70 | 8.79 | 20.44 | 0.43 |
| December | 30.66 | 28.03 | 1.09 | 18.60 | 20.76 | 0.90 |
| Naqu | Tanggula | |||
|---|---|---|---|---|
| ETa | ET0 | ETa | ET0 | |
| Net radiation (Rn) | 0.702 ** | 0.826 ** | 0.782 ** | 0.874 ** |
| Air temperature (Ta) | 0.795 ** | 0.664 ** | 0.748 ** | 0.674 ** |
| Wind speed (ws) | −0.518 ** | −0.055 | −0.314 ** | −0.263 ** |
| Water vapour pressure (e) | 0.787 ** | 0.322 ** | 0.719 ** | 0.323 ** |
| Surface temperature (T0) | 0.812 ** | 0.654 ** | 0.770 ** | 0.705 ** |
| Soil water content (smc) | 0.764** | 0.341 ** | 0.791 ** | 0.490 ** |
| Naqu | Tanggula | |||||
|---|---|---|---|---|---|---|
| Monthly Average | Monthly Maximum | Monthly Minimum | Monthly Average | Monthly Maximum | Monthly Minimum | |
| January | 0.04 | 0.87 | −0.06 | 0.35 | 1.99 | −0.09 |
| February | 0.10 | 1.13 | −0.75 | 0.85 | 2.63 | 0.20 |
| March | 0.06 | 1.06 | −0.20 | 0.36 | 1.62 | 0.09 |
| April | 0.03 | 0.47 | −0.24 | 0.32 | 1.33 | 0.06 |
| May | 0.43 | 0.98 | −0.15 | 0.81 | 1.63 | 0.11 |
| June | 0.90 | 1.17 | 0.54 | 1.01 | 2.00 | 0.52 |
| July | 0.98 | 1.23 | 0.46 | 1.11 | 1.65 | 0.74 |
| August | 0.98 | 1.20 | 0.73 | 1.19 | 1.84 | 0.76 |
| September | 0.86 | 1.15 | 0.53 | 1.20 | 1.55 | 0.56 |
| October | 0.65 | 1.08 | 0.02 | 1.00 | 1.70 | −0.32 |
| November | 1.70 | 3.11 | −2.94 | 0.43 | 1.20 | −1.82 |
| December | 1.09 | 2.76 | 0.11 | 0.90 | 1.30 | 0.47 |
Disclaimer/Publisher’s Note: The statements, opinions and data contained in all publications are solely those of the individual author(s) and contributor(s) and not of MDPI and/or the editor(s). MDPI and/or the editor(s) disclaim responsibility for any injury to people or property resulting from any ideas, methods, instructions or products referred to in the content. |
© 2025 by the authors. Licensee MDPI, Basel, Switzerland. This article is an open access article distributed under the terms and conditions of the Creative Commons Attribution (CC BY) license (https://creativecommons.org/licenses/by/4.0/).
Share and Cite
Gu, L.; Yao, J.; Hu, Z.; Ma, Y.; Yu, H.; Sun, F.; Wang, S. Comparison of Actual and Reference Evapotranspiration Between Seasonally Frozen and Permafrost Soils on the Tibetan Plateau. Remote Sens. 2025, 17, 1316. https://doi.org/10.3390/rs17071316
Gu L, Yao J, Hu Z, Ma Y, Yu H, Sun F, Wang S. Comparison of Actual and Reference Evapotranspiration Between Seasonally Frozen and Permafrost Soils on the Tibetan Plateau. Remote Sensing. 2025; 17(7):1316. https://doi.org/10.3390/rs17071316
Chicago/Turabian StyleGu, Lianglei, Jimin Yao, Zeyong Hu, Yaoming Ma, Haipeng Yu, Fanglin Sun, and Shujin Wang. 2025. "Comparison of Actual and Reference Evapotranspiration Between Seasonally Frozen and Permafrost Soils on the Tibetan Plateau" Remote Sensing 17, no. 7: 1316. https://doi.org/10.3390/rs17071316
APA StyleGu, L., Yao, J., Hu, Z., Ma, Y., Yu, H., Sun, F., & Wang, S. (2025). Comparison of Actual and Reference Evapotranspiration Between Seasonally Frozen and Permafrost Soils on the Tibetan Plateau. Remote Sensing, 17(7), 1316. https://doi.org/10.3390/rs17071316