Article

Evaluation of the Accuracy and Trend Consistency of Hourly Surface Solar Radiation Datasets of ERA5, MERRA-2, SARAH-E, CERES, and Solcast over China

by
Han Wang
and
Yawen Wang
*
Frontier Science Center for Deep Ocean Multispheres and Earth System (FDOMES) and Physical Oceanography Laboratory, College of Oceanic and Atmospheric Sciences, Ocean University of China, Qingdao 266100, China
*
Author to whom correspondence should be addressed.
Remote Sens. 2025, 17(7), 1317; https://doi.org/10.3390/rs17071317
Submission received: 18 February 2025 / Revised: 26 March 2025 / Accepted: 4 April 2025 / Published: 7 April 2025

Abstract

:
The global ambition to achieve carbon neutrality by the mid-21st century is driving a transition towards clean energy. Accurately assessing solar energy potential necessitates high-quality observations of hourly surface solar radiation (SSR). The performance of hourly SSR data from two reanalysis products (ERA5 and MERRA-2) and three satellite-derived products (CERES, SARAH-E, and Solcast) is validated against 22 years of continuous surface observations over 96 stations across China. The accuracy (in %) and trend consistency (in % decade−1) of estimates from gridded products in reproducing the diurnal cycle and trend of SSR are generally lower at sunrise and sunset than at noon, and they are also reduced in the cold season (October to next March) compared with the warm season (April to September). Regionally, accuracy is generally lower in the southwestern plateau region, and the trend consistency of most products is lowest in the rugged and cloudy southern part of China. Among the evaluated datasets, Solcast and MERRA-2 exhibit the highest accuracy and trend consistency in capturing the diurnal pattern of SSR, respectively, while CERES demonstrates the best overall performance.

1. Introduction

Transitioning to clean energy is a vital strategy to mitigate climate change and achieve the net zero carbon emission target, known as carbon neutrality [1], by the mid-21st century. Solar energy has emerged as a primary source of clean and renewable energy, providing a solution to gradually phase out the consumption of fossil fuels and reduce significant greenhouse gas emissions [2]. China has achieved remarkable progress in reforming its energy consumption patterns. By the end of June 2024, China’s installed capacity of new energy had surpassed that of coal power for the first time, with the installed solar power generation capacity exceeding 700 million kW [3].
High-quality surface solar radiation (SSR) data are essential for the rapidly developing solar power industry, influencing resource assessment, system optimization, policy formulation, etc. [4,5,6]. For instance, in solar photovoltaic (PV) systems, knowledge of SSR at hourly intervals is often required for models to accurately assess the potential of solar power generation [7,8,9]. However, due to the lack of hourly SSR data, previous estimates of China’s PV potential have relied on data at daily or longer timescales [2,10]. Access to a high-quality SSR dataset with hourly intervals could significantly enhance the accuracy of PV potential assessments.
As direct measurements, surface observations, though sparse in space, serve as fundamental references for evaluating the estimates from satellite or reanalysis products, which are superior in their continuous and extensive temporal and spatial coverage [4,5,11,12]. In China, the presence of heavy aerosols and the complex terrain may introduce discrepancies in SSR retrievals from satellite and reanalysis products [11]. Thus, it is necessary to validate satellite and reanalysis datasets using surface observations to identify the optimal gridded product that provides reliable hourly SSR data with comprehensive spatial coverage across China.
Due to the scarcity of surface observations with high temporal resolution, previous validations of satellite and reanalysis SSR products were primarily conducted at daily or monthly scales, with limited studies at hourly intervals [11,13,14,15,16,17,18,19,20,21,22,23,24,25,26,27,28]. Studies evaluating hourly SSR often relied on a small number of stations and years of observations in China. For example, Yang and Bright [5] found that Solcast outperformed five satellite-derived products and two reanalysis products in reproducing hourly SSR based on 27 years of global surface observations, although only two Chinese stations were included. Worldwide validations of evaluated SSR from ERA5, COSMO-REA6, and CERES were conducted based on a BSRN (Baseline Surface Radiation Network) and CERES atmospheric radiation measurement validation experiment, with both validations considering only one Chinese station [14,29,30]. Li et al. [31] validated the SSR estimates from Himawari-8 and improved the algorithm to map SSR in East Asia at high spatiotemporal resolution, but they used BSRN and CMA (China Meteorological Administration) data only from 2017. Similarly, Cao et al. [4] demonstrated that CERES-SYN1deg outperformed ERA5 and MERRA-2 for hourly SSR using data from four Chinese stations between 2001 and 2016. Jiang et al. [32] showed that ERA5 overestimates hourly SSR at 98 stations across China, particularly in cloudy areas, based on one year of observations from 2007. Based also on one year of observation from 2018, Du et al. [33] noted that MERRA-2 overestimates hourly SSR at 37 stations across China, especially under cloudy conditions. Furthermore, Wang et al. [12] found that CERES-SYN has the highest accuracy compared to ERA5, MERRA-2, NCEP-CFSR, JRA-55, and GLDAS in estimating SSR at three-hourly and one-hourly timescales over the Qinghai–Tibet Plateau. In addition, Yang et al. [34] validated hourly SSR estimation for 1998 from UMD-SRB in the Tibet province of China based on reference data collected through GAME-Tibet (GEWEX Asian Monsoon Experiments—Tibet). However, very few studies have assessed the trend consistency of hourly SSR estimates from satellite and reanalysis products.
This study, therefore, aims to further validate both the accuracy and trend consistency of five long-term hourly SSR gridded products—ERA5, MERRA-2, SARAH-E, CERES, and Solcast—using 22 years of homogeneous hourly surface observations from 96 stations across China, with the goal of identifying the product that demonstrates the best accuracy and trend consistency.

2. Data and Methods

2.1. Gridded Products

Among the current mainstream gridded products providing hourly SSR, we selected five datasets that cover China and have long-term records spanning more than 10 years up to the present (Table 1). The same variable—surface downward shortwave radiation under all-sky conditions—was collected from these products, although the variable names differ across the products, with detailed information provided below.
ERA5, the fifth generation of the European Centre for Medium-Range Weather Forecasts (ECMWF) atmospheric reanalysis, provides estimates for atmospheric, wave, and land surface parameters. Produced through the CY41R2 model and 4D-Var data assimilation of ECMWF’s Integrated Forecast System (IFS), ERA5 surpasses its predecessors by offering enhanced spatial and temporal resolutions, delivering hourly data. According to the introduction on its official website, the radiation scheme performs computations of shortwave radiative fluxes using the predicted values of temperature, humidity, cloud, and monthly mean climatologies for aerosols and the main trace gases. SSR in ERA5 is named surface solar radiation downwards from the cluster ERA5 hourly data on single levels from 1979 to the present.
MERRA-2, the second Modern-Era Retrospective analysis for Research and Applications, is produced by NASA’s Global Modeling and Assimilation Office (GMAO). MERRA-2 is the earliest long-term global reanalysis dataset to assimilate observed aerosol information into the physical processes within the climate system [5,35,36,37]. The radiative transfer calculations in MERRA-2, essential for assimilating satellite radiance, are performed using version 2.1.3 of the Community Radiative Transfer Model (CRTM) [35]. SSR in MERRA-2 is named surface_incoming_shortwave_flux, stored in the collection MERRA-2 tavg1_2d_rad_Nx.
SARAH-E, Surface Solar Radiation Data Set—Heliosat, Meteosat-East, uses data collected by the Eastern Meteosat Satellites situated over the Indian Ocean [38]. Aerosol information from the Monitoring Atmospheric Composition and Climate (MACC) project is incorporated into its SSR retrieval as 8 years (2003–2010) of monthly climatological values [11,29,38]. Water vapor from the ERA-Interim dataset is also considered in the retrieved SSR [39]. Higher uncertainties in the SSR calculation are indicated over bright surfaces, such as desert regions [40]. SARAH-E provides hourly SSR records since 1999 but is available only within the spatial coverage of the Meteosat disk, excluding the region of northeastern China. SSR validated in this research is named SIS—surface incoming shortwave radiation in SARAH-E.
CERES, the Clouds and the Earth’s Radiant Energy System, aims at providing Earth radiation budget data through remote sensing [41]. The CERES SYN1deg products include coincident MODIS-derived cloud and aerosol properties, as well as hourly geostationary satellite (GEO)-derived cloud properties [42]. The MODIS sensors are mounted on the sun-synchronous polar-orbiting satellites Terra and Aqua, while the GEO satellites are depicted in Figure 1-1 of the CERES_SYN1deg_Ed4A Data Quality Summary [42]. Aerosol optical thickness data from MODIS are assimilated and interpolated by the MATCH model before being used to calculate SSR [43]. Ice and snow information used to calculate SSR is sourced from the daily map of the National Ice and Snow Data Center [44]. In CERES-SYN1deg, SSR is represented as the Shortwave Flux Down within the Adjusted All-Sky Profile Fluxes data group, with observations commencing in March 2000.
Solcast provides global solar forecasting and solar irradiance data starting from 2007 using a semi-empirical and satellite-derived methodology [45]. It uses radiative transfer calculations, the REST2v5 clear sky model [46], to establish the SSR under clear skies before accounting for cloud effects. For the clear sky model, input data of aerosol and albedo are sourced from MERRA-2. Additional variables, including air temperature, wind speed and direction (10 and 100 m), relative humidity, surface pressure, precipitation water, precipitation rate, dew point temperature, and snow depth equivalent water variables, are obtained from ERA5. Satellite imagery provides cloud information, leading to all-sky SSR estimates. The satellites used in Solcast, as shown in Figure 1 of Bright [45], include METEOSAT, FY4, and Himawari, with the latter two primarily providing complete coverage of China. SSR used in this validation belongs to the cluster Historical Time Series (HTS) and is referred to as global horizontal irradiance (GHI).

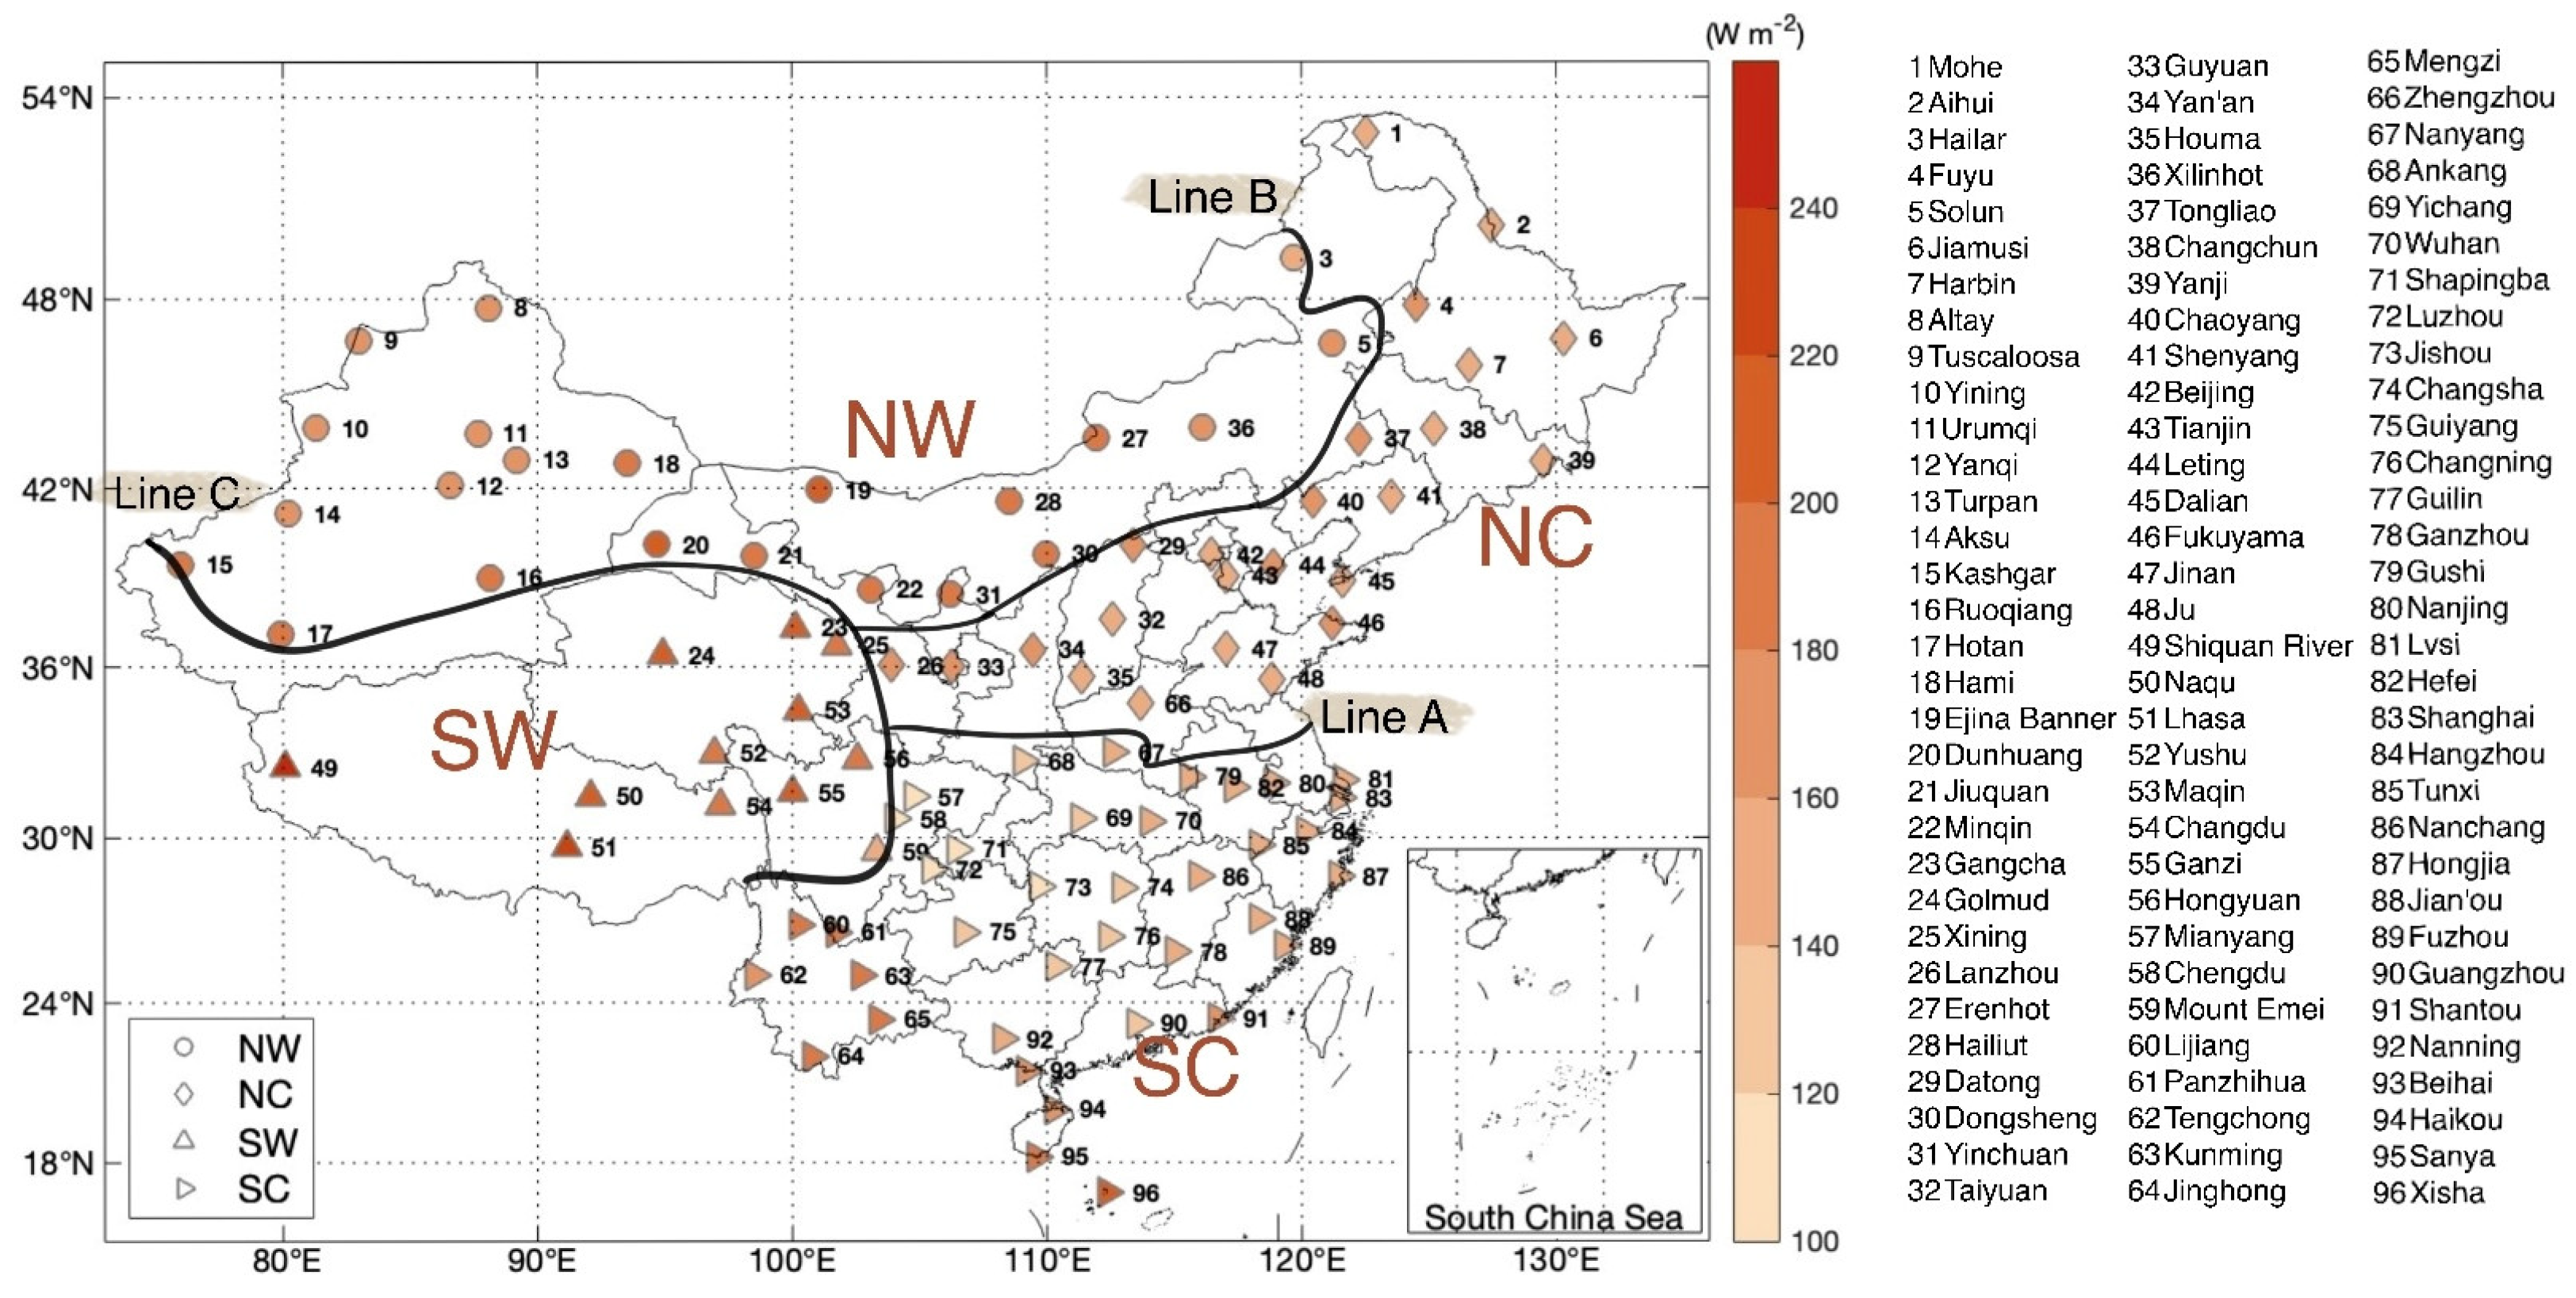
2.2. Surface Reference Observations

As the reference dataset, hourly SSR measurements obtained from the China Meteorological Data Service Center of the China Meteorological Administration (CMA, http://data.cma.cn/en/, accessed on 21 May 2015) have been recorded in local time (LT) intervals ranging from 1 to 24 h since 1993. CMA has conducted fundamental data quality controls before releasing the data, including checks for climatic range, spatial consistency, and temporal continuity. This study further ensured the quality of CMA hourly observations by implementing a physical threshold test, long-term record selection, and data gap filling, following the methodology outlined by Wang et al. [13]. The physical threshold test eliminated the outliers exceeding extraterrestrial radiation, calculated at an hourly scale using the FAO-56 method [47]. The long-term record selection removed records of stations with hourly observations covering less than 90% of the examined period. This resulted in 96 remaining stations with 22 years of continuous hourly SSR observations from 1993 to 2014 (Figure 1). Among them, three stations—Lanzhou, Chengdu, and Luzhou—relocated during the study period, and their observations were merged with those from the collocated stations to ensure data continuity and complete the recording period. Monthly average hourly SSR was then calculated, with approximately 94% of the data computed with a sampling size exceeding 10 days per month. The missing monthly mean hourly data V i , j , k , n for hour i , month j , station k , and year n were filled using linear interpolation:
V i , j , k , n = a i , j , k × n + b i , j , k
where the trend slope a i , j , k and intercept b i , j , k are derived from a linear regression model constructed using available monthly average hourly data for the same hour i , month j , and station k over the period from 1993 to 2014.
This gap filling process added approximately 2% of records and introduced minor changes in the diurnal mean of surface-observed SSR, ranging from –0.5 to 1.1 W m−2 (–0.1% to 0.5%) on average during the examined period of 7–18 LT. Nevertheless, it effectively reduced potential biases in seasonal means and overall trends that could have arisen from missing values.
To further ensure the reliability of the evaluation, a series of preprocessing steps were performed on the selected satellite and reanalysis products. Firstly, the gridded data were extracted based on the same latitude and longitude coordinates as the surface reference observations for accurate comparison. For the three combined stations, gridded data were merged from the corresponding locations of the collocated stations for the same time periods. After calculating the monthly average hourly SSR, the universal time ( U T ) used in the original gridded data was converted into local time ( L T ) to ensure consistency with the observational time recorded by the CMA. It is important to note that although all five products use UTC, their data are recorded with different timestamps. For example, for the 10:00–11:00 period, ERA5 and SARAH-E use the end-of-hour timestamp (11:00), MERRA-2 and CERES-SYN1deg use the mid-hour timestamp (10:30), and Solcast provides both the start and end-of-hour timestamps (10:00 and 11:00) for each hourly record. To ensure uniformity, we standardized the recording of hourly data for all products at the end of each hour, aligning the diurnal cycle of SSR so that it peaks at noon (Figure A1). Then, the UTC to LT time conversion was carried out using the (°) of each station, as described in Equation (2).
L T = U T + l o n g i t u d e 15 °
In addition, only the data available in both the reference and validated datasets were selected to ensure consistent sample sizes during the evaluation of each product. Specifically, 90.3% of ERA5, 90.1% of MERRA-2, 92.0% of SARAH-E, 91.4% of CERES, and 90.8% of Solcast samples were retained for evaluation during the periods of 1993–2014, 1993–2014, 1999–2014, 2000.3–2014, and 2007–2014, respectively.

2.3. Evaluation Indices and Procedure

For the accuracy test, the three accuracy indices defined by Yang and Bright [5], namely, nMBD, nMABD, and nRMSD, which are normalized versions of the Mean Bias Deviation (MBD), Mean Absolute Deviation (MABD), and Root Mean Square Deviation (RMSD), were applied in this study. The normalization constants can be converted into scale-dependent measures by multiplying with the means. The nMBD indicates whether the estimates from gridded products tend to overestimate or underestimate the reference surface observations, while nMABD and nRMSD reflect the absolute magnitude and dispersion of the biases in SSR estimations, respectively. The normalized indices were calculated in relative terms to facilitate comparisons among different hours with varying SSR levels.
  • Normalized Mean Bias Deviation, nMBD:
    n M B D = 1 n E ( x ) i = 1 n p i x i
  • Normalized Mean Absolute Bias Deviation, nMABD:
    n M A B D = 1 n E ( x ) i = 1 n p i x i
  • Normalized Root Mean Square Deviation, nRMSD:
    n R M S D = 1 E ( x ) 1 n i = 1 n p i x i 2
    where n is the number of hourly samples, E ( x ) is the mean hourly SSR from the reference surface observations, p i is the hourly SSR estimated from the validated products, and x i is the reference hourly SSR observed at surface stations.
For the trend consistency test, the linear decadal trends of SSR were compared for each hour to evaluate the agreement. These trends, expressed in % decade−1, were derived from relative anomalies of SSR, enabling comparisons across hours with varying SSR levels. The relative anomalies for each hour were calculated by (1) deriving the multiyear monthly mean diurnal cycles and (2) determining the relative differences between each monthly mean hourly SSR and the corresponding monthly mean diurnal cycles. Only hours with more than 50% data availability were included in the comparison to minimize the impact of missing data on the overall trends. The bias and absolute bias of the decadal trends of SSR between surface observations and the validated products were then calculated to assess their consistency.
The evaluation of accuracy and trend consistency was also conducted across different seasons and regions. The seasons were categorized into warm seasons (April to September) and cold seasons (October to next March). Only hours with at least 50% data availability in both seasons were considered for comparison. Regionally, China was divided into four geographical areas, as shown in Figure 1—north China (NC), south China (SC), northwest China (NW), and southwest China (SW)—based on regional climate and topographic characteristics [48].

3. Results and Discussions
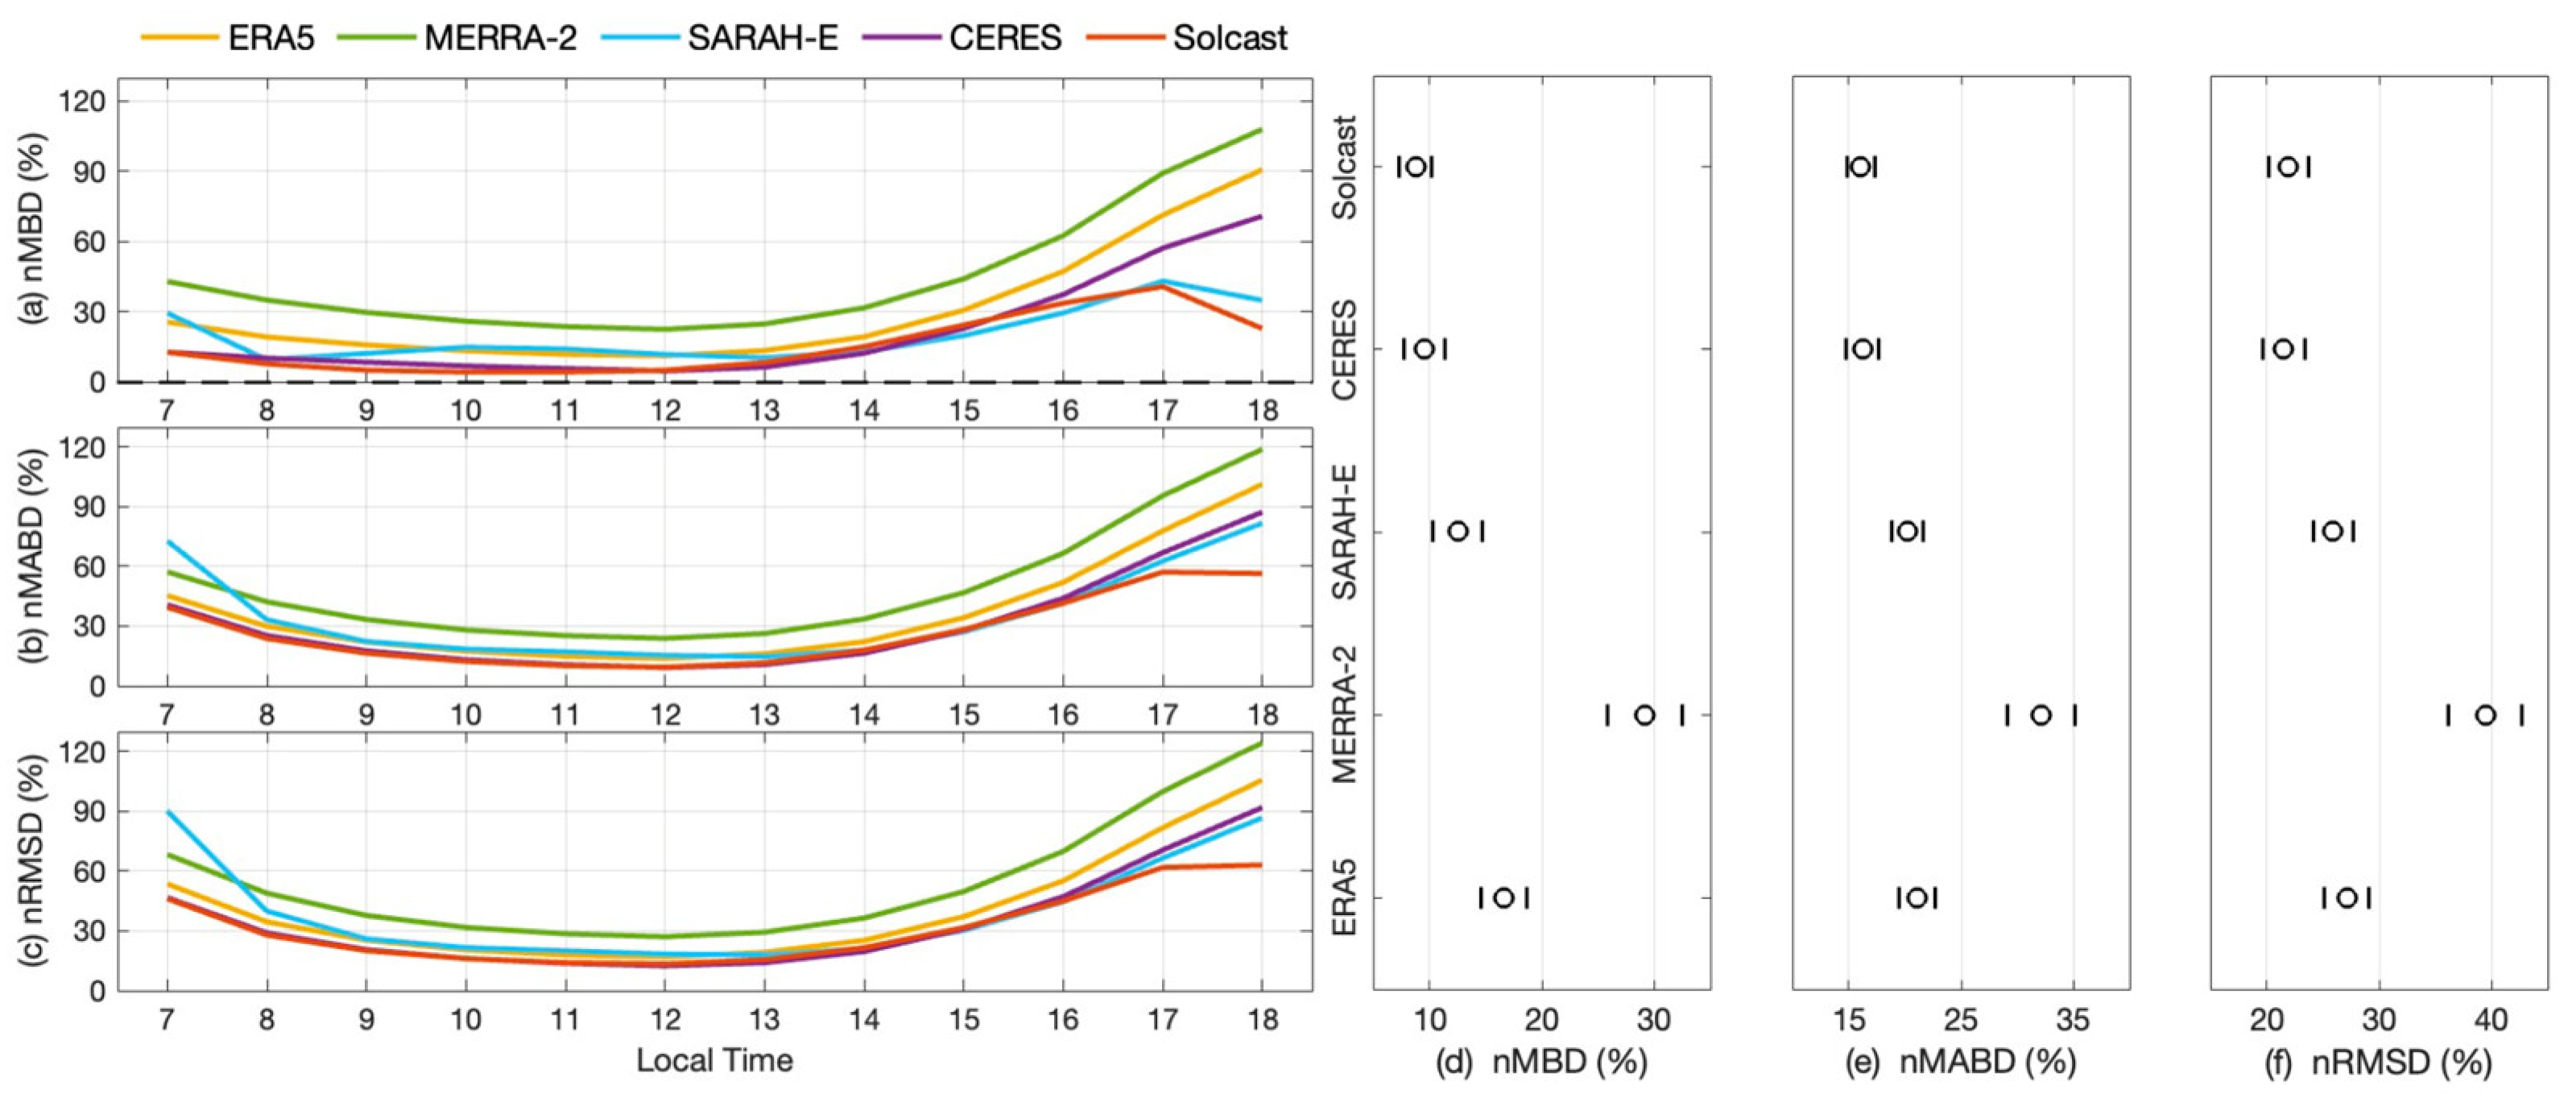
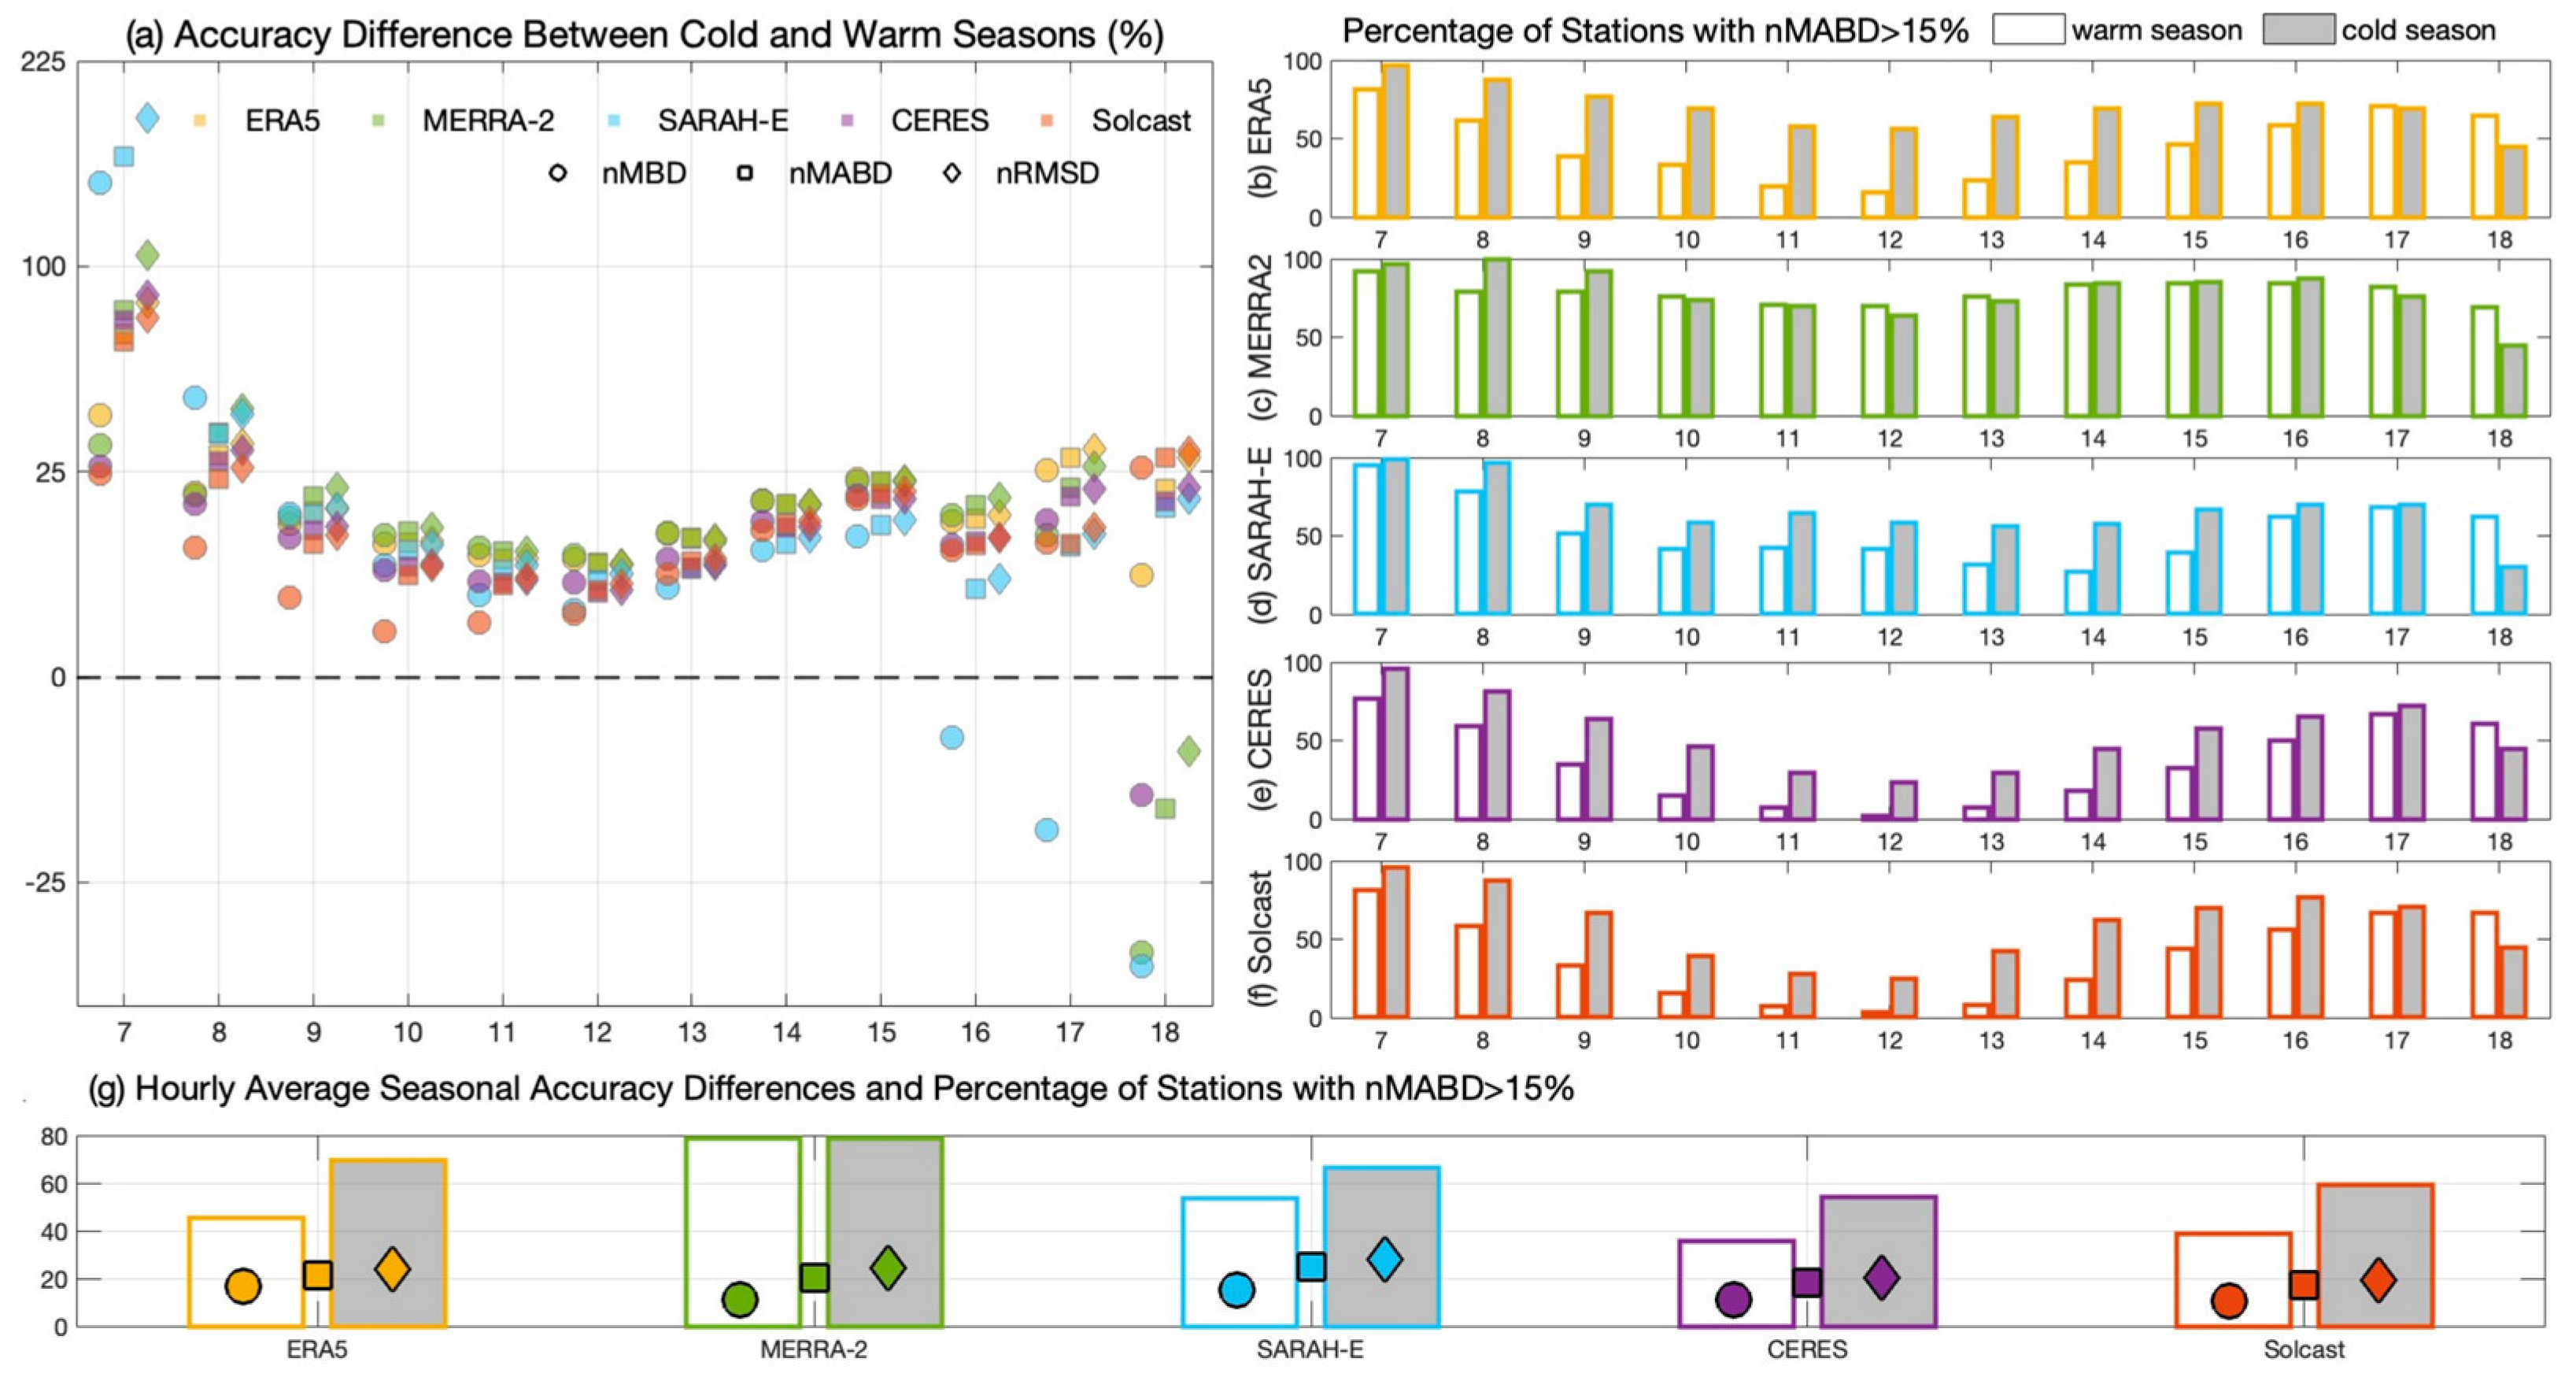
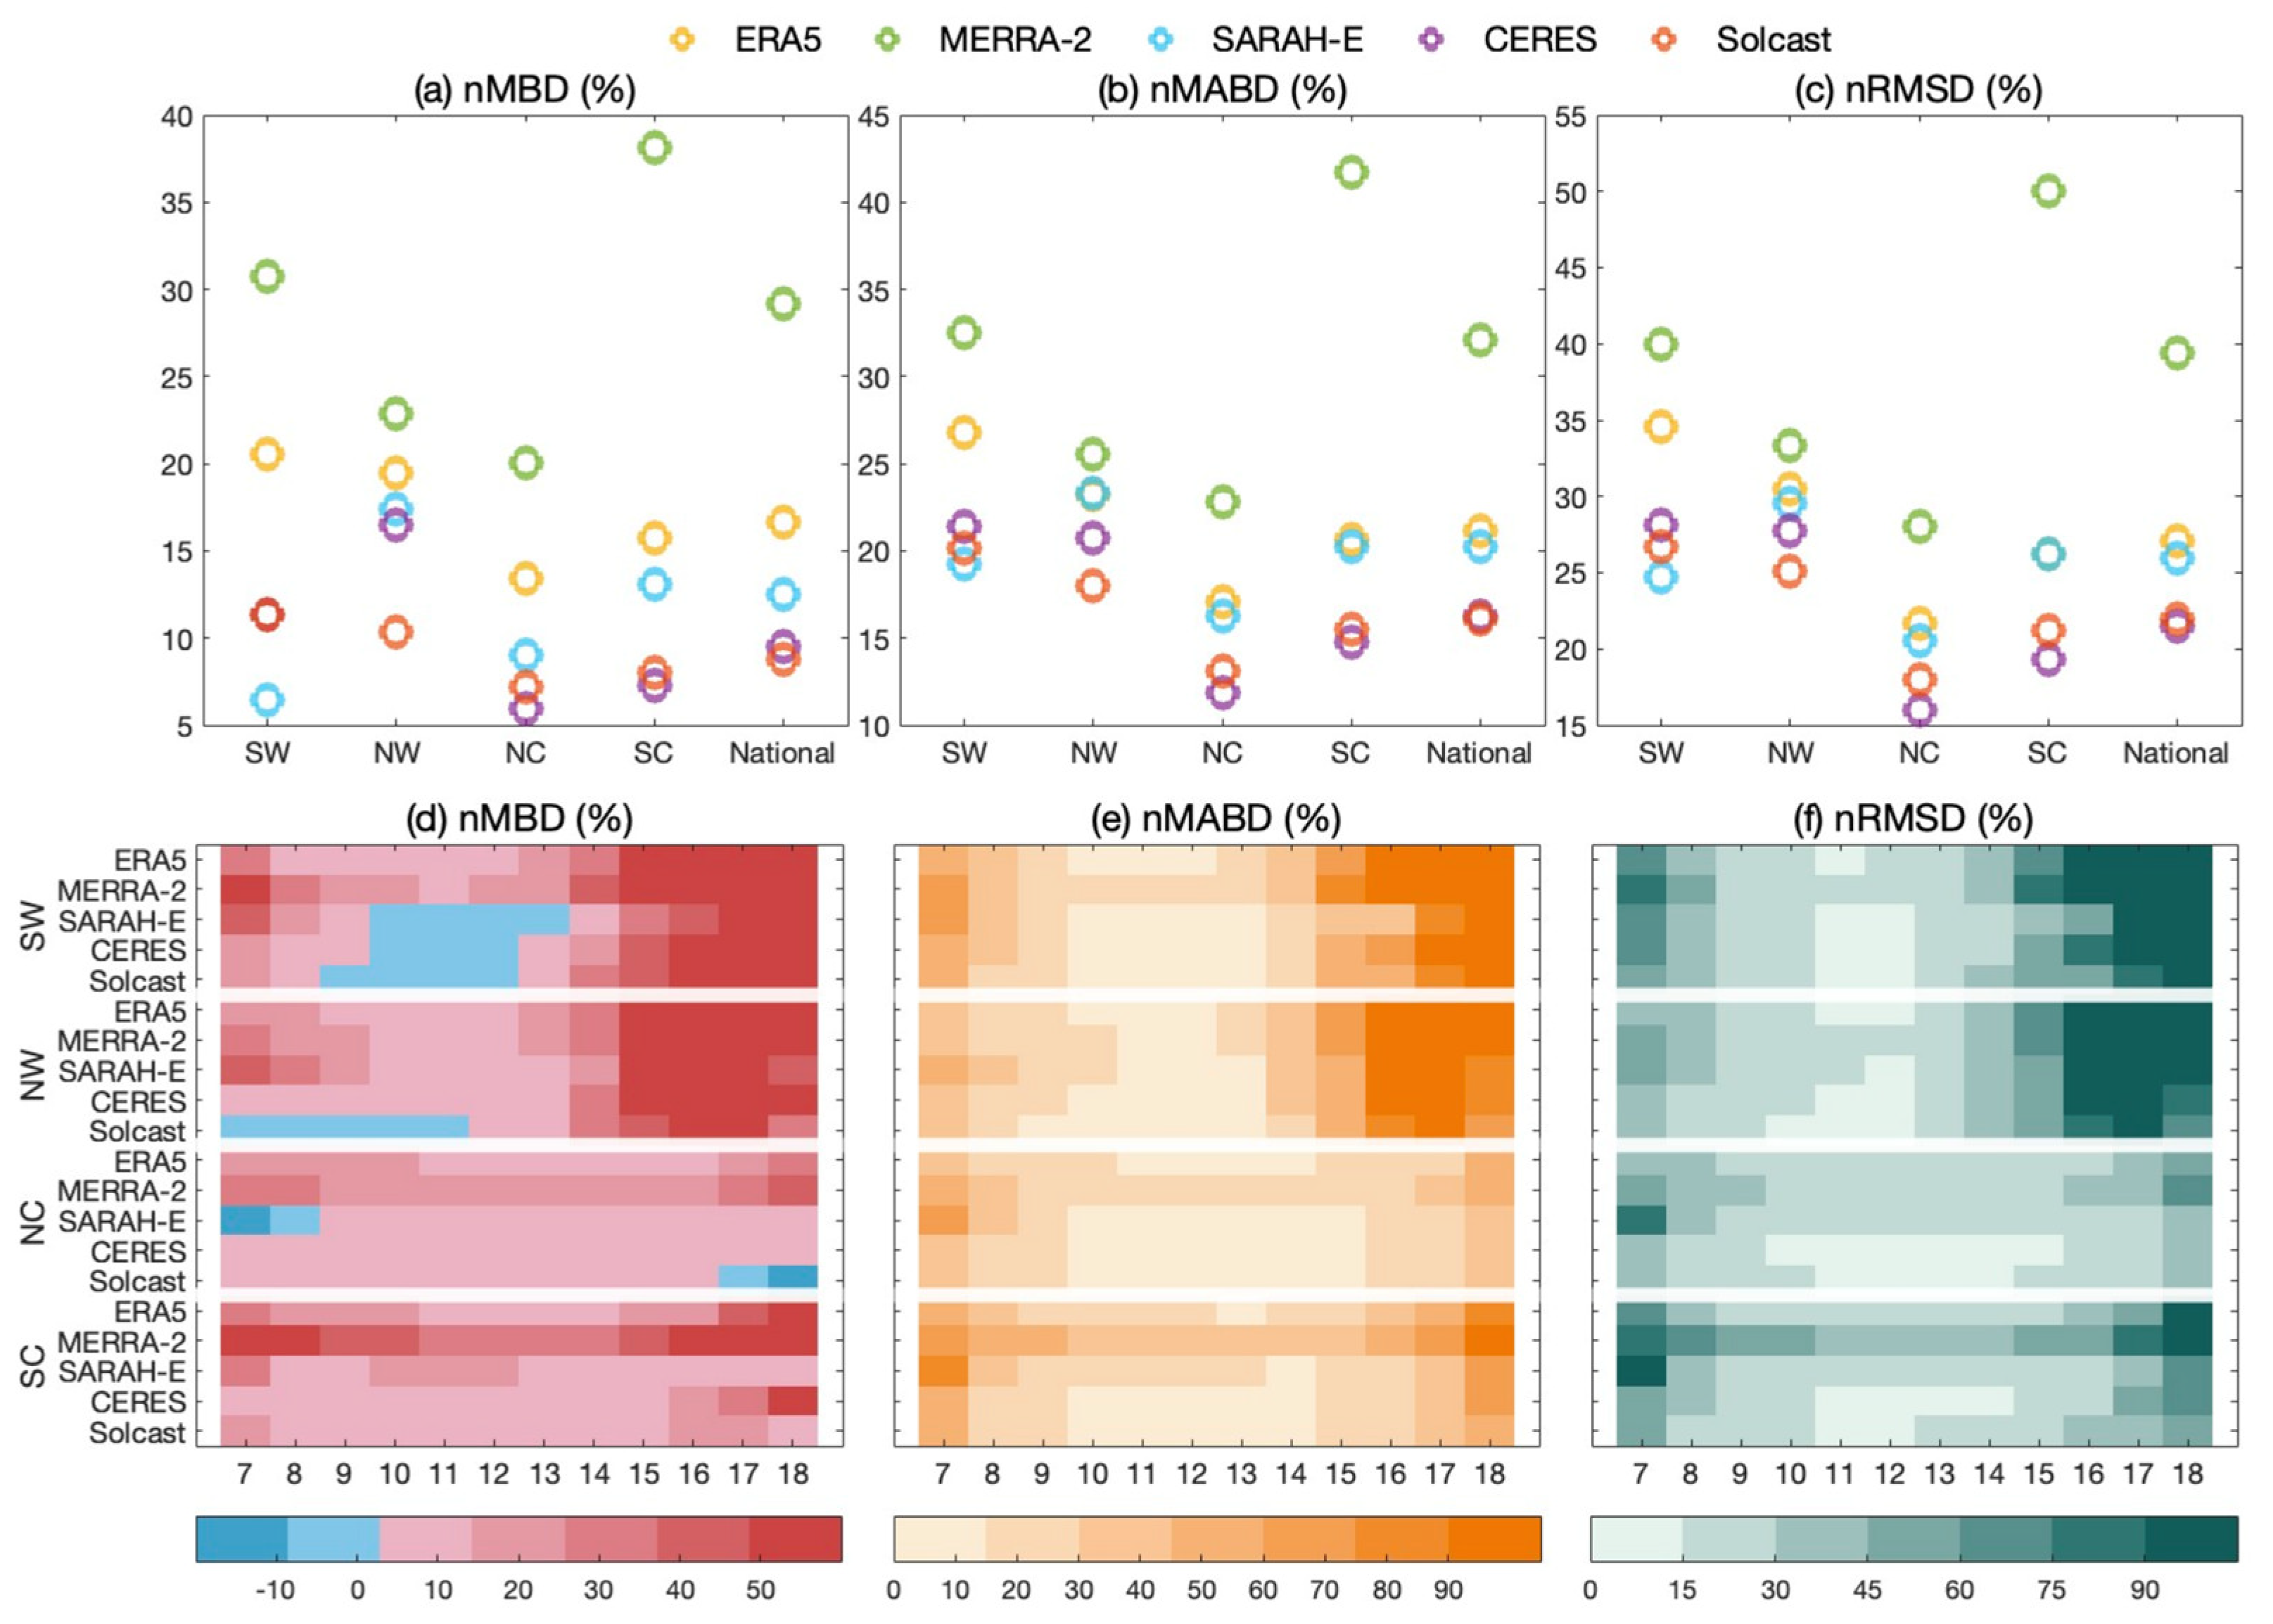
3.1. Accuracy Test

The diurnal performance of the accuracy of the validated satellite-derived and reanalysis SSR products is illustrated in Figure 2. In general, SSR estimations at each hour are overestimated by the five validated products, and larger deviations are observed at low solar elevation angles during sunrise and sunset. This may be due to instrumental limitations, increased turbulence, or the longer optical path that amplifies the influence of atmospheric constituents on light attenuation at low solar elevations [13]. The average nMBD, nMABD, and nRMSD for the morning and afternoon hours (7–9 and 16–18 LT) are 37.1%, 52.4%, and 57.6%, while for the noon hours (10–15 LT) they are 15.8%, 19.7%, and 23.0%, respectively, averaged over the five gridded products.
Among the five products, the estimation accuracy of the diurnal SSR cycle improves from MERRA-2, ERA5, SARAH-E, and CERES to Solcast (Figure 2a–c). This trend is also reflected in the hourly averages for 7–18 LT (Figure 2d–f). MERRA-2 exhibits the largest deviation from the surface observations, with hourly averages of nMBD, nMABD, and nRMSD reaching 44.9%, 49.8%, and 54.3%, respectively. Throughout the day, MERRA-2 shows the most significant overestimation, especially in the afternoon. Previous studies have also observed substantial discrepancies in MERRA-2 in estimating hourly SSR when compared to worldwide BSRN observations [5], as well as daily SSR when compared to CMA observations in China [4]. The largest deviation in MERRA-2 among the validated products has been attributed to its inability to capture cloud dynamics [49]. ERA5, another reanalysis product, shows a similar diurnal pattern to MERRA-2 but lower bias than MERRA-2. For SARAH-E, one possible reason for its relatively larger bias in hourly SSR retrievals compared to the other satellite products may be the absence of a satellite that centrally covers China, resulting in a larger viewing angle and, consequently, greater pixel distortion in satellite images over China [38,45]. CERES and Solcast exhibit high accuracy at noon but reduced accuracy at sunrise and sunset, as well. The high accuracy of CERES at noon was attributed to the complementary timing of its two sensors (Terra and Aqua) by Lu and Ma [14]. Terra orbits in a descending sun-synchronous orbit with an equator-crossing time of 10:30, while Aqua orbits in an ascending sun-synchronous orbit with an equator-crossing time of 13:30 [14,50]. This combination of observations provides a more balanced representation of atmospheric conditions, such as cloud cover and aerosols, contributing to the higher accuracy observed at noon. The high accuracy of Solcast’s SSR estimation has been proven worldwide in terms of nRMSD when compared to BSRN observations, which include only two Chinese stations [5,45]. Over China, Solcast, followed by CERES, exhibit the best performance in reproducing the diurnal SSR cycle, with bias slightly increasing at sunrise and sunset. Although Solcast exhibits higher accuracy than CERES at sunset (Figure 2a–c), the hourly average accuracy indices of CERES and Solcast are comparable over the entire period (Figure 2d–f), as the data sample size is smaller at sunset and sunrise.
The diurnal pattern of the estimation accuracy of the five gridded products remains consistent across seasons, aligning with the annual results shown in Figure 2a–c. The only difference lies in the degree of overestimation and underestimation across seasons. Given the similar diurnal patterns of accuracy in both seasons, we subtracted the accuracy index of the cold season from that of the warm season to highlight the differences, as illustrated by the seasonal difference in Figure 3a,g. Compared to the warm season, accuracy is lower in the cold season, which includes the snowy period, characterized by enhanced surface reflectance, and the heat supply period in China, which leads to higher aerosol concentrations [11,51]. These factors, combined with relatively lower solar elevation angles, make SSR estimation more challenging in the cold season [11,25,45,52]. The accuracy differences between the cold and warm seasons are generally larger at sunrise and sunset than at other hours. Specifically, the average nMBD, nMABD, and nRMSD over the five gridded products for the morning and afternoon hours (7–9 and 16–18 LT) are 48.6%, 76.7%, and 85.4% in the cold season and 33.1%, 46.7%, and 50.3% in the warm season, while for the noon hours (10–15 LT) they are 22.7%, 27.0%, and 30.2% in the cold season and 12.5%, 16.2%, and 19.1% in the warm season. This evidence of reduced accuracy at sunrise and sunset in the cold season is further verified by the percentage of stations with an nMABD greater than 15%, which is, on average, 74.8% in the cold season and 66.3% in the warm season at low solar elevation angles (7–9 and 16–18 LT), while the average percentages of stations with an nMABD greater than 15% for the noon hours (10–15 LT) are 56.5% in the cold season and 34.6% in the warm season. In contrast, as shown in Figure 3g, CERES and Solcast continue to exhibit superior performance, particularly during the warm season.
Reduced estimation accuracy at hours with low solar elevation angles is also observed across the regions (Figure 4). In terms of nMBD, the validated satellite and reanalysis products overestimate SSR during most of the day (Figure 4a,d). The exception of SSR underestimation by the SARAH-E, CERES, and Solcast products in the morning mainly occurs in the SW region of China, where the Qinghai–Tibet Plateau is located. As also indicated by the hourly averages of nMABD and nRMSD (Figure 4b,c), ERA5, CERES, and Solcast all reach their highest nMABD and nRMSD in the SW. The nMABD values of the three products are as high as 26.8%, 21.4%, and 20.1%, and their nRMSD values are as high as 34.6%, 28.1%, and 26.7%, respectively, both significantly exceeding the national average values (Figure 4b,c). Figure 4d shows that accuracy in the SW region decreases further at sunset, with the average nMBD, nMABD, and nRMSD for the five products at the 16–18 LT reaching 183.7%, 184.4%, and 189.7%, respectively. Similar conclusions have been obtained in previous work, showing that the accuracy of all radiation products is relatively poor in the Qinghai–Tibet Plateau, regardless of bias or RMSE, and the error is generally higher than that of the polar regions [12]. This may be attributed to the rugged terrain of the Tibetan Plateau. Complex terrain directly affects solar radiation estimation through shading by mountain peaks and scattering from elevation-dependent snow cover and indirectly through convective orographic clouds and the redistribution of precipitation by large- and local-scale diurnal winds [27,34]. The large deviation in MERRA-2 is most evident in SC, where intense cloud activity and a monsoonal climate occur. This points to the inadequacy of reanalysis models in accurately capturing the diurnal cycle of cloud cover and aerosol variations, particularly in regions with complex cloudy weather or significant human activity [33,49]. SARAH-E shows its lowest accuracy in NW, the desert region of China. In addition, all five products also exhibited significant accuracy degradation at sunset (16–18 LT) in the NW region, with average nMBD, nMABD, and nRMSD values of 96.0%, 106.7%, and 109.6%, respectively. This may be due to the high albedo of the bright underlying surface, which closely resembles the albedo of clouds. This similarity makes it challenging to distinguish between cloudy and sunny conditions, often leading to SSR estimation errors [40,45]. All of the validated products show the highest accuracy in NC, the main plain area of China.

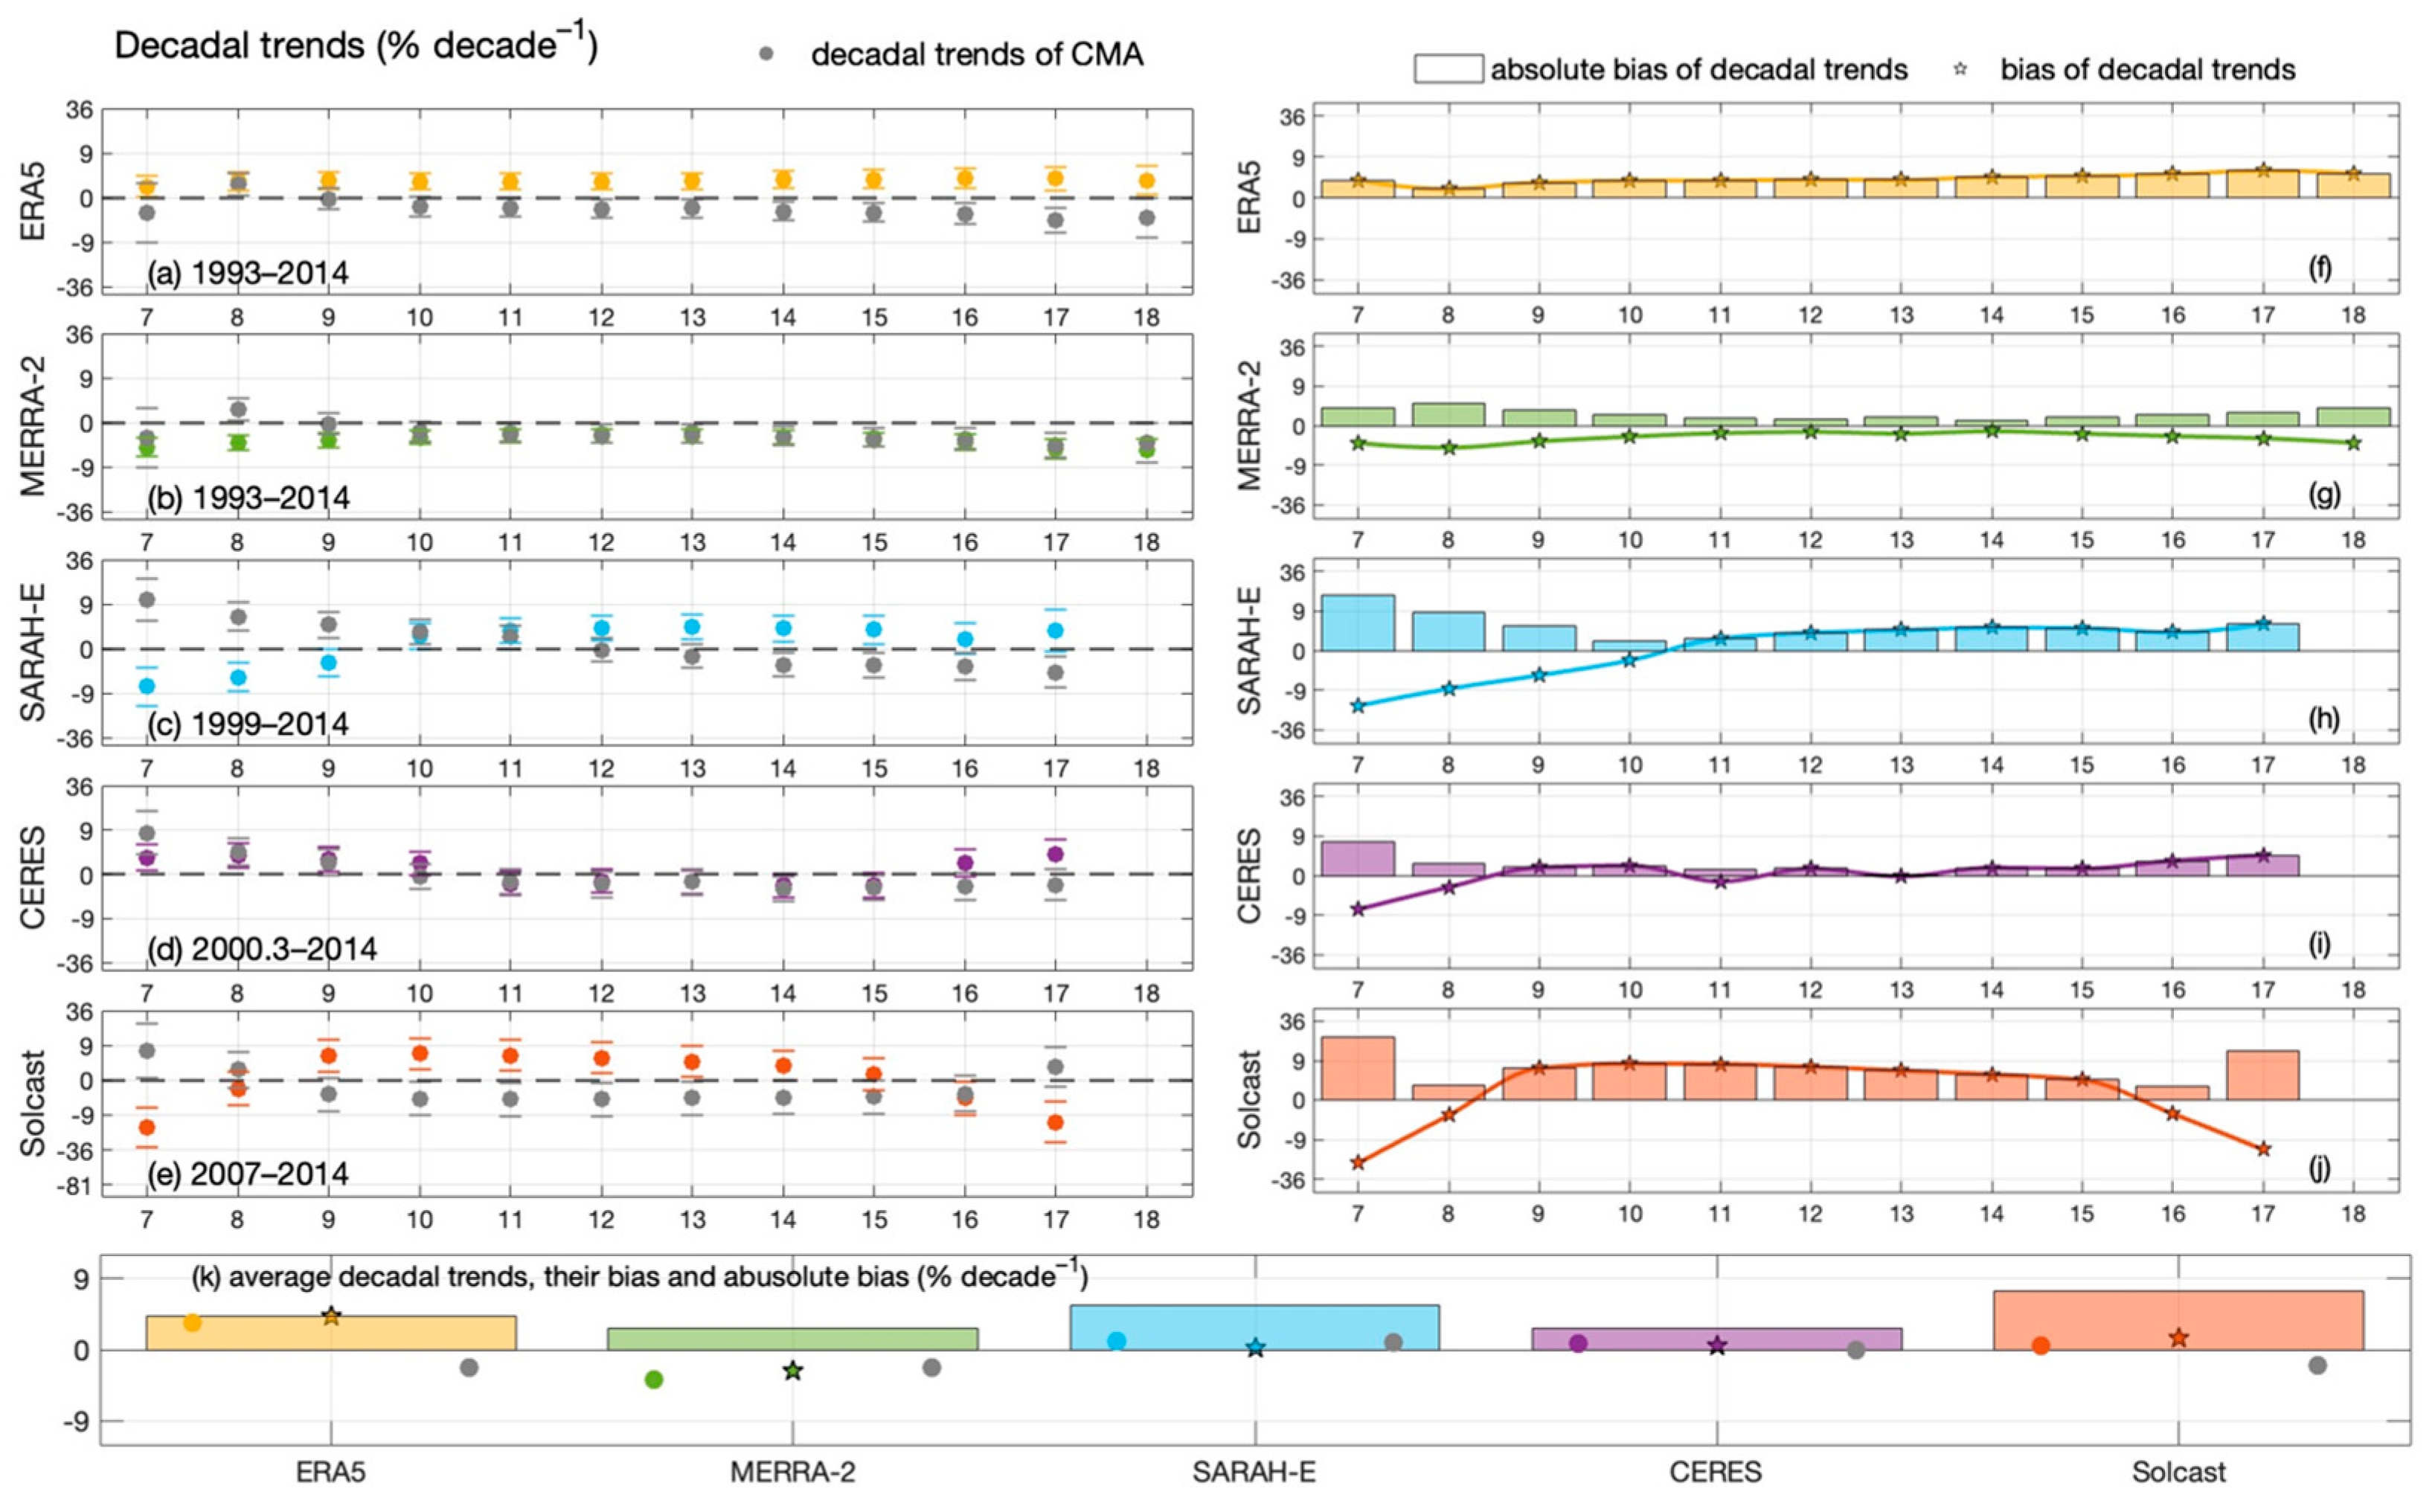
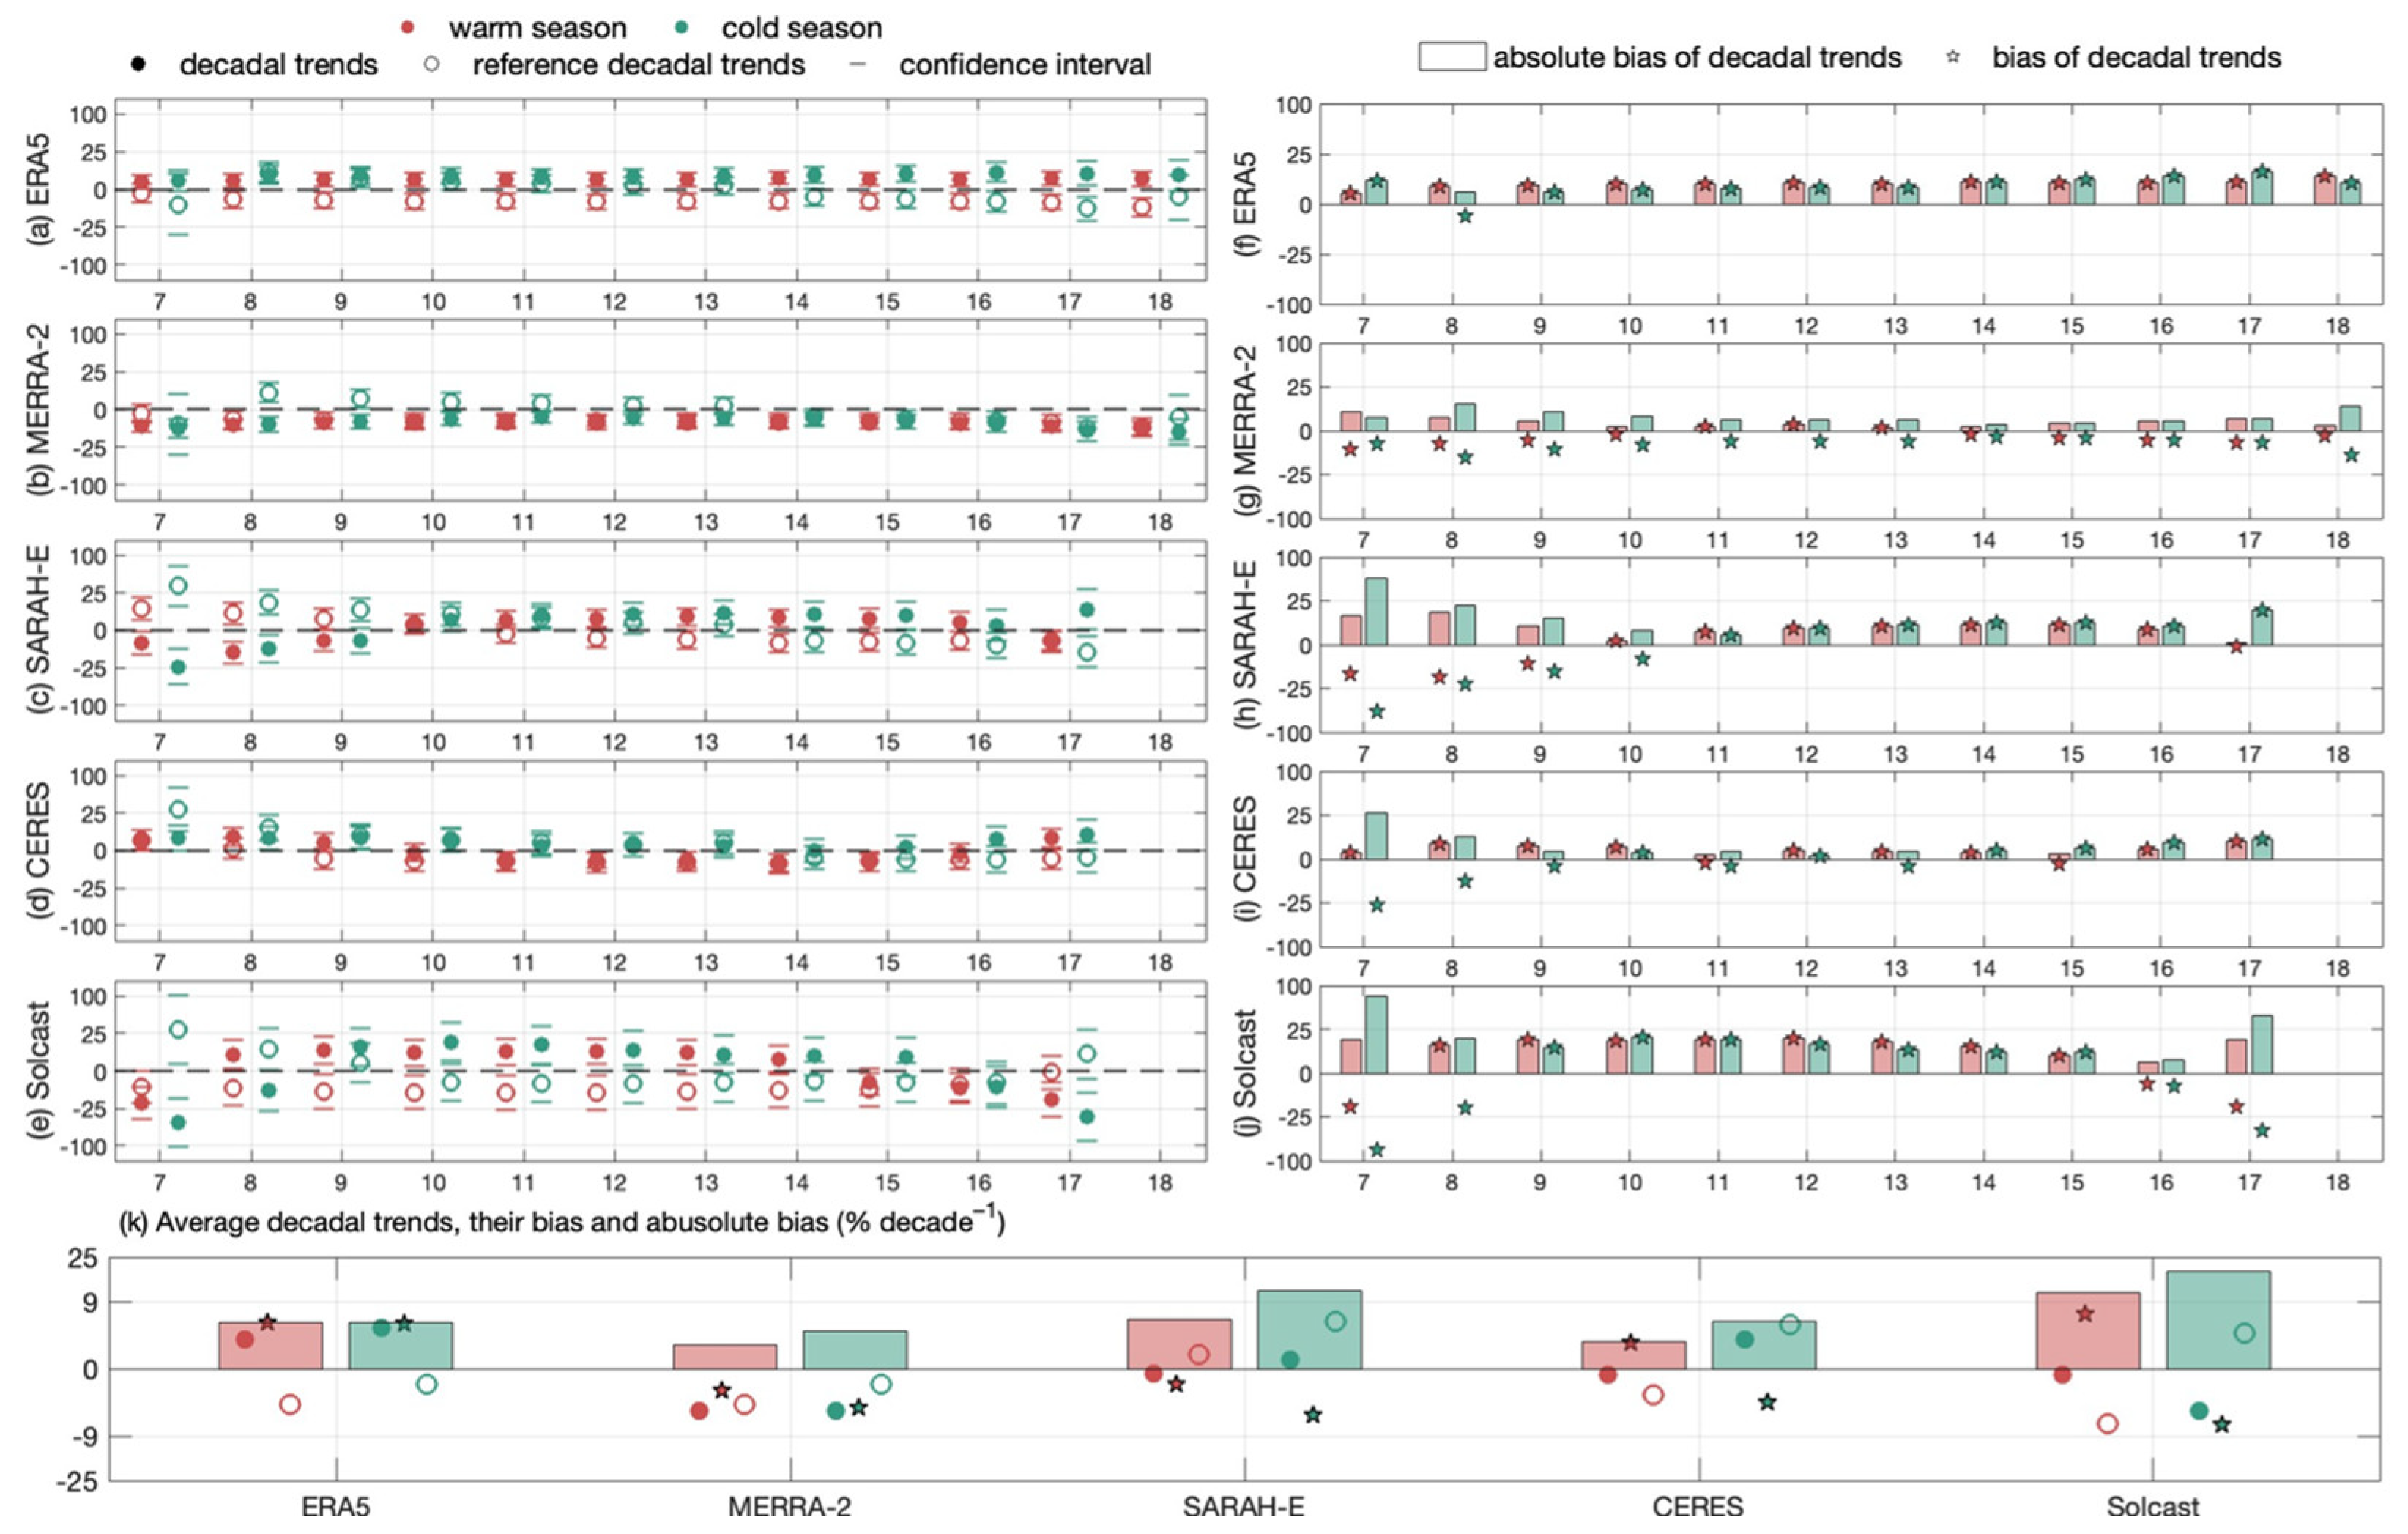
3.2. Trend Consistency Test

Consistent and stable SSR is essential for ensuring the steady output of PV systems. However, the trend consistency of the diurnal trends in satellite-derived and reanalysis SSR has rarely been evaluated in previous studies due to the lack of long-term hourly observations. Taking advantage of the 22 years of continuous hourly SSR observations over China, this study reveals opposite directions in the diurnal SSR trends between surface observations and the gridded products, especially for Solcast, SARAH-E, and ERA5, during most of the day (Figure 5a–e). This highlights the challenges of accurately reproducing diurnal SSR trends using satellite or reanalysis products over China, a region known for its rapid industrialization and high levels of anthropogenic aerosol emissions [13,53,54,55]. The significant bias observed in the diurnal SSR trends of SARAH-E and ERA5 (Figure 5a,c,f,h) may result from their reliance on aerosol climatology rather than accounting for long-term or real-time aerosol variations in their SSR estimations [56,57]. While Solcast uses time-dynamic MERRA-2 aerosol data as the input in its irradiance model, the inherent model assumptions may still introduce substantial biases in the diurnal trends of SSR (Figure 5e,j), especially in regions with complex and highly variable aerosol conditions. Furthermore, the short time period of Solcast (2007–2014) may affect the significance of the derived decadal trends, thereby influencing its trend consistency with surface observations. Discrepancies in hourly SSR trends are particularly evident at low solar elevation angles (Figure 5a–j), where the longer optical path enhances the attention of atmospheric constituents on SSR [13].
With a more comprehensive incorporation of aerosol information, both MERRA-2 and CERES demonstrate superior performance in reproducing diurnal SSR trends over China [5,35,42]. The average difference in their hourly SSR trends is only about 1.0% decade−1 higher than those derived from surface observations. MERRA-2 maintains a relatively stable bias in hourly SSR trends throughout the day, whereas CERES exhibits greater variability of decadal trend bias, with larger biases near sunrise and sunset (Figure 5b,d,g,i). This suggests that MERRA-2 is more effective than CERES at capturing diurnal SSR trends. While CERES incorporates aerosol retrievals at regular intervals from satellite observations, MERRA-2 integrates near real-time and continuous aerosol information by assimilating observational data from multiple sources, enhancing its ability to reproduce SSR trends throughout the day [5,35,43,44].
Among the evaluated datasets, MERRA-2 exhibits the highest trend consistency in hourly SSR trends, followed by CERES, ERA5, SARAH-E, and Solcast, with this ranking remaining consistent across both cold and warm seasons (Figure 6). Larger biases in the satellite- and reanalysis-derived hourly SSR trends generally occur in the cold season at lower solar elevation angles, consistent with the results of the accuracy test (Figure 3 and Figure 6). This is particularly evident for satellite-derived products SARAH-E, CERES, and Solcast, where the average absolute trend bias during morning and afternoon hours (7–9 and 16–18 LT) in the cold season can reach up to 19.8, 8.1 and 28.2% decade−1 (Figure 6h–j). This may because low solar elevation angles complicate the accurate detection of clouds in satellite images, resulting in larger errors in satellite-derived products compared to reanalysis products during the cold season [45]. ERA5 shows a relatively consistent trend bias between cold and warm seasons throughout the day, with an average overestimation of 4.2% decade−1 (Figure 6f). Compared to other products, MERRA-2 demonstrates superior performance in capturing diurnal SSR trends even in the cold season, reinforcing its robustness across different seasonal conditions (Figure 6b,g,i). In addition to MERRA-2, CERES also shows high trend consistency in the warm season (Figure 6i). This suggests that both MERRA-2 and CERES, which incorporate aerosol information more comprehensively and precisely, are well-suited to analyzing SSR diurnal variations during the warm season, which is the peak period for solar energy utilization [5,35,43,44].
Reduced trend consistency at sunrise and sunset hours is also observed across the regions. The average absolute trend bias during morning and afternoon hours (7–9 and 16–18 LT) across the four regions and five products can reach up to 8.6% decade−1, while for the noon hours (10–15 LT) it is 5.5% decade−1 (Figure 7e). As shown in Figure 7d, decadal trends of SSR are primarily underestimated in the morning and evening but overestimated at noon. The two products using climatology aerosol information for SSR estimation, ERA5 and SARAH-E, reveal the largest absolute trend bias in the eastern regions of SC and NC (Figure 7c), characterized by dense populations and high levels of anthropogenic aerosols. This again illustrates the importance of dynamic aerosol information for obtaining decadal trends in SSR [13,53,54,55]. Meanwhile, for products that account for temporal variations in aerosols, the largest absolute trend biases are found in the SC region for MERRA-2 and the SW region for CERES and Solcast (Figure 7c). Furthermore, the SW and SC regions have higher averaged absolute trend biases over the five gridded products at 7.9% decade−1 and 7.3% decade−1, respectively, compared to the NW and NC regions, which have averaged absolute trend biases of 6.4% decade−1 and 6.8% decade−1, respectively (Figure 7c). The difficulty of capturing decadal trends in SW may be attributed to its rugged terrain [27,34], as explained in relation to the accuracy test. In SC, in addition to the influence of national aerosols, capturing decadal trends of SSR under cloudy conditions has proven to be challenging [4]. In general, the regional analyses illustrate that in addition to aerosols, rugged terrain and cloudy conditions also present challenges to estimating SSR decadal trends. Among the five validated products, MERRA-2, along with ERA5 and CERES, demonstrate strong regional trend consistency, indicating their robust ability to capture regional characteristics (Figure 7c).

3.3. Comprehensive Evaluation

To identify the product with the best overall performance in reproducing the diurnal cycles and trends of SSR over China, we used nMABD and absolute trend bias as key evaluation indices, summarizing the accuracy and trend consistency in Table A1. The overall performance of the five gridded products in terms of both accuracy and trend consistency was compared across different seasons and regions, as shown in Figure 8a,b. The polygon area formed by connecting these accuracy and trend consistency index values is directly proportional to the estimation performance of each product, providing a visual representation of their relative strengths.
Both temporal and spatial evaluations indicate that CERES exhibits the best overall performance in terms of both accuracy and trend consistency for hourly SSR estimation. Solcast shows the highest accuracy but the lowest trend consistency. SARAH-E ranks third in overall accuracy and fourth in trend consistency, and its incomplete coverage over China further limits its applicability. The two reanalysis products, ERA5 and MERRA-2, show superior performance in capturing diurnal SSR trends but exhibit the largest deviations in reproducing diurnal SSR cycles.

4. Conclusions

Leveraging 22 years of continuous hourly surface observations from 96 stations across China, this study provides a comprehensive evaluation of the accuracy and trend consistency of five gridded surface solar radiation (SSR) products—MERRA-2, CERES, ERA5, SARAH-E, and Solcast—in reproducing diurnal SSR cycles and trends over China.
Our findings reveal a systematic diurnal pattern in the accuracy and trend consistency of satellite- and reanalysis-derived hourly SSR, with smaller biases at noon and larger biases at sunrise and sunset. These discrepancies, which are amplified at low solar elevation angles, persist consistently across seasons and regions. Seasonal analyses further indicate that the accuracy and trend consistency of hourly SSR estimates degrade during the cold season, which is characterized by high levels of anthropogenic aerosol loadings. Regional analyses show lower accuracy in the southwest plateau region of China and lower trend consistency in southern China, characterized by cloudy weather in the southeast and rugged terrain in the southwest. These results highlight the critical importance of accurately capturing real-time aerosol dynamics and other radiative components (e.g., clouds, water vapor), particularly during low solar elevation periods and above special ground surfaces, such as plateaus and basins, for reliable hourly SSR estimations.
Among the validated products, the accuracy of diurnal SSR cycle estimation improves in the order of MERRA-2, ERA5, SARAH-E, CERES, and Solcast, while trend consistency ranks from lowest to highest in the order of Solcast, SARAH-E, CERES, ERA5, and MERRA-2. When considering both accuracy and trend consistency, CERES demonstrates the best overall performance, followed by Solcast, ERA5, SARAH-E, and MERRA-2. These results provide a valuable reference for selecting the most appropriate hourly SSR dataset tailored to specific needs, whether for solar energy assessments, climate studies, or surface radiative process analysis.

Author Contributions

Conceptualization, Y.W.; formal analysis, H.W.; writing—original draft preparation, H.W.; writing—review and editing, H.W. and Y.W.; funding acquisition, Y.W. All authors have read and agreed to the published version of the manuscript.

Funding

This research was funded by the Young Taishan Scholars Program of Shandong Province, grant number tsqn202211061, and the National Natural Science Foundation of China, grant number 41971018.

Data Availability Statement

Surface observations used in this study are available from the China Meteorological Data Service Center via http://data.cma.cn/en/ (accessed on 21 May 2015). Reanalysis data from ERA5 are available via https://cds.climate.copernicus.eu/, and MERRA-2 is available via https://disc.gsfc.nasa.gov/, both were accessed on 16 June 2023. Satellite data from SARAH-E are available via https://wui.cmsaf.eu/ (accessed on 19 June 2023), CERES is available via https://ceres.larc.nasa.gov/ (accessed on 12 June 2023), and Solcast is available via https://solcast.com/ (accessed on 7 July 2023).

Conflicts of Interest

The authors declare no conflicts of interest.

Appendix A

Table A1. Comparison of accuracy and trend consistency of the five hourly surface solar radiation (SSR) gridded products.
ProductsERA5MERRA-2SARAH-ECERESSolcast
nMABD
(%)
National37.249.835.430.827.0
Warm Season32.344.330.526.823.3
Cold Season53.864.755.245.240.5
SW Region26.832.519.221.420.1
NW Region23.225.523.320.718.0
NC Region17.122.816.311.913.1
SC Region20.641.820.314.815.5
ABSOLUTE TREND BIAS
(% DECADE−1)
National2.10.94.31.27.1
Warm Season4.21.14.91.411.5
Cold Season4.32.912.24.418.9
SW Region4.35.27.77.315.0
NW Region3.73.47.35.013.3
NC Region4.03.69.74.912.7
SC Region5.05.49.45.511.7
Figure A1. Comparisons of the diurnal cycles of surface solar radiation (SSR, W m–2) between the validated products and reference CMA observations after timestamp standardization.
Remotesensing 17 01317 g0a1

References

  1. Nations. Carbon Neutrality by 2050: The World’s Most Urgent Mission. Available online: https://www.un.org/sg/en/content/sg/articles/2020-12-11/carbon-neutrality-2050-the-world%E2%80%99s-most-urgent-mission (accessed on 16 April 2024).
  2. Sweerts, B.; Pfenninger, S.; Yang, S.; Folini, D.; van der Zwaan, B.; Wild, M. Estimation of losses in solar energy production from air pollution in China since 1960 using surface radiation data. Nat. Energy 2019, 4, 657–663. [Google Scholar] [CrossRef]
  3. National Energy Administration. The Installed Capacity of Solar Power Generation Exceeds 700 Million Kilowatts. Available online: https://www.nea.gov.cn/2024-07/26/c_1310782813.htm (accessed on 29 July 2024).
  4. Cao, Q.; Liu, Y.; Sun, X.; Yang, L. Country-level evaluation of solar radiation data sets using ground measurements in China. Energy 2022, 241, 122938. [Google Scholar] [CrossRef]
  5. Yang, D.; Bright, J.M. Worldwide validation of 8 satellite-derived and reanalysis solar radiation products: A preliminary evaluation and overall metrics for hourly data over 27 years. Sol. Energy 2020, 210, 3–19. [Google Scholar] [CrossRef]
  6. Wild, M.; Folini, D.; Henschel, F.; Fischer, N.; Müller, B. Projections of long-term changes in solar radiation based on CMIP5 climate models and their influence on energy yields of photovoltaic systems. Sol. Energy 2015, 116, 12–24. [Google Scholar] [CrossRef]
  7. King, D.L.; Boyson, W.E.; Kratochvil, J.A. Photovoltaic Array Performance Model. 2004. Available online: https://www.osti.gov/servlets/purl/919131 (accessed on 3 January 2025).
  8. Huld, T.; Amillo, A.M.G. Estimating PV Module Performance over Large Geographical Regions: The Role of Irradiance, Air Temperature, Wind Speed and Solar Spectrum. Energies 2015, 8, 5159–5181. [Google Scholar] [CrossRef]
  9. Ishaque, K.; Salam, Z.; Taheri, H. Accurate MATLAB Simulink PV System Simulator Based on a Two-Diode Model. J. Power Electron. 2011, 11, 179–187. [Google Scholar] [CrossRef]
  10. Yang, Q.; Huang, T.; Wang, S.; Li, J.; Dai, S.; Wright, S.; Wang, Y.; Peng, H. A GIS-based high spatial resolution assessment of large-scale PV generation potential in China. Appl. Energy 2019, 247, 254–269. [Google Scholar] [CrossRef]
  11. Wang, Y.; Trentmann, J.; Yuan, W.; Wild, M. Validation of CM SAF CLARA-A2 and SARAH-E Surface Solar Radiation Datasets over China. Remote Sens. 2018, 10, 1977. [Google Scholar] [CrossRef]
  12. Wang, G.; Wang, T.; Xue, H. Validation and comparison of surface shortwave and longwave radiation products over the three poles. Int. J. Appl. Earth Obs. Geoinf. 2021, 104, 102538. [Google Scholar] [CrossRef]
  13. Wang, Y.W.; Zhang, J.H.; Sanchez-Lorenzo, A.; Tanaka, K.; Trentmann, J.; Yuan, W.P.; Wild, M. Hourly Surface Observations Suggest Stronger Solar Dimming and Brightening at Sunrise and Sunset Over China. Geophys. Res. Lett. 2021, 48, e2020GL091422. [Google Scholar] [CrossRef]
  14. Lu, L.; Ma, Q. Diurnal Cycle in Surface Incident Solar Radiation Characterized by CERES Satellite Retrieval. Remote Sens. 2023, 15, 3217. [Google Scholar] [CrossRef]
  15. Li, J.; Wang, D. A Comparative Study on Three Types of Remote Sensing Solar Radiation Products. Clim. Environ. Res. 2018, 23, 252–258. [Google Scholar] [CrossRef]
  16. Zhang, X.; Liang, S.; Wild, M.; Jiang, B. Analysis of surface incident shortwave radiation from four satellite products. Remote Sens. Environ. 2015, 165, 186–202. [Google Scholar] [CrossRef]
  17. Wang, D.; Sheng, L.; Shi, G.; Che, H. Comparison of Surface Solar Radiation Reanalysis Data and Observations over China. J. Appl. Meteorol. Sci. 2012, 23, 729–738. [Google Scholar]
  18. Liu, J.; Shi, C.; Han, S.; Jiang, Z.; Zhang, T. The Data Fusion of Multi-source Downward Surface Solar Radiation and Evaluation. Remote Sens. Technol. Appl. 2018, 33, 850–856. [Google Scholar]
  19. Wang, J.; Sun, X.; Sun, R.; Li, Z.; Guo, R.; He, M. Comparison of reanalysis radiation data and observations in China for 2000–2016. J. Trop. Meteorol. 2020, 36, 734–743. [Google Scholar]
  20. Zhang, X.; Lu, N.; Jiang, H.; Yao, L. Evaluation of Reanalysis Surface Incident Solar Radiation Data in China. Sci. Rep. 2020, 10, 3494. [Google Scholar] [CrossRef]
  21. Peng, X.; She, J.; Zhang, S.; Tan, J.; Li, Y. Evaluation of Multi-Reanalysis Solar Radiation Products Using Global Surface Observations. Atmosphere 2019, 10, 42. [Google Scholar] [CrossRef]
  22. Shi, H.; Li, W.; Fan, X.; Zhang, J.; Hu, B.; Husi, L.; Shang, H.; Han, X.; Song, Z.; Zhang, Y.; et al. First assessment of surface solar irradiance derived from Himawari-8 across China. Sol. Energy 2018, 174, 164–170. [Google Scholar] [CrossRef]
  23. Allen, R.J.; Norris, J.R.; Wild, M. Evaluation of multidecadal variability in CMIP5 surface solar radiation and inferred underestimation of aerosol direct effects over Europe, China, Japan, and India. J. Geophys. Res. Atmos. 2013, 118, 6311–6336. [Google Scholar] [CrossRef]
  24. Chen, R.S.; Ersi, K.; Yang, J.P.; Lu, S.H.; Zhao, W.Z. Validation of five global radiation models with measured daily data in China. Energy Convers. Manag. 2004, 45, 1759–1769. [Google Scholar] [CrossRef]
  25. Xia, X.A.; Wang, P.C.; Chen, H.B.; Liang, F. Analysis of downwelling surface solar radiation in China from National Centers for Environmental Prediction reanalysis, satellite estimates, and surface observations. J. Geophys. Res.-Atmos. 2006, 111, 9. [Google Scholar] [CrossRef]
  26. Wu, F.T.; Fu, C.B. Assessment of GEWEX/SRB version 3.0 monthly global radiation dataset over China. Meteorol. Atmos. Phys. 2011, 112, 155–166. [Google Scholar] [CrossRef]
  27. Kong, H.; Wang, J.; Cai, L.; Cao, J.; Zhou, M.; Fan, Y. Surface Solar Radiation Resource Evaluation of Xizang Region Based on Station Observation and High-Resolution Satellite Dataset. Remote Sens. 2024, 16, 1405. [Google Scholar] [CrossRef]
  28. Zhang, X.; Liang, S.; Wang, G.; Yao, Y.; Jiang, B.; Cheng, J. Evaluation of the Reanalysis Surface Incident Shortwave Radiation Products from NCEP, ECMWF, GSFC, and JMA Using Satellite and Surface Observations. Remote Sens. 2016, 8, 225. [Google Scholar] [CrossRef]
  29. Urraca, R.; Huld, T.; Gracia-Amillo, A.; Javier Martinez-de-Pison, F.; Kaspar, F.; Sanz-Garcia, A. Evaluation of global horizontal irradiance estimates from ERA5 and COSMO-REA6 reanalyses using ground and satellite-based data. Sol. Energy 2018, 164, 339–354. [Google Scholar] [CrossRef]
  30. Zhang, K.; Zhao, L.; Tang, W.; Yang, K.; Wang, J. Global and Regional Evaluation of the CERES Edition-4A Surface Solar Radiation and Its Uncertainty Quantification. IEEE J. Sel. Top. Appl. Earth Obs. Remote Sens. 2022, 15, 2971–2985. [Google Scholar] [CrossRef]
  31. Li, J.; Wenjun, T.; Jingwen, Q.; and Yan, Z. Mapping high-resolution surface shortwave radiation over East Asia with the new generation geostationary meteorological satellite Himawari-8. Int. J. Digit. Earth 2023, 16, 323–336. [Google Scholar] [CrossRef]
  32. Jiang, H.; Yang, Y.P.; Bai, Y.Q.; Wang, H.Z. Evaluation of the Total, Direct, and Diffuse Solar Radiations from the ERA5 Reanalysis Data in China. IEEE Geosci. Remote Sens. Lett. 2020, 17, 47–51. [Google Scholar] [CrossRef]
  33. Du, Y.; Shi, H.; Zhang, J.; Xia, X.; Yao, Z.; Fu, D.; Hu, B.; Huang, C. Evaluation of MERRA-2 hourly surface solar radiation across China. Sol. Energy 2022, 234, 103–110. [Google Scholar] [CrossRef]
  34. Yang, K.; Pinker, R.T.; Ma, Y.; Koike, T.; Wonsick, M.M.; Cox, S.J.; Zhang, Y.; Stackhouse, P. Evaluation of satellite estimates of downward shortwave radiation over the Tibetan Plateau. J. Geophys. Res. Atmos. 2008, 113, D17204. [Google Scholar] [CrossRef]
  35. Gelaro, R.; Mccarty, W.; Suárez, M.J.; Todling, R.; Molod, A.; Takacs, L.; Randles, C.A.; Darmenov, A.; Bosilovich, M.G.; Reichle, R.; et al. The Modern-Era Retrospective Analysis for Research and Applications, Version 2 (MERRA-2). J. Clim. 2017, 30, 5419–5454. [Google Scholar] [CrossRef]
  36. Buchard, V.; Randles, C.A.; da Silva, A.M.; Darmenov, A.; Colarco, P.R.; Govindaraju, R.; Ferrare, R.; Hair, J.; Beyersdorf, A.J.; Ziemba, L.D.; et al. The MERRA-2 Aerosol Reanalysis, 1980 Onward. Part II: Evaluation and Case Studies. J. Clim. 2017, 30, 6851–6872. [Google Scholar] [CrossRef] [PubMed]
  37. Randles, C.A.; da Silva, A.M.; Buchard, V.; Colarco, P.R.; Darmenov, A.; Govindaraju, R.; Smirnov, A.; Holben, B.; Ferrare, R.; Hair, J.; et al. The MERRA-2 Aerosol Reanalysis, 1980 Onward. Part I: System Description and Data Assimilation Evaluation. J. Clim. 2017, 30, 6823–6850. [Google Scholar] [CrossRef]
  38. Amillo, A.G.; Huld, T.; Müller, R. A New Database of Global and Direct Solar Radiation Using the Eastern Meteosat Satellite, Models and Validation. Remote Sens. 2014, 6, 8165–8189. [Google Scholar] [CrossRef]
  39. Dee, D.; Uppala, S.M.; Simmons, A.; Berrisford, P.; Poli, P.; Kobayashi, S.; Andrae, U.; Balmaseda, M.A.; Balsamo, G.; Bauer, P.; et al. The ERA-Interim reanalysis: Configuration and performance of the data assimilation system. Q. J. R. Meteorol. Soc. 2011, 137, 553–597. [Google Scholar] [CrossRef]
  40. Huld, T.; Müller, R.; Gracia-Amillo, A.; Pfeifroth, U.; Trentmann, J. Surface Solar Radiation Data Set—Heliosat, Meteosat-East (SARAH-E)—Edition 1.1; Satellite Application Facility on Climate Monitoring (CM SAF): Offenbach, Germany, 2017. [Google Scholar] [CrossRef]
  41. Wielicki, B.A.; Barkstrom, B.R.; Harrison, E.F.; III, R.B.L.; Smith, G.L.; Cooper, J.E. Clouds and the Earth’s Radiant Energy System (CERES): An Earth Observing System Experiment. Bull. Am. Meteorol. Soc. 1996, 853–868. [Google Scholar] [CrossRef]
  42. CERES_SYN1deg_Ed4A Data Quality Summary. 2021. Available online: https://ceres.larc.nasa.gov/documents/DQ_summaries/CERES_SYN1deg_Ed4A_DQS.pdf (accessed on 12 June 2023).
  43. Collins, W.D.; Rasch, P.J.; Eaton, B.E.; Khattatov, B.V.; Lamarque, J.F.; Zender, C.S. Simulating aerosols using a chemical transport model with assimilation of satellite aerosol retrievals: Methodology for INDOEX. J. Geophys. Res. Atmos. 2001, 106, 7313–7336. [Google Scholar] [CrossRef]
  44. Rutan, D.A.; Kato, S.; Doelling, D.R.; Rose, F.G.; Nguyen, L.T.; Caldwell, T.E.; Loeb, N.G. CERES Synoptic Product: Methodology and Validation of Surface Radiant Flux. J. Atmos. Ocean. Technol. 2015, 32, 1121–1143. [Google Scholar] [CrossRef]
  45. Bright, J.M. Solcast: Validation of a satellite-derived solar irradiance dataset. Sol. Energy 2019, 189, 435–449. [Google Scholar] [CrossRef]
  46. Gueymard, C.A. REST2: High-performance solar radiation model for cloudless-sky irradiance, illuminance, and photosynthetically active radiation—Validation with a benchmark dataset. Sol. Energy 2008, 82, 272–285. [Google Scholar] [CrossRef]
  47. Allen, R.G.; Pereira, L.S.; Raes, D.; Smith, M. Crop Evapotranspiration: Guidelines for Computing Crop Water Requirements. 1998. Available online: https://appgeodb.nancy.inra.fr/biljou/pdf/Allen_FAO1998.pdf (accessed on 24 August 2024).
  48. Wang, Y.; Trentmann, J.; Pfeifroth, U.; Yuan, W.; Wild, M. Improvement of Air Pollution in China Inferred from Changes between Satellite-Based and Measured Surface Solar Radiation. Remote Sens. 2019, 11, 2910. [Google Scholar] [CrossRef]
  49. Salazar, G.; Gueymard, C.; Galdino, J.B.; Vilela, O.d.C.; Fraidenraich, N. Solar irradiance time series derived from high-quality measurements, satellite-based models, and reanalyses at a near-equatorial site in Brazil. Renew. Sustain. Energy Rev. 2020, 117, 109478. [Google Scholar] [CrossRef]
  50. Loeb, N.G.; Doelling, D.R.; Wang, H.L.; Su, W.Y.; Nguyen, C.; Corbett, J.G.; Liang, L.S.; Mitrescu, C.; Rose, F.G.; Kato, S. Clouds and the Earth’s Radiant Energy System (CERES) Energy Balanced and Filled (EBAF) Top-of-Atmosphere (TOA) Edition-4.0 Data Product. J. Clim. 2018, 31, 895–918. [Google Scholar] [CrossRef]
  51. Chan, C.K.; Yao, X. Air pollution in mega cities in China. Atmos. Environ. 2008, 42, 1–42. [Google Scholar] [CrossRef]
  52. Sanchez-Lorenzo, A.; Wild, M.; Trentmann, J. Validation and stability assessment of the monthly mean CM SAF surface solar radiation dataset over Europe against a homogenized surface dataset (1983–2005). Remote Sens. Environ. 2013, 134, 355–366. [Google Scholar] [CrossRef]
  53. Zhou, Z.; Lin, A.; Wang, L.; Qin, W.; Zhong, Y.; He, L. Trends in downward surface shortwave radiation from multi-source data over China during 1984–2015. Int. J. Climatol. 2019, 40, 3467–3485. [Google Scholar] [CrossRef]
  54. Yang, S.; Wang, X.L.; Wild, M. Causes of Dimming and Brightening in China Inferred from Homogenized Daily Clear-Sky and All-Sky in situ Surface Solar Radiation Records (1958–2016). J. Clim. 2019, 32, 5901–5913. [Google Scholar] [CrossRef]
  55. Wang, Y.W.; Yang, S.; Sanchez-Lorenzo, A.; Yuan, W.P.; Wild, M. A Revisit of Direct and Diffuse Solar Radiation in China Based on Homogeneous Surface Observations: Climatology, Trends, and Their Probable Causes. J. Geophys. Res. Atmos. 2020, 125, e2020JD032634. [Google Scholar] [CrossRef]
  56. He, Y.; Wang, K.; Feng, F. Improvement of ERA5 over ERA-Interim in Simulating Surface Incident Solar Radiation throughout China. J. Clim. 2021, 3853–3867. [Google Scholar] [CrossRef]
  57. Wang, Y.W.; Yang, Y.H. China’s dimming and brightening: Evidence, causes and hydrological implications. Ann. Geophys. 2014, 32, 41–55. [Google Scholar] [CrossRef]
Figure 1. Spatial pattern of the multiyear annual mean surface solar radiation (W m–2) for the 96 observation stations across China. The stations are divided into four regions, northwest (NW), north China (NC), southwest (SW), and south China (SC), by three lines, Line A (the Qinling–Huaihe line), Line B (the 400 mm isohyet), and Line C (the dividing line between the first and second steps of the Chinese terrain).
Remotesensing 17 01317 g001
Figure 2. Diurnal (ac) and hourly average (df) patterns of the accuracy for five gridded products in surface solar radiation estimates over China. The accuracy indices—nMBD, nMABD, and nRMSD—are the normalized versions (in %) of the Mean Bias Deviation, Mean Absolute Bias Deviation, and Root Mean Square Deviation, respectively.
Remotesensing 17 01317 g002
Figure 3. Comparison of the accuracy of five gridded products in surface solar radiation estimates during the cold (October to next March) and warm (April to September) seasons. The accuracy indices—nMBD, nMABD, and nRMSD—are the normalized versions (in %) of the Mean Bias Deviation, Mean Absolute Bias Deviation, and Root Mean Square Deviation, respectively. Subfigure (a) shows the diurnal patterns of the differences in accuracy between the cold and warm seasons, (bf) illustrate the percentage of stations with an nMABD greater than 15%, and (g) presents the hourly averages for 7–18 LT.
Remotesensing 17 01317 g003
Figure 4. Comparison of the accuracy of five gridded products in surface solar radiation estimates across four regions, northwest (NW), north China (NC), southwest (SW), and south China (SC), at both hourly average (ac) and diurnal (df) scales. The accuracy indices—nMBD, nMABD, and nRMSD—are the normalized versions (in %) of the Mean Bias Deviation, Mean Absolute Bias Deviation, and Root Mean Square Deviation, respectively.
Remotesensing 17 01317 g004
Figure 5. Comparison of the decadal trends (% decade−1) in the hourly relative anomalies of surface solar radiation between the validated products and reference CMA observations. The horizontal lines on both sides of the trend magnitudes (circles) in subfigures (ae) represent the 95% confidence intervals. Trend bias (pentagrams) and absolute trend bias (bars) are shown in subfigures (fj), while the hourly averages are displayed in subfigure (k).
Remotesensing 17 01317 g005
Figure 6. Similar to Figure 5, but showing the comparison of the decadal trends (% decade−1) in the hourly relative anomalies of surface solar radiation between the validated products and reference CMA observations for the cold (October to next March) and warm (April to September) seasons. The trend magnitudes with 95% confidence intervals lines are shown in subfigures (ae). Trend bias (pentagrams) and absolute trend bias (bars) are presented in subfigures (fj), while the hourly averages are displayed in subfigure (k).
Remotesensing 17 01317 g006
Figure 7. Spatial comparison of the decadal trends (% decade−1) in the hourly relative anomalies of surface solar radiation, along with their bias and absolute bias, between reference CMA observations and the validated products across four regions, northwest (NW), north China (NC), southwest (SW), and south China (SC), at both hourly average (ac) and diurnal (d,e) scales.
Remotesensing 17 01317 g007
Figure 8. Overall comparison of both the accuracy and trend consistency of the five gridded products in surface solar radiation estimates over China. Accuracy is represented by nMABD (the normalized versions of Mean Absolute Bias Deviation, %), while trend consistency is indicated by absolute trend bias (% decade–1). Subfigure (a) presents the temporal comparison across the entire year during cold (October to next March) and warm (April to September) seasons. Subfigure (b) shows the spatial comparison across four regions: northwest (NW), north China (NC), southwest (SW), and south China (SC). The overall performance of each gridded product is proportional to the area of its corresponding polygon.
Remotesensing 17 01317 g008
Table 1. Comparison of hourly surface solar radiation (SSR) gridded products used for validation.
ProductsSpatial
Resolution
Time RangeSpatial
Coverage
Reference
REANALYSISERA50.25° × 0.25°1940–presentGlobalhttps://cds.climate.copernicus.eu/
accessed on 16 June 2023
MERRA-20.5° × 0.625°1980–presentGlobalhttps://disc.gsfc.nasa.gov/
accessed on 16 June 2023
SATELLITE-DERIVEDSARAH-E0.05° × 0.05°1999–201665°S–65°N,
8°W–128°E
https://wui.cmsaf.eu/
accessed on 19 June 2023
CERES-SYN1deg1° × 1°2003–presentGlobalhttps://ceres.larc.nasa.gov/
accessed on 12 June 2023
Solcast2 km × 2 km2007–presentGlobalhttps://solcast.com/
accessed on 7 July 2023
Disclaimer/Publisher’s Note: The statements, opinions and data contained in all publications are solely those of the individual author(s) and contributor(s) and not of MDPI and/or the editor(s). MDPI and/or the editor(s) disclaim responsibility for any injury to people or property resulting from any ideas, methods, instructions or products referred to in the content.

