An Estimation Model of Emissions from Burning Areas Based on the Tier Method
Abstract
1. Introduction
1.1. Air Quality Standards for Suspended Particulate Matter
1.2. Estimatimating the PM10 and PM2.5 Pollution from the Ground
1.3. Estimatimating the TSP, PM10 and PM2.5 Pollution from Remote Sensors
1.4. Emission Estimation Models
2. Materials and Methods
2.1. Scanning Satellite Image
2.2. Picture Bit-Depth Conversion
2.3. Emission Estimation Methods
2.3.1. Tier 1 Method
- Epollutant—emission (E) of pollutants, kg/year;
- ARresidue_burnt—mass of burnt residues (dry matter), kg/year;
- EFpollutant—emission factor, kg/kg s.m.
- A—burned area, ha/year;
- Mb—mass of burnt residues (tones/ha);
- Cf—combustion coefficient.
2.3.2. Tier 2 Method
2.3.3. Tier 3 Method
3. Results
3.1. Research Areas of Satellite Images
- Frequent Revisit Times: Both systems allow for tracking fire dynamics in near-real time, which is crucial for determining residue combustion patterns over time.
- High Spatial Resolution: Burned areas can be accurately mapped using MODIS’ 1 km resolution and VIIRS’ 375 m resolution.
- Advanced Spectral Capabilities: These features help discriminate between fires and other heat sources, minimizing false detections and ensuring reliable data.
3.2. Emission Estimation by Tier 1 Method
3.3. Emission Estimation by Tier 2 Method
3.3.1. Screen Estimation for Wheat Residue Burnouts in India
3.3.2. Screen Estimation for Barley Residue Burnouts in India
3.3.3. Screen Estimation for Maze Residue Burnouts in Arkansas (USA)
3.3.4. Screen Estimation for Rice Residue Burnouts in China
4. Discussion
5. Conclusions
Author Contributions
Funding
Data Availability Statement
Conflicts of Interest
References
- Roman, M.; Roman, K.; Roman, M. Spatial Variation in Particulate Emission Resulting from Animal Farming in Poland. Agriculture 2021, 11, 168. [Google Scholar] [CrossRef]
- Gokul, T.; Kumar, K.R.; Veeramanikandan, V.; Arun, A.; Balaji, P.; Faggio, C. Impact of Particulate Pollution on Aquatic Invertebrates. Environ. Toxicol. Pharmacol. 2023, 100, 104146. [Google Scholar] [CrossRef]
- Harrison, R.M.; Jones, A.M.; Lawrence, R.G. Major Component Composition of PM10 and PM2.5 from Roadside and Urban Background Sites. Atmos. Environ. 2004, 38, 4531–4538. [Google Scholar] [CrossRef]
- I DIRECTIVE 2008/50/EC OF THE EUROPEAN PARLIAMENT AND OF THE COUNCIL of 21 May 2008 on Ambient Air Quality and Cleaner Air for Europe. Off. J. Eur. Union 2008, 152, 1–44.
- Roman, K.K.; Borek, K.; Mazur, K.; Wardal, W.J. The Measurements of PM25 Dust Concentration by Using an Integrated Optical Sensor. Prz. Elektrotech. 2020, 96, 129–132. [Google Scholar] [CrossRef]
- Abdurrahman, M.I.; Chaki, S.; Saini, G. Stubble Burning: Effects on Health & Environment, Regulations and Management Practices. Environ. Adv. 2020, 2, 100011. [Google Scholar]
- Thrall, A.D.; Burton, C.S. The Probability of NAAQS Nonattainment When Exceedance Outcomes Constitute a Two-State Markov Process. Atmos. Environ. 1987, 21, 2695–2702. [Google Scholar] [CrossRef]
- Jain, N.; Bhatia, A.; Pathak, H. Emission of Air Pollutants from Crop Residue Burning in India. Aerosol Air Qual. Res. 2014, 14, 422–430. [Google Scholar] [CrossRef]
- Kim, M.; Yeon, J.W. ICP-OES and NAA Analysis of Aerosols Generated from Molten Iron–Concrete Reactions in the Presence of Simulated Fission Products. Nucl. Eng. Technol. 2024, 57, 103316. [Google Scholar] [CrossRef]
- Howard, M.H.; Sayes, C.M.; Giesy, J.P.; Li, Y. Valley Fever under a Changing Climate in the United States. Environ. Int. 2024, 193, 109066. [Google Scholar] [CrossRef]
- Pizzorni, M.; Innocenti, A.; Tollin, N. Droughts and Floods in a Changing Climate and Implications for Multi-Hazard Urban Planning: A Review. City Environ. Interact. 2024, 24, 100169. [Google Scholar] [CrossRef]
- Chuvieco, E.; Pettinari, M.L.; Koutsias, N.; Forkel, M.; Hantson, S.; Turco, M. Human and Climate Drivers of Global Biomass Burning Variability. Sci. Total Environ. 2021, 779, 146361. [Google Scholar] [CrossRef]
- Vijayakumar, K.; Devara, P.C.S.; Yadav, S. Investigations on Stubble-Burning Aerosols over a Rural Location Using Ground-Based, Model, and Spaceborne Data. Atmosphere 2024, 15, 1383. [Google Scholar] [CrossRef]
- Dróżdż, D.; Wystalska, K.; Malińska, K.; Grosser, A.; Grobelak, A.; Kacprzak, M. Management of Poultry Manure in Poland—Current State and Future Perspectives. J. Environ. Manag. 2020, 264, 110327. [Google Scholar] [CrossRef]
- Wang, J.; Hu, Z.; Chen, Y.; Chen, Z.; Xu, S. Contamination Characteristics and Possible Sources of PM10 and PM2.5 in Different Functional Areas of Shanghai, China. Atmos. Environ. 2013, 68, 221–229. [Google Scholar] [CrossRef]
- Koza, M.; Funk, R.; Pöhlitz, J.; Conrad, C.; Shibistova, O.; Meinel, T.; Akshalov, K.; Schmidt, G. Wind Erosion after Steppe Conversion in Kazakhstan. Soil. Tillage Res. 2024, 236, 105941. [Google Scholar] [CrossRef]
- Shannak, B.; Corsmeier, U.; Kottmeier, C.; Al-azab, T. Wind Tunnel Study of Twelve Dust Samples by Large Particle Size. Atmos. Environ. 2014, 98, 442–453. [Google Scholar] [CrossRef]
- Das, P.; Behera, M.D.; Abhilash, P.C. A Rapid Assessment of Stubble Burning and Air Pollutants from Satellite Observations. Trop. Ecol. 2024, 65, 152–157. [Google Scholar] [CrossRef]
- Zare Khormizi, H.; Jafari, M.; Ghafarian Malamiri, H.; Tavili, A.; Keshtkar, H. Generating MODIS Hourly Land Surface Temperature under Clear Sky Conditions Using Fourier Series Analysis. Int. J. Appl. Earth Obs. Geoinf. 2025, 136, 104341. [Google Scholar] [CrossRef]
- Zhang, Z.; Zhang, S.; Behrenfeld, M.J.; Jamet, C.; Di Girolamo, P.; Dionisi, D.; Hu, Y.; Lu, X.; Pan, Y.; Luo, M.; et al. Consistency Analysis of Water Diffuse Attenuation between ICESat-2 and MODIS in Marginal Sea: A Case Study in China Sea. Remote Sens. Environ. 2025, 318, 114602. [Google Scholar] [CrossRef]
- Justice, C.O.; Giglio, L.; Korontzi, S.; Owens, J.; Morisette, J.T.; Roy, D.; Descloitres, J.; Alleaume, S.; Petitcolin, F.; Kaufman, Y. The MODIS Fire Products. Remote Sens. Environ. 2002, 83, 244–262. [Google Scholar] [CrossRef]
- Hill, M.J.; Senarath, U.; Lee, A.; Zeppel, M.; Nightingale, J.M.; Williams, R.J.; McVicar, T.R. Assessment of the MODIS LAI Product for Australian Ecosystems. Remote Sens. Environ. 2006, 101, 495–518. [Google Scholar] [CrossRef]
- He, H. Nexus of Natural Resources Exploitation, Social Protection, and Sustainable Environment: COP27 Is a Sufficient Solution? Resour. Policy 2024, 96, 105190. [Google Scholar] [CrossRef]
- Giannakidou, S.; Radoglou-Grammatikis, P.; Lagkas, T.; Argyriou, V.; Goudos, S.; Markakis, E.K.; Sarigiannidis, P. Leveraging the Power of Internet of Things and Artificial Intelligence in Forest Fire Prevention, Detection, and Restoration: A Comprehensive Survey. Internet Things 2024, 26, 101171. [Google Scholar] [CrossRef]
- Zhao, Y.; Ban, Y. Near Real-Time Wildfire Progression Mapping with VIIRS Time-Series and Autoregressive SwinUNETR. Int. J. Appl. Earth Obs. Geoinf. 2025, 136, 104358. [Google Scholar] [CrossRef]
- Singh, T.; Biswal, A.; Mor, S.; Ravindra, K.; Singh, V.; Mor, S. A High-Resolution Emission Inventory of Air Pollutants from Primary Crop Residue Burning over Northern India Based on VIIRS Thermal Anomalies. Environ. Pollut. 2020, 266, 115132. [Google Scholar] [CrossRef] [PubMed]
- Mor, S.; Ravindra, K. Municipal Solid Waste Landfills in Lower- and Middle-Income Countries: Environmental Impacts, Challenges and Sustainable Management Practices. Process Saf. Environ. Prot. 2023, 174, 510–530. [Google Scholar] [CrossRef]
- Jordan, N.S.; Ichoku, C.; Hoff, R.M. Estimating Smoke Emissions over the US Southern Great Plains Using MODIS Fire Radiative Power and Aerosol Observations. Atmos. Environ. 2008, 42, 2007–2022. [Google Scholar] [CrossRef]
- van der Werf, G.R.; Randerson, J.T.; Giglio, L.; van Leeuwen, T.T.; Chen, Y.; Rogers, B.M.; Mu, M.; van Marle, M.J.E.; Morton, D.C.; Collatz, G.J.; et al. Global Fire Emissions Estimates during 1997–2016. Earth Syst. Sci. Data 2017, 9, 697–720. [Google Scholar] [CrossRef]
- Ito, A.; Penner, J.E. Global Estimates of Biomass Burning Emissions Based on Satellite Imagery for the Year 2000. J. Geophys. Res. D: Atmos. 2004, 109, 4423. [Google Scholar] [CrossRef]
- Konovalov, I.B.; Berezin, E.V.; Ciais, P.; Broquet, G.; Beekmann, M.; Hadji-Lazaro, J.; Clerbaux, C.; Andreae, M.O.; Kaiser, J.W.; Schulze, E.-D. Constraining CO2 Emissions from Open Biomass Burning by Satellite Observations of Co-Emitted Species: A Method and Its Application to Wildfires in Siberia. Atmos. Chem. Phys. 2014, 14, 10383–10410. [Google Scholar] [CrossRef]
- Li, J.; Bo, Y.; Xie, S. Estimating Emissions from Crop Residue Open Burning in China Based on Statistics and MODIS Fire Products. J. Environ. Sci. 2016, 44, 158–170. [Google Scholar] [CrossRef] [PubMed]
- Obi-Njoku, O.; Boh, M.Y.; Smith, W.; Grant, B.; Flemming, C.; Price, G.W.; Hernandez-Ramirez, G.; Burton, D.; Whalen, J.K.; Clark, O.G. A Comparison of Tier 1, 2, and 3 Methods for Quantifying Nitrous Oxide Emissions from Soils Amended with Biosolids. Sci. Total Environ. 2024, 915, 169639. [Google Scholar] [CrossRef]
- Paredes, M.G.; Güereca, L.P.; Molina, L.T.; Noyola, A. Methane Emissions from Anaerobic Sludge Digesters in Mexico: On-Site Determination vs. IPCC Tier 1 Method. Sci. Total Environ. 2019, 656, 468–474. [Google Scholar] [CrossRef]
- Lu, F.; Er, G.; Dai, Q.; Xiao, H. Bit-Depth Scalable Coding Using a Perfect Picture and Adaptive Neighboring Filter. Tsinghua Sci. Technol. 2009, 14, 570–574. [Google Scholar] [CrossRef]
- Hirayama, K.; Takayama, K.; Haruta, S.; Ishibashi, H.; Takeuchi, I. Effect of Low Concentrations of Irgarol 1051 on RGB (R, Red; G, Green; B, Blue) Colour Values of the Hard-Coral Acropora Tenuis. Mar. Pollut. Bull. 2017, 124, 678–686. [Google Scholar] [CrossRef]
- Gottipati, R.; Pavan, B.R.N.; Menon, S. Stubble Burning: Root Cause, Impacts and Its Management in Indian Scenario. Environ. Conserv. J. 2021, 22, 37–45. [Google Scholar] [CrossRef]
- Eggleston, H.S. 2006 IPCC Guidelines for National Greenhouse Gas Inventories; Institute for Global Environmental Strategies: Yamaguchi, Japan, 2006; ISBN 4887880324. [Google Scholar]
- CARB. Atmospheric Pollutant Emission Factors from Open Burning of Agricultural-and Forest Biomass by Wind Tunnel Simulations; CARB: Sacramento, CA, USA, 2020; Volume 1.
- Meo, S.A.; Shaikh, N.; Alotaibi, M. Association between Air Pollutants Particulate Matter (PM2.5, PM10), Nitrogen Dioxide (NO2), Sulfur Dioxide (SO2), Volatile Organic Compounds (VOCs), Ground-Level Ozone (O3) and Hypertension. J. King Saud Univ. Sci. 2024, 36, 103531. [Google Scholar] [CrossRef]
- van der Werf, G.R.; Randerson, J.T.; Giglio, L.; Collatz, G.J.; Mu, M.; Kasibhatla, P.S.; Morton, D.C.; DeFries, R.S.; Jin, Y.; van Leeuwen, T.T. Global Fire Emissions and the Contribution of Deforestation, Savanna, Forest, Agricultural, and Peat Fires (1997–2009). Atmos. Chem. Phys. 2010, 10, 11707–11735. [Google Scholar] [CrossRef]
- Herring, S.C.; Christidis, N.; Hoell, A.; Hoerling, M.P.; Stott, P.A. Explaining Extreme Events of 2018 from a Climate Perspective. Bull. Am. Meteorol. Soc. 2020, 101, S1–S140. [Google Scholar] [CrossRef]
- Awasthi, A.; Singh, N.; Mittal, S.; Gupta, P.K.; Agarwal, R. Effects of Agriculture Crop Residue Burning on Children and Young on PFTs in North West India. Sci. Total Environ. 2010, 408, 4440–4445. [Google Scholar] [CrossRef]
- Akagi, S.K.; Yokelson, R.J.; Wiedinmyer, C.; Alvarado, M.J.; Reid, J.S.; Karl, T.; Crounse, J.D.; Wennberg, P.O. Emission Factors for Open and Domestic Biomass Burning for Use in Atmospheric Models. Atmos. Chem. Phys. 2011, 11, 4039–4072. [Google Scholar] [CrossRef]
- Webb, J.; Hutchings, N.; Amon, B. 3.F Field Burning of Agricultural Residues. In EMEP/EEA Air Pollutant Emission Inventory Guidebook 2019; EEA: Copenhagen, Denmark, 2019. [Google Scholar]
- Zhang, T.; Wooster, M.J.; Green, D.C.; Main, B. New Field-Based Agricultural Biomass Burning Trace Gas, PM2.5, and Black Carbon Emission Ratios and Factors Measured in Situ at Crop Residue Fires in Eastern China. Atmos. Environ. 2014, 121, 22–34. [Google Scholar] [CrossRef]
- Lasko, K.; Vadrevu, K. Improved Rice Residue Burning Emissions Estimates: Accounting for Practice-Specific Emission Factors in Air Pollution Assessments of Vietnam. Environ. Pollut. 2018, 236, 795–806. [Google Scholar] [CrossRef]
- Sahu, S.K.; Mangaraj, P.; Beig, G.; Samal, A.; Pradhan, C.; Dash, S.; Tyagi, B. Quantifying the High Resolution Seasonal Emission of Air Pollutants from Crop Residue Burning in India. Environ. Pollut. 2021, 286, 117165. [Google Scholar] [CrossRef]
- Smith, R.; Adams, M.; Maier, S.; Craig, R.; Kristina, A.; Maling, I. Estimating the Area of Stubble Burning from the Number of Active Fires Detected by Satellite. Remote Sens. Environ. 2007, 109, 95–106. [Google Scholar] [CrossRef]
- Li, R.; He, X.; Wang, H.; Wang, Y.; Zhang, M.; Mei, X.; Zhang, F.; Chen, L. Estimating Emissions from Crop Residue Open Burning in Central China from 2012 to 2020 Using Statistical Models Combined with Satellite Observations. Remote Sens. 2022, 14, 3682. [Google Scholar] [CrossRef]
- Sitran, A.; Delhaye, E.; Uccelli, I. Directive 2008/96/EC on Road Infrastructure Safety Management: An Ex-Post Assessment 5 Years after Its Adoption. Transp. Res. Procedia 2016, 14, 3312–3321. [Google Scholar] [CrossRef][Green Version]


| Error Source | Description | Estimated Impact on Burned Area, % | Estimated Impact on Emission Estimates, % |
|---|---|---|---|
| Bit-depth conversion | Loss of fine details affecting fire area segmentation | 4.2 | 4.8 |
| Point-to-Point Scaling | Interpolation-induced spatial distortions | 3.8 | 4.2 |
| Combined Impact | Cumulative effect of both processes | 7.5 | 8.2 |
| Method | Burned Area, ha | Error, % |
|---|---|---|
| Raw Satellite Data | 1000 | 0 |
| Bit-Depth Conversion | 950 | −5 |
| Point-to-Point Scaling | 970 | −3 |
| Final Corrected Estimate | 990 | −1 |
| Pollution | Emission Factor (EFpollutant), kg/kg s.m. | Confidence Interval (95%) | |
|---|---|---|---|
| Lower | Upper | ||
| TSP | 0.0058 | 0.0045 | 0.0071 |
| PM10 | 0.0057 | 0.0044 | 0.0071 |
| PM2.5 | 0.0054 | 0.0042 | 0.0067 |
| Type of Crop Residues | Crop Residues | Emission Factor (EFpollutant), kg/kg s.m. | Confidence Interval (95%) | |
|---|---|---|---|---|
| Lower | Upper | |||
| Wheat | TSP | 0.0058 | 0.0045 | 0.0071 |
| PM10 | 0.0057 | 0.0044 | 0.0071 | |
| PM2.5 | 0.0054 | 0.0042 | 0.0067 | |
| Barley | TSP | 0.0078 | 0.0067 | 0.0088 |
| PM10 | 0.0077 | 0.0067 | 0.0087 | |
| PM2.5 | 0.0074 | 0.0064 | 0.0085 | |
| Maize | TSP | 0.006 | 0.0048 | 0.0078 |
| PM10 | 0.0062 | 0.0047 | 0.0077 | |
| PM2.5 | 0.006 | 0.0045 | 0.0074 | |
| Rice | TSP | 0.0058 | 0.0035 | 0.0078 |
| PM10 | 0.0058 | 0.0035 | 0.0077 | |
| PM2.5 | 0.0055 | 0.0031 | 0.0074 | |
| Date | Bitmap of the Scanned Image | Percentage of Fire Coverage, % |
|---|---|---|
| 15 July 2018 | 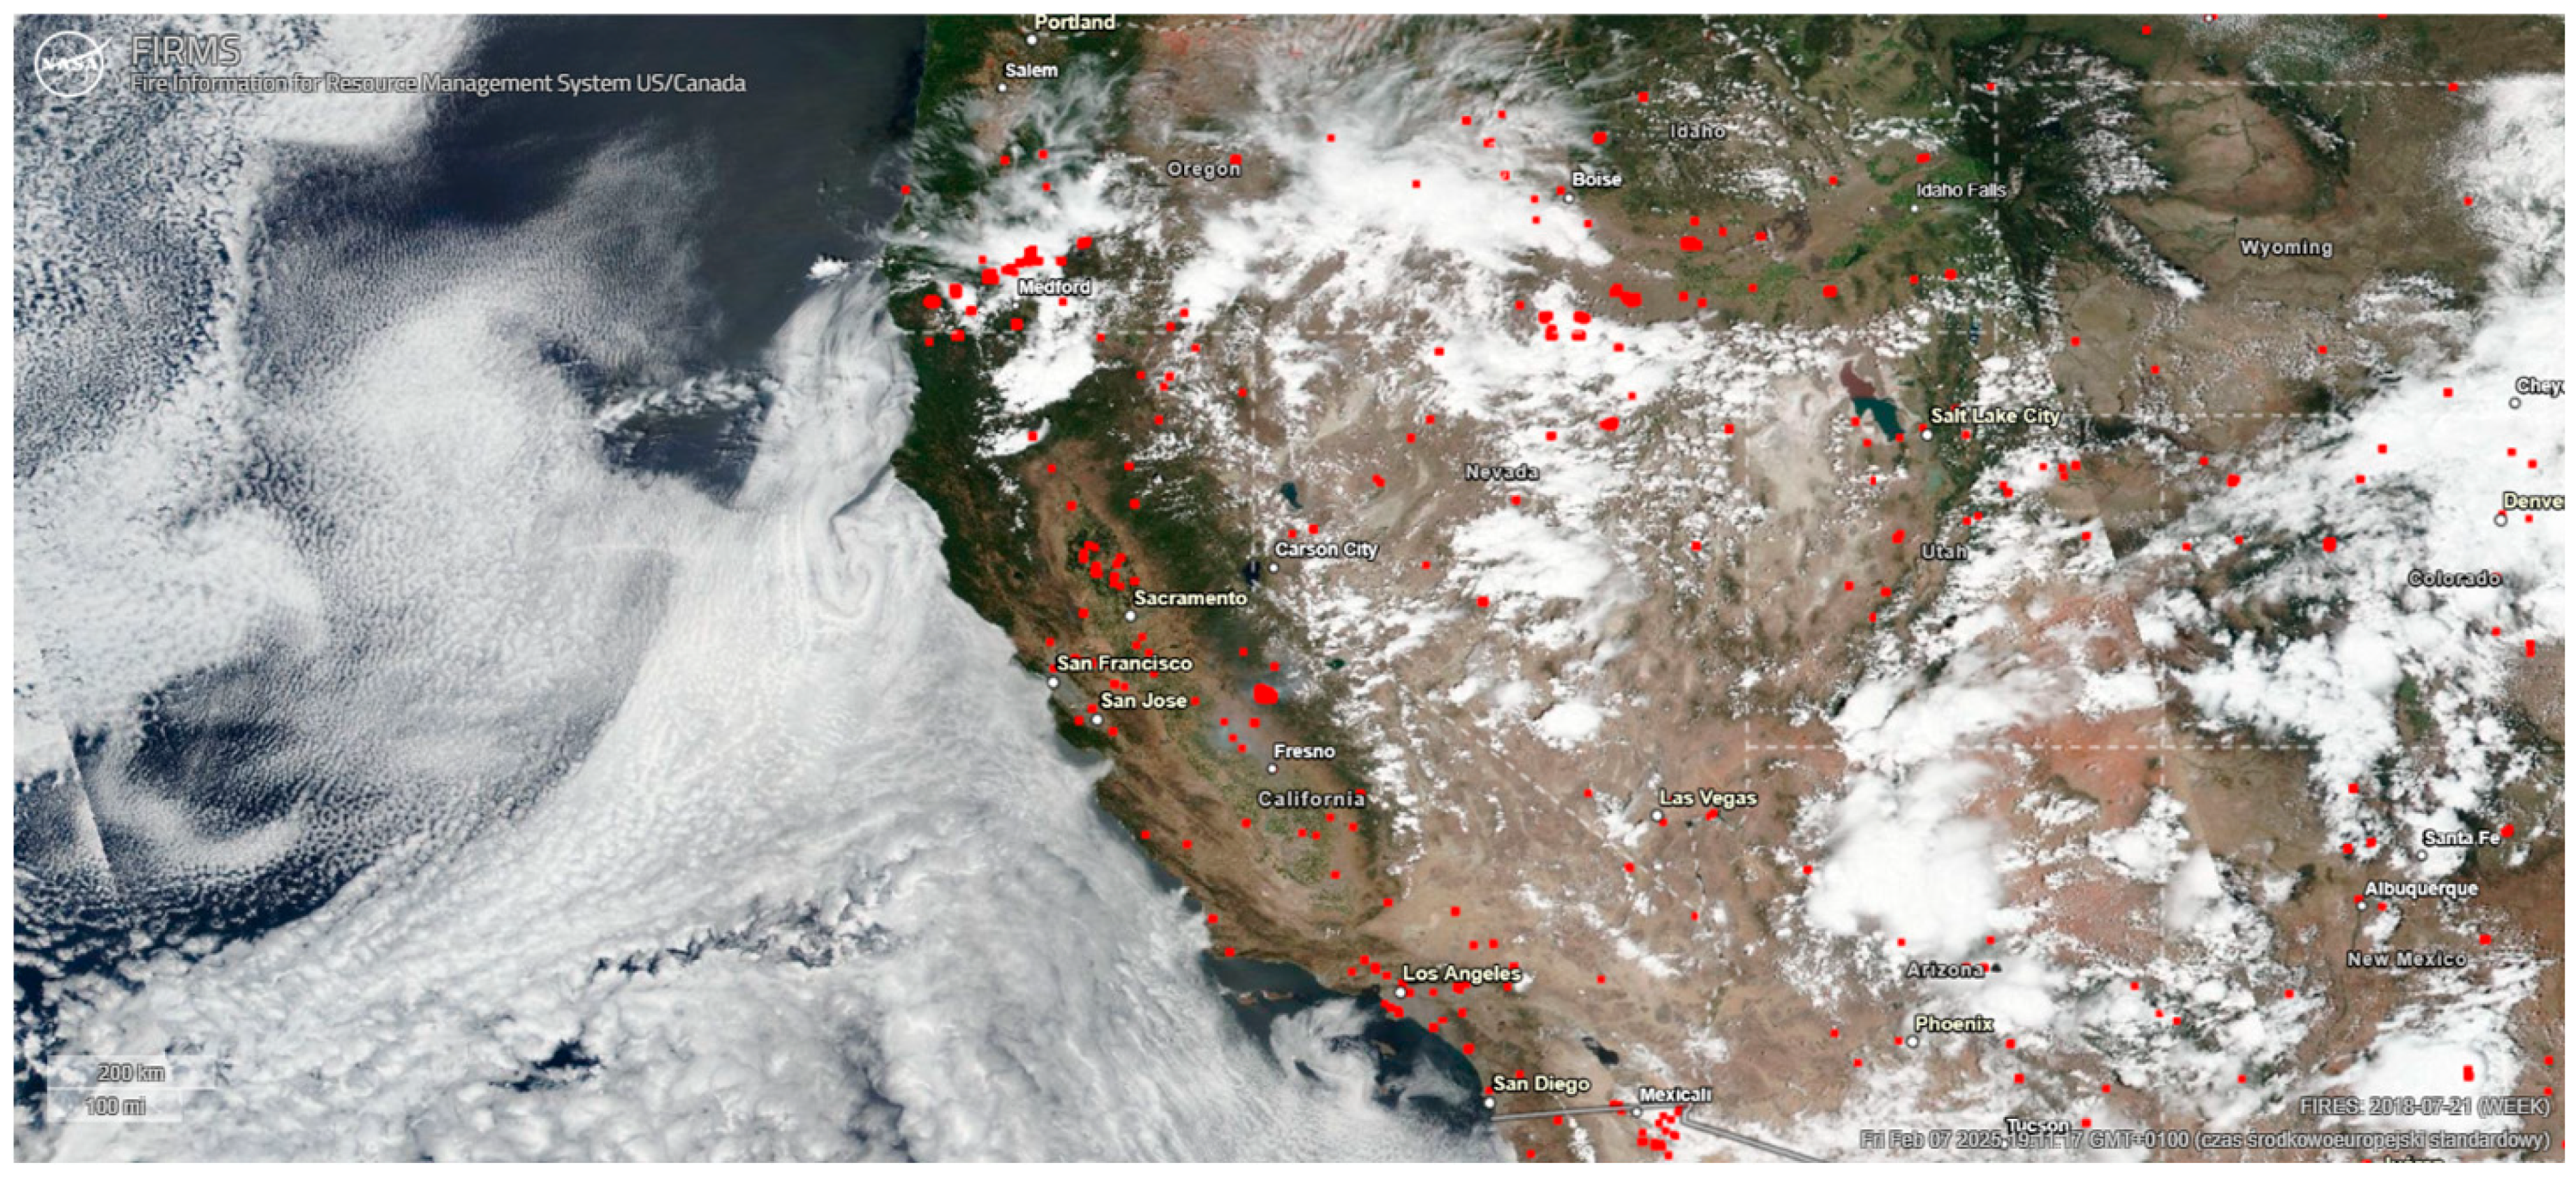 | 1416 px/0.1335% |
| 22 July 2018 | 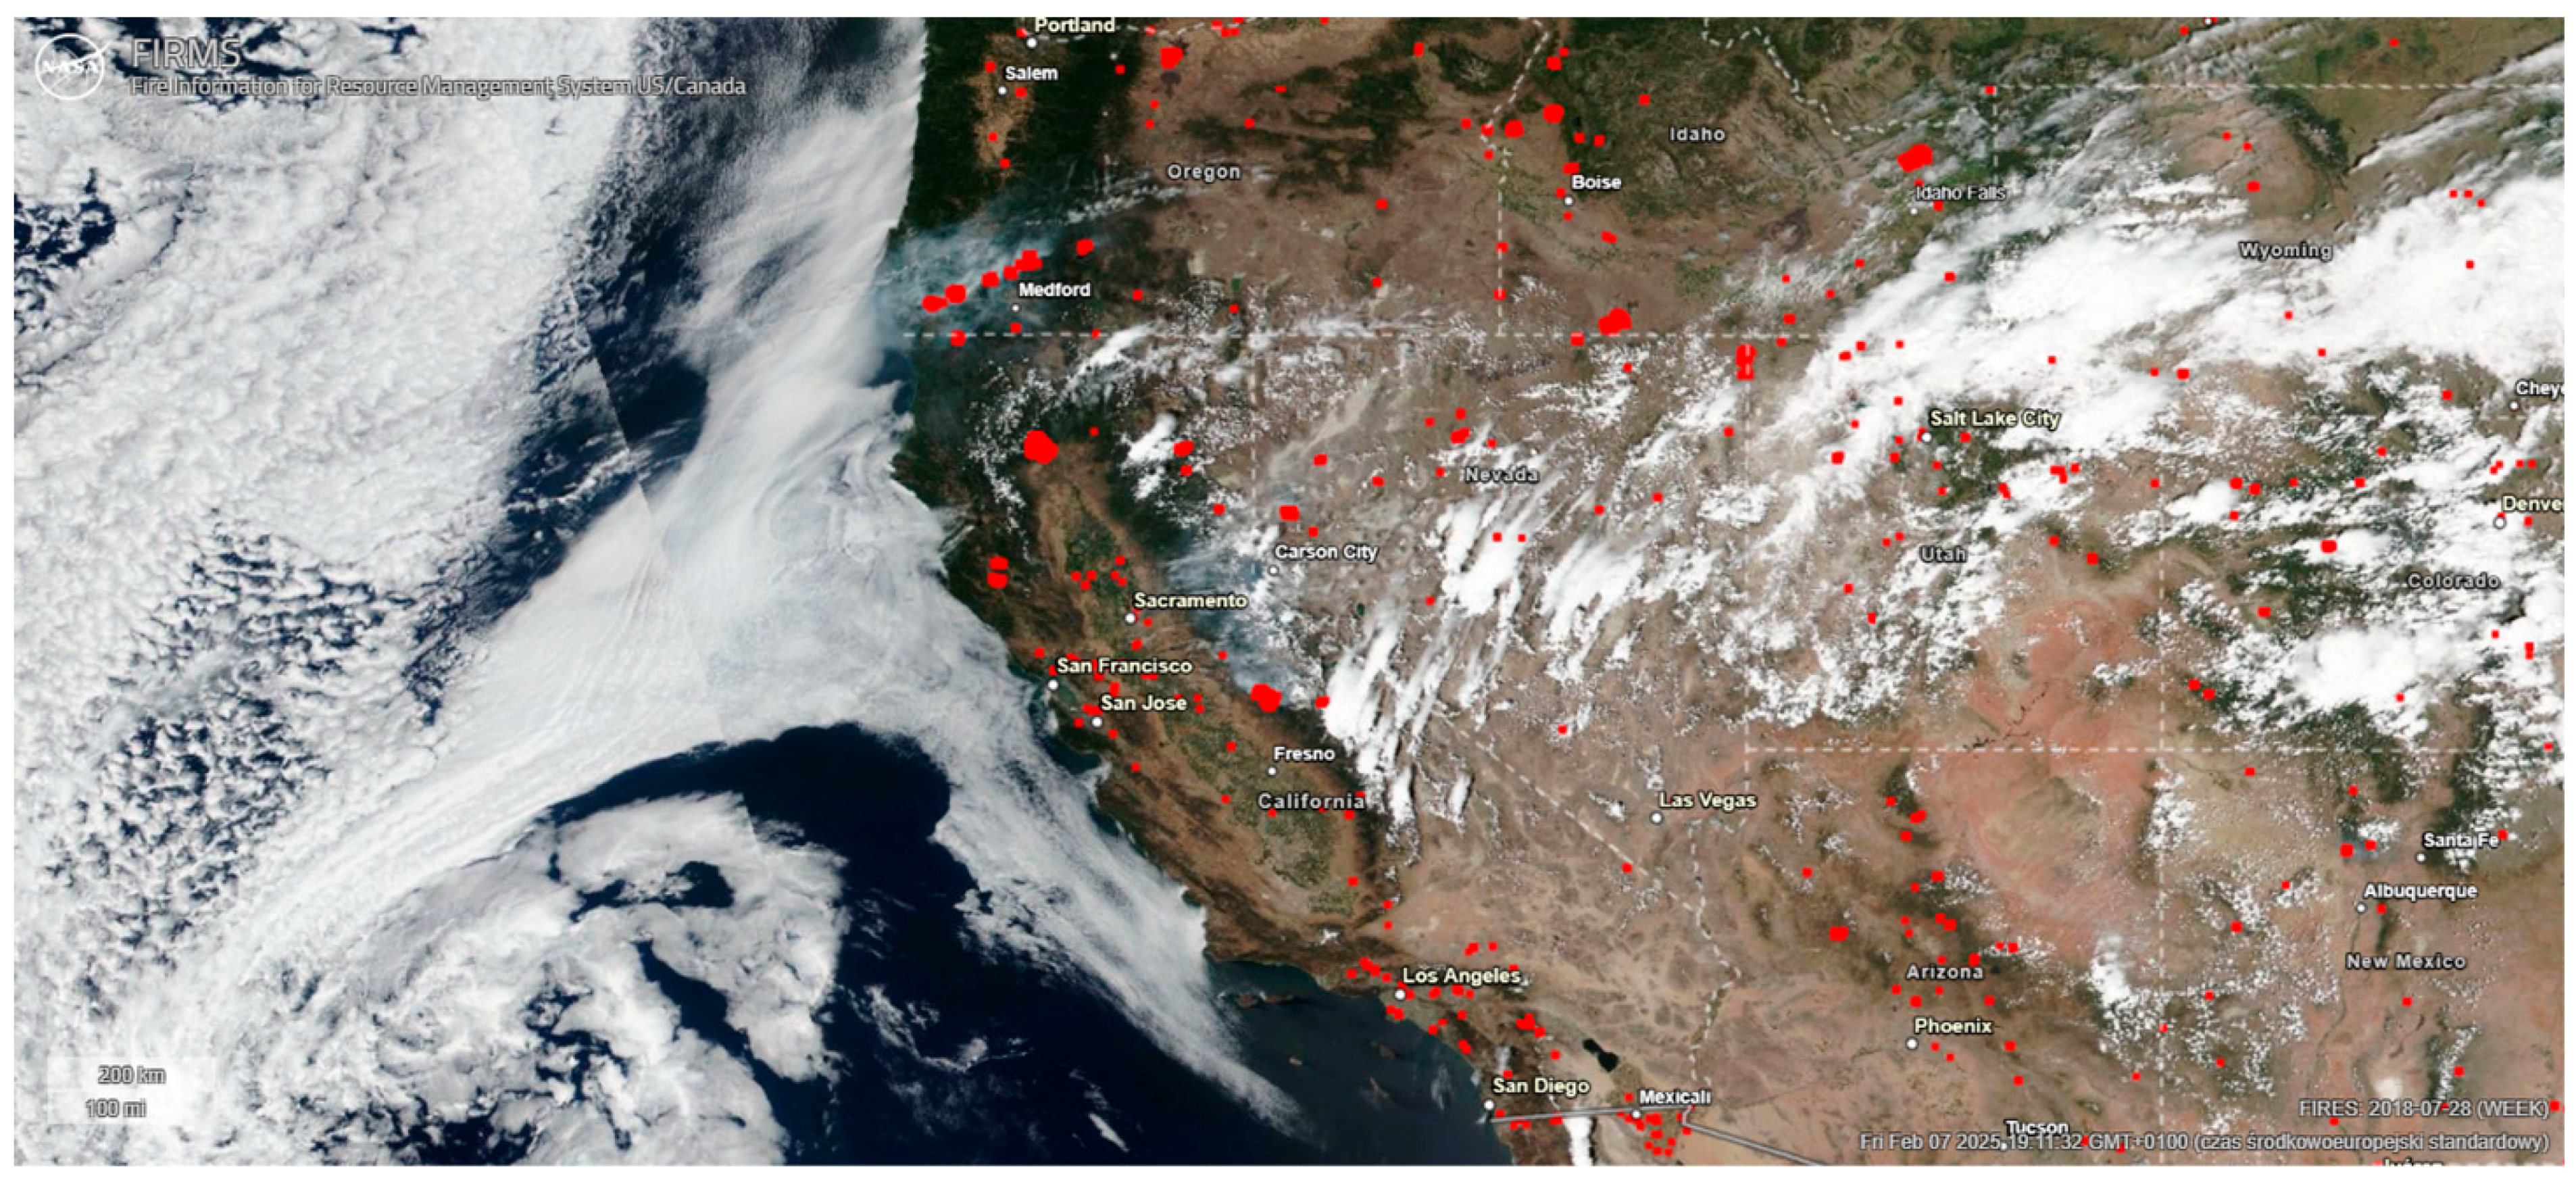 | 2595 px/0.2447% |
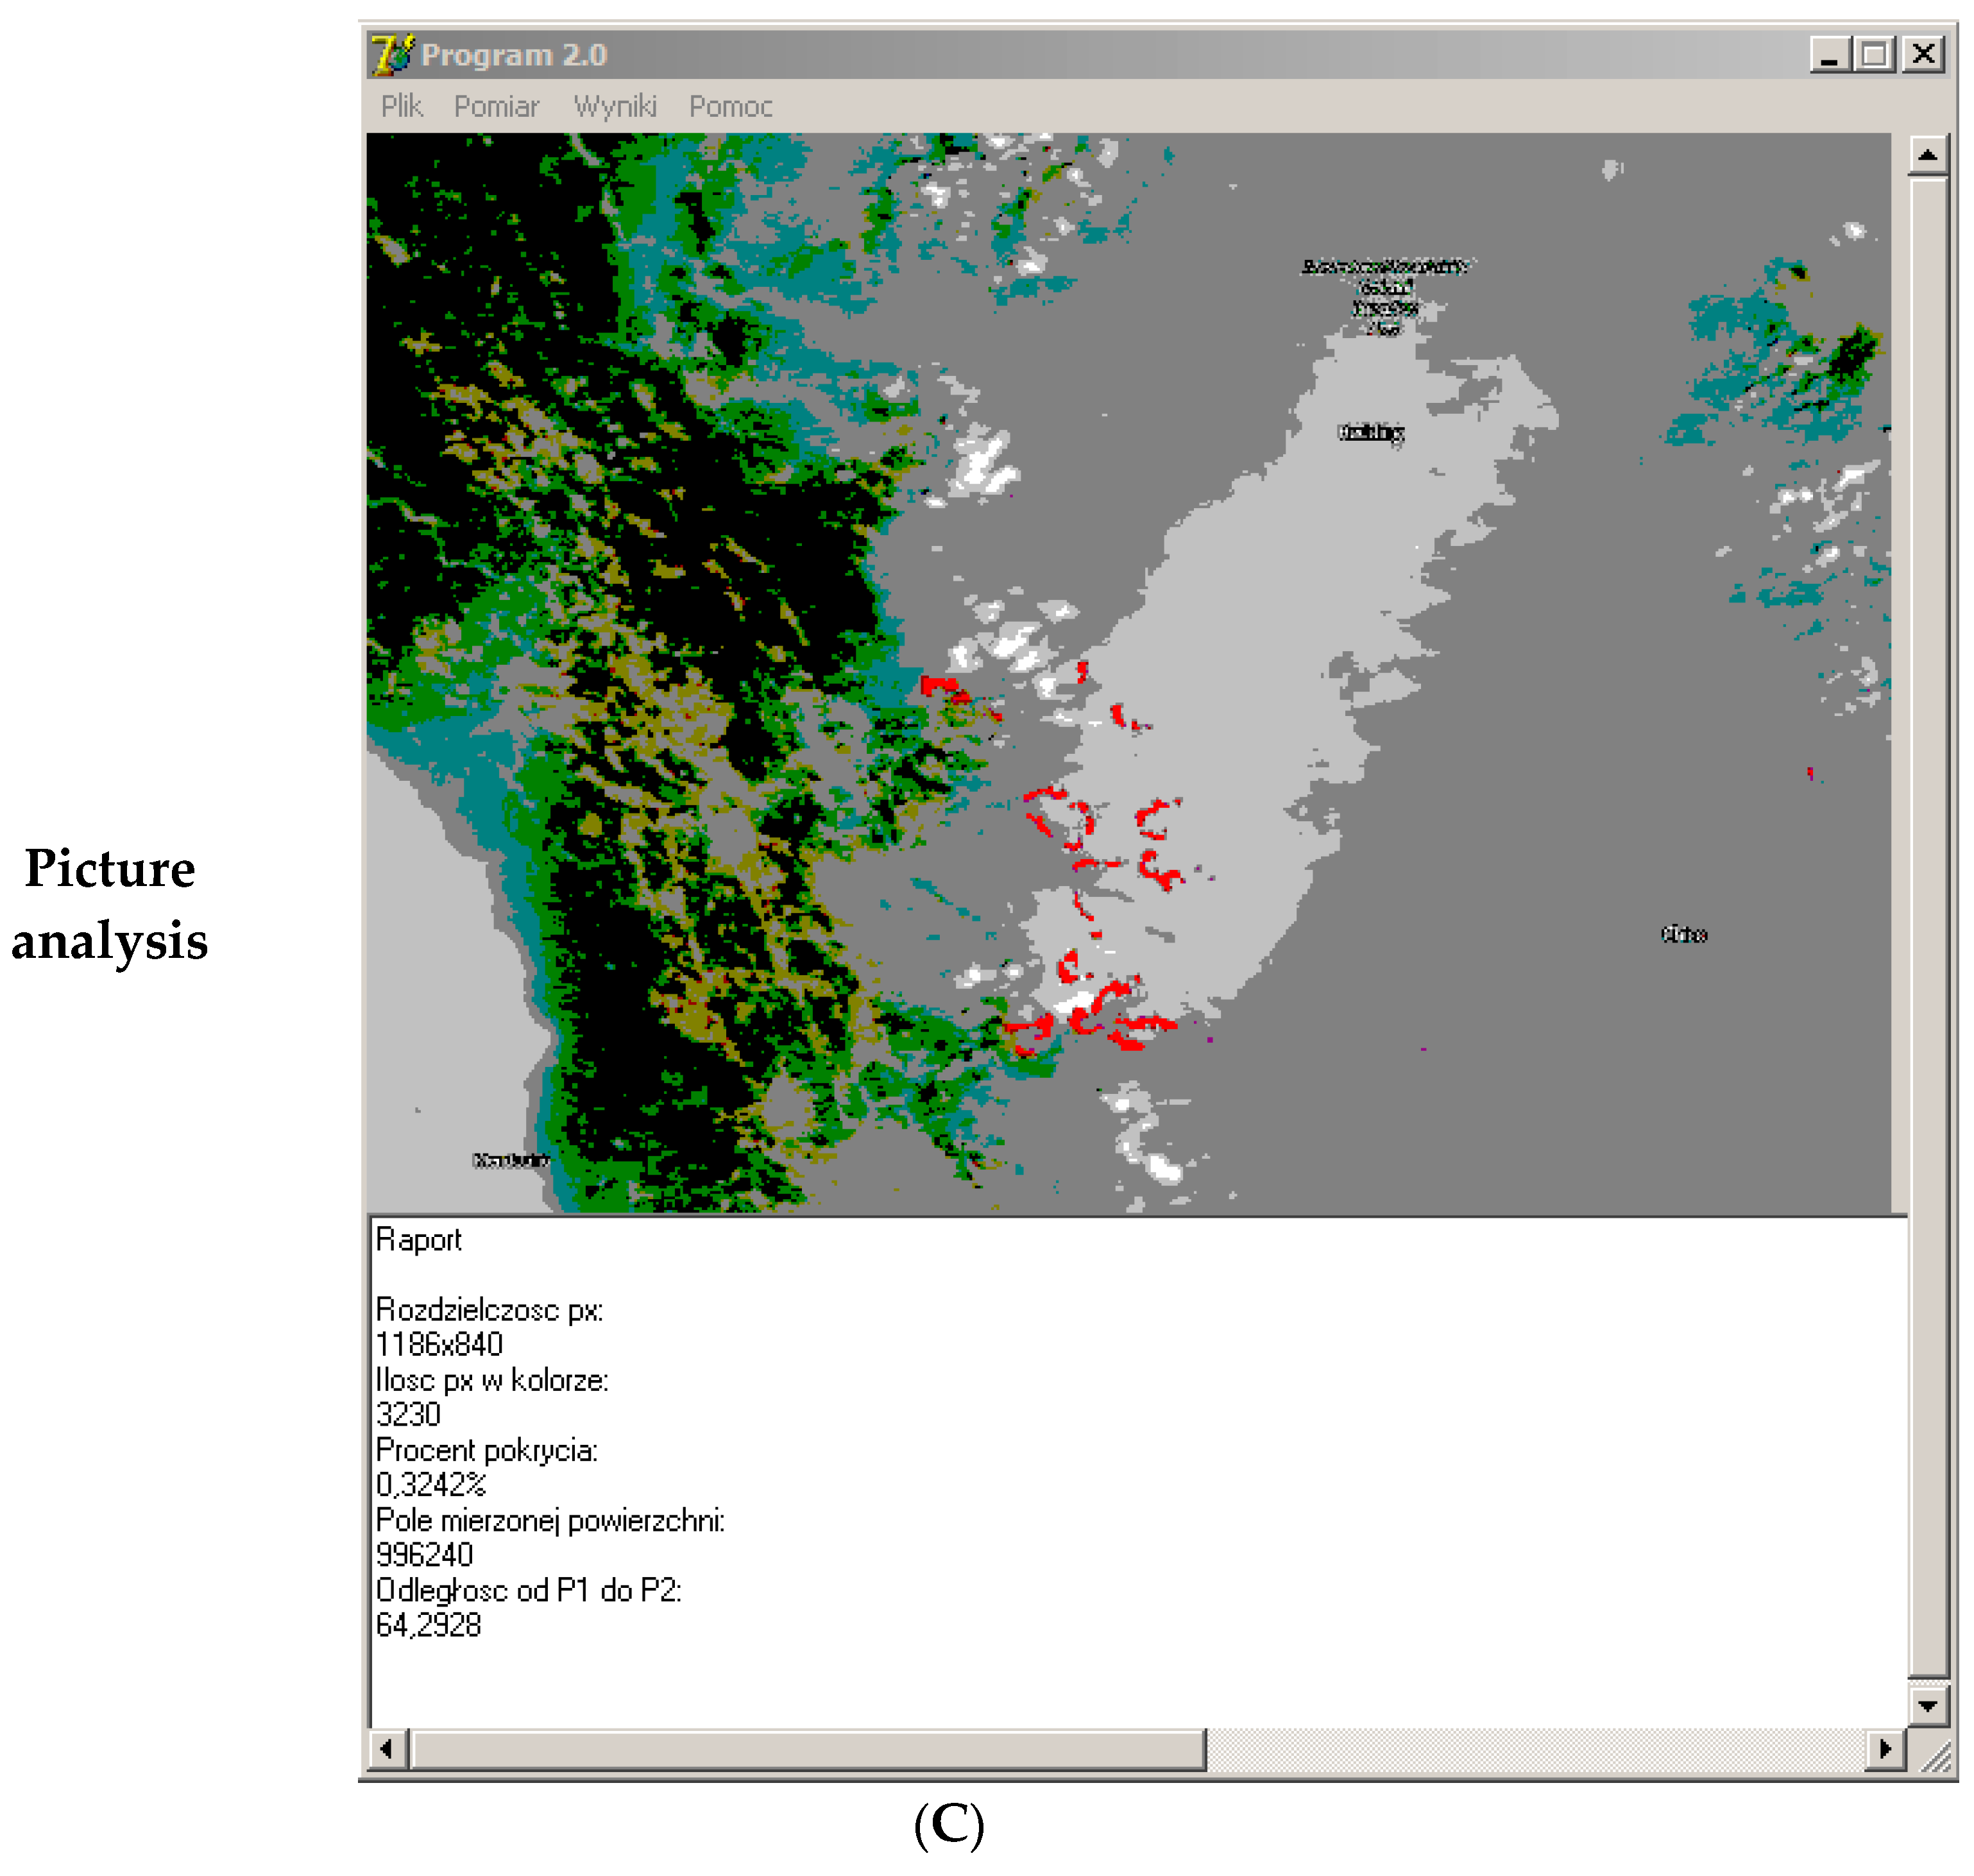
| 29 July 2018 | 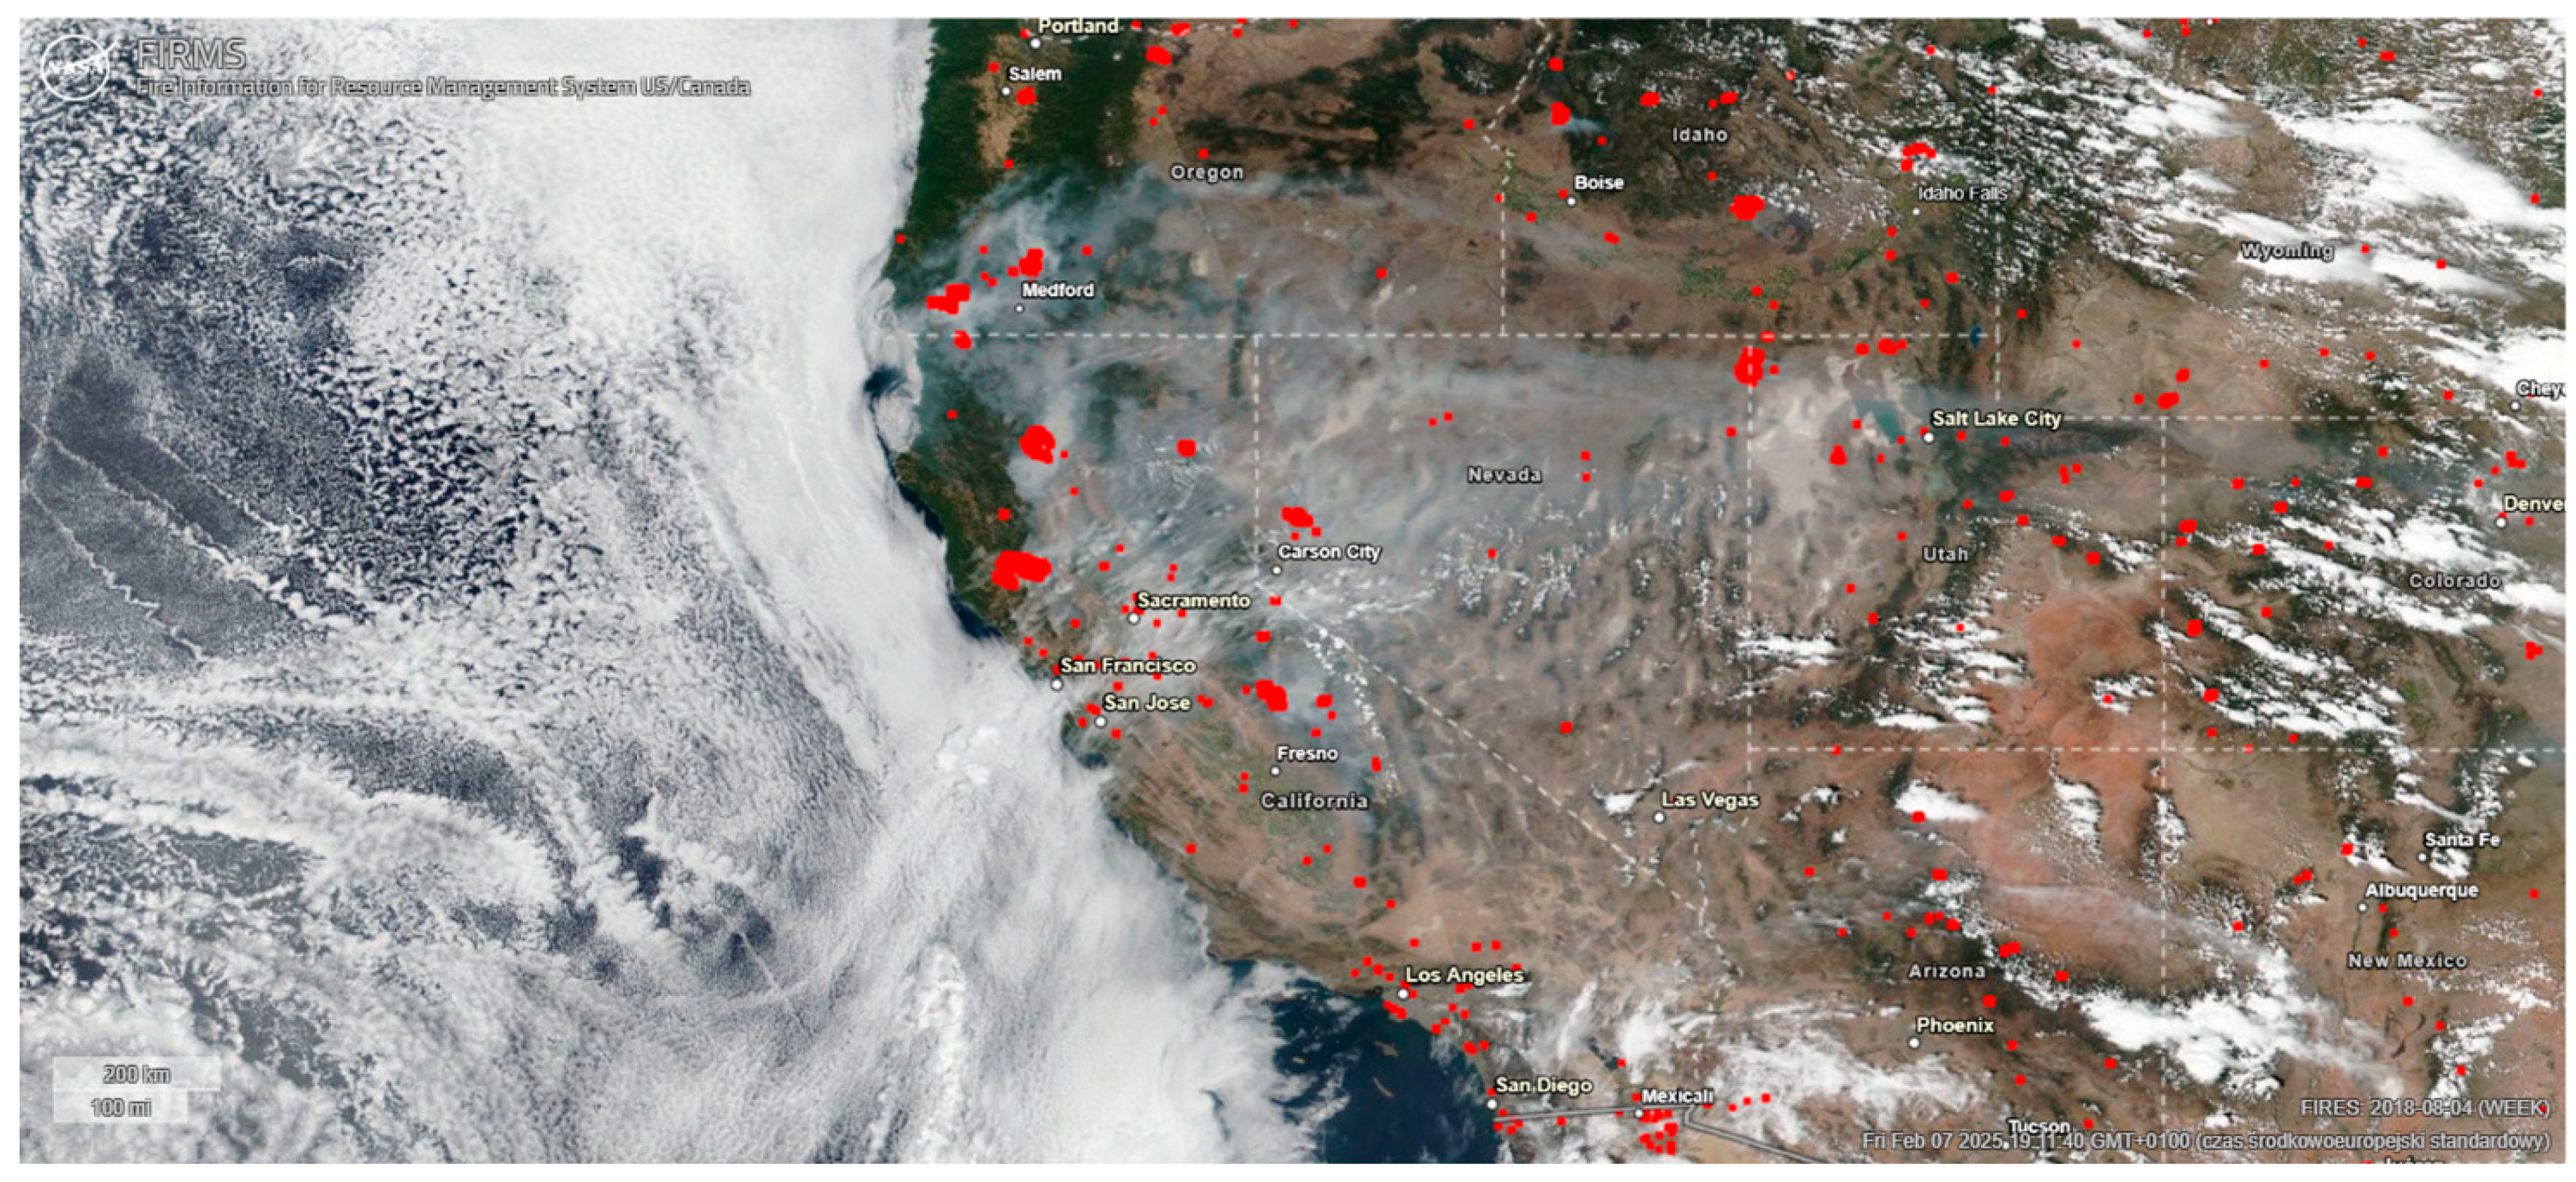 | 3249 px/0.3063% |
| 12 August 2018 |  | 2676 px/0.2523% |
| 19 August 2018 | 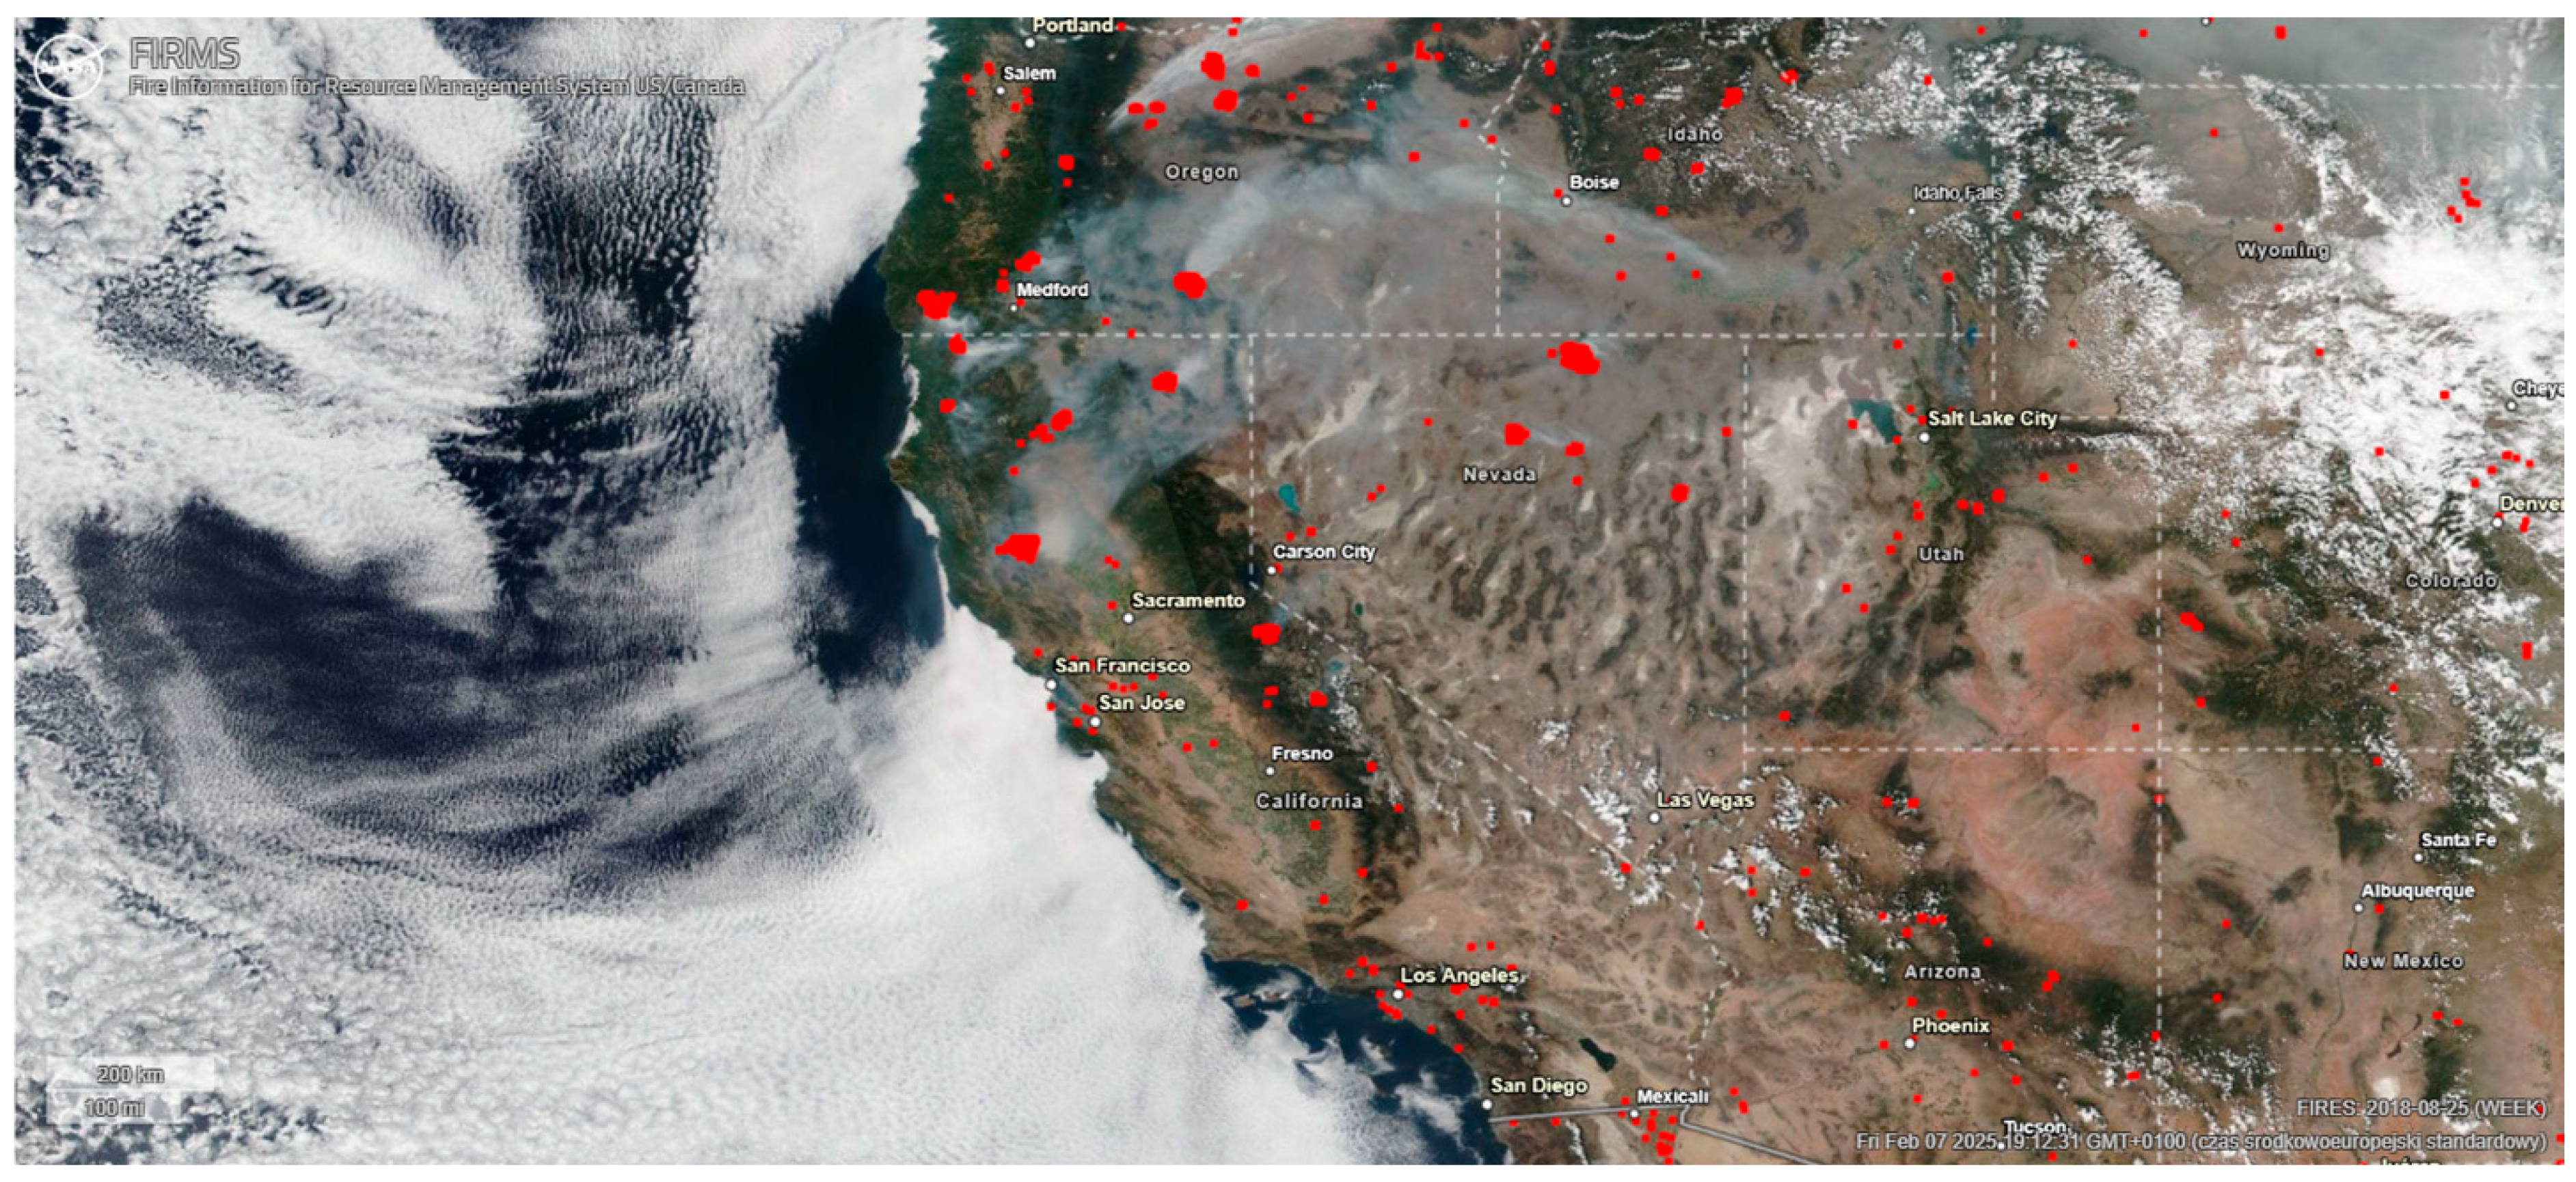 | 2720 px/0.2523% |
| 30 August 2018 | 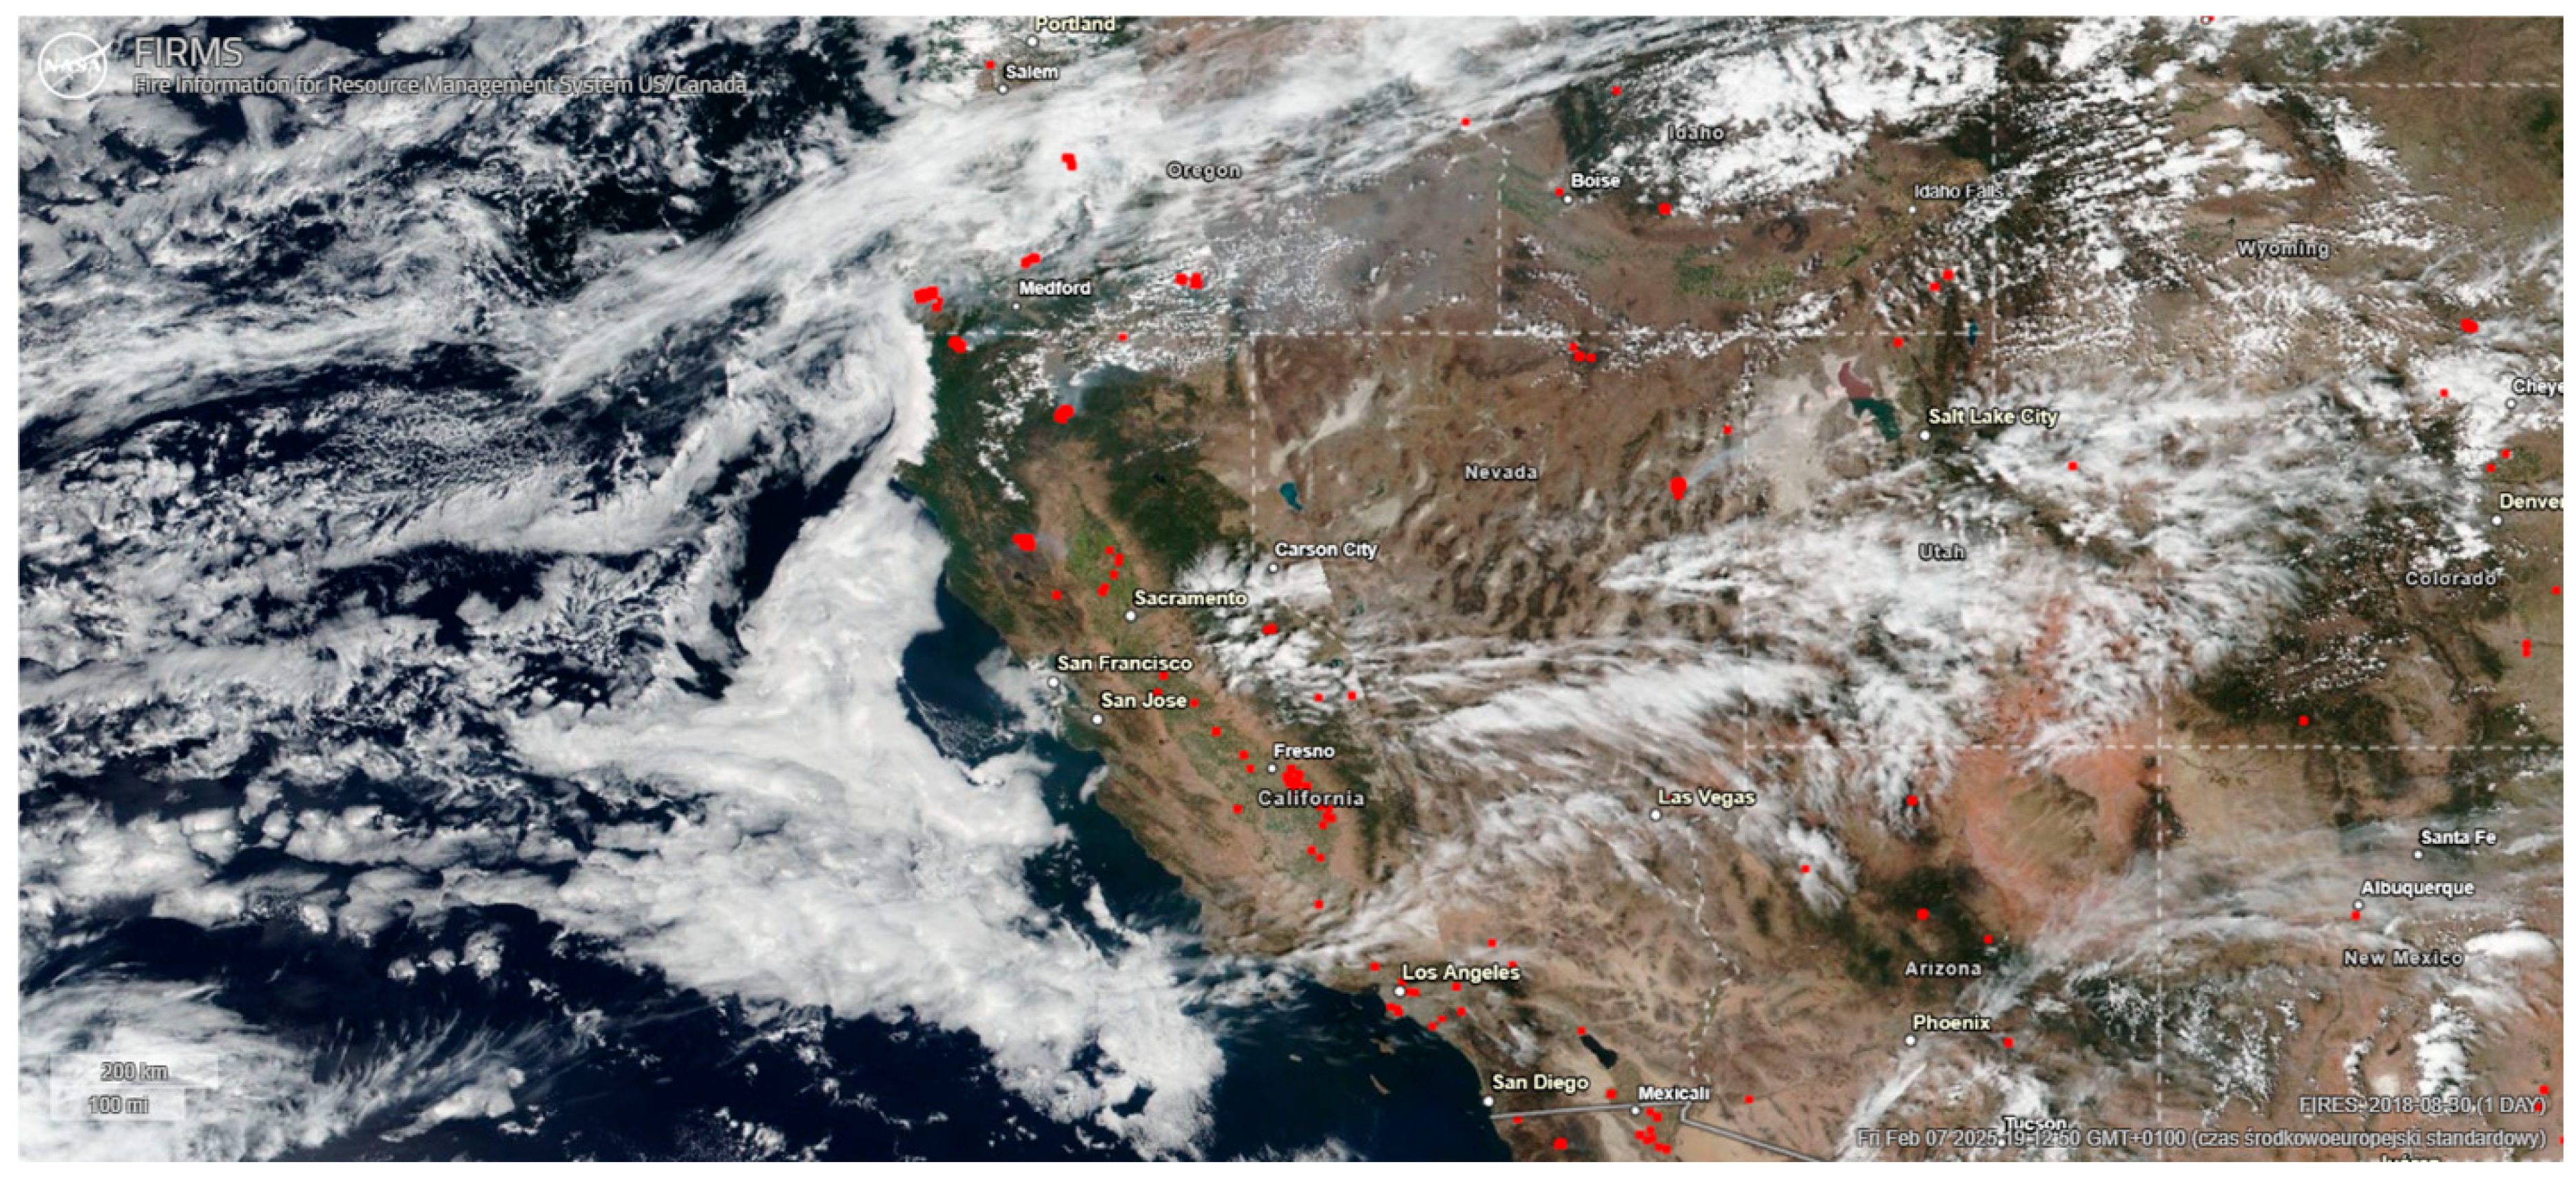 | 656 px/0.0618 |
| Date | Pollution | Burned Area (A), ha | Emission Factor (EFpollutant), kg/kg s.m. | Emission of Pollutants (Epollutant), Tones |
|---|---|---|---|---|
| 15 July 2018 | TSP | 280,396.04 | 0.0058 (0.002) | 1.626 |
| PM10 | 0.0057 (0.002) | 1.598 | ||
| PM2.5 | 0.0054 (0.002) | 1.514 | ||
| 22 July 2018 | TSP | 513,861.39 | 0.0058 (0.002) | 2.980 |
| PM10 | 0.0057 (0.002) | 2.929 | ||
| PM2.5 | 0.0054 (0.002) | 2.775 | ||
| 29 July 2018 | TSP | 643,366.34 | 0.0058 (0.002) | 3.732 |
| PM10 | 0.0057 (0.002) | 3.669 | ||
| PM2.5 | 0.0054 (0.002) | 3.474 | ||
| 12 August 2018 | TSP | 529,900.99 | 0.0058 (0.002) | 3.073 |
| PM10 | 0.0057 (0.002) | 3.020 | ||
| PM2.5 | 0.0054 (0.002) | 2.861 | ||
| 19 August 2018 | TSP | 538,613.86 | 0.0058 (0.002) | 3.124 |
| PM10 | 0.0057 (0.002) | 3.070 | ||
| PM2.5 | 0.0054 (0.002) | 2.909 | ||
| 30 August 2018 | TSP | 129,900.99 | 0.0058 (0.002) | 0.754 |
| PM10 | 0.0057 (0.002) | 0.740 | ||
| PM2.5 | 0.0054 (0.002) | 0.701 |
| Date | Bitmap of the Scanned Image | Percentage of Fire Coverage, % |
|---|---|---|
| 5 April 2021 | 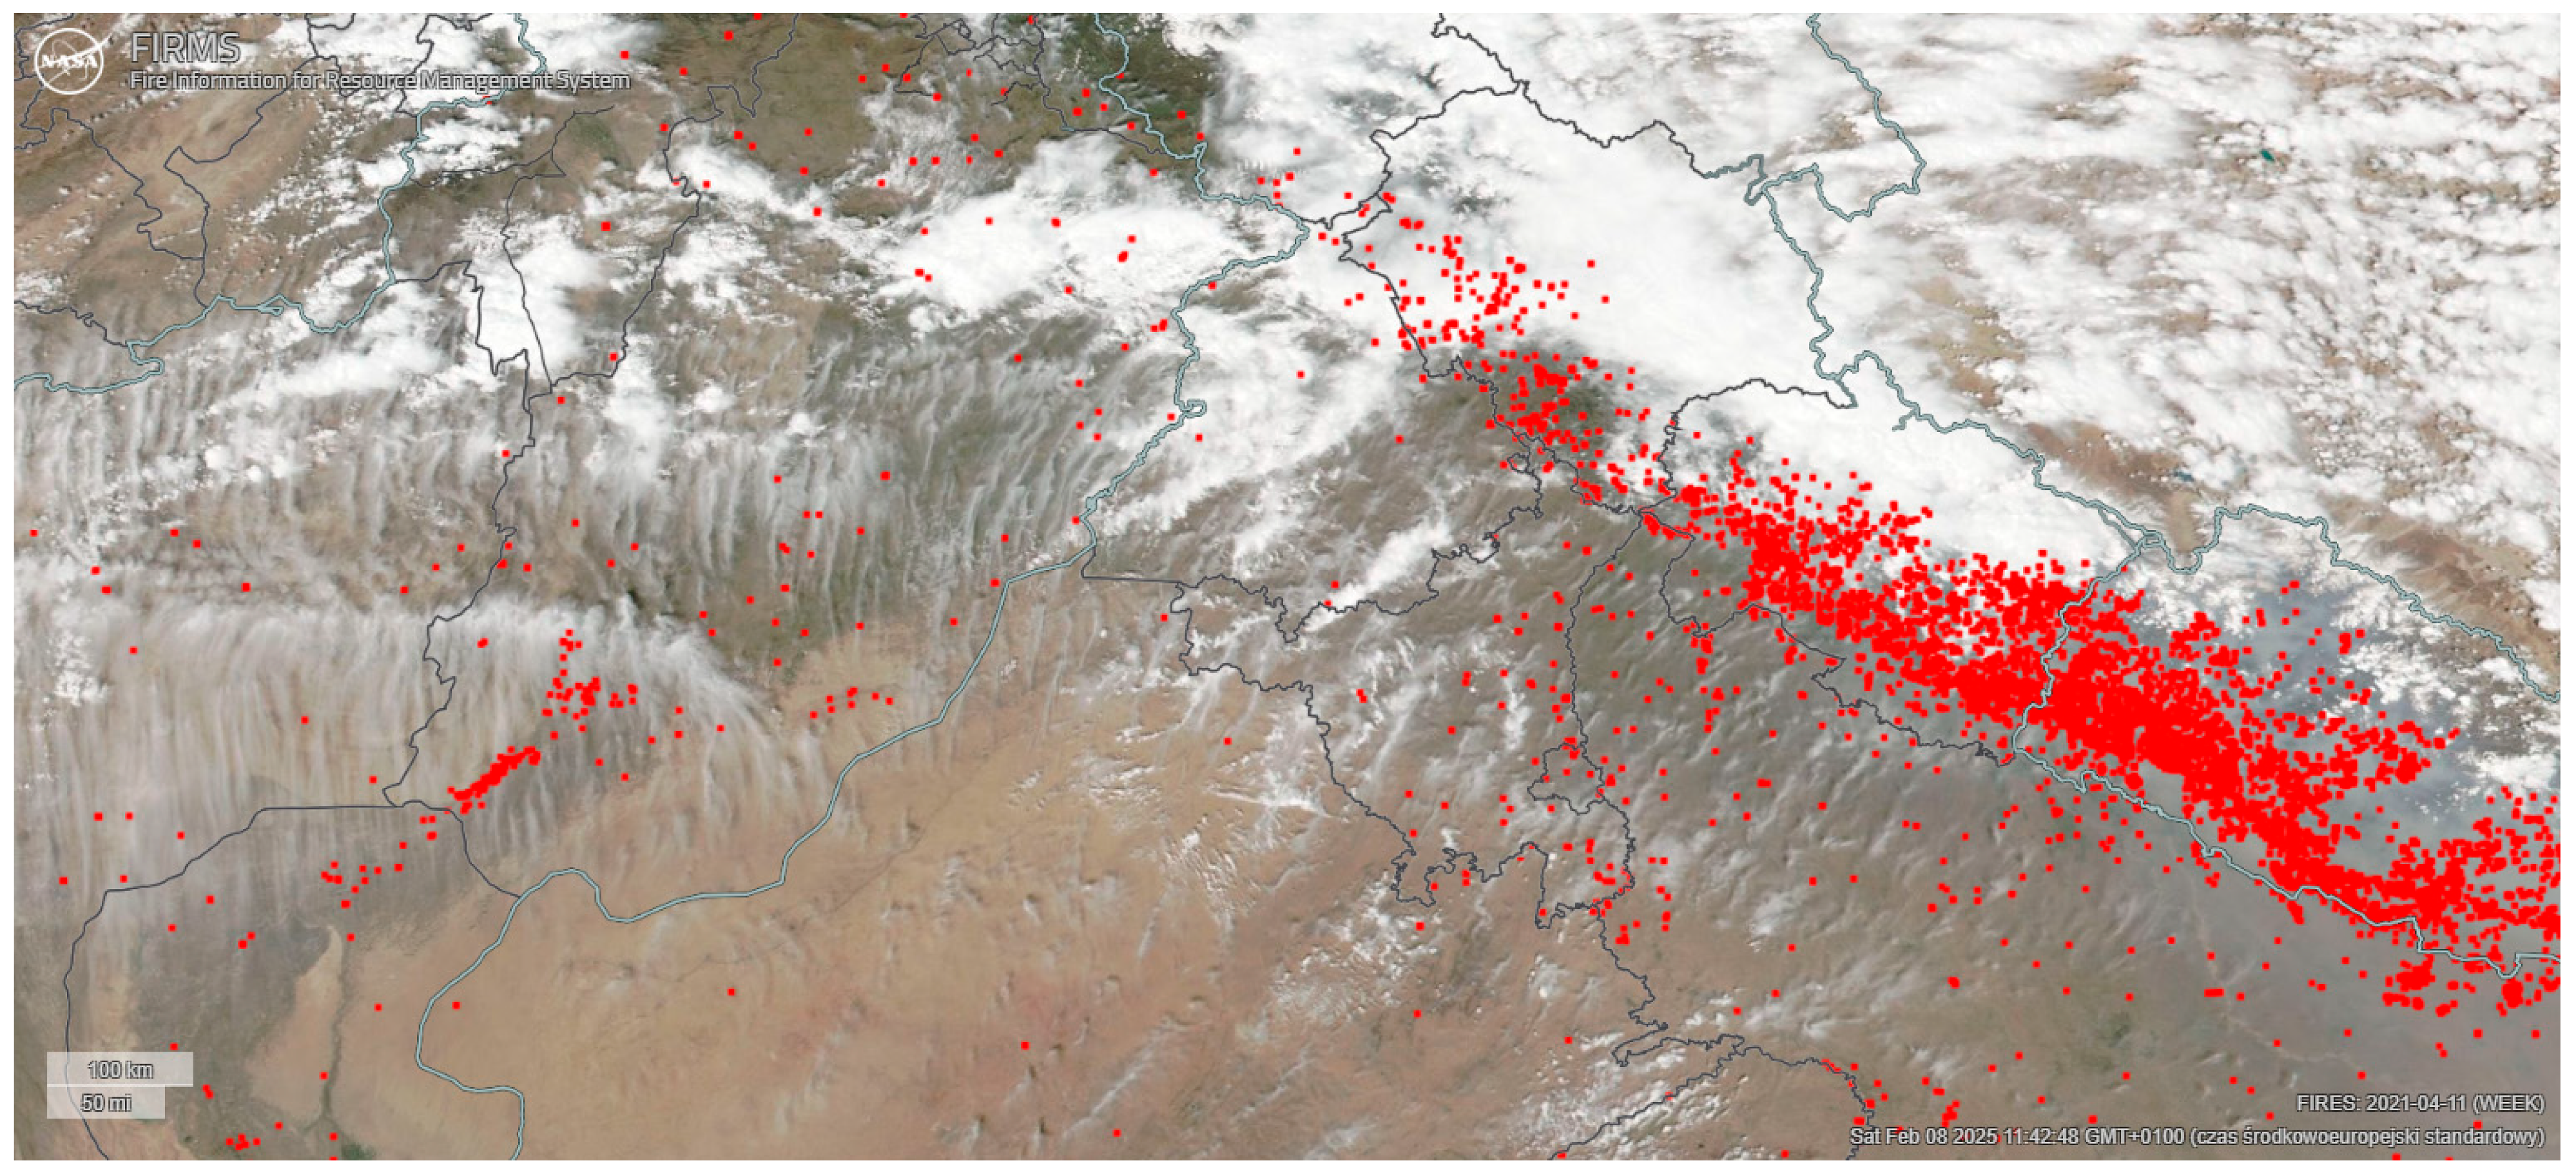 | 16,146 px/ 1.5222% |
| 12 April 2021 |  | 10,934 px/ 1.0308% |
| 19 April 2021 | 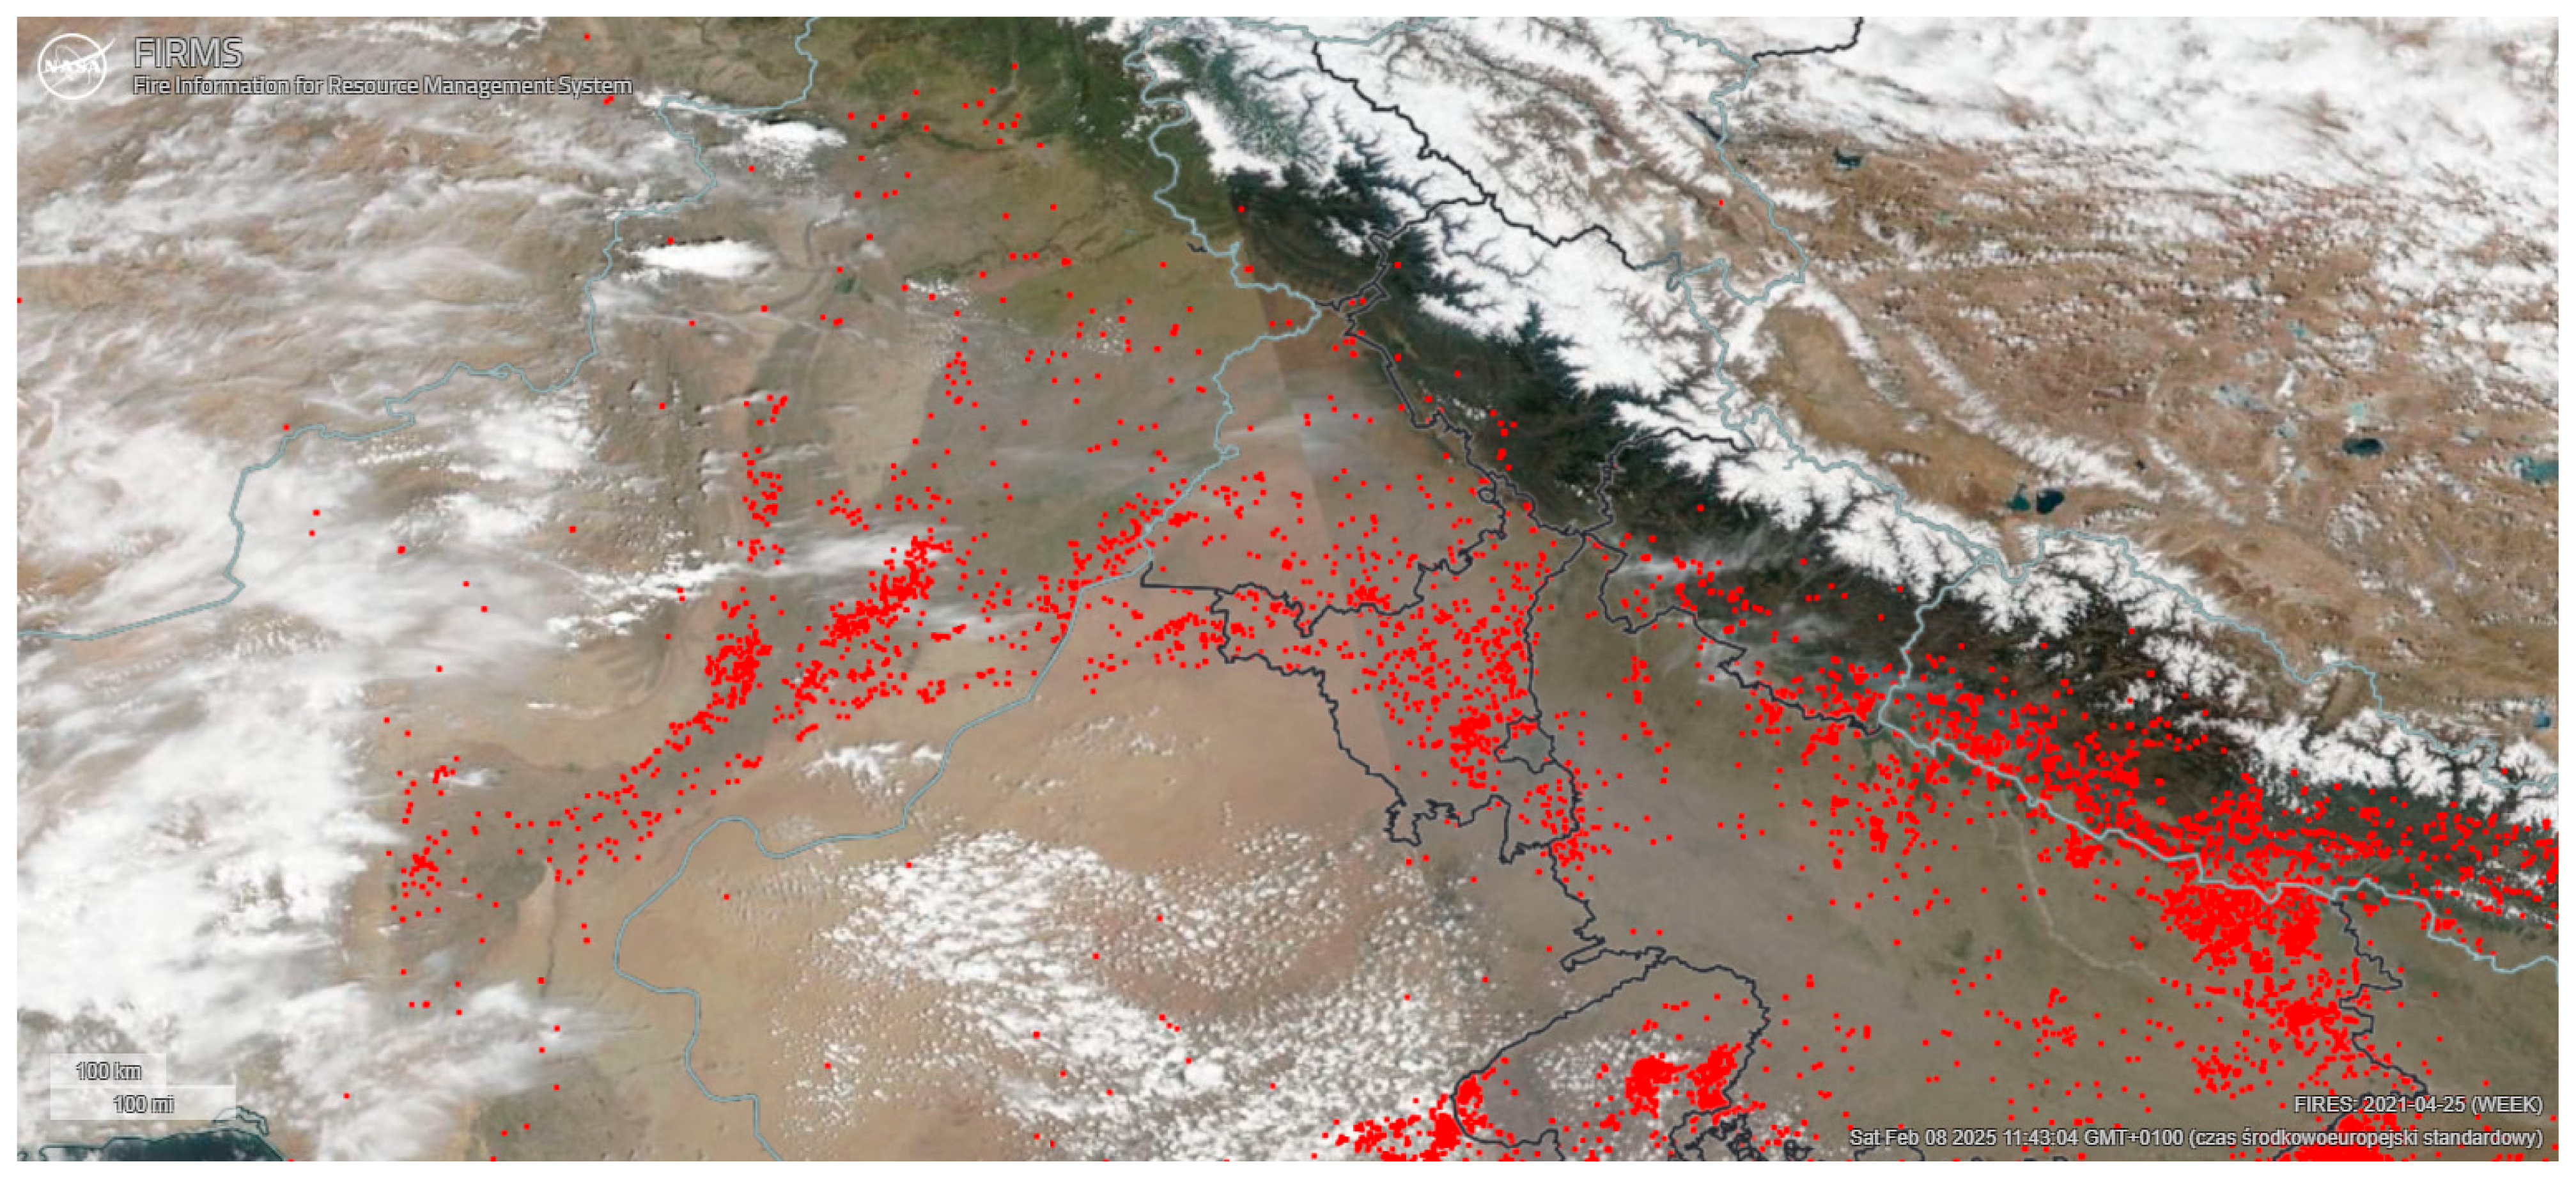 | 7674 px/ 0.7235% |
| 26 April 2021 | 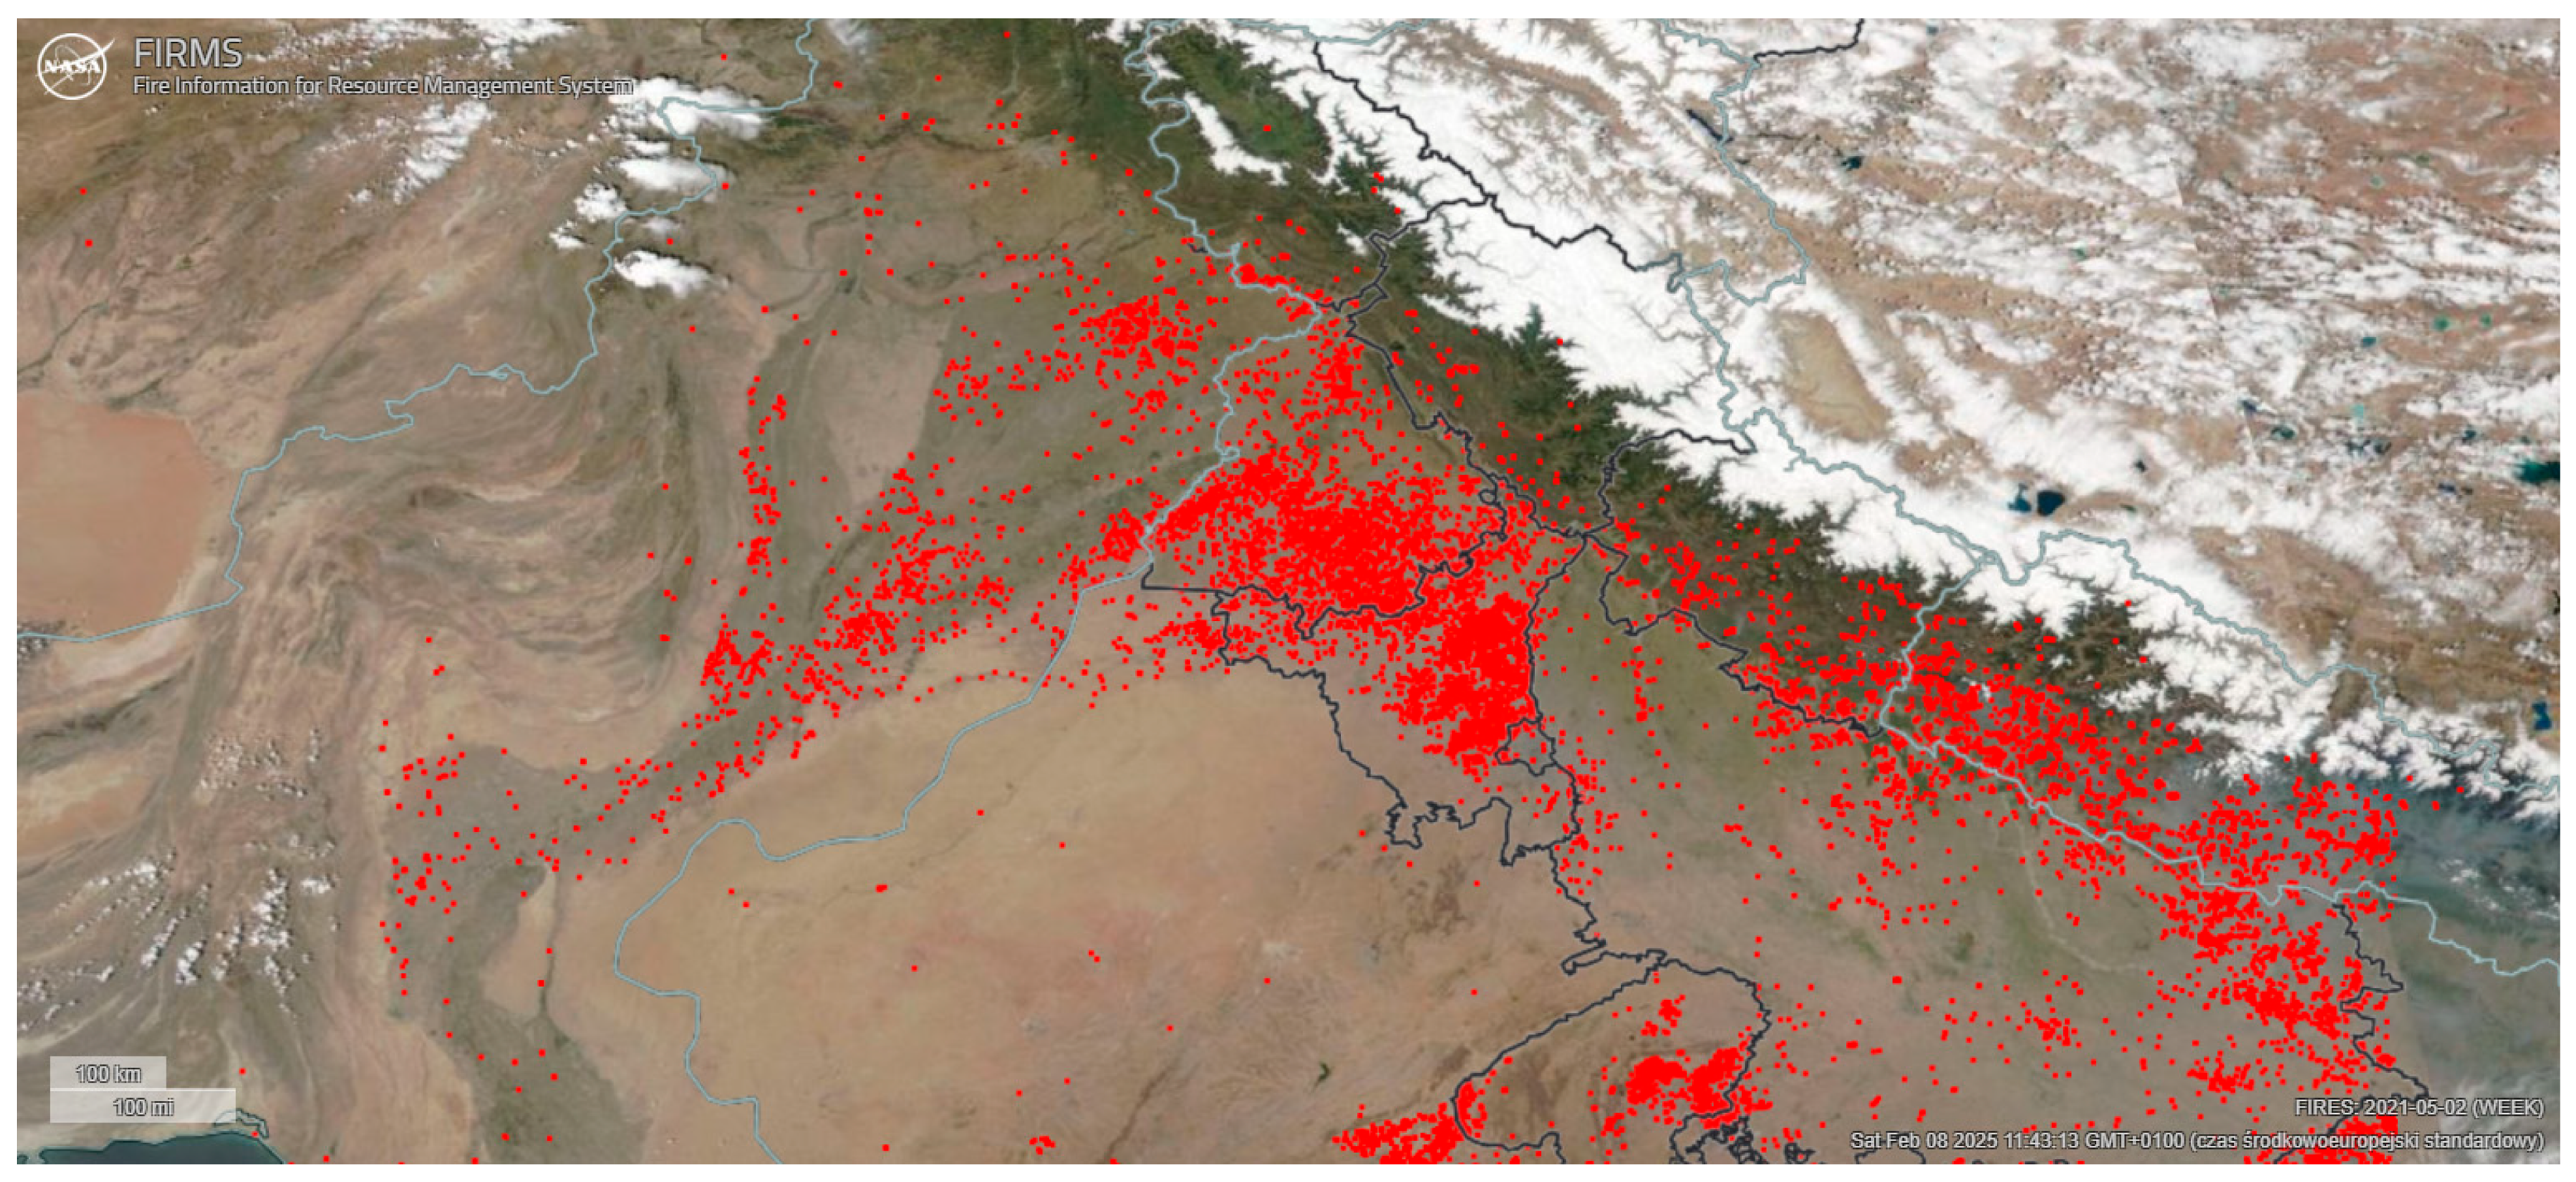 | 14,468 px/ 1.364% |
| 3 May 2021 |  | 13,570 px/ 1.2794% |
| 10 May 2021 |  | 9565 px/ 0.9018% |
| 17 May 2021 |  | 3313 px/ 0.3123% |
| 05-24-2021 | 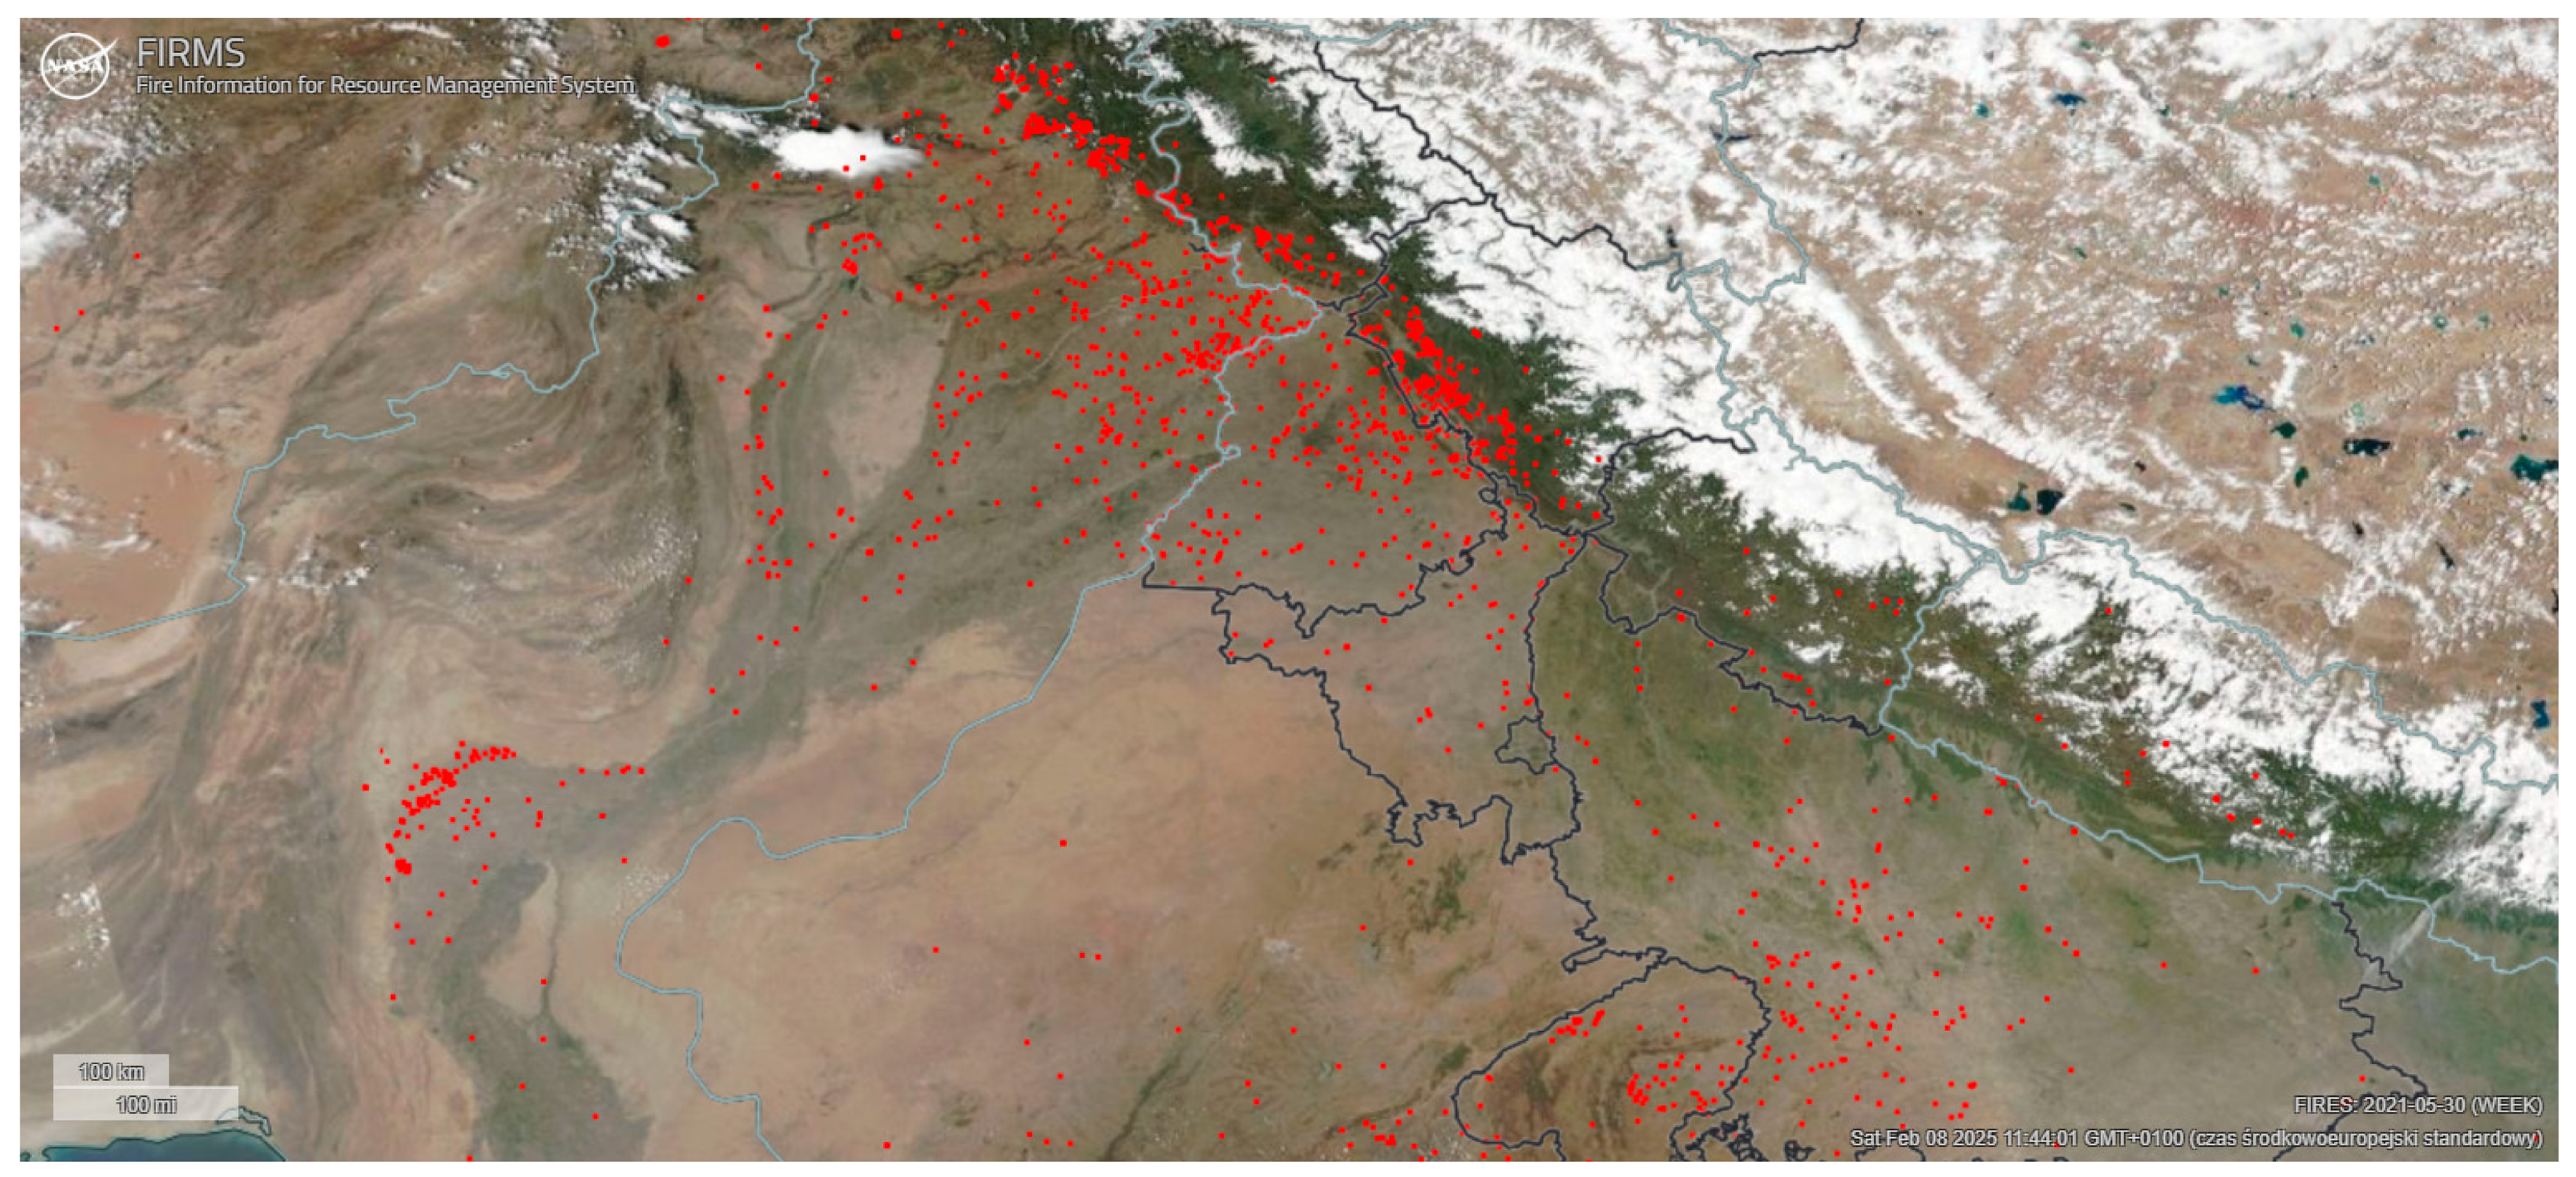 | 1850 px/ 0.1744% |
| Date | Pollution | Burned Area (A), ha | Emission Factor (EFpollutant), kg/kg s.m. | Emission of Pollutants (Epollutant), Tones |
|---|---|---|---|---|
| 5 May 2021 | TSP | 2,306,571.43 | 0.0058 (0.002) | 13.378 |
| PM10 | 0.0057 (0.002) | 13.147 | ||
| PM2.5 | 0.0054 (0.002) | 12.455 | ||
| 12 April 2021 | TSP | 1,562,001.23 | 0.0058 (0.002) | 9.060 |
| PM10 | 0.0057 (0.002) | 8.903 | ||
| PM2.5 | 0.0054 (0.002) | 8.435 | ||
| 19 April 2021 | TSP | 1,096,285.71 | 0.0058 (0.002) | 6.358 |
| PM10 | 0.0057 (0.002) | 6.249 | ||
| PM2.5 | 0.0054 (0.002) | 5.920 | ||
| 26 April 2021 | TSP | 2,066,857.14 | 0.0058 (0.002) | 11.988 |
| PM10 | 0.0057 (0.002) | 11.781 | ||
| PM2.5 | 0.0054 (0.002) | 11.161 | ||
| 3 May 2021 | TSP | 1,938,571.43 | 0.0058 (0.002) | 11.244 |
| PM10 | 0.0057 (0.002) | 11.050 | ||
| PM2.5 | 0.0054 (0.002) | 10.468 | ||
| 10 May 2021 | TSP | 1,366,428.57 | 0.0058 (0.002) | 7.925 |
| PM10 | 0.0057 (0.002) | 7.789 | ||
| PM2.5 | 0.0054 (0.002) | 7.379 | ||
| 17 May 2021 | TSP | 473,285.72 | 0.0058 (0.002) | 2.745 |
| PM10 | 0.0057 (0.002) | 2.698 | ||
| PM2.5 | 0.0054 (0.002) | 2.556 | ||
| 24 May 2021 | TSP | 264,285.74 | 0.0058 (0.002) | 1.533 |
| PM10 | 0.0057 (0.002) | 1.506 | ||
| PM2.5 | 0.0054 (0.002) | 1.427 |
| Date | Bitmap of the Scanned Image | Percentage of Fire Coverage, % |
|---|---|---|
| 30 September 2024 | 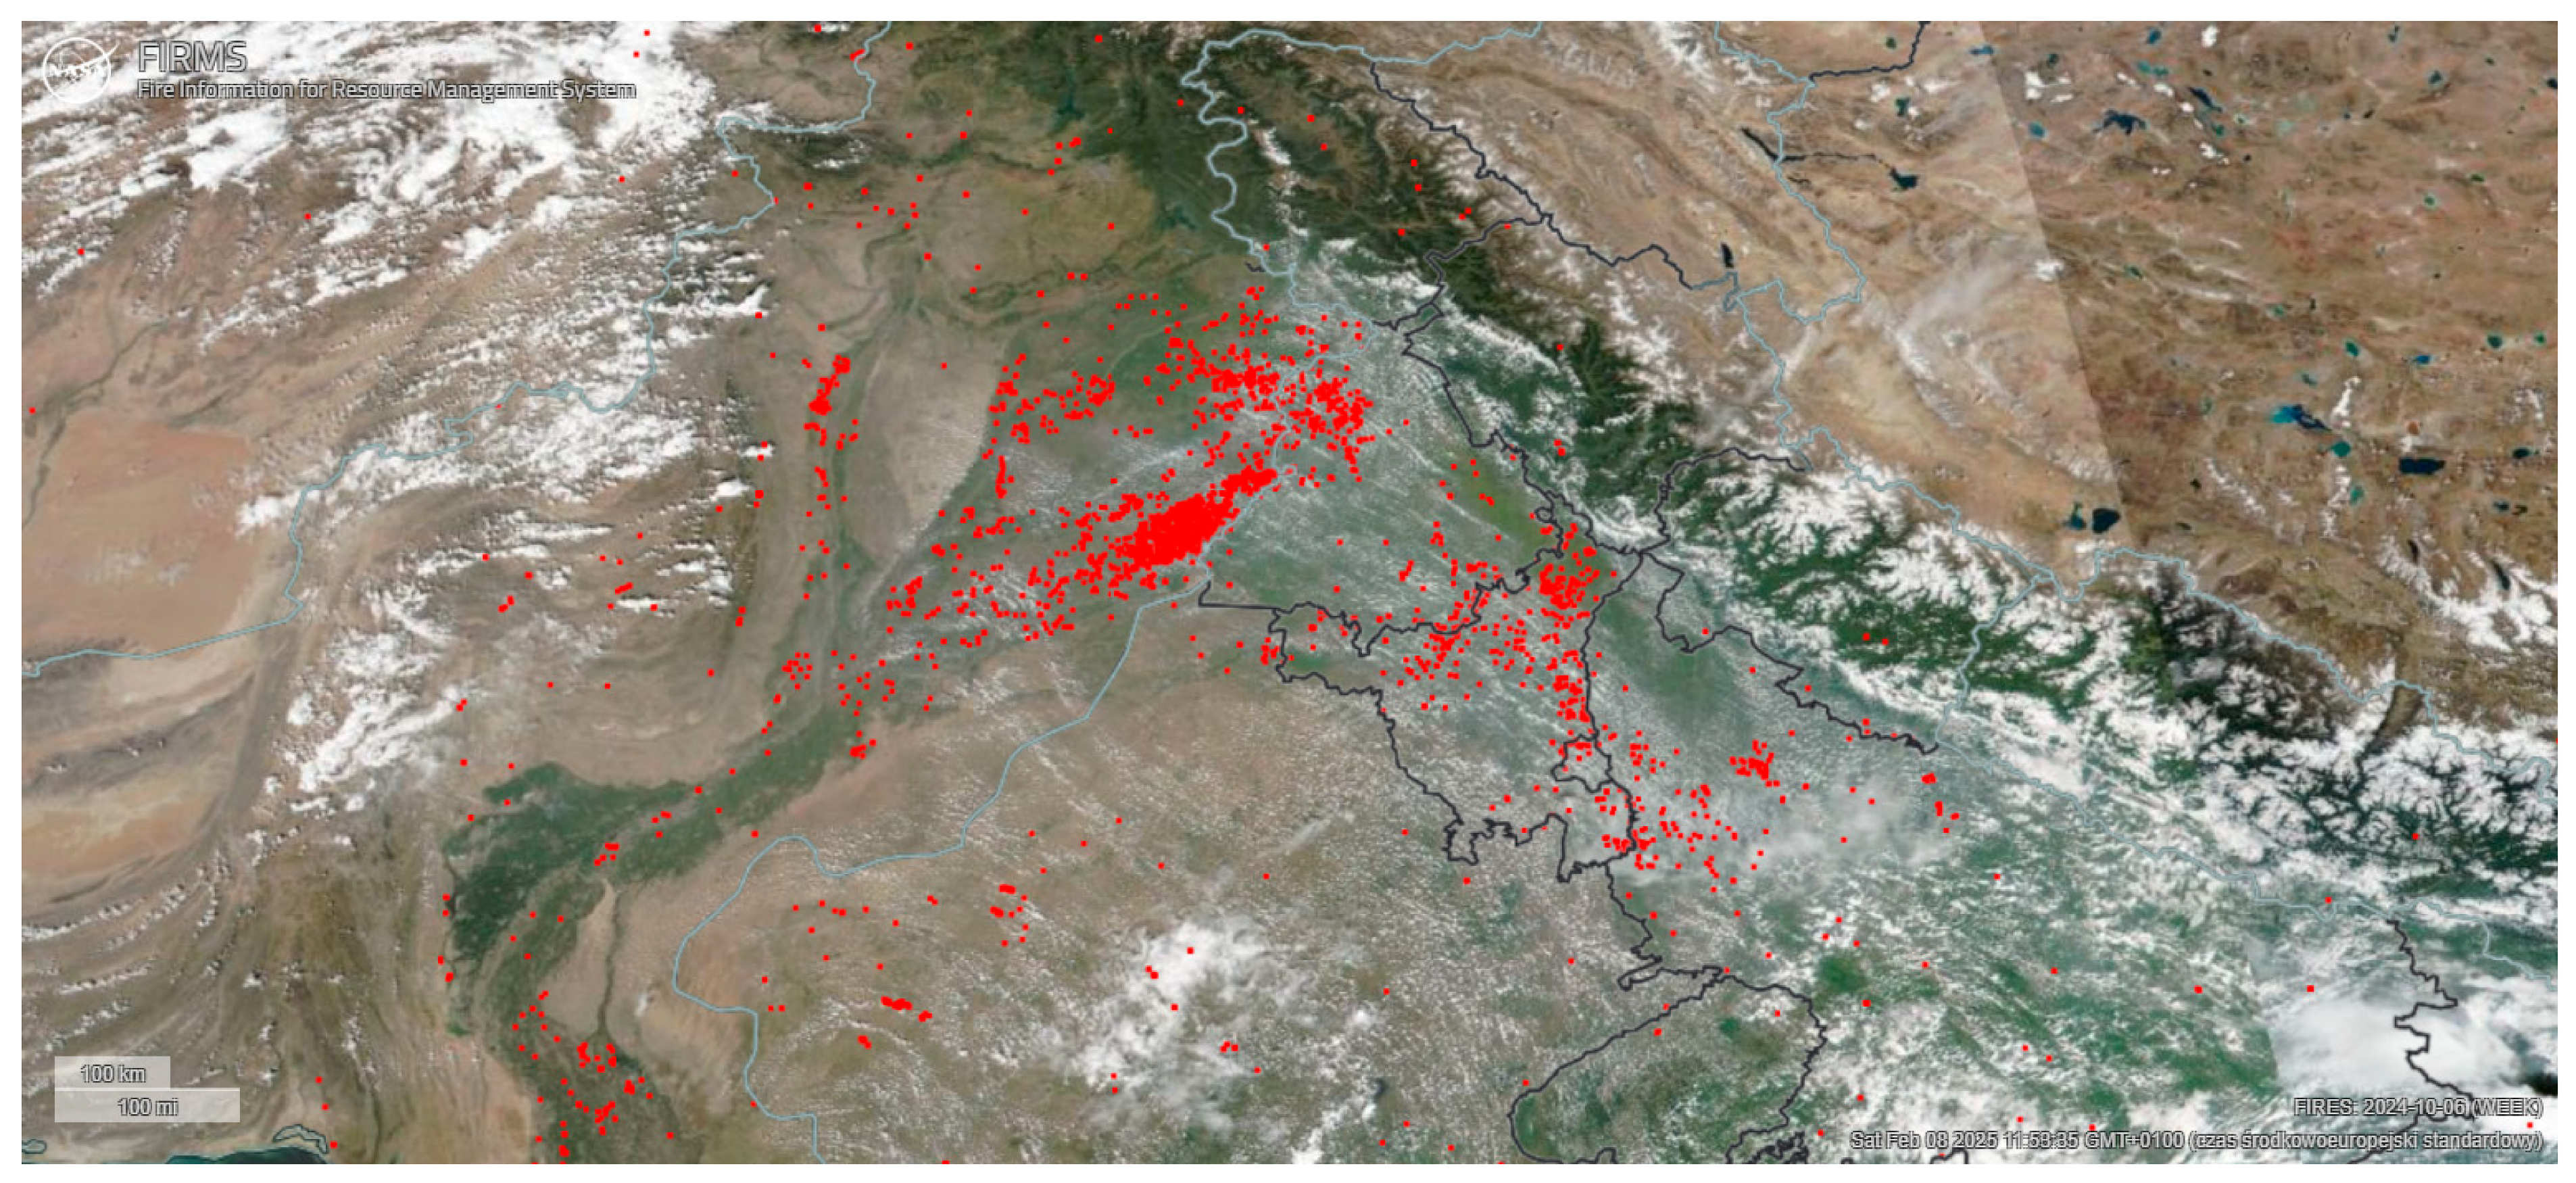 | 3295 px/ 0.3106% |
| 7 October 2024 | 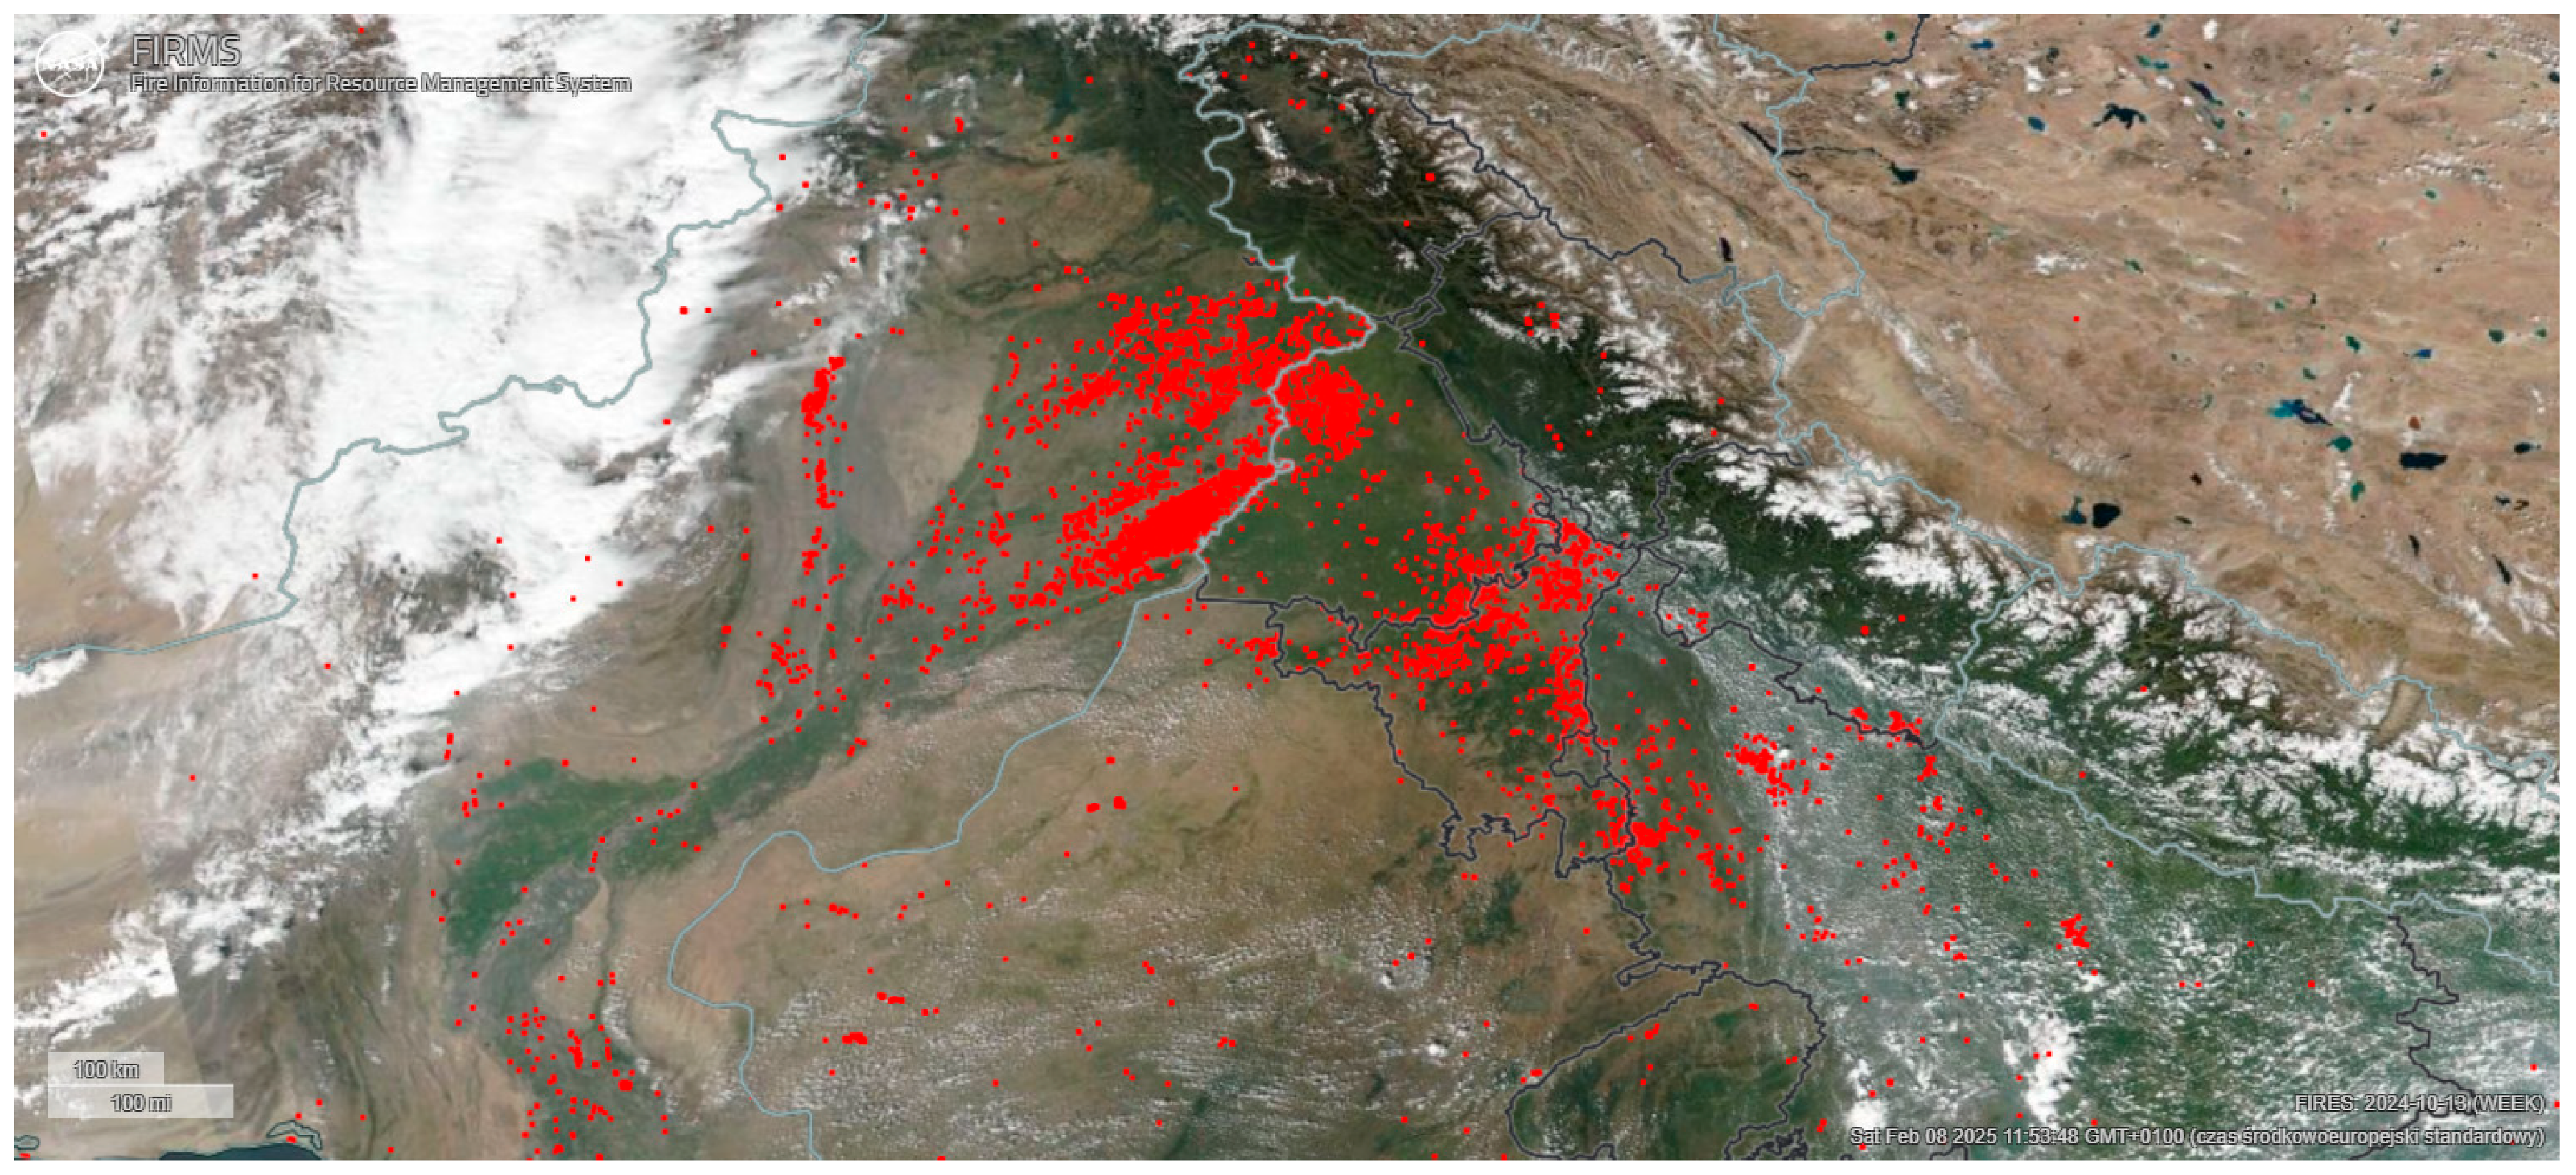 | 7197 px/ 0.6785% |
| 14 October 2024 |  | 9258 px/ 0.8728% |
| 21 October 2024 | 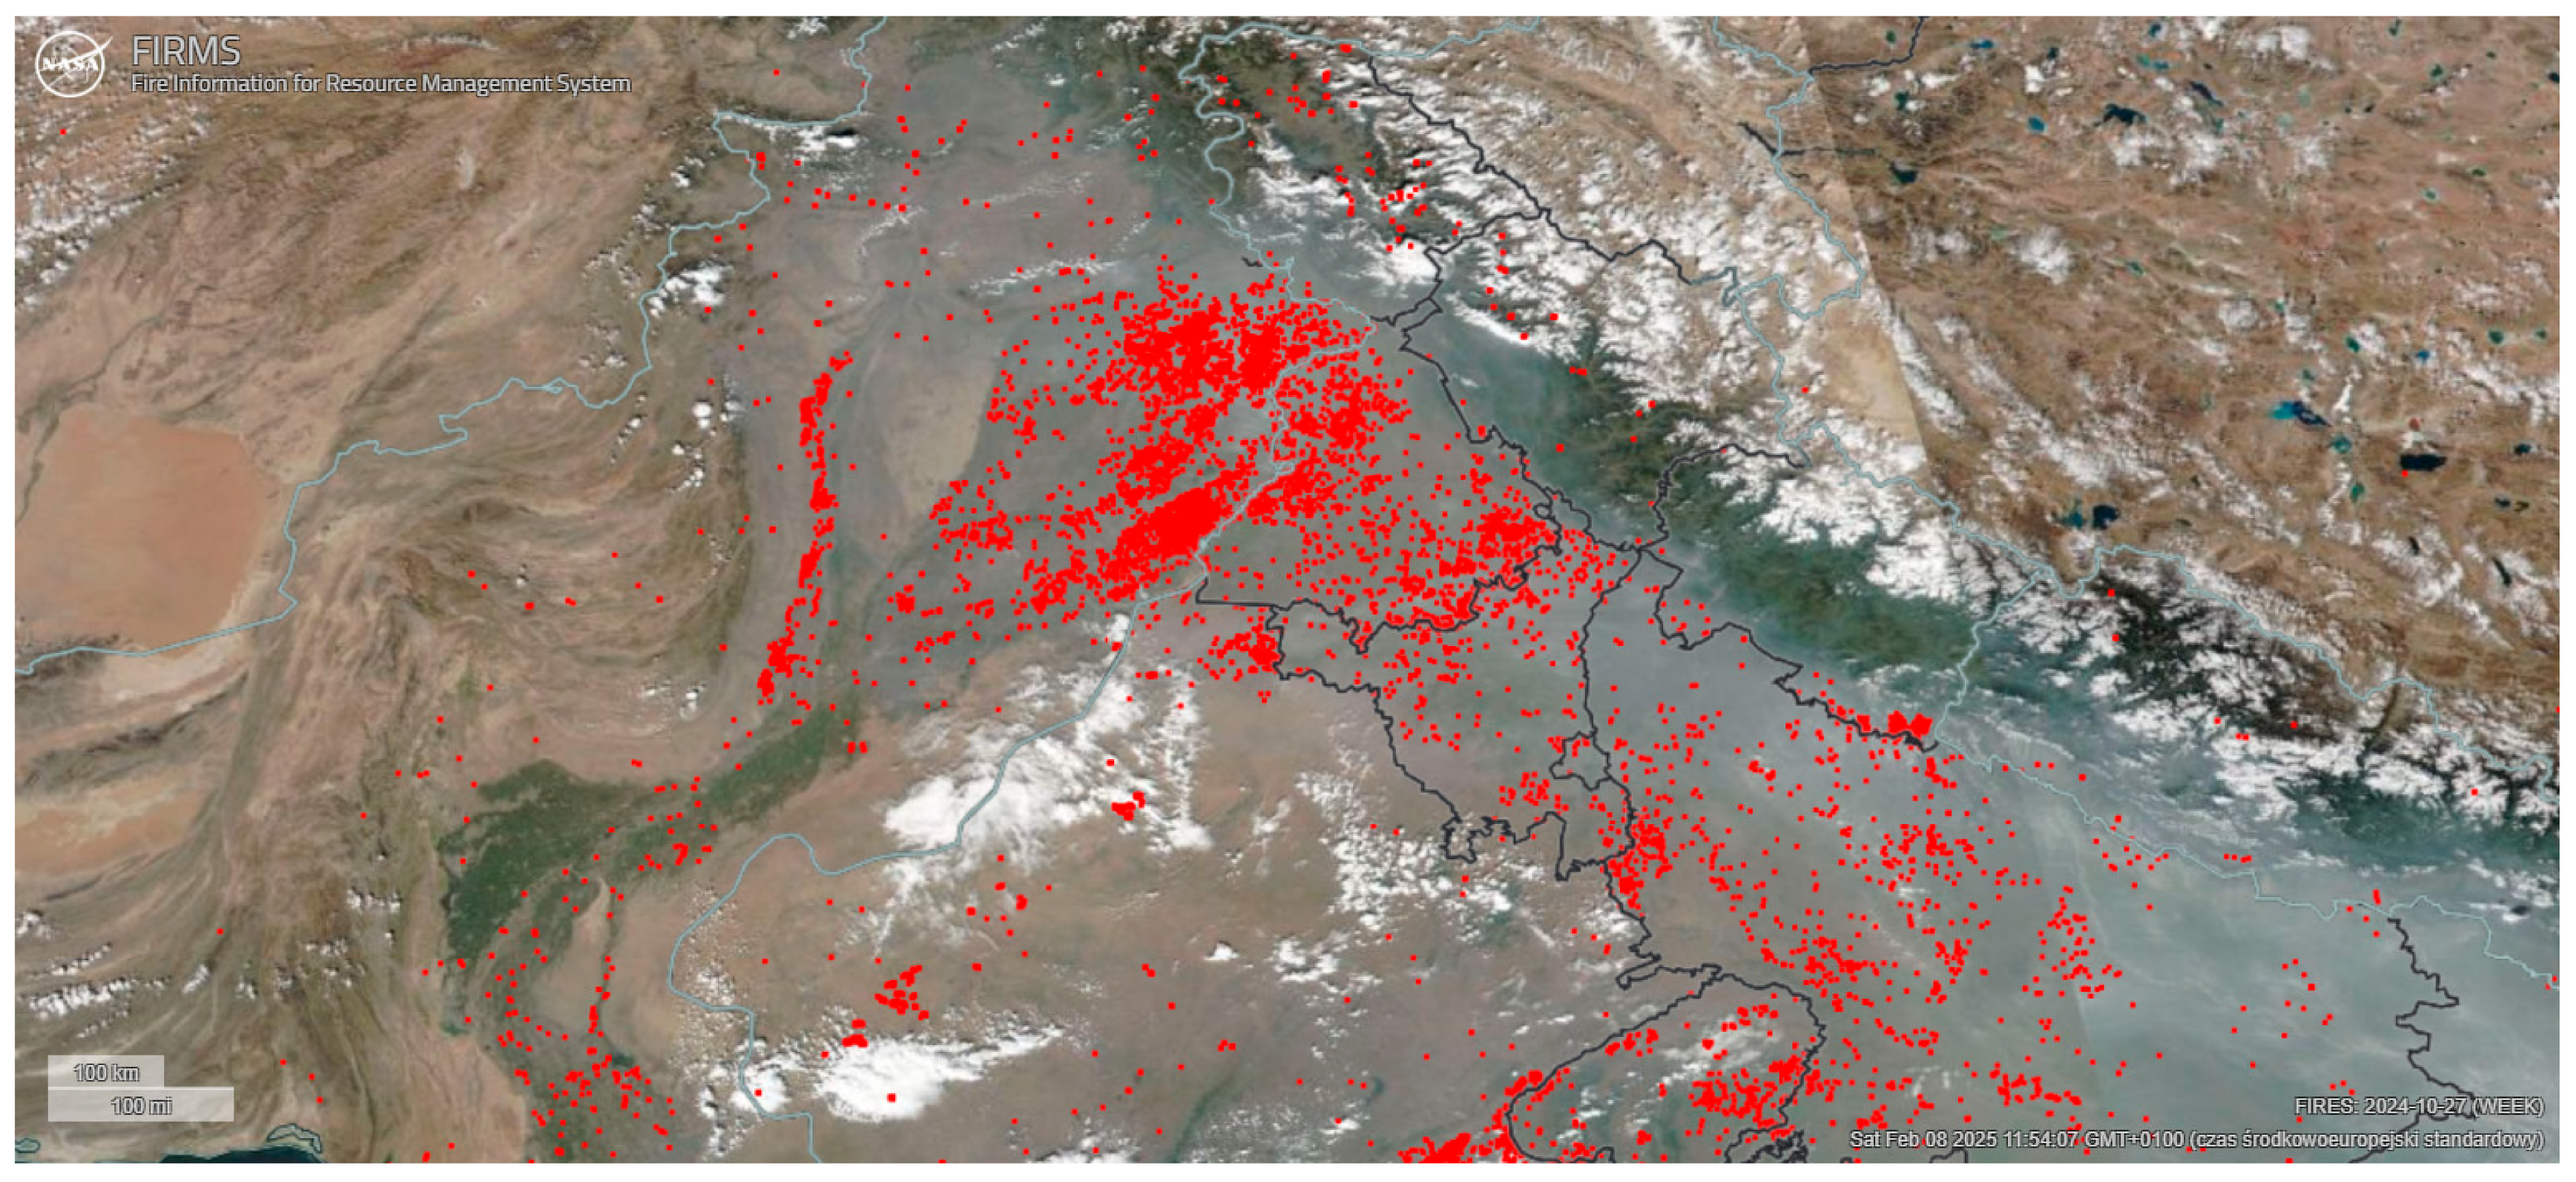 | 10,019 px/ 0.9446% |
| 27 October 2024 | 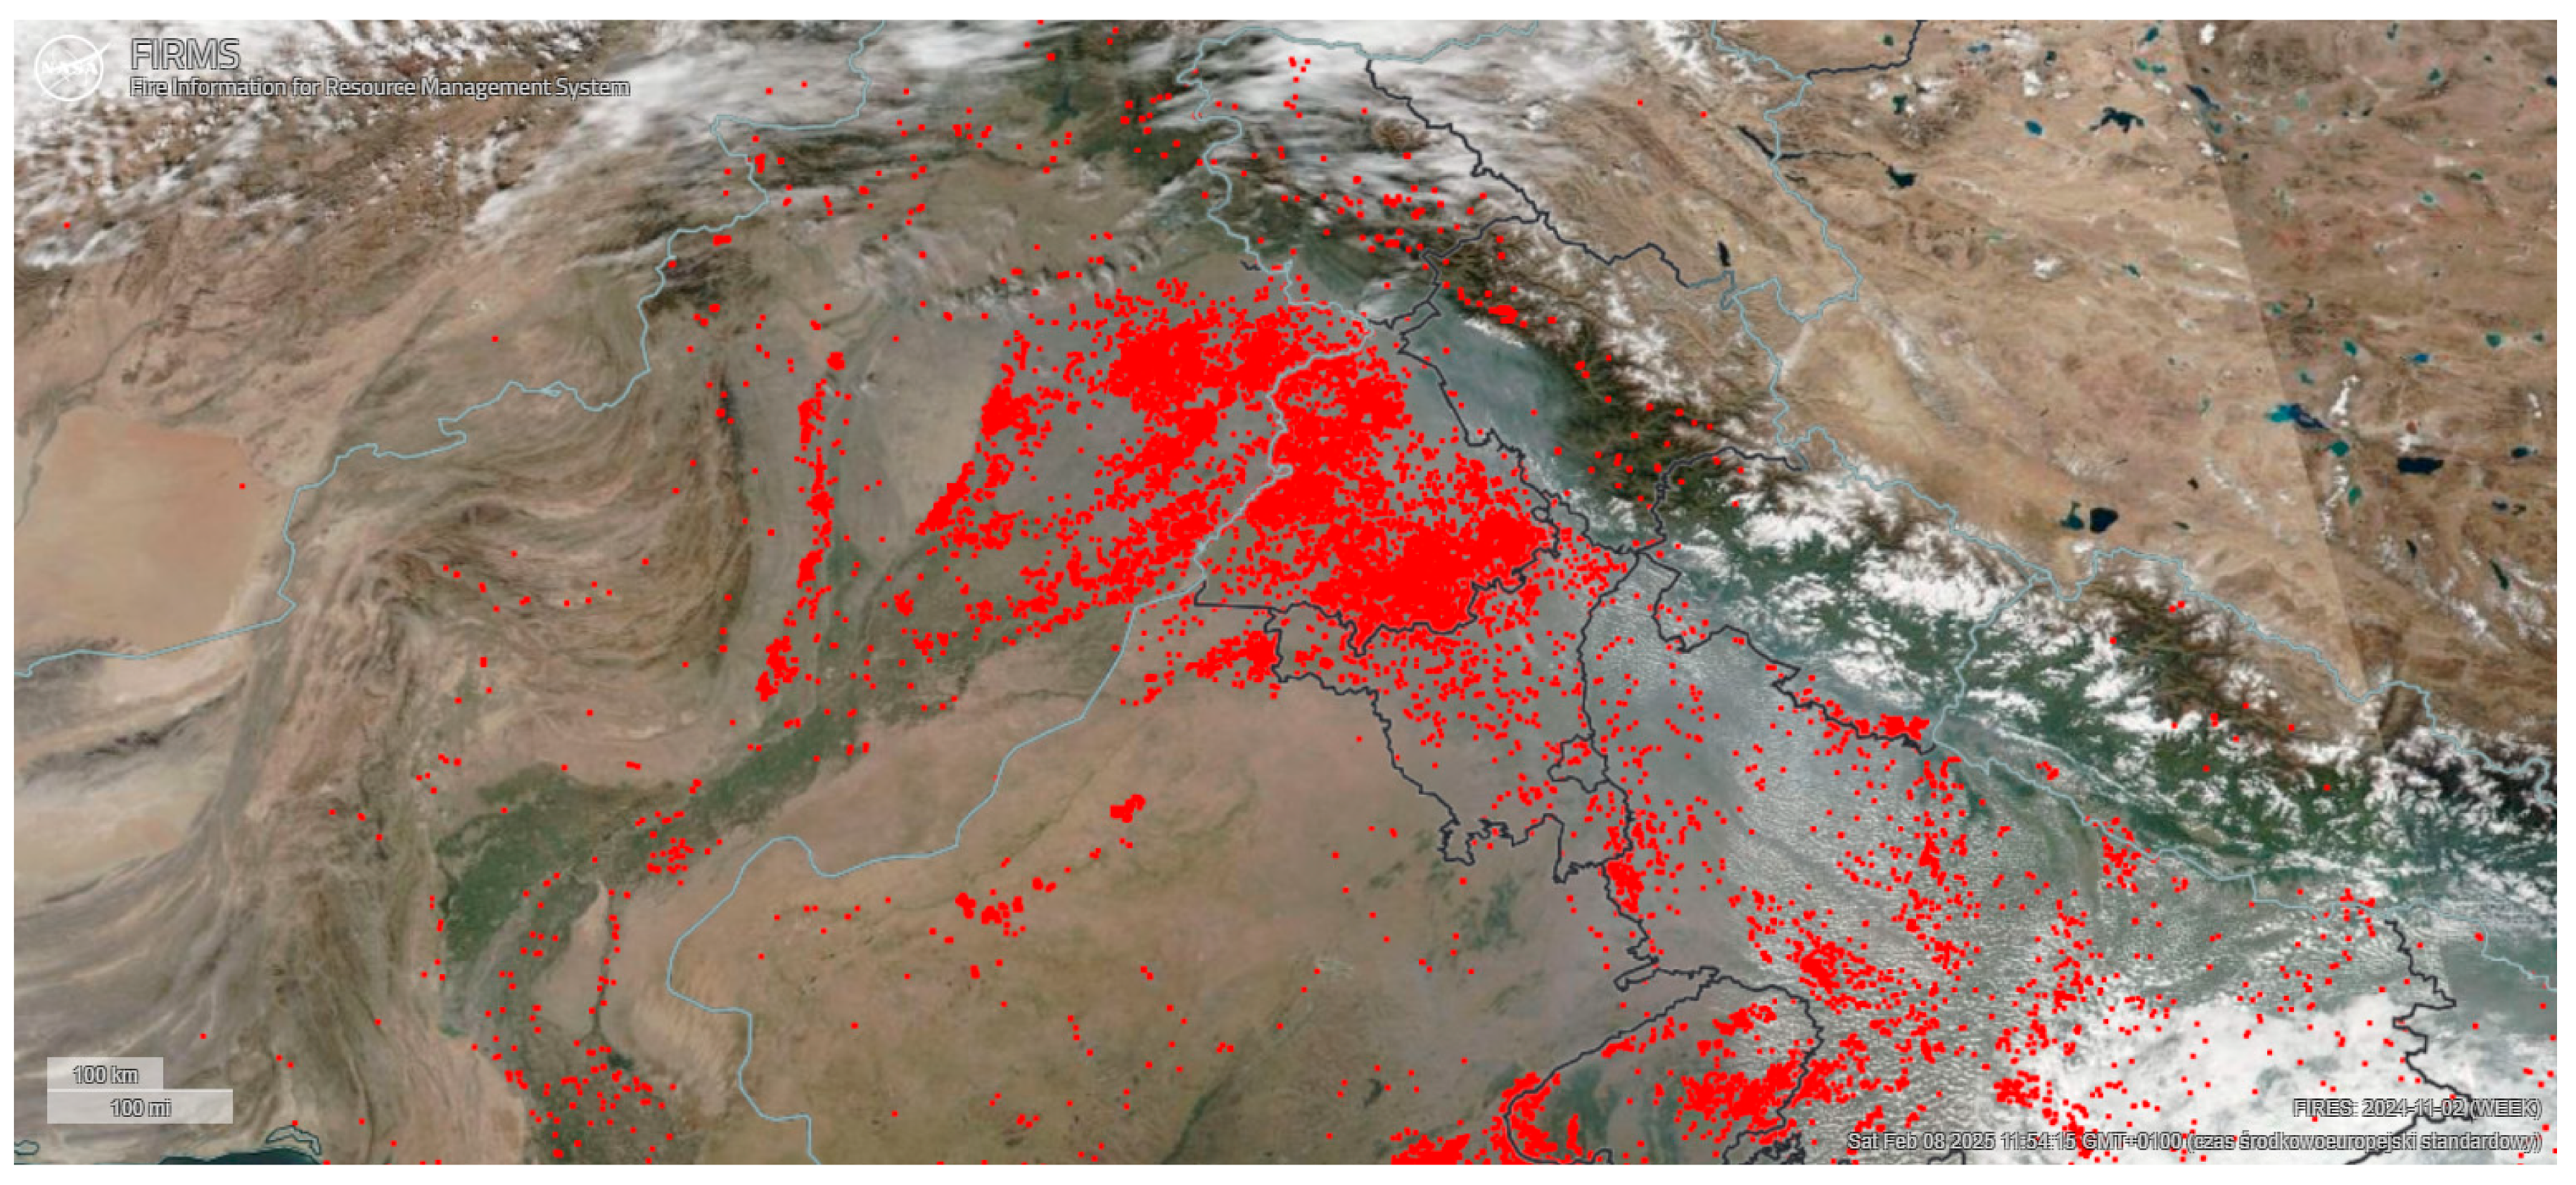 | 18,208 px/ 1.7166% |
| 3 November 2024 | 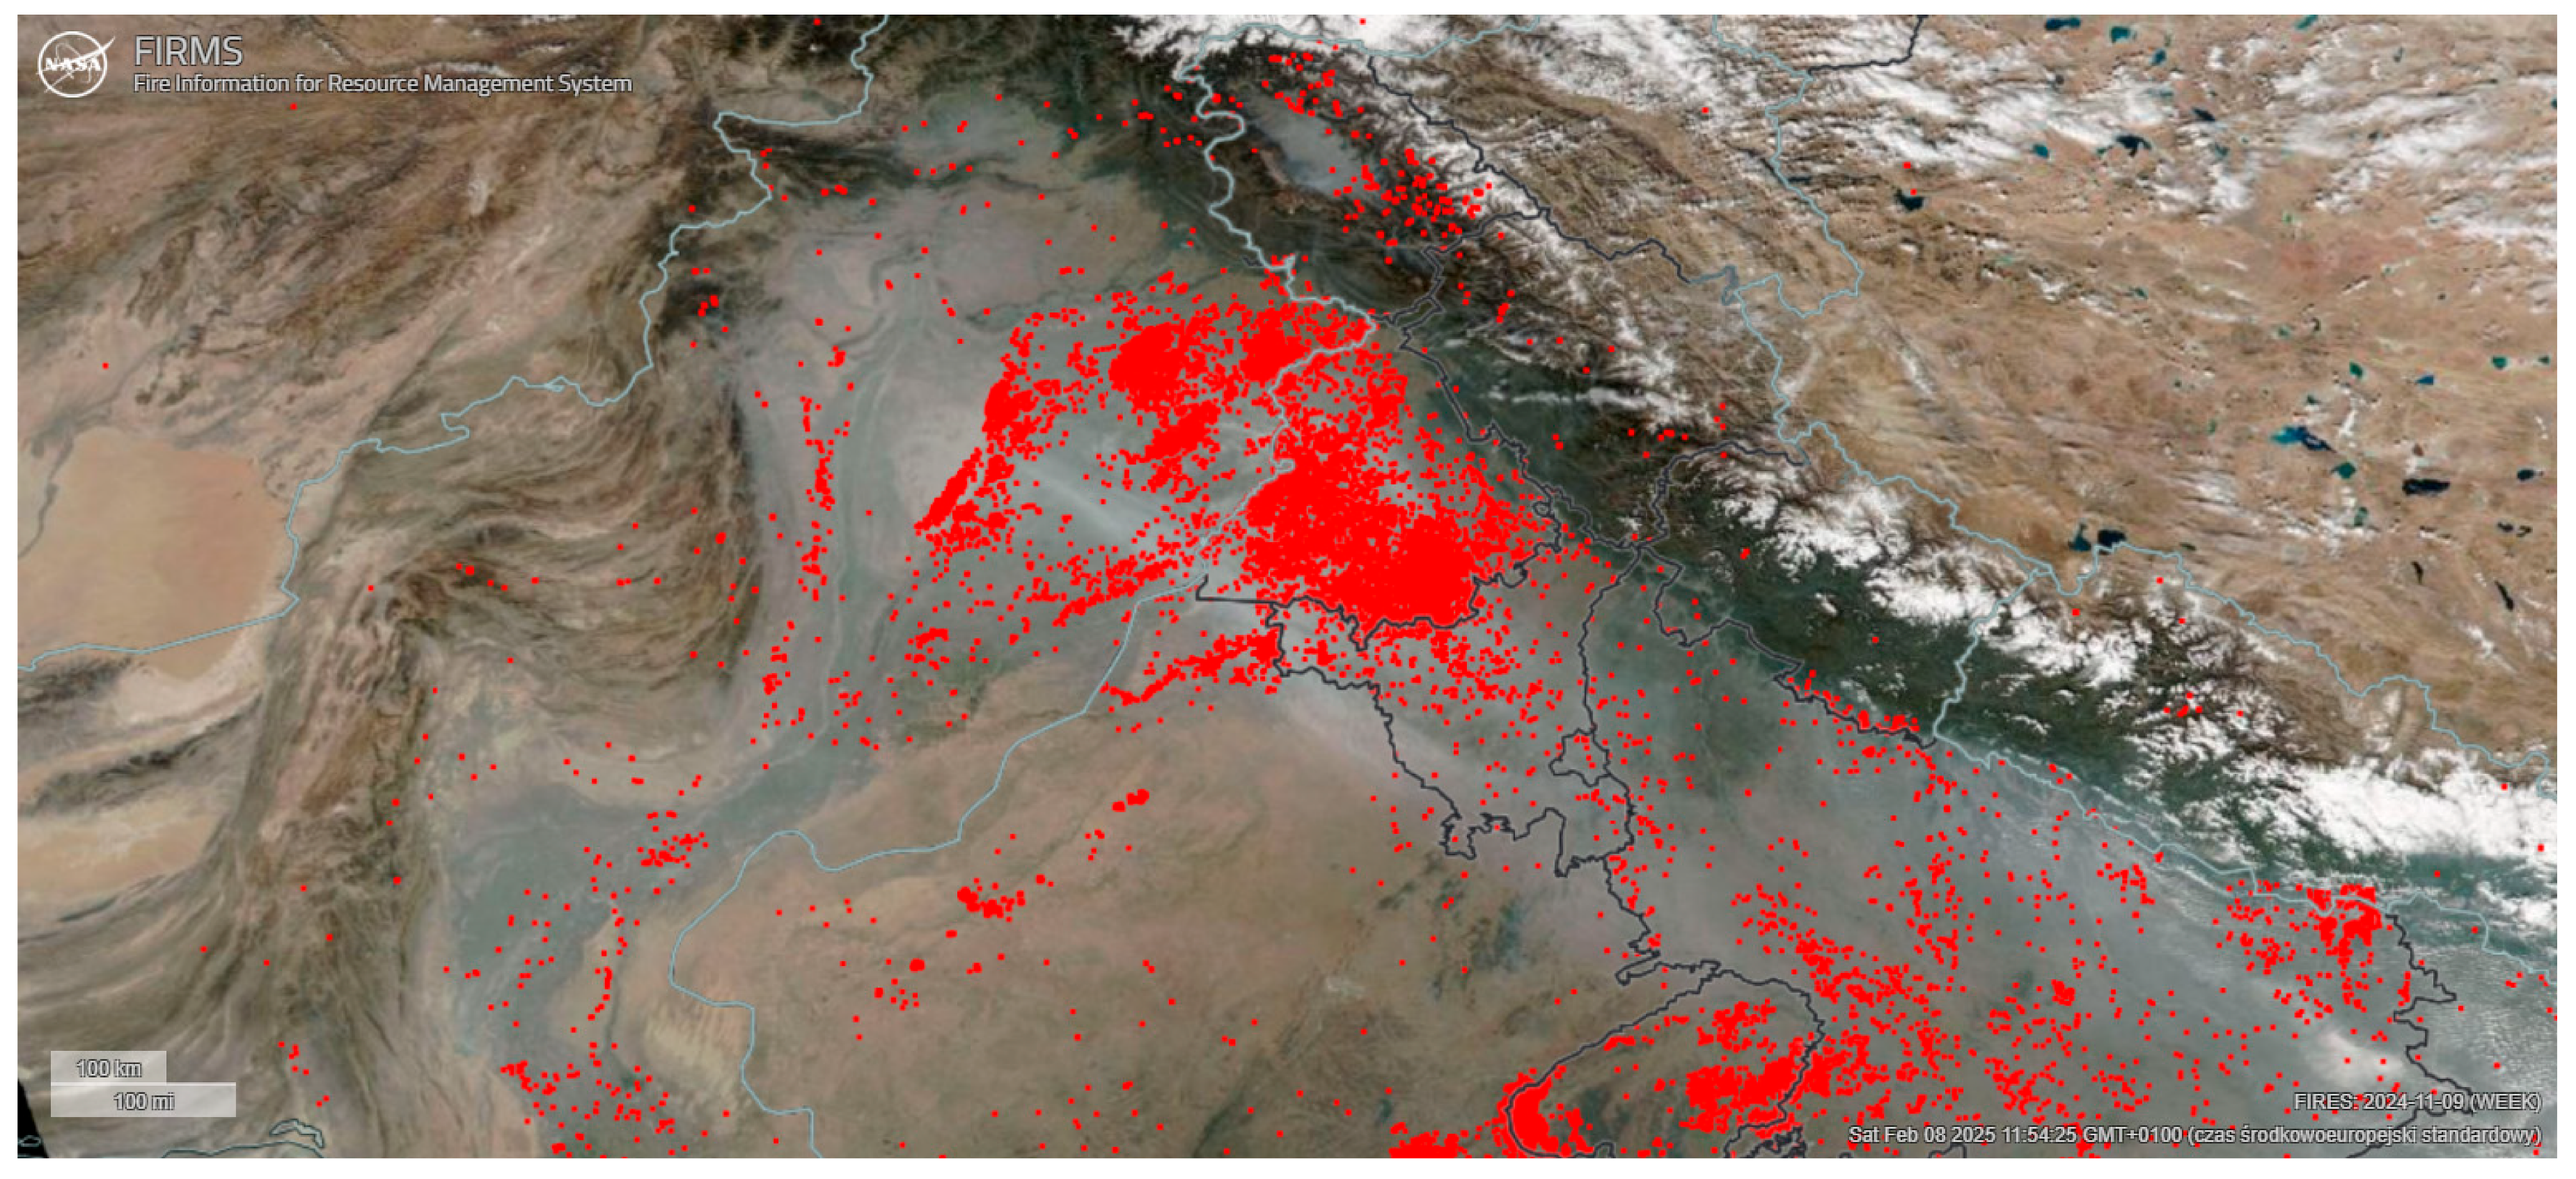 | 17,685 px/ 1.6673% |
| 10 November 2024 | 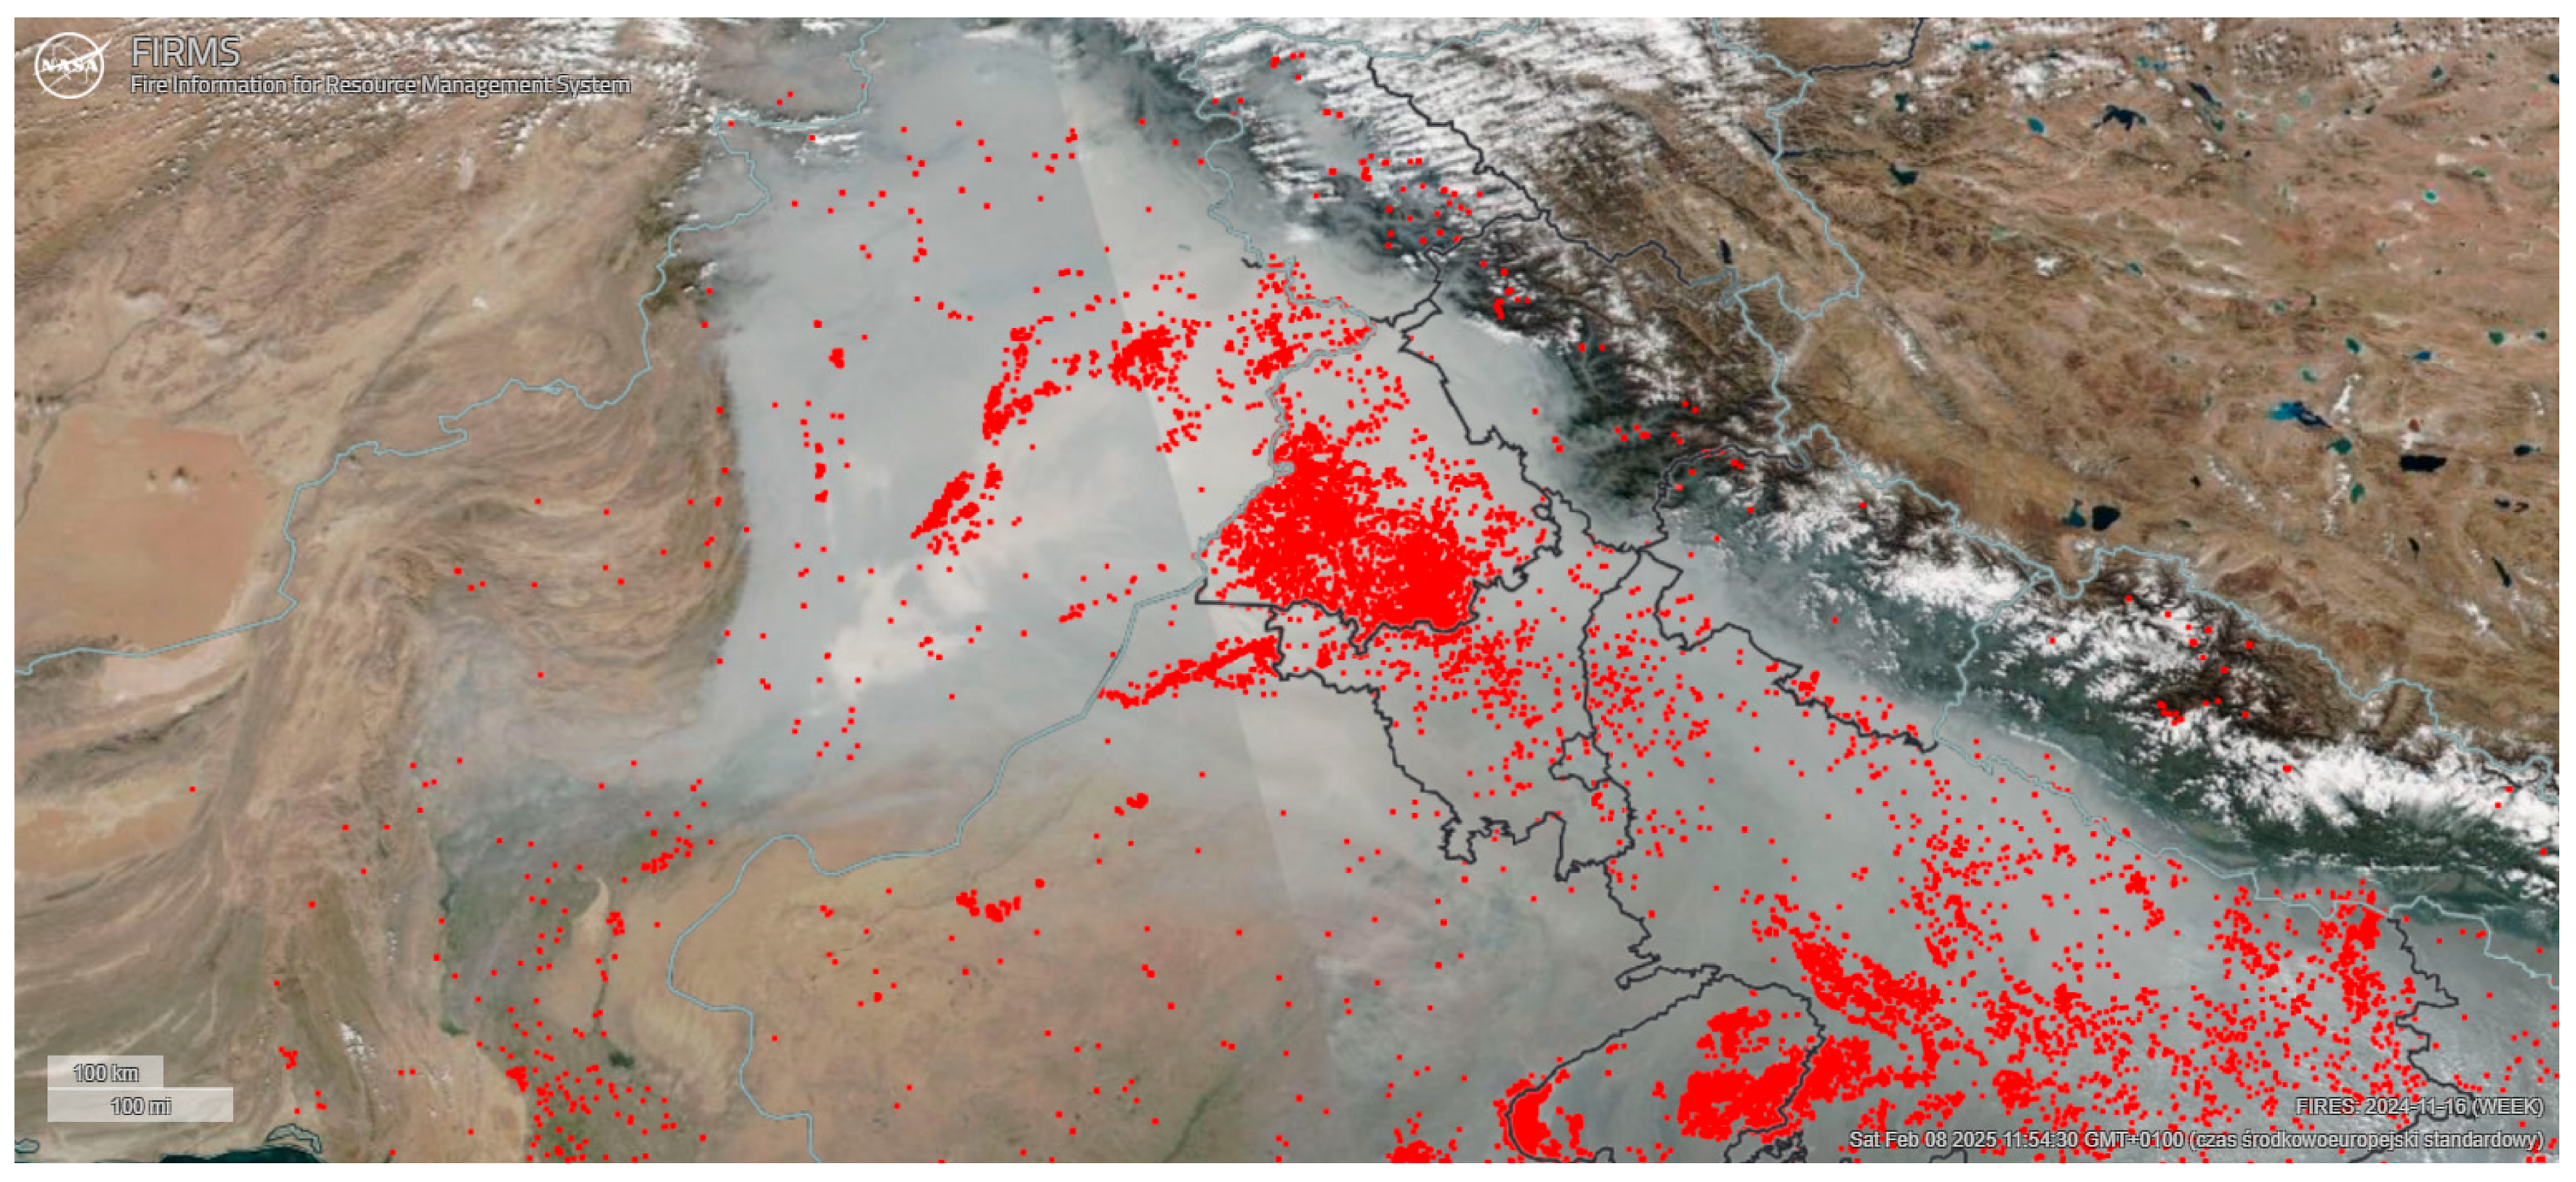 | 14,877 px/ 1.4026% |
| 17 November 2024 | 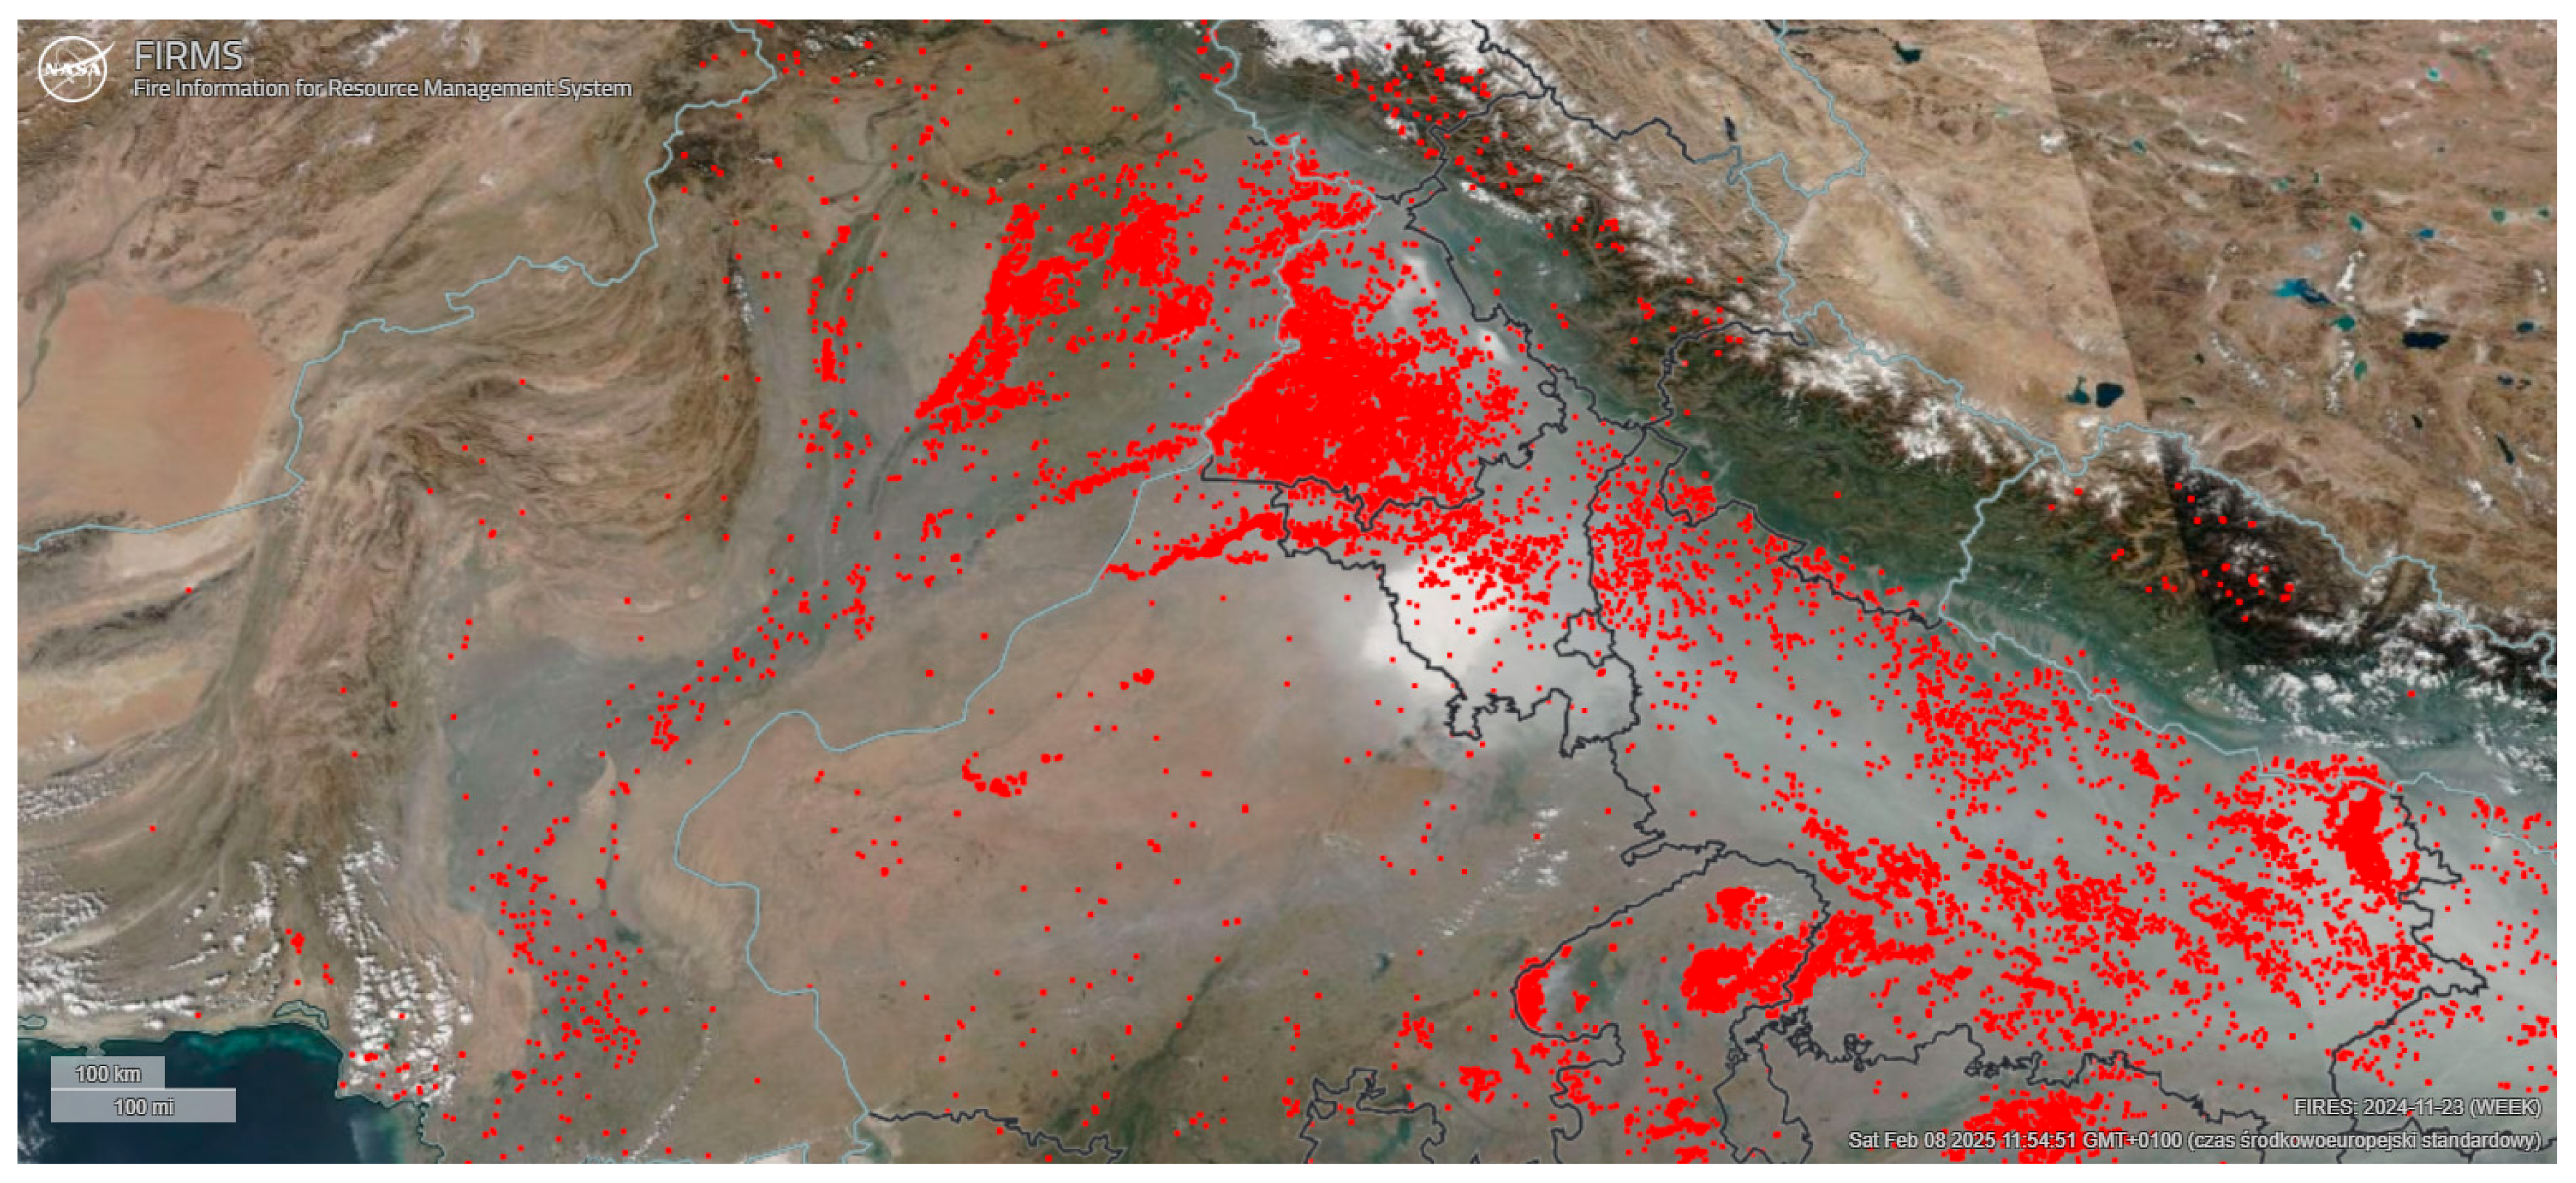 | 24,575 px/ 2.3169% |
| Date | Pollution | Burned Area (A), ha | Emission Factor (EFpollutant), kg/kg s.m. | Emission of Pollutants (Epollutant), Tones |
|---|---|---|---|---|
| 30 September 2024 | TSP | 484,558.82 | 0.0078 (0.001) | 3.780 |
| PM10 | 0.0077 (0.001) | 3.731 | ||
| PM2.5 | 0.0074 (0.001) | 3.586 | ||
| 7 October 2024 | TSP | 1,058,382.353 | 0.0078 (0.001) | 8.255 |
| PM10 | 0.0077 (0.001) | 8.150 | ||
| PM2.5 | 0.0074 (0.001) | 7.832 | ||
| 14 October 2024 | TSP | 1,361,470.588 | 0.0078 (0.001) | 10.619 |
| PM10 | 0.0077 (0.001) | 10.483 | ||
| PM2.5 | 0.0074 (0.001) | 10.075 | ||
| 21 October 2024 | TSP | 1,473,382.353 | 0.0078 (0.001) | 11.492 |
| PM10 | 0.0077 (0.001) | 11.345 | ||
| PM2.5 | 0.0074 (0.001) | 10.903 | ||
| 27 October 2024 | TSP | 2,677,647.059 | 0.0078 (0.001) | 20.886 |
| PM10 | 0.0077 (0.001) | 20.618 | ||
| PM2.5 | 0.0074 (0.001) | 19.815 | ||
| 3 November 2024 | TSP | 2,600,735.294 | 0.0078 (0.001) | 20.286 |
| PM10 | 0.0077 (0.001) | 20.026 | ||
| PM2.5 | 0.0074 (0.001) | 19.245 | ||
| 10 November 2024 | TSP | 2,187,794.118 | 0.0078 (0.001) | 17.065 |
| PM10 | 0.0077 (0.001) | 16.846 | ||
| PM2.5 | 0.0074 (0.001) | 16.190 | ||
| 17 November 2024 | TSP | 3,613,970.588 | 0.0078 (0.001) | 28.189 |
| PM10 | 0.0077 (0.001) | 27.828 | ||
| PM2.5 | 0.0074 (0.001) | 26.743 |
| Date | Bitmap of the Scanned Image | Percentage of Fire Coverage, % |
|---|---|---|
| 18 October 2024 | 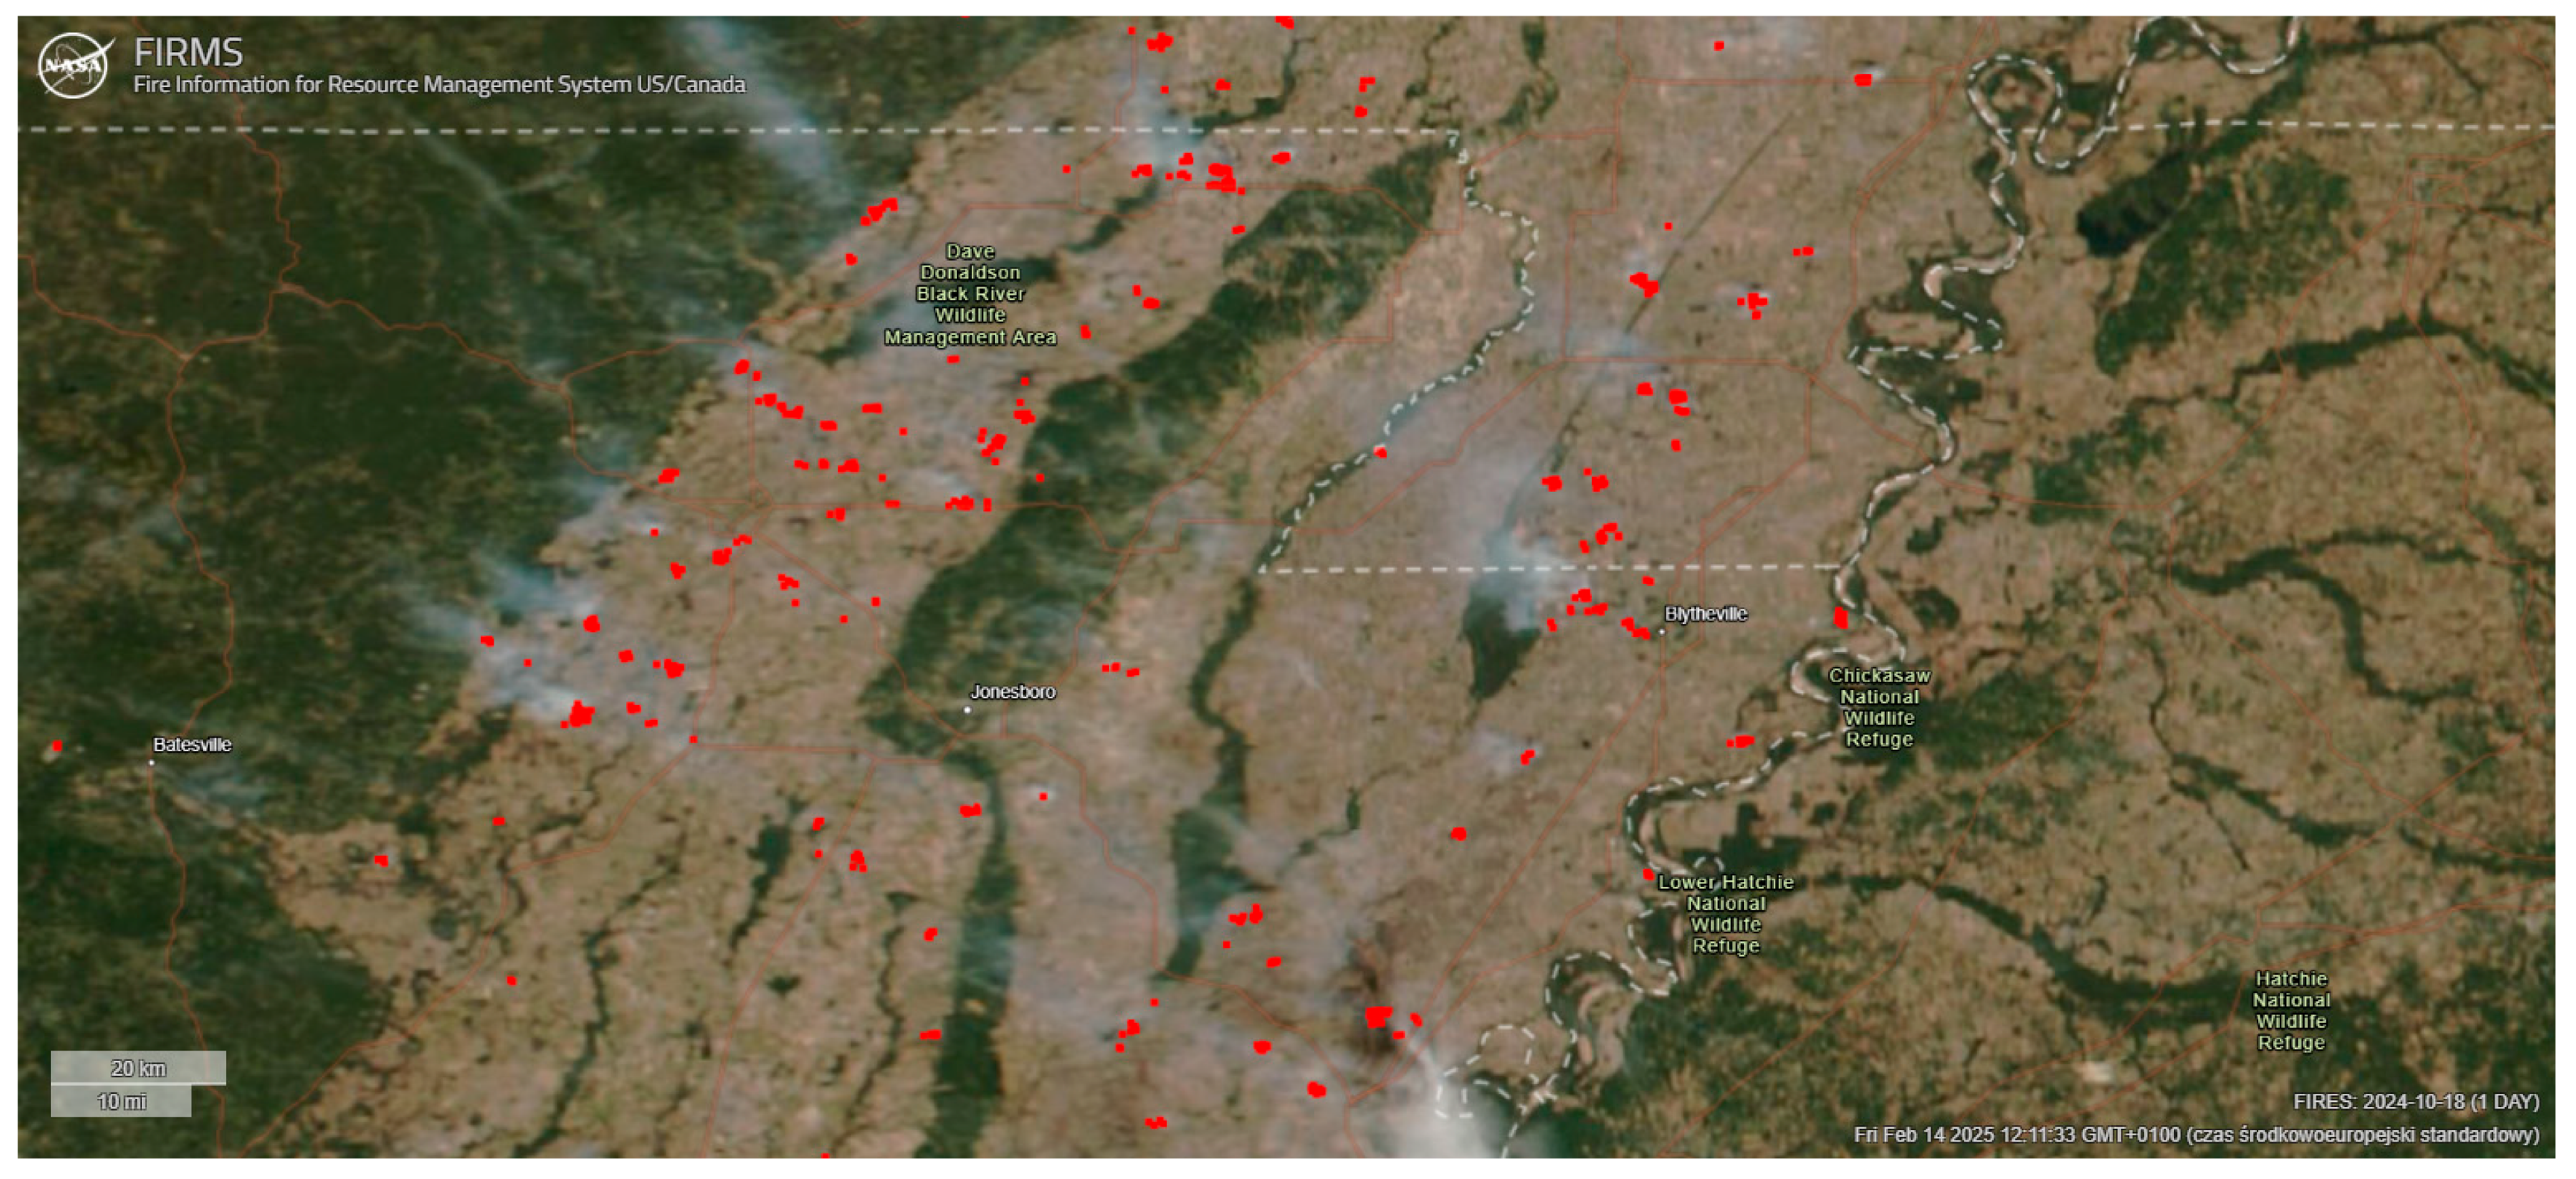 | 2645 px/0.2494% |
| 21 October 2024 | 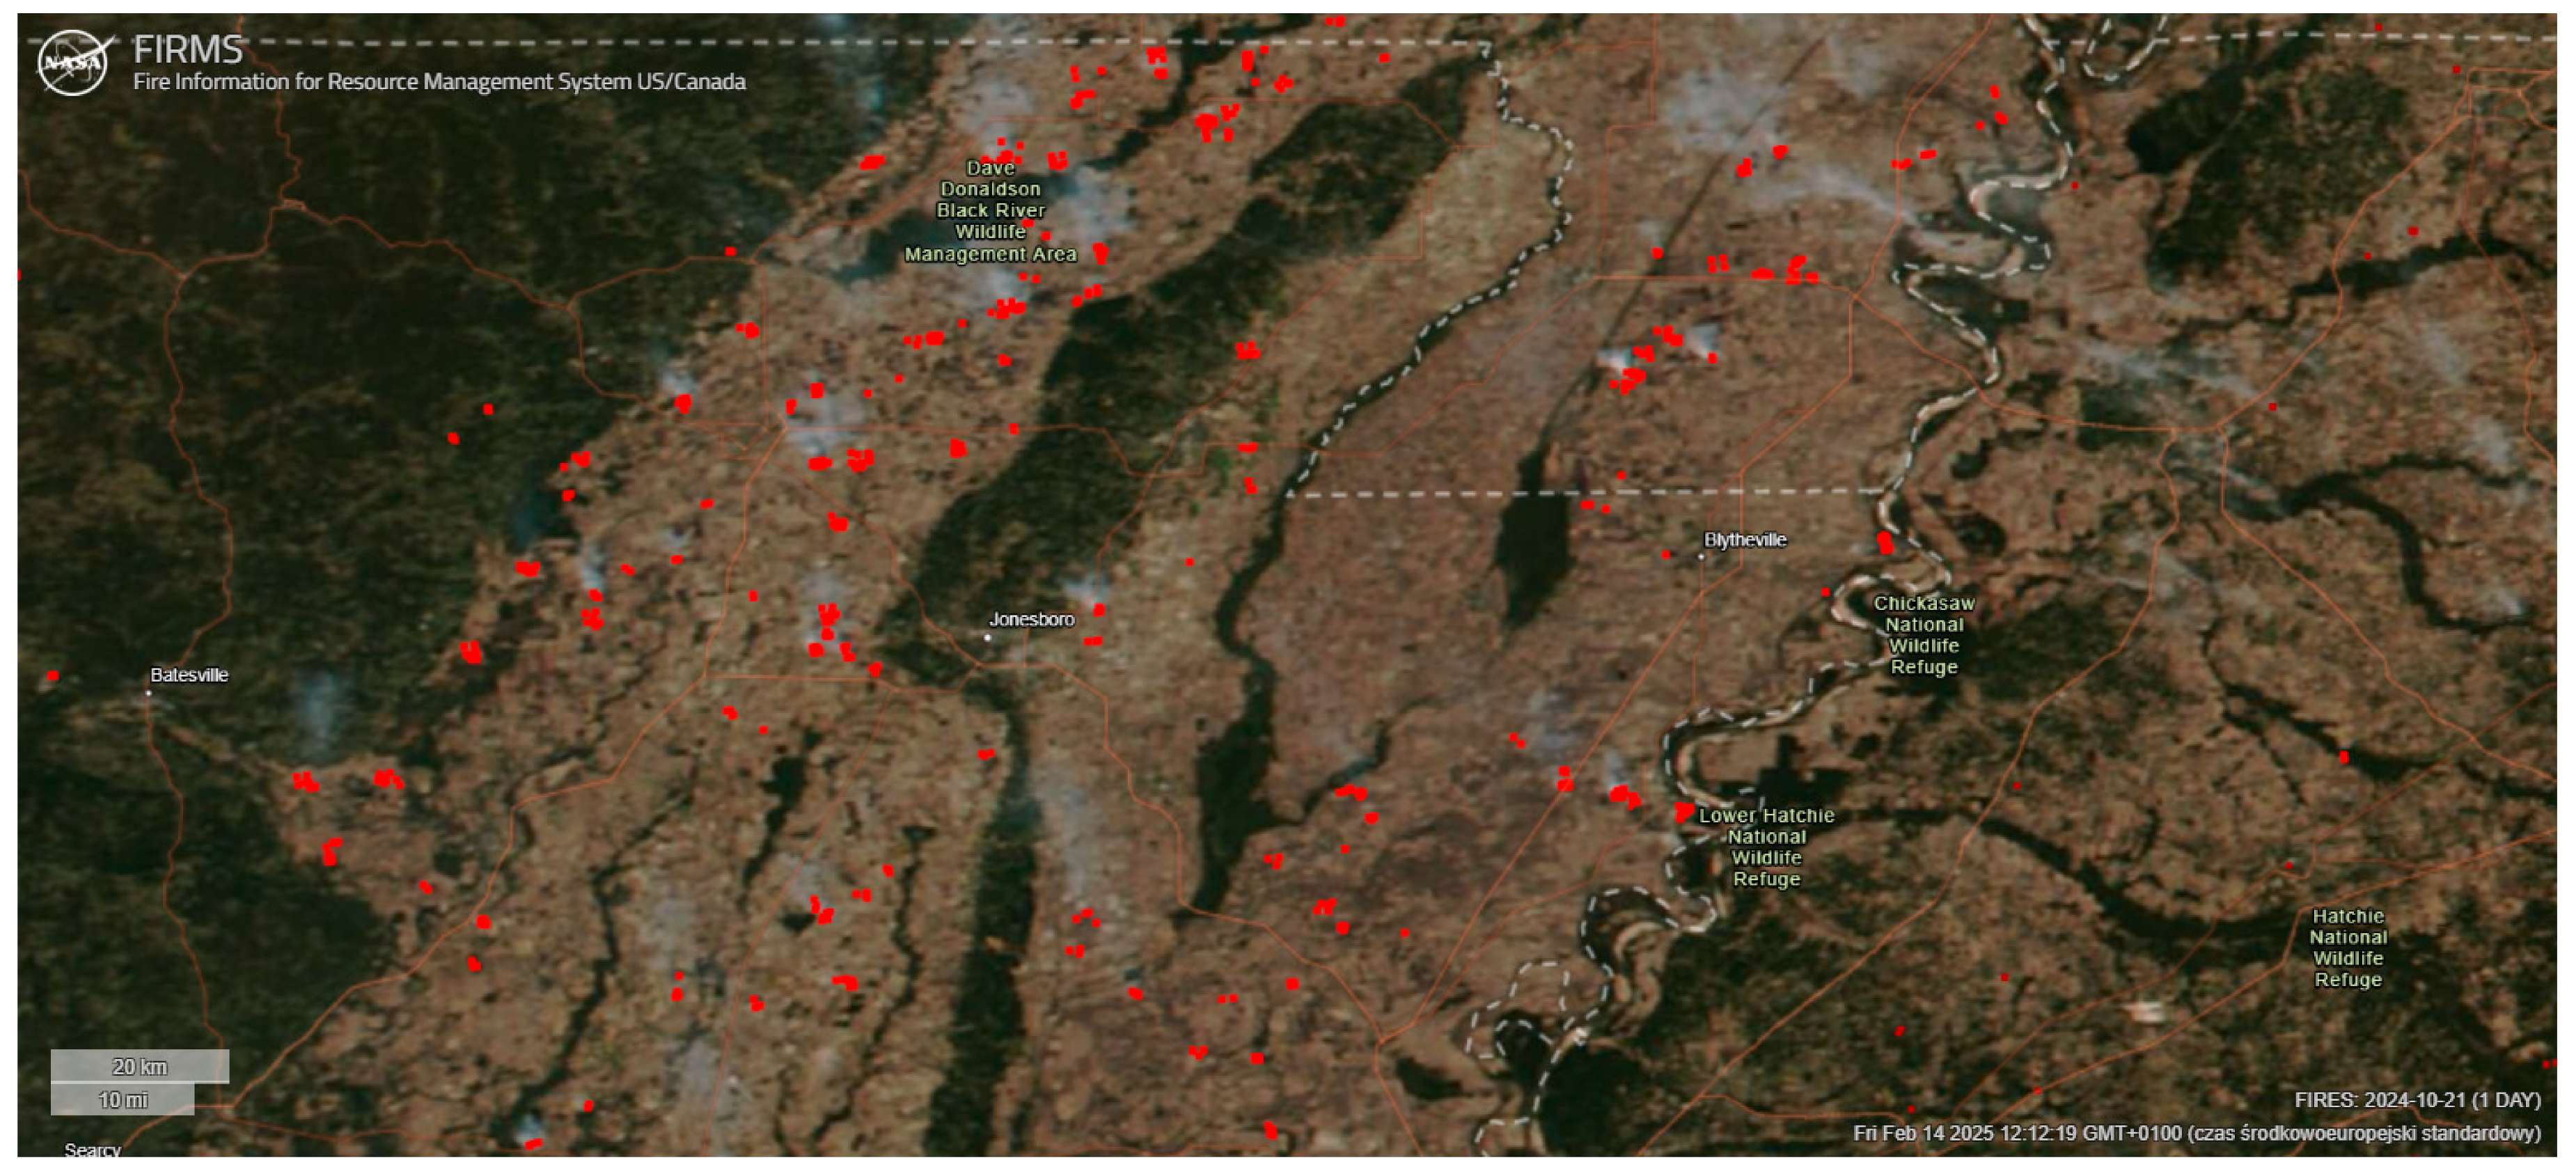 | 3042 px/0.2868% |
| 24 October 2024 | 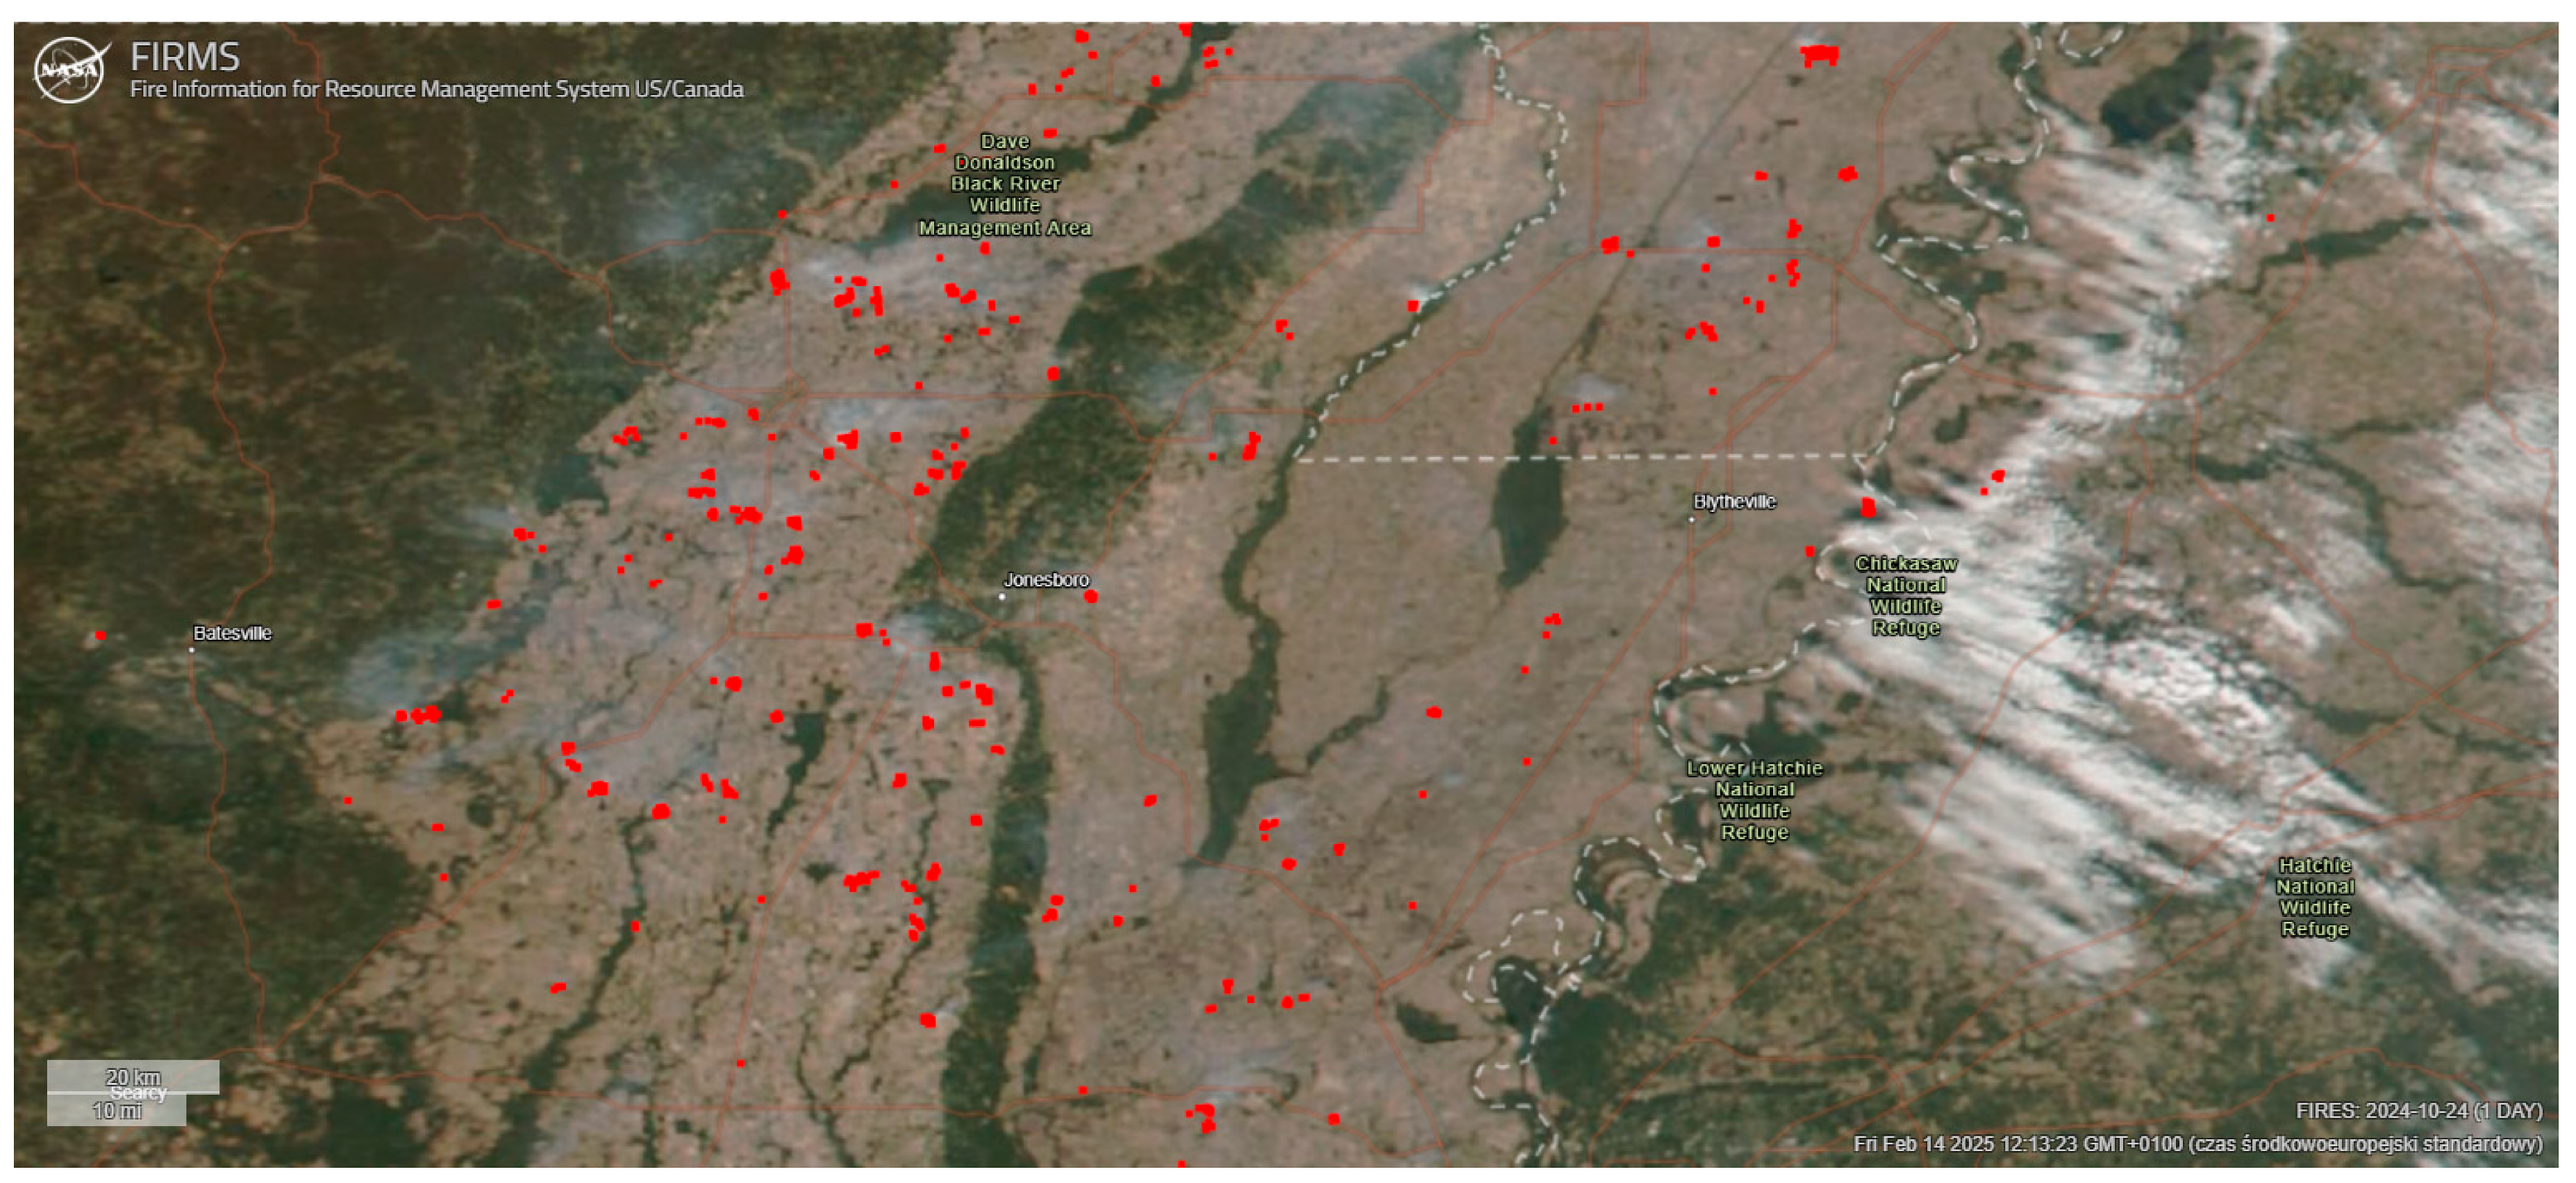 | 2954 px/0.2785% |
| 29 October 2024 |  | 2804 px/0.2644% |
| Date | Pollution | Burned Area (A), ha | Emission Factor (EFpollutant), kg/kg s.m. | Emission of Pollutants (Epollutant), Tones |
|---|---|---|---|---|
| 18 October 2024 | TSP | 44,453.78 | 0.006 (0.002) | 0.267 |
| PM10 | 0.0062 (0.002) | 0.276 | ||
| PM2.5 | 0.006 (0.002) | 0.267 | ||
| 21 October 2024 | TSP | 51,126.05 | 0.006 (0.002) | 0.307 |
| PM10 | 0.0062 (0.002) | 0.317 | ||
| PM2.5 | 0.006 (0.002) | 0.298 | ||
| 24 October 2024 | TSP | 49,647.06 | 0.006 (0.002) | 0.308 |
| PM10 | 0.0062 (0.002) | 0.298 | ||
| PM2.5 | 0.006 (0.002) | 0.283 | ||
| 29 October 2024 | TSP | 47,126.05 | 0.006 (0.002) | 0.292 |
| PM10 | 0.0062 (0.002) | 0.283 | ||
| PM2.5 | 0.006 (0.002) | 0.307 |
| Date | Bitmap of the Scanned Image | Percentage of Fire Coverage, % |
|---|---|---|
| 19 April 2021 | 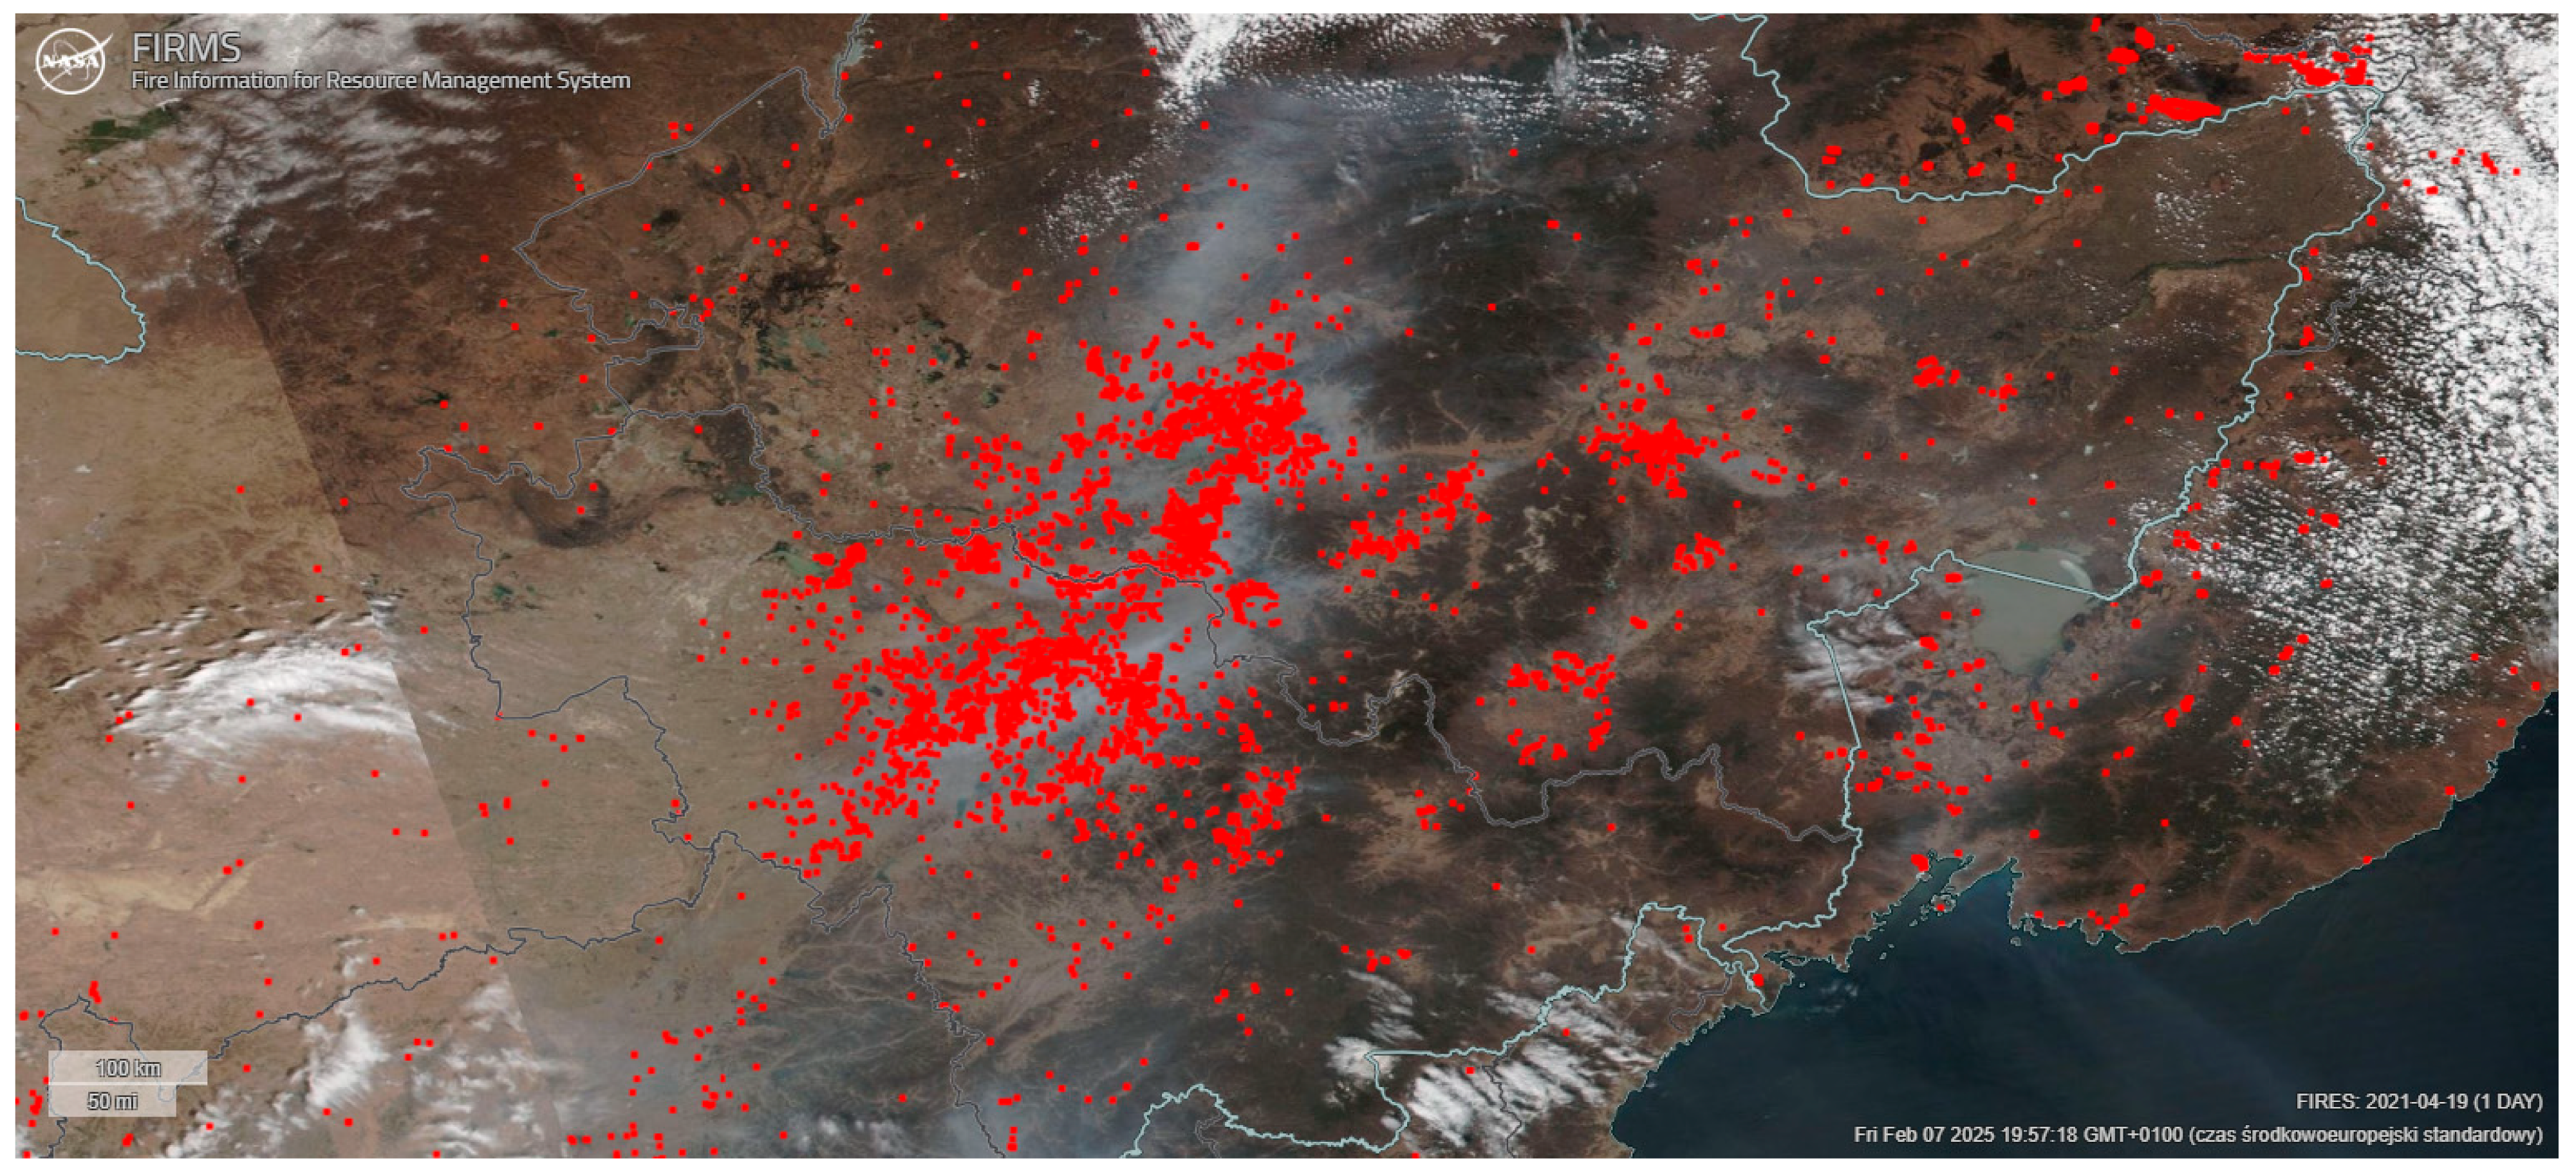 | 12,029 px/1.1341% |
| 20 April 2021 | 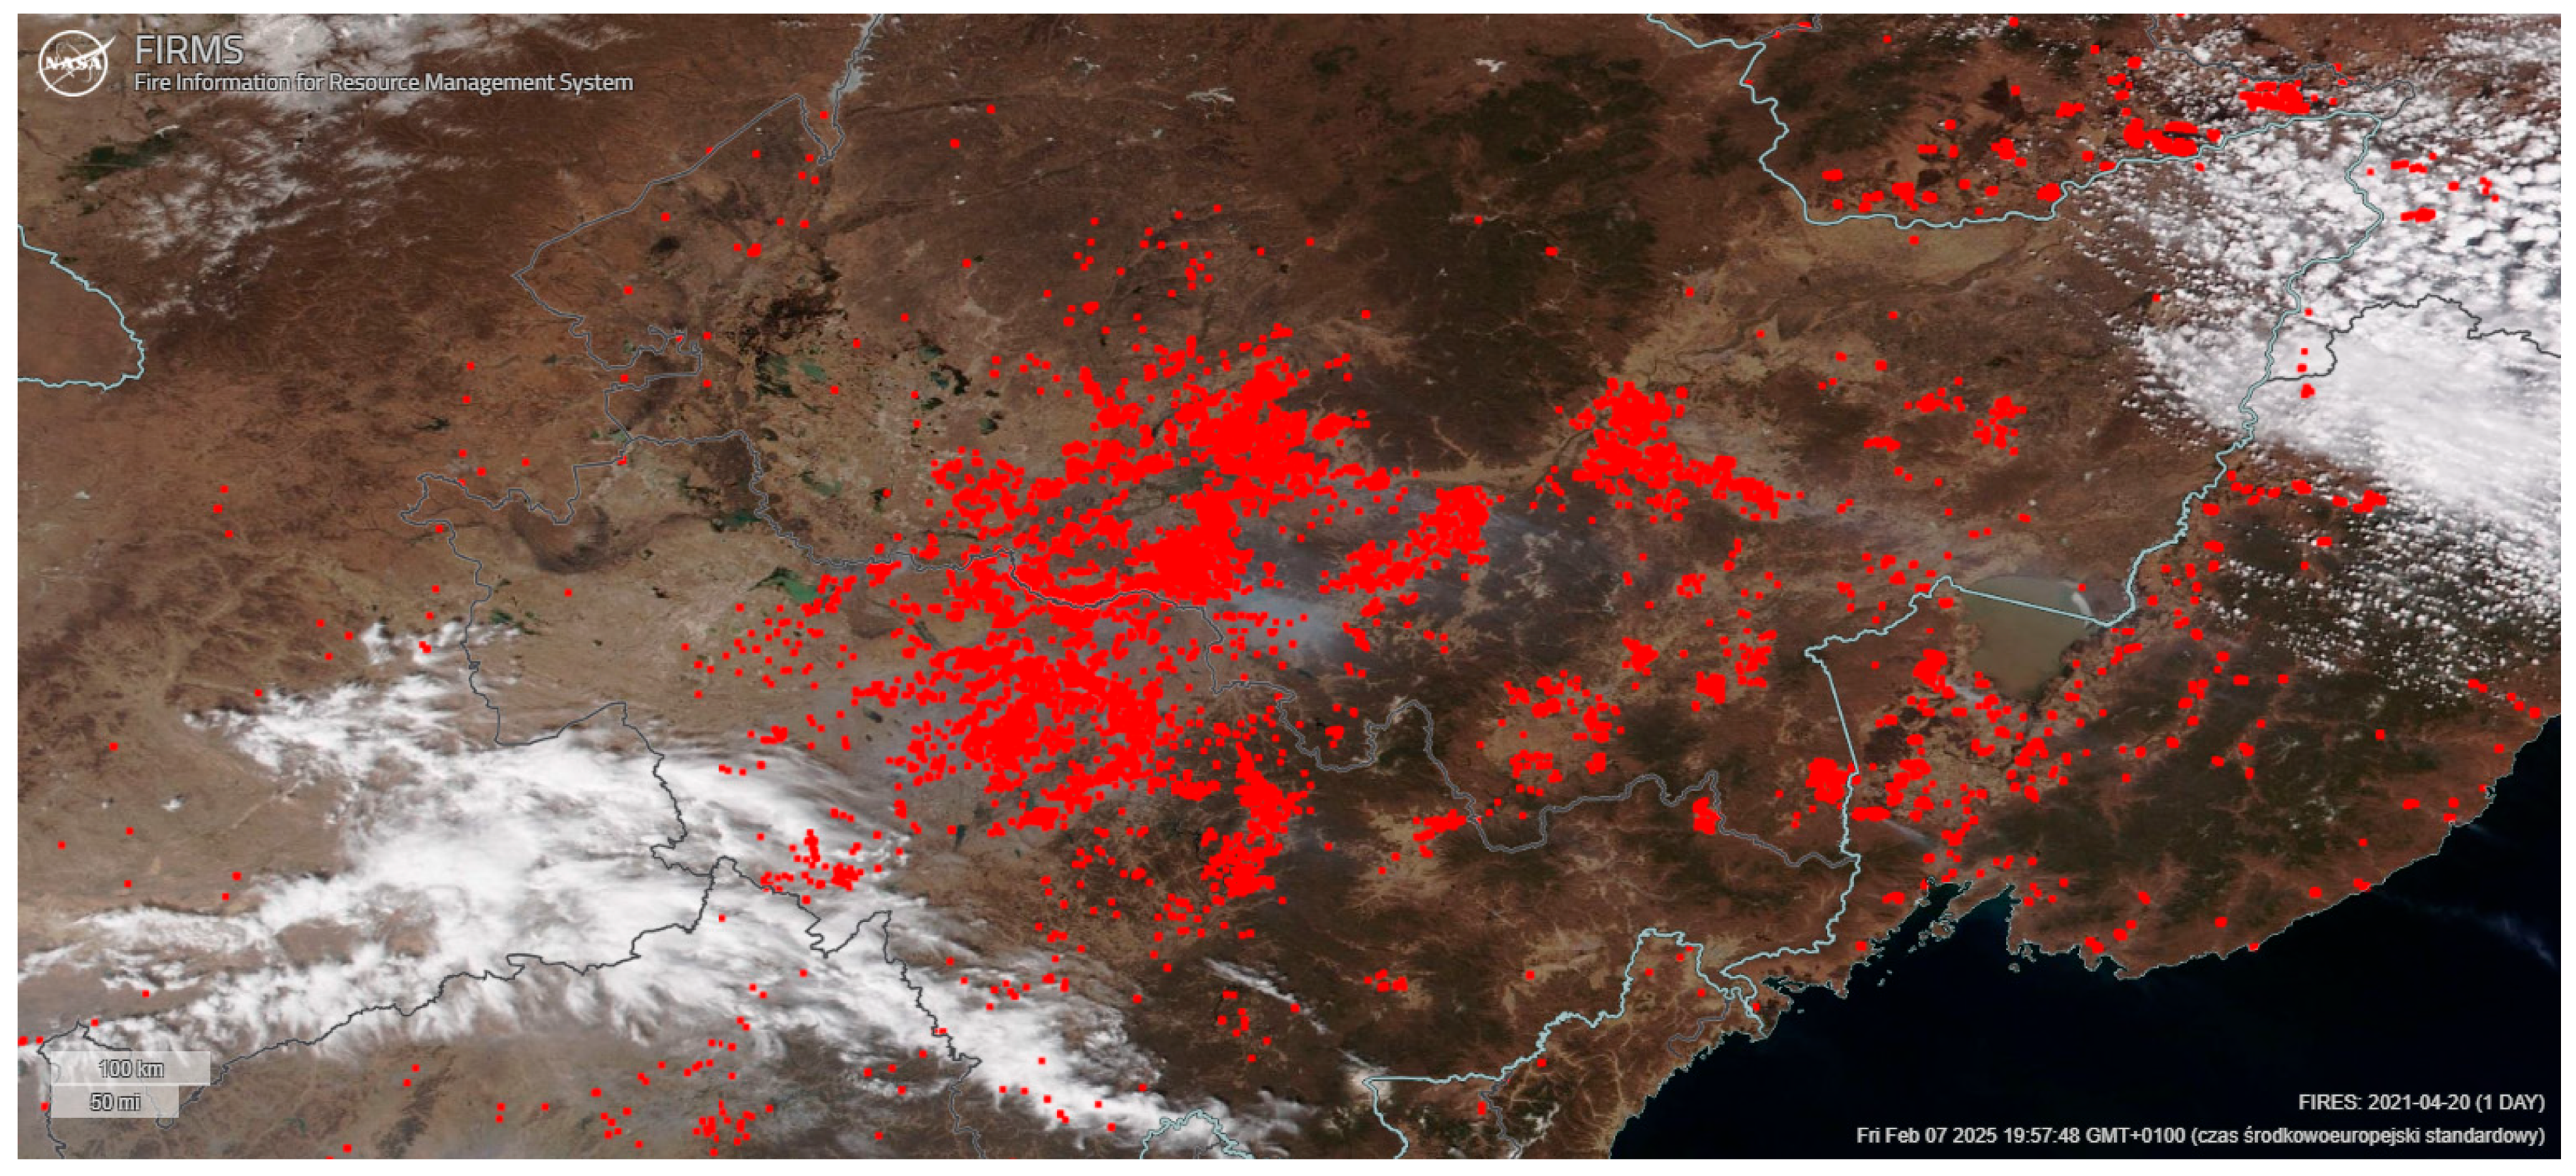 | 19,899 px/1.8761% |
| 21 April 2021 |  | 26,923 px/2.5383% |
| Date | Pollution | Burned Area (A), ha | Emission Factor (EFpollutant), kg/kg s.m. | Emission of Pollutants (Epollutant), Tones |
|---|---|---|---|---|
| 19 April 2021 | TSP | 1,253,020.83 | 0.0058 (0.003) | 7.268 |
| PM10 | 0.0058 (0.003) | 7.268 | ||
| PM2.5 | 0.0055 (0.003) | 6.892 | ||
| 20 April 2021 | TSP | 2,072,812.50 | 0.0058 (0.003) | 12.022 |
| PM10 | 0.0058 (0.003) | 12.022 | ||
| PM2.5 | 0.0055 (0.003) | 11.400 | ||
| 21 April 2021 | TSP | 2,804,479.17 | 0.0058 (0.003) | 16.266 |
| PM10 | 0.0058 (0.003) | 16.266 | ||
| PM2.5 | 0.0055 (0.003) | 15.425 |
Disclaimer/Publisher’s Note: The statements, opinions and data contained in all publications are solely those of the individual author(s) and contributor(s) and not of MDPI and/or the editor(s). MDPI and/or the editor(s) disclaim responsibility for any injury to people or property resulting from any ideas, methods, instructions or products referred to in the content. |
© 2025 by the authors. Licensee MDPI, Basel, Switzerland. This article is an open access article distributed under the terms and conditions of the Creative Commons Attribution (CC BY) license (https://creativecommons.org/licenses/by/4.0/).
Share and Cite
Dobosz, B.; Roman, K.; Grzegorzewska, E. An Estimation Model of Emissions from Burning Areas Based on the Tier Method. Remote Sens. 2025, 17, 1264. https://doi.org/10.3390/rs17071264
Dobosz B, Roman K, Grzegorzewska E. An Estimation Model of Emissions from Burning Areas Based on the Tier Method. Remote Sensing. 2025; 17(7):1264. https://doi.org/10.3390/rs17071264
Chicago/Turabian StyleDobosz, Barbara, Kamil Roman, and Emilia Grzegorzewska. 2025. "An Estimation Model of Emissions from Burning Areas Based on the Tier Method" Remote Sensing 17, no. 7: 1264. https://doi.org/10.3390/rs17071264
APA StyleDobosz, B., Roman, K., & Grzegorzewska, E. (2025). An Estimation Model of Emissions from Burning Areas Based on the Tier Method. Remote Sensing, 17(7), 1264. https://doi.org/10.3390/rs17071264


