Article

Change Patterns of Ecological Vulnerability and Its Dominant Factors in Mongolia During 2000–2022

1
School of Space Science and Technology, Shandong University, Weihai 264209, China
2
School of Civil Engineering and Geomatics, Shandong University of Technology, Zibo 255000, China
3
State Key Laboratory of Resources and Environmental Information System, Institute of Geographic Sciences and Natural Resources Research, Chinese Academy of Sciences, Beijing 100101, China
*
Author to whom correspondence should be addressed.
These authors contributed equally to this work.
Remote Sens. 2025, 17(7), 1248; https://doi.org/10.3390/rs17071248
Submission received: 8 February 2025 / Revised: 21 March 2025 / Accepted: 28 March 2025 / Published: 1 April 2025
(This article belongs to the Special Issue Recent Advances in Remote Sensing of Soil Science)

Abstract

:
Under global climate change, the ecological vulnerability issue in Mongolia has become increasingly severe. However, the change process of the ecological environment and the dominant driving factors in different periods and sub-regions of Mongolia are not clear. In this paper, we propose a new ecological vulnerability index for Mongolia using MODIS data, combined with the Geographical Detector and the gravity center model, to reveal the spatiotemporal changes and driving mechanisms of ecological vulnerability in Mongolia from 2000 to 2022. The results show the following: (1) the newly proposed remote sensing ecological vulnerability index has high applicability in ecosystems mainly in Mongolia, with an accuracy rate of 89.39%; (2) Mongolia belongs to the category of moderate vulnerability, with an average ecological vulnerability index of 1.57, and the center of vulnerability is shifting toward the southwest direction; (3) Tmax is the leading driving factor of ecological vulnerability in Mongolia, especially at high altitudes and in arid regions, where it directly affects vegetation growth, desertification, and water availability. The dominant interactive factors have shifted from Tmax ∩ Tmin to Tmin ∩ PRE, with PRE being the leading factor in the eastern, central, and southern regions of Mongolia, Tmax being the leading factor in the western region, and Tmin being the leading factor in the northwestern region. This study provides an index system for constructing the ecological vulnerability system in Mongolia and offers scientific references for the regional protection of the ecological environment in Mongolia.

Graphical Abstract

1. Introduction

Ecological environmental vulnerability has now become a major issue for the ecological environment of many countries. Under the dual influence of global climate change and human activities, a series of environmental problems have been triggered, such as extreme climate events, frequent natural disasters, land degradation, a reduction in vegetation productivity, the loss of biodiversity, the disruption of water resource patterns, and the melting of glaciers [1]. Once the ecological environment is damaged, it is difficult for it to self–repair. Therefore, ecological vulnerability is an important analytical factor for environmental protection and planning, as well as sustainable development [2].
Currently, ecologically fragile areas are mainly concentrated in arid regions [3], mountainous areas [4], agricultural areas [5], and some riverside and coastal areas [6,7]. Recent studies have focused on tourist areas [8], mining production [9], and areas near water bodies [10] to protect local biodiversity. The current research methods for the vulnerability of ecological areas are mainly two types: the characteristic index method and the indicator evaluation method [11]. The index system method evaluates ecological vulnerability by constructing a hierarchical index system. The existing ecological vulnerability index evaluation models mainly include the Pressure–State–Response (PSR) model [12], the Vulnerability Scoping Diagram (VSD) model [13], the Sensitivity–Resilience–Pressure (SRP) model [14], the Social–Environmental System (SES) model [15], and the Driver–Pressure–State–Impact–Response (DPSIR) model [16]. In Mongolia, where desertification and land degradation are prominent, ecological vulnerability assessments often incorporate climate, topography, biological, and environmental factors [17]. The WAE Shah Vulnerability and Risk Assessment Framework, using the Global Delta Risk Index (GDRI) and Vulnerability and Risk Assessment Framework in the context of Nature–Based Solutions, along with the SRP–coupled SES model by Huang B et al., are useful for assessing ecological vulnerability [18,19]. Zhang et al. developed indicators based on ecological services and entropy to analyze vulnerability in the Yellow River region [20]. These models are effective for analyzing socio–ecological interactions and can provide insights for Mongolia. However, they require large datasets and high computational complexity, which is challenging due to limited data availability in Mongolia. The allocation of index weights is also a primary factor affecting the results of ecological vulnerability assessment [21]. Spirasteh et al. applied machine learning and the fuzzy analytic hierarchy process to study mountain hazards [22], DJ Abson used principal component analysis to calculate the vulnerability index of the African region [23], and Q Tang et al. employed genetic projection tracking for urban ecological vulnerability assessment [24]. These traditional methods exhibit significant subjectivity. In contrast, PCA effectively accounts for the varying contributions of factors over time and remains applicable in data–limited contexts, making it particularly suitable for ecological vulnerability assessments in Mongolia.
Mongolia is a hotspot area for global desertification [25]. As temperatures rise and precipitation decreases [26], Mongolia’s natural grasslands are becoming more and more dense due to the dual effects of natural and human activities [27]. Over the past few decades, under the pressure of global changes in the ecosystem, the impact of human activities, and the lack of long–term sequence data, the main driving factors of ecological vulnerability in Mongolia are still unclear.
Due to challenges in obtaining high–resolution ecological data for Mongolia, this study utilizes MODIS09A1 and MODIS11A2 satellite data to derive key ecological indicators. Principal component analysis (PCA) is employed to develop a remote sensing ecological vulnerability index (RSEVI), assessing ecological vulnerability in Mongolia from 2000 to 2022. The RSEVI provides valuable insights into the spatiotemporal evolution of ecological vulnerability, serving as a foundation for ecological protection and sustainable development strategies in the region.

2. Materials and Methods
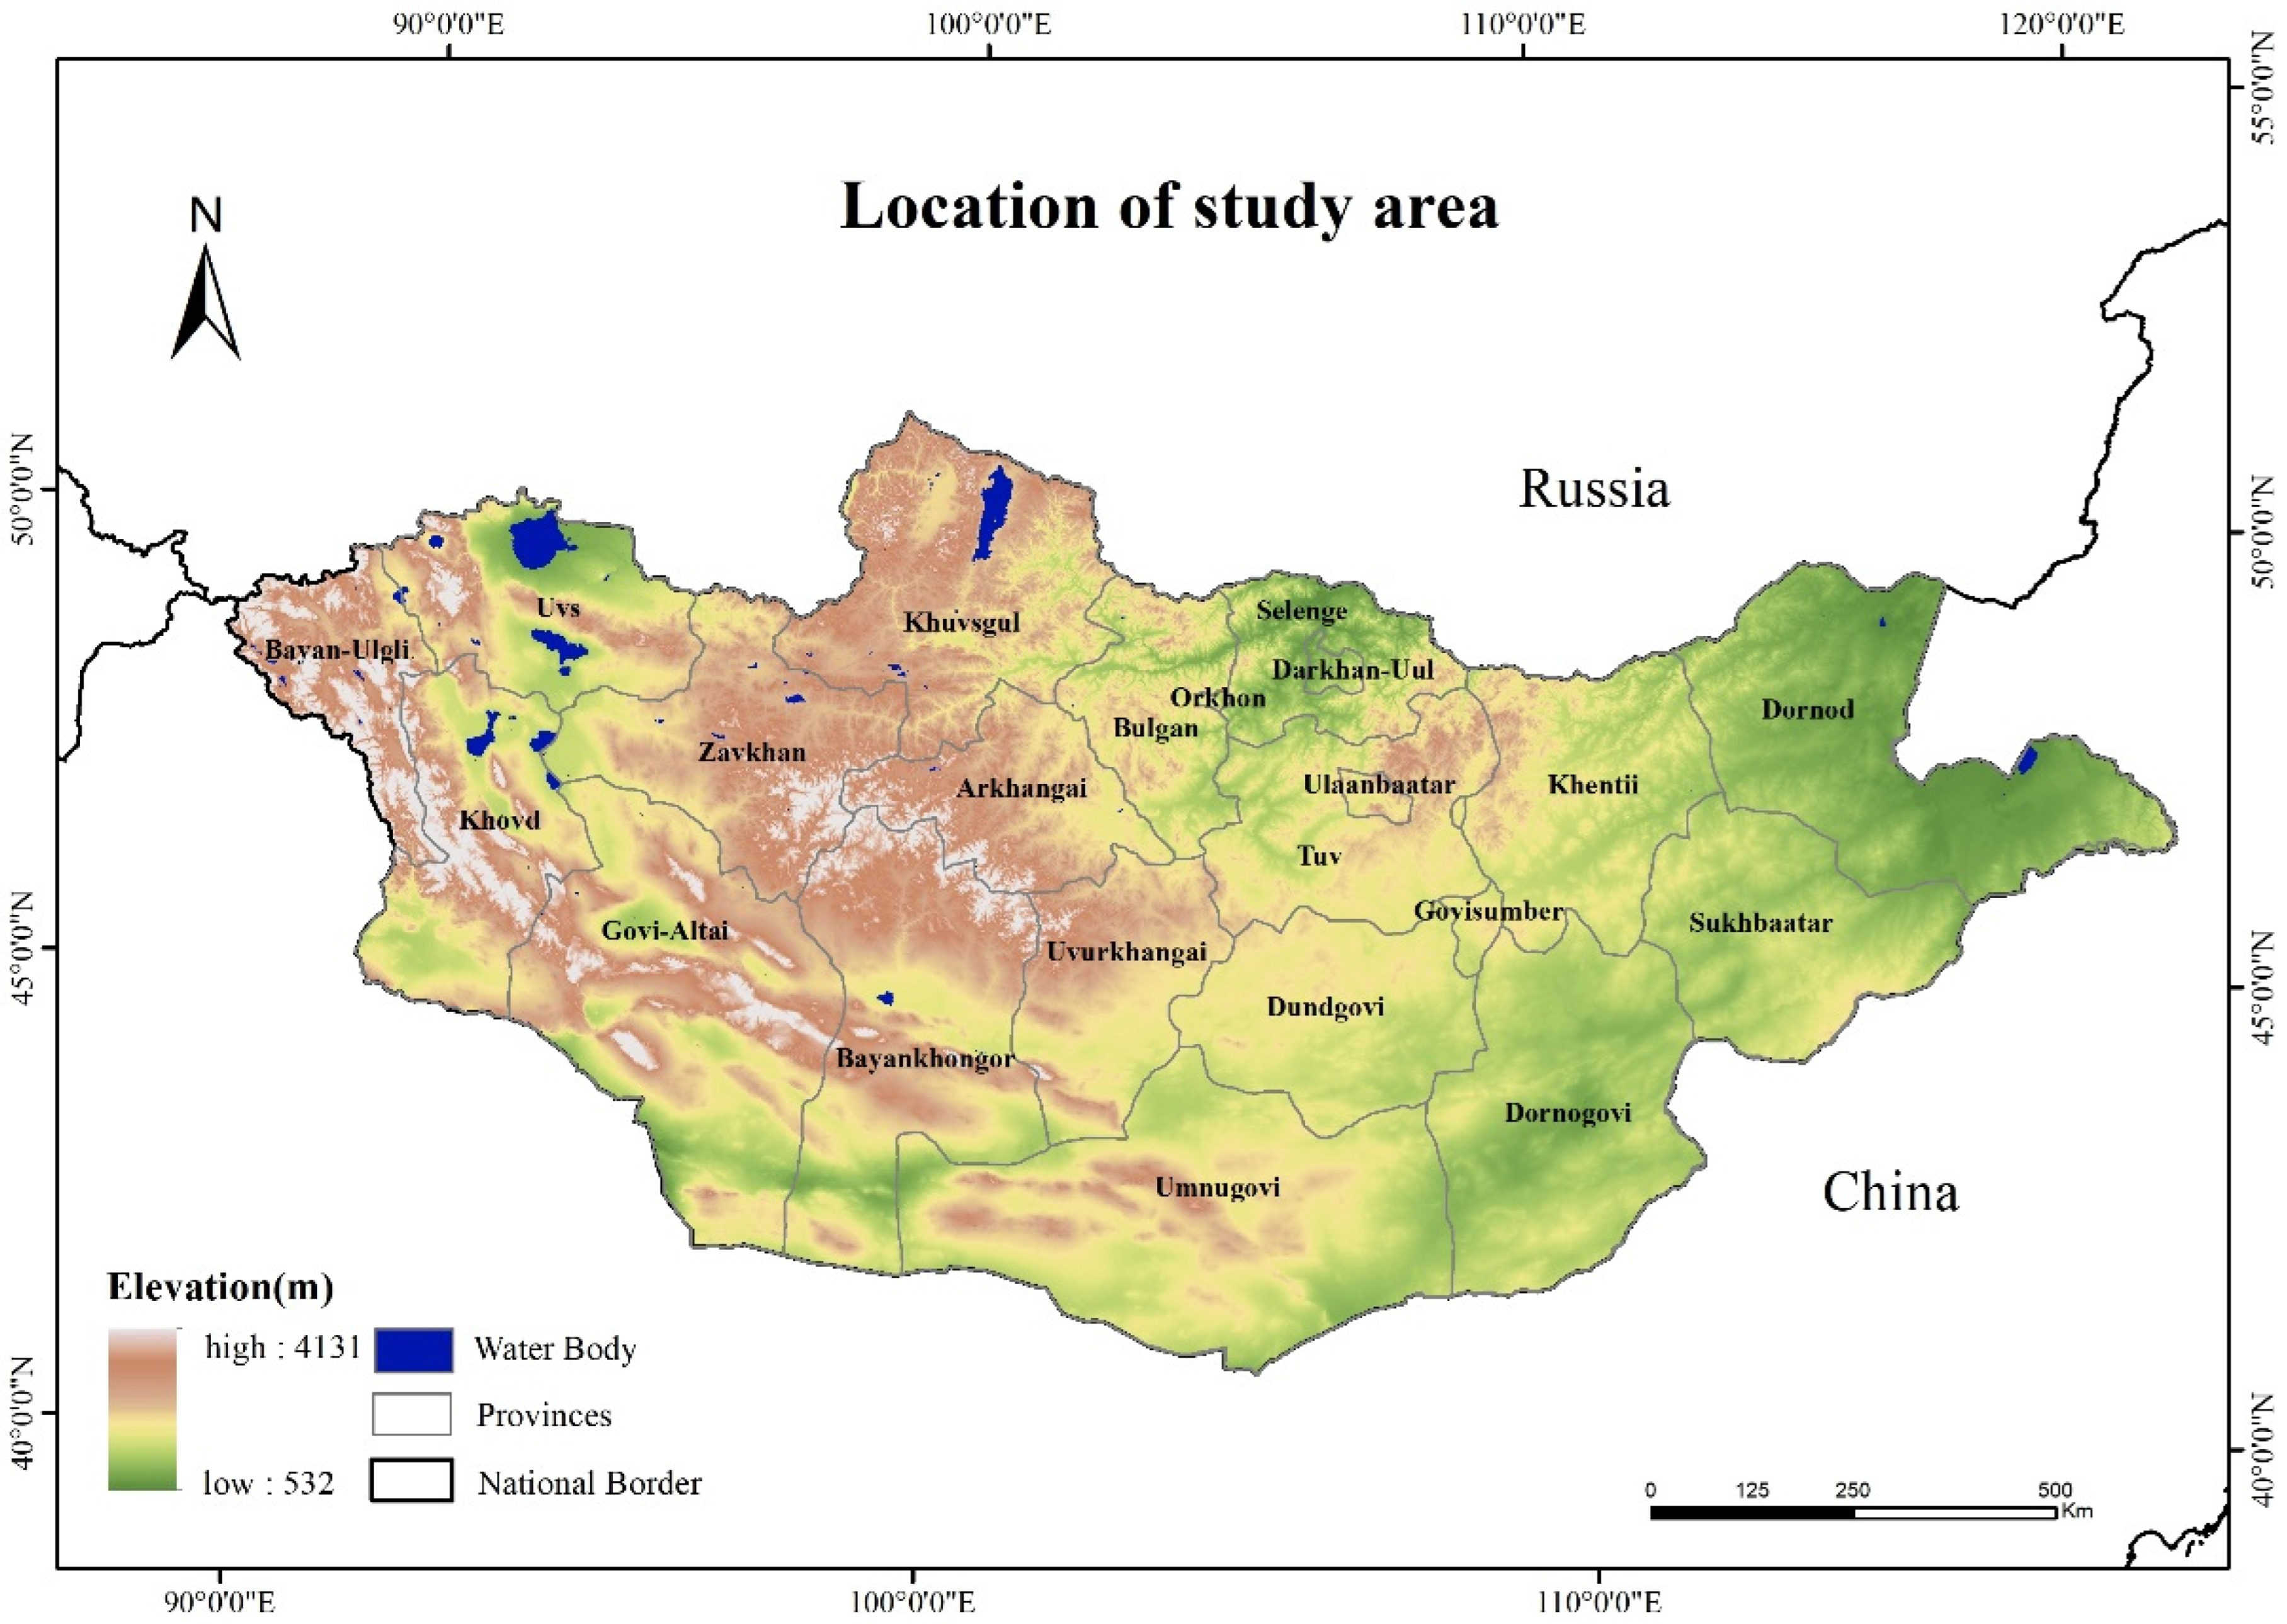
2.1. Study Area

As shown in Figure 1, Mongolia is located in East Asia, with a land area of about 156.65 × 10⁴ km2. It is the second largest landlocked country in the world [28]. Mongolia is located in East Asia, with a land area of about 156.65 × 10⁴ km2. It is the second largest landlocked country in the world [29]. Mongolia has a high terrain, with an average altitude of about 1580 m. The soil layer is thick, and the main soil types are chestnut black soil and saline–alkali soil [30]. About 71.8% of Mongolia faces degradation or desertification due to climate change and human activities like overgrazing, deforestation, unsustainable farming, and mining, leading to soil erosion, desertification, and dust storms [31,32]. This degradation affects plant diversity, accelerates erosion, and lowers land productivity [17].

2.2. Data Resources

MODIS data are from the U.S. National Aeronautics and Space Administration (NASA) (https://ladsweb.modaps.eosdis.nasa.gov (accessed on 27 March 2025)) covering 1 June to 31 October between 2000 and 2022, including MOD09 A1, MOD11A2, and MOD12Q1. The spatial resolutions of these three products are 500 m, 1000 m, and 1000 m, respectively, and their temporal resolution is 8 days. The MODIS Reprojection Tool (MRT) [33] is utilized to perform resampling, reprojection, and mosaicking on two of the MODIS products, resulting in standardized images with a projection type of Krasovsky 1940–Albers and a spatial resolution of 1000 m. Other meteorological data for Mongolia are provided in the following Table 1.

2.3. Principal Component Analysis

Principal component analysis (PCA) is a common dimensionality reduction method that compresses high–dimensional data into a lower–dimensional space while preserving maximum variance [34]. In the article, seven indicators, including NDVI (Normalized Difference Vegetation Index), SMI (Soil Moisture Index), LST (Land Surface Temperature), Albedo, SI (Slope Index), and TGSI (Topsoil Grain Size Index), HDI (Human Disturbance Index) were combined to analyze the ecological vulnerability of Mongolia.

2.4. Kappa Coefficient
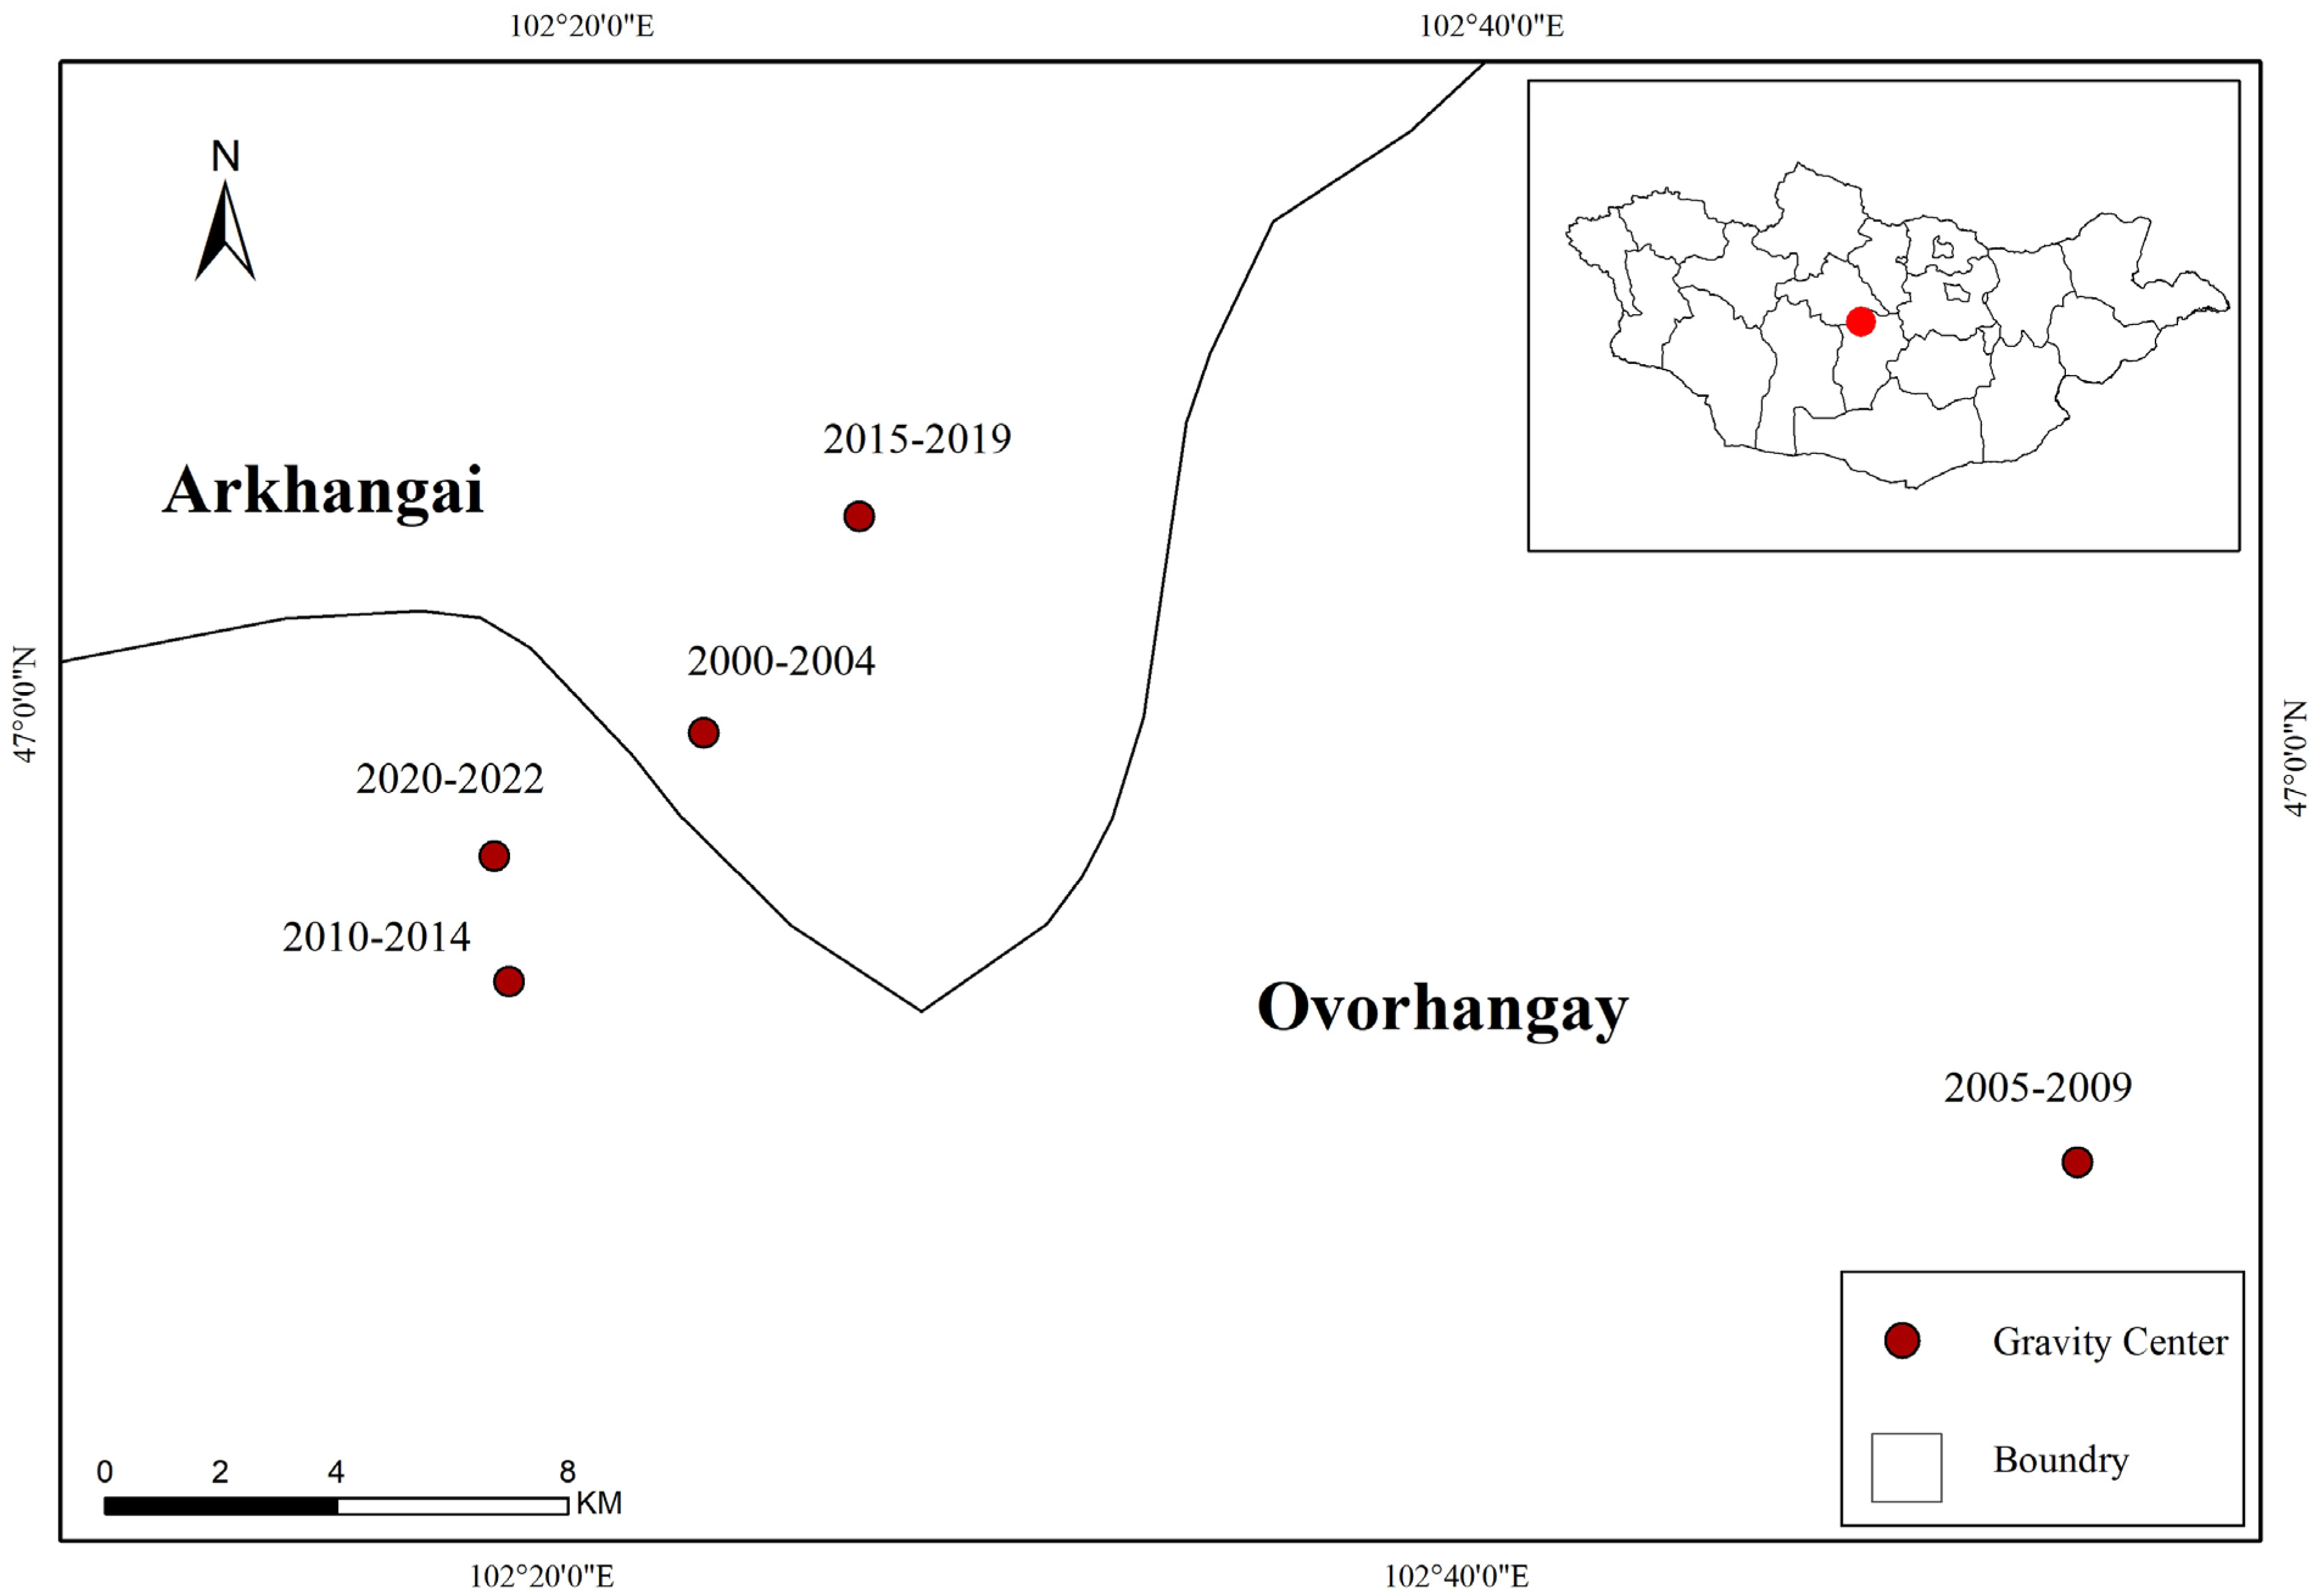
The Kappa coefficient measures classification accuracy and consistency with observed values [35]. To verify the accuracy of the retrieved ecological vulnerability index for Mongolia, this study selected 245 sample points from Mongolia in 2022 to validate the accuracy of the ecological vulnerability index. Based on the sample points and evaluation results provided by Google Earth, the Kappa coefficient was calculated. In this study, the Kappa coefficient was utilized to verify the accuracy of the ecological vulnerability index classification results.
P o = i = 1 C T i n
P e = i = 1 C a i × b i n 2
K = P o P e 1 P e
In the formula, n is the total number of samples, C is the total number of categories, Ti is the number of correctly classified samples for each category, ai is the sum of the number of samples in row i, and bi is the sum of the number of samples in column i.

2.5. Gravity Center

The gravity center represents the balanced point of mass within an area, reflecting spatial changes in various elements. As these elements shift, the gravity center’s movement indicates the spatial trajectory of regional development. The calculation formula is
x ¯ = i = 1 n Z i x i i = 1 n Z i
y ¯ = i = 1 n Z i y i i = 1 n Z i
In the formula, Z i is the attribute value of the ecological vulnerability in the i year, ( x i , y i ) is the latitude and longitude coordinate value of the i point, and the points ( x , j ) are the latitude and longitude coordinates of the gravity center of the ecological vulnerability after the calculation of the n points.

2.6. Geo–Detector Model

Desertification in Mongolia is driven by complex natural and human factors, making it difficult to identify key drivers. The Geographical Detector tests the spatial heterogeneity of single factors and assesses whether their combined effect strengthens or weakens the explanatory power of the dependent variable [36]. In this study, the dependent variable (Y) represents Mongolia’s ecological vulnerability, while the independent variables (X) include precipitation, DEM, maximum and minimum temperature, land use, and nightlight index The Factor Detector uses the q value to measure explanatory power and evaluates the spatial distribution of ecological vulnerability in 2000, 2010, and 2020, The calculation method is:
q = 1 h = 1 L N h σ h 2 N σ 2 = 1 W SS T SS
W SS = h = 1 L N h σ h 2
T ss = N σ 2
In the formula, h is the layer or partition of the independent variable Y and the dependent variable X; Nh is the number of units in layer h; N is the number of units in the whole region; σ h 2 is the variance of the Y value in the h layer; σ 2 is the variance of the Y value of the whole region. Wss is the sum of variance of each layer; Tss is the total variance of the whole region. q [ 0 , 1 ] , the greater the q value, the stronger the explanatory power of X to Y.

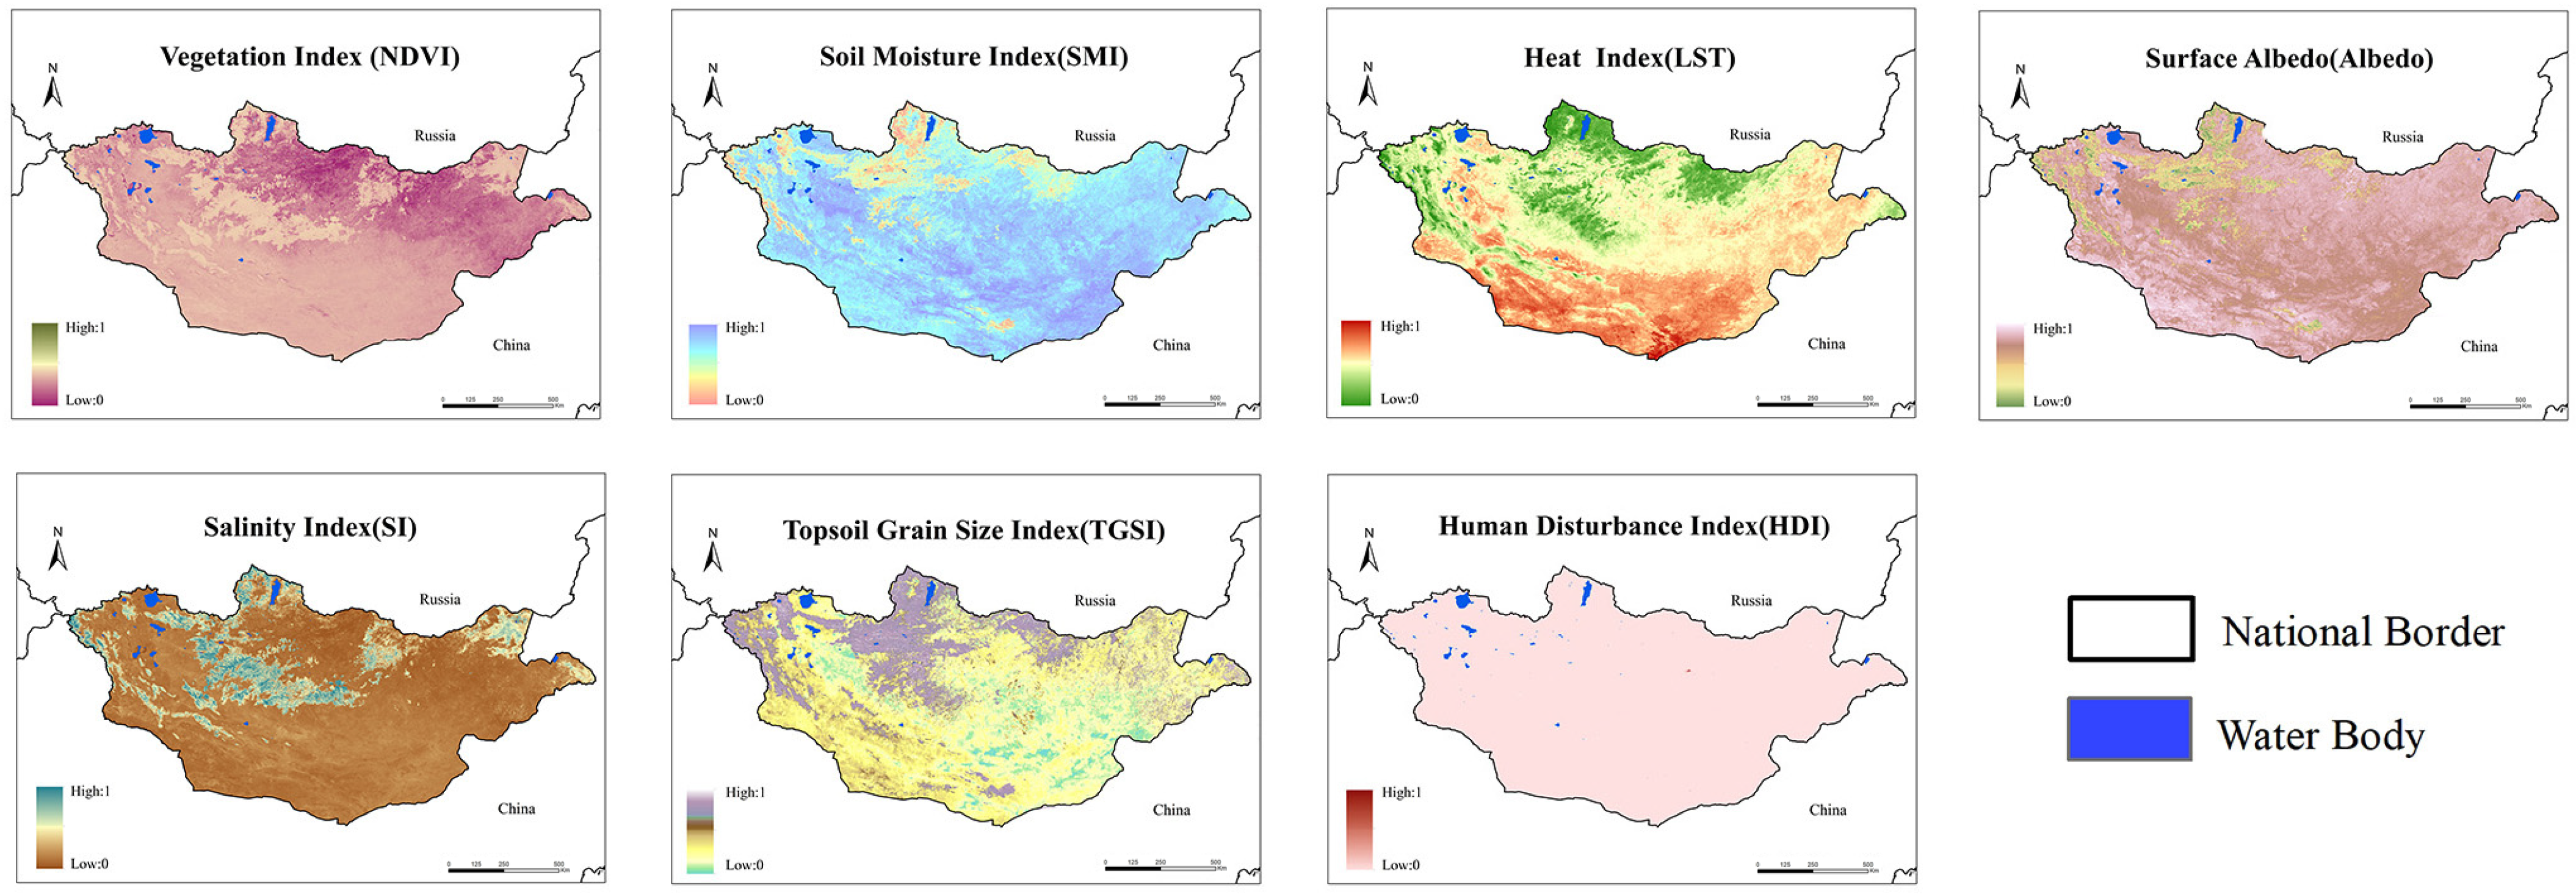
2.7. Ecological Vulnerability Indicators

2.7.1. Vegetation Index

Vegetation indices are indicators of the distribution and activity of surface vegetation. In this article, the Normalized Difference Vegetation Index (NDVI) was used, which is a popular index for vegetation assessment and is also an important parameter for reflecting vegetation vigor and vegetation cover. NDVI has been proven to be correlated with the biophysical variables that control vegetation productivity and land/atmosphere fluxes [37,38]. Figure 2 shows the NDVI for 2020. The calculation formula was as follows:
NDVI = B 2 B 1 B 2 + B 1

2.7.2. Soil Moisture Index

The moisture index reflects the water balance in an ecosystem and serves as a key indicator of hydrological balance. This study uses the Soil Moisture Index (SMI) to describe drought and heavy rainfall conditions [39]. Figure 2 shows the SMI for 2020. The calculation formula was as follows:
SMI = B 6 B 7 B 6 + B 7
In the formula, B6 and B7 are the 6th and 7th bands of MOD09A1, respectively.

2.7.3. Heat Index

Temperature influences vegetation growth and distribution. This study uses Land Surface Temperature (LST) as a heat index, leveraging its negative correlation with NDVI to monitor vegetation in arid regions [39]. LST also impacts heat exchange. Figure 2 shows the LST for 2020. The calculation formula is
LST = 0.02 × N 273.15
In the formula, N refers to the value of the Land Surface Temperature from MOD11A2, and subtracting 273.15 converts the temperature from Kelvin to Celsius.

2.7.4. Land Degradation Index

Due to the impact of climate and human activities, soil desertification, salinization, and other land degradation issues in the Mongolian region are becoming increasingly severe. Based on the severity of the ecological impact of various land degradation problems, this article selects three indicators—surface soil particle size, salinity, and surface Albedo—to analyze the degree of land degradation Figure 2 shows the Albedo, SI, TGSI for 2020. The calculation formula is
Albedo = 0.001 × R
SI = B 1 × B 3
TGSI = B 1 B 3 B 1 + B 3 + B 4
In the formula, R refers to the value of MCD43A3 product data; B1, B3, and B4 are the 1st, 3rd, and 4th bands of MOD09A1, respectively.

2.7.5. Human Disturbance Index

Nighttime light data primarily reflects the positive correlation between population density and GDP, thus serving as a proxy for the intensity of human activities on ecosystems. In this study, the human disturbance index (HDI) is utilized as an indicator derived from nighttime light data. Figure 2 shows the HDI for 2020. The formula for the HDI is as follows:
HDI =   N L D N
In the formula, HDI is the human disturbance index, and N L D N refers to the DN value of night light data.

2.8. Construction of Remote Sensing Ecological Vulnerability Index

2.8.1. Remote Sensing Ecological Vulnerability Index

Based on four indicators—vegetation index, moisture index, heat index, and degree of land degradation, we apply principal component analysis to process these indicators and obtain the remote sensing ecological vulnerability index for Mongolia. The specific calculation formula is as follows:
RSEVI = α 1 × P 1 + α 2 × P 2 + ... + α n × P n
In the formula, RSEVI refers to the remote sensing ecological vulnerability index; α n is the contribution rate of the nth principal component; P n is the nth principal component.

2.8.2. Classification of Ecological Vulnerability Index Using Remote Sensing

To intuitively display and analyze the spatial distribution characteristics of ecological vulnerability at different levels, the remote sensing ecological vulnerability index (RSEVI) is divided into five grades using the Natural Breaks (Jenks) method in ArcGIS 10.7 (Esri, Redlands, CA, USA): an RSEVI of less than 1.4 is classified as slight vulnerability, an RSEVI of less than 2.0 as mild vulnerability, an RSEVI of less than 2.6 as moderate vulnerability, an RSEVI of less than 3.2 as severe vulnerability, and an RSEVI greater than 3.2 as very severe vulnerability.

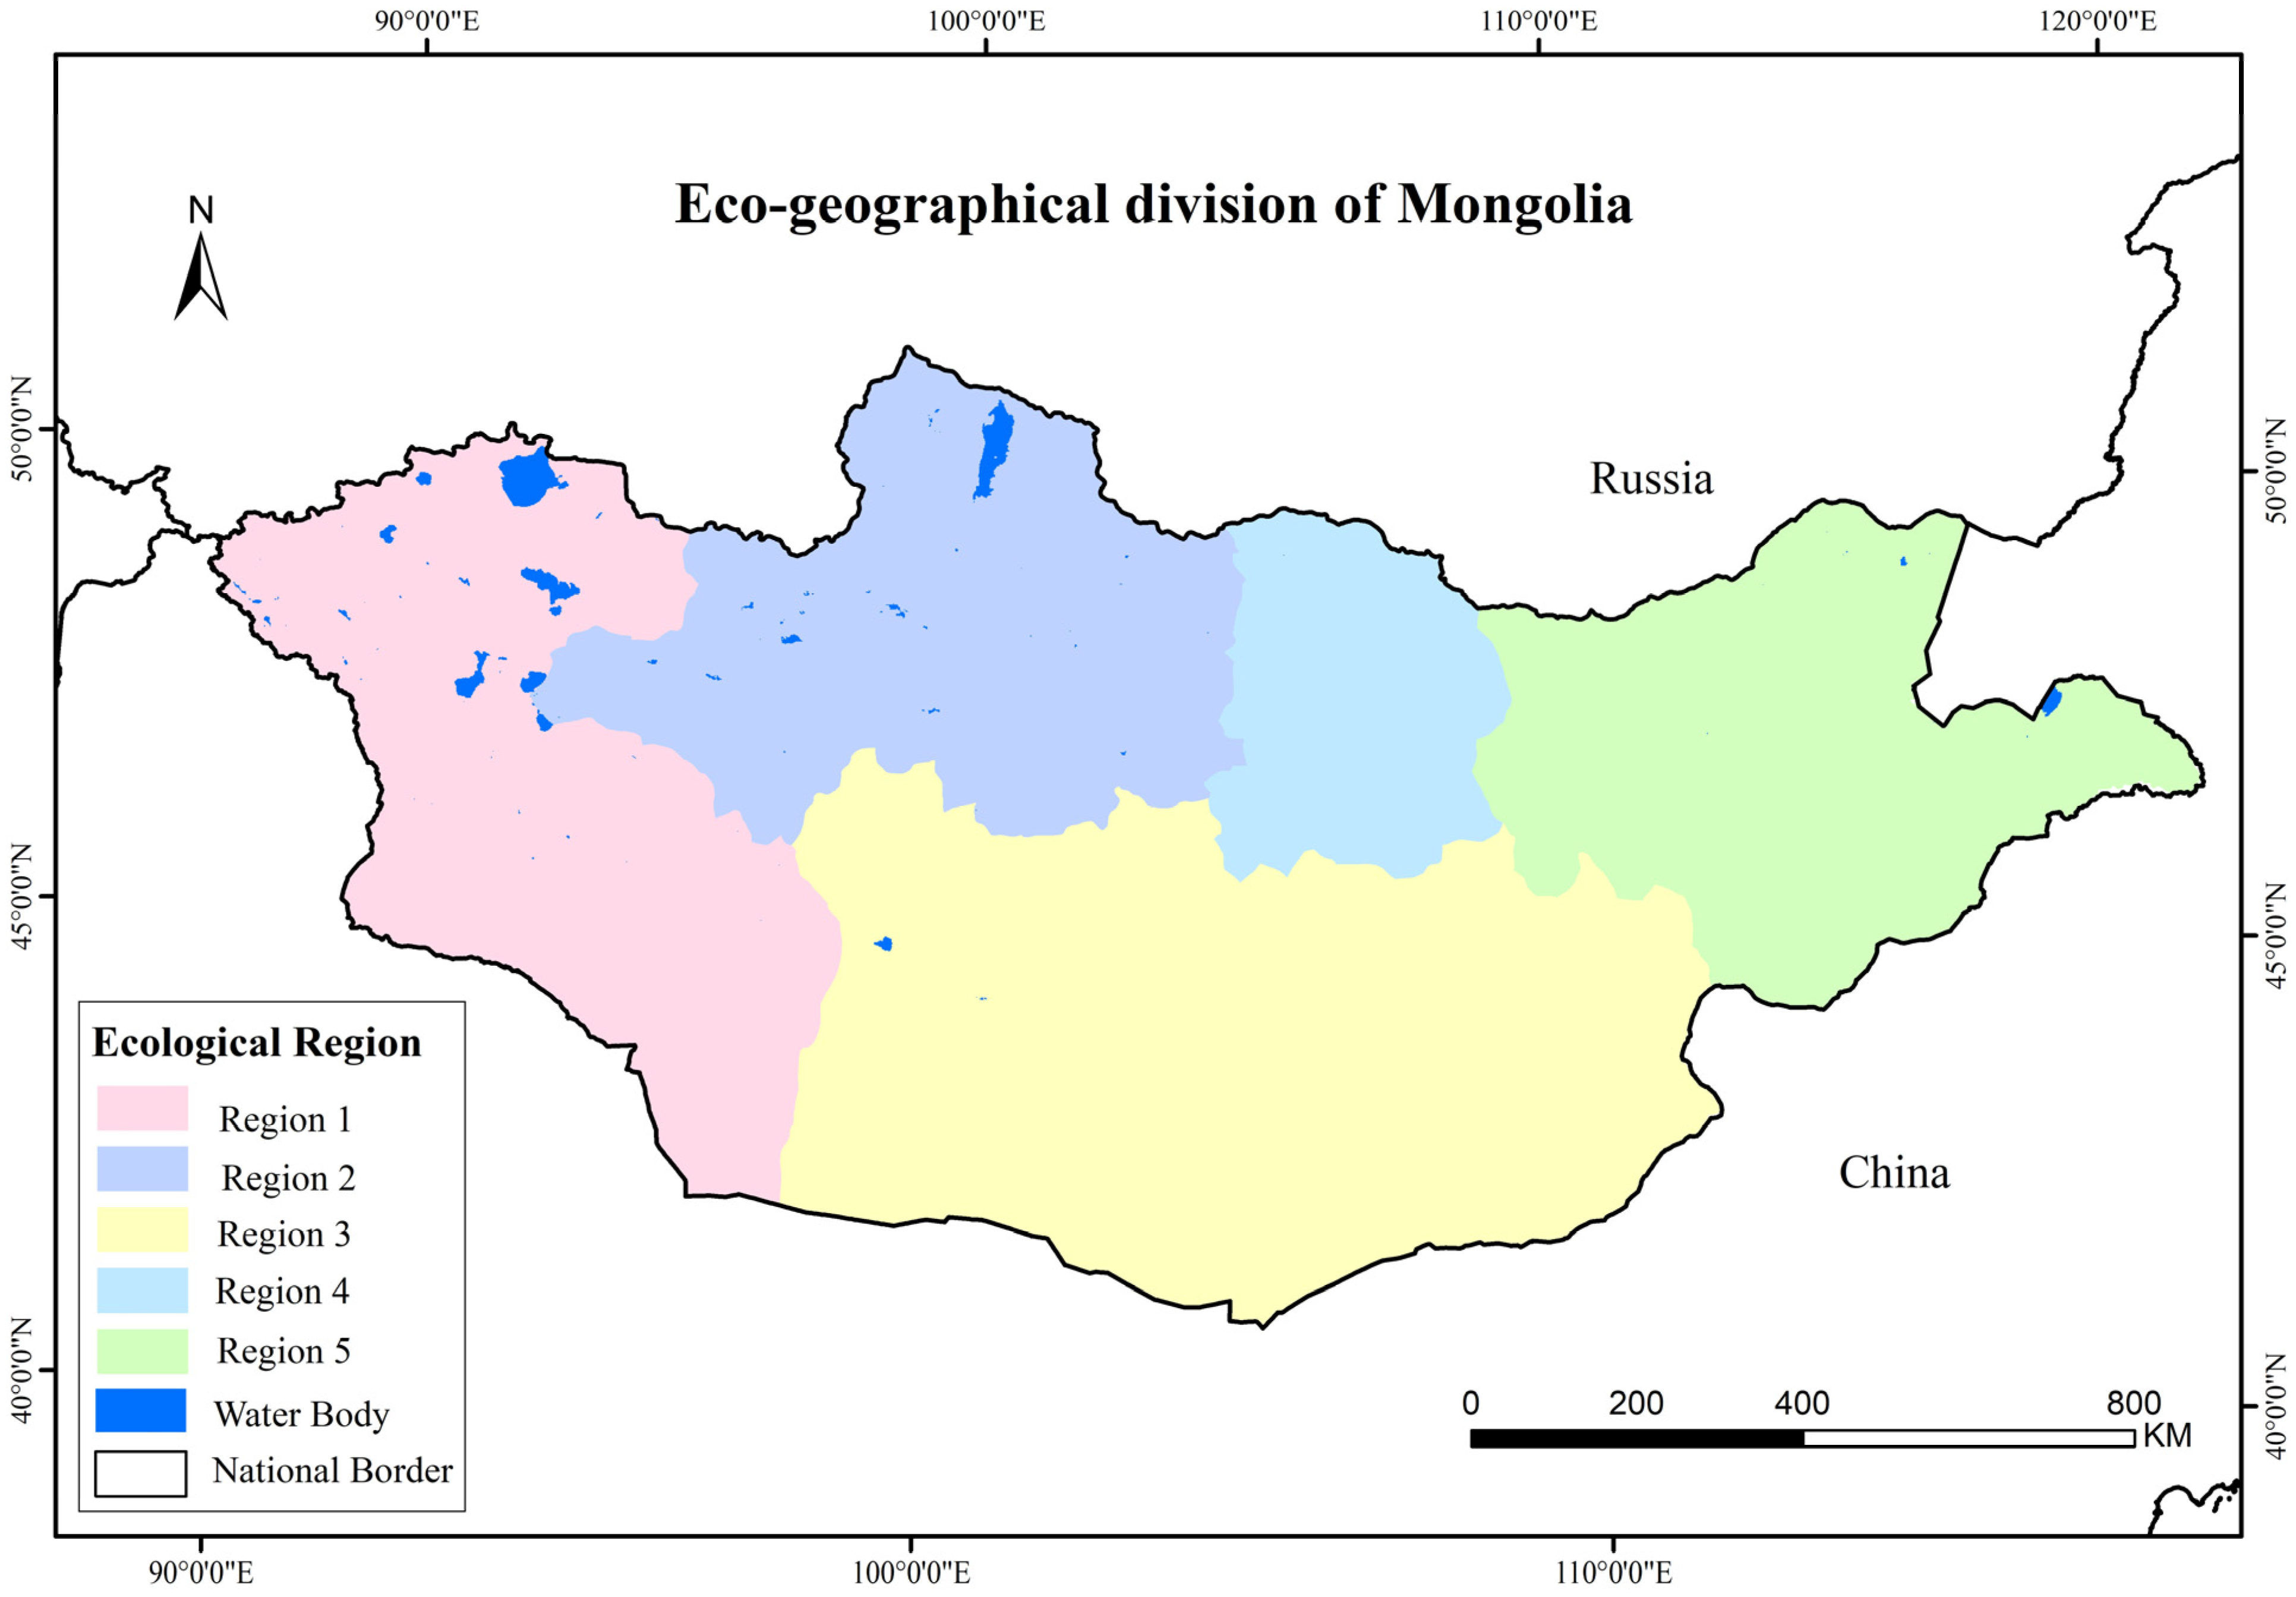
2.9. Eco–Geographical Division of Mongolia

As shown in Figure 3, the country is divided into five sub–regions based on natural and anthropogenic factors like topography, climate, and precipitation. The 200 mm isohyet separates the southern and northern parts. In the south, the Altai Mountain provinces are Region 1, while the remaining provinces form Region 3. The northern part is divided into Region 2 (northwest), Region 4 (central), and Region 5 (eastern, the Mongolian Plateau).

3. Results

3.1. Verifying the Accuracy of Remote Sensing Ecological Vulnerability Index

As shown in the error matrix, the overall accuracy of the Mongolian remote sensing ecological vulnerability index is 88.98%. The accuracy for mild vulnerability is the highest, at 93.10%, followed by slight vulnerability at 90.91%. The remaining accuracies, in descending order, are severe vulnerability at 88.64%, moderate vulnerability at 85.37%, and intensive vulnerability at 85.11%. Overall, all levels of vulnerability are above 85%, indicating that the ecological vulnerability index for Mongolia has a high degree of applicability (as shown in Table 2).

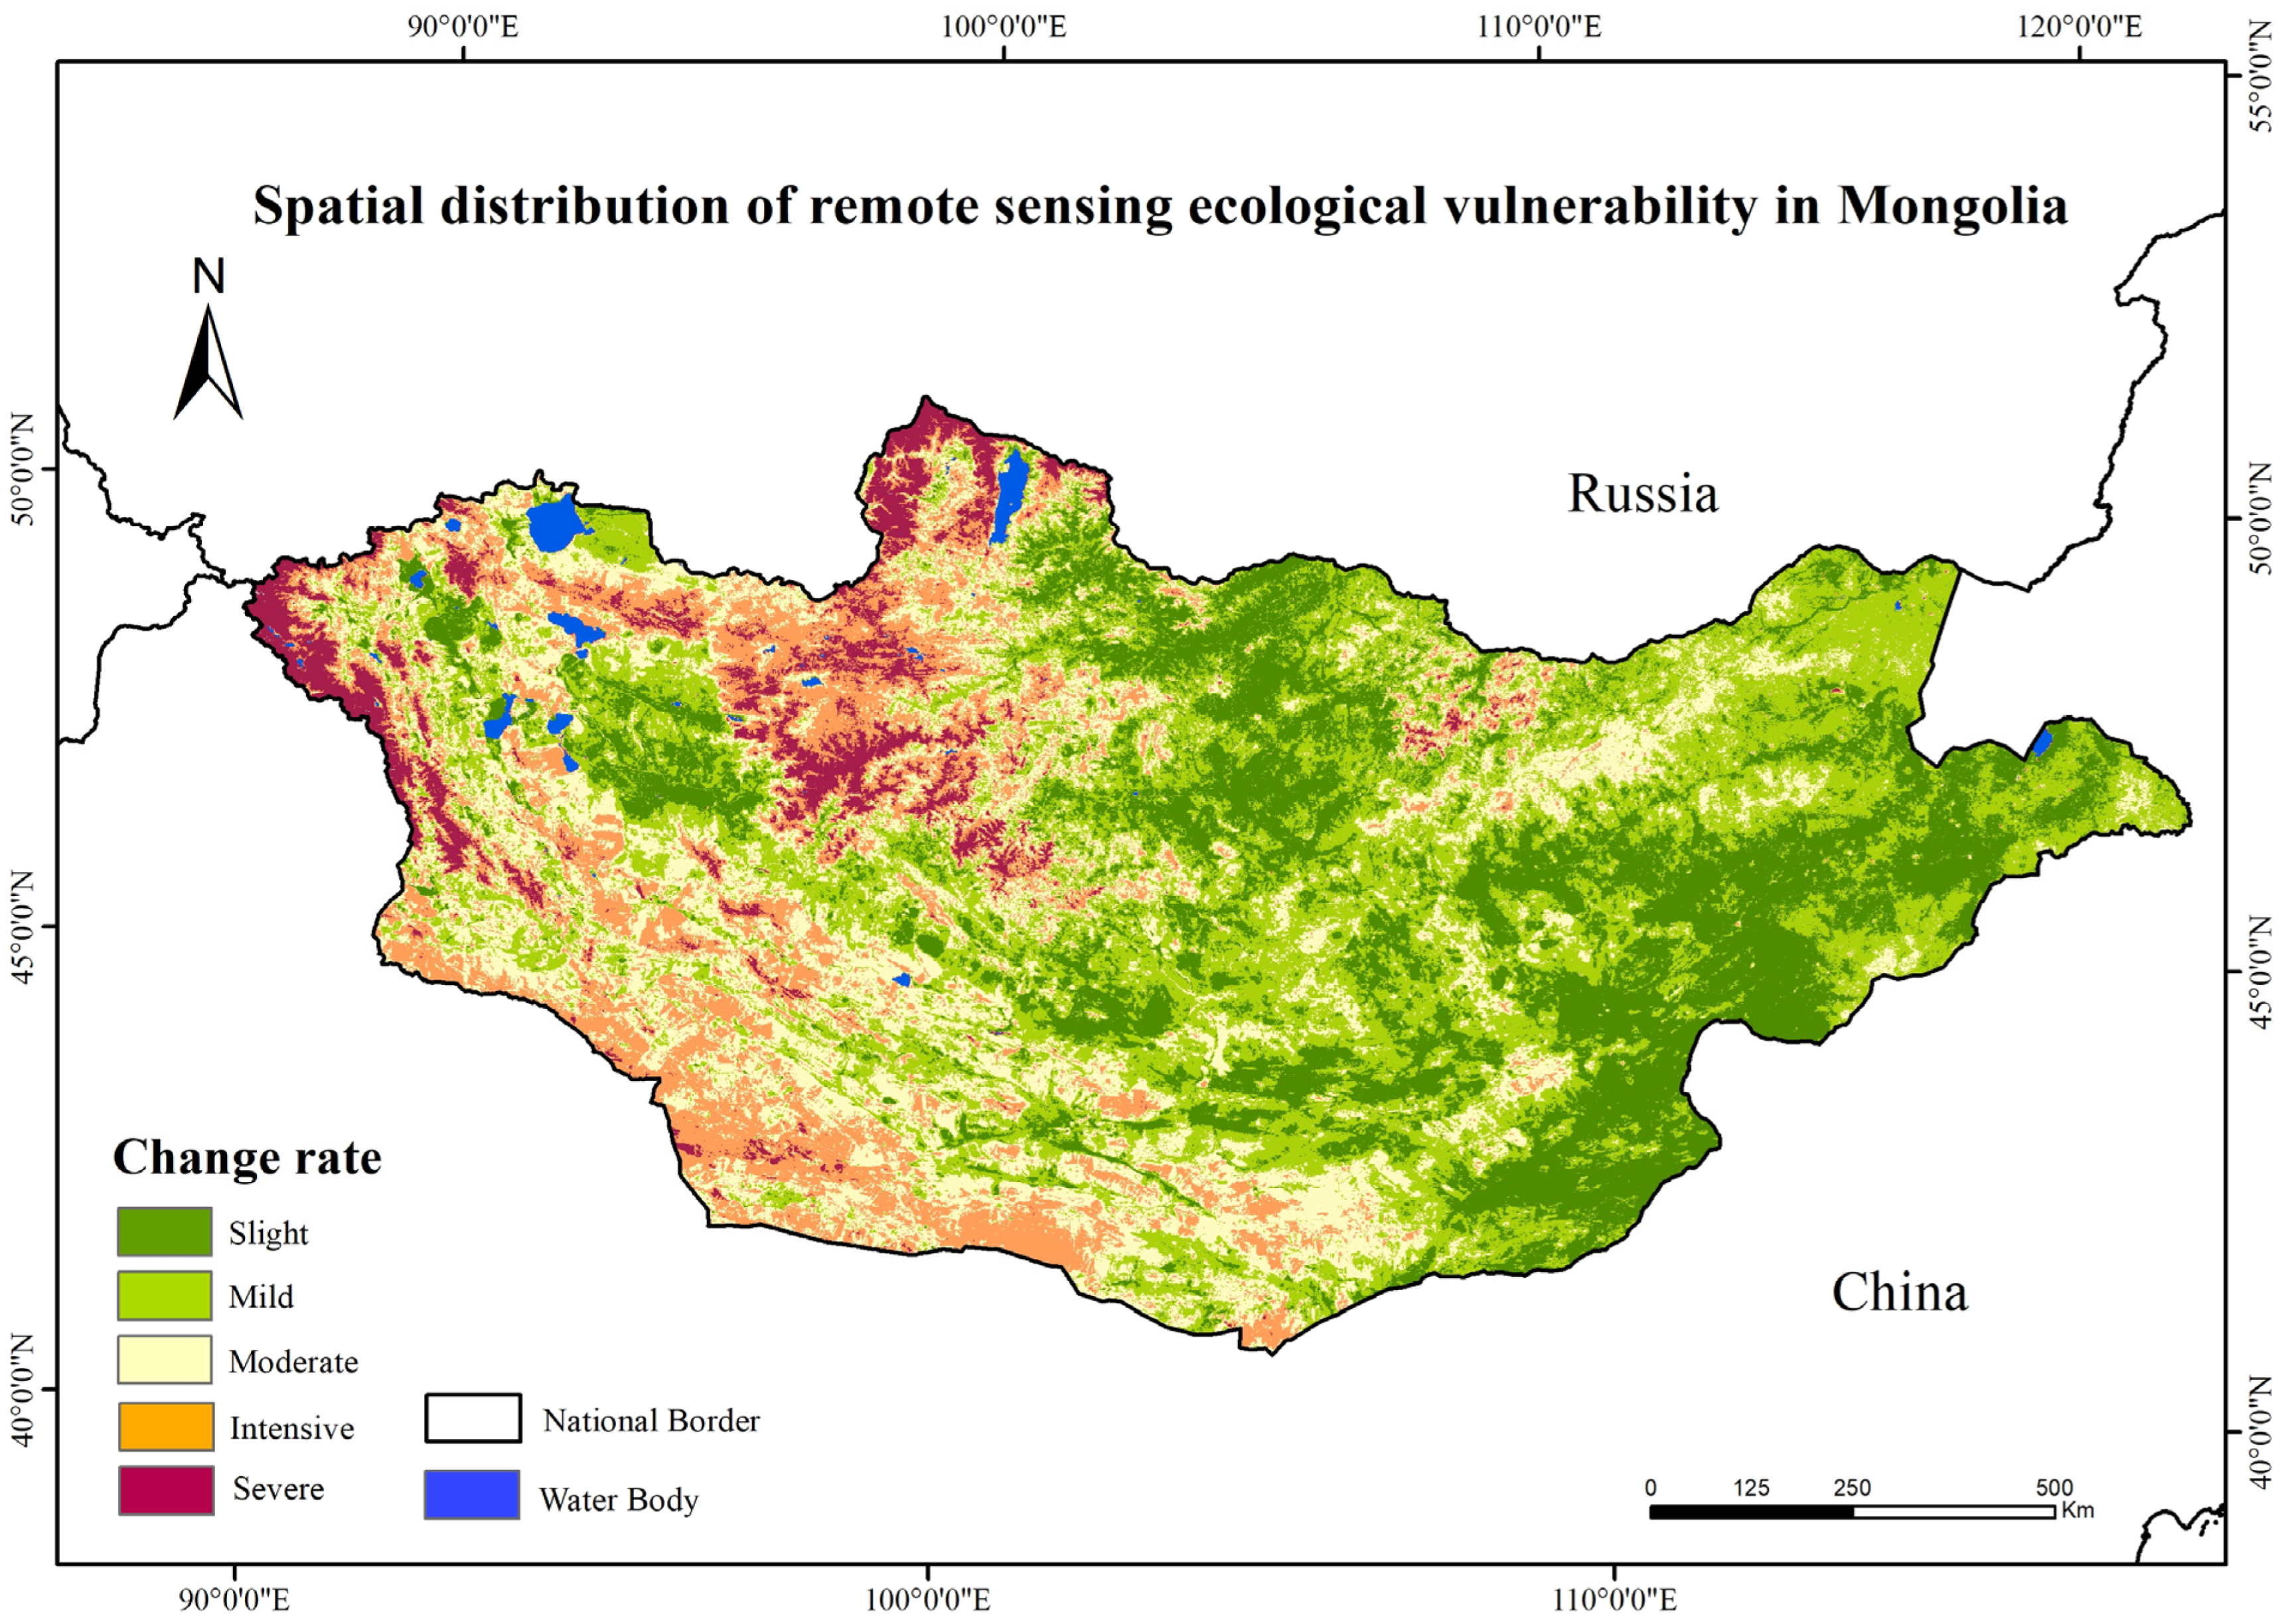
3.2. Spatial Distribution of Remote Sensing Ecological Vulnerability

From 2000 to 2022, the average ecological vulnerability index of Mongolia, known as the RSEVI, was 1.57, which falls into the category of mild vulnerability. As shown in Figure 4 there are spatial differences in the distribution of ecological vulnerability at different levels. In the figure, the area of slight vulnerability is approximately 3.68 × 10⁵ km2, accounting for 23.68% of the total area of the study region, mainly concentrated in the eastern and northern parts, and the northwestern part of the Zavkhan Province. The mild vulnerability area is primarily distributed in the central and eastern parts, with a total area of about 5.09 × 10⁵ km2, accounting for 32.73% of the total area of the study region, and has the largest area of concentrated vulnerability. The moderate vulnerability area is 3.75 × 10⁵ km2, distributed throughout Mongolia, with more pronounced areas in the central, western, and southern parts, accounting for 24.13%. The severe vulnerability area accounts for 14.64%, with an area of about 2.26 × 10⁵ km2, mainly distributed south of the Altai Mountains and the Khangai Range and north of the Hangay Range. The very severe vulnerability area is about 0.75 × 10⁵ km2, accounting for 4.82% of the total area of the study region, mainly located in the Altai Mountains, north of the Hangay Mountains, and in the northern part of Mongolia.

3.3. Gravity Center Model

The gravity center model effectively reveals the spatial imbalance and deviation in the distribution of ecological vulnerability. As illustrated in Figure 5, the calculated gravity center of ecological vulnerability is predominantly situated at the intersection of Aekhangai Province and Ovorhangay Province, highlighting that the ecological vulnerability in central Mongolia is more pronounced than in other regions of the country. The trajectories of the gravity center over different temporal scales exhibit distinct patterns. Therefore, this study employed both a 5-year and a 3-year time scale to examine the directional and distance shifts in the vulnerability center.
On a 5-year scale, the gravity center of vulnerability was located at the intersection of Aekhangai Province and Ovorhangay Province during 2000–2004. It subsequently shifted southeastward in 2005–2009, positioning itself in the northern part of Ovorhangay Province. During the subsequent period of 2010–2014, the vulnerability center migrated from the southeast to the northwest. In 2015–2019, the gravity center shifted northeastward, locating itself in the southern part of Aekhangai Province. Over the last three years (2020–2022), the gravity center moved southwestward relative to its position in 2015–2019.
A comparative analysis reveals that, except for the period of 2005–2009, the vulnerability center exhibited a consistent northwestward shift during 2000–2004, 2010–2014, 2015–2019, and 2020–2022. This pattern indicates that the increase and growth rate of ecological vulnerability in northwest Mongolia during 2000–2004 and 2010–2019 significantly exceeded that of other regions, with the most substantial increase observed between 2010 and 2014. In summary, the gravity center of vulnerability has shown a predominant northwestward shift over the past 23 years, suggesting that the increase and growth rate of ecological vulnerability in the northwest region from 2000 to 2022 have been markedly higher than in other regions of Mongolia.

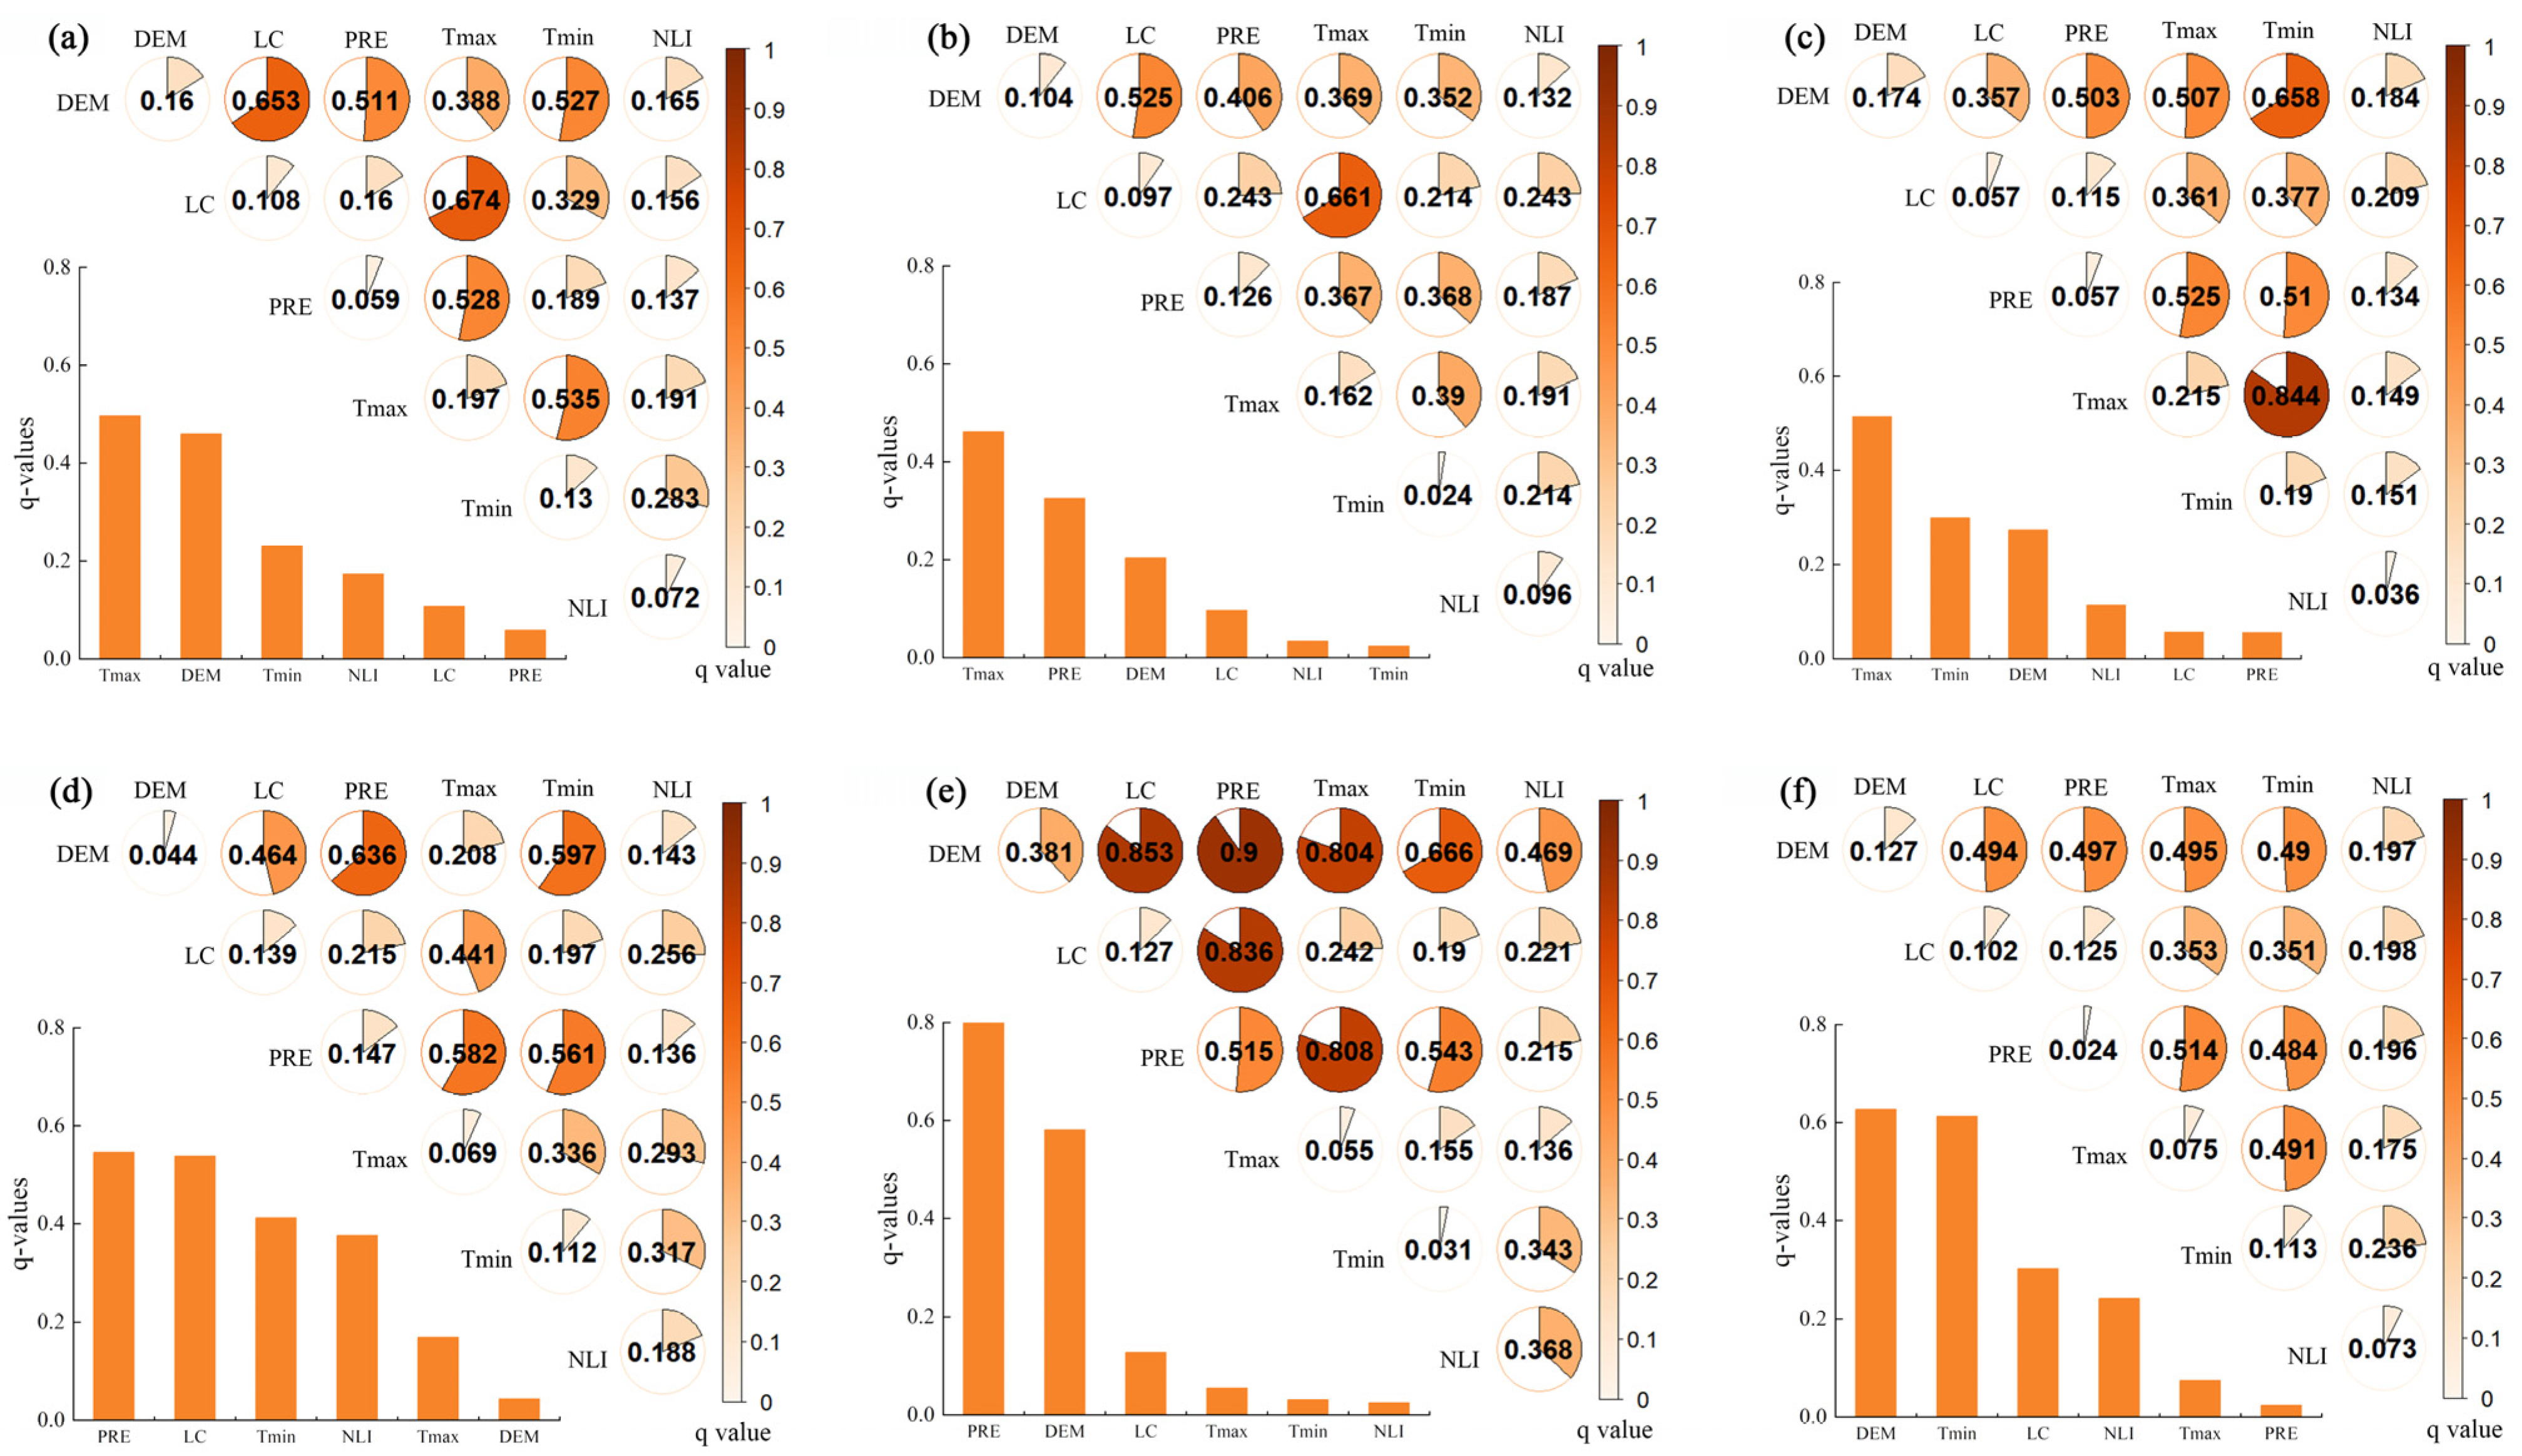
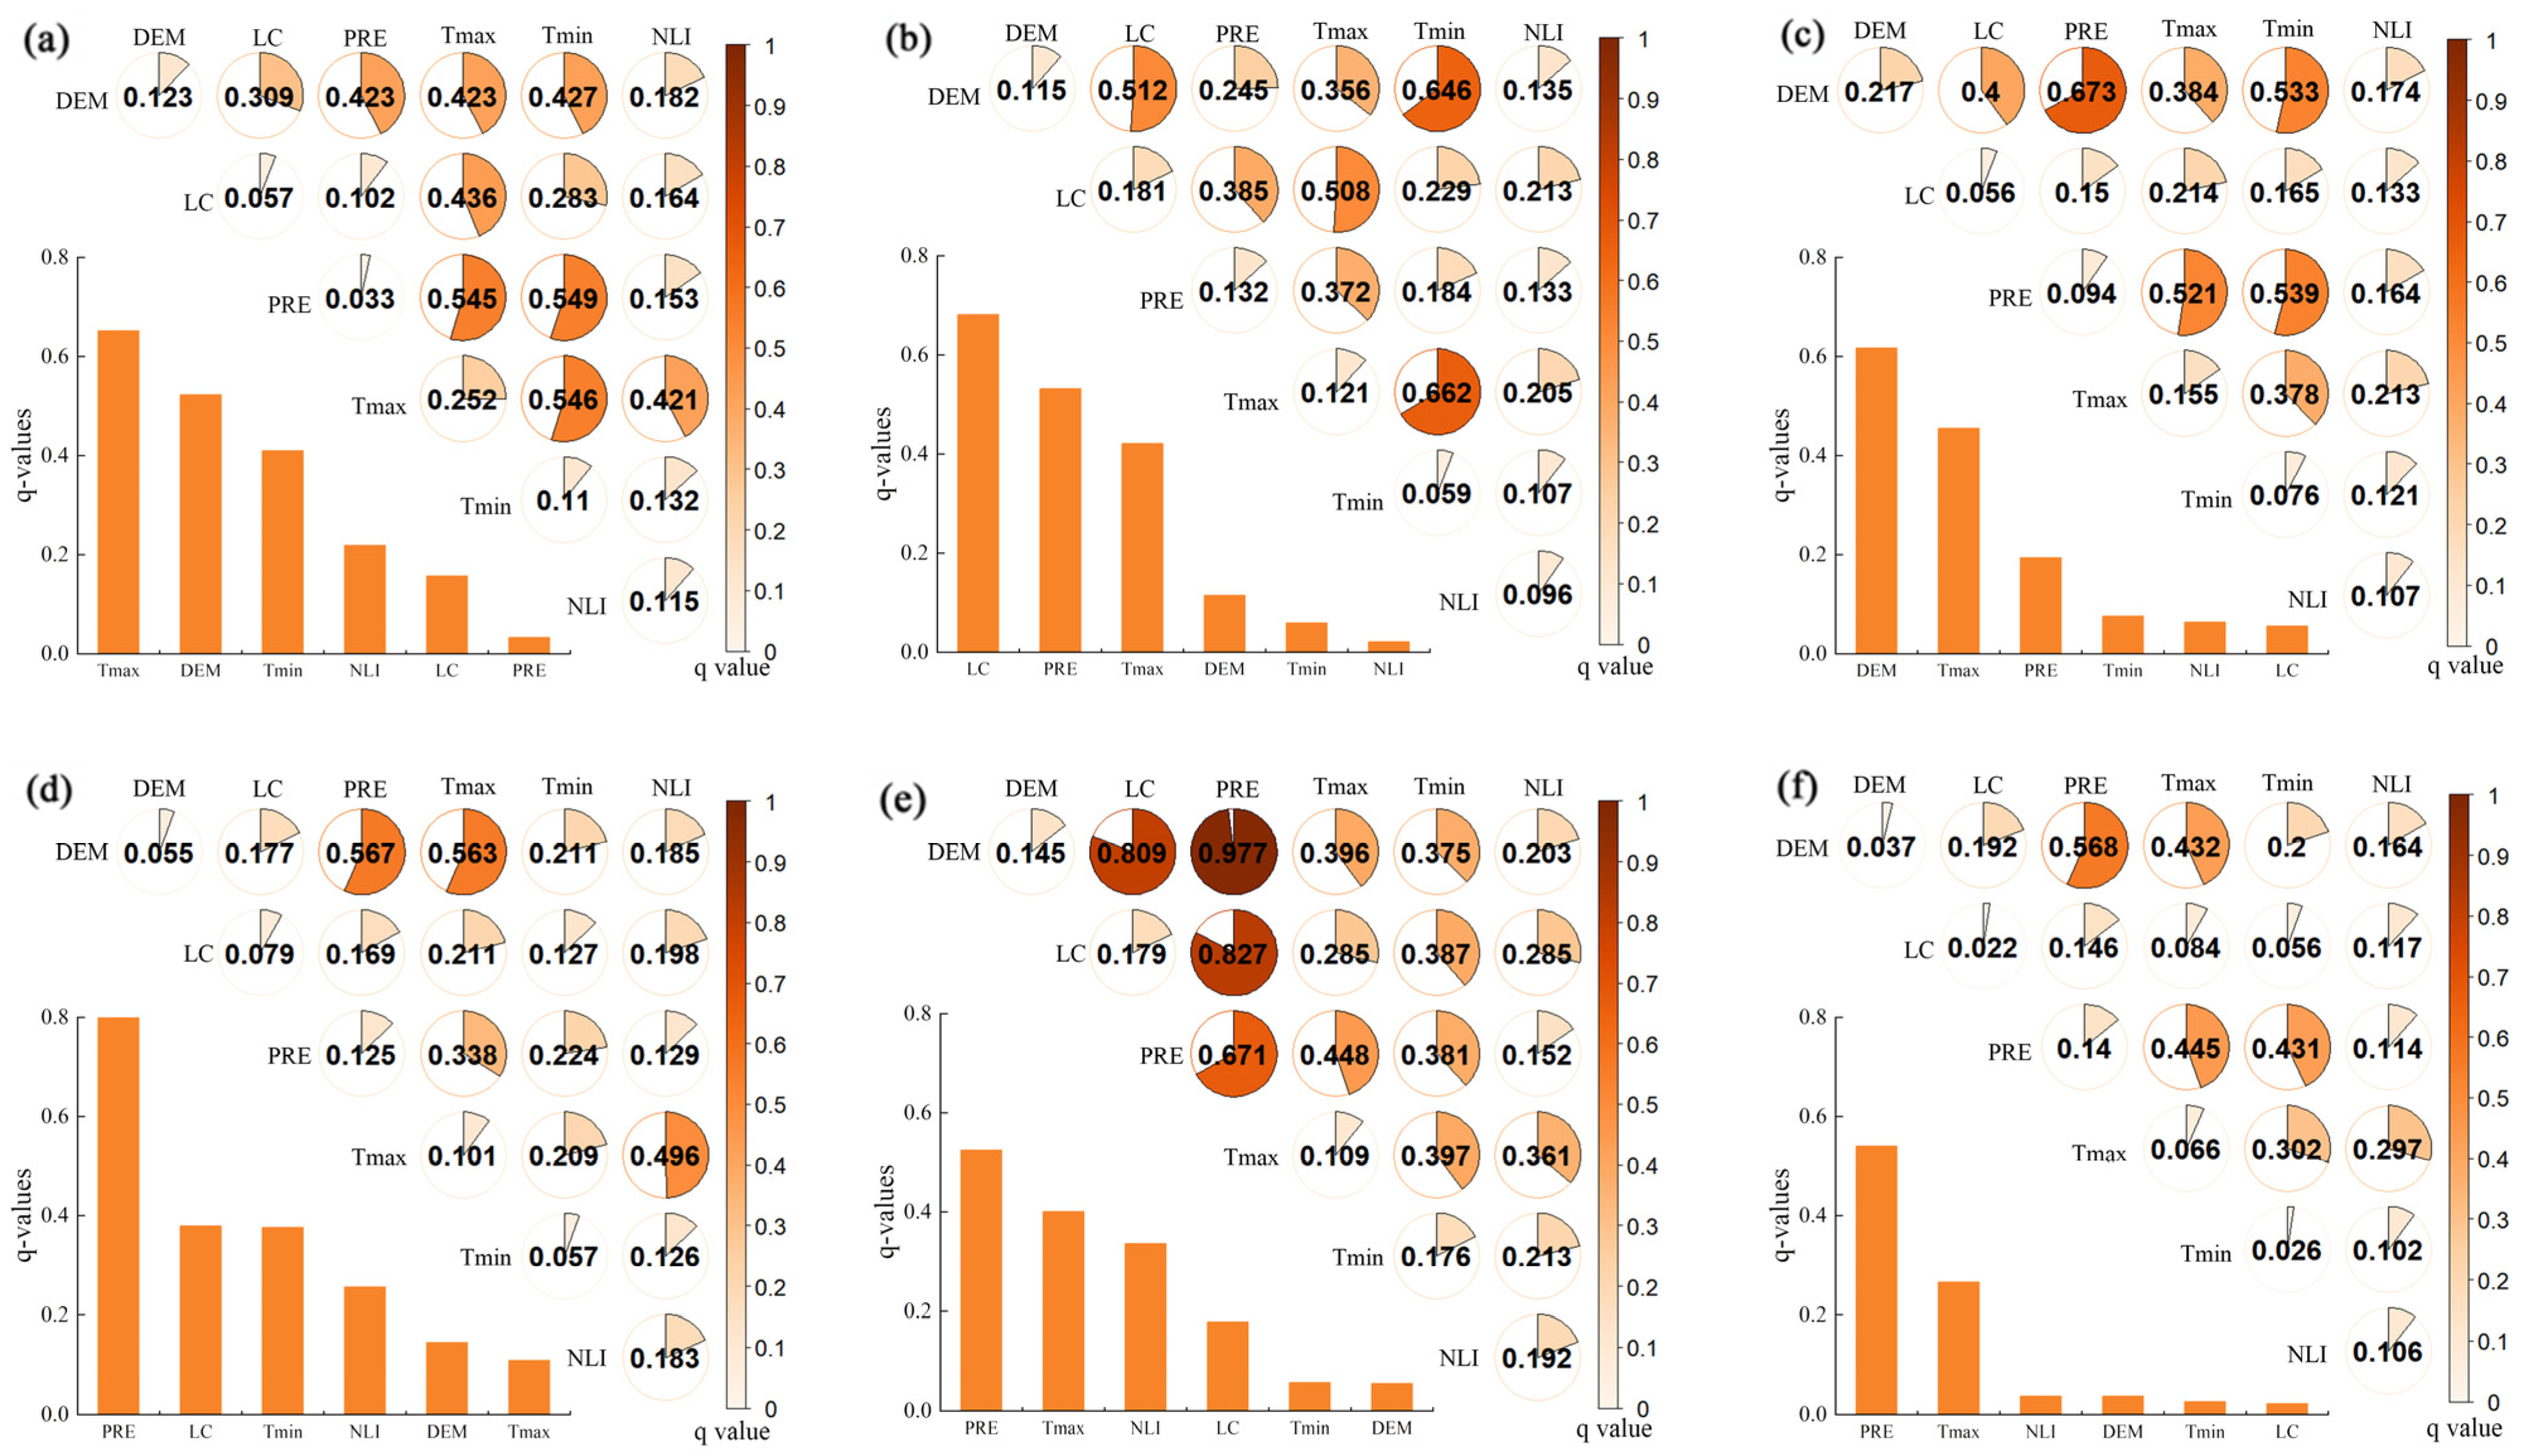
3.4. Dominant Factors in Different Sub–Regions of Mongolia

In Figure 6 and Table 3, in the year 2000, the maximum temperature (Tmax) emerged as the principal driver of ecological vulnerability across Mongolia, exhibiting a q value of 0.635. The most influential interactive factor was the combination of Tmax and minimum temperature (Tmin), with a q value of 0.834. Region–specific results indicated that in Region I, Tmax remained the dominant factor (q = 0.688), with the interaction between Tmax and Tmin (q = 0.821) also playing a significant role. In Region II, Tmin became the primary factor (q = 0.531), with Tmin and precipitation (PRE) interacting as the most influential factors (q = 0.822). In Region III, the digital elevation model (DEM) was identified as the leading factor (q = 0.523), with the DEM–PRE interaction as the dominant factor (q = 0.685). For Region IV, PRE was the dominant factor (q = 0.663), with the DEM–PRE interaction displaying the strongest influence (q = 0.872). In Region V, DEM was again the primary factor (q = 0.472), with the DEM–PRE interaction showing the most considerable impact (q = 0.552).
By 2010, in Figure 7 and Table 3, Tmax continued to be the dominant single factor for Mongolia (q = 0.497), while the interaction between Tmax and land cover (LC) (q = 0.674) became the most significant interactive factor. Region–specific results indicated that Tmax remained the primary factor in Region I (q = 0.462), with the Tmax–LC interaction showing a significant influence (q = 0.661). In Region II, Tmax (q = 0.515) continued to be the dominant factor, with the interaction between Tmax and Tmin (q = 0.844) being most pronounced. For Region III, PRE became the leading factor (q = 0.547), with the interaction between PRE and DEM showing a significant influence (q = 0.636). Region IV showed a strong dominance of PRE (q = 0.815), with the interaction between PRE and DEM exhibiting the highest influence (q = 0.900). In Region V, DEM remained the primary factor (q = 0.627), with the DEM–PRE interaction playing a significant role (q = 0.497).
In Figure 8 and Table 3, in 2020, Tmax continued to dominate as the key driver of ecological vulnerability in Mongolia (q = 0.652), while the interaction between Tmin and PRE emerged as the leading interactive factor (q = 0.549). Region–specific results showed that in Region I, land cover (LC) was the dominant single factor (q = 0.681), while the interaction of Tmax and Tmin (q = 0.662) was most significant. In Region II, DEM (q = 0.671) became the primary factor, with the interaction between DEM and PRE (q = 0.673) having the most considerable impact. For Region III, PRE (q = 0.525) remained the dominant factor, with the PRE–DEM interaction showing a notable influence (q = 0.567). Region IV demonstrated the dominance of PRE (q = 0.871), with the PRE–DEM interaction displaying the strongest association (q = 0.977). Lastly, in Region V, PRE continued to be the primary factor (q = 0.54), with the DEM–PRE interaction showing a considerable influence (q = 0.566).
These findings highlight the evolving dominance of temperature and precipitation, as well as their interactions with other factors, in shaping the spatial distribution of ecological vulnerability across Mongolia over the 20-year period.

4. Discussion

4.1. The Advantages of the Remote Sensing Ecological Vulnerability Index

Currently, many scholars primarily use MODIS data to derive multi–indicator–based ecological remote sensing indices [40]. In this study, we chose to use a method that integrates remote sensing platforms such as MODIS and GEE to assess Mongolia’s ecological vulnerability at a larger spatial scale and longer time series. Compared with machine learning models, which require a large amount of data labeling and are not suitable for long–term trend analysis, ground monitoring has higher local accuracy but lacks consistency in assessing large–scale spatial coverage. MODIS data have higher adaptability and higher spatial resolution and can fully reflect the dynamic changes in Mongolia’s ecosystem at different temporal and spatial scales. Among them, NDVI (Normalized Difference Vegetation Index) is an important indicator of vegetation coverage and health, which can effectively reflect the resilience of the ecosystem [41]. LST (Land Surface Temperature) is an important indicator of climate change and drought. By utilizing the strong correlation between NDVI and LST, the response mechanism of Mongolia’s ecosystem to climate change can be more accurately assessed [42,43]. Land degradation, including desertification and salinization, has become a serious ecological challenge in Mongolia. This study introduces a Land Degradation Index (LDI) composed of the Temperature–Greenness–Soil Moisture Index (TGSI), Albedo, and Slope Index (SI). TGSI captures climate, vegetation, and soil moisture conditions, while Albedo reflects surface reflectivity and drought intensity. SI highlights the influence of terrain on soil erosion potential, adding the night light index (NLI) as a measure of social activity, as an indirect indicator of human stress. By integrating both natural and anthropogenic factors, the ecological vulnerability index provides a comprehensive assessment of Mongolia’s ecosystem response to climate change and human interference across spatial and temporal scales. The ecological vulnerability index is applicable to areas where field data are missing, such as desert steppes and high mountains.
While MODIS data are valuable for large–scale monitoring, their coarse spatial resolution may limit the detection of small–scale ecological changes. Cloud cover, sensor errors, and data gaps could also introduce uncertainty. This study applied data smoothing and time averaging to reduce noise and improve consistency. Future research could explore integrating higher–resolution remote sensing data to enhance accuracy.

4.2. Spatial Distribution Analysis of Remote Sensing Ecological Vulnerability

The spatial distribution of different ecological vulnerability levels varies greatly. Mildly and slightly vulnerable areas are mainly distributed in the eastern and northern parts of Region III, the eastern part of Region II, and Regions IV and V. This is mainly because the eastern part of Mongolia has good climatic conditions, sufficient precipitation, and good vegetation growth [44]. The spatial distribution of different ecological vulnerability levels varies greatly. Mildly and slightly vulnerable areas are mainly distributed in the eastern and northern parts of Region III, the eastern part of Region II, and Regions IV and V. This is mainly because the eastern part of Mongolia has good climatic conditions, sufficient precipitation, and good vegetation growth [45]. At the same time, the center of ecological vulnerability in Mongolia has shifted toward the northwest from 2000 to 2022, indicating that the ecology of this region has become severely fragile. These areas experience significant fluctuations in temperature and precipitation, with desert grassland landscapes that are highly sensitive to climate change. Intensive human activities, such as overgrazing and deforestation, have led to a substantial reduction in natural grassland areas [46]. The Khangai Mountain region, with its extensive forest cover [47], has seen an increase in human activities that exacerbate climate–related vulnerability, leading to a decline in forest vegetation and a shift toward grasslands, thus intensifying ecological fragility [48]. Degraded ecosystems are more susceptible to extreme climate events, creating a feedback loop. This is especially true for the severely vulnerable southern regions, where the decline in vegetation cover and desertification further trigger soil erosion, loss of biodiversity, and a decrease in agricultural productivity. These changes, in turn, amplify the impact of human activities, affecting both the local ecology and economic development.

4.3. Dominant Factors of Ecological Vulnerability

Between 2000 and 2022, the maximum temperature (Tmax), digital elevation model (DEM), and minimum temperature (Tmin) emerged as the principal drivers of ecological vulnerability in Mongolia. Tmax, with a notably high and consistent q value of approximately 0.64, was identified as the dominant factor. In contrast, DEM and Tmin were secondary factors, while land cover (LC) and precipitation (PRE), with q values below 0.2, had minimal impact. The potential rise in temperature could amplify the occurrence of droughts and heatwaves, accelerating desertification in Mongolia. Divergent from Shuxing Xu’s studies [49], Tmax’s role as the key driver of ecological vulnerability signifies an ecological shift from water–limited to temperature–limited systems with increasing altitude, highlighting the pronounced effect of temperature on vegetation. The dominant interactive factors have evolved from Tmax intersecting Tmin to Tmin intersecting PRE between 2000 and 2022, underscoring the persistent influence of temperature throughout the period. Concurrently, the influence of precipitation on Mongolia’s ecological environment has become more pronounced amidst the warming climate. In recent years, the warming climate in Mongolia, increased river evaporation, and reduced precipitation have led to water scarcity [50], intensifying desertification and severely impacting the ecological environment. Under the predominant influence of temperature, precipitation has become the most influential interactive driver of ecological vulnerability.
Upon individual analysis of each region, Tmax is identified as the dominant factor in Region 1, whereas Tmin is the primary influence in Region 2. Considering the elevated altitude of Region 1, temperature emerges as a critical factor impacting plant growth; rising temperatures enhance vegetation development, with Tmax exhibiting a more significant positive correlation with plant life [51]. Region 2, characterized mainly by grasslands, experiences an advancement in the greening season due to the increase in Tmin, which further stimulates plant growth [52]. For Regions 3, 4, and 5, PRE assumes the role of the dominant influencing factor. Within the Mongolian landscape, rainfall is identified as a pivotal element affecting the activity of vegetation. The arid southern Mongolia endures severe desertification due to scarce rainfall. In contrast, the surface vegetation in the northeastern and northern Mongolia is markedly influenced by precipitation levels. Reduced rainfall elevates the risk of drought, resulting in soil moisture depletion and hindered plant growth. Conversely, increased rainfall can exacerbate hydrological erosion [53], leading to soil loss and a decrease in soil fertility, thereby slowing down plant growth [54,55]. Consequently, Mongolia must devise strategic measures for the equitable distribution of water and soil resources [56], implement integrated agricultural and pastoral practices, augment grassland management initiatives, bolster the capacity to withstand disasters, and adapt to and counteract the ecological repercussions of climate change [57].

5. Conclusions

This research, after thoroughly considering the climate change and ecological dynamics in Mongolia, identified four key indicators—vegetation, humidity, heat, and land degradation—to establish a novel remote sensing ecological index. We conducted an analysis of the spatiotemporal variations in ecological vulnerability across Mongolia and employed the Geographical Detector to investigate the driving forces behind these changes at both the national and sub–regional levels in Mongolia. The principal findings are summarized below:
The newly proposed remote sensing ecological vulnerability index has a high applicability rate in the Mongolian region, with an accuracy value of 88.98%.
  • From 2000 to 2022, the average remote sensing ecological vulnerability index of Mongolia was 1.57, classified as mild vulnerability. The area of mild vulnerability constitutes the largest proportion.
  • Between 2000 and 2022, the gravity center of Mongolia’s ecological vulnerability shifted toward the southwest, indicating that the degree of ecological vulnerability intensification in the southwest region was greater than that in the northeast region.
  • From 2000 to 2022, Tmax was the dominant driving factor of ecological vulnerability in Mongolia, with the dominant interactive factor transitioning from Tmax ∩ Tmin to Tmin ∩ PRE. For the eastern, central, and southern regions of Mongolia, PRE was the dominant factor, and PRE ∩ DEM was the dominant interactive factor. In the western and northwestern regions, the dominant factor shifted from Tmax and Tmin to DEM and LC, and the dominant interactive factor evolved from Tmax ∩ Tmin, Tmin ∩ PRE to PRE ∩ DEM, LC ∩ DEM.

Author Contributions

Conceptualization, methodology, and writing—original draft preparation, J.H., L.P. and B.G.; investigation, supervision, project administration, and funding acquisition, B.H. and T.X. All authors have read and agreed to the published version of the manuscript.

Funding

This work was supported by the Key Research and Development Program of Shandong Province (Major Technological Innovation Project) (grant number:2021ZDSYS01), National Natural Science Foundation of China (grant number: 42471329), Scientific Innovation Project for Young Scientists in Shandong Provincial Universities (grant number: 2022KJ224).

Data Availability Statement

The data presented in this study are available on request from the corresponding author.

Conflicts of Interest

The authors declare no conflicts of interest.

References

  1. Nilsson, C.; Grelsson, G. The fragility of ecosystems: A review. J. Appl. Ecol. 1995, 32, 677–692. [Google Scholar]
  2. Wang, Q.; Wang, H. Evaluation for the spatiotemporal patterns of ecological vulnerability and habitat quality: Implications for supporting habitat conservation and healthy sustainable development. Environ. Geochem. Health 2023, 45, 2117–2147. [Google Scholar] [PubMed]
  3. Liu, H.-L.; Willems, P.; Bao, A.-M.; Wang, L.; Chen, X. Effect of climate change on the vulnerability of a socio-ecological system in an arid area. Glob. Planet. Change 2016, 137, 1–9. [Google Scholar] [CrossRef]
  4. Jodha, N.S. Globalization and fragile mountain environments. Mt. Res. Dev. 2000, 20, 296–299. [Google Scholar] [CrossRef]
  5. Liu, Y.; Zhang, Y.; Guo, L. Towards realistic assessment of cultivated land quality in an ecologically fragile environment: A satellite imagery-based approach. Appl. Geogr. 2010, 30, 271–281. [Google Scholar] [CrossRef]
  6. Inman, D.L.; Brush, B.M. The Coastal Challenge: Fragile ribbons which border our land require more understanding, new technology, and resolute planning. Science 1973, 181, 20–32. [Google Scholar]
  7. Zhao, H.; Xu, X.; Tang, J.; Wang, Z.; Miao, C. Spatial pattern evolution and prediction scenario of habitat quality in typical fragile ecological region, China: A case study of the Yellow River floodplain area. Heliyon 2023, 9, e14430. [Google Scholar] [CrossRef]
  8. Olafsdottir, R.; Runnström, M.C. A GIS approach to evaluating ecological sensitivity for tourism development in fragile environments. A case study from SE Iceland. Scand. J. Hosp. Tour. 2009, 9, 22–38. [Google Scholar] [CrossRef]
  9. Xu, H.; Xu, F.; Lin, T.; Xu, Q.; Yu, P.; Wang, C.; Aili, A.; Zhao, X.; Zhao, W.; Zhang, P.; et al. A systematic review and comprehensive analysis on ecological restoration of mining areas in the arid region of China: Challenge, capability and reconsideration. Ecol. Indic. 2023, 154, 110630. [Google Scholar] [CrossRef]
  10. Farnworth, E.G.; Golley, F.B. Fragile Ecosystems: Evaluation of Research and Applications in the Neotropics; Springer Science & Business Media: Berlin/Heidelberg, Germany, 2013. [Google Scholar]
  11. Hong, W.; Jiang, R.; Yang, C.; Zhang, F.; Su, M.; Liao, Q. Establishing an ecological vulnerability assessment indicator system for spatial recognition and management of ecologically vulnerable areas in highly urbanized regions: A case study of Shenzhen, China. Ecol. Indic. 2016, 69, 540–547. [Google Scholar] [CrossRef]
  12. Jiang, Y.; Shi, B.; Su, G.; Lu, Y.; Li, Q.; Meng, J.; Ding, Y.; Song, S.; Dai, L. Spatiotemporal analysis of ecological vulnerability in the Tibet Autonomous Region based on a pressure-state-response-management framework. Ecol. Indic. 2021, 130, 108054. [Google Scholar] [CrossRef]
  13. Polsky, C.; Neff, R.; Yarnal, B. Building comparable global change vulnerability assessments: The vulnerability scoping diagram. Glob. Environ. Change 2007, 17, 472–485. [Google Scholar] [CrossRef]
  14. Chen, X.; Li, X.; Eladawy, A.; Yu, T.; Sha, J. A multi-dimensional vulnerability assessment of Pingtan Island (China) and Nile Delta (Egypt) using ecological Sensitivity-Resilience-Pressure (SRP) model. Hum. Ecol. Risk Assess. Int. J. 2021, 27, 1860–1882. [Google Scholar] [CrossRef]
  15. Eakin, H.; Luers, A.L. Assessing the vulnerability of social-environmental systems. Annu. Rev. Environ. Resour. 2006, 31, 365–394. [Google Scholar] [CrossRef]
  16. Malekmohammadi, B.; Jahanishakib, F. Vulnerability assessment of wetland landscape ecosystem services using driver-pressure-state-impact-response (DPSIR) model. Ecol. Indic. 2017, 82, 293–303. [Google Scholar] [CrossRef]
  17. Eckert, S.; Hüsler, F.; Liniger, H.; Hodel, E. Trend analysis of MODIS NDVI time series for detecting land degradation and regeneration in Mongolia. J. Arid. Environ. 2015, 113, 16–28. [Google Scholar] [CrossRef]
  18. Shah, M.A.R.; Wang, X. Assessing social-ecological vulnerability and risk to coastal flooding: A case study for Prince Edward Island, Canada. Int. J. Disaster Risk Reduct. 2024, 106, 104450. [Google Scholar] [CrossRef]
  19. Huang, B.; Zha, R.; Chen, S.; Zha, X.; Jiang, X. Fuzzy evaluation of ecological vulnerability based on the SRP-SES method and analysis of multiple decision-making attitudes based on OWA operators: A case of Fujian Province, China. Ecol. Indic. 2023, 153, 110432. [Google Scholar] [CrossRef]
  20. Zhang, Q.; Wang, G.; Yuan, R.; Singh, V.P.; Wu, W.; Wang, D. Dynamic responses of ecological vulnerability to land cover shifts over the Yellow River Basin, China. Ecol. Indic. 2022, 144, 109554. [Google Scholar] [CrossRef]
  21. Cai, X.; Li, Z.; Liang, Y. Tempo-spatial changes of ecological vulnerability in the arid area based on ordered weighted average model. Ecol. Indic. 2021, 133, 108398. [Google Scholar] [CrossRef]
  22. Pirasteh, S.; Fang, Y.; Mafi-Gholami, D.; Abulibdeh, A.; Nouri-Kamari, A.; Khonsari, N. Enhancing vulnerability assessment through spatially explicit modeling of mountain social-ecological systems exposed to multiple environmental hazards. Sci. Total Environ. 2024, 930, 172744. [Google Scholar] [CrossRef]
  23. Abson, D.J.; Dougill, A.J.; Stringer, L.C. Using principal component analysis for information-rich socio-ecological vulnerability mapping in Southern Africa. Appl. Geogr. 2012, 35, 515–524. [Google Scholar]
  24. Tang, Q.; Wang, J.; Jing, Z. Tempo-spatial changes of ecological vulnerability in resource-based urban based on genetic projection pursuit model. Ecol. Indic. 2021, 121, 107059. [Google Scholar]
  25. Helldén, U.; Tottrup, C. Regional desertification: A global synthesis. Glob. Planet. Change 2008, 64, 169–176. [Google Scholar]
  26. Alexander, L.V.; Zhang, X.; Peterson, T.C.; Caesar, J.; Gleason, B.; Klein Tank, A.; Haylock, M.; Collins, D.; Trewin, B.; Rahimzadeh, F.; et al. Global observed changes in daily climate extremes of temperature and precipitation. J. Geophys. Res. Atmos. 2006, 111, 1042–1063. [Google Scholar]
  27. Rao, M.P.; Davi, N.K.; D D’Arrigo, R.; Skees, J.; Nachin, B.; Leland, C.; Lyon, B.; Wang, S.-Y.; Byambasuren, O. Dzuds, droughts, and livestock mortality in Mongolia. Environ. Res. Lett. 2015, 10, 074012. [Google Scholar]
  28. Yuan, J.; Chen, J.; Sciusco, P.; Kolluru, V.; Saraf, S.; John, R.; Ochirbat, B. Land use hotspots of the two largest landlocked countries: Kazakhstan and Mongolia. Remote Sens. 2022, 14, 1805. [Google Scholar] [CrossRef]
  29. Batima, P.; Natsagdorj, L.; Gombluudev, P.; Erdenetsetseg, B. Observed climate change in Mongolia. Assess. Impacts Adapt. Clim. Change 2005, 12, 1–26. [Google Scholar]
  30. Tamura, K.; Asano, M.; Jamsran, U. Soil diversity in Mongolia. In The Mongolian Ecosystem Network: Environmental Issues Under Climate and Social Changes; Springer: Tokyo, Japan, 2013; pp. 99–103. [Google Scholar]
  31. Batjargal, Z. Desertification in Mongolia. RALA Rep. 1997, 200, 107–113. [Google Scholar]
  32. Foggin, J.M.; Smith, A.T. Rangeland utilization and biodiversity on the alpine grasslands of Qinghai Province, People’s Republic of China. In Conserving China’s Biodiversity II; China Environmental Science Press: Beijing, China, 1996; pp. 247–258. [Google Scholar]
  33. Dwyer, J.; Schmidt, G. The MODIS reprojection tool. In Earth Science Satellite Remote Sensing: Vol. 2: Data, Computational Processing, and Tools; Springer: Berlin/Heidelberg, Germany, 2006; pp. 162–177. [Google Scholar]
  34. Wold, S.; Esbensen, K.; Geladi, P. Principal component analysis. Chemom. Intell. Lab. Syst. 1987, 2, 37–52. [Google Scholar]
  35. Wan, T.; Hu, J.; Wu, P.; He, H. Kappa Coefficient: A Popular Measure of Rater Agreement. Shanghai Arch. Psychiatry 2015, 27, 62. [Google Scholar]
  36. Zhu, L.; Meng, J.; Zhu, L. Applying Geodetector to disentangle the contributions of natural and anthropogenic factors to NDVI variations in the middle reaches of the Heihe River Basin. Ecol. Indic. 2020, 117, 106545. [Google Scholar]
  37. Bai, Z.G.; Dent, D.L.; Olsson, L.; Schaepman, M.E. Proxy global assessment of land degradation. Soil Use Manag. 2008, 24, 223–234. [Google Scholar] [CrossRef]
  38. Hall, F.; Masek, J.G.; Collatz, G.J. Evaluation of ISLSCP Initiative II FASIR and GIMMS NDVI products and implications for carbon cycle science. J. Geophys. Res. Atmos. 2006, 111, D22S08. [Google Scholar]
  39. Hunt, E.D.; Hubbard, K.G.; Wilhite, D.A.; Arkebauer, T.J.; Dutcher, A.L. The development and evaluation of a soil moisture index. Int. J. Climatol. 2009, 29, 747. [Google Scholar]
  40. Houborg, R.; Soegaard, H.; Boegh, E. Combining vegetation index and model inversion methods for the extraction of key vegetation biophysical parameters using Terra and Aqua MODIS reflectance data. Remote Sens. Environ. 2007, 106, 39–58. [Google Scholar] [CrossRef]
  41. Pettorelli, N.; Vik, J.O.; Mysterud, A.; Gaillard, J.-M.; Tucker, C.J.; Stenseth, N.C. Using the satellite-derived NDVI to assess ecological responses to environmental change. Trends Ecol. Evol. 2005, 20, 503–510. [Google Scholar] [CrossRef]
  42. Yue, W.; Xu, J.; Tan, W.; Xu, L. The relationship between land surface temperature and NDVI with remote sensing: Application to Shanghai Landsat 7 ETM+ data. Int. J. Remote Sens. 2007, 28, 3205–3226. [Google Scholar]
  43. Sun, D.; Kafatos, M. Note on the NDVI-LST relationship and the use of temperature-related drought indices over North America. Geophys. Res. Lett. 2007, 34, L24406. [Google Scholar]
  44. Yembuu, B. Climate and Climate Change of Mongolia. In The Physical Geography of Mongolia; Springer: Berlin/Heidelberg, Germany, 2021; pp. 51–76. [Google Scholar]
  45. Miao, L.; Fraser, R.; Sun, Z.; Sneath, D.; He, B.; Cui, X. Climate impact on vegetation and animal husbandry on the Mongolian plateau: A comparative analysis. Nat. Hazards 2016, 80, 727–739. [Google Scholar] [CrossRef]
  46. Nanzad, L.; Zhang, J.; Tuvdendorj, B.; Nabil, M.; Zhang, S.; Bai, Y. NDVI anomaly for drought monitoring and its correlation with climate factors over Mongolia from 2000 to 2016. J. Arid. Environ. 2019, 164, 69–77. [Google Scholar]
  47. Nandintsetseg, B.; Boldgiv, B.; Chang, J.; Ciais, P.; Davaanyam, E.; Batbold, A.; Bat-Oyun, T.; Stenseth, N.C. Risk and vulnerability of Mongolian grasslands under climate change. Environ. Res. Lett. 2021, 16, 034035. [Google Scholar] [CrossRef]
  48. Avidsuren, E. Risk Assessment of Grassland Degradationin Arhangai, Mongolia. Ph.D. Thesis, Inner Mongolia Agricultural University, Hohhot, China, 2021. [Google Scholar]
  49. Xu, S.; Wang, J.; Altansukh, O.; Chuluun, T. Spatiotemporal evolution and driving mechanisms of desertification on the Mongolian Plateau. Sci. Total Environ. 2024, 941, 173566. [Google Scholar]
  50. Nandintsetseg, B.; Greene, J.S.; Goulden, C.E. Trends in extreme daily precipitation and temperature near Lake Hövsgöl, Mongolia. Int. J. Climatol. A J. R. Meteorol. Soc. 2007, 27, 341–347. [Google Scholar]
  51. Peng, S.; Piao, S.; Ciais, P.; Myneni, R.B.; Chen, A.; Chevallier, F.; Dolman, A.J.; Janssens, I.A.; Penuelas, J.; Zhang, G. Asymmetric effects of daytime and night-time warming on Northern Hemisphere vegetation. Nature 2013, 501, 88–92. [Google Scholar]
  52. Shen, M.; Piao, S.; Chen, X.; An, S.; Fu, Y.H.; Wang, S.; Cong, N.; Janssens, I.A. Strong impacts of daily minimum temperature on the green-up date and summer greenness of the Tibetan Plateau. Glob. Change Biol. 2016, 22, 3057–3066. [Google Scholar]
  53. Sheffield, J.; Wood, E.F. Projected changes in drought occurrence under future global warming from multi-model, multi-scenario, IPCC AR4 simulations. Clim. Dyn. 2008, 31, 79–105. [Google Scholar]
  54. Goulden, C.E.; Mead, J.; Horwitz, R.; Goulden, M.; Nandintsetseg, B.; McCormick, S.; Boldgiv, B.; Petraitis, P.S. Interviews of Mongolian herders and high resolution precipitation data reveal an increase in short heavy rains and thunderstorm activity in semi-arid Mongolia. Clim. Change 2016, 136, 281–295. [Google Scholar]
  55. Bao, G.; Tuya, A.; Bayarsaikhan, S.; Dorjsuren, A.; Mandakh, U.; Bao, Y.; Li, C.; Vanchindorj, B. Variations and climate constraints of terrestrial net primary productivity over Mongolia. Quat. Int. 2020, 537, 112–125. [Google Scholar]
  56. Hannam, I. Human dimensions of soil and water conservation: Mongolia. In Human Dimensions of Soil and Water Conservation; Nova Science Publishers: New York, NY, USA, 2010; pp. 341–356. [Google Scholar]
  57. Wang, J.; Brown, D.G.; Agrawal, A. Sustainable governance of the Mongolian grasslands: Comparing ecological and social-institutional changes in the context of climate change in Mongolia and Inner Mongolia, China. In Dryland East Asia: Land Dynamics amid Social and Climate Change; De Gruyter: Berlin, Germany, 2014; pp. 423–444. [Google Scholar]
Figure 1. Location of the study area.
Remotesensing 17 01248 g001
Figure 2. Related index calculation map (for the year 2020).
Remotesensing 17 01248 g002
Figure 3. Eco–geographical division of Mongolia.
Remotesensing 17 01248 g003
Figure 4. Spatial distribution of remote sensing ecological vulnerability in Mongolia.
Remotesensing 17 01248 g004
Figure 5. The migration trajectory of the gravity center of remote sensing ecological vulnerability in Mongolia from 2000 to 2022.
Remotesensing 17 01248 g005
Figure 6. The dominant interaction factor q value in different regions of Mongolia in 2000. (a) Mongolia (b) Region I, (c) Region II, (d) Region III, (e) Region IV, and (f) Region V.
Remotesensing 17 01248 g006
Figure 7. The dominant interaction factor q value in different regions of Mongolia in 2010. (a) Mongolia, (b) Region I, (c) Region II, (d) Region III, (e) Region IV, and (f) Region V.
Remotesensing 17 01248 g007
Figure 8. The dominant interaction factor q value in different regions of Mongolia in 2020. (a) Mongolia, (b) Region I, (c) Region II, (d) Region III, (e) Region IV, and (f) Region V.
Remotesensing 17 01248 g008
Table 1. Data sources and description.
DataData DescriptionData SourcesData Use
Digital elevation model500 m accuracy digital elevation model in MongoliaGeneral Bathymetric Chart of the Oceans Attributional analysis
Maximum temperature
(Tmax)
Global 2.5 min resolution Maximum temperature grid dataWorldClimAttributional analysis
Minimum temperature
(Tmin)
Global 2.5 min resolution minimum temperature grid dataWorldClimAttributional analysis.
Land cover
(LC)
Esri 10 m land cover dataEsriAttributional analysis
Precipitation data
(PRE)
Annual average precipitation data at global meteorological stationsNational Centers foe EnvironmentalAttributional analysis
Night lights index (NLI)1 km night light data
500 m night light data
Suomi NPP/VIIRS
DMSP/OLS
Attributional analysis
Table 2. Error matrix of remote sensing ecological vulnerability index in Mongolia in 2022.
Evaluation Results
Vulnerability LevelsSlightMildModerateIntensiveSevereSum
Filed observed samplesSlight50021154
Mild35423264
Moderate11352140
Intensive02140144
Severe11113943
Sum5558414744245
Table 3. The dominant single factor and interaction factor q values in different regions of Mongolia.
YearAreaSingle Factorq ValueInteraction Factorq Value
2000MongoliaTmax0.635Tmax ∩ Tmin0.834
Region ITmax0.688Tmax ∩ Tmin0.821
Region IITmin0.531Tmin ∩ PRE0.822
Region IIIDEM0.523DEM ∩ PRE0.689
Region IVPRE0.663PRE ∩ DEM0.872
Region VDEM0.472DEM ∩ PRE0.557
2010MongoliaTmax0.497Tmax ∩ LC0.674
Region ITmax0.462Tmax ∩ LC0.661
Region IITmax0.515Tmax ∩ Tmin0.844
Region IIIPRE0.547PRE ∩ DEM0.636
Region IVPRE0.815PRE ∩ DEM0.9
Region VDEM0.627Tmax ∩ PRE0.514
2022MongoliaTmax0.652Tmin ∩ PRE0.549
Region ILC0.681DEM ∩ Tmin0.646
Region IIDEM0.671DEM ∩ PRE0.673
Region IIIPRE0.525PRE ∩ DEM0.567
Region IVPRE0.871PRE ∩ DEM0.977
Region VPRE0.540PRE ∩ DEM0.569
Disclaimer/Publisher’s Note: The statements, opinions and data contained in all publications are solely those of the individual author(s) and contributor(s) and not of MDPI and/or the editor(s). MDPI and/or the editor(s) disclaim responsibility for any injury to people or property resulting from any ideas, methods, instructions or products referred to in the content.

