1. Introduction
Soil organic carbon (SOC) is an essential component of terrestrial ecosystems and an important descriptor of soil health in agro-environmental systems [
1]. Hence, monitoring changes in SOC at national and global levels is critical. It helps to identify areas at risk, prevent degradation, and evaluate the efficiency of regenerative agricultural practices and relevant policies. In the era of soil information technology, recent advances in spaceborne sensing platforms and non-destructive sensing devices have emerged as key tools. Their integration with artificial intelligence (AI) algorithms should be further explored for enhancing analysis towards an accurate and cost-effective approach.
In the last several decades, SOC mapping and monitoring at a large scale mainly relied on digital soil mapping techniques based on the SCORPAN method [
2]. For instance, previous works proposed the use of multiple environmental variables to develop SOC content models [
3]. This digital approach usually results in spatial products with coarse resolution impeding regular assessments of soil threats at a field-scale level [
4]. The recent shift towards utilizing AI regression techniques, such as convolution neural networks (CNNs) to leverage spatial contextual information results in a notable improvement in predicting various soil properties [
5,
6]. More recently, CNNs have also been used to capture intricate patterns in the satellite imagery data of exposed soils frequently yielding further improvement in the predictive performance when applied on a national or global scale [
7]. However, the performance is still moderate and this can be attributed to the limited spectral range of current multispectral systems [
8] and a set of ambient factors that affect spaceborne spectral signatures [
9,
10]. Digital soil mapping aims to expand further, driven by advancements in data cube technology [
11], allowing analysis-ready data to be generated and provided routinely to support large-scale applications. Hence, we are transitioning from merely delivering gridded soil layers [
4] to offering information that can enhance decision-making through the utilization of new algorithms and refined spatial prediction [
12]. This shift underscores a need for open data initiatives, facilitating access to valuable datasets for broader analysis and application [
13].
Integrating remote sensing data with observations collected by laboratory spectroscopy with advanced AI regression techniques also holds a promising future to improve models’ accuracy and reliability. For instance, Rosin et al. [
14] made use of visible-near- and short-wave infrared (VNIR–SWIR) data from a national soil spectral library to estimate the abundance of minerals. Subsequently, these estimations were used in a second research step with spatially explicit indicators of environmental covariates and bare soil reflectance composites to upscale the predictions at a regional level. Similarly, other studies, constrained to a field scale, have evaluated the combination of reflectance spectroscopy and multiple environmental covariates or multispectral information [
15,
16]. Results from small-scale studies combining laboratory spectroscopy and Earth-Observation data have shown promising outcomes, especially when incorporating machine learning approaches, resulting in significant accuracy gain [
17].
Despite the extensive usage of analytical spectroradiometers, their widespread adoption is limited due to the high cost of obtaining and analyzing the data. Cutting-edge developments in photonics have resulted in more affordable and miniaturized hyperspectral spectrometers [
18], allowing for the application of spectroscopy technology from the laboratory scientific conditions to production-level applications, where non-specialized users will be able to utilize the new sensors. Envisioning a future where growers and land managers could survey soil properties to track changes in a routine way, several research groups have explored and compared the effectiveness of various low-cost photonic-based devices [
19,
20]. They have demonstrated comparable accuracies between miniaturized Fourier-transform VNIR and full VNIR spectrometers in predicting SOC across diverse soil types. Priori et al. [
21] utilized the Neo-Spectra scanner for predicting soil properties using PLSR, resulting in a slightly lower accuracy compared to an analytical device. Given the research community’s interest, Mitu et al. [
22] evaluated its consistency and reliability in spectral acquisition and model calibration before widespread adoption in research and application.
Additional challenges arise from the predominant focus on making use of soil reflectance spectroscopy and environmental covariates from satellite data independently, with limited focus emphasis on exploiting the synergies between the two for estimating soil properties. Previous investigations have addressed this by combining data from satellite remote sensing and laboratory sensors with Random Forest hybridized with particle swarm optimization algorithm [
23]. Recently, a novel approach combining NIR spectroscopy, remote sensing data, and CNNs through a concatenation layer to estimate the crucial soil properties controlling soil health at the field level has been presented [
24]. However, merging spectral data and environmental covariates within deep learning architectures requires careful design to ensure that the model appropriately combines and processes both types of information, enabling their interpretability [
25].
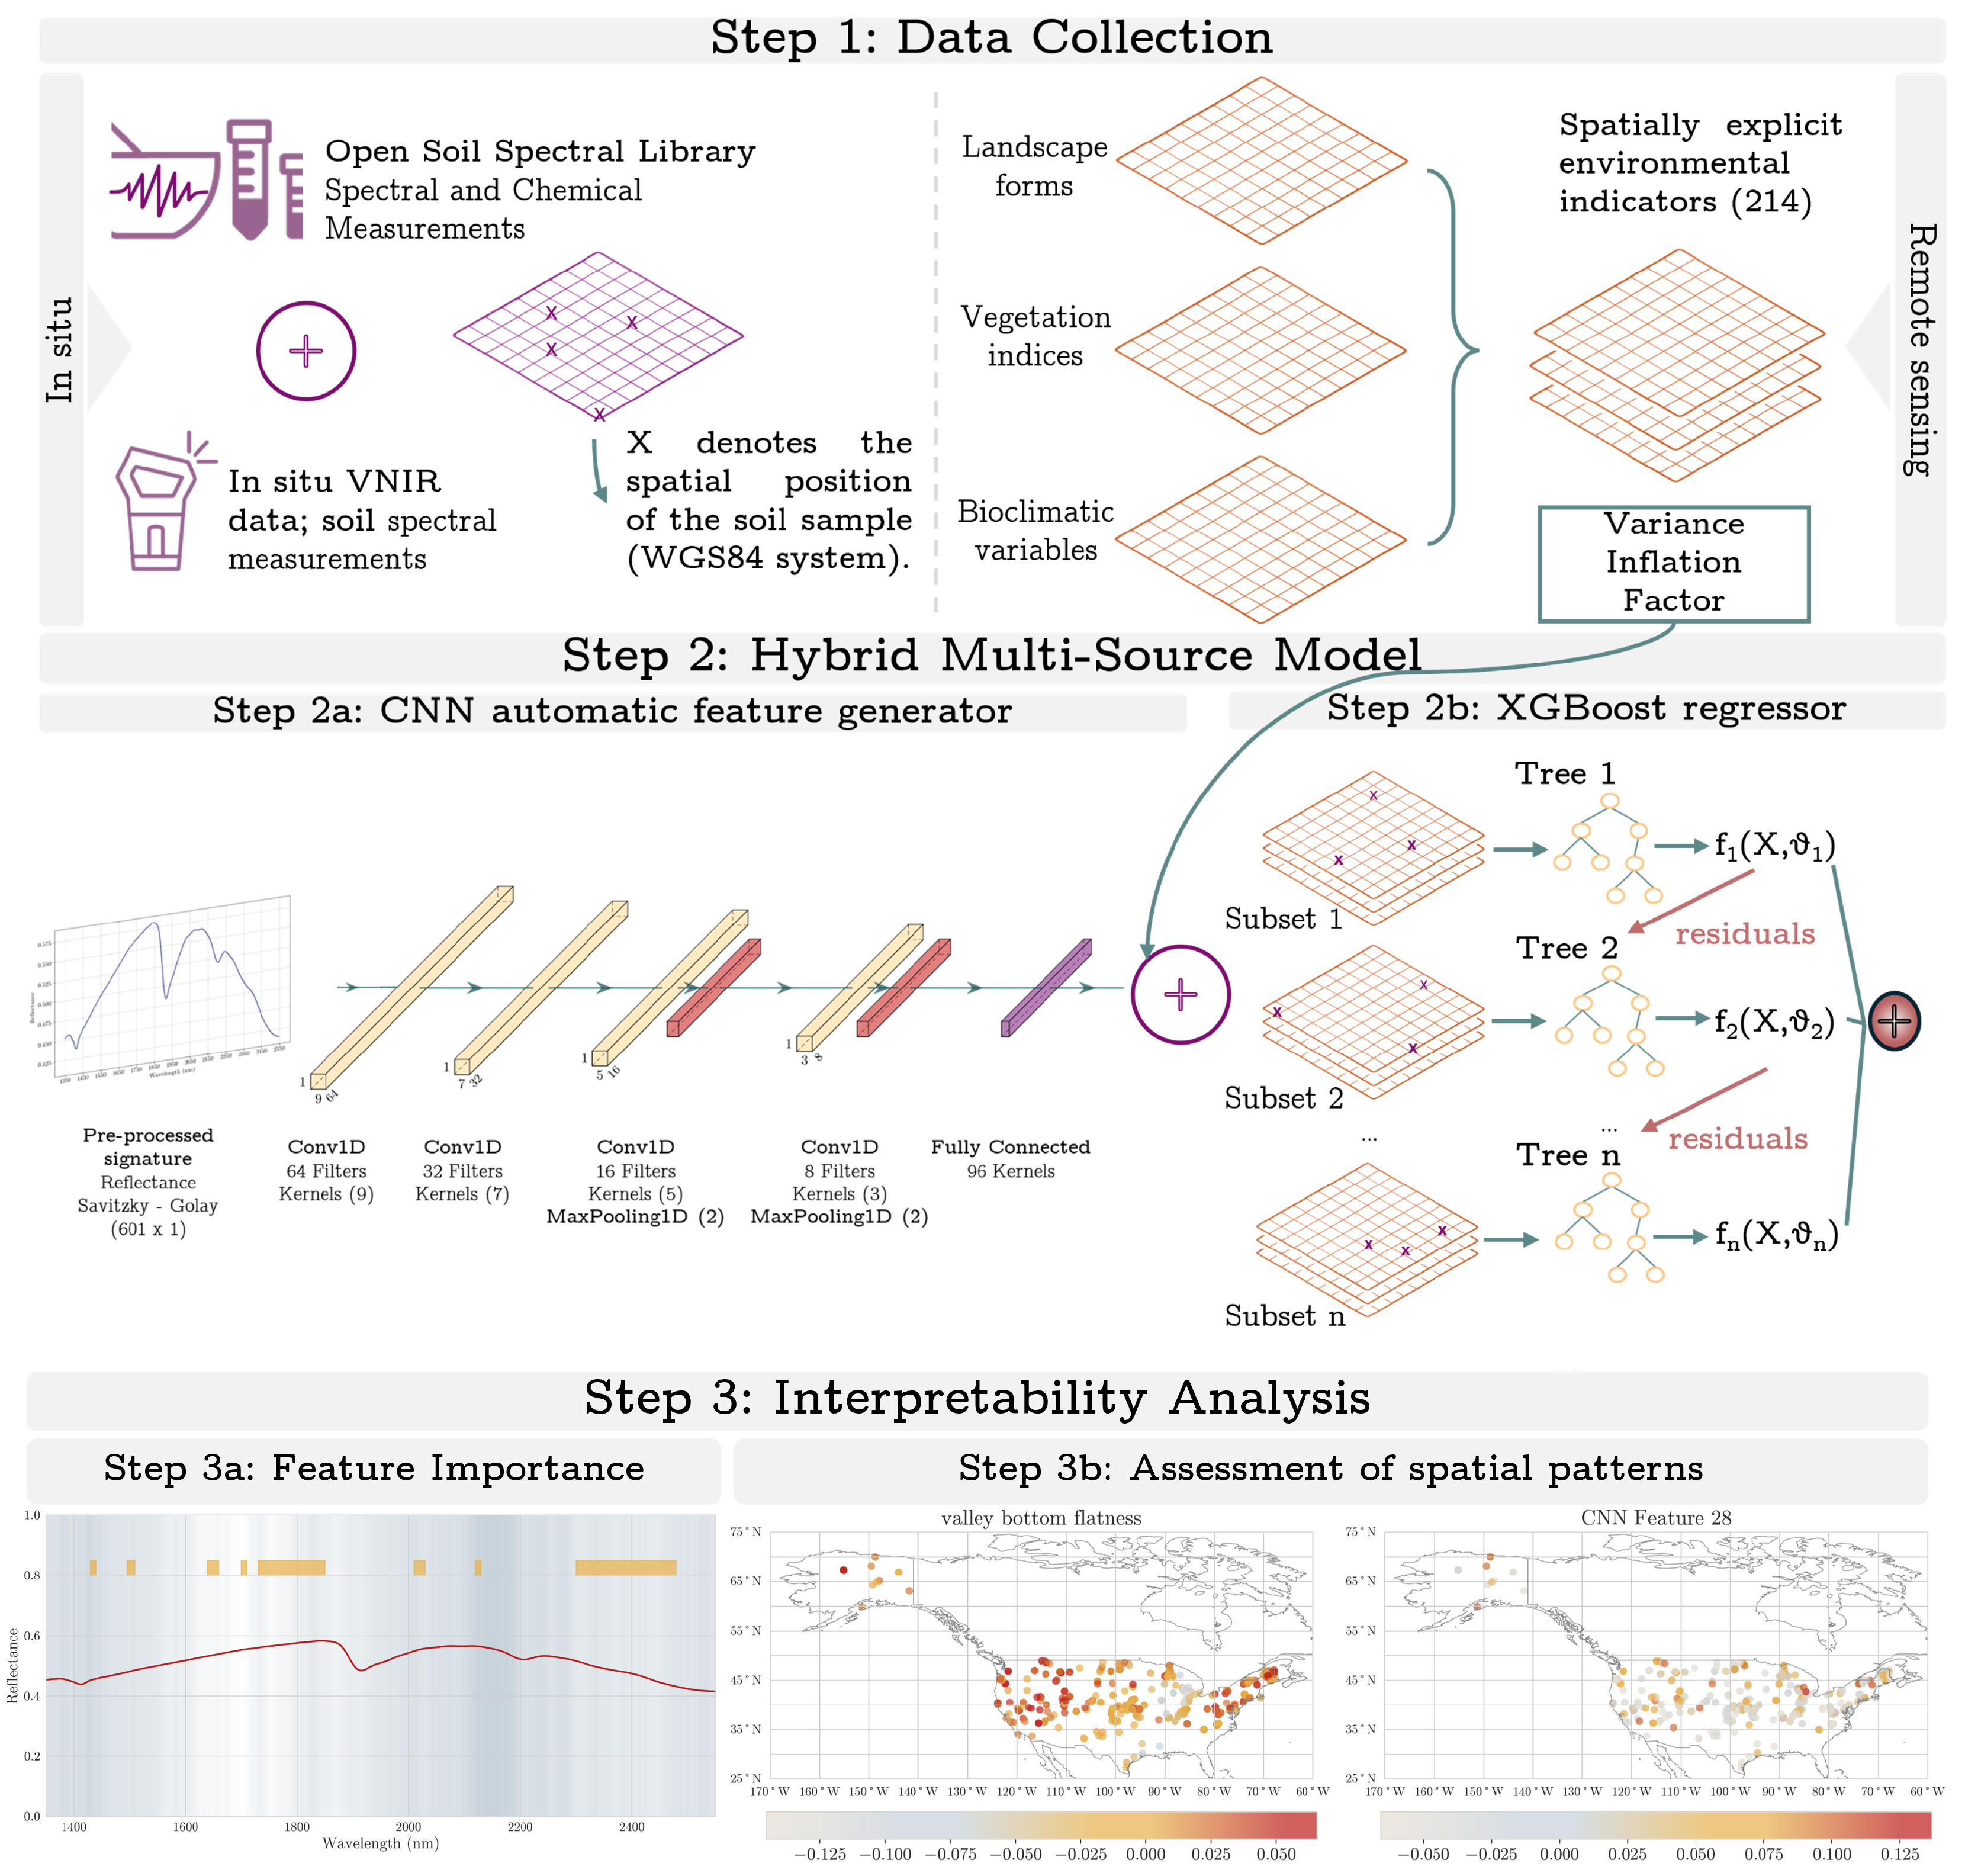
Based on the existing experimental framework, we identified two constraints that currently hinder the accurate estimation of SOC: (i) despite growing low-cost spectroradiometers usage, their synergistic integration with spaceborne-derived environmental data remains unexplored as well as their applicability at a continental scale and (ii) simple merging techniques may not fully exploit the complementary nature of the data, potentially resulting in information loss or misinterpretation. In this context, the objective of this study is to further contribute to the understanding of how environmental covariates derived from remote sensing data (henceforth noted as covariates) and laboratory soil NIR reflectance information (henceforth referred to as spectral data) can be synergistically exploited to provide enhanced SOC content estimations using an efficient data fusion approach. A hybrid regression framework was proposed, where diverse data inputs are fed into two distinct streams. One stream, a CNN, acts as a feature preprocessor and generator, by extracting meaningful information from the Neo-Spectra spectral data, while the other, an ensemble learning model (XGBoost or Random Forest), employs 214 raster spatial layers along with the generated spectral features, towards the final estimation of the SOC values. The current research employs a diverse soil database from independent locations sampled across the US to evaluate the results in the state of Massachusetts and New York, while techniques for interpretability have been applied, providing insights into the inner workings of the model and uncovering the relationships between the various landscape forms, vegetation indices, and bio-climatic variables, as well as a portable device’s spectral recordings and the SOC content values. Thus, this research provides a framework to integrate remotely sensed two-dimensional data with in situ one-dimensional spectral signatures, synergistically combining these data sources to enhance predictive capabilities and ultimately inform improved farm-level management strategies.
2. Material and Methods
The methodological approach of our study comprises three steps: (i) data collection; (ii) regression analysis based on a hybrid regression model; and (iii) a post hoc analysis where we evaluate the model’s interpretability and the spatial assessment of its predictions. An overview of the proposed workflow is presented in
Figure 1.
2.1. Soil Data
This study utilizes publicly available datasets derived from previous research initiatives. Specifically, the Neo-Spectra NIR database [
26], which is readily accessible through the Open Soil Spectral Library (
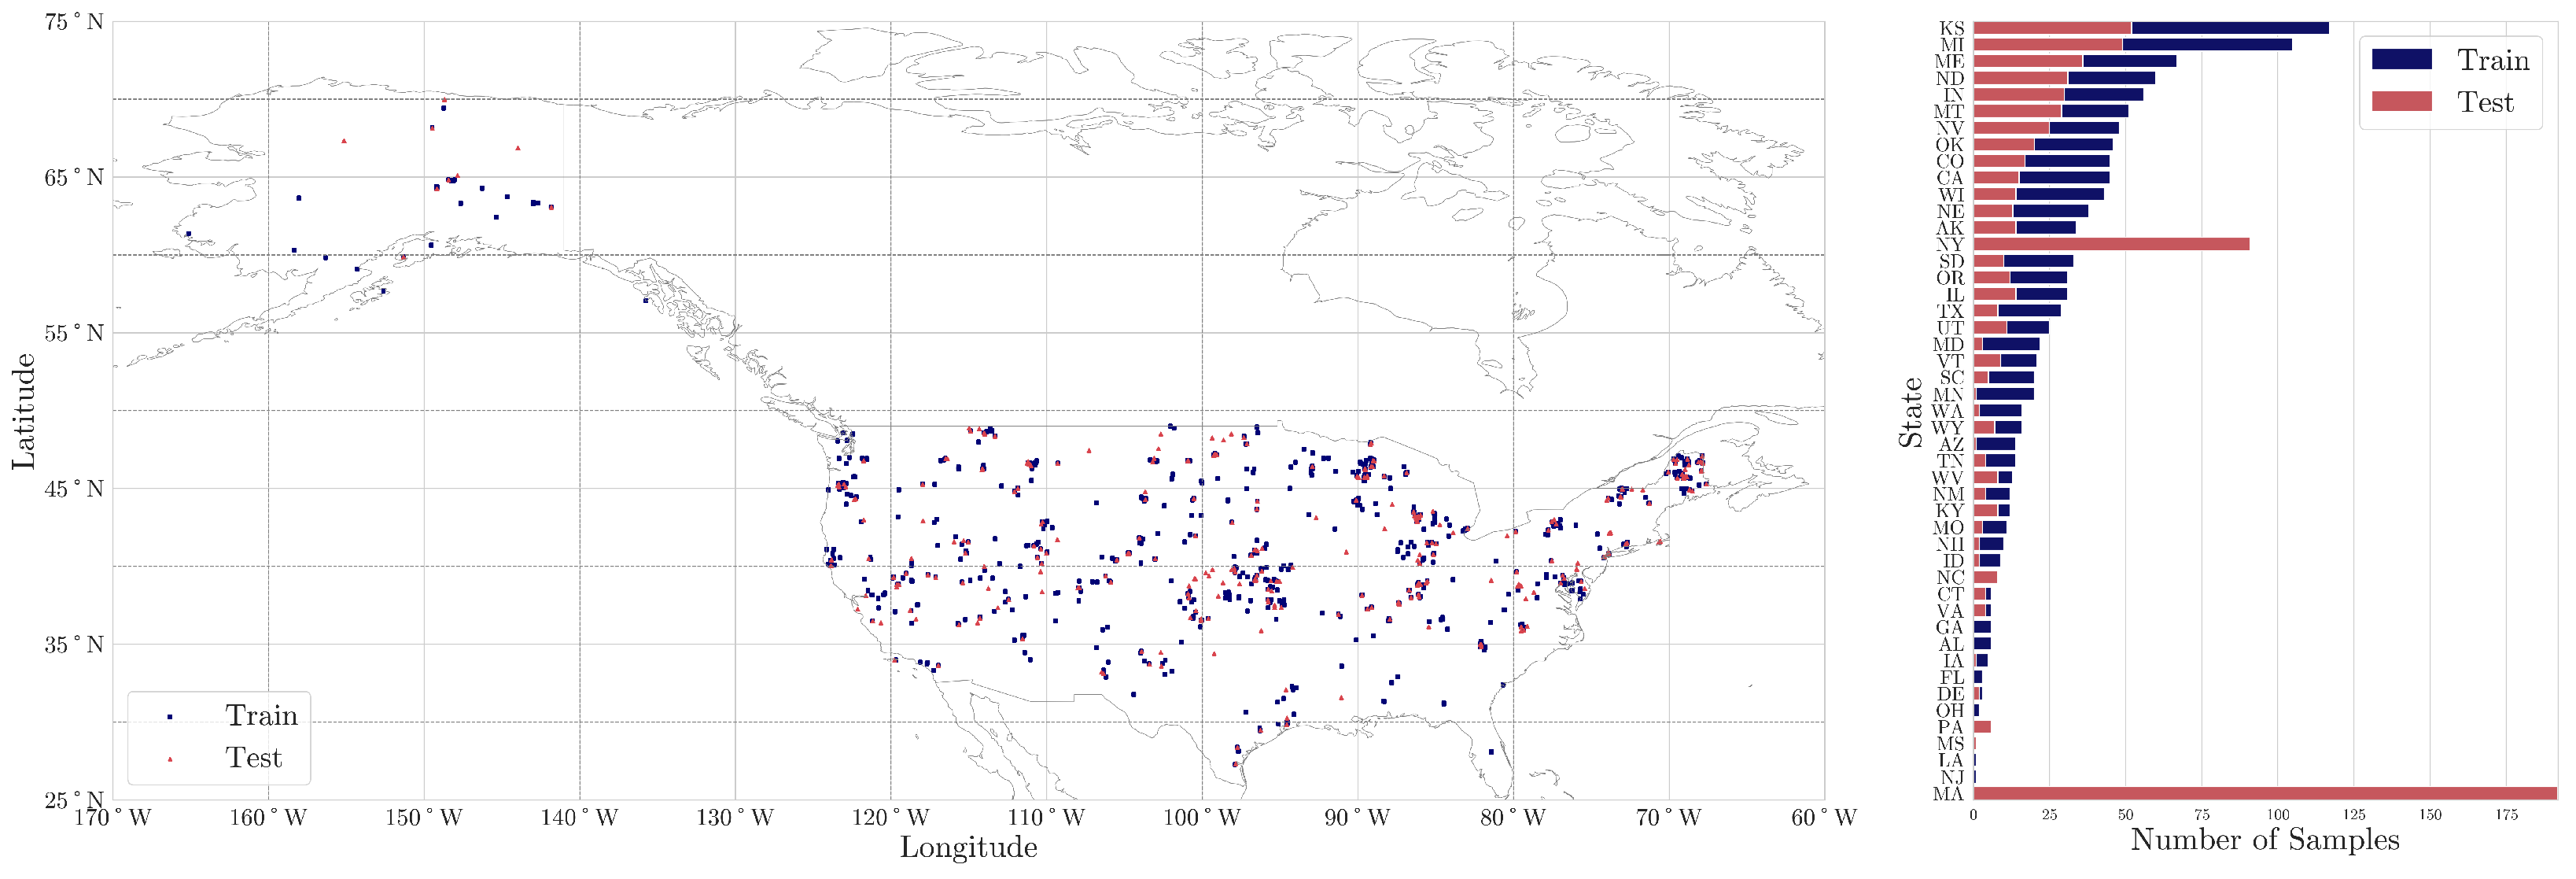
explorer.soilspectroscopy.org), accessed on 13 March 2024, was employed. The selected dataset in this study comprises a collection of 1706 soil samples from across the United States of America (
Figure 2) with analytical data on SOC content. These samples were split into train (1202) and test (504) sets, with a ratio of 70%:30%. In addition, our study incorporated a second distinct test set of 269 samples collected from various farms across Massachusetts and New York states, in the years 2021 and 2022, respectively, thus bringing the total number of test samples to 773. All soil samples are given here with precise location coordinates, specified in the WGS84 format. The main training set was chosen to represent the diversity of mineral soil properties found in the United States [
26] while the local farm test sets were provided as part of a Kaggle soil spectroscopy competition to find novel ways of utilizing a national spectral library at the local scale [
27] (
Figure 2). Therefore, the distribution of samples was not a design choice made in this current study.
The SOC content was determined as the difference between total carbon, measured using dry combustion, and calcium carbonate, measured by a pressure calcimeter [
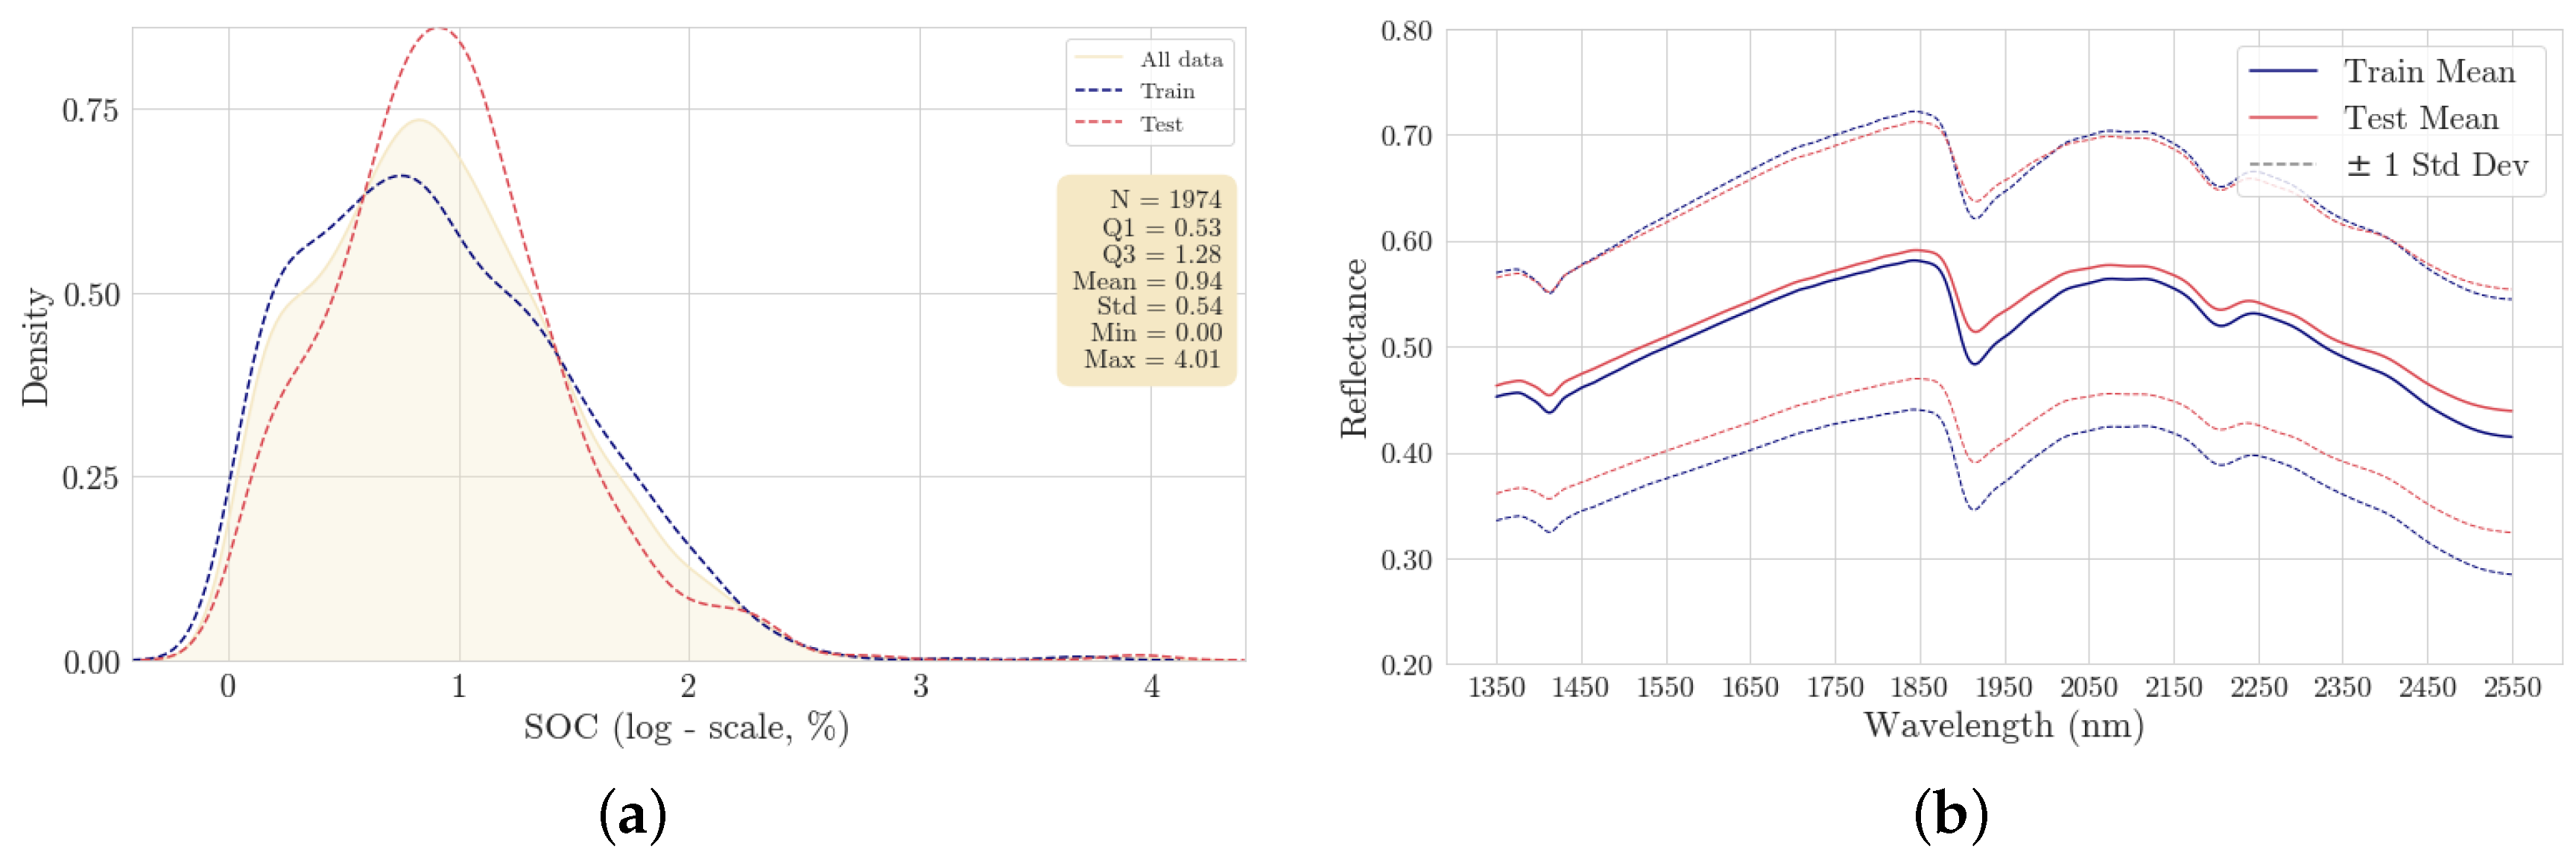
28]. Overall, it exhibits a highly skewed probability distribution as naturally expected. Therefore, the representation of SOC content is adjusted to a logarithmic scale (taking the natural logarithm with offset 1), as presented in
Figure 3a for both the train and test sets. All samples were accompanied by precisely measured spectra covering the wavelength range of 1350 to 2550 nm. These measurements contained 258 records, which were interpolated to 2 nm resolution, resulting in the final format of 601 spectral features. A white reference material was used with the Neo-Spectra sensor for scanning calibration. A comparative plot of the mean reflectance spectra for both train and test sets, including their standard deviations, is presented in
Figure 3b, allowing us to visually assess the variability and consistency across the spectral signatures captured with the Neo-Spectra sensor (Si-Ware Systems, Cairo, Egypt). Similar patterns can be observed between train and test datasets.
2.2. Environmental Covariates
A set of 214 spatial layers was available as open geo-environmental covariates for this study, encompassing landform characteristics, climatic dynamics, and vegetation indices, to capture the multifaceted environmental influences on SOC. Landform and landscape information was also used since it provides crucial insights into terrain features that influence SOC distribution. Climatic information derived from BioClim v1.2, with a mean aggregated over 1981–2010 (CHELSA-climate) [
29], offered comprehensive temperature and precipitation patterns, supplemented by dynamic overlays of monthly aggregated water vapor and land surface temperature dynamics, along with long-term daytime and nighttime temperatures from 2000 to 2020. Lastly, the cropland spatial distribution from the previous work by Cao et al. [
30] was also used.
Table A1 in
Appendix A summarizes the geo-covariates used in this work.
2.3. Addressing Multicollinearity
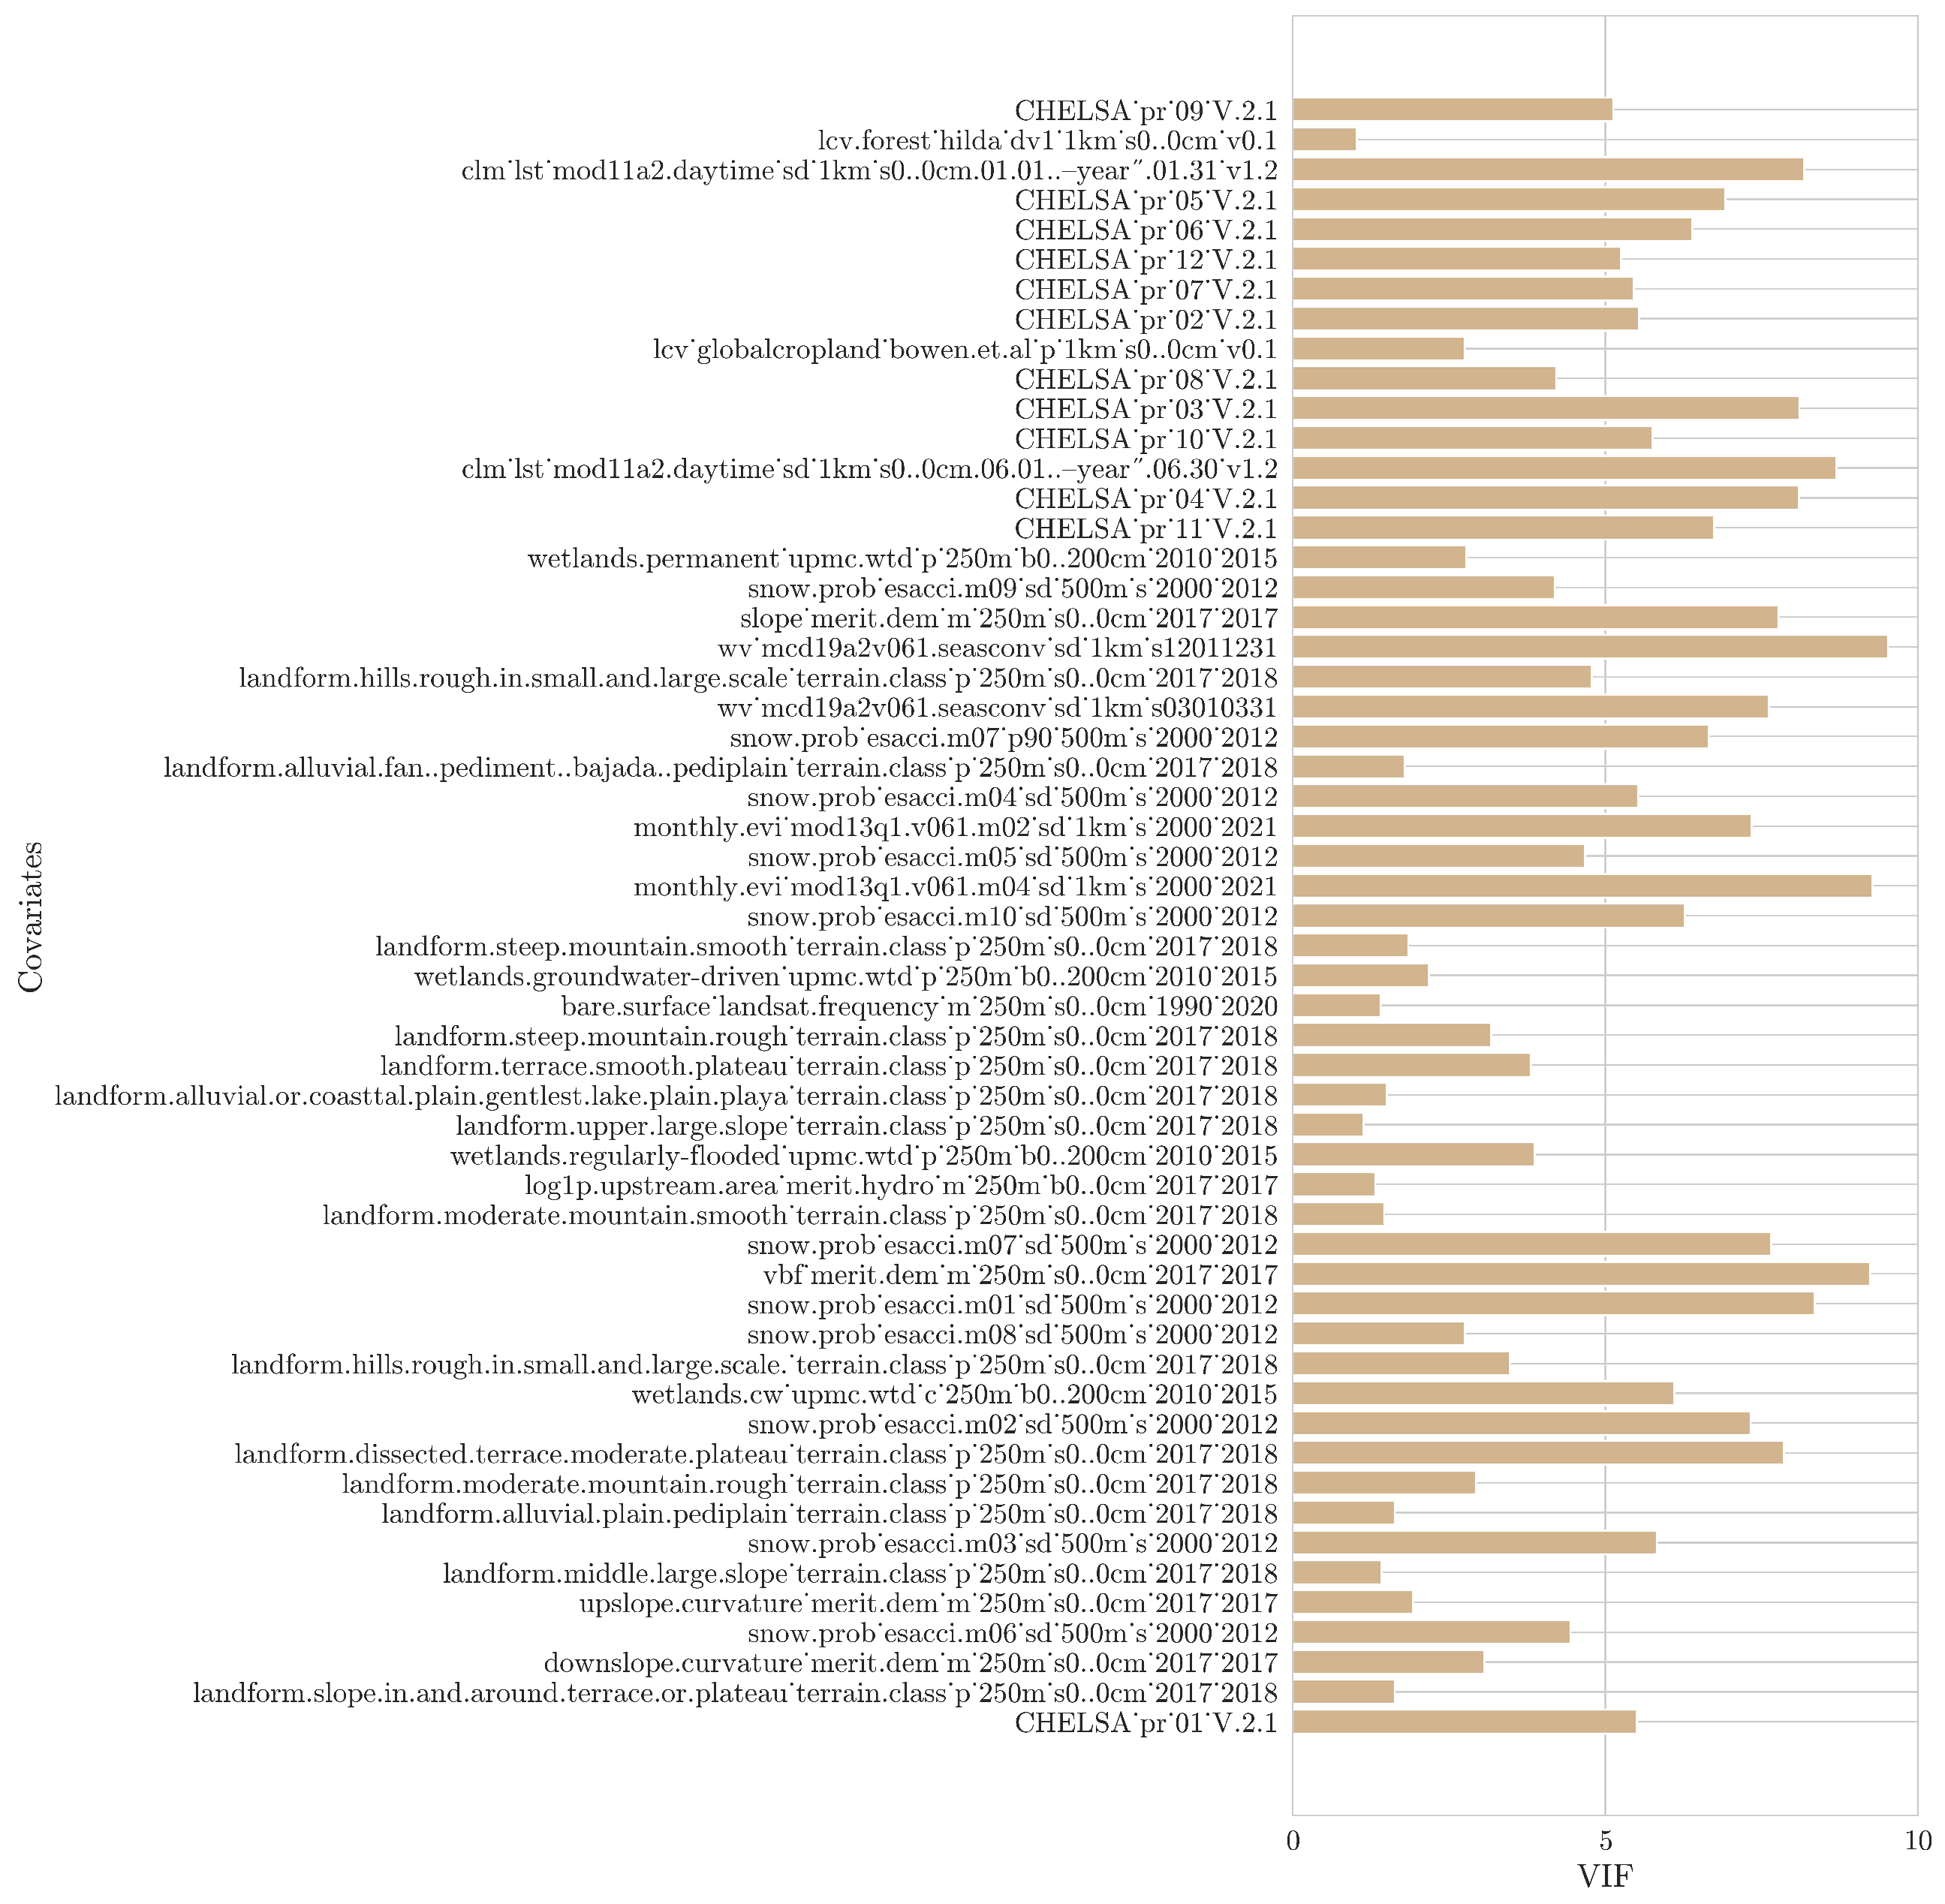
In order to eliminate the impact of multicollinearity amongst the environmental covariates, we utilized the variance inflation factor (VIF) analysis [
31]. The multicollinearity is measured by performing a regression with each covariate against all other covariates in order to derive multiple correlation coefficient values. These values are utilized to calculate the VIF as expressed in Equation (
1):
where
is the coefficient of determination obtained by regressing the
i-th predictor against all other predictors.
Subsequently, following a stepwise backward approach, the covariate with the highest VIF value was removed based on a specific cutoff value. A VIF of value one indicates no collinearity between the covariates; however, the threshold value is subjective and depends on the research aim. Based on previous studies, threshold values range from 5 to 10 to ensure a moderate correlation [
32]. A threshold of five has been selected in the current work.
2.4. Analysis Using Artificial Intelligence
It is important to highlight that spectral data and geo-covariates are distinct and heterogeneous in nature; hence, it is necessary to tailor our modeling approaches to maximize their predictive performance as well as their interpretability. Spectral data, being sequential and continuous, are ideal for feature extraction with CNNs, which excel at identifying complex patterns and achieving high accuracy on structured datasets. On the other hand, geo-covariates used in this study, such as climatic indices, and topographic variables, have diverse natures and lack a sequential structure required for CNNs to effectively process them. Applying a CNN to these heterogeneous data can hinder performance and interpretability.
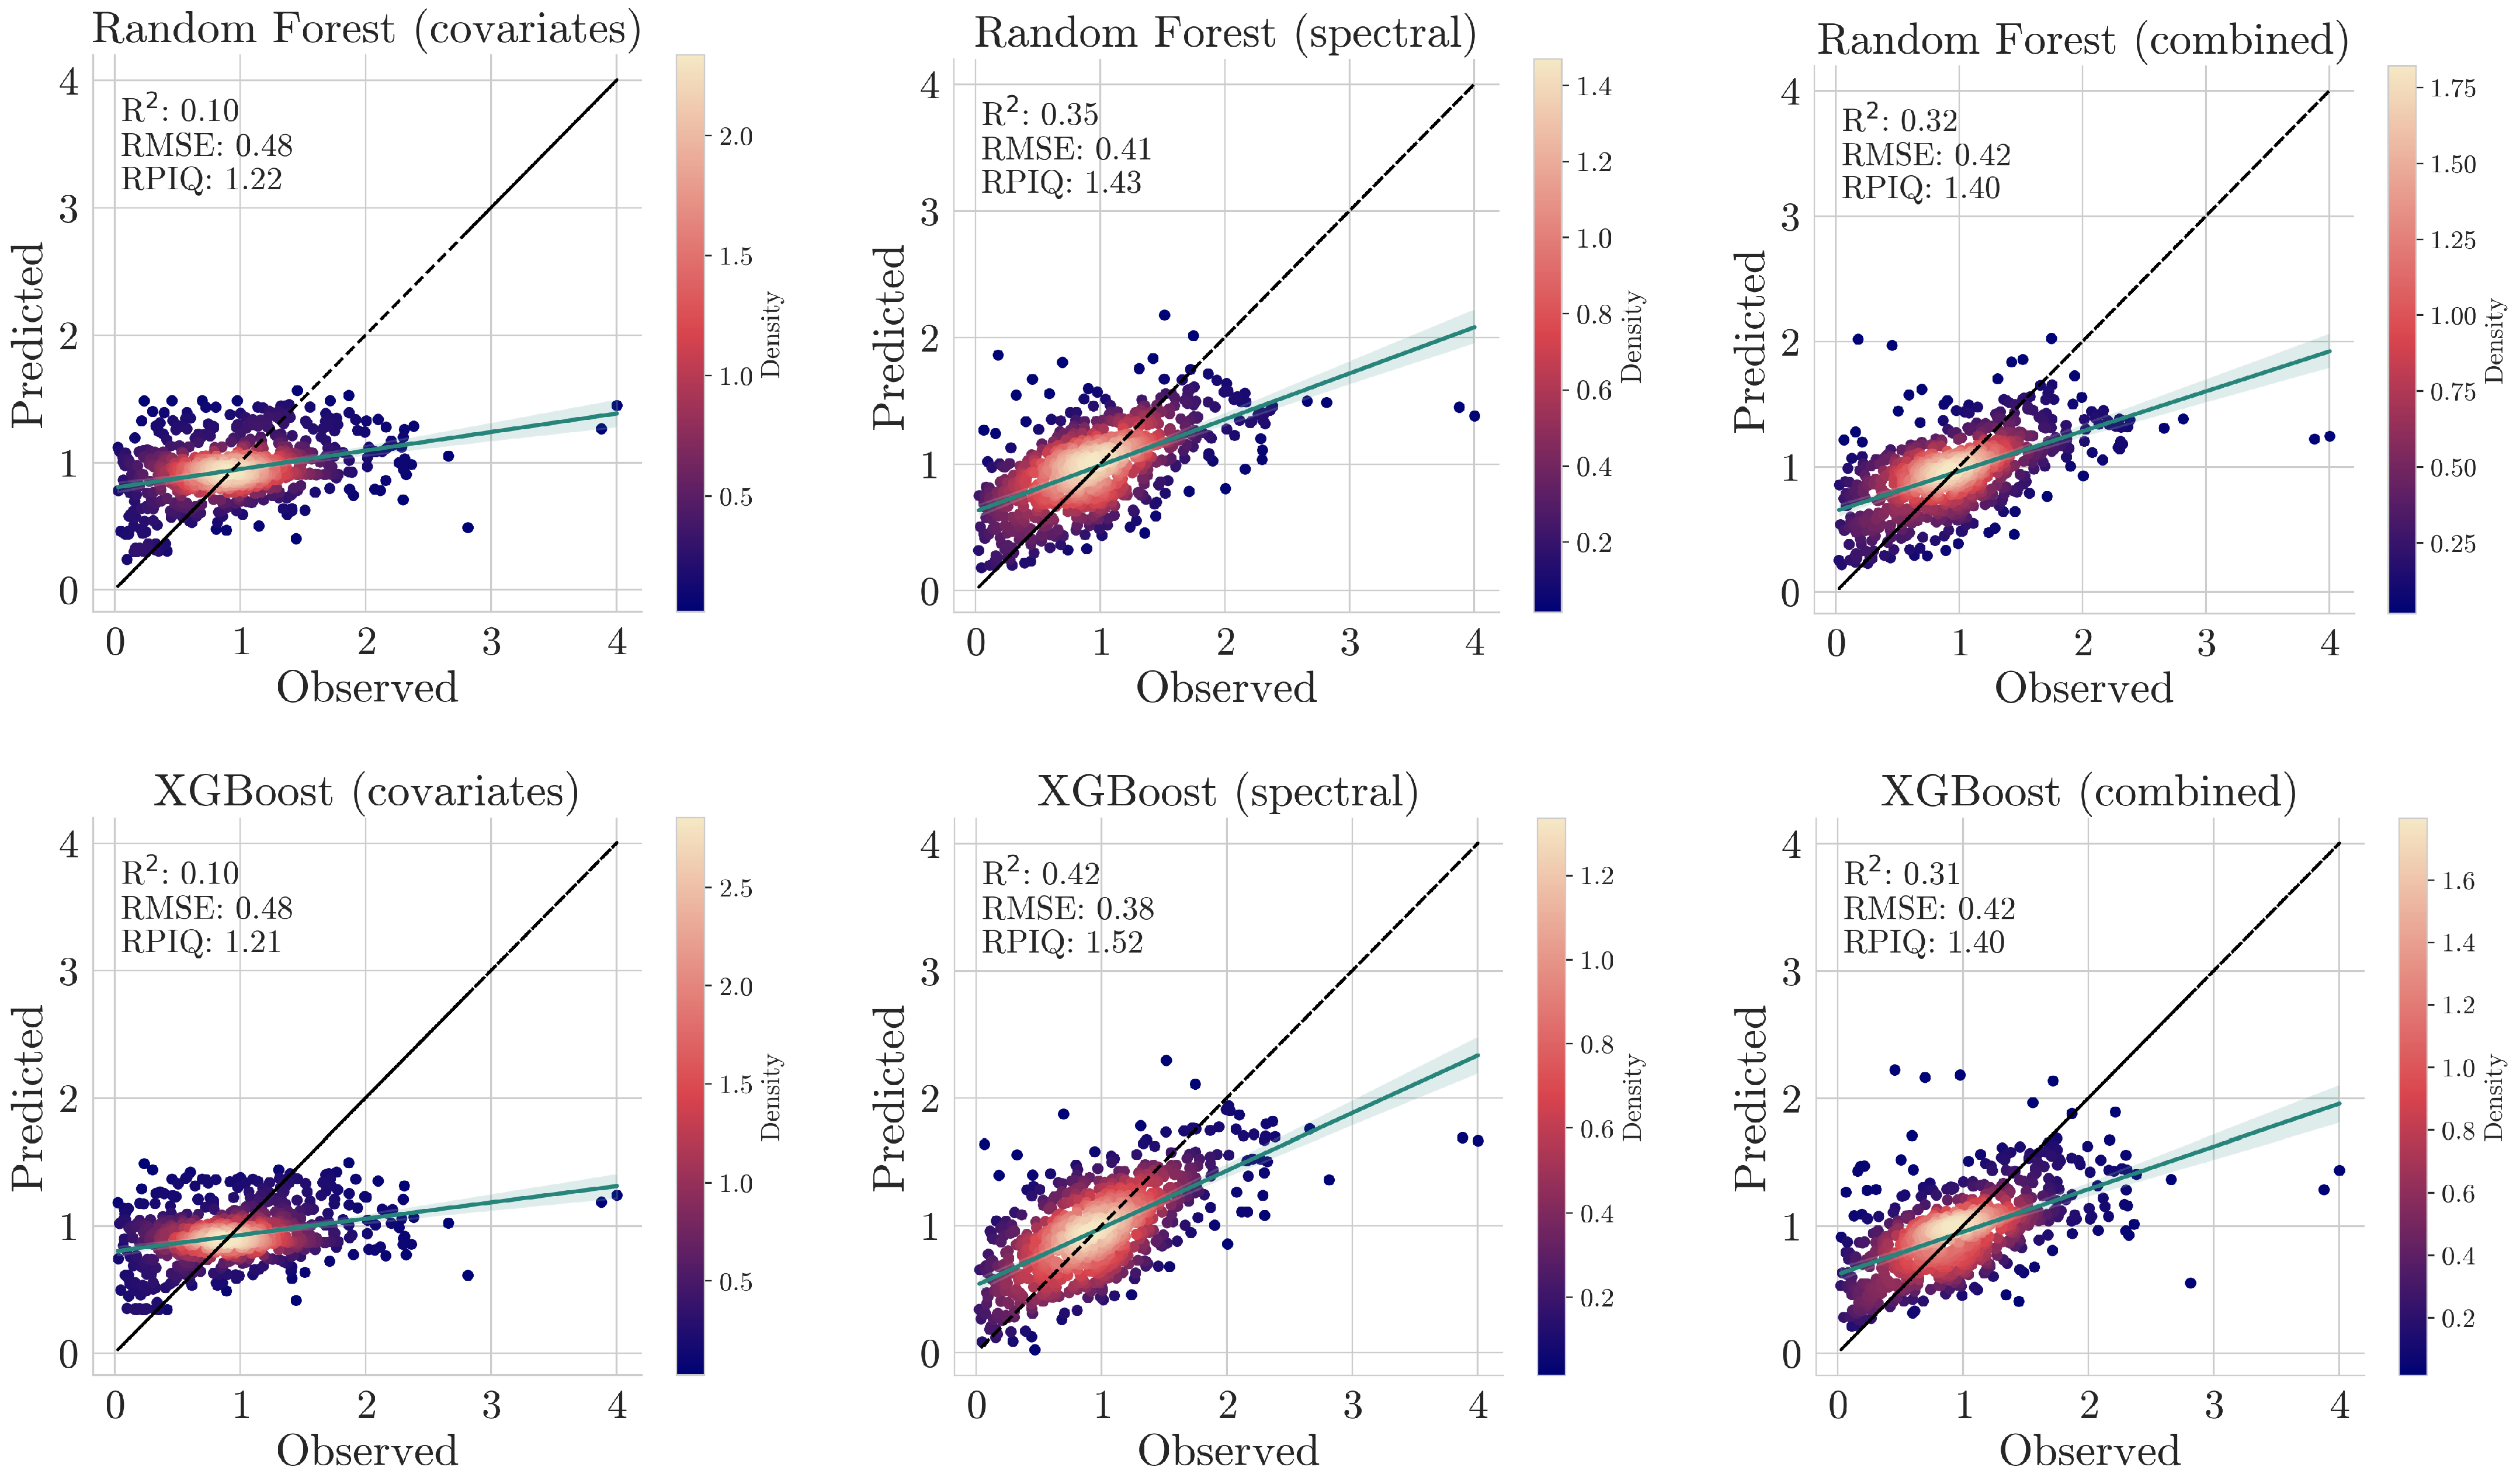
To address these challenges, a hybrid approach was adopted, where CNNs were used to extract features from spectral data that were integrated with other environmental covariates via machine learning models like Random Forests and XGBoost. To establish a baseline for comparison, we tested the performance of machine learning models on spectral data alone, geo-covariates alone, and the combined dataset. However, as previously explained, CNNs are not suitable for modeling covariates or combined data. Therefore, as an extra step, CNNs were applied exclusively to spectral data, allowing for a performance comparison between deep learning and traditional machine learning approaches.
In this section, we describe the architecture of the CNN and the ensemble learning methods (i.e., XGBoost and Random Forest) used for regression in the hybrid approach and as a standalone regressor for comparison with the proposed approach.
2.4.1. Description of the CNN Architecture
CNN, as an automatic feature generator, is initiated with an input layer designed to accept one-dimensional spectral recordings with a length of 601 (see
Section 2.1). Through an iterative refining probabilistic approach, namely the Tree-structured Parzen Estimator (TPE) algorithm [
33] and five-fold cross-validation, we evaluated the most promising hyperparameter configurations. Following the input layer, three convolutional layers with kernel sizes of 7 × 1, 5 × 1, and 3 × 1, respectively, each followed by Leaky ReLU activation functions, were used. These convolutional layers utilize 64, 32, and 16 filters, respectively. Subsequently, max-pooling layers with kernel sizes of 2 × 1 were applied to downsample the features’ generated information from the first convolutional layer. Following the pooling layers, two additional convolutional layers with kernel sizes of 3 × 1 and 8 filters, and 2 × 1 and 1 filter, respectively, continued the feature extraction process. Finally, the feature maps were flattened and passed through a fully connected layer with 128 neurons, employing Leaky ReLU activation functions. The CNN’s architecture is given in
Table 1. The model was trained for a maximum number of 2000 epochs or if no further improvement in the accuracy of the validation set was noticed for 50 epochs (plateau). The model converged at 253 epochs. The best hyperparameters to ensure efficiency and effectiveness in the proposed network are listed in
Table A2.
2.4.2. Ensemble Learning Models
We implemented both Random Forest (RF) and Extreme Gradient Boosting (XGBoost) regression models to estimate SOC from spectral recordings and the selected geo-covariates after the VIF approach (
Section 2.3). They are considered nonparametric regression models that are able to capture nonlinear relationships among the input features and minimize the risk of over-fitting by combining many trees operating with different feature subsets that are randomly selected. RF is an ensemble learning method that constructs a multitude of decision trees during training and returns the mean prediction of the individual trees [
34]. XGBoost is an efficient and scalable implementation of gradient boosting. Similarly to Random Forest, it builds a series of decision trees sequentially; however, each subsequent tree adjusts the errors made by the previous one at each step, resulting in a powerful ensemble model [
35].
Both Random Forest and XGBoost were optimized using a Bayesian approach in a five-fold cross-validation of the calibration set (i.e., where each evaluation of the set of hyperparameters is evaluated across the five folds) to systematically fine-tune their hyperparameters toward the maximization of the model’s predictive performance. We explored a range of values for each hyperparameter. We also tested different strategies for selecting the maximum features at each split, specifically using the square root (
) and base-2 logarithm (
) of the total number of features, where
M represents the total feature count. Similarly, for XGBoost, we applied Bayesian search to optimize hyperparameters, including maximum tree depth, learning rate, the number of estimators, column subsample ratio, and
regularization strength, ensuring a thorough evaluation of parameter values to maximize predictive accuracy. Briefly, in Random Forest, we evaluated the number of estimators within the range of 50 to 1000, testing maximum depth values from 3 up to 20 with a step of 1, and applying feature selection strategies that use the square root or base-2 logarithm of the total features. For XGBoost, we assessed tree depth values between 3 and 8, learning rates within {0.01, 0.05, 0.1, 0.2}, the number of estimators ranging from 10 to 1000, subsample ratios of [0.3–0.8, by step 0.1], and regularization strengths with L1 penalty values of 0, 5, and 10. We optimized hyperparameters for each dataset (spectral, geo-covariates, and combined) to tailor the models to their specific characteristics. Hence, the final models were trained using different configurations of optimized hyperparameters, tailored to each dataset and model to ensure an alignment with the specific characteristics of the spectral, the selected geo-covariates from the VIF approach, and combined datasets. All results, including hyperparameters and performance metrics, are summarized in
Table A3 for Random Forest models and
Table A4 for XGBoost models, while the results for the hybrid models are presented in
Table A5.
2.5. Interpretability
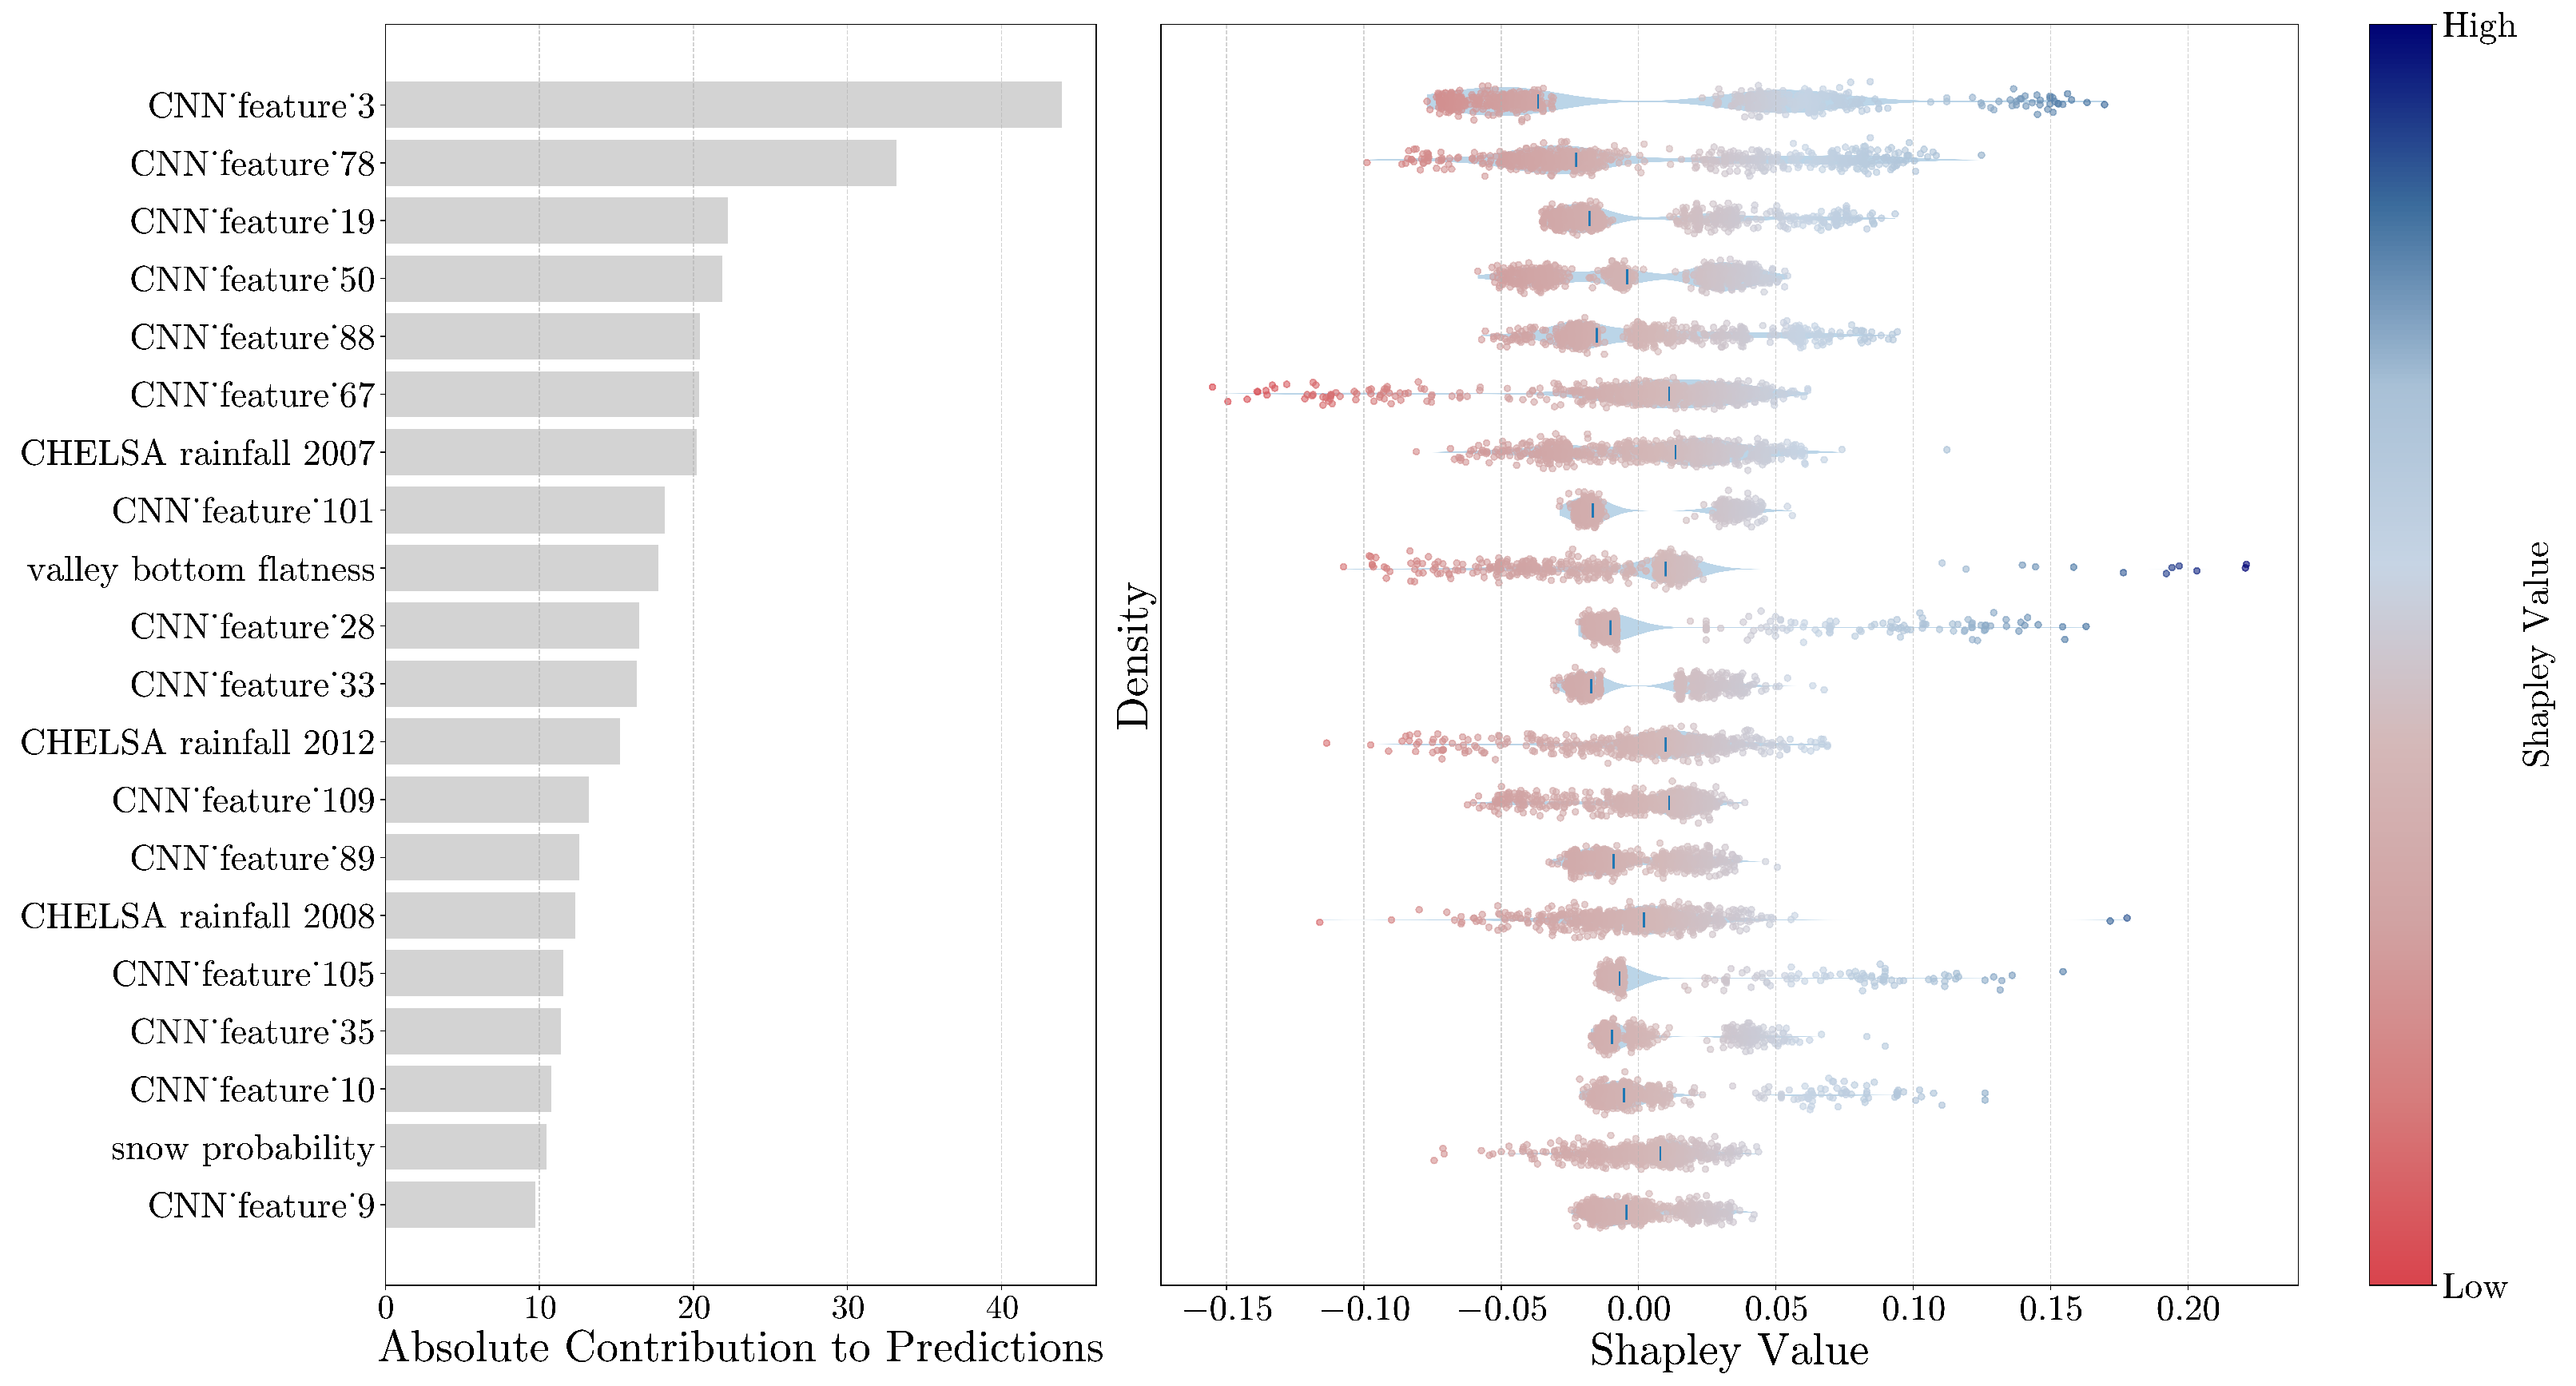
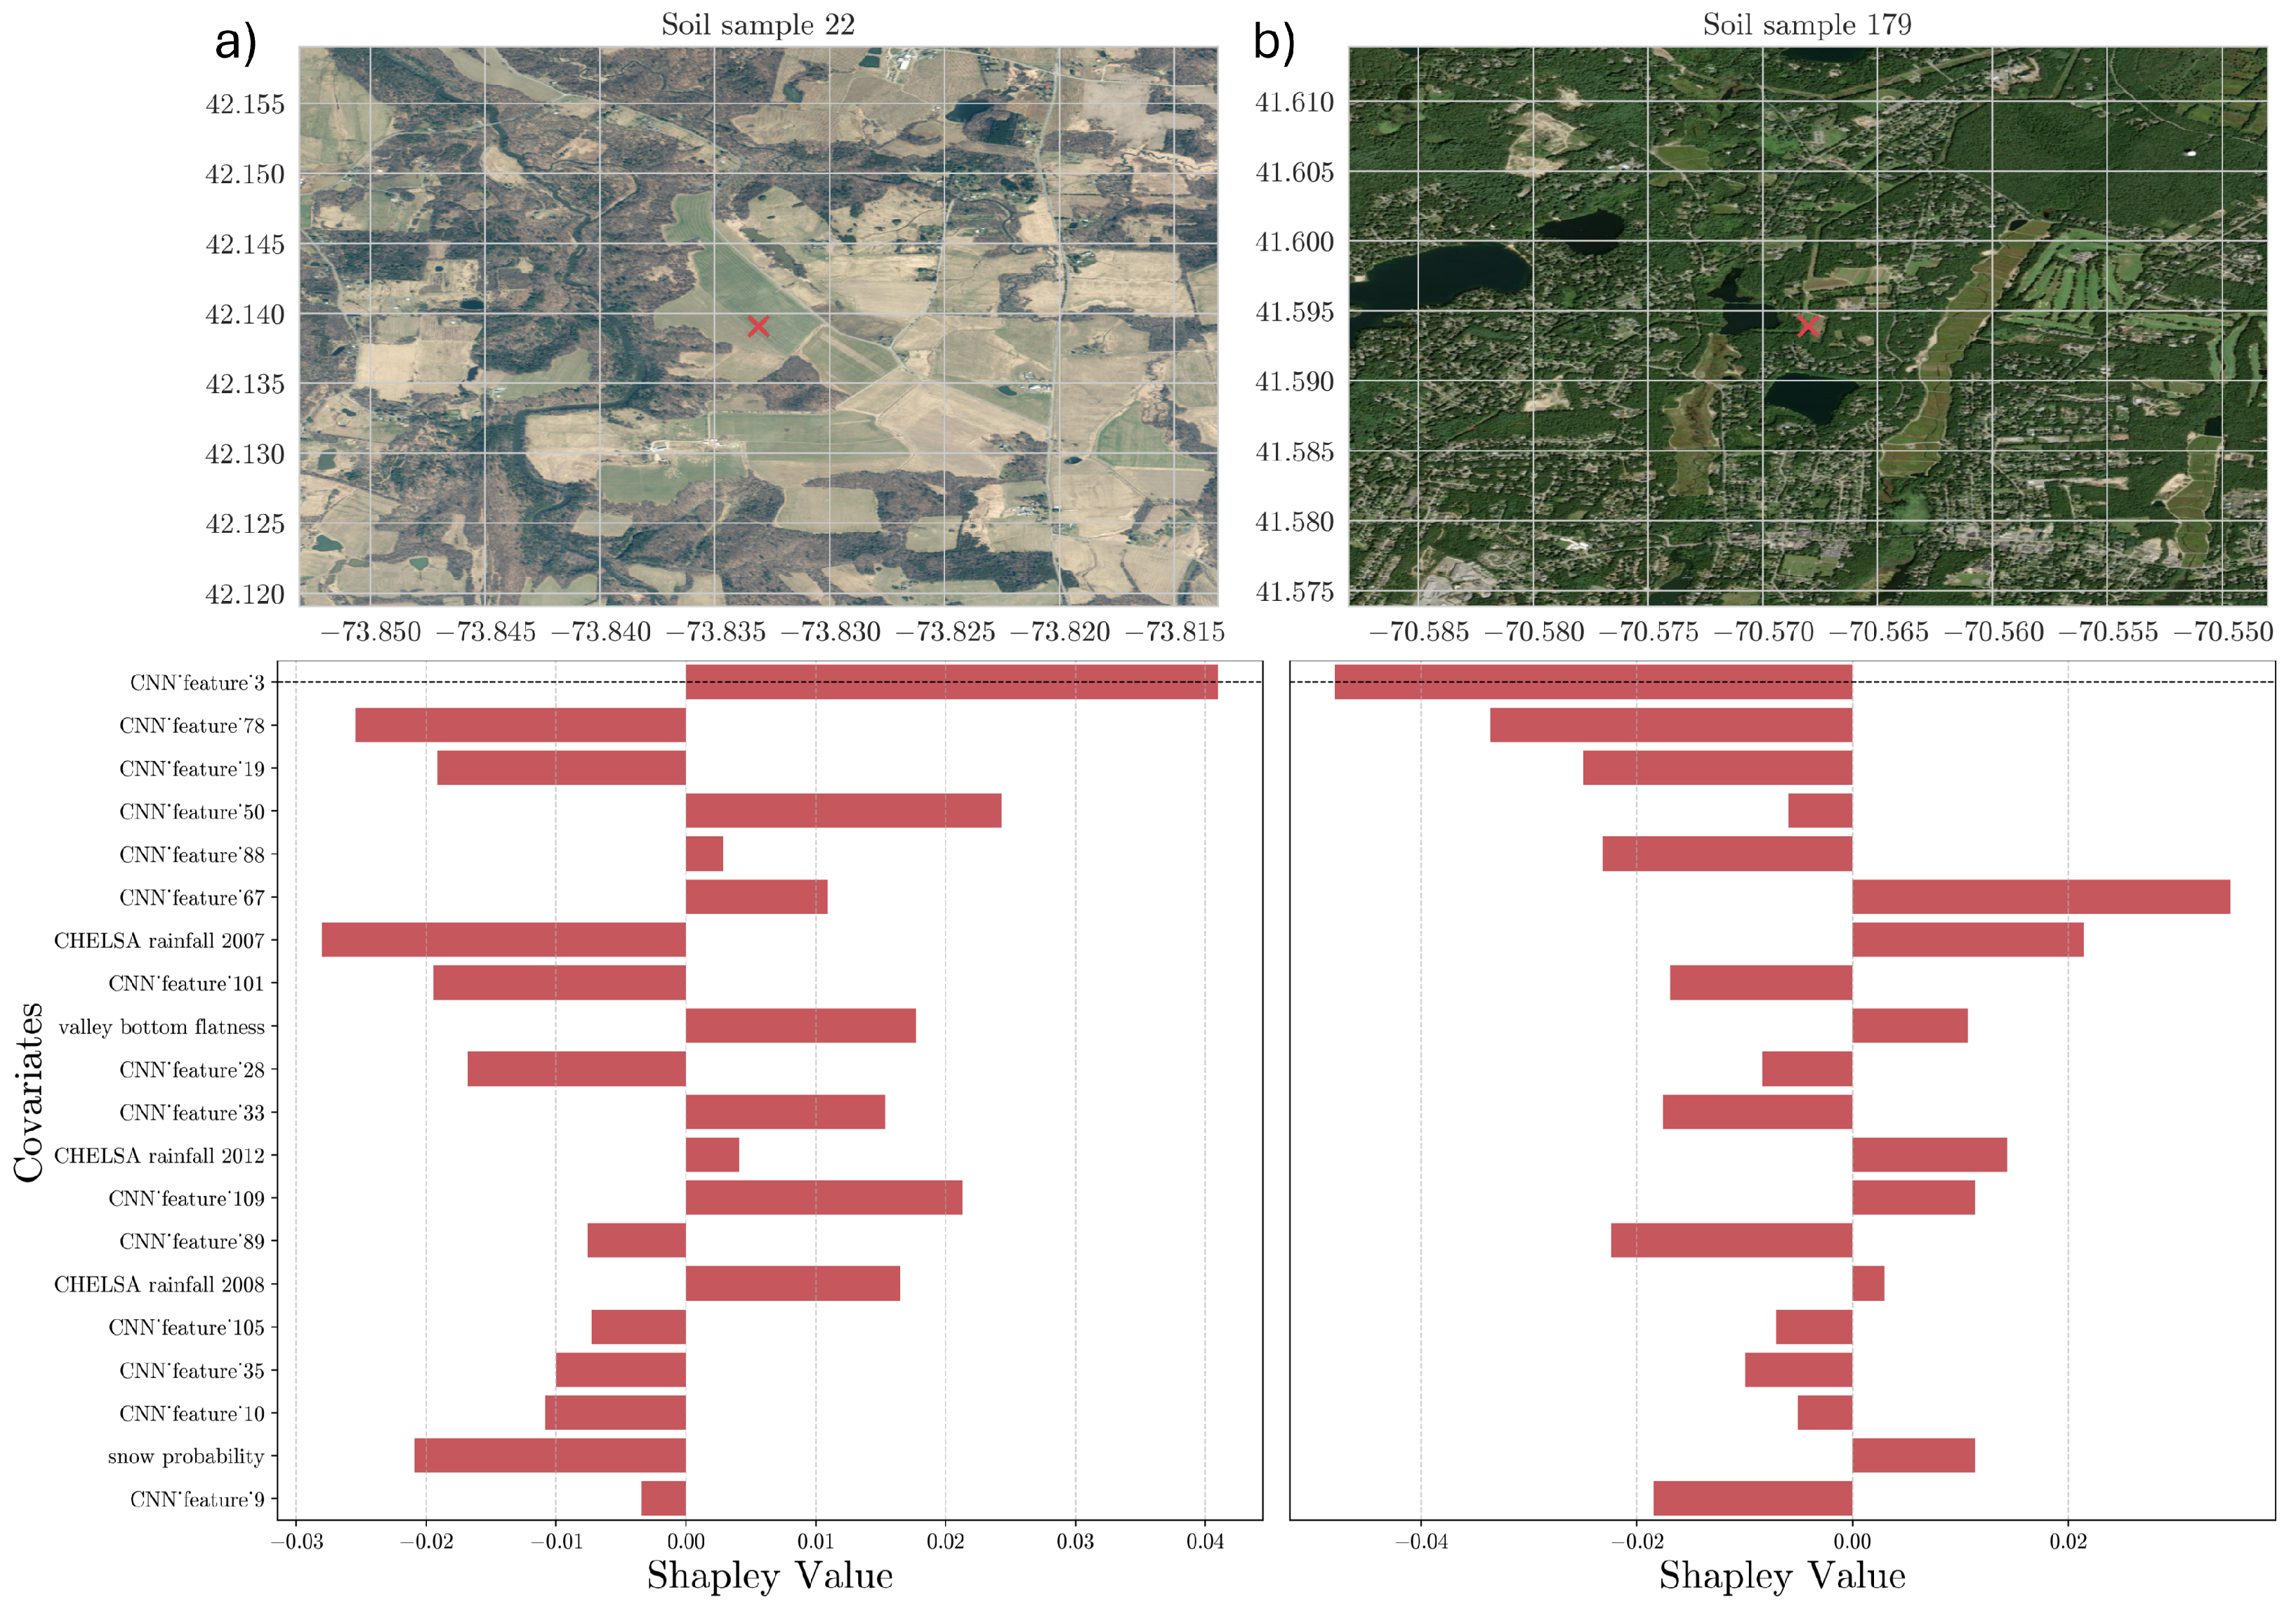
Shapley values were used to estimate how the input features, considering both the generated features from the CNN and the geo-covariates, affect the SOC predictions. Shapley values are one of the most used explainability techniques for ranking the input features and estimating their contribution to the model’s predictions per instance [
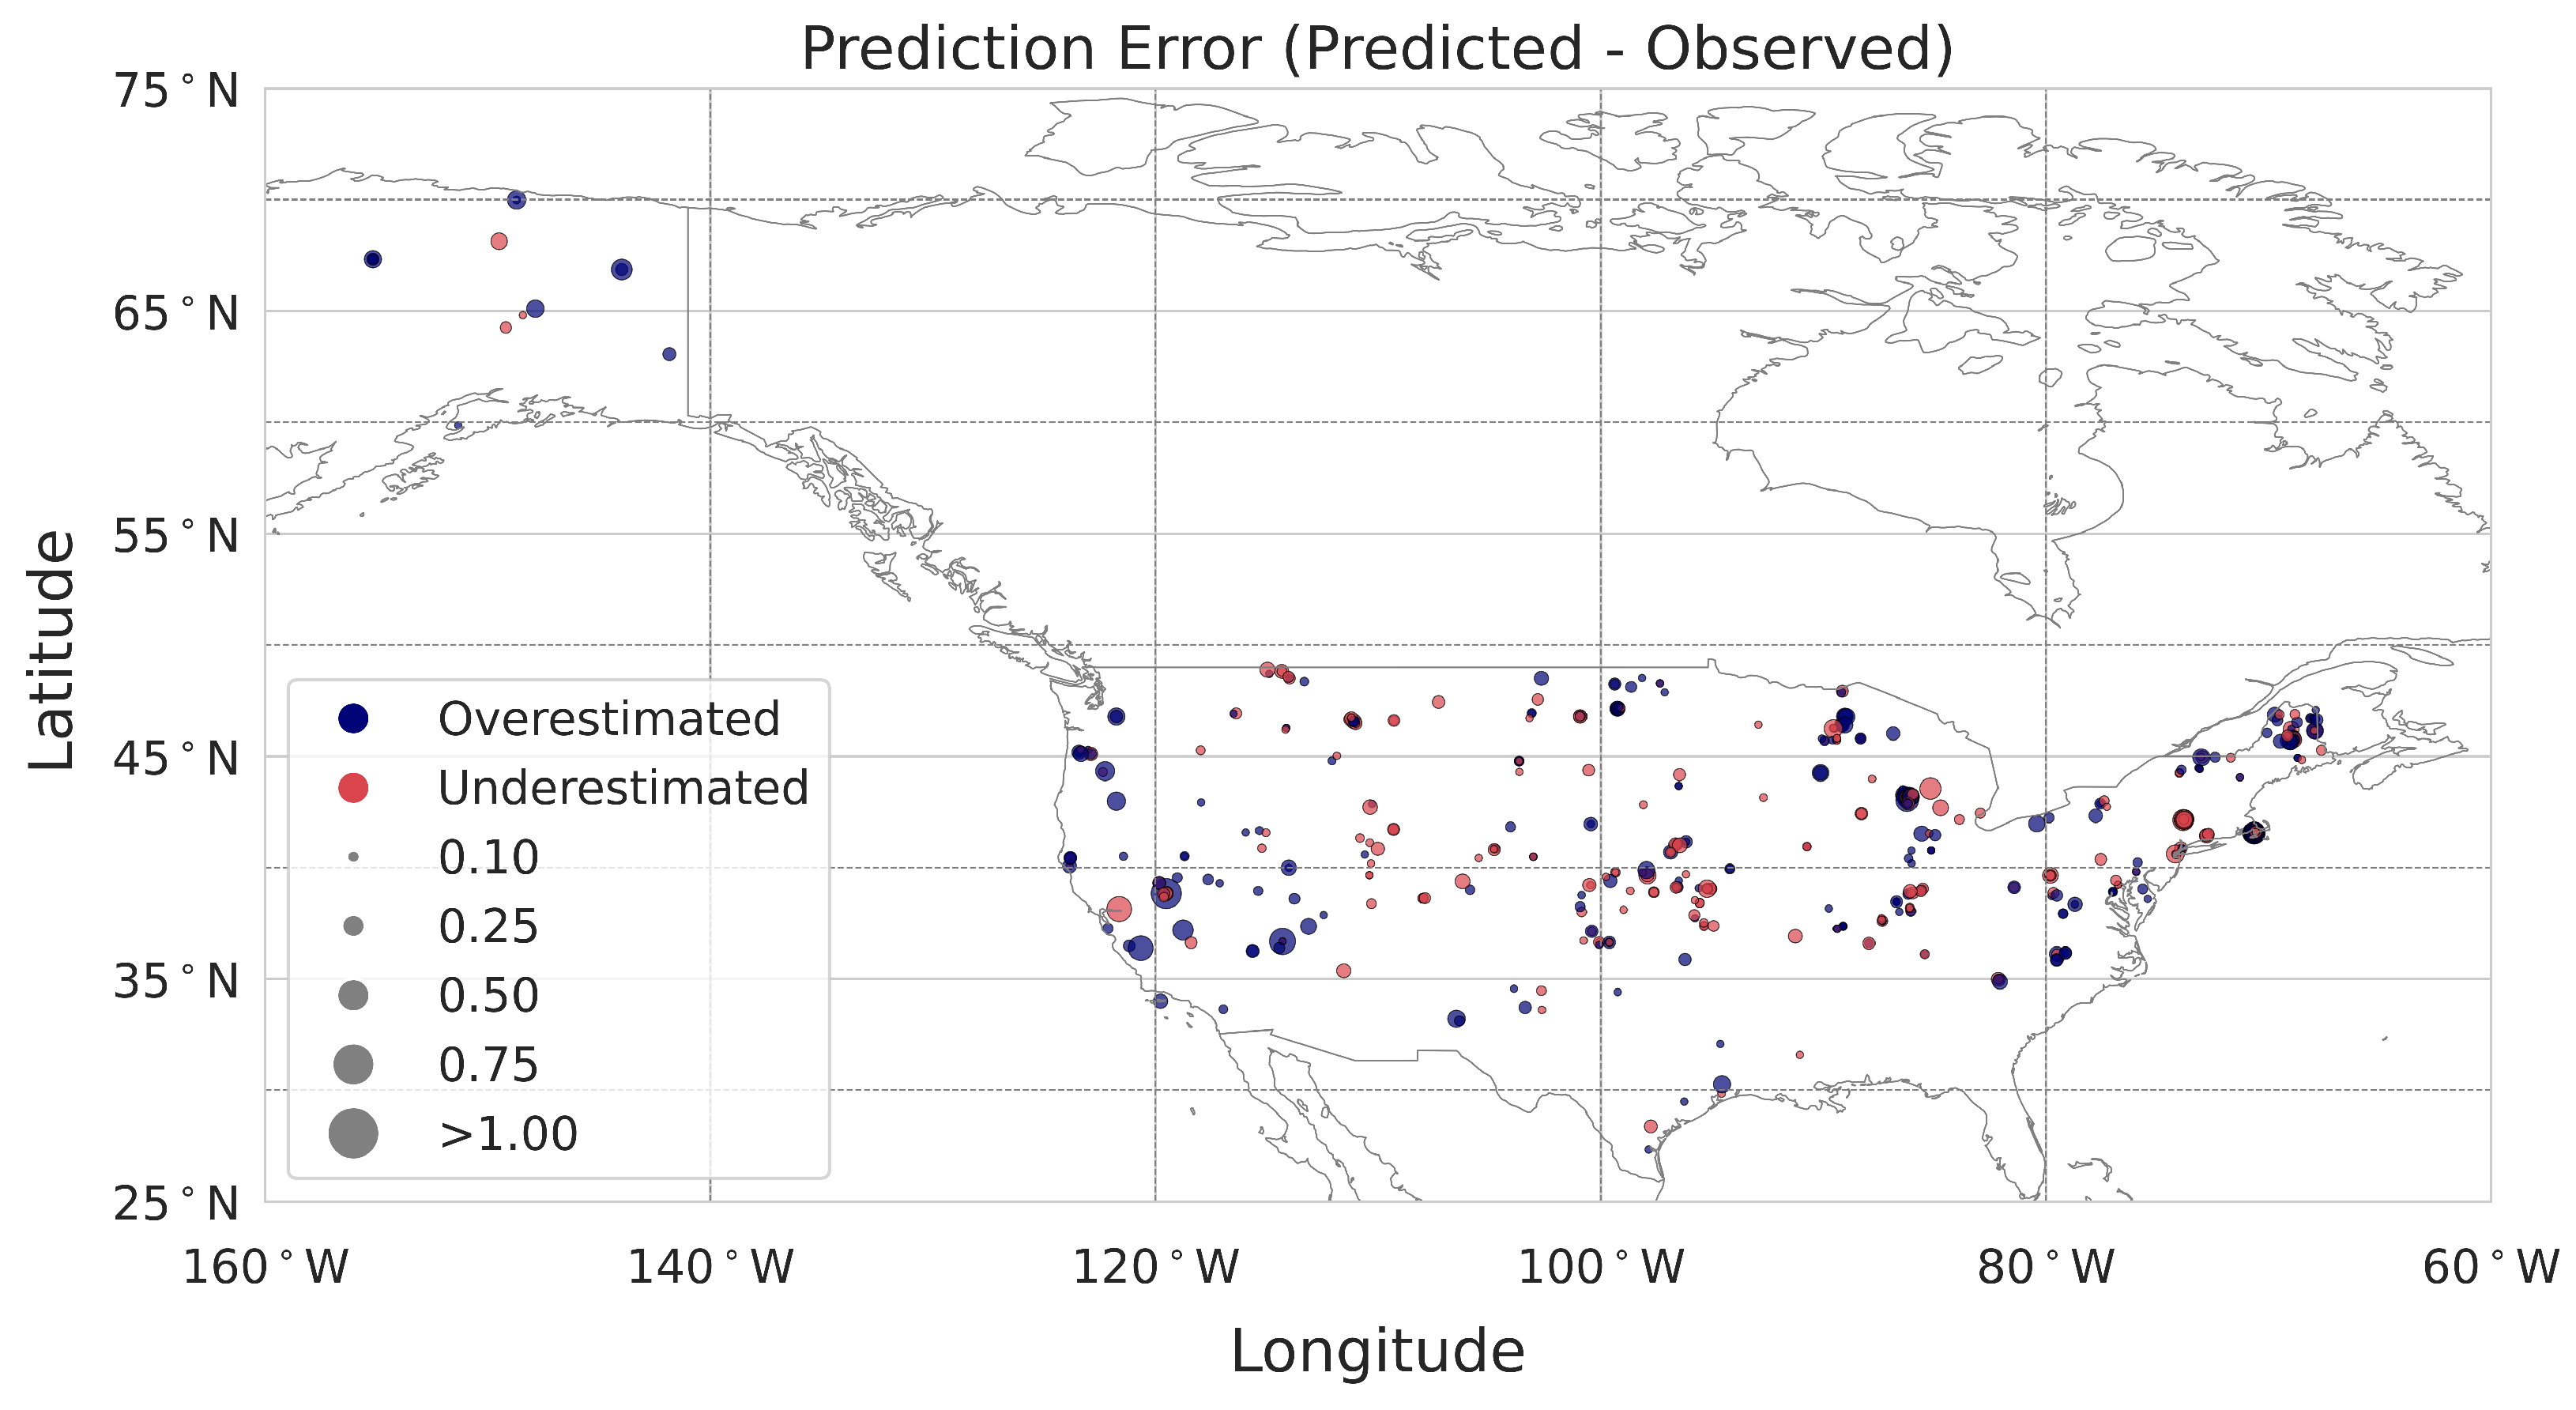
36]. The importance of each predictor is properly weighted by considering the interactions between input features. Moreover, we derived the average contribution by summing the absolute Shapley values across individual observations in the calibration dataset, resulting in an overall variable contribution to the prediction. Lastly, we evaluated the contribution of each point considering spatial patterns that can help us to determine the average contribution for specific areas, such as bioclimatic regions or states across the USA.
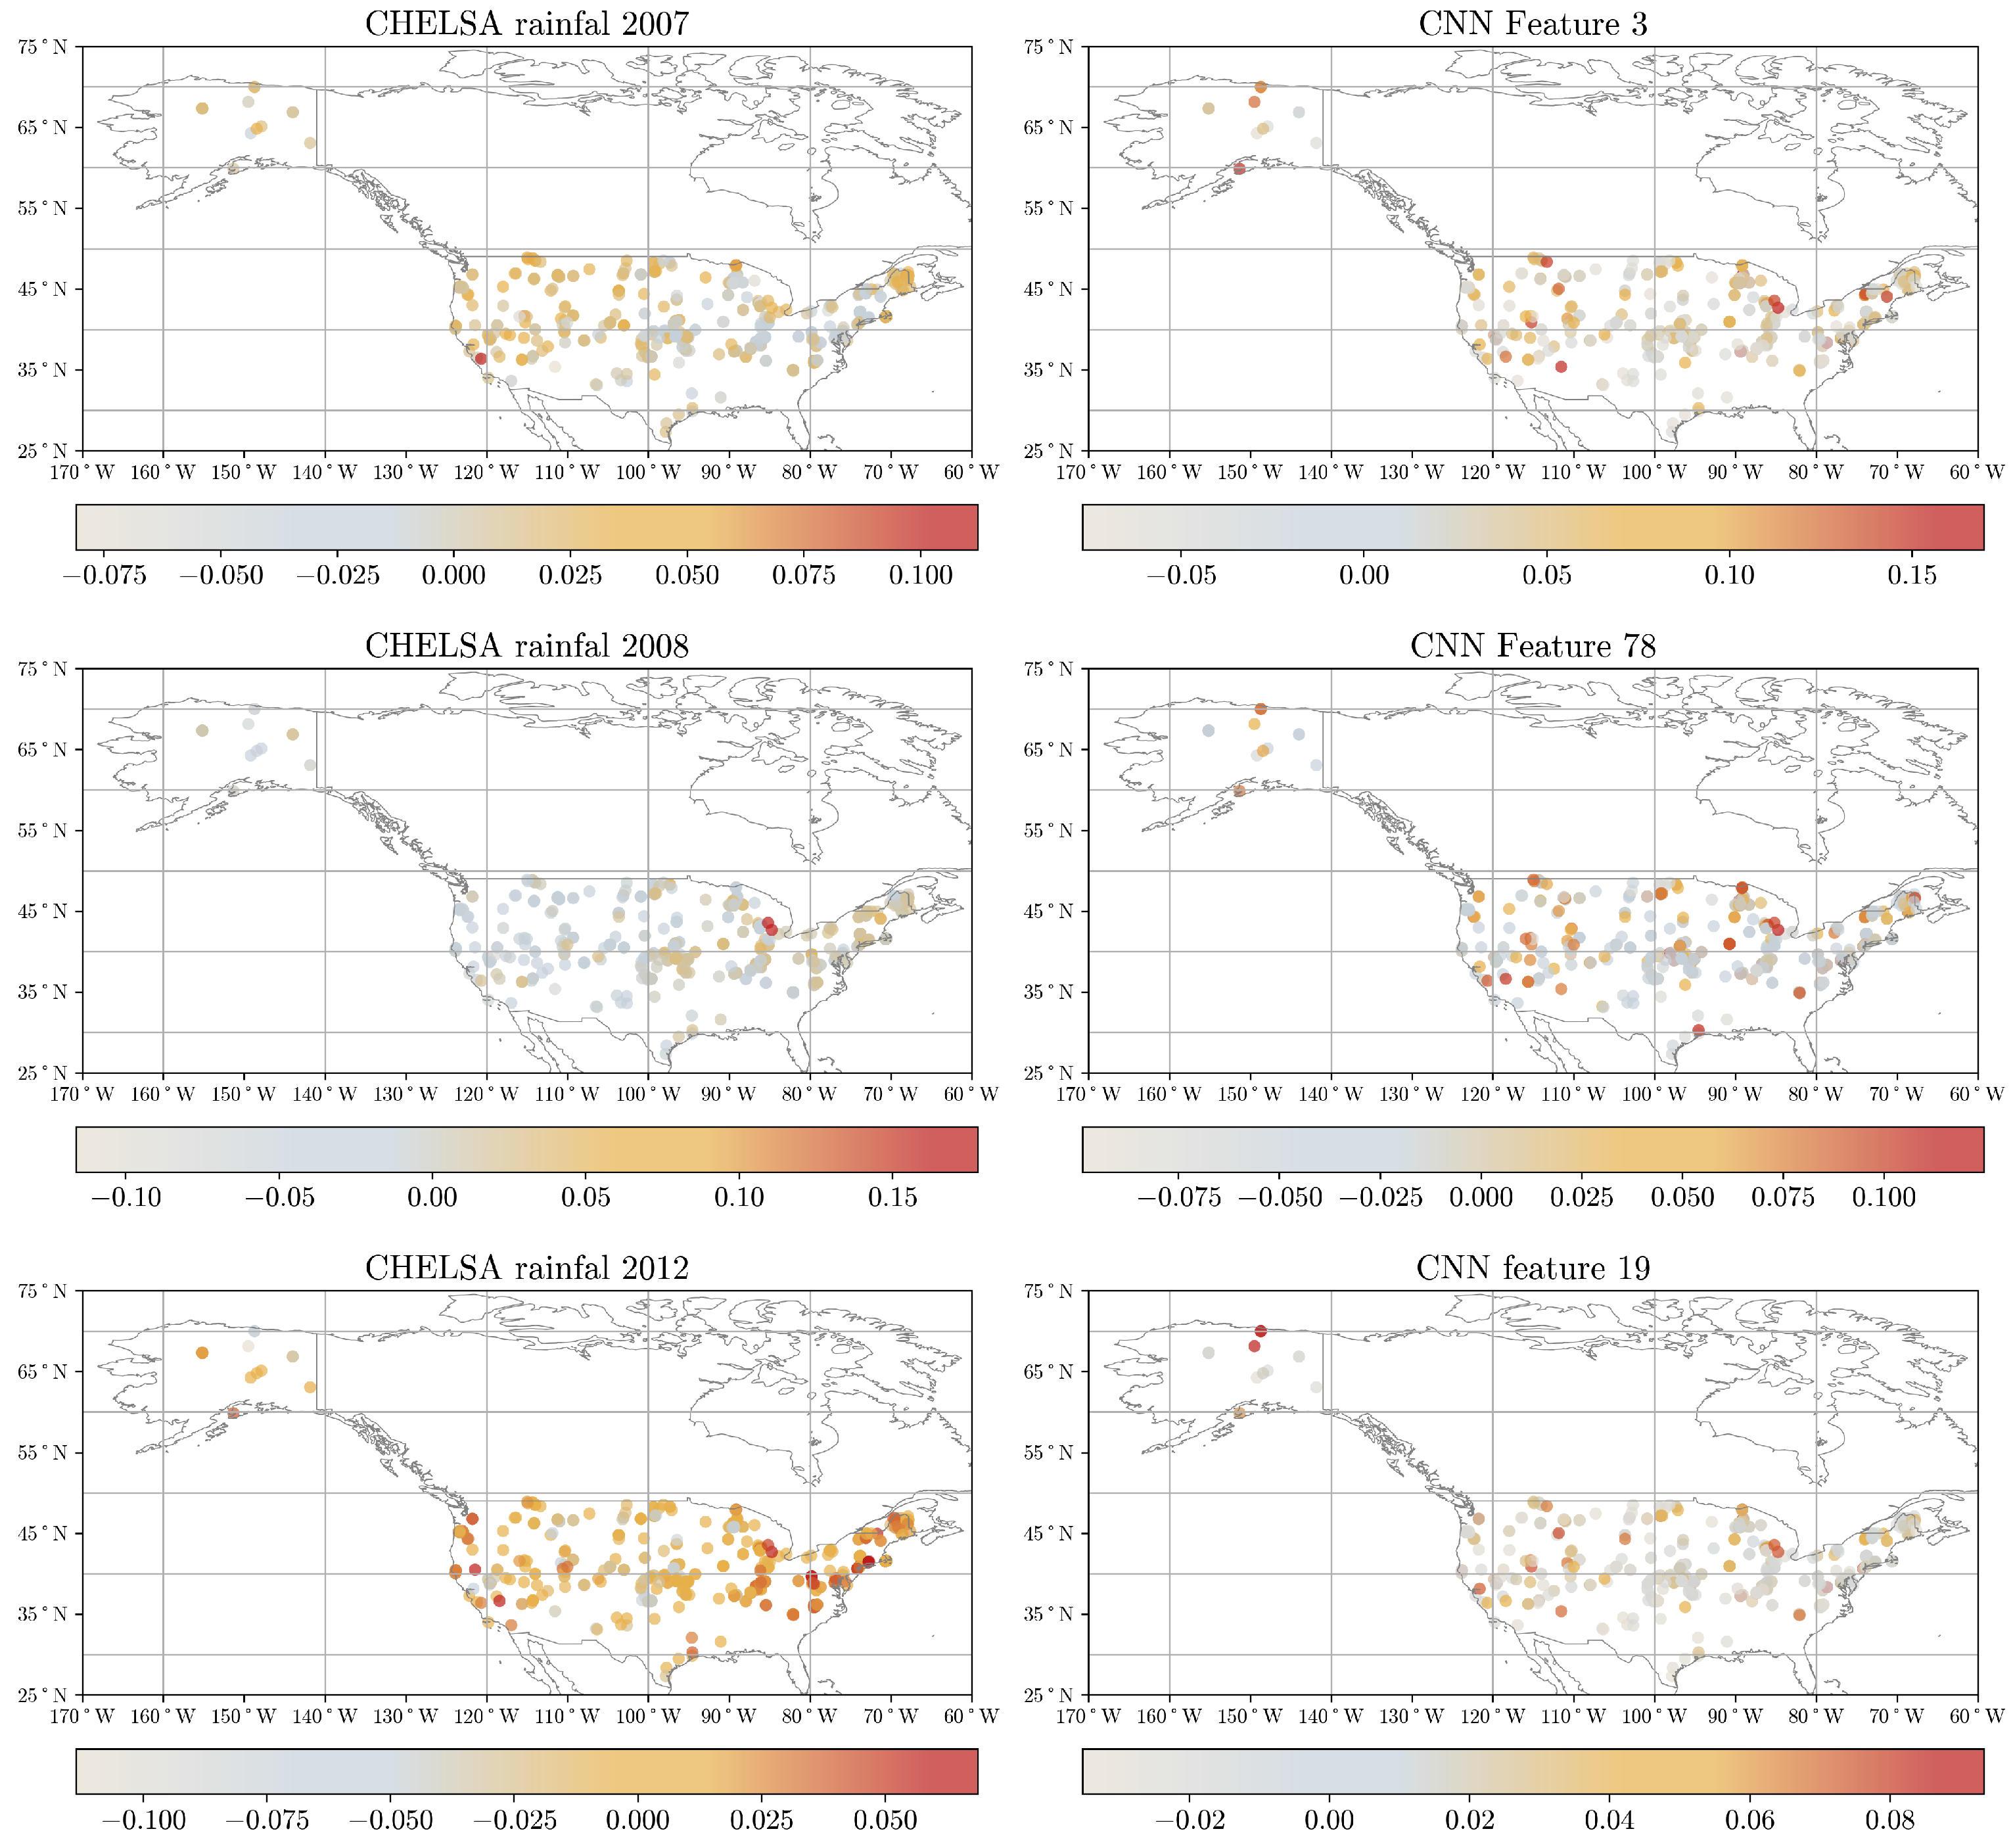
Moreover, we further explored techniques to gain insights into the reasoning process of the CNN model. In this regard, the feature maps created at each convolution layer capture complex features, with the final layer retaining a strong correlation between each neuron’s position and the input wavelength. This allowed us to assess the spectral region that mostly drives the model’s estimations, enabling us to confirm the model’s alignment with areas corresponding to well-known chemical bonds impacting SOC. This comparison reinforces the interpretability of our approach.
2.6. Evaluation
The coefficient of determination (
, Equation (
2)) assesses how well the independent variables explain the variability of the dependent variable. Root Mean Square Error (RMSE, Equation (
3)) measures the average difference between predicted and observed values, while the Ratio of Performance to Interquartile Range (RPIQ, Equation (
4)) evaluates model performance relative to data quartiles. The metrics above have been calculated using the following equations:
where
denotes the observed values,
stands for the predicted values,
denotes the mean of observed values, RMSE denotes Root Mean Square Error,
n represents the number of observations, and
indicates the interquartile range of the observed values.
2.7. Computational Framework
Data processing and regression analysis were performed on HiPerGator 3.0 (UFIT Research Computing, Gainesville, FL, USA), a high-performance computing cluster at the University of Florida, using an NVIDIA RTX 2080 Ti GPU (NVIDIA Corporation, Santa Clara, CA, USA). The code for the AI modeling is based on the Python libraries scikit-learn, TensorFlow, and Keras. All experiments and computations for the calculation of Shapley values were conducted using the SHAP package in Python programming language [
37].
5. Conclusions
This study exemplifies the synergistic integration of deep learning methodologies and diverse data sources to address the unprecedented challenges in rapid and accurate soil predictions by leveraging and building upon dual-input frameworks. More specifically, we introduced a comprehensive methodological framework for predicting organic carbon in soils using spectral data acquired from a handheld NIR device, combined with open geospatial covariates related to landform, climate, and vegetation. Initial experiments demonstrated that CNNs, utilizing low-cost spectral devices, achieved accurate results with an of 0.62, an RMSE of 0.31, and an RPIQ of 1.87. In this context, the study’s findings emphasize the effectiveness of a hybrid model, using a CNN as an automatic feature generator and an XGBoost as a regression method to handle the multimodal data leading to a remarkable RMSE reduction of >30% and an improved of 0.72, along with an RPIQ of 2.17 compared to a simple XGBoost model. The integration of geo-covariates alongside Neo-Spectra data significantly further enhanced predictive accuracy, surpassing traditional approaches. Lastly, the use of techniques enabling the explainability of the model’s reasoning allowed for a clearer understanding of the contributions of various climatic and topographical factors, as well as spectral data, illuminating the complex interactions that influence SOC variability. In conclusion, this research highlights the promise of advanced analytical frameworks in enhancing our understanding of various soil properties, paving the way for more effective soil management practices at continental extents.
