Article

A Mobile Triaxial Stabilized Ship-Borne Radiometric System for In Situ Measurements: Case Study of Sentinel-3 OLCI Validation in Highly Turbid Waters

by
Haoran Jiang
1,2,3,
Peng Zhang
1,2,*,
Hong Guan
4 and
Yongchao Zhao
1,2,3
1
Aerospace Information Research Institute, Chinese Academy of Sciences, Beijing 100094, China
2
Key Laboratory of Technology in Geo-Spatial Information Processing and Application System, Chinese Academy of Sciences, Beijing 100190, China
3
School of Electronic, Electrical and Communication Engineering, University of Chinese Academy of Sciences, Beijing 100049, China
4
UTAN Technology Co., Ltd., Hangzhou 310012, China
*
Author to whom correspondence should be addressed.
Remote Sens. 2025, 17(7), 1223; https://doi.org/10.3390/rs17071223
Submission received: 21 February 2025 / Revised: 21 March 2025 / Accepted: 28 March 2025 / Published: 29 March 2025

Abstract

:
This study presents the “Mobile Triaxial Stabilized Water-leaving Reflectance Measurement System” (MTS-WRMS), a ship-borne radiometric system designed for high-precision acquisition of water-leaving radiance (Lw) and remote sensing reflectance (Rrs) in mobile aquatic environments. The system employs a triaxial stabilized gimbal to maintain the orientation of three spectrometers, effectively mitigating angular deviations. The system also features automatic azimuth adjustment to maintain the relative sun-sensor azimuth angle within the optimal range of 90° ≤ φ ≤ 135° and supports long-range wireless telemetry for autonomous real-time monitoring. The system’s accuracy was validated through the “direct approach” experiments, which demonstrated low systematic bias, with a mean weighted absolute percentage deviation (WAPD) of 4.42% in the 440–720 nm range, which covers 90% of radiant energy. Additionally, ground validation involving 296 matched spectra from Gaoyou and Zhuhai revealed that Sentinel-3 A/B OLCI products tend to overestimate Rrs in highly turbid waters, with weighted percentage deviation (WPD) and WAPD values of about 16% and 31%, respectively. The overestimation was particularly pronounced in the 400–443 nm range, likely due to low Rrs and inadequate atmospheric correction. The MTS-WRMS provides an advanced tool for accurate, real-time Rrs measurements, offering valuable insights into temporal and spatial variations in water bodies.

1. Introduction

Global water resources face intensifying pressures from scarcity and pollution, with over 2 billion people experiencing water stress and 505,000 annual deaths linked to waterborne diseases [1,2]. Effective water quality monitoring is critical for safeguarding public health and ecosystems, yet traditional methods relying on discrete sampling suffer from prohibitive costs and inadequate spatiotemporal resolution. These challenges are particularly pronounced in inland waters with substantial spatiotemporal variability, such as eutrophic lakes, where traditional methods often fail to capture dynamic processes like algal blooms [3,4]. In contrast, remote sensing technology enables large-scale, real-time water quality monitoring with extensive spatial coverage and periodic data acquisition. By reducing the logistical challenges and costs associated with field surveys, remote sensing effectively addresses the limitations of traditional approaches and provides a more efficient solution for long-term environmental assessment [5,6,7,8,9,10].
Satellite-derived products now support vital applications from algal bloom detection to sediment transport modeling [11,12,13]. These applications rely fundamentally on accurately retrieving biogeochemical parameters, particularly chlorophyll-a concentration, total suspended matter (TSM), and colored dissolved organic matter (CDOM). To ensure the operational reliability of satellite-derived products, rigorous validation processes are required through spatiotemporally matched comparisons between orbital observations and in situ measurements [11].
The spectral remote sensing reflectance (Rrs) determined from top-of-atmosphere radiance serves as the foundational ocean color remote sensing product for generating all the aforementioned water quality parameter retrieval results. To validate satellite-derived Rrs, synchronized satellite-ground measurements are required. The Rrs measured on the ground is defined as the ratio of water-leaving radiance exiting the water body to the total downwelling irradiance from the entire sky, as defined by the following equation:
R r s ( λ ) = L w ( λ ) E d ( 0 + , λ ) ,
where Ed (0+, λ) is the downwelling irradiance at a height just above the water, and Lw (λ) is the water-leaving radiance, as the component of upwelling radiance that has been transmitted across the water–air interface.
Current Rrs measurement approaches include the Above-Water Approach (AWA) [14,15,16,17,18,19,20], In-Water Approach (IWA) [21,22,23], and Skylight-Blocked Approach (SBA) [24,25,26]. Among these, the AWA has gained widespread adoption due to its non-contact operation with the water body and adaptability to diverse water types.
Above-water hyperspectral radiometry has undergone various methodological advancements across stationary and mobile deployment platforms. Station-based observation systems, exemplified by the Trios/RAMSES radiometer, are widely used in the measurement of Rrs [27,28,29,30]. In addition, other fixed observation systems, like SeaPRISM [31] and HYPSTAR [32,33], have also been developed. While these systems deliver high-temporal-resolution data for localized water bodies, their spatial representativeness remains constrained to proximal aquatic environments.
Mobile platforms have emerged to address spatial sampling limitations, encompassing handheld devices (e.g., WISP-3 [34]) and ship-borne configurations such as HyperSAS [35] and DALEC [36,37]. Station-based observation systems excel in long-term radiation measurement, whereas ship-borne deployments enable regional-scale Rrs validation through spatially distributed sampling [36,38]. However, ship-borne measurements introduce unique challenges, such as vertical oscillations of the vessel caused by waves during navigation and the changes in the vessel’s heading, which lead to variations in the relative azimuth angle between the measurement direction and solar radiation. These dynamic conditions demand enhanced angular stability in observational instruments.
In this study, we developed the Mobile Triaxial Stabilized Water-leaving Reflectance Measurement System (MTS-WRMS) to acquire high-precision Rrs in dynamic aquatic environments. Given that anthropogenically influenced waters, being priority targets for water quality monitoring, typically exhibit elevated turbidity levels, this study strategically selected two high-turbidity regions to synchronize in situ measurements with satellite data and leveraged the acquired dataset to validate the accuracy of Rrs products derived from the Sentinel-3 Ocean and Land Colour Instrument (OLCI).

2. The Ship-Borne Radiometric System MTS-WRMS

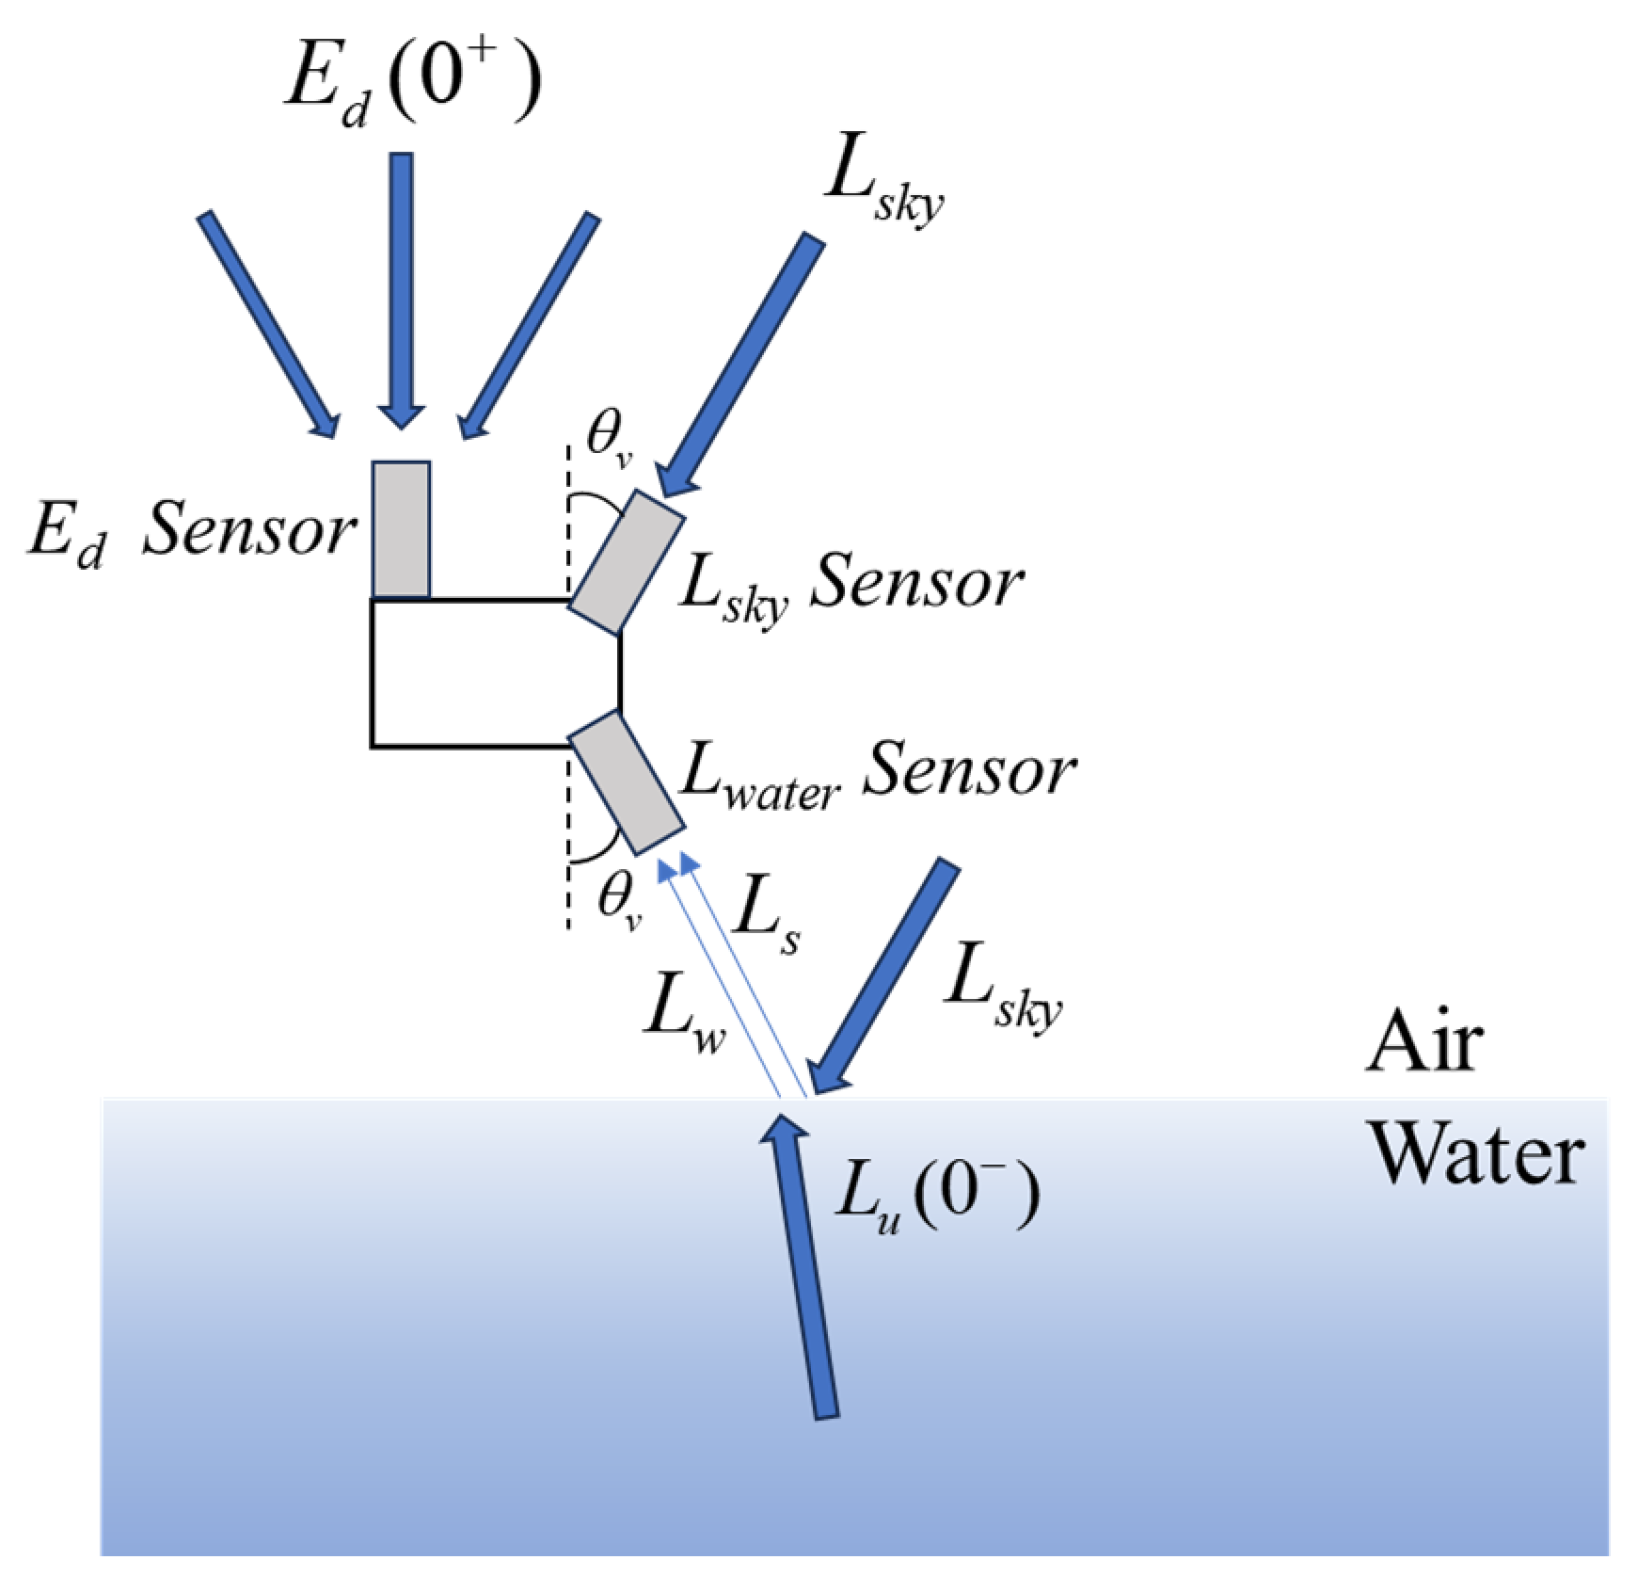
2.1. Measurement Theory for Above-Water Approach

A critical consideration in above-water measurements is the correction of skylight reflection at the air–water interface, which requires the concurrent acquisition of sky radiance measurements. The Rrs calculation under this method follows the equation:
R r s ( λ ) = L w a t e r ( λ ) ρ L s k y ( λ ) E d ( 0 + , λ ) ,
where Lwater (λ) and Lsky (λ) represent water-viewing radiance and sky-viewing radiance, respectively. Moreover, ρ denotes the effective Fresnel reflectance coefficient [11].
Based on the number of spectroradiometers employed, AWA implementations can be classified as single- or tri-sensor architectures. Figure 1 illustrates a tri-sensor system schematic, where Ls represents the skylight reflected at the air–water interface, which is equal to ρLsky. In this arrangement, Lwater indicates the radiance acquired by the nadir-oriented aquatic sensor at the nadir angle, and θv constitutes the composite signal of water-leaving radiance (Lw) and surface-reflected skylight (Ls). Concurrently, Lsky is measured using an azimuthally matched sky-viewing sensor at identical zenith angle θv, while Ed is quantified using a vertically oriented irradiance sensor. The data obtained from synchronous measurements using these three instruments enable direct computation of Rrs through substitution into Equation (2).
Additionally, to avoid specular reflection (sunglint) off the water surface, the measurement direction should maintain a relative azimuth angle φ between 90° and 135° to the solar principal plane. This angular constraint minimizes sunglint interference, ensuring reliable data acquisition by avoiding the most intense solar reflection components [11,14,16].
In contrast, the single-sensor methodology requires sequential acquisition of these three radiometric quantities, introducing inherent uncertainties from temporal-spatial mismatches during non-concurrent measurements. This asynchrony-induced error becomes particularly pronounced under unstable illumination conditions, such as rapidly changing skylight intensity or transient cloud cover. Nevertheless, the single-sensor configuration eliminates inter-sensor spectral calibration discrepancies, thereby reducing systematic measurement biases.

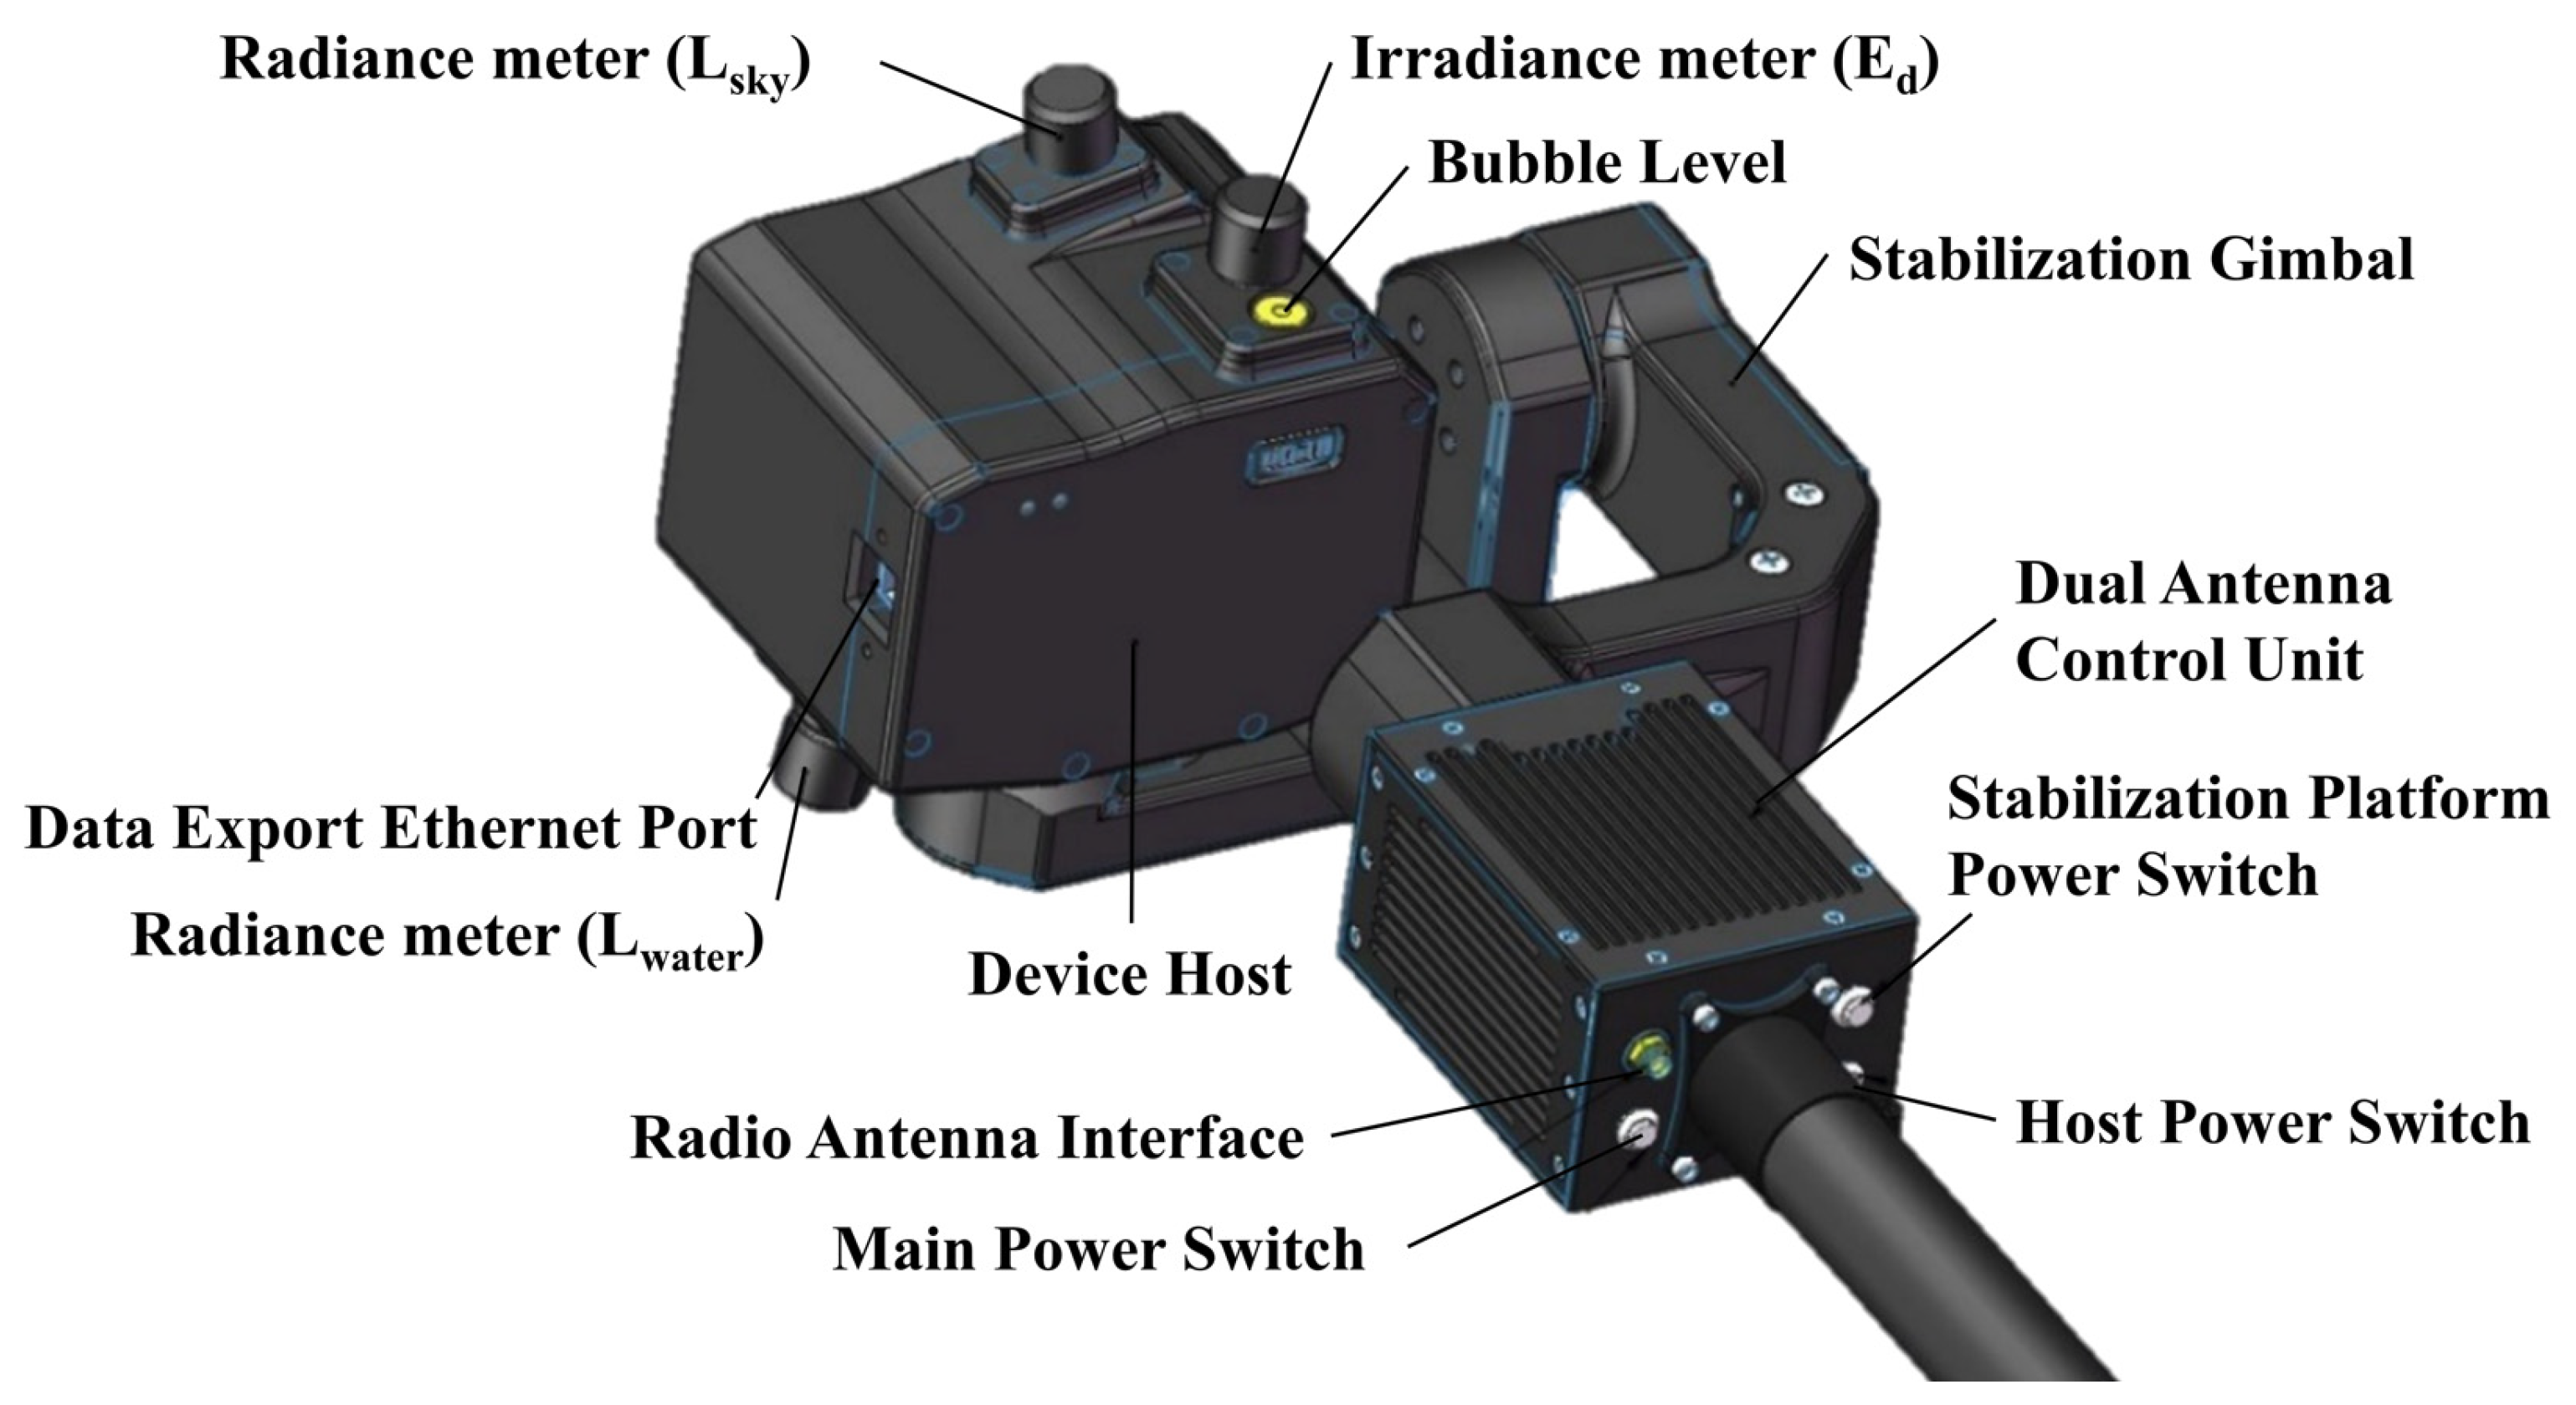
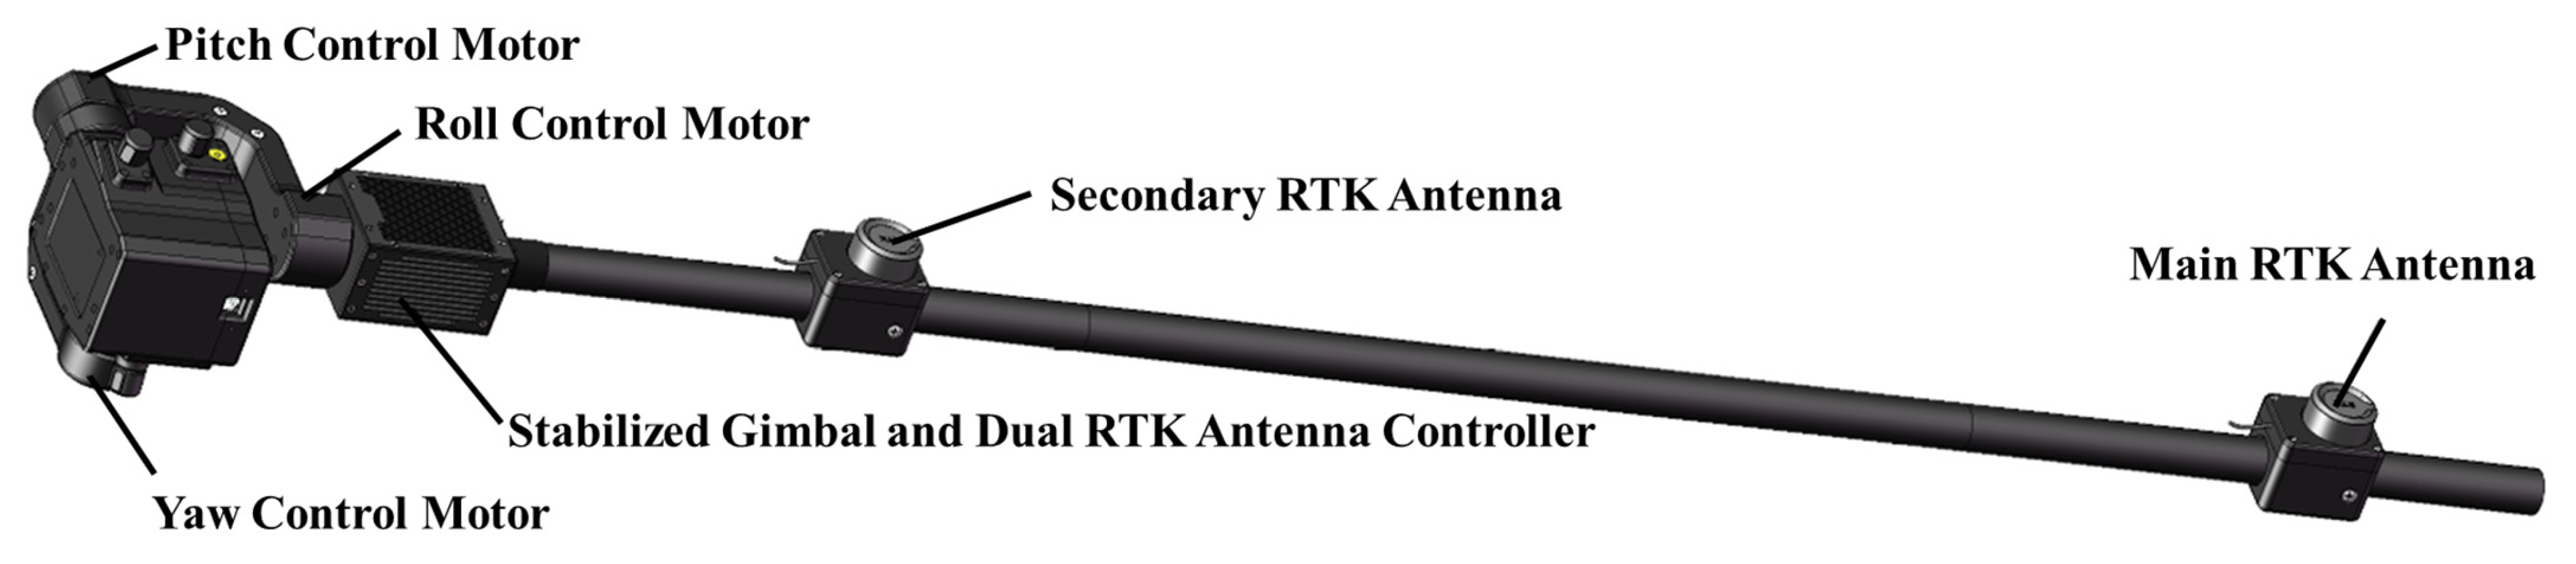
2.2. The Hardware Components

The MTS-WRMS was jointly developed by our research group and UTAN Technology Co., Ltd. (Hangzhou, China), with the device model designated as UT-OP-WUD_3. The system can simultaneously measure spectral downwelling irradiance Ed (0+, λ), upwelling water radiance Lwater (λ), and downwelling sky radiance Lsky (λ) using a stabilized gimbal, enabling the accurate calculation of water-leaving radiance Lw and remote-sensing reflectance Rrs. Figure 2 presents a schematic diagram of the main hardware components of the system.
The MTS-WRMS integrates three hyperspectral spectrometers (Optosky ATP2400 ultra-thin miniature fiber-optic spectrometers), operating in the 400–900 nm spectral range for Rrs measurements. The Lwater and Lsky sensors have an 8° field of view, and the Ed sensor has a cosine-like response. Each spectrometer provides approximately 1100 spectral channels within this range, with spectral sampling intervals of 0.4 nm. All three spectrometers demonstrate an average signal-to-noise ratio (SNR) exceeding 450:1 across the selected spectral range.
Maintaining a stable observation geometry is a fundamental prerequisite for accurate measurements. The following paragraphs introduce the composition and operating principles of the triaxial stabilized gimbal control system and dual antenna orientation system integrated into the MTS-WRMS. The system components are illustrated in Figure 3.
The triaxial stabilized gimbal control system operates by utilizing an IMU (Inertial Measurement Unit) to sense the current pitch and roll Euler angles. The control circuit of the stabilized gimbal processes the data at a frequency of 400 Hz, adjusting the movements of the pitch and roll control motors to maintain the predefined pitch and roll angles, thereby ensuring device stabilization. Through ship-borne experiments, it was measured that σpitch < 0.5° and σroll < 0.05°, ensuring minimal measurement deviation under dynamic conditions.
The dual antenna orientation system continuously measures the vector formed by the main and secondary RTK (Real-Time Kinematic) antennas (with the main antenna pointing toward the secondary antenna) and calculates its angle deviation from a preset direction (ranging from 0° to 360°). The dual antenna control board then regulates the yaw-axis servo motor, ensuring that the yaw direction remains locked to the specified orientation. This capability is particularly critical during ship-borne measurements, as vessel heading changes during navigation; the yaw angle of MTS-WRMS can be compensated to maintain 90° ≤ φ ≤ 135°, minimizing sunglint in the acquired data.
The system allows the pitch, roll, and yaw axes to be manually adjusted via a communication interface (±30° pitch/roll, 360° yaw). Additionally, it can be locked to maintain a stable orientation relative to the solar elevation and azimuth angles. This ensures adaptability to different measurement scenarios and guarantees high-quality data acquisition, making the system a robust tool for this study.
In addition to the main hardware components, the system includes a 2 m foldable carbon fiber rod that provides structural support and stability, securing the system to the vessel and extending the sensors approximately 1 m beyond the hull. The GPS system ensures precise geolocation and real-time positional data recording, enabling accurate satellite data matching and spatial mapping of Rrs. The system also supports long-distance wireless signal transmission, facilitating long-term automated measurements. Furthermore, the system operates on an 18–32 V DC power supply with an average power consumption of less than 15 W, enabling both ship-borne measurements and shore-based automated monitoring.

2.3. System Advantages

By integrating the carbon fiber rod with the stabilized gimbal, the system’s three spectrometers maintain a stable orientation throughout the measurement process, effectively minimizing errors caused by fluctuations in observation angles.
The system is versatile: in ship-borne applications, the system collects spatially distributed spectral data across different water areas, providing valuable insights into the spatial distribution of water quality. Alternatively, it can be deployed for long-term shore-based fixed-point measurements, capturing time-series data at a single location to observe temporal variations. This dual functionality allows the system to monitor both spatial distribution and temporal changes in Rrs effectively.
Table 1 below presents a comparison of the spectral and deployment characteristics of various devices used for measuring Rrs. The table highlights key specifications including the number of sensors, deployment methods, spectral characteristics, FOV, and whether the horizontal orientation angle can be automatically adjusted. These attributes are essential for understanding the capabilities and limitations of each device in the context of Rrs measurements.
Compared with existing measurement systems, the MTS-WRMS offers several advantages:
  • The system is equipped with a triaxial stabilized gimbal that maintains a stable measurement angle. Experimental results indicate that the system achieves σpitch < 0.5°, σroll < 0.05°. Under mobile conditions, this design ensures higher accuracy in measuring Ed (0+, λ), Lwater (λ), and Lsky (λ);
  • The system allows for automatic yaw angle adjustment, ensuring that the relative azimuth angle between the instrument’s observation plane and the solar radiance plane adheres to the optimal range of 90° ≤ φ ≤ 135°, effectively reducing sunglint interference and enhancing measurement accuracy.
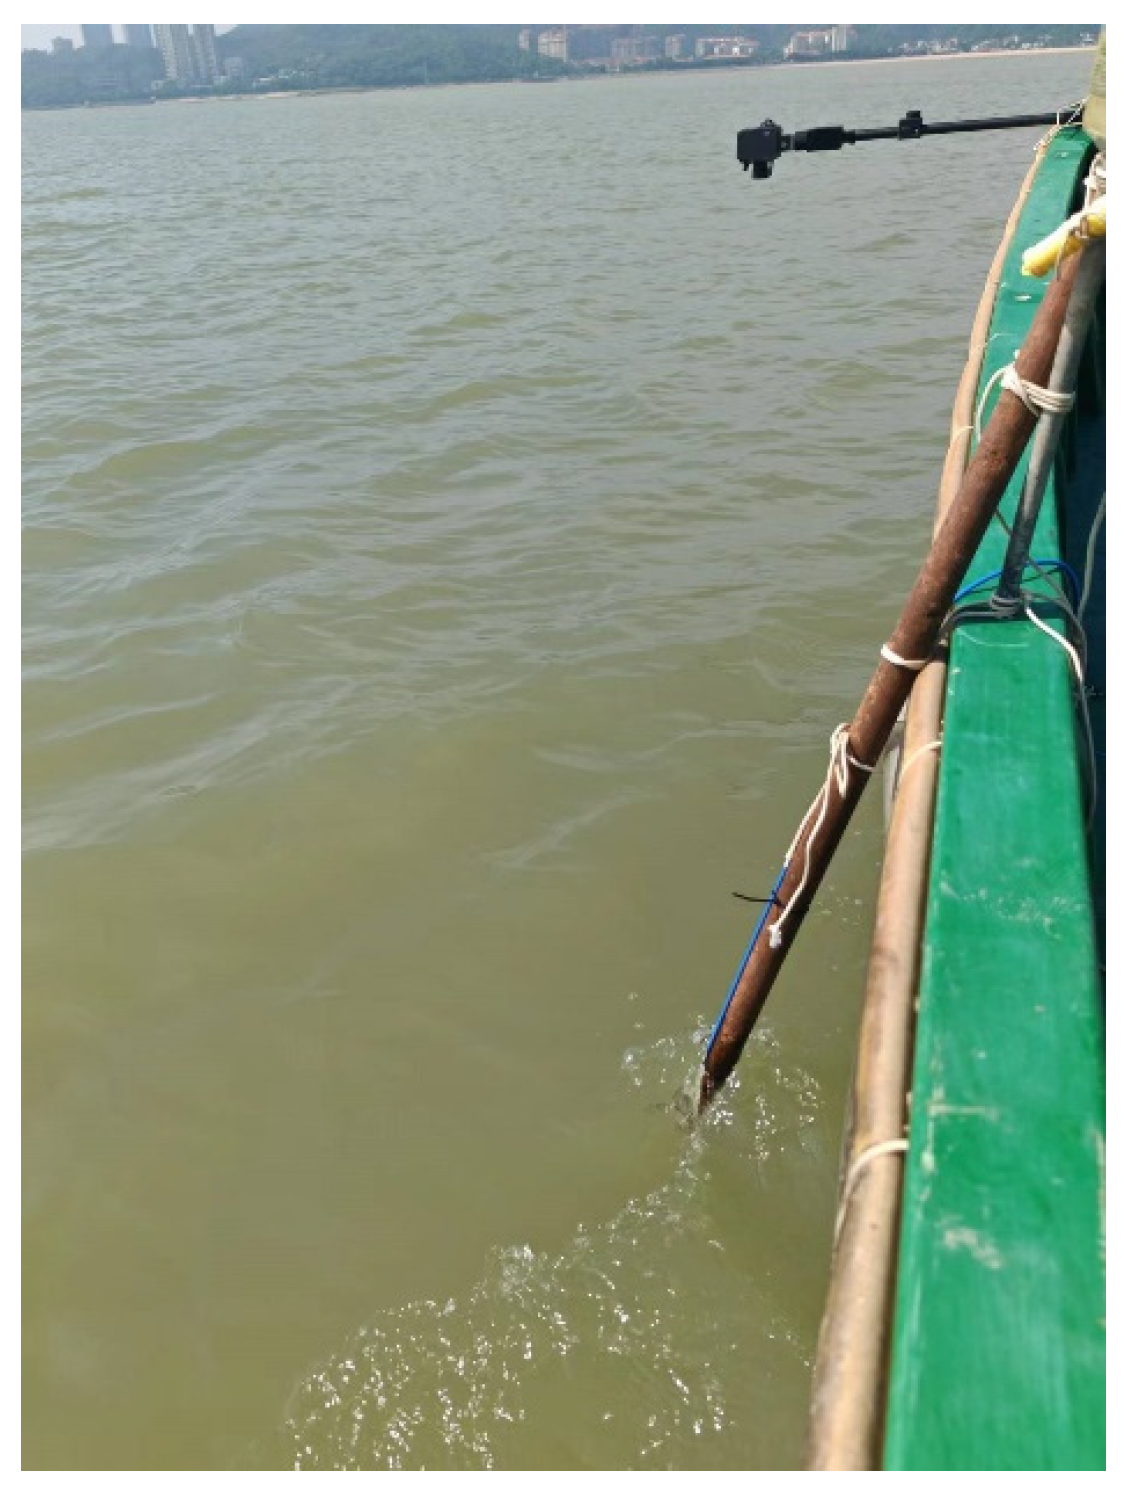
  • The foldable carbon fiber rod can extend the sensors 1 m beyond the vessel when deployed, reducing interference from hull shadows and vessel-generated waves, which enhances data reliability;
  • The system supports long-distance wireless signal transmission, enabling autonomous real-time monitoring in both shore-based fixed-point measurements and ship-borne applications without the need for manual intervention.

2.4. Data Validation Approach

Since water-leaving radiance measurements above the surface are indirect and susceptible to air–water interface effects, accurate validation requires subsurface reference data. Conventional methods (e.g., IWA, SBA) lack dynamic observation capabilities due to their static measurement nature. This study adopts an alternative approach—termed the “direct approach”— submerging a sensor below the surface. This approach was described by Lee et al. [14] and applied by Gitelson et al. [39] to water-leaving radiance measurements in turbid waters. The methodology leverages the principle that upwelling radiance measured a few centimeters below the water surface can be treated as the subsurface value (Lu (0, λ)). The waterproof fiber-optic probe maintains natural water-to-air optical paths, eliminating corrections for surface transmittance or refractive index when correlating them with above-water measurements. Consequently, the measured subsurface upwelling irradiance is directly equivalent to the water-leaving radiance (Lw (λ)), as illustrated in Figure 4.
In direct approach measurements, the depth at which the probe is submerged is closely related to the accuracy of the collected data. Ideally, the probe should be placed as close to the surface as possible to minimize deviations from Lu (0, λ). However, during practical measurements, wave-induced vessel motion causes dynamic variations in the probe depth. To ensure that the probe remains submerged and avoids exposure due to wave action, it must be positioned sufficiently below the surface. Additionally, when the vessel is in motion, the bow experiences significant vertical oscillations due to wave impact. Placing the probe near the bow would amplify depth fluctuations, introducing greater measurement errors. Therefore, securing the probe near the midship section is preferable, as this area experiences relatively smaller wave-induced oscillations, effectively reducing depth variations and improving measurement stability. Considering these factors, positioning the probe 3 to 5 cm below the water surface and securing it to the midship section represents the optimal configuration. This design minimizes measurement errors while ensuring that the probe remains submerged under wave disturbances, resulting in more accurate and reliable data.
Compared with other methods, the direct approach offers broad applicability across various water bodies (e.g., lakes, rivers, and oceans) and avoids the need for complex post-processing or model assumptions. However, there are limitations, including susceptibility to wave-induced depth variations and potential interference from aquatic vegetation or floating debris, which may obstruct signal acquisition or damage the instrument. While this approach provides a promising method for high-precision water-leaving radiance measurements, field applications require environmental adaptations to optimize reliability.
In this study, measurements were conducted using an Ocean Optics USB2000+ spectrometer with a fiber-optic probe. The spectrometer has a wavelength range of 350–820 nm, with an SNR greater than 250:1 across the entire range. Therefore, data evaluation is only conducted within the 400–820 nm wavelength band. Experimental details are provided in Section 3.2.

3. Materials and Methods

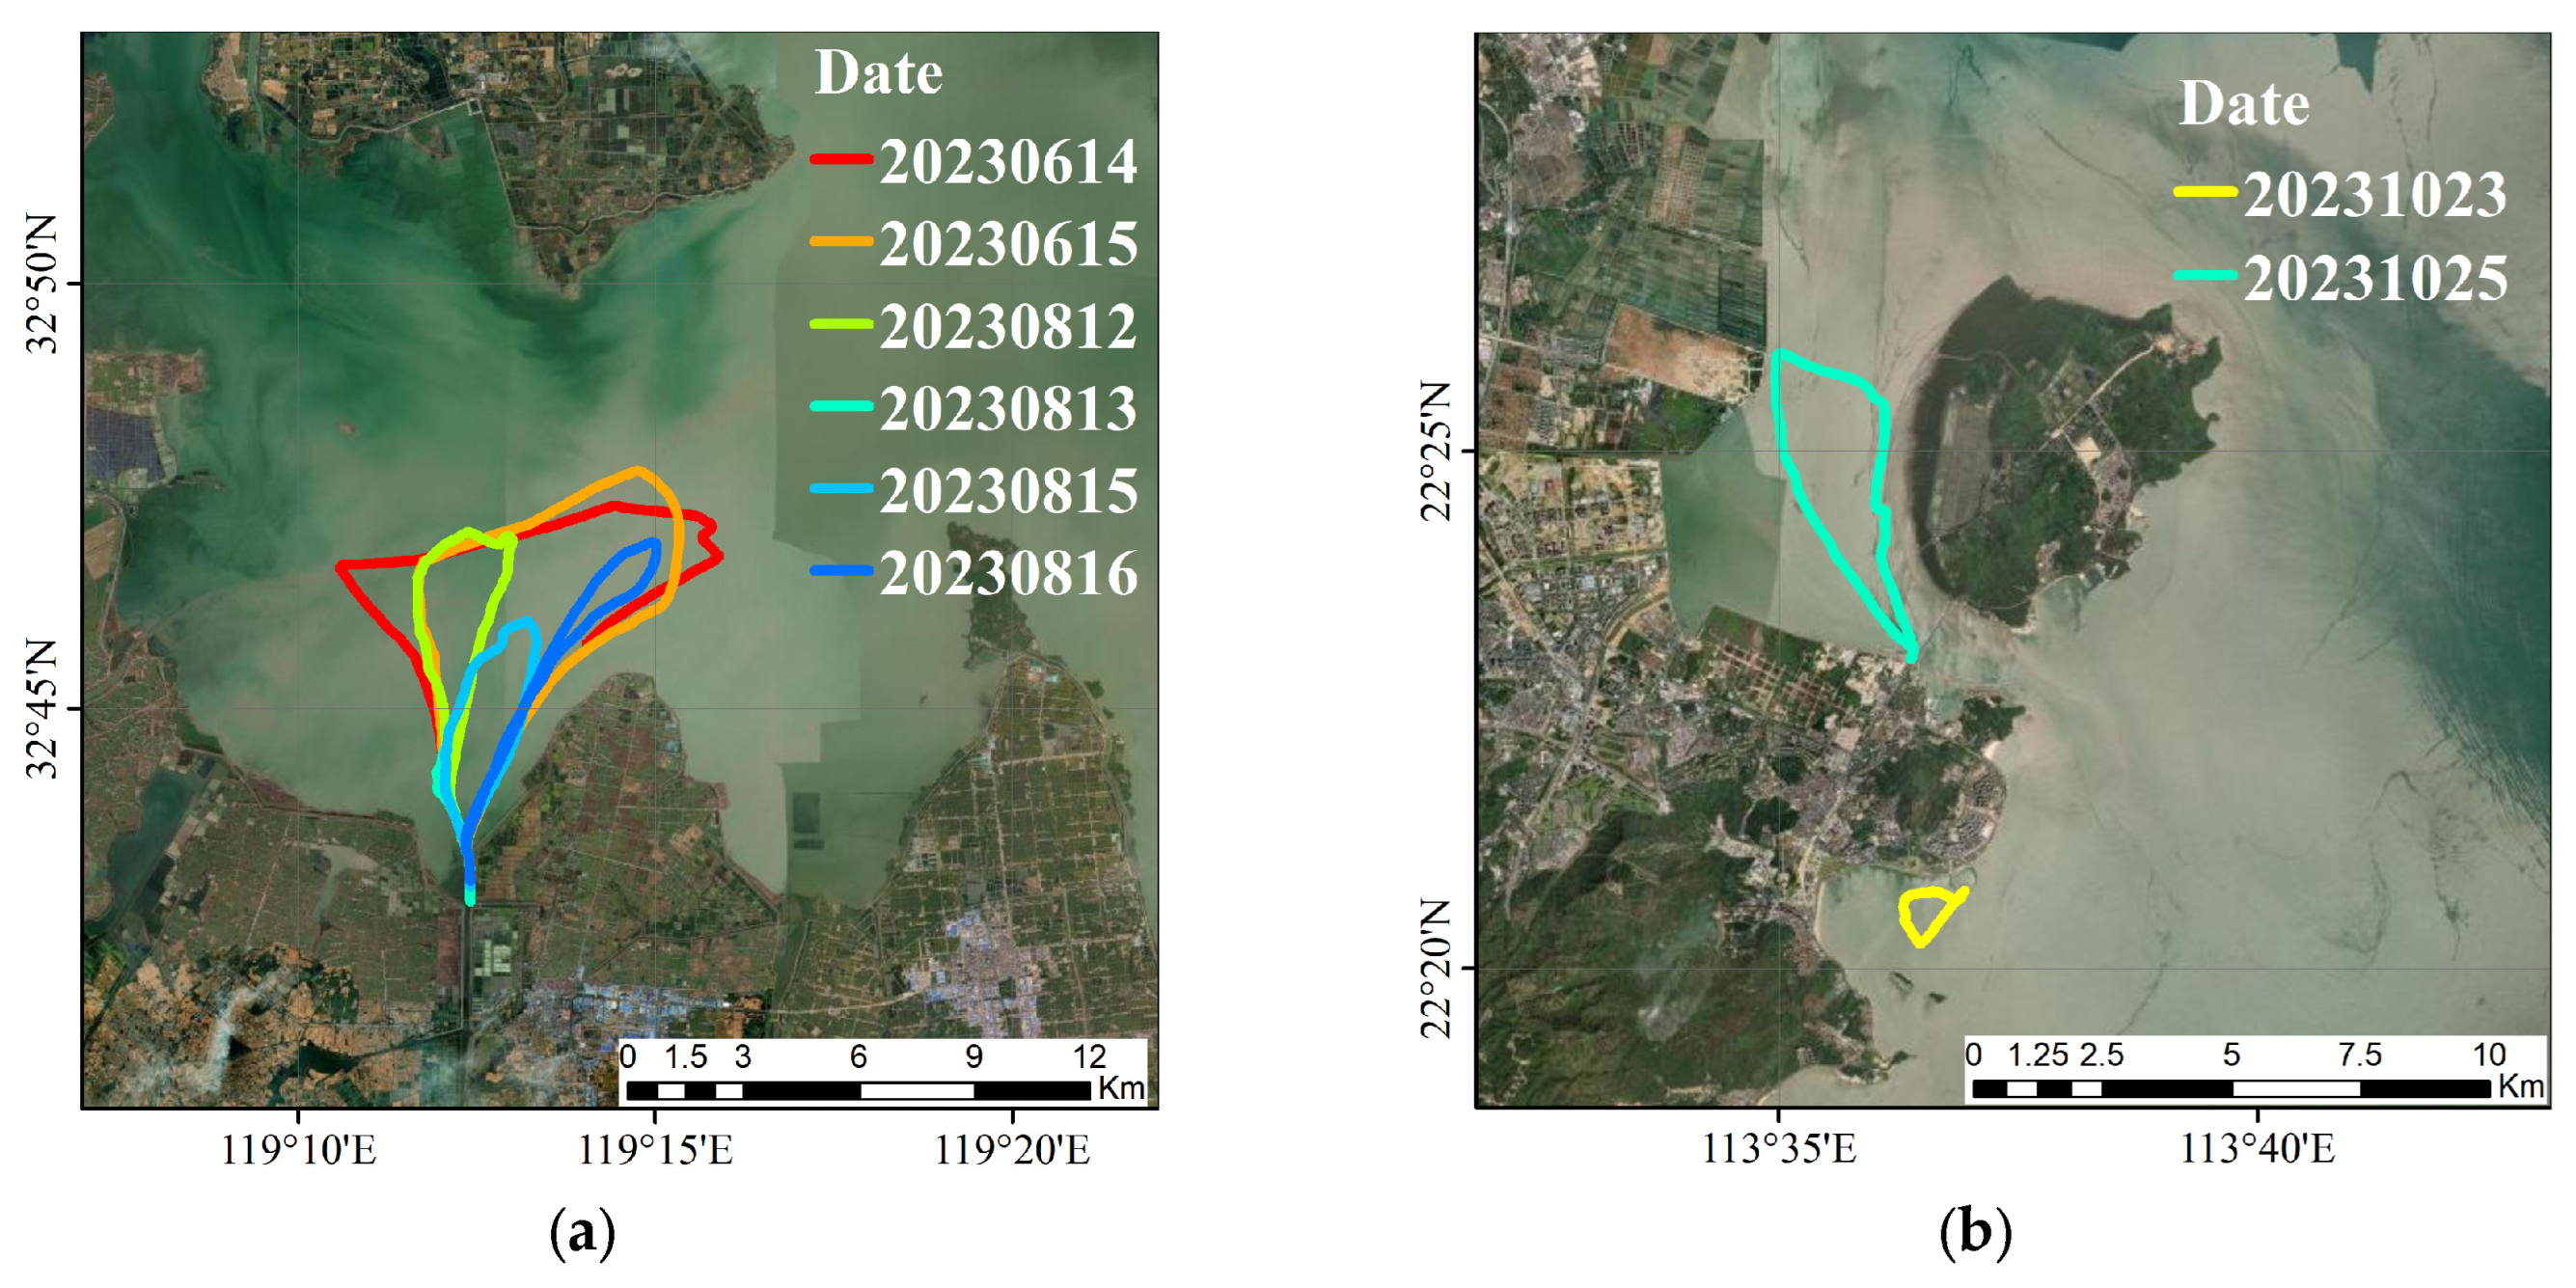
3.1. Study Area and Navigation Route

This study investigates the Rrs of highly turbid water bodies by selecting two representative study areas: Gaoyou Lake, a typical inland shallow lake, and the Zhuhai nearshore waters, a coastal transitional zone. These two areas exemplify distinct, highly turbid aquatic environments, with Gaoyou Lake representing freshwater conditions and Zhuhai nearshore waters characterized by brackish water. The following sections provide a detailed introduction to these study areas.

3.1.1. Gaoyou Lake

Gaoyou Lake, located in the central part of Jiangsu Province, is the sixth largest freshwater lake in China and the third largest in Jiangsu Province, serving as one of the key lakes downstream of the Huai River. The lake covers an area of approximately 760 km2 with a perennial water level ranging from 5 to 5.5 m and a lakebed elevation between 3.5 and 4.5 m, resulting in an average depth of about 1.5 m [40,41]. In terms of ecological function, Gaoyou Lake plays a crucial role as a key hub in the Huai River to Yangtze River waterway. During flood seasons, it regulates water volume by storing excess water, thereby mitigating flood risks downstream.
However, prolonged human activities, particularly large-scale aquaculture within the lake, have significantly impacted its water environment. The lake has been in a state of mild eutrophication for an extended period, leading to severe degradation of its ecological structure and increasing water quality concerns. Such environmental degradation not only affects the lake’s aquatic ecosystem but also poses challenges to local water supply and fisheries [42,43].
Notably, the shallow-water characteristics of Gaoyou Lake offer unique advantages for scientific research and technological applications. Due to its relatively shallow average depth, sunlight can penetrate directly to the lakebed, meaning that remote sensing signals from the water surface may also contain bottom reflectance information. This enables the use of remote sensing techniques to monitor submerged vegetation (e.g., Potamogeton crispus) and assess sediment distribution. Satellite- or drone-based remote sensing technologies facilitate large-scale, high-frequency acquisition of dynamic lake information. This allows for the efficient and accurate monitoring of water quality variations, algal blooms, and aquatic pollution levels. In recent years, an increasing number of studies have applied remote sensing methods to monitor the water quality of Gaoyou Lake [42,44,45,46,47].
Gaoyou Lake is a typical shallow inland lake characterized by its relatively low water depth, extensive water coverage, and diverse ecological environment. During the in situ measurements, the boat traveled at a speed of approximately 10 km/h, with each survey lasting around 2 h, covering a total distance of about 20 km. Given the large surface area of Gaoyou Lake, full coverage was not feasible. Previous studies indicate that the northern and western regions of the lake have higher submerged vegetation coverage, potentially leading to a broader range of Rrs variations [48]. Therefore, the western part of Gaoyou Lake was selected for this study. Figure 5a illustrates the navigation routes taken during the measurements in Gaoyou Lake, which were conducted over 6 days.

3.1.2. Zhuhai Nearshore Waters

Zhuhai is located in the southern part of Guangdong Province, China, along the western coast of the Pearl River Estuary and adjacent to the South China Sea. As an integral part of the Pearl River Delta, Zhuhai possesses abundant marine resources and a diverse ecosystem. The nearshore area features an extensive water surface, a highly indented shoreline, and numerous islands and bays, creating a distinctive marine landscape. The seawater quality is generally high, with moderate nutrient levels that provide a favorable habitat for marine life. Moreover, Zhuhai serves as a critical maritime hub within the Pearl River Estuary, connecting the Guangdong-Hong Kong-Macao Greater Bay Area and holding significant economic and strategic importance [49,50].
However, rapid urbanization and increasing human activities have posed environmental challenges to the nearshore waters of Zhuhai. Certain areas have been affected by land-based pollution and overfishing, leading to localized eutrophication and ecosystem degradation. Additionally, Qi’ao Island, located in the northeastern part of Zhuhai, hosts extensive mangrove forests along its tidal flats. However, coastal development activities have exerted pressure on these mangroves and the associated wetland ecosystems [51,52].
Despite these challenges, the natural characteristics of Zhuhai’s nearshore waters provide unique advantages for scientific research and technological applications. The moderate water depth makes it suitable for marine ecological monitoring and remote sensing applications. Remote sensing techniques enable the efficient acquisition of dynamic information on water quality, algal distribution, and pollution status, thereby supporting marine environmental protection and resource management efforts.
This study selects Zhuhai’s nearshore waters as the research area due to its representative subtropical nearshore characteristics, including extensive water coverage, diverse ecological environments, and intensive human activities. This region also exhibits high water turbidity, making it an ideal study site for high-turbidity nearshore waters. As shown in Figure 5b, two in situ experiments were conducted in this region. The first survey, on 23 October, was carried out in the southern part of Zhuhai. The second survey, on 25 October, was conducted in the waters between Zhuhai and Qi’ao Island.
Figure 6 presents in situ photographs taken during field measurements at the two study areas. The images clearly illustrate the high turbidity of both Gaoyou Lake and Zhuhai nearshore waters.

3.2. Validation Experiment

Following the methodology outlined in Section 2.4, a validation experiment was conducted on 23 October 2023 utilizing an Ocean Optics USB2000+ spectrometer for the direct approach, simultaneously with the MTS-WRMS system. During the measurement campaign, the MTS-WRMS was rigidly mounted at the vessel’s bow, while the optical fiber probe of the direct approach was deployed via supplementary fixation using a metal rod submerged to a depth of approximately 5 cm in the midship section. Figure 7 presents a photo taken during the experiment.
To ensure spatiotemporal consistency between the measurement systems, a calibrated temporal compensation (Δt = 1 s) was implemented during data alignment. This adjustment accommodated the 3 m longitudinal separation between systems, guaranteeing the concurrent measuring of identical water areas.
Post-experiment relative radiometric calibration was systematically performed on all spectrometers using an ASD FieldSpec hyperspectral radiometer as the reference standard.

3.3. The Matchup of Satellite Data and In Situ Data

Sentinel-3 A/B OLCI Level-2 Water Full Resolution (WFR) products were acquired from the Copernicus Data Space Ecosystem (https://dataspace.copernicus.eu/, accessed on 10 March 2024). Our analysis incorporated 15 spectral bands (400–884 nm) while excluding the 1020 nm channel, aligning with the study’s 400–900 nm spectral domain.
In situ measurements for each satellite band were extracted as the L2 reflectance convoluted using the mean spectral response functions (SRFs) for each Sentinel-3 mission (https://sentinels.copernicus.eu/web/sentinel/technical-guides/sentinel-3-olci/olci-instrument/spectral-characterisation-data, accessed on 14 June 2023).
After band matching, geometric alignment was conducted between the in situ and OLCI Rrs data using the GPS information recorded synchronously during the measurement. Figure 8a shows the true color composite image of OLCI Rrs data of 14 June, with the red line indicating the ship’s route. Figure 8b presents the OLCI Rrs spectra for all matched pixel points.
Table 2 summarizes the experimental dates, locations, time windows of in situ measurements (UTC+8), names of imaging satellites, satellite imaging times (UTC+8), number of in situ satellite image matching points, and wind speed conditions for all 8-day experiments. The wind speed data were acquired from the Huiju Map platform (http://map.hjhj-e.com/, accessed on 11 January 2024), which provides hourly wind speed measurements of China. The tabulated values represent temporally averaged wind speeds during each experimental campaign.
Regarding the reflectance of the water surface to Lsky (ρ), Mobley [16] proposed that for observation angles of (40°, 135°) and wind speeds below 5 m/s, a value of 0.028 is reasonable. Ruddick et al. [53] suggested that under clear sky conditions, ρ can be estimated as a function of wind speed using:
ρ = 0.0256 + 0.00039 w + 0.000034 w 2 ,
where w means the wind speed. Additionally, Lin et al. [54] highlighted that ρ varies across different wavelengths and provided spectral distributions of ρ under varying wind speed conditions. Overall, ρ is influenced by wind-driven surface waves and exhibits inter-band differences.
Since previous studies indicate that ρ remains relatively stable when wind speeds are below 5 m/s, all experimental dates in this study were selected based on this threshold. It is also important to note that the wind speed used in this study represents an hourly average rather than an instantaneous value, which may introduce additional uncertainty if this wind speed data is used to estimate ρ.
Given these considerations, we adopted a fixed reflectance value of ρ = 0.028 in this study. This choice may introduce some error; for example, when wind speeds approach zero, if ρ is closer to 0.0256 according to (3), the maximum deviation of ρ would be 8.57%. The resulting error in Rrs depends on the ratio of ρLsky to Lwater. Measurements indicate that at the two study areas, in the 500–700 nm range—where the water-leaving radiance is most pronounced—0.028 × Lsky accounts for approximately 10% of Lwater, leading to an error in Rrs of less than 1%. In other spectral bands, the proportion of 0.028 × Lsky remains below 50%, resulting in an Rrs error of less than 5%.

3.4. Evaluation Methods

The validation of satellite-derived Rrs products was performed through a rigorous statistical evaluation of spatiotemporally matched in situ satellite pairs. Quantitative performance metrics, including percentage difference (PD) and absolute percentage difference (APD), were computed to characterize systematic biases and random errors, respectively. These metrics are defined as follows:
PD = 1 N i = 1 N y i x i x i × 100 % APD = 1 N i = 1 N y i x i x i × 100 % ,
where N represents the number of valid matchups, and xi and yi denote in situ and satellite Rrs values, respectively. The PD metric quantifies directional bias trends in retrieval accuracy, while the APD evaluates the aggregate magnitude of spectral discrepancies.
While PD and APD are effective for assessing spectral biases on a per-band basis, they may not accurately reflect the overall deviation when considering the entire spectrum. Specifically, in bands with very low signal values, percentage differences can be inflated, potentially misleading conclusions about the overall bias. To mitigate this issue, we introduce the weighted PD (WPD) and weighted APD (WAPD) methods, where the PD or APD of each band is multiplied by the band’s average Rrs value before summing the weighted differences. The resulting value is then normalized by the total Rrs across all bands. Mathematically, the WPD and WAPD can be expressed as follows:
WPD = i = 1 n PD i R ¯ i / i = 1 n R ¯ i × 100 % WAPD = i = 1 n APD i R ¯ i / i = 1 n R ¯ i × 100 % ,
where n represents the number of bands, and ͞Ri is the mean Rrs of the ith band derived from in situ measurements. This weighted scheme prioritizes spectral regions with higher radiative energy contributions, yielding a more accurate and physically meaningful assessment of the spectral discrepancy between satellite-derived and in situ measurements.
In addition, the validity of MTS-WRMS measurements using the direct approach was assessed using APD, WAPD, and root mean square difference (RMSD), a robust metric that quantifies the magnitude of prediction deviations. The RMSD is mathematically defined as follows:
RMSD = 1 N i = 1 N ( y i x i ) 2

4. Results and Discussion

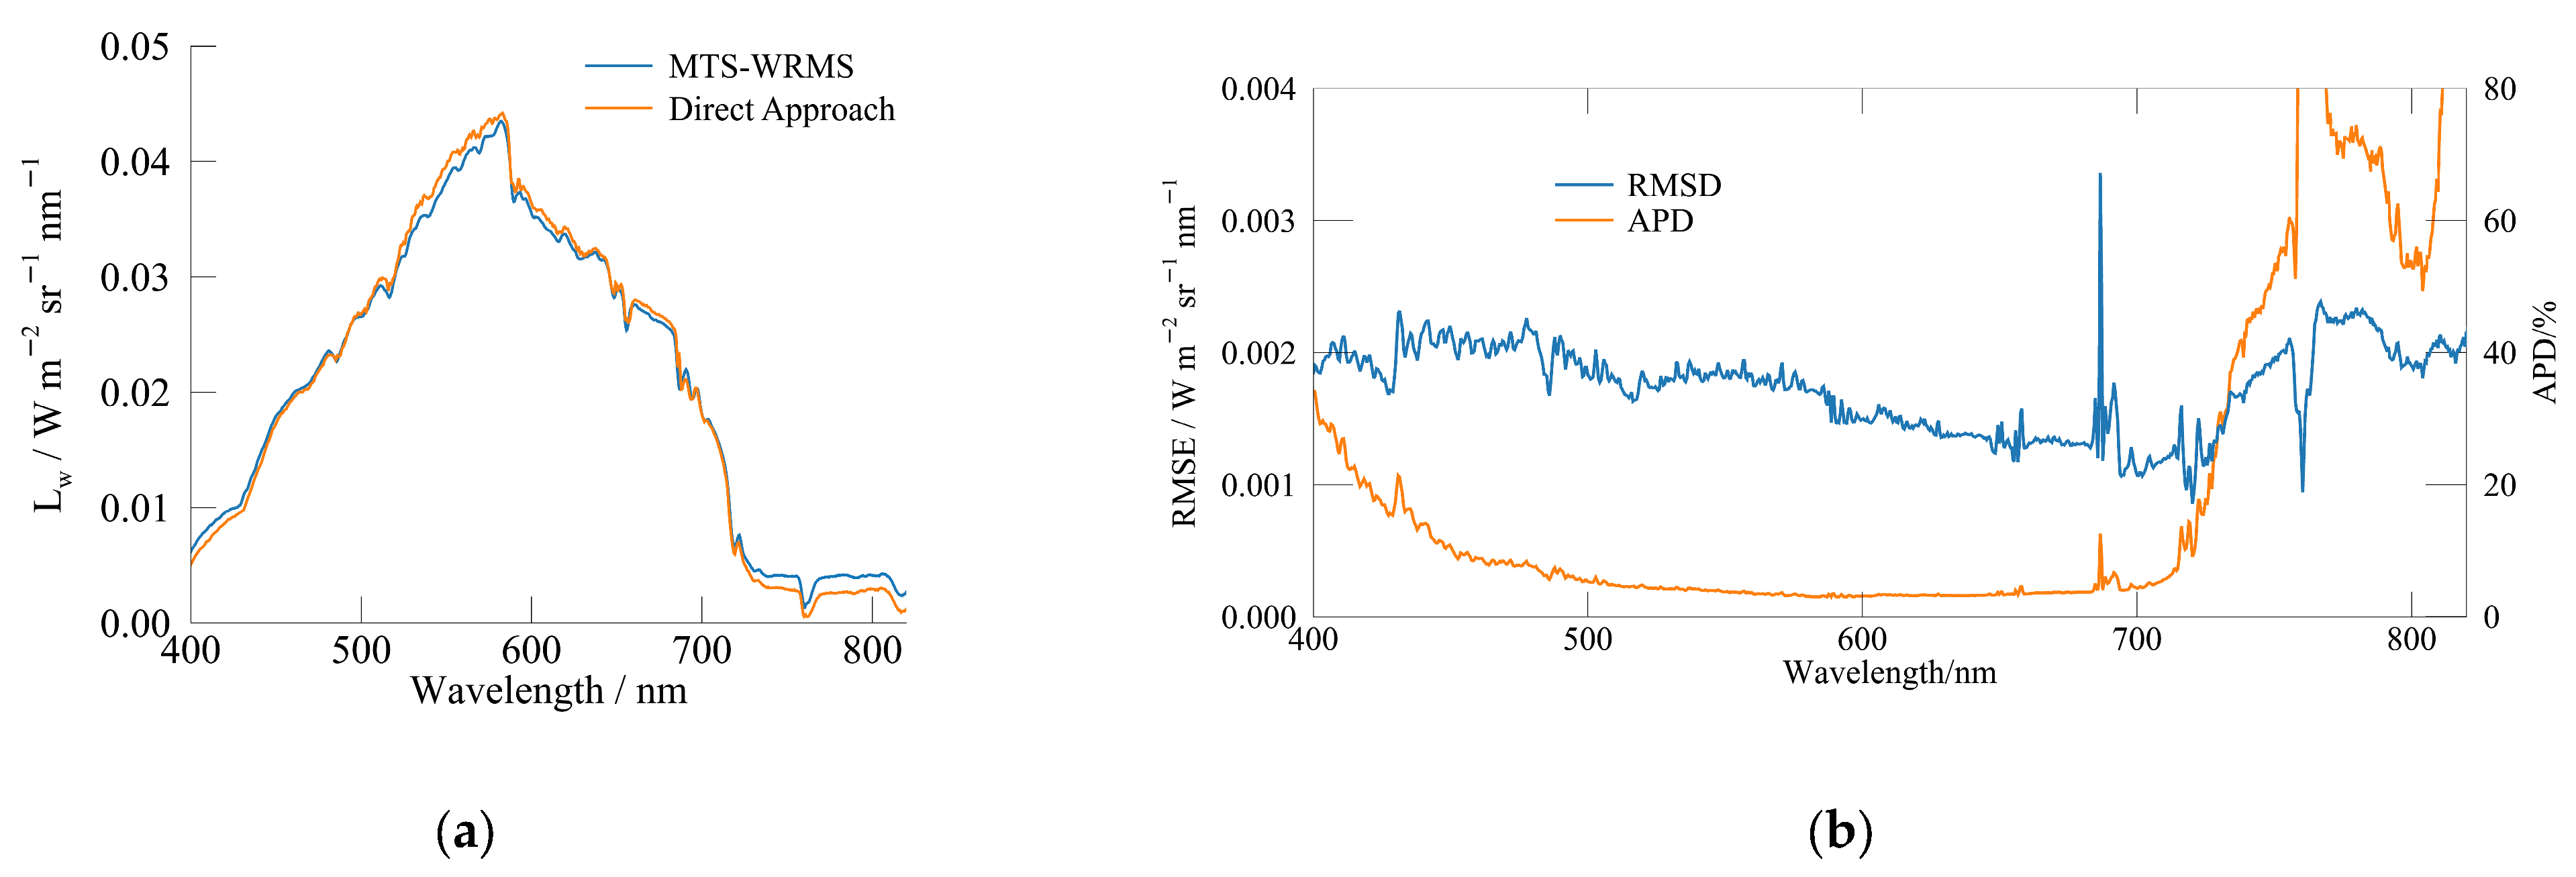
4.1. Validation of Data Reliability

Following the experimental methodology outlined in Section 3.2, a validation experiment was conducted to assess the data reliability of the MTS-WRMS using the direct approach. This section presents the analysis of the validation results.
The validation experiment yielded over 3000 paired water-leaving radiance spectra Lw(λ) through the simultaneous application of both approaches. Figure 9a presents the spectra of water-leaving radiance from a single measurement pair, while Figure 9b presents the statistical distributions of RMSD and APD across all spectral bands.
For quantitative validation, the direct approach was adopted as the reference standard. As shown in Figure 9, the RMSD values stabilize at approximately 0.002 W·m−2·nm−1·sr⁻1 across the entire spectral range. For the APD, notable discrepancies between the two approaches are observed in the pre-440 nm and post-720 nm spectral regions. Both of these areas have low Lw(λ), with above-water measurements showing higher radiance than in-water measurements, likely due to residual surface reflection signals in above-water measurements, whereas in-water measurements inherently suppress such artifacts.
The full-spectrum WAPD value is 7.27%. Within the 440–720 nm range, which accounts for over 90% of the total radiant energy and serves as the primary focus of this study, most of the 596 spectral bands in this band range exhibit APD values below 5%, with a WAPD of 4.42%. This confirms minimal systematic bias in the critical spectral region. Beyond this range, RMSD values stabilize at approximately 0.002 W·m−2·nm−1·sr⁻1, but the APD increases significantly due to the inherently low magnitude of water-leaving radiance in these spectral bands.

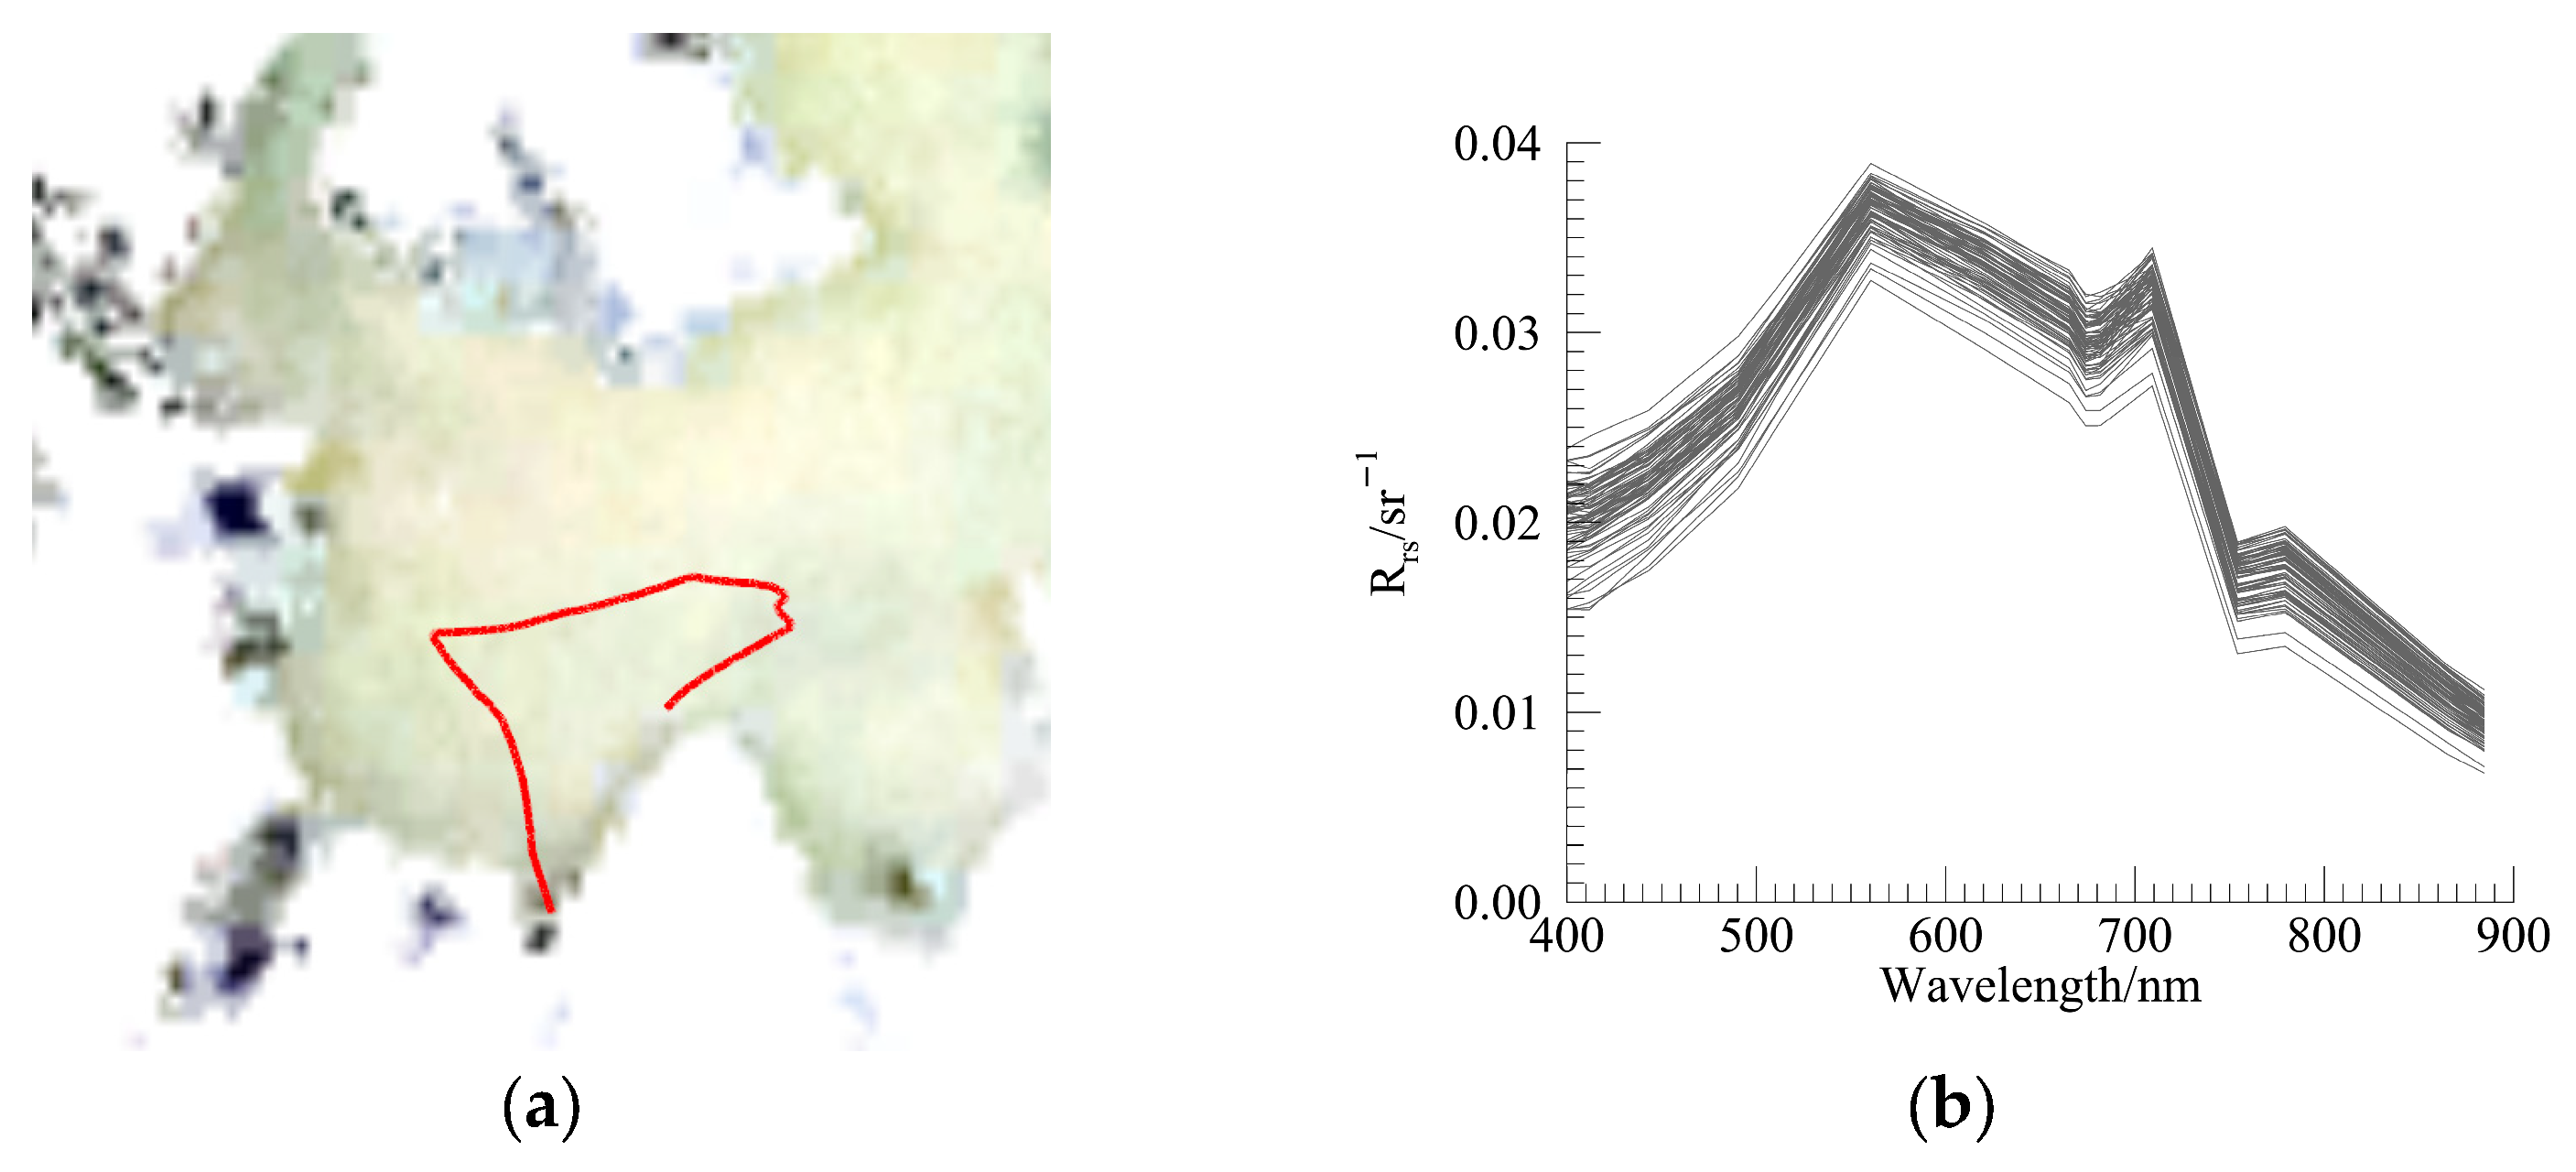
4.2. Spectral Characteristics of Study Areas

Figure 10 presents the Rrs obtained from two study areas on 15 June and 25 October. In each subplot, the black solid lines represent the mean Rrs spectra of the in situ measurements, with shaded areas indicating the 2σ confidence intervals. The red curves correspond to the mean spectral profiles derived from all matched pixels in OLCI satellite data.
The Rrs spectra from both study areas exhibit peak values around 0.03 sr⁻1, confirming high turbidity conditions. For Gaoyou Lake, the Rrs spectra display a distinct dual-peak structure: a broad primary peak spanning 570–700 nm and a narrow secondary peak near 810 nm (Figure 10a). The primary peak arises from the combined effects of low absorption coefficients by pure water and dominant optically active constituents (e.g., suspended sediments and CDOM) in this spectral range, which amplify the backscattering contribution [55,56]. Within the primary peak region, two notable spectral features are observed:
1. An absorption trough at 670 nm, attributed to strong chlorophyll-a absorption by phytoplankton pigments;
2. A reflectance shoulder near 700 nm, associated with chlorophyll fluorescence.
The secondary peak at 810 nm is primarily driven by the abrupt decrease in pure water absorption, where the absorption coefficient decreases to ~2.02 m⁻1 at 810 nm—27% lower than at 750 nm [57].
In contrast, the Rrs spectra from Zhuhai (Figure 10b) show attenuated chlorophyll-related features: the 670 nm absorption trough and 700 nm fluorescence shoulder are less pronounced, suggesting lower chlorophyll-a concentrations. However, enhanced Rrs signals in the near-infrared (NIR) region (>780 nm) imply elevated suspended sediment loads consistent with the hydrodynamic conditions of nearshore waters. Additionally, the Rrs variability in Zhuhai is more pronounced, indicating significant spatial differences in the water body.

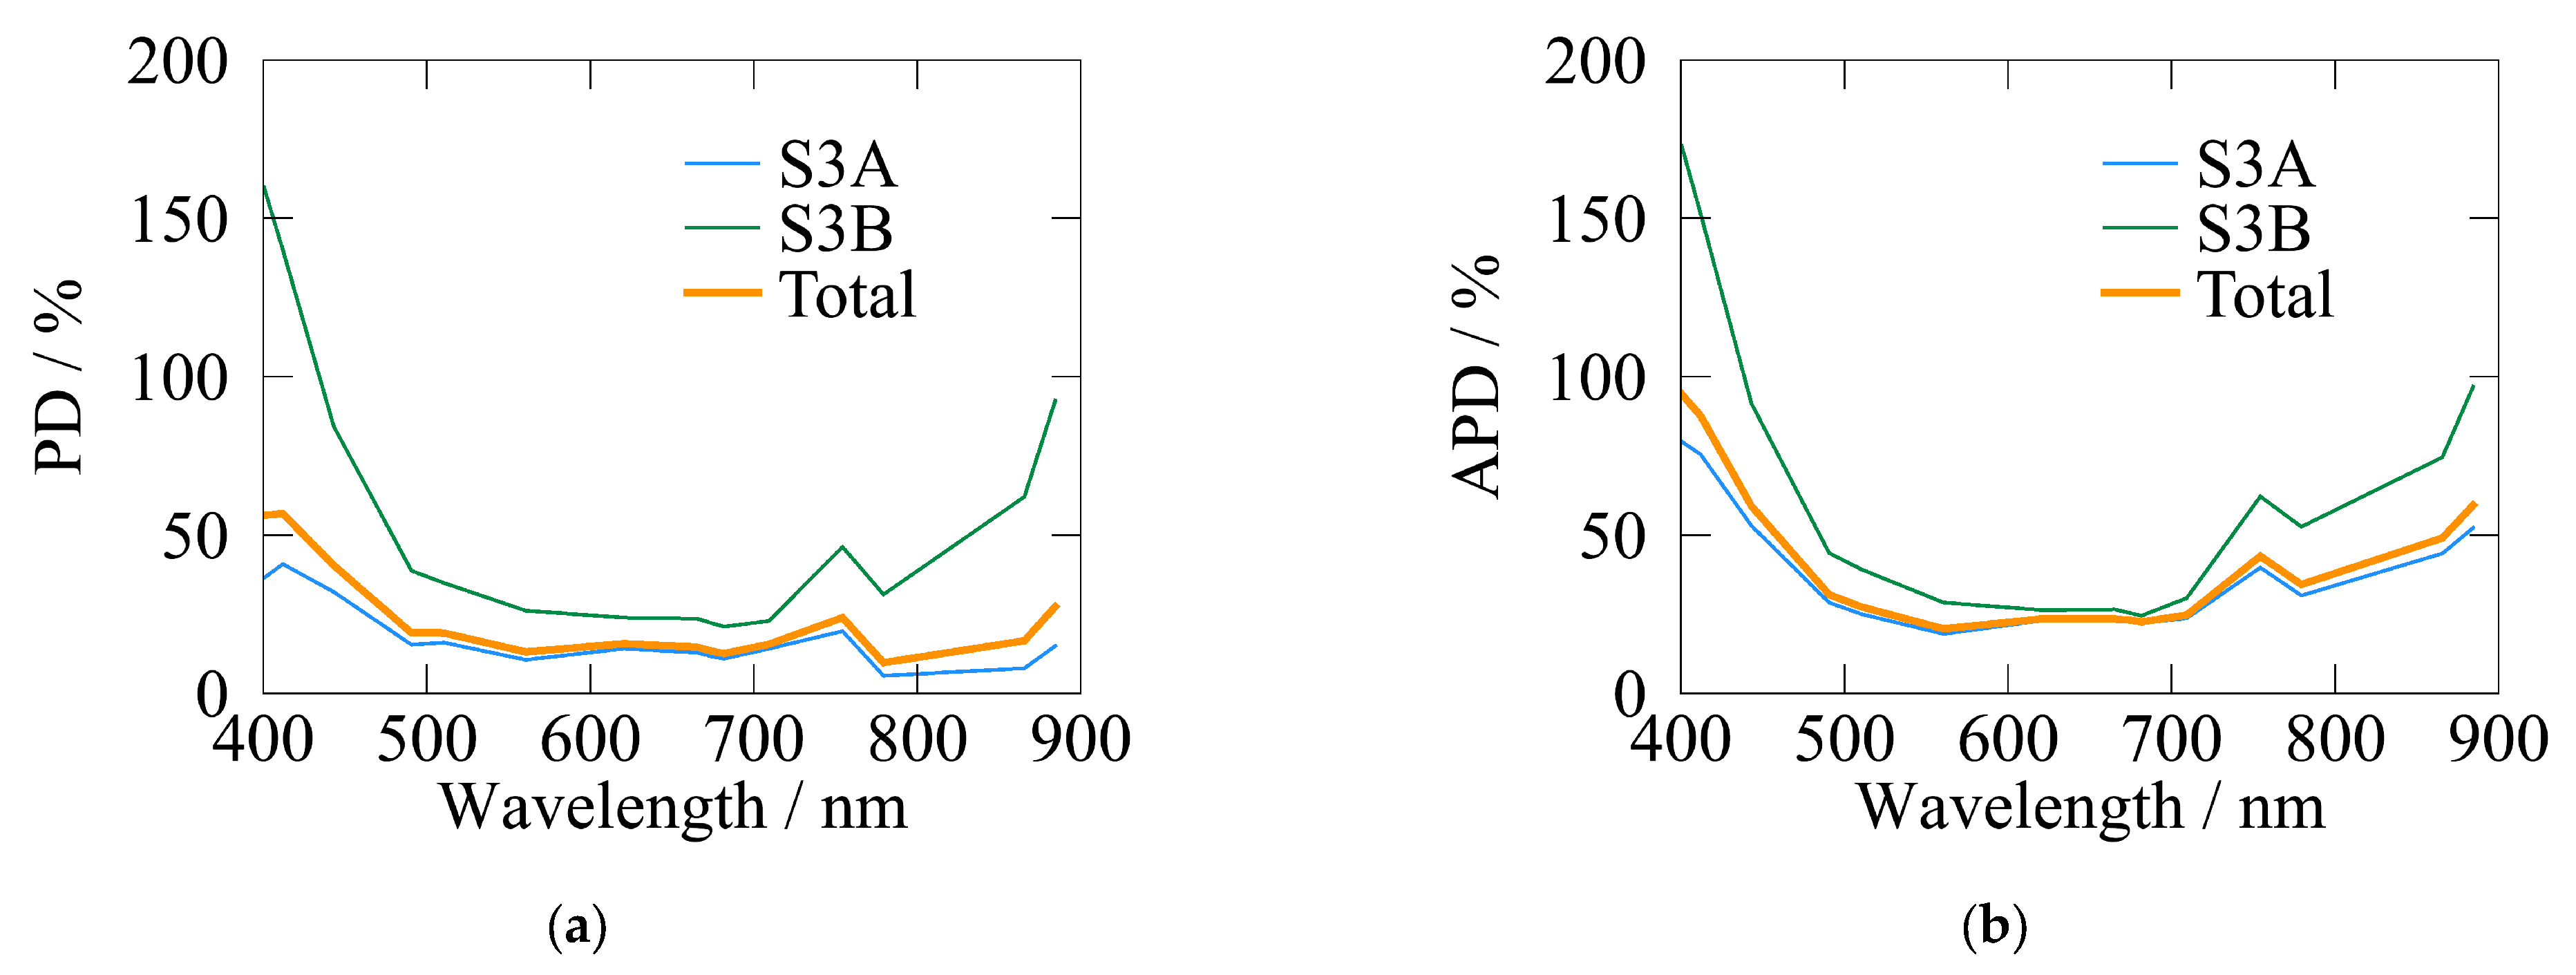
4.3. Deviation Analysis of In Situ Rrs Data

To evaluate the stability of in situ measurements, we employed the coefficient of variation (CV = σ/μ) as an indicator of data consistency. This approach allows for a quantitative assessment of daily variations in Rrs measurements.
For each measurement day, we calculated the mean CV across the 400–900 nm spectral range and listed in Table 3. In Gaoyou, the lowest average CV was recorded on 16 August 2023, at 0.55%, indicating minimal variability. In contrast, the highest CV was observed on 14 June, reaching 2.97%, suggesting increased measurement fluctuations. Similarly, in Zhuhai, the CV values on 23 and 25 October were 3.00% and 2.87%, respectively. A comparison between CV values and wind speed further revealed a general positive correlation, indicating that measurement deviations tend to increase under stronger wind conditions.
Across the eight experimental days in this study, the highest recorded average CV for Rrs measured using the MTS-WRMS system was 3%. Considering noise levels at a 3σ threshold, the maximum deviation in the measurement process is estimated to be approximately 10% of the signal value.
Using CV analysis, this study provides a more detailed statistical evaluation of measurement stability, helping to quantify potential uncertainties in the collected Rrs data.

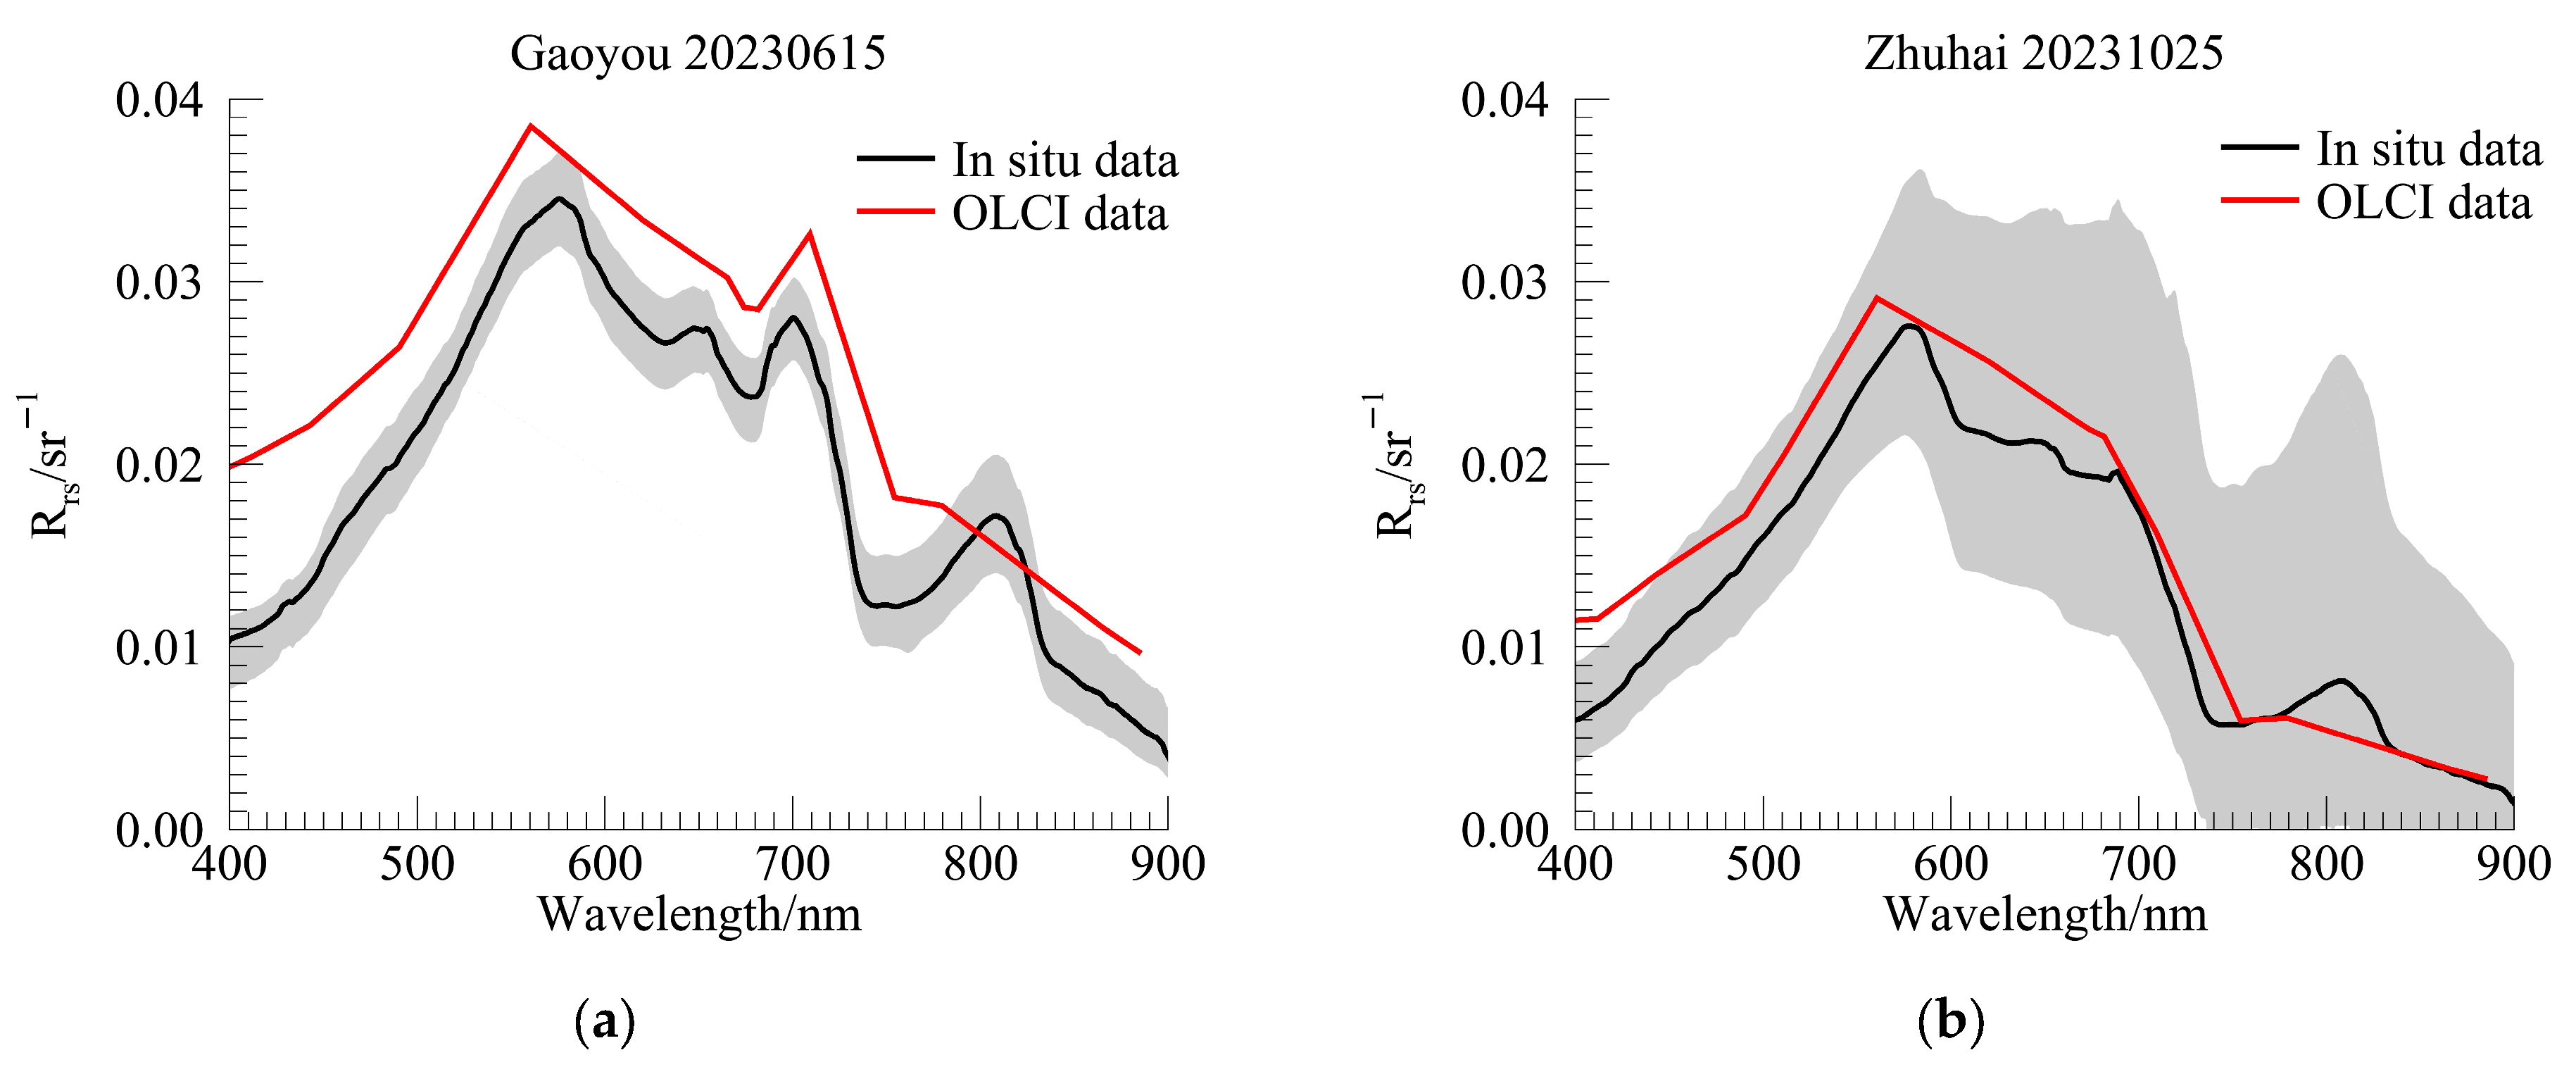
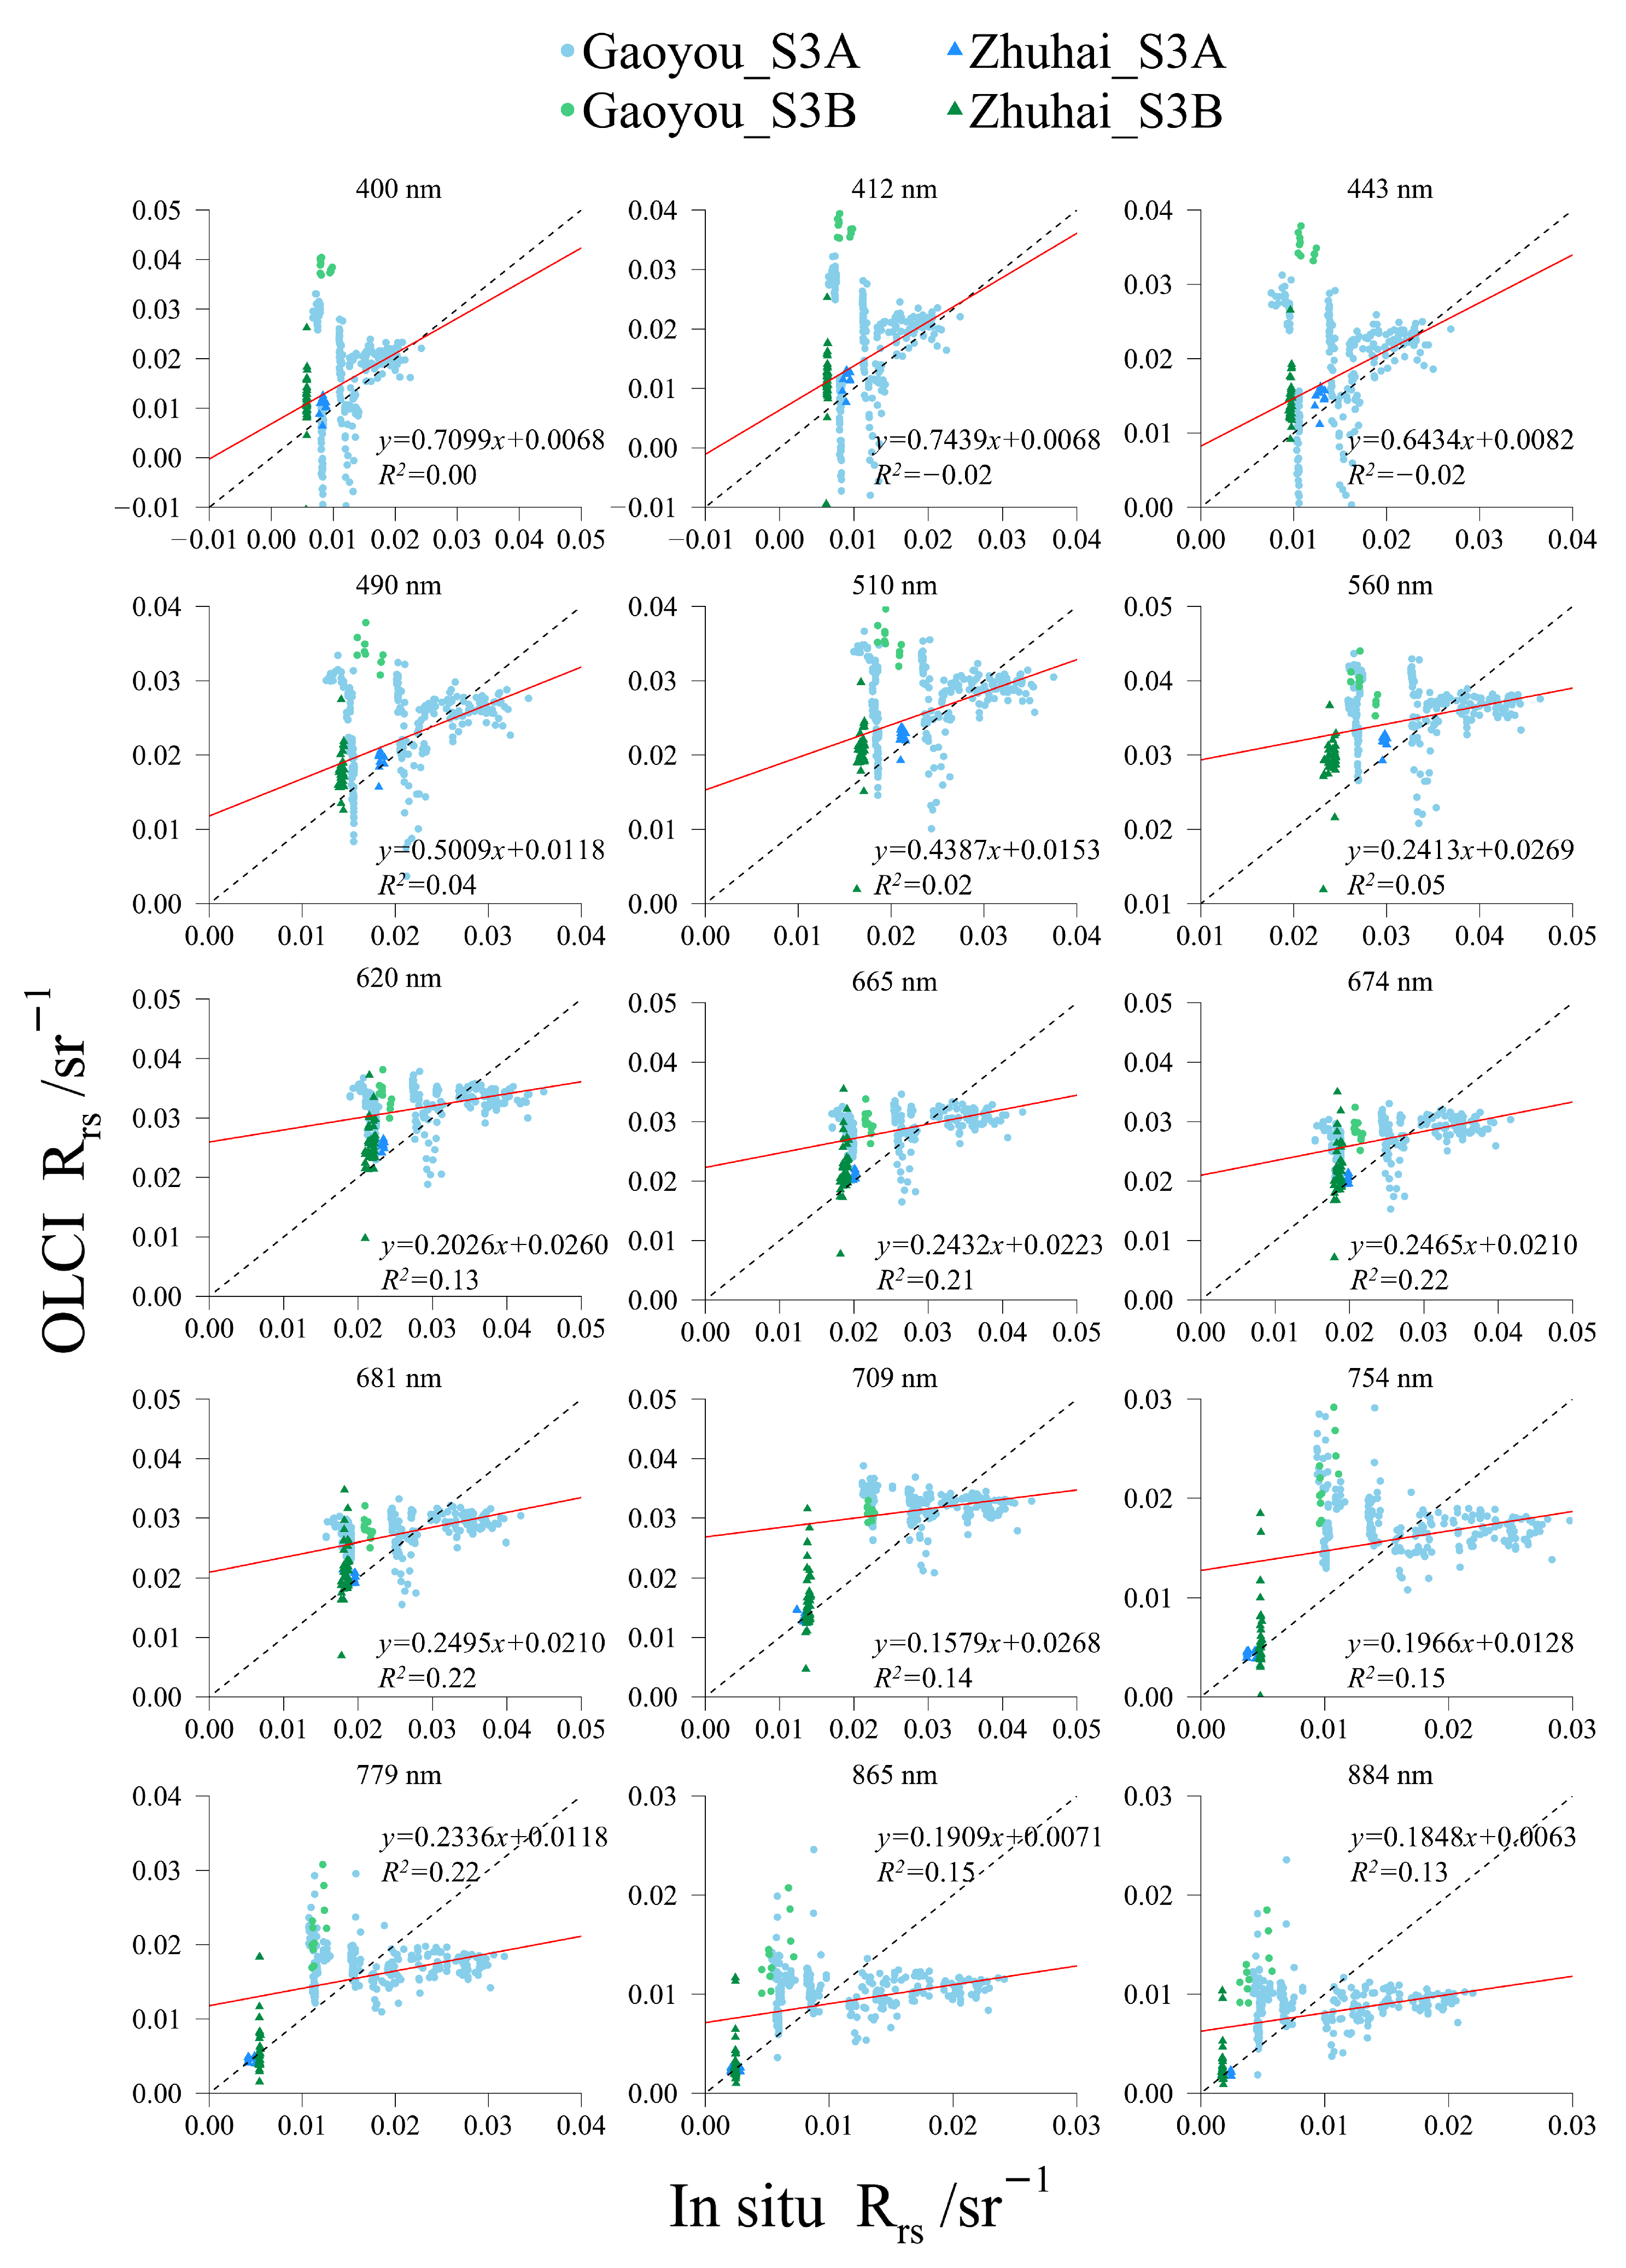
4.4. Consistency Analysis Between In Situ and OLCI Rrs Data

To evaluate the consistency between in situ and satellite-derived Rrs, band-specific scatterplots for Sentinel-3 A/B OLCI were generated using the full matchup dataset (N = 293), as shown in Figure 11. Linear regression was applied to each scatterplot, with the regression lines shown in red and the corresponding equations and R2 values provided to assess the strength of the relationship.
The scatter plots in Figure 11 distinguish data from Sentinel-3 A and B using blue and green points. Results from two study areas, Gaoyou and Zhuhai, are represented by light-colored circles and dark-colored triangles.
According to Figure 11, the scatter point distributions exhibit substantial variability across spectral bands. Nevertheless, all bands demonstrate positive regression slopes between satellite-derived and in situ Rrs, suggesting an underlying correspondence in reflectance magnitude variations.
Notably, the regression lines show low R2 values (≤0.22). This observation aligns with the findings of Gleratti et al. [37] when validating OLCI in medium-turbidity waters. This difference can be attributed to the fact that, for some measurement dates, the in situ data exhibited less variation, while OLCI data showed larger fluctuations. This discrepancy may stem from biases in the OLCI data or from the spatial resolution of the OLCI sensor, which is 300 × 300 m, creating a scale mismatch compared with in situ measurements. In turbid waters, the spatial distribution of Rrs is uneven, and this sub-pixel heterogeneity means that ship-borne measurements may not fully represent the spatially weighted average of the optical properties within a satellite pixel. To address this issue, future studies could consider increasing the number of in situ measurement points within a single satellite pixel to better align the average in situ spectrum with the satellite-derived spectra.
To quantitatively analyze the differences between OLCI-derived and in situ Rrs, performance metrics (PD and APD) were calculated for each band and are presented in Table 4 and Figure 12. Additionally, the WPD and WAPD of the Rrs across all bands are given in Table 4. For simplicity, Sentinel-3 A/B OLCI are referred to as S3A and S3B. These metrics provide a quantitative measure of consistency between in situ and satellite Rrs data.
For PD, the overall deviations across the spectral bands are consistently positive, indicating that the satellite data tend to overestimate the Rrs compared with in situ measurements. However, the deviations are not excessively large, particularly for S3A, where the PD values are relatively modest across most bands, with values ranging from 5.58% to 40.83%. In contrast, S3B exhibits notably larger deviations, with PD values ranging from 21.07% to 159.76%. For APD, similar patterns emerge. S3A shows moderate deviations, with values ranging from 18.8% to 79.47%, while S3B exhibits much larger APD values, ranging from 26.5% to 172.87%. The bands exhibiting larger deviations are primarily the low-signal violet bands (400–443 nm) and near-infrared (NIR) bands (754–884 nm). However, the deviations across different bands in the 490–709 nm wavelength range do not show significant differences and remain relatively stable. The total PD values range from 9.7% to 23.92%, while the APD values range from 20.38% to 43.32%. The overall spectral bias between devices was assessed using weighted PD (WPD = 20.2%) and weighted APD (WAPD = 34.52%), quantifying measurement discrepancies across the full spectrum.
The overall overestimation of OLCI-derived Rrs may be attributed to insufficient atmospheric correction. The most significant deviations are observed in the violet and near-infrared (NIR) bands, likely due to the inherently low Rrs in these regions, which results in higher relative errors. In the violet band, the low Rrs is primarily caused by the strong absorption of chlorophyll and CDOM. In the NIR band, the dominant factor is the strong absorption by pure water, which further suppresses the water-leaving signal. Additionally, shorter wavelengths are more affected by Rayleigh scattering during atmospheric transmission, potentially increasing errors in atmospheric correction [30,37,58,59]. To improve the accuracy of OLCI-derived Rrs, it may be necessary to refine atmospheric correction algorithms for turbid water conditions.
Traceability analysis attributes the anomaly of S3B primarily to the presence of clouds in the data from 13 August 2023. The cloud cover resulted in some data points from the satellite matchup on that day not having corresponding values in the satellite data. The 11 matching points from that day exhibited significant errors. If the data from this day are removed, the WPD for S3B decreases to 15.65%, and the WAPD decreases to 29.44%, which is essentially the same as that of S3A.
Overall, compared with in situ measurements, the Rrs data from Sentinel-3 A/B OLCI show some overestimation in highly turbid waters (WPD ≈ 16%, WAPD ≈ 31%).

5. Conclusions

This study presents a novel ship-borne Rrs measurement system, the MTS-WRMS, designed to enhance the accuracy and stability of spectral data collection in mobile water quality measurements. The integration of a triaxial stabilized gimbal with three spectrometers ensures stable orientation of the sensors, significantly reducing angular errors and mitigating the fluctuations caused by vessel movements. The system provides an automatic orientation adjustment feature, which minimizes sunglint interference. Furthermore, its support for long-distance wireless transmission makes it versatile for both spatially distributed data collection in ship-borne applications and long-term, time-series monitoring in shore-based fixed-point measurements.
The quantitative validation of the system, using the direct approach as the reference standard, demonstrates promising results. The RMSD values remain stable across the entire spectral range, approximately 0.002 W·m⁻2·nm⁻1·sr⁻1. The analysis reveals that within the 440–720 nm range, which covers over 90% of radiant energy, the WAPD is 4.42%, confirming low systematic bias. Notable discrepancies in the pre-440 nm and post-720 nm spectral regions are attributed to surface reflection signals in above-water measurements. This demonstrates the system’s reliability in capturing accurate spectral data.
Furthermore, a comprehensive ground-based validation was performed in two highly turbid water study areas, Gaoyou and Zhuhai, with 296 matched spectra collected over eight days of synchronous measurements with Sentinel-3 A/B OLCI data. The analysis revealed that the OLCI products tend to overestimate Rrs in turbid waters, with WPD and WAPD values of approximately 16% and 31%, respectively. The overestimation was more pronounced in the 400–443 nm bands, likely due to lower Rrs value and insufficient atmospheric correction. To improve the accuracy of OLCI-derived Rrs, it may be necessary to refine atmospheric correction algorithms for turbid water conditions.
In summary, the MTS-WRMS system shows great potential for enhancing Rrs measurement accuracy in challenging mobile ship-borne environments and serves as a valuable tool for studying both temporal and spatial variations in water bodies. However, several areas for improvement remain. Firstly, the system’s hardware stability and anti-interference capabilities under high wave conditions are yet to be fully tested. Although the stabilized gimbal can maintain level orientation through automatic adjustments, its mechanical structure may experience response delays or wear during prolonged use or under severe vibrations (e.g., in high-sea conditions). Additionally, the system lacks automatic validation during data collection. For example, it would be beneficial if the system could autonomously flag data reliability when the pitch and roll angle deviations exceed certain thresholds (e.g., 0.5°) rather than relying on post-measurement manual verification. Lastly, the post-processing software for the system is still under development, and we hope to enhance it in the future with water quality parameter calculation functions similar to those provided by systems such as WISP-3.

Author Contributions

Conceptualization, H.J., H.G. and Y.Z.; methodology, H.J. and P.Z.; software, H.J.; validation, H.J., P.Z. and H.G.; investigation, H.J.; data curation, Y.Z.; writing—original draft preparation, H.J.; writing—review and editing, H.J., P.Z. and Y.Z.; visualization, H.J.; supervision, Y.Z., H.G. and P.Z.; funding acquisition, P.Z. All authors have read and agreed to the published version of the manuscript.

Funding

This research was funded by the National Key R&D Program of China, grant number 2023YFF1303802.

Data Availability Statement

Data are contained within the article.

Conflicts of Interest

Hong Guan is the legal representative of UTAN Technology Co., Ltd. (Hangzhou, China) and one of the lead developers of the “MTS-WRMS” device used in this study. He provided technical support during the use of the device. Although Guan is affiliated with UTAN Technology Co., Ltd., no direct financial support or funding was received from the company for this study.

References

  1. WHO. Guidelines for Drinking-Water Quality: Fourth Edition Incorporating the First and Second Addenda; WHO: Geneva, Switzerland, 2022; p. 614. [Google Scholar]
  2. FAO. The State of the World’s Land and Water Resources for Food and Agriculture (SOLAW): Systems at Breaking Point; FAO: Rome, Italy, 2021; p. 82. [Google Scholar]
  3. Hou, X.; Feng, L.; Dai, Y.; Hu, C.; Gibson, L.; Tang, J.; Lee, Z.; Wang, Y.; Cai, X.; Liu, J.; et al. Global mapping reveals increase in lacustrine algal blooms over the past decade. Nat. Geosci. 2022, 15, 130–134. [Google Scholar] [CrossRef]
  4. Sebastiá-Frasquet, M.-T.; Aguilar-Maldonado, J.-A.; Herrero-Durá, I.; Santamaría-del-Ángel, E.; Morell-Monzó, S.; Estornell, J. Advances in the monitoring of algal blooms by remote sensing: A bibliometric analysis. Appl. Sci. 2020, 10, 7877. [Google Scholar] [CrossRef]
  5. Wang, X.; Yang, W. Water quality monitoring and evaluation using remote sensing techniques in China: A systematic review. Ecosyst. Health Sustain. 2019, 5, 47–56. [Google Scholar]
  6. Ritchie, J.C.; Zimba, P.V.; Everitt, J.H. Remote sensing techniques to assess water quality. Photogramm. Eng. Remote Sens. 2003, 69, 695–704. [Google Scholar]
  7. Jiang, J. Remote Sensing Monitoring of Water Quality for Yuanhe River Inland Water. Master’s Thesis, Beijing Jiaotong University, Beijing, China, 2009. [Google Scholar]
  8. Adjovu, G.E.; Stephen, H.; James, D.; Ahmad, S. Overview of the application of remote sensing in effective monitoring of water quality parameters. Remote Sens. 2023, 15, 1938. [Google Scholar] [CrossRef]
  9. Usali, N.; Ismail, M.H. Use of remote sensing and GIS in monitoring water quality. J. Sustain. Dev. 2010, 3, 228. [Google Scholar]
  10. Fang, C. Remote Sensing Retrieval and Spatial and Temporal Evolution Analysis of International Boundary Lake Water Quality. Ph.D. Thesis, University of Chinese Academy of Sciences (Northeast Institute of Geography and Agroecology, Chinese Academy of Sciences), Beijing, China, 2021. [Google Scholar]
  11. Ruddick, K.G.; Voss, K.; Boss, E.; Castagna, A.; Frouin, R.; Gilerson, A.; Hieronymi, M.; Johnson, B.C.; Kuusk, J.; Lee, Z. A review of protocols for fiducial reference measurements of water-leaving radiance for validation of satellite remote-sensing data over water. Remote Sens. 2019, 11, 2198. [Google Scholar] [CrossRef]
  12. Gordon, H.R.; Brown, O.B.; Evans, R.H.; Brown, J.W.; Smith, R.C.; Baker, K.S.; Clark, D.K. A semianalytic radiance model of ocean color. J. Geophys. Res. Atmos. 1988, 93, 10909–10924. [Google Scholar]
  13. Pahlevan, N.; Mangin, A.; Balasubramanian, S.V.; Smith, B.; Alikas, K.; Arai, K.; Barbosa, C.; Bélanger, S.; Binding, C.; Bresciani, M.; et al. ACIX-Aqua: A global assessment of atmospheric correction methods for Landsat-8 and Sentinel-2 over lakes, rivers, and coastal waters. Remote Sens. Environ. 2021, 258, 112366. [Google Scholar] [CrossRef]
  14. Lee, Z.; Ahn, Y.-H.; Mobley, C.; Arnone, R. Removal of surface-reflected light for the measurement of remote-sensing reflectance from an above-surface platform. Opt. Express 2010, 18, 26313–26324. [Google Scholar] [CrossRef]
  15. Mueller, J.L.; Morel, A.; Frouin, R.; Davis, C.; Arnone, R.; Carder, K.; Lee, Z.; Steward, R.; Hooker, S.; Mobley, C. Ocean Optics Protocols For Satellite Ocean Color Sensor Validation, Revision 4. Volume III: Radiometric Measurements and Data Analysis Protocols. 2003. Available online: https://test.repository.oceanbestpractices.org/handle/11329/478 (accessed on 20 February 2025).
  16. Mobley, C.D. Estimation of the remote-sensing reflectance from above-surface measurements. Appl. Opt. 1999, 38, 7442–7455. [Google Scholar] [PubMed]
  17. Wang, X.; Li, T.; Tang, J.; Yang, A. Measurement and analysis of AOPs in case II waters with above-water method. J. Ocean Technol. 2004, 23, 1–6. [Google Scholar]
  18. Tang, J.; Tian, G.; Wang, X.; Wang, X.; Song, Q. The methods of water spectra measurement and analysis I: Above-water method. Natl. Remote Sens. Bull. 2004, 37–44. [Google Scholar]
  19. Lin, J.; Dall’Olmo, G.; Tilstone, G.H.; Brewin, R.J.; Vabson, V.; Ansko, I.; Evers-King, H.; Casal, T.; Donlon, C. Derivation of uncertainty budgets for continuous above-water radiometric measurements along an Atlantic Meridional Transect. Opt. Express 2022, 30, 45648–45675. [Google Scholar] [PubMed]
  20. Greenberg, E.; Thompson, D.R.; Jensen, D.; Townsend, P.A.; Queally, N.; Chlus, A.; Fichot, C.G.; Harringmeyer, J.P.; Simard, M. An improved scheme for correcting remote spectral surface reflectance simultaneously for terrestrial BRDF and water-surface sunglint in coastal environments. J. Geophys. Res. Biogeosci. 2022, 127, e2021JG006712. [Google Scholar]
  21. Antoine, D.; Guevel, P.; Deste, J.-F.; Becu, G.; Louis, F.; Scott, A.J.; Bardey, P. The “BOUSSOLE” buoy—A new transparent-to-swell taut mooring dedicated to marine optics: Design, tests, and performance at sea. J. Atmos. Ocean. Technol. 2008, 25, 968–989. [Google Scholar]
  22. Clark, D.K.; Yarbrough, M.A.; Feinholz, M.; Flora, S.; Broenkow, W.; Kim, Y.S.; Johnson, B.C.; Brown, S.W.; Yuen, M.; Mueller, J.L. MOBY, a radiometric buoy for performance monitoring and vicarious calibration of satellite ocean color sensors: Measurement and data analysis protocols. In Ocean Optics Protocols for Satellite Ocean Color Sensor Validation. Volume 6: Special Topics in Ocean Optics Protocols and Appendices; NASA: Washington, DC, USA, 2003. [Google Scholar]
  23. Morrow, J.H.; Hooker, S.B.; Booth, C.R.; Bernhard, G.; Lind, R.N.; Brown, J.W. Advances in measuring the apparent optical properties (AOPs) of optically complex waters. NASA Tech. Memo 2010, 215856, 42–50. [Google Scholar]
  24. Lin, H. Experimental Evaluation of the Self-Shadow And Its Correction for on-Water Measurements of Water-Leaving Radiance. Master’s Thesis, Xiamen University, Xiamen, China, 2022. [Google Scholar]
  25. Lee, Z.; Wei, J.; Shang, Z.; Garcia, R.; Dierssen, H.; Ishizaka, J.; Castagna, A. On-water radiometry measurements: Skylight-blocked approach and data processing. In Appendix to Protocols for Satellite Ocean Colour Data Validation: In Situ Optical Radiometry. IOCCG Ocean Optics and Biogeochemistry Protocols for Satellite Ocean Colour Sensor Validation; IOCCG: Dartmouth, NS, Canada, 2019; Volume 3, p. 7. [Google Scholar]
  26. Tian, L.; Li, S.; Sun, X.; Sun, Z.; Song, Q. Development and application of a portable floating optical buoy based on the skylight-blocked approach. Natl. Remote Sens. Bull. 2022, 26, 211–220. [Google Scholar]
  27. Arabi, B.; Salama, M.S.; Wernand, M.R.; Verhoef, W. Remote sensing of water constituent concentrations using time series of in-situ hyperspectral measurements in the Wadden Sea. Remote Sens. Environ. 2018, 216, 154–170. [Google Scholar]
  28. Xu, Y.; He, X.; Bai, Y.; Wang, D.; Zhu, Q.; Ding, X. Evaluation of Remote-Sensing Reflectance Products from Multiple Ocean Color Missions in Highly Turbid Water (Hangzhou Bay). Remote Sens. 2021, 13, 4267. [Google Scholar] [CrossRef]
  29. Vansteenwegen, D.; Ruddick, K.; Cattrijsse, A.; Vanhellemont, Q.; Beck, M. The pan-and-tilt hyperspectral radiometer system (PANTHYR) for autonomous satellite validation measurements—Prototype design and testing. Remote Sens. 2019, 11, 1360. [Google Scholar] [CrossRef]
  30. Vanhellemont, Q.; Ruddick, K. Atmospheric correction of Sentinel-3/OLCI data for mapping of suspended particulate matter and chlorophyll-a concentration in Belgian turbid coastal waters. Remote Sens. Environ. 2021, 256, 112284. [Google Scholar] [CrossRef]
  31. Zibordi, G.; Mélin, F.; Hooker, S.B.; D’Alimonte, D.; Holben, B. An autonomous above-water system for the validation of ocean color radiance data. IEEE Trans. Geosci. Remote Sens. 2004, 42, 401–415. [Google Scholar]
  32. Kuusk, J.; Corizzi, A.; Doxaran, D.; Duong, K.; Flight, K.; Kivastik, J.; Laizans, K.; Leymarie, E.; Muru, S.; Penkerc’h, C. HYPSTAR: A hyperspectral pointable system for terrestrial and aquatic radiometry. Front. Remote Sens. 2024, 5, 1347507. [Google Scholar]
  33. Ruddick, K.G.; Brando, V.E.; Corizzi, A.; Dogliotti, A.I.; Doxaran, D.; Goyens, C.; Kuusk, J.; Vanhellemont, Q.; Vansteenwegen, D.; Bialek, A. WATERHYPERNET: A prototype network of automated in situ measurements of hyperspectral water reflectance for satellite validation and water quality monitoring. Front. Remote Sens. 2024, 5, 1347520. [Google Scholar]
  34. Hommersom, A.; Kratzer, S.; Laanen, M.; Ansko, I.; Ligi, M.; Bresciani, M.; Giardino, C.; Beltrán-Abaunza, J.M.; Moore, G.; Wernand, M. Intercomparison in the field between the new WISP-3 and other radiometers (TriOS Ramses, ASD FieldSpec, and TACCS). J. Appl. Remote Sens. 2012, 6, 063615. [Google Scholar]
  35. Carswell, T.; Costa, M.; Young, E.; Komick, N.; Gower, J.; Sweeting, R. Evaluation of MODIS-Aqua atmospheric correction and chlorophyll products of Western North American coastal waters based on 13 years of data. Remote Sens. 2017, 9, 1063. [Google Scholar] [CrossRef]
  36. Brando, V.E.; Lovell, J.L.; King, E.A.; Boadle, D.; Scott, R.; Schroeder, T. The potential of autonomous ship-borne hyperspectral radiometers for the validation of ocean color radiometry data. Remote Sens. 2016, 8, 150. [Google Scholar] [CrossRef]
  37. Gleratti, G.; Martinez-Vicente, V.; Atwood, E.C.; Simis, S.G.; Jackson, T. Validation of full resolution remote sensing reflectance from Sentinel-3 OLCI across optical gradients in moderately turbid transitional waters. Front. Remote Sens. 2024, 5, 1359709. [Google Scholar]
  38. Bailey, S.W.; Werdell, P.J. A multi-sensor approach for the on-orbit validation of ocean color satellite data products. Remote Sens. Environ. 2006, 102, 12–23. [Google Scholar]
  39. Gitelson, A.A.; Schalles, J.F.; Hladik, C.M. Remote chlorophyll-a retrieval in turbid, productive estuaries: Chesapeake Bay case study. Remote Sens. Environ. 2007, 109, 464–472. [Google Scholar]
  40. Wang, J.; Sun, D.; Wang, S.; Li, Z.; Zhang, Y.; Li, J.; Zhang, H. Satellite observations of suspended particulate matter concentration in Lake Gaoyou in the past four decades. Water Res. 2024, 254, 121442. [Google Scholar] [PubMed]
  41. Li, S.; Guo, W.; Yin, Y.; Jin, X.; Tang, W. Environmental changes inferred from lacustrine sediments and historical literature: A record from Gaoyou Lake, eastern China. Quat. Int. 2015, 380, 350–357. [Google Scholar]
  42. Qu, X.; Chen, Y.; Liu, H.; Xia, W.; Lu, Y.; Gang, D.-D.; Lin, L.-S. A holistic assessment of water quality condition and spatiotemporal patterns in impounded lakes along the eastern route of China’s South-to-North water diversion project. Water Res. 2020, 185, 116275. [Google Scholar] [PubMed]
  43. Zhang, L.; Cheng, Y.; Niu, Y.; Jiang, J. Analysis and prediction of eutrophication for advanced warning of the water quality concerns in Gaoyou Lake. Water Supply 2020, 20, 186–196. [Google Scholar]
  44. Wang, H.; Dai, Y.; Chen, Y.; Zhang, K.; Gao, Q.; Bai, S. Spatiotemporal Evolution and Cause Analysis of Potamogeton crispus L. in Gaoyou Lake Based on Multispectral Remote Sensing Technology. Adm. Tech. Environ. Monit. 2024, 36, 78–82+87. [Google Scholar]
  45. Chen, Y.; Chen, Z.; Zou, L.; Wang, H. Remote Sensing Inversion of Chlorophyll-a Concentration and Total Suspended Matter Concentration in Gaoyou Lake Based on Sentinel-2 MSI Data. Environ. Monit. Forewarning 2024, 16, 21–28. [Google Scholar]
  46. Chen, Y.; Chen, Z.; Ma, D.; Yin, H.; Wu, C. Remote Sensing Estimation of Water Quality Parameters in Gaoyou Lakebased on Sentinel-2 MSIData. Environ. Sci. Manag 2022, 47, 77–81. [Google Scholar]
  47. Cai, P.; Liu, R.; Gao, M.; Chen, B.; Gao, Y. Spatial-temporal changes and driving factors of water quality in Gaoyou Lake from 2009 to 2021. Jiangsu Water Resour. 2023, 4–9. [Google Scholar]
  48. Tian, C.; Guo, C.; Wu, X. Distribution of submerged plants and its relationship with environmental factors in Gaoyou Lake. Acta Hydrobiol. Sin. 2019, 43, 423–430. [Google Scholar]
  49. Wu, C.S.; Yang, S.; Huang, S.; Mu, J. Delta changes in the Pearl River estuary and its response to human activities (1954–2008). Quat. Int. 2016, 392, 147–154. [Google Scholar]
  50. Huang, X.; Huang, L.; Yue, W. The characteristics of nutrients and eutrophication in the Pearl River estuary, South China. Mar. Pollut. Bull. 2003, 47, 30–36. [Google Scholar] [CrossRef] [PubMed]
  51. Liu, S.; Zhou, W.; Ye, S.; Li, C. Research on the potential suitable habitat of mangroves analysis in Zhuhai city based on MaxEnt modeling. J. Cent. South Univ. For. Technol. 2023, 43, 35–43. [Google Scholar]
  52. Qiu, N.; Xu, S.; Qiu, P.; Yang, W.; Yang, X.; Yang, Q. Community distribution and landscape pattern of the mangrove on the Qi’ao Island, Zhuhai. Scientia Silvae Sinicae 2019, 55, 1–10. [Google Scholar]
  53. Ruddick, K.G.; De Cauwer, V.; Park, Y.-J.; Moore, G. Seaborne measurements of near infrared water-leaving reflectance: The similarity spectrum for turbid waters. Limnol. Oceanogr. 2006, 51, 1167–1179. [Google Scholar] [CrossRef]
  54. Lin, J.; Lee, Z.; Tilstone, G.H.; Liu, X.; Wei, J.; Ondrusek, M.; Groom, S. Revised spectral optimization approach to remove surface-reflected radiance for the estimation of remote-sensing reflectance from the above-water method. Opt. Express 2023, 31, 22964–22981. [Google Scholar] [CrossRef]
  55. Smith, R.C.; Baker, K.S. Optical properties of the clearest natural waters (200–800 nm). Appl. Opt. 1981, 20, 177–184. [Google Scholar] [CrossRef]
  56. Kuang, R. Remote Sensing Model of Ocean Colour Parameters in Yangtze Estuary. Ph.D. Thesis, East China Normal University, Shanghai, China, 2010. [Google Scholar]
  57. Deng, R.; He, Y.; Qin, Y.; Chen, Q.; Chen, L. Pure water absorption coefficient measurement after eliminating the impact of suspended substance in spectrum from 400 nm to 900 nm. Yaogan Xuebao-J. Remote Sens. 2012, 16, 174–191. [Google Scholar]
  58. Wei, J.; Lee, Z.; Garcia, R.; Zoffoli, L.; Armstrong, R.A.; Shang, Z.; Sheldon, P.; Chen, R.F. An assessment of Landsat-8 atmospheric correction schemes and remote sensing reflectance products in coral reefs and coastal turbid waters. Remote Sens. Environ. 2018, 215, 18–32. [Google Scholar] [CrossRef]
  59. Soppa, M.A.; Silva, B.; Steinmetz, F.; Keith, D.; Scheffler, D.; Bohn, N.; Bracher, A. Assessment of polymer atmospheric correction algorithm for hyperspectral remote sensing imagery over coastal waters. Sensors 2021, 21, 4125. [Google Scholar] [CrossRef]
Figure 1. A tri-sensor system schematic for Above-Water Approach.
Remotesensing 17 01223 g001
Figure 2. The main hardware components of the MTS-WRMS.
Remotesensing 17 01223 g002
Figure 3. The composition of the stabilized gimbal control system and dual-antenna orientation system of MTS-WRMS.
Remotesensing 17 01223 g003
Figure 4. The schematic of direct approach.
Remotesensing 17 01223 g004
Figure 5. Navigation routes of each experimental date: (a) Gaoyou, (b) Zhuhai. The basemap is sourced from ArcGIS.
Remotesensing 17 01223 g005
Figure 6. In situ photographs of the two study areas: (a) Gaoyou Lake, 15 June 2023; (b) Zhuhai nearshore waters, 25 October 2023.
Remotesensing 17 01223 g006
Figure 7. Photo of the validation experiment. The MTS-WRMS is fixed at the vessel’s bow, and the optical fiber for the direct approach is submerged in the water at the midship region.
Remotesensing 17 01223 g007
Figure 8. Geometric matching of satellite and in situ data. (a) True-color composite image of OLCI Rrs data in Gaoyou Lake on 14 June with ship route; (b) Rrs data for all matched points.
Remotesensing 17 01223 g008
Figure 9. Validation results of data reliability: (a) A pair of Lw(λ) simultaneously obtained using the two methods; (b) Statistical distributions of full-band RMSD and APD.
Remotesensing 17 01223 g009
Figure 10. Comparison of Rrs spectra between in situ measurements and OLCI satellite retrievals for (a) the Gaoyou study area on 15 June and (b) the Zhuhai study area on 25 October. Black solid lines indicate the mean in situ Rrs spectra with shaded regions representing 2σ confidence intervals of field measurements, while red curves depict the mean OLCI-derived Rrs spectra from spatially matched pixels.
Remotesensing 17 01223 g010
Figure 11. Scatterplots of matchups between Sentinel-3 A/B OLCI sensors for in situ Rrs measurements of the two study areas of each band. In each plot, the black dotted line represents the position where OLCI and in situ data are equal, and the red line represents the regression line fitted to all matched points, with the corresponding regression equation and the R2 values for all points.
Remotesensing 17 01223 g011
Figure 12. Performance metrics curves for Sentinel-3 A/B OLCI data based on Table 4. (a) PD and (b) APD.
Remotesensing 17 01223 g012
Table 1. Comparison of spectral and deployment characteristics of various Rrs measurement devices.
DevicesHYPSTARRAMSESWISP-3HyperSASDALECMTS-WRMS
Number of sensors133133
Deployment methodFixedFixedHandheldMobileMobileMobile
Spectral resolution/nm3104.910102
Spectral sampling interval/nm 0.53.30.43.33.30.4
Number of bands204825620482562562048
Field of View (FOV)
Automatic horizontal orientation adjustmentYesNo-YesNoYes
Table 2. Matchup between in situ measurements and satellite data (UTC+8).
SatelliteExperimental DateExperimental LocationSatellite Image Acquisition TimeIn Situ Measurement TimeNumber of Matched Pixels Average Wind Speed (m/s)
Sentinel-3 A14 June 2023 Gaoyou10:21:0708:51:26–11:35:21792.8
15 June 2023Gaoyou09:54:5708:57:11–11:10:39411.5
12 August 2023 Gaoyou09:51:0710:01:35–11:58:36482.5
15 August 2023Gaoyou10:13:3210:01:19–11:35:54372.6
16 August 2023Gaoyou09:47:2109:50:47–11:32:19300.8
23 October 2023Zhuhai10:27:5010:23:16–11:19:59113.4
Sentinel-3 B13 August 2023Gaoyou10:27:0410:29:23–11:40:20112.7
25 October 2023Zhuhai10:37:3409:43:30–11:03:21363.0
Table 3. Full-band average coefficient of variation (CV) for each experimental date.
GaoyouZhuhai
DateCV/%DateCV/%DateCV/%
14 June 2.9713 August1.1523 October3.00
15 June2.5915 August2.3825 October2.87
12 August 1.1016 August0.55
Table 4. Performance metrics of Sentinel-3 A/B OLCI data derived from matchup results.
PD/%Wavelength/nm400412443490510560620665
S3A36.4540.8332.0415.3816.0310.6114.1312.88
S3B159.76139.9584.3138.7434.8626.1223.9123.59
Total56.2356.7340.4219.1319.0513.0915.714.6
Wavelength/nm674681709754779865884WPD
S3A11.710.9514.1119.655.587.9314.9815.82
S3B22.221.0722.8546.2631.2562.0792.4439.84
Total13.3812.5815.5123.929.716.6227.420.2
APD/%Wavelength/nm400412443490510560620665
S3A79.4775.4652.9428.662518.822.9822.86
S3B172.87151.591.5244.2939.128.6826.3126.5
Total94.4587.6559.1331.1727.2620.3823.5223.44
Wavelength/nm674681709754779865884WAPD
S3A22.7422.1923.7239.7230.9144.1752.2631.84
S3B25.4224.5530.0762.1852.674.5296.8545.5
Total23.1722.5724.7443.3234.3949.0459.4134.52
Disclaimer/Publisher’s Note: The statements, opinions and data contained in all publications are solely those of the individual author(s) and contributor(s) and not of MDPI and/or the editor(s). MDPI and/or the editor(s) disclaim responsibility for any injury to people or property resulting from any ideas, methods, instructions or products referred to in the content.

