1. Introduction
As an active remote sensing tool, Synthetic Aperture Radar (SAR) provides day-and-night imagery in all weather conditions and is widely used in civilian applications such as climate change research and environmental monitoring [
1,
2,
3,
4]. In recent years, the advancements in payload design and imaging technology have significantly enhanced the resolution of SAR imagery to the sub-meter scale. This enables SAR to capture certain structural details of targets like aircraft, making their detection technically feasible. Furthermore, with the rapid increase in SAR image data and the evolution of intelligent algorithms, aircraft target detection has gradually become a notable research focus.
Current methods of aircraft detection in SAR images are mainly categorized into traditional approaches and deep learning-based methods. Traditional techniques primarily depend on manually designed features, such as grayscale statistical measures, geometric attributes, and textual descriptors [
5,
6,
7,
8], to differentiate targets from their backgrounds. The widely used constant false alarm rate (CFAR) [
9] characterizes the statistical properties of background clutter to adjust the detection threshold. Hu et al. [
6] leveraged edge density and uniformity to detect aircraft targets. Tan et al. [
8] detected salient targets utilizing directional local gradient distribution. While these methods have achieved relatively good performance in simple scenarios, they heavily rely on prior information and specifically designed features, limiting their adaptability and performance in complex scenarios.
Deep learning-based methods have gained attention for their excellent feature extraction and representation capabilities [
10,
11,
12]. Many detection algorithms from natural image processing have been adapted to SAR images. He et al. [
13] introduced a parallel network to incorporate component information and filter false detections. Zhang et al. [
14] designed a pyramid architecture to suppress background texture and highlight targets. Li et al. [
15] utilized local mask patches to predict gradient representations and integrate SAR domain information.
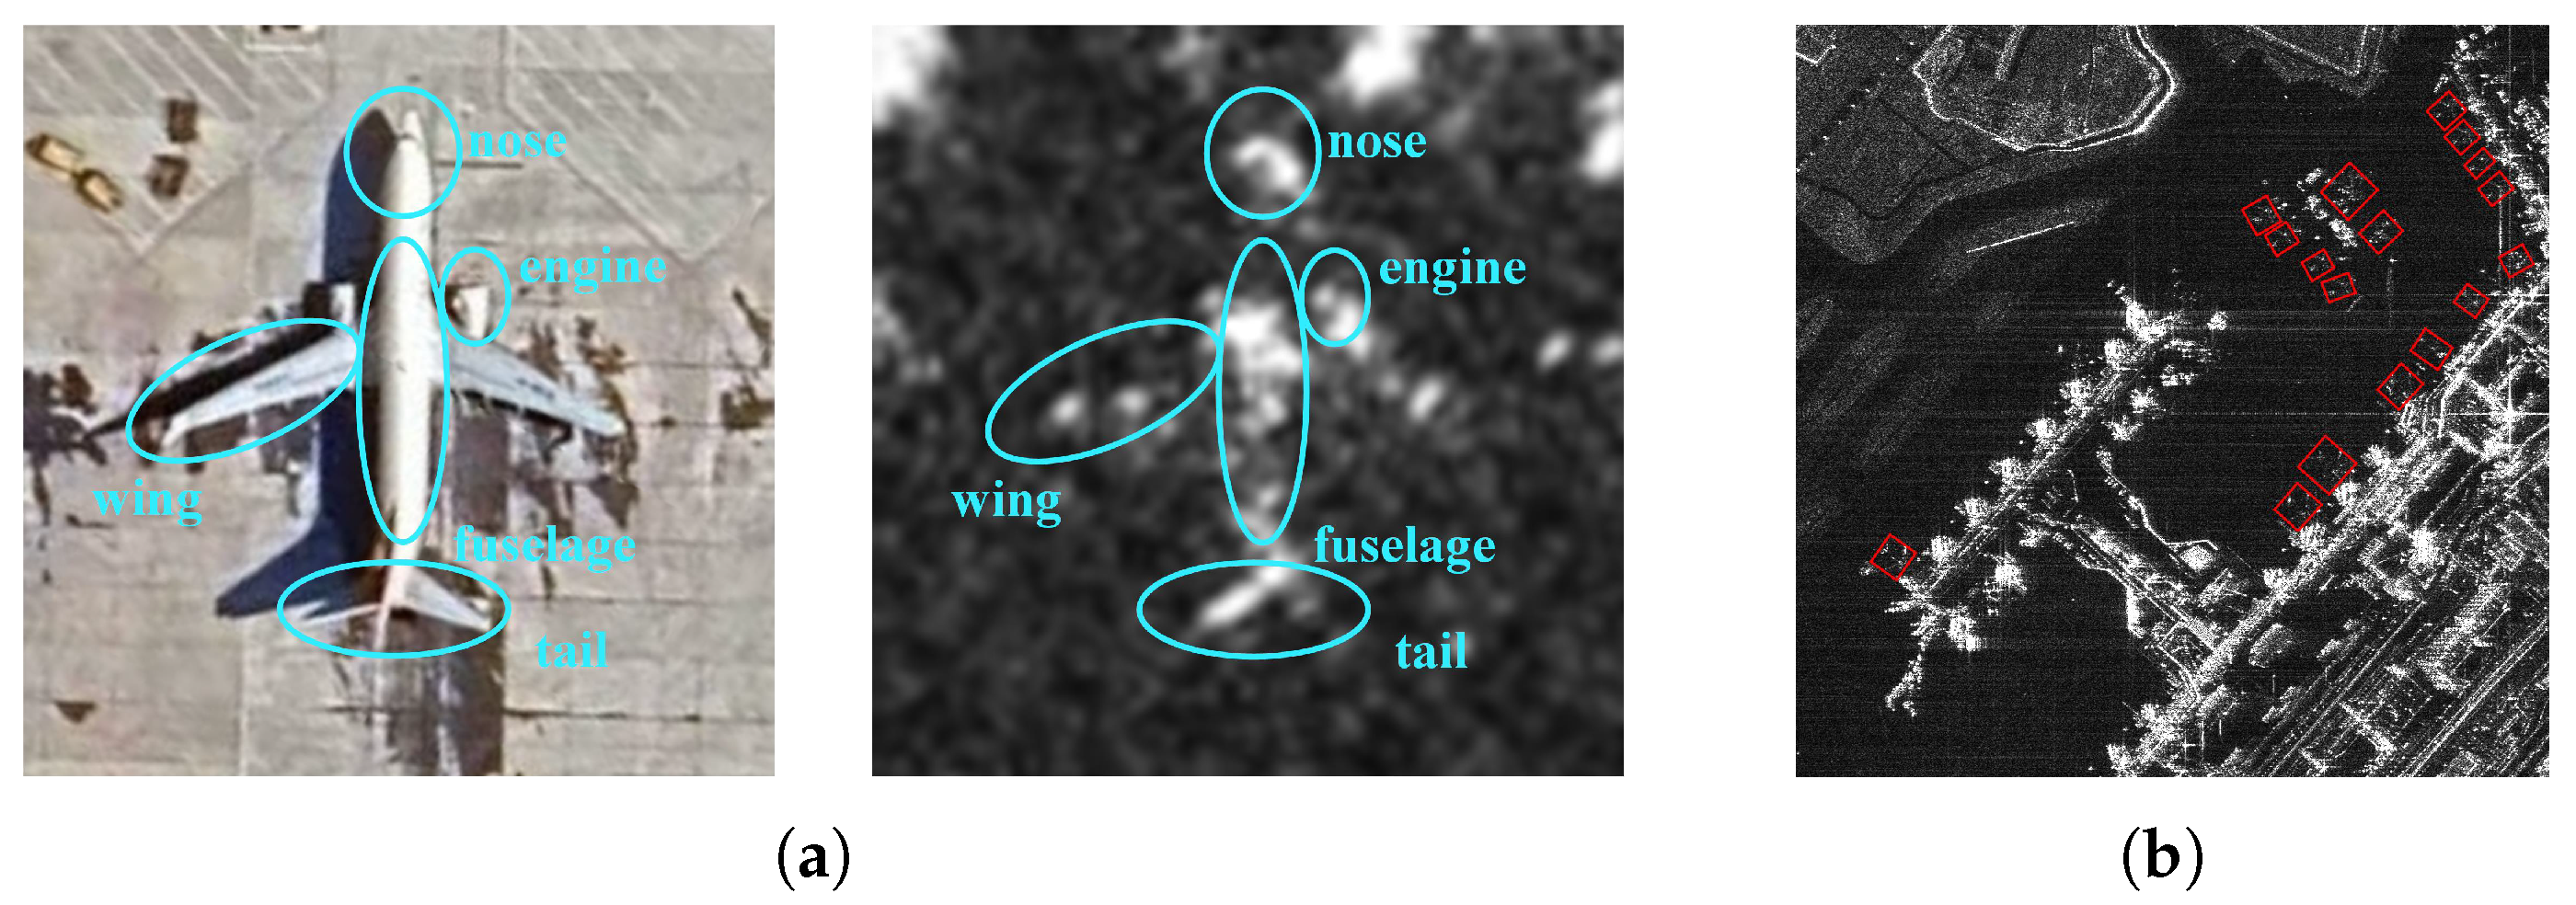
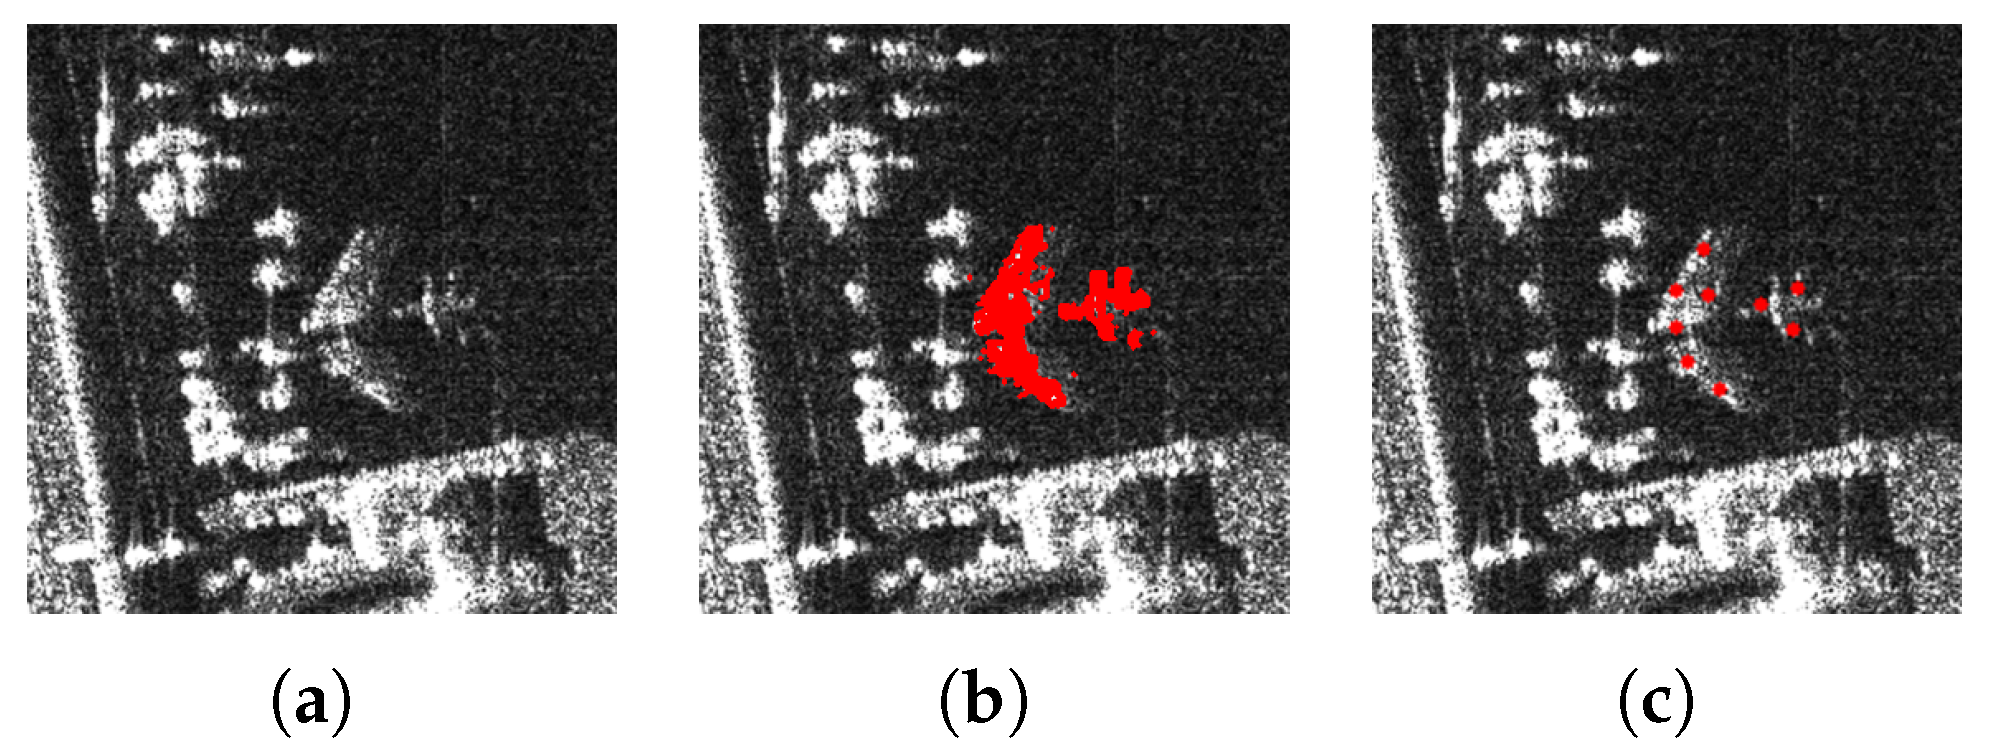
While the deep learning-based methods mentioned above have reached a certain level of performance, aircraft detection in SAR imagery still presents some challenges. First, due to the SAR imaging mechanism and the structural properties of aircraft, a single aircraft target typically appears as a collection of discrete points from strong backscattering areas with multiple centers, as depicted in
Figure 1a. The weak correlations between discrete points result in discontinuous component features and incomplete representation of the overall structure. In addition, the contour and texture details of aircraft are often indistinct, as shown in
Figure 1b, which makes the targets hard to distinguish and may cause confusion between aircraft and ground facilities with similar scattering representations, leading to false alarms. Most existing methods are limited by these factors in detection recall and false-alarm suppression and often struggle to effectively extract directional information for oriented targets and integrate strong scattering features.
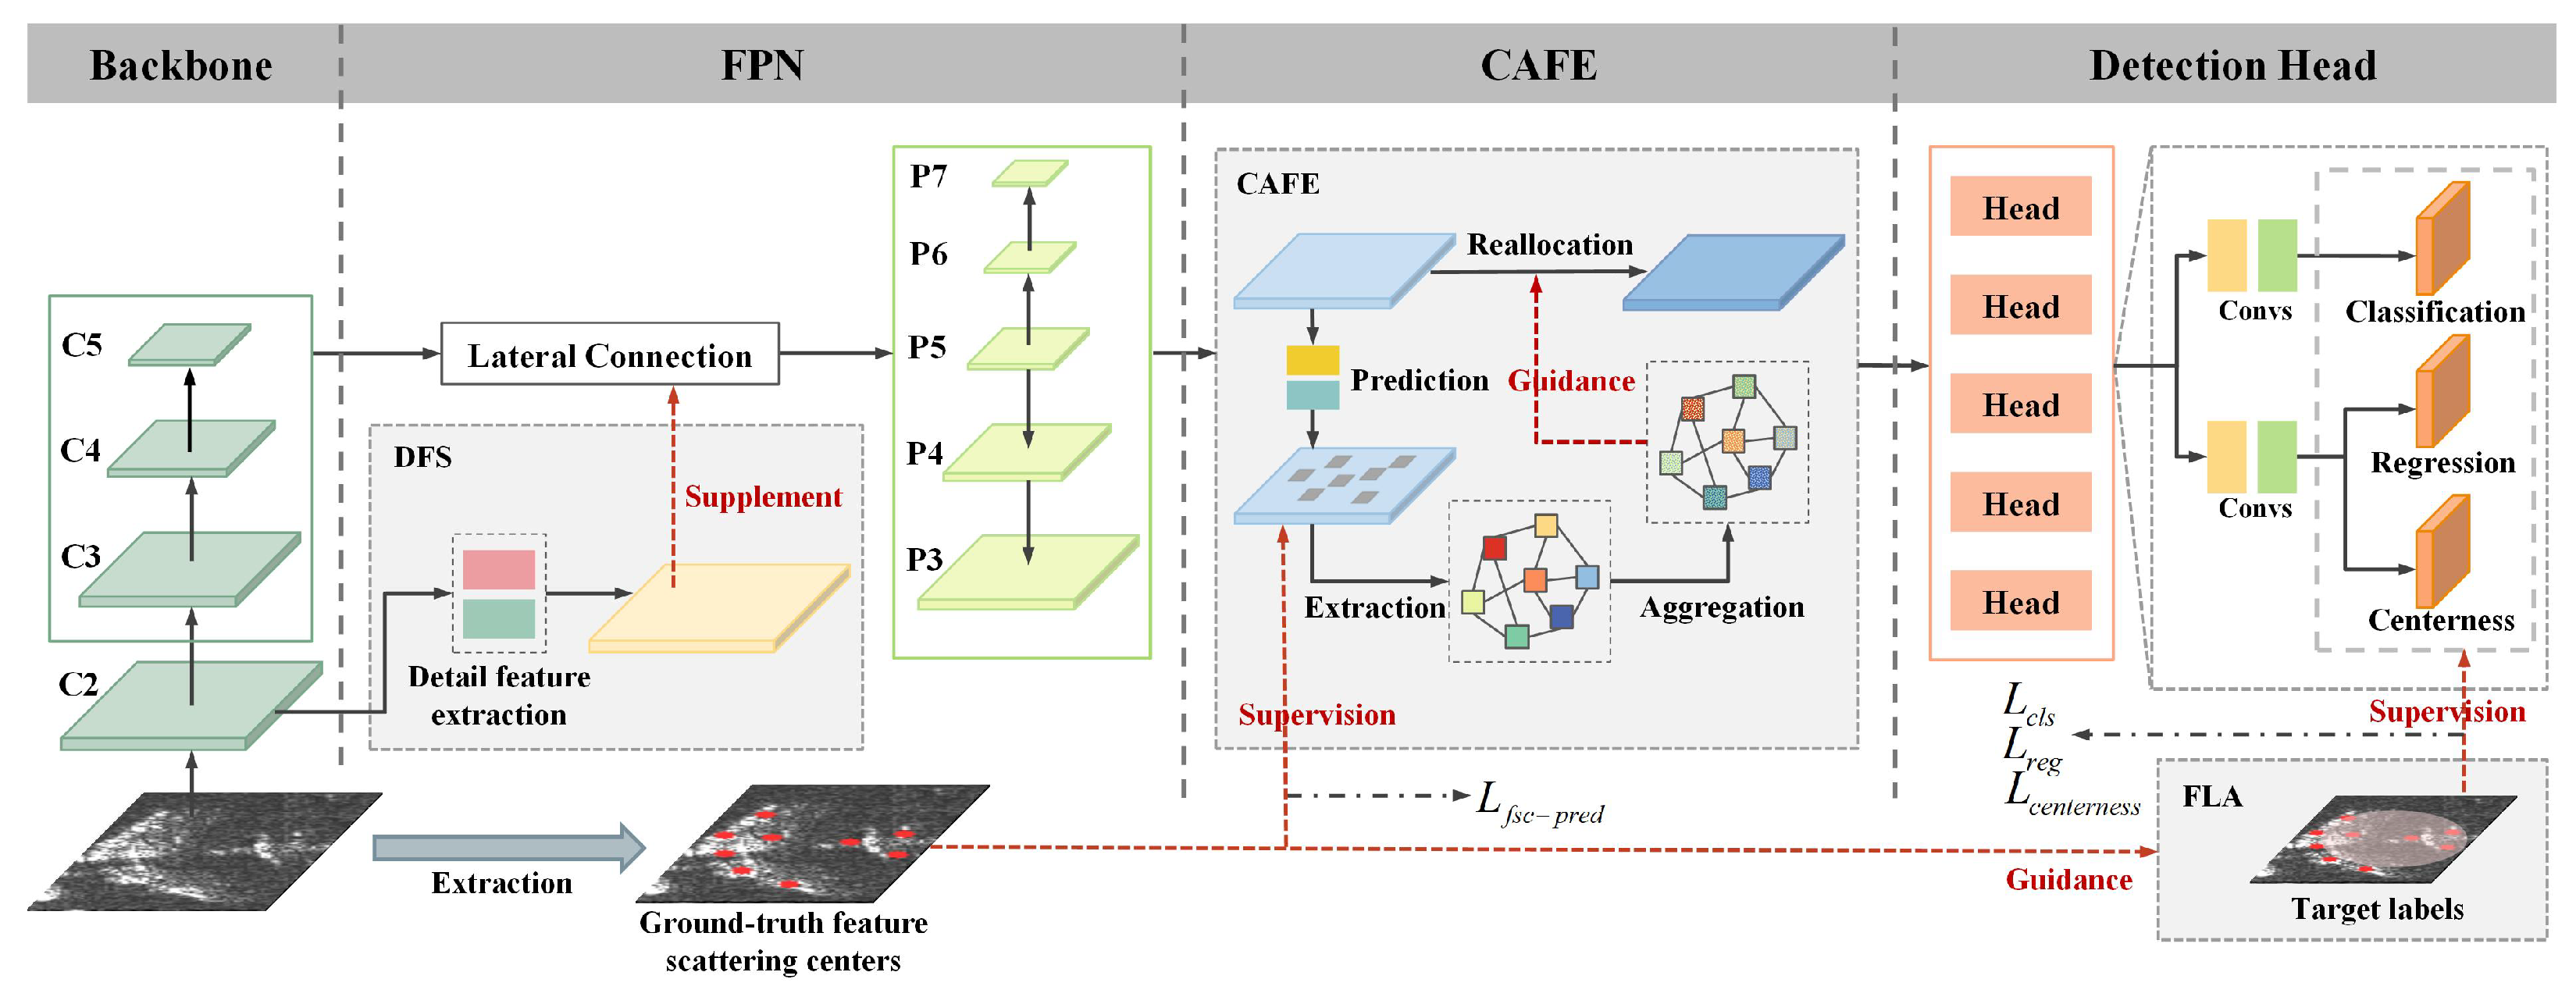
To address the above challenges, a scattering feature guidance network (SFG-Net) is proposed as a framework for multi-scale oriented aircraft detection in SAR imagery. The key idea is to incorporate the discrete and multi-center scattering characteristics of aircraft targets, enhancing feature representation with low-level details while guiding scattering feature aggregation and enhancement, as well as label assignment based on the distribution of strong scattering regions, thereby optimizing aircraft detection performance while suppressing interference. Concretely, the method introduces a context-aware scattering feature enhancement (CAFE) module, which aggregates global scattering information and enriches local response through global contextual transmission between strong scattering areas. This enhances the structural integrity and target saliency, improving the ability to differentiate targets from background interference and reducing false alarms. The method also includes a detail feature supplement (DFS) module, which strengthens low-level features to capture more detailed and contextual scattering information, thereby expanding perception of contour and texture characteristics and providing more enriched representations. Additionally, a feature scattering center-based label assignment (FLA) strategy is proposed during the training process to adaptively adjust positive sample regions based on the spatial distribution of strong scattering regions. This ensures a more precise alignment between the assigned labels and the targets, enhancing the detection robustness and accuracy in complex scenarios. Furthermore, unlike most common methods using horizontal bounding-box (HBB) annotations, the proposed method utilizes a framework with oriented bounding-box (OBB) annotations, encapsulating more orientation information.
Our main contributions are summarized as follows:
(1) The scattering feature guidance network (SFG-Net) provides a novel detection framework for arbitrarily oriented aircraft in SAR imagery. Through the integration of detail-aware feature extraction, contextual information aggregation, and adaptive label assignment, SFG-Net incorporates the scattering characteristics of aircraft targets into the detection process and effectively enhances detection accuracy while reducing background interference.
(2) The framework introduces two key modules: the detail feature supplement (DFS) module and the context-aware scattering feature enhancement (CAFE) module. The DFS extracts low-level features to enrich high-level representations, capturing fine and contextual details to expand the perception of contour and texture characteristics, thereby improving detection, especially for less prominent targets. CAFE leverages the associations between strong scattering regions to conduct global contextual transmission and aggregation. This enhances structural integrity and feature consistency of aircraft targets, improving detection accuracy while effectively suppressing false alarms.
(3) To further optimize the training process, a feature scattering center-based label assignment (FLA) strategy is proposed based on the spatial distribution of strong scattering regions. By adaptively aligning label assignment with the scattering characteristics of targets, FLA improves the coverage of structure information and the consistency between supervision signals and target features, resulting in improved detection performance.
Ablation studies validate the effectiveness and generalizability of the proposed method. The remainder of this paper is structured as follows:
Section 2 reviews related work,
Section 3 elaborates on the proposed methodology,
Section 4 presents experimental results and analysis,
Section 5 provides discussions, and
Section 6 concludes the study.
3. Materials and Methods
Aircraft targets in SAR imagery typically exhibit discrete and fragmented structural features, along with indistinct contours and texture details, posing significant challenges in accurately representing target structures and maintaining feature continuity. These factors result in incomplete structural representations and increased difficulty in distinguishing aircraft targets from background clutter, hindering improvements in detection accuracy and suppression of misdetections.
To overcome the challenges mentioned above, a framework called SFG-Net is proposed for oriented aircraft detection. The key idea is to leverage the target-scattering characteristics through a coupled pipeline, enhancing feature representation with low-level details while guiding feature extraction, reconstruction, and label assignment based on the distribution and associations of strong scattering features. Specifically, the detail feature supplement (DFS) module extracts low-level features by capturing more contour and texture details and richer contextual information and bridges them with high-level representations, contributing to more accurate detection, especially for less prominent targets. Then, the context-aware scattering feature enhancement (CAFE) module aggregates global scattering information and enriches the local response through global contextual extraction and transmission, improving structural integrity and target saliency while reducing false alarms. Additionally, the feature scattering center-based label assignment (FLA) strategy adaptively refines positive sample regions based on the spatial distribution of scattering features to ensure critical regions and the overall structure receive more attention during training. Together, these modules optimize feature representation and label assignment, boosting detection accuracy and robustness while suppressing interference in complex scenarios. The whole architecture of SFG-Net is presented in
Figure 2. In this section, a comprehensive introduction to the framework is provided.
3.1. General Baseline
In this work, we employ FCOS (Fully Convolutional One-Stage Object Detection) [
21] as the baseline. As an anchor-free framework, it integrates multi-scale features and a decoupled detection head, providing a suitable foundation for integration and assessment of scattering guidance.
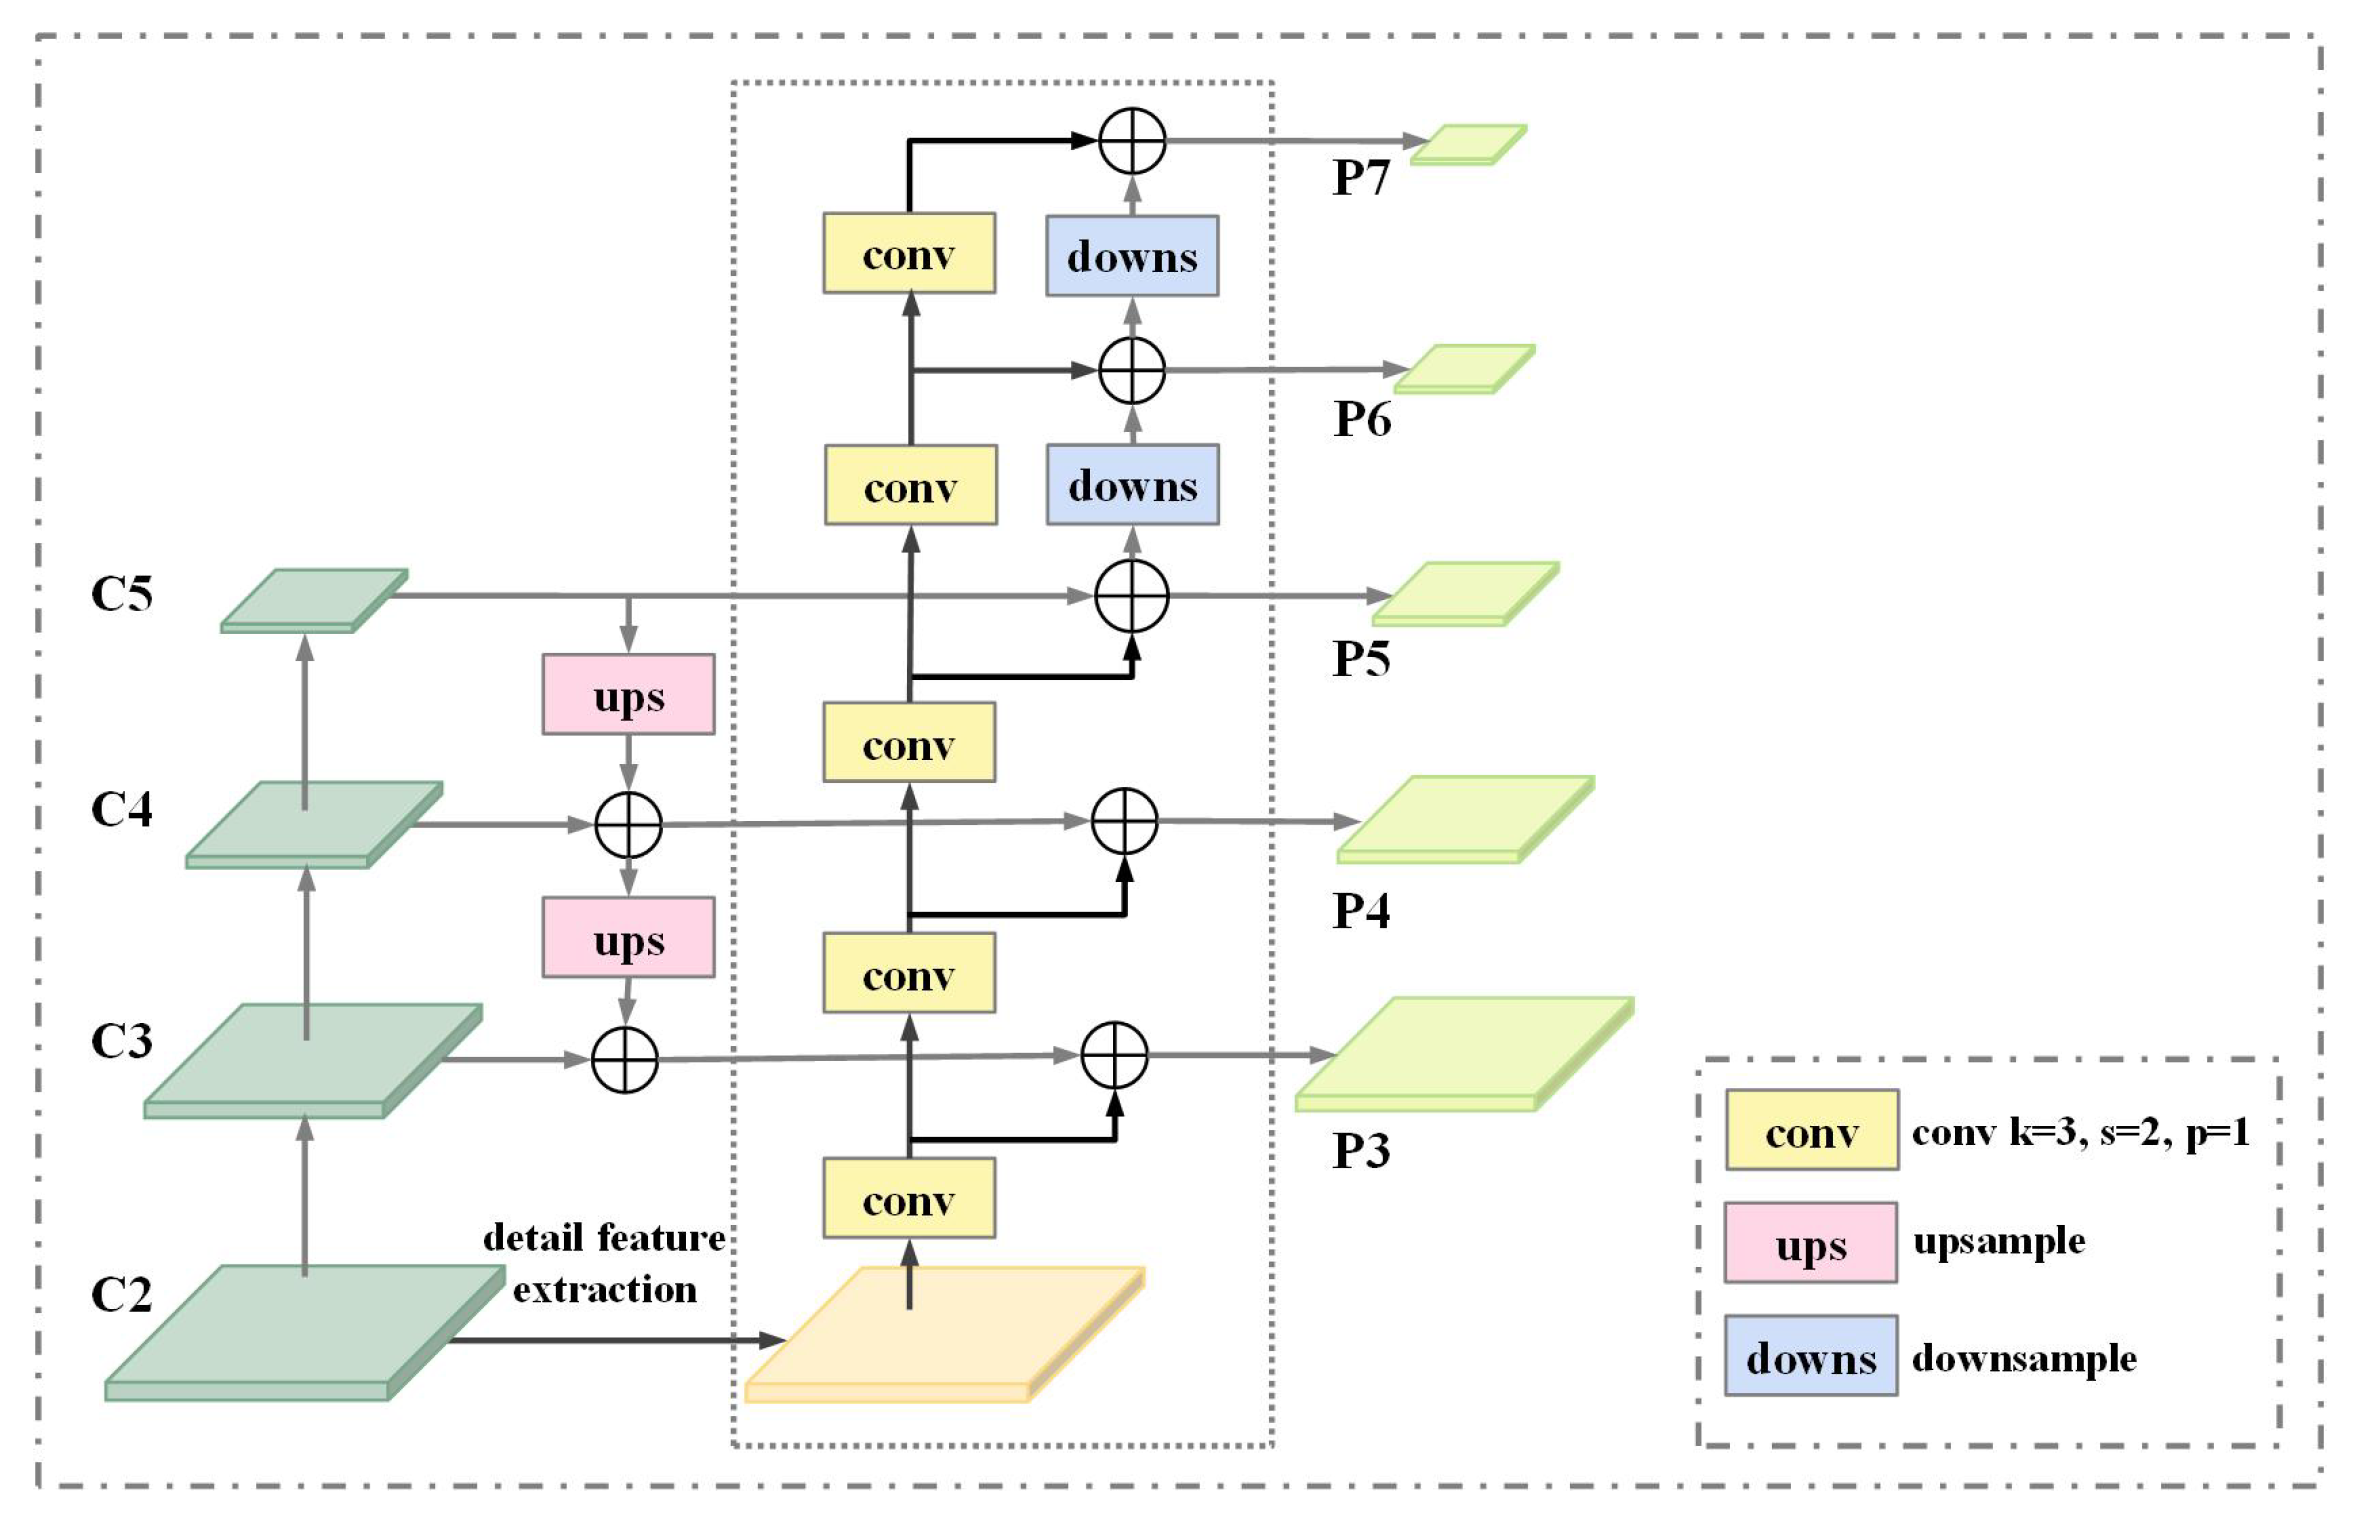
The baseline utilizes ResNet-50 [
30] as the backbone for feature extraction and a feature pyramid network (FPN) [
31] for multi-level feature fusion. ResNet-50 extracts features at multiple scales and generates feature maps {C2, C3, C4, C5} through downsampling convolutional blocks, where higher-level maps contain more semantic but less spatial information. Subsequently, FPN processes {C3, C4, C5} to produce multi-scale feature maps {P3, P4, P5, P6, P7} via a top-down pathway and lateral connections.
In the detection head, predictions are made in a per-pixel fashion. As depicted in
Figure 3, the regression target is modeled as the distances to boundaries of the bounding box
, which is then normalized by the stride (
s) of each level of feature maps to obtain
as the target. The detection head outputs three branches, as shown in
Figure 2: classification, regression, and centerness branches, which predict categorical labels, bounding-box coordinates, and centerness scores, respectively. The centerness branch is introduced to suppress low-quality predictions far from bounding-box centers.
For label assignment, points within ground-truth bounding boxes are classified as positive, while other points are classified as negative. To refine positive sample selection, center sampling is employed by prioritizing regions near ground-truth box centers.
This study integrates the designed modules into feature extraction, enhancement, and label assignment stages within the baseline, leveraging scattering characteristics as guidance and supervision to improve detection performance. The following sections provide detailed introductions to each proposed module.
3.2. Detail Feature Supplement (DFS) Module
Since aircraft targets in SAR images often display discrete and discontinuous features, their contours and textures are typically less distinct, making targets less discriminative. To alleviate this issue, a detail feature supplement (DFS) module is introduced to expand the perception of low-level information and enhance high-level representations. By capturing low-level texture and contour details and contexts, the DFS module provides enriched supplementary information for subsequent multi-scale feature representations. The DFS module contains two stages where detail information is first extracted from low-level features, then supplements the multi-level feature pyramid.
The detail feature extraction stage, as illustrated in
Figure 4, is designed to extract and refine contextual information and low-level texture and contour features. It adopts a parallel structure similar to that proposed in [
32], where a low-level C2 feature map is first refined by 3 × 3 convolutions, then processed by parallel blocks including dilated convolutions, hybrid differential blocks (HDBlocks), and 1 × 1 convolutions, which refine the feature map while retaining its shape, forming a residual structure.
To better perceive and extract contextual features around target regions, dilated convolutions [
33] are employed. By inserting gaps between convolutional kernel elements, dilated convolutions enable the network to capture surrounding information and broader spatial dependencies without introducing additional parameter complexity. Specifically, two branches of 3 × 3 dilated convolutions with dilation rates of 2 and 4 are employed, allowing the network to extract more context information in complex backgrounds.
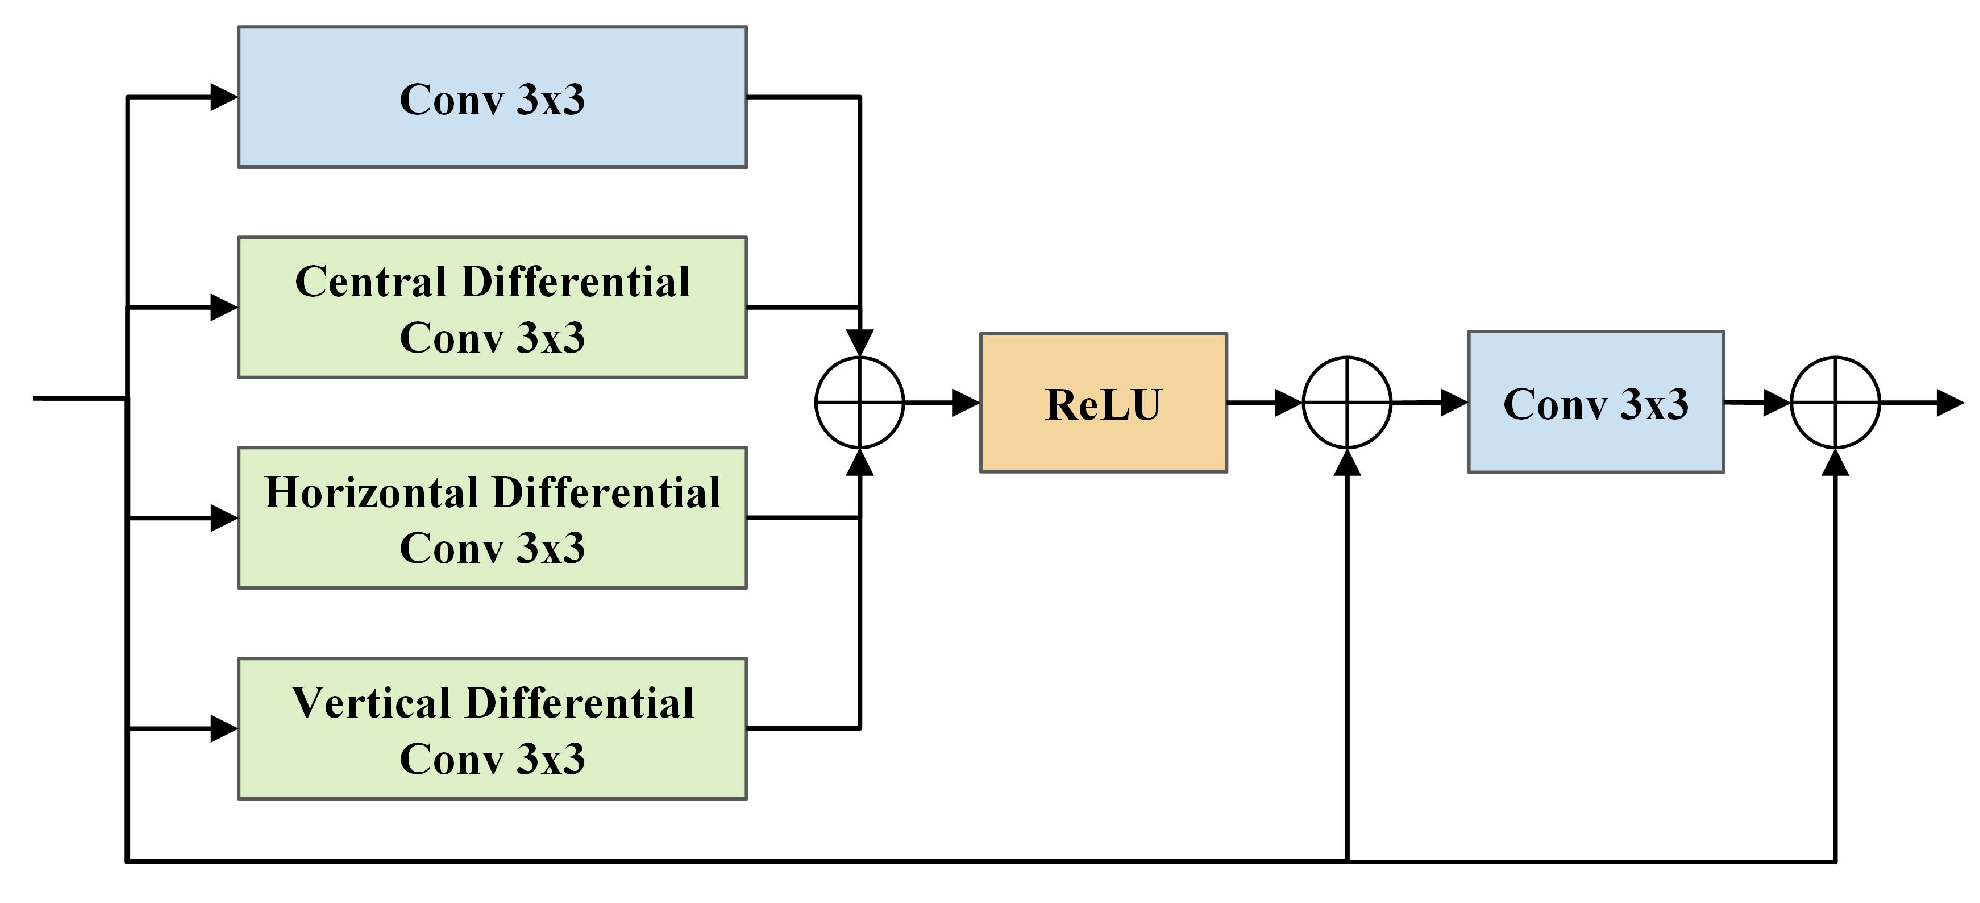
To further enhance the extraction of edge-related texture details and contour information critical for structural representations, a hybrid differential block (HDBlock) is utilized. As illustrated in
Figure 5, the HDBlock consists of four parallel convolution branches, including one vanilla convolution and three differential convolutions [
34], forming a dual residual structure through skip connections. The differential convolution kernels have similar patterns to traditional local operators like Sobel and Laplace operators but include trainable parameters that can better adapt to scattering feature variation. By integrating directional gradient information with rearranged weights, the HDBlock encodes gradient priors, allowing the model to capture more high-contrast features such as contour and strong scattering information and learn more precise structural representations through backpropagation.
The output of the detail feature extraction stage undergoes transformation through concatenation, followed by a 1 × 1 convolution, producing a refined detail feature map that integrates low-level contextual and contour information. To incorporate enriched features into the feature pyramid, the detail feature map is progressively downsampled using 3 × 3 convolutions and fused with FPN features at each level via element-wise addition, as shown in
Figure 6.
The supplement process results in multi-level features enriched with supplementary detail information. By enhancing the perception of contexts and capturing low-level texture and contour details, the DFS module strengthens feature extraction and representation, improving the detection of aircraft targets with less distinct scattering characteristics.
3.3. Context-Aware Scattering Feature Enhancement (CAFE) Module
In SAR imagery, aircraft targets often appear as discrete features with weak correlations due to their complex structures and backscattering mechanisms, which limits the effective perception of their overall structure. Moreover, feature extraction through convolutional layers is constrained by the limited receptive field, hindering the perception of structural features within an aircraft target and between targets. Therefore, conducting global contextual exchange and transfer is essential for capturing a more comprehensive representation of the aircraft structure.
In this paper, a context-aware scattering feature enhancement (CAFE) module is proposed, which conducts global scattering information transmission, aggregation, and guidance to improve the saliency of targets. Specifically, CAFE captures global dependencies within strong scattering regions and transfers them by constructing and leveraging the affinity relationships between local strong scattering regions, guiding the network to focus more on strong scattering regions and the correlations between them. This enhances the structural integrity and feature consistency of aircraft targets, improving detection accuracy while suppressing background interference. The design of the CAFE module is shown in
Figure 7. It contains three stages, including local feature extraction, global context-aware aggregation, and scattering feature reallocation. Next, we provide a detailed introduction to the CAFE module.
3.3.1. Pre-Processing: Extraction of Feature Scattering Centers
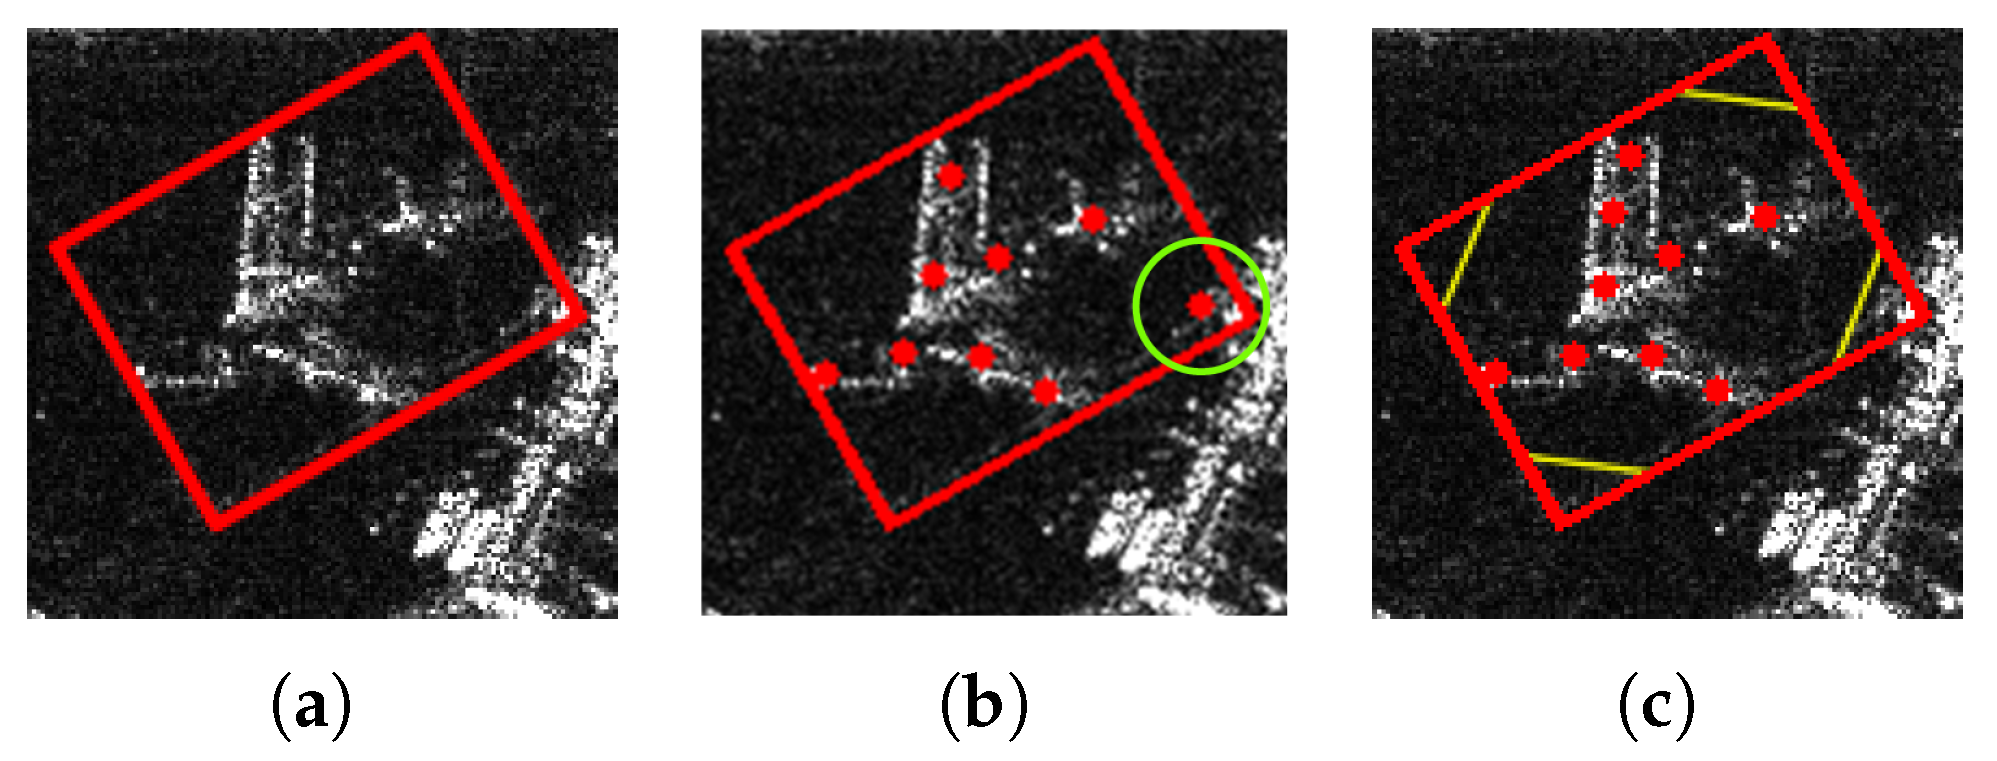
To identify strong scattering regions that correspond to critical structural components of aircraft, such as the nose, wings, fuselage, and tail, we first extract feature scattering centers (FSCs) from aircraft targets in SAR imagery following a manner similar to that described in [
28]. As shown in
Figure 8, a 5 × 5 mean filter is first applied to smooth images and reduce speckle noise. Then, Harris [
35] and Canny [
36] detectors are employed to extract corners and edges within ground-truth bounding boxes, focusing on strong scattering regions while suppressing non-target interference. The extracted features with local peak values are then clustered, with cluster centroids serving as ground-truth FSCs, which represent strong scattering regions and are utilized as supervision and guidance information in subsequent stages.
Additionally, to alleviate the interference of noisy targets near the corners of bounding boxes, we perform an erosion operation, as depicted in
Figure 9, which applies mask to each bounding box that removes the corner regions, prompting a shift in the clustering arrangement and making the distribution more aligned with the true shape of the aircraft.
3.3.2. Local Feature Extraction
To effectively capture and extract discriminative features from key regions associated with the target, we designed a feature fusion structure based on FSCs to aggregate contextual features around them. To retain trainable parameters, we first predict FSCs from feature maps. For each feature level, multiple layers of 3 × 3 convolutions are employed to further extract features, followed by another 3 × 3 convolution to generate predicted FSC heat maps. Thresholding is then performed on the heat maps to obtain FSC coordinate predictions, which are then utilized as location guidance to extract local descriptors and encode spatial information for feature assignment and aggregation.
To integrate the scattering features in the vicinity of the predicted FSCs, we then employ a soft assignment-based extraction method to construct local feature descriptors. For a feature map,
, where
H and
W are the height and width of the original input image, respectively;
s is the downsampling stride at each level; and
represents the feature vector at the location
of
X. Then, based on N FSCs, corresponding features (
) can be extracted from the feature map (
X), and each vector (
) is the feature vector at the location of the
i-th FSC. With each FSC serving as the center of aggregation, for a point located at a distance of
from the center, a soft assignment function (
) is applied to compute the weight based on distance, where
Here,
is used as a scaling factor, which governs the weight decay, varying with the distance. Then, the differences between the neighbor features and the center feature are calculated to capture the local information around FSCs, resulting in local descriptors:
where
is the corresponding coordinate of the
k-th FSC on the feature map (
X) and
is the coordinate of each point in the FSC neighborhood. The assignment coefficients are calculated by a softmax scheme:
The collection of local descriptors () can be considered as a representation for local strong scattering regions across the whole image, capturing essential structural and scattering properties of the target.
3.3.3. Global Context-Aware Aggregation
To exchange contextual information across local strong scattering regions and refine target representations for a more comprehensive perception of aircraft target structure, a relation modeling mechanism is applied to globally aggregate and propagate contextual features based on the affinity between local descriptors [
37]. Specifically, the FSCs are treated as reference nodes for relation modeling, forming a set (
) to represent local contextual information for strong scattering regions. Here, set
V is constructed on local descriptors
and incorporates position embeddings as additional spatial information. We utilize linear layers to transform predicted FSC coordinates (
) into a higher dimensional space, resulting in position embeddings (
) that can be formulated as
where
represents the coordinates of the
N FSCs;
W and
are weight matrices;
b is the bias vector; and
is an activation function, such as ReLU. Then, the reference node descriptor (
V) can be written as
with each node having the following local term:
To transfer and integrate the global contextual information between local features, inspired by [
38], we employ a relevance function (
) to model the relation between reference nodes by measuring the affinity scores between them. Here, the relevance between two nodes can be defined directly as follows:
Then, the context term for each node is generated based on its relevance to other nodes:
By collecting all context terms, the global context map is formed as
. Then, the context map (
C) is updated to
by incorporating context-aware information transfer across different reference nodes:
Here, , where represents the adjacency matrix with added self-connections, is the identity matrix, and D is the diagonal degree matrix indicating the number of connections each node has with others.
Following relation modeling and global aggregation of local contextual information, the final represents the new terms at FSC locations with fused features from strong scattering regions across the whole image. To enhance the origin feature map with the aggregated FSC features, the fused representation () is added back to the corresponding positions of input feature X, obtaining the enhanced feature representation , which enhances representation for target structures.
3.3.4. Scattering Feature Reallocation
To guide the network to focus on critical scattering regions, we employ an attention mechanism to reallocate features from the enhanced feature (
). By adaptively weighting the contribution of each feature, this process emphasizes key areas, suppresses irrelevant information, and facilitates more precise feature representation for improved detection performance. Here, we integrate the fused feature and the convolutional block attention module [
39] (CBAM) to enhance global feature maps. CBAM sequentially applies channel and spatial attention to focus on informative regions. The channel attention module identifies the most relevant channels by global average pooling and global max pooling to capture global channel information, followed by a shared, fully connected layer to generate attention weights to reallocate channel features. Then, the spatial attention module analyzes the spatial distribution of the feature map to locate the most relevant regions, generating a spatial attention map using information from the channel dimension and helping the network focus on important local regions while suppressing irrelevant background noise.
With efficient utilization of feature scattering center information for feature transmission and reallocation, the reallocated feature maps are enhanced with spatial and contextual information. The reallocated feature maps are then forwarded to the detection head for final predictions.
By performing relation modeling and global aggregation of local strong scattering features across the entire image, the CAFE module establishes associations between key features and directs the framework to focus on critical scattering regions. It captures dependencies among strong scattering areas, producing more discriminative features for aircraft targets, enhancing the structural integrity and feature consistency, and improving detection accuracy while effectively suppressing background interference.
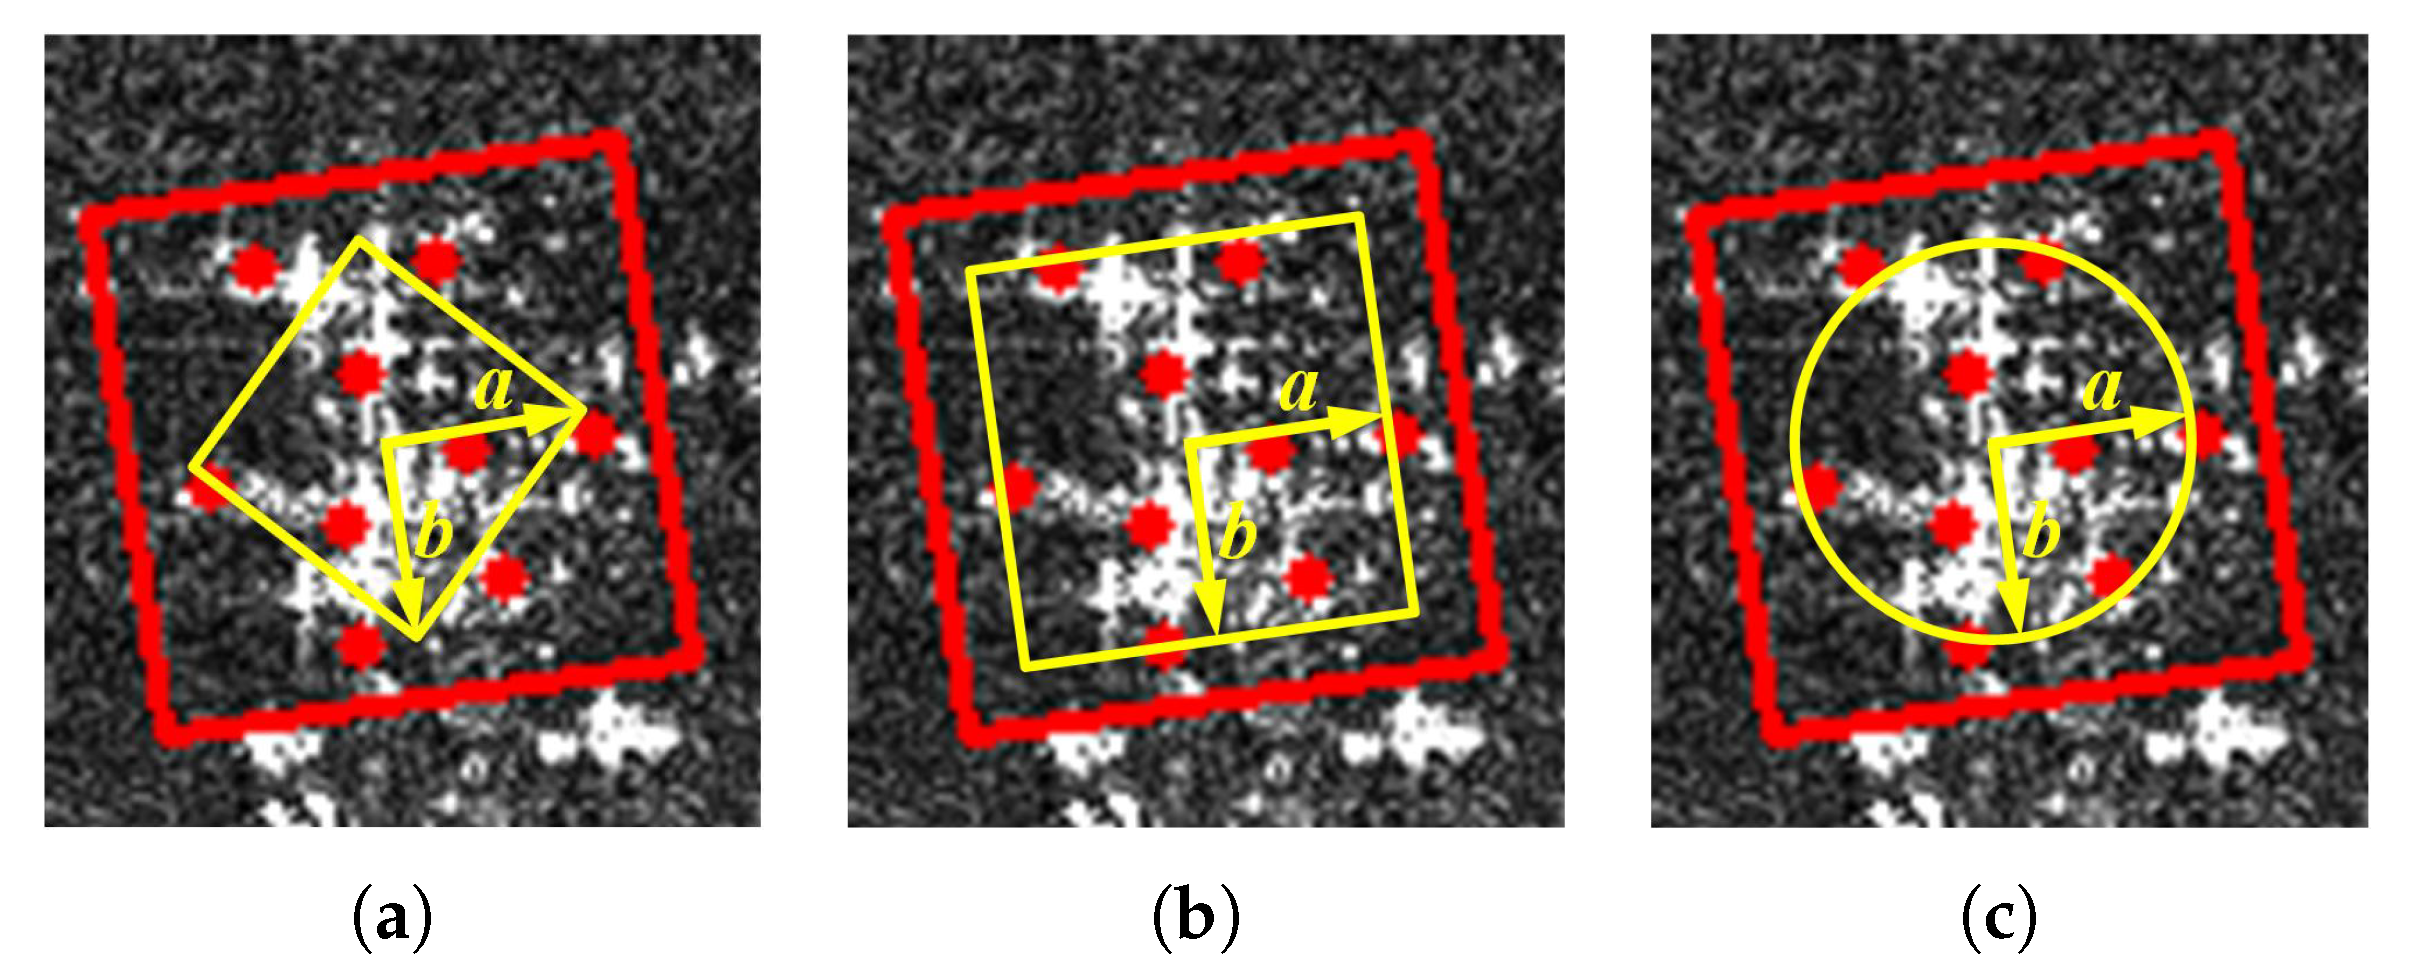
3.4. Feature Scattering Center-Based Label Assignment (FLA) Strategy
Aircraft targets in SAR images exhibit complex structural characteristics, which may lead to misdetections, as many points within bounding boxes potentially do not contain actual aircraft targets (
Figure 10a). The center sampling strategy in FCOS seeks to address this issue by assigning positive labels only for a smaller region around the center of the bounding box to reduce the noisy background points (
Figure 10b). However, the components of aircraft, such as the nose, wings, and tail, are often located away from the central region of the bounding box. Even within the central region, the proportion of true-positive samples may not necessarily increase, while risking the loss of structural information.
To address the problem and optimize the training process, a label assignment method is proposed based on the extracted feature scattering centers, adjusting the label assignment region dynamically through the position and spatial distribution of ground-truth feature scattering centers.
Specifically, by analyzing the aircraft shapes, as well as the distribution of extracted feature scattering centers, it is found that the geometric structure of an aircraft exhibits symmetry along the fuselage axis, extending primarily along the line connecting the nose and tail, as well as the line corresponding to the wing edges. Additionally, we observe that with a sufficient number of extracted feature scattering centers (e.g., N = 9 in this module), their distribution generally reflects the overall shape and skeletal structure of the aircraft (
Figure 10c). Building on the observations reported above, we assign positive labels within a symmetric region centered at the bounding box, considering the centerness, as well as the potential structural incompleteness during imaging process. Accounting for the shape distribution of the nose, wings, and tail, an elliptical region is chosen as the positive sample area.
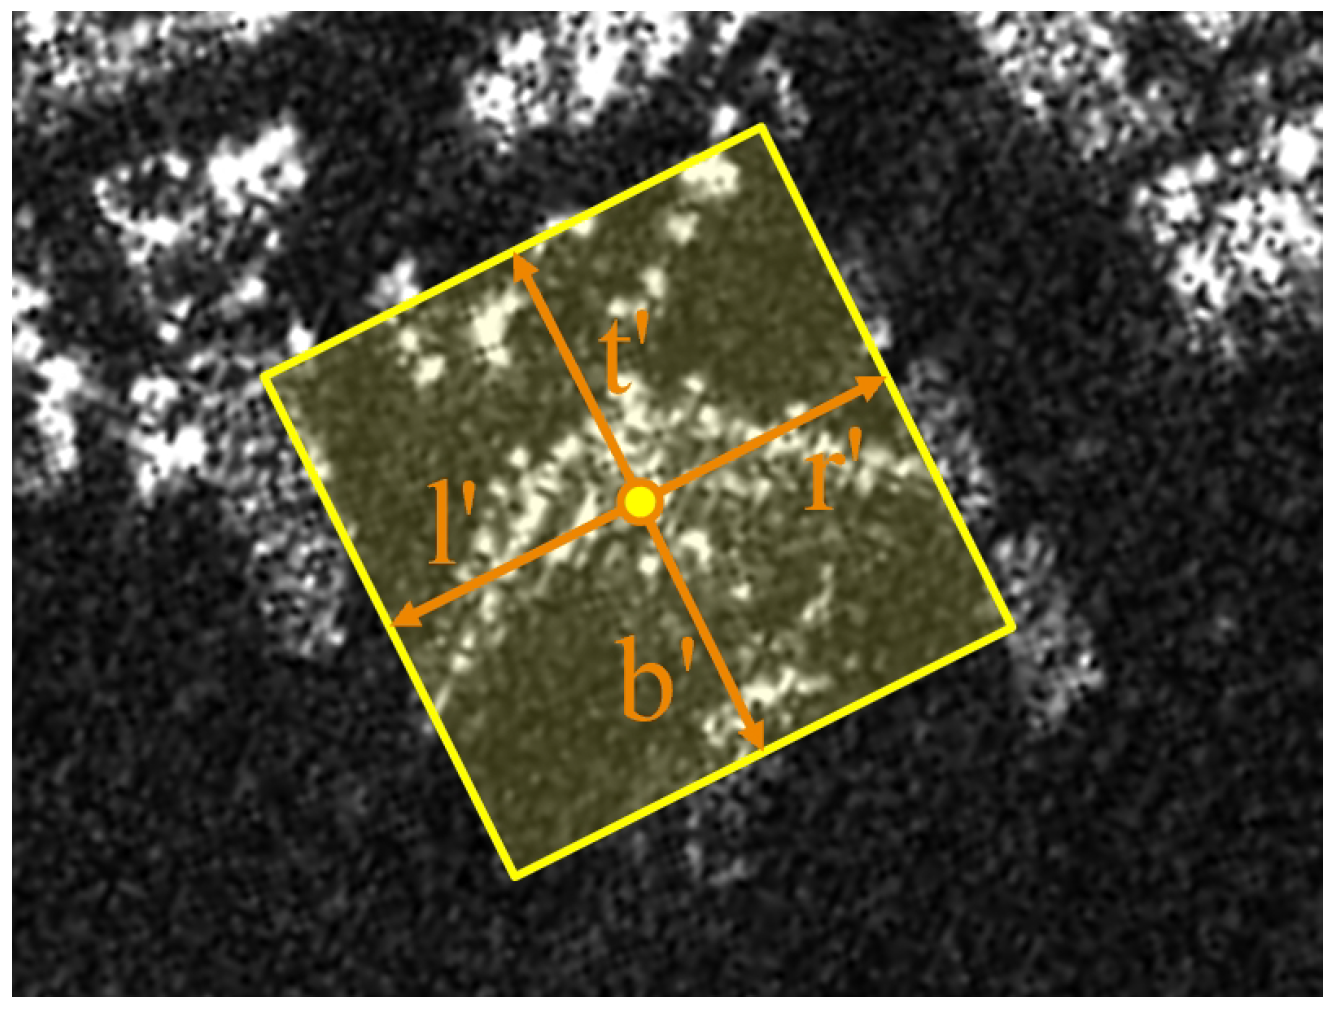
To achieve this, we first construct an oriented coordinate system by utilizing the rotation angle of the bounding box. As shown in
Figure 10d, the center of the bounding box is defined as the origin, and the inclined
x- and
y-axes are determined based on the box rotation angle, parallel to the widthwise and heightwise directions of the box, respectively. This ensures that the coordinate system adapts to the orientation of the bounding box, facilitating more precise feature alignment and representation.
Then
N feature scattering center coordinates in the oriented system can be obtained by calculating the centers’ distances from the origin along the
x- and
y-axes, where the collection can be represented as
Then, the farthest distances along
x-axis and
y-axis can be calculated as
We take
as the guidance of the overall shape and construct an elliptical condition by utilizing
as semi-axis parameters. Then, the positive labels are assigned to the points satisfying the elliptical condition in the oriented system, where
By leveraging the structural and scattering characteristics of aircraft, the FLA strategy aligns the positive sample region with the spatial distribution of feature scattering centers and focuses on critical components. As shown in
Figure 10d, the FLA strategy covers more strong scattering regions corresponding to feature scattering centers. It captures more positive samples while reducing background interference, ensuring that positive regions receive more attention. For complex shapes and diverse poses, FLA selects structurally relevant points, improving sample representativeness and boosting detection performance adaptively.
3.5. Loss Function
Considering the SAR imaging mechanism and the structural complexity of aircraft targets, the critical strong scattering features exhibit discrete characteristics with weak correlations. To improve the perception of strong scattering features and emphasize the model’s attention to critical regions, a dedicated loss term (
) is introduced to enhance the ability to detect the feature scattering centers (FSCs) and ensure that the predicted FSCs align with the ground-truth FSCs. The feature scattering center (FSC) prediction loss (
) is supervised by ground-truth FSCs during training according to the following formula:
where
where
and
are modulating factors. The probability
is predicted by
The total loss function for training optimization is composed of four parts:
where
,
, and
correspond to the classification loss, regression loss, and centerness loss, respectively. The term
equals 1 if
; otherwise, it is 0. Here, · represents either
p or
s.
is the number of positive samples, and
corresponds to the number of ground-truth feature scattering centers.
The classification loss (
), which also employs focal loss, can be formulated as follows:
employs GIoU loss to evaluate the overlap between the predicted and the ground-truth bounding boxes.
is the BCE loss used to calculate the confidence of the centerness score. The ground-truth centerness is formulated as
where
is the ground truth for regression target
.
4. Results
This section presents a series of experiments and provides the results to validate the effectiveness of the proposed method. First, we provide an overview of the CSAR-AC dataset and a description of the experimental setup. Then, the metrics employed to evaluate the model’s performance are introduced. Following this, ablation studies are conducted to assess the contributions of the proposed modules. Finally, we compare the performance of the proposed method with that of other classical methods on the CSAR-AC dataset.
4.1. Dataset and Settings
To evaluate the detection performance of the proposed method in oriented aircraft detection, an dataset denoted as CSAR-AC is constructed based on 74 Gaofen-3 (GF-3) satellite images with 1 m resolution. CSAR-AC contains a total of 2866 slices, each measuring 1024 × 1024 pixels, covering a diverse range of aircraft with different structures and sizes in complex scenes at multiple civilian airports, which leads to a challenging detection task. The aircraft targets are labeled with oriented bounding-box (OBB) annotations. In our experiments, the dataset is divided into a training and validation dataset and a test set. The training and validation set has 2462 slices, and the test set comprises 404 slices.
4.2. Implementation Details
All experiments were conducted under consistent settings. The training process was performed on a single NVIDIA 2080 Ti GPU with a batch size of 2. The SGD optimizer was employed with a initial learning rate of 0.001. The momentum was set to 0.9, and the weight decay coefficient was set to 0.0001. A warm-up strategy was utilized to mitigate the instability of the learning rate during early training stages while providing a smooth transition phase for the optimizer.
4.3. Evaluation Metrics
Several commonly used evaluation criteria are employed to evaluate the performance of different methods, including precision, recall, F1 score, average precision (AP), Floating Point Operations (FLOPs), and model parameter size. Precision and recall measure the model’s detection accuracy and ability to capture positive samples, respectively, which can be formulated as follows:
where TP represents true positives, i.e., targets correctly detected as positives; FP represents false positives, i.e., background targets incorrectly detected; and FN represents false negatives, i.e., targets incorrectly missed. Generally, predictions with an IoU greater than 0.5 are considered TP; otherwise, they are considered FP. The F1 score measures the accuracy and completeness by comprehensively evaluating both precision and recall, where
AP is a metric that assesses the overall performance by averaging precision at different recall levels, where
For practical implementation,
is computed in a discrete way. Recall (
R) (from
to
) is divided into N equally spaced levels, and the corresponding precision (
P) for each recall level (
) is defined as the maximum precision at any
:
The
can be obtained by accumulating
P at each recall level (
) under the set IoU threshold:
FLOPs represent the floating-point operations a model executes during forward propagation, commonly used to assess computational complexity. A greater number of FLOPs indicates greater computational demands, while fewer FLOPs suggest reduced storage and processing needs. Model parameters denote the tunable values optimized during training; fewer parameters help minimize storage requirements.
4.4. Ablation Studies
In this section, ablation experiments are conducted on the CSAR-AC dataset to examine the impact of each improved method, maintaining consistent settings to ensure a fair comparison. The DFS, CAFE, and FLA modules are progressively added to the baseline to compare their impacts on detection performance. The overall results are present in
Table 1. As shown in
Table 1, each proposed module or strategy contributes to the final performance enhancement. Compared with baseline, DFS enhances the F1 by 2.88% and AP by 1.82%, CAFE results in a 2.13% improvement in F1 and 1.98% improvement in AP, and FLA boosts F1 and AP by 1.26% and 1.29%, respectively. In total, the SFG-Net outperforms the baseline by 3.3% in AP and 3.2% in F1 score. SFG-Net introduces moderate computational overhead compared to the baseline FCOS. Specifically, the total parameter size increases from 31.89 M to 35.87 M, while the FLOPs increase from 206.20 G to 313.15 G. The added complexity is justified by performance gains in complex SAR scenarios, particularly in suppressing false alarms, with increases of 3.96% in precision and 3.3% in AP.
4.4.1. Effect of DFS
The DFS module is proposed to provide enriched information and strengthen high-level feature representations by expanding the perception of low-level textures and contour details. As shown in
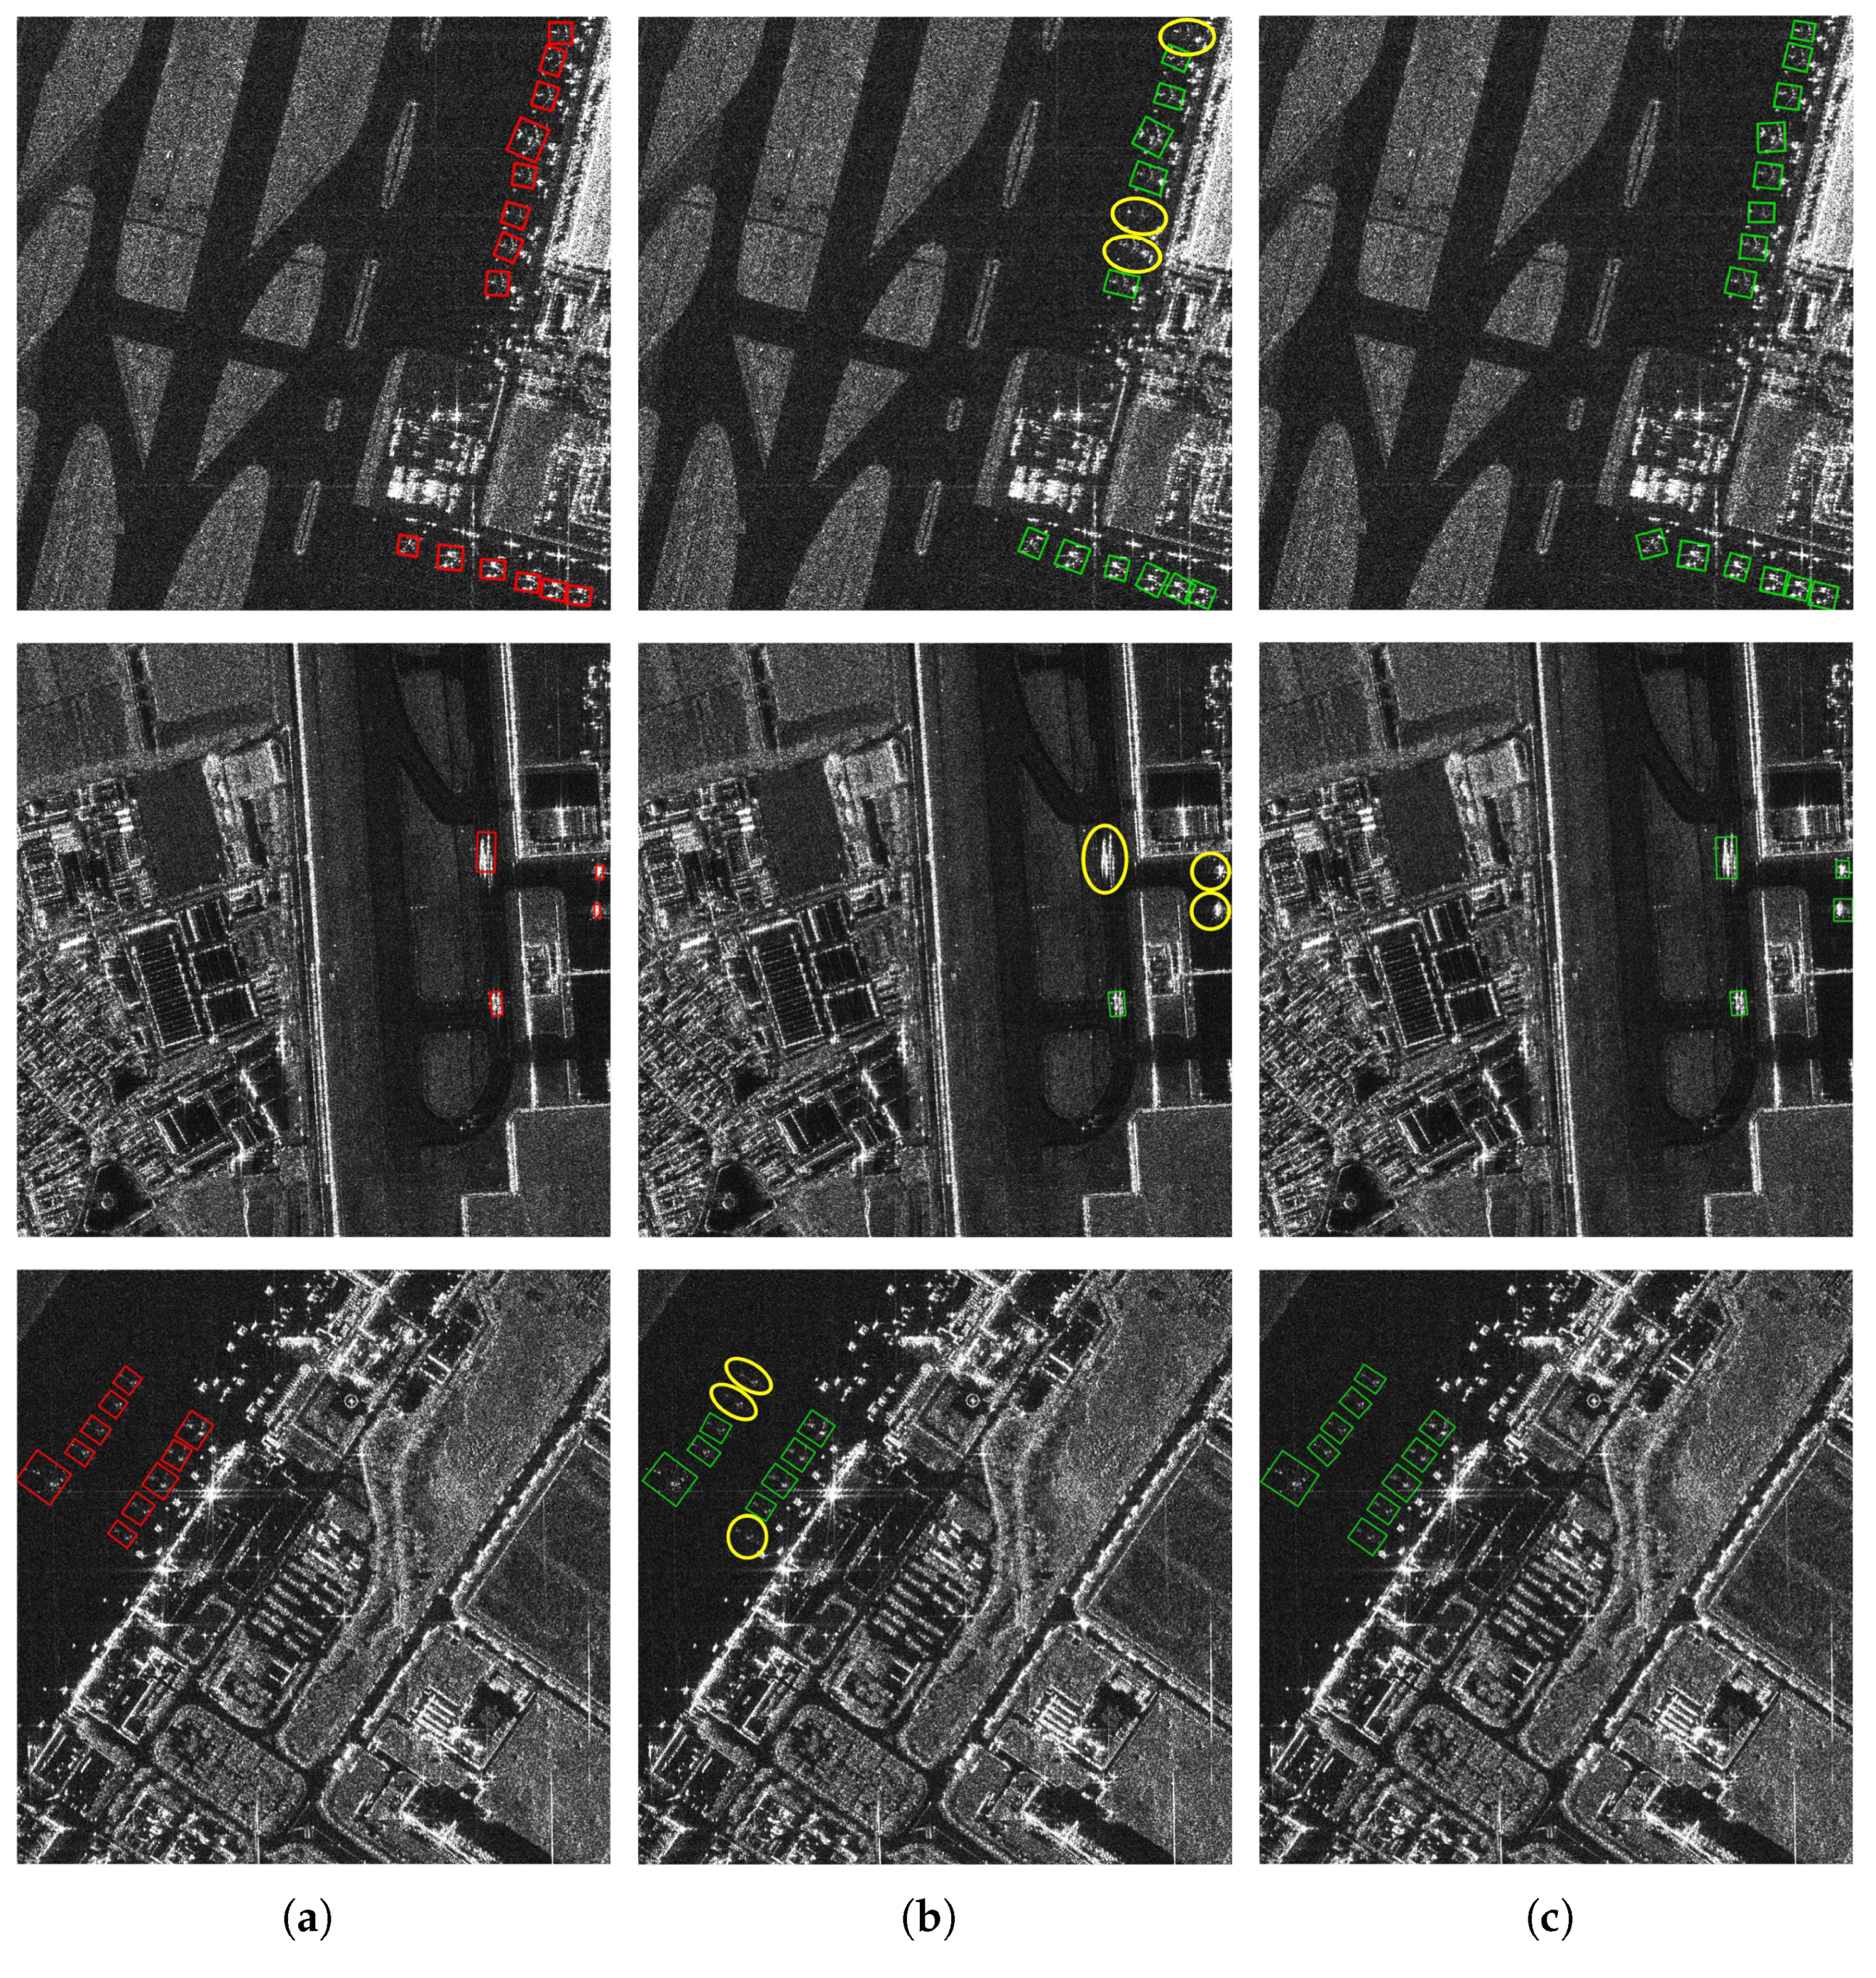
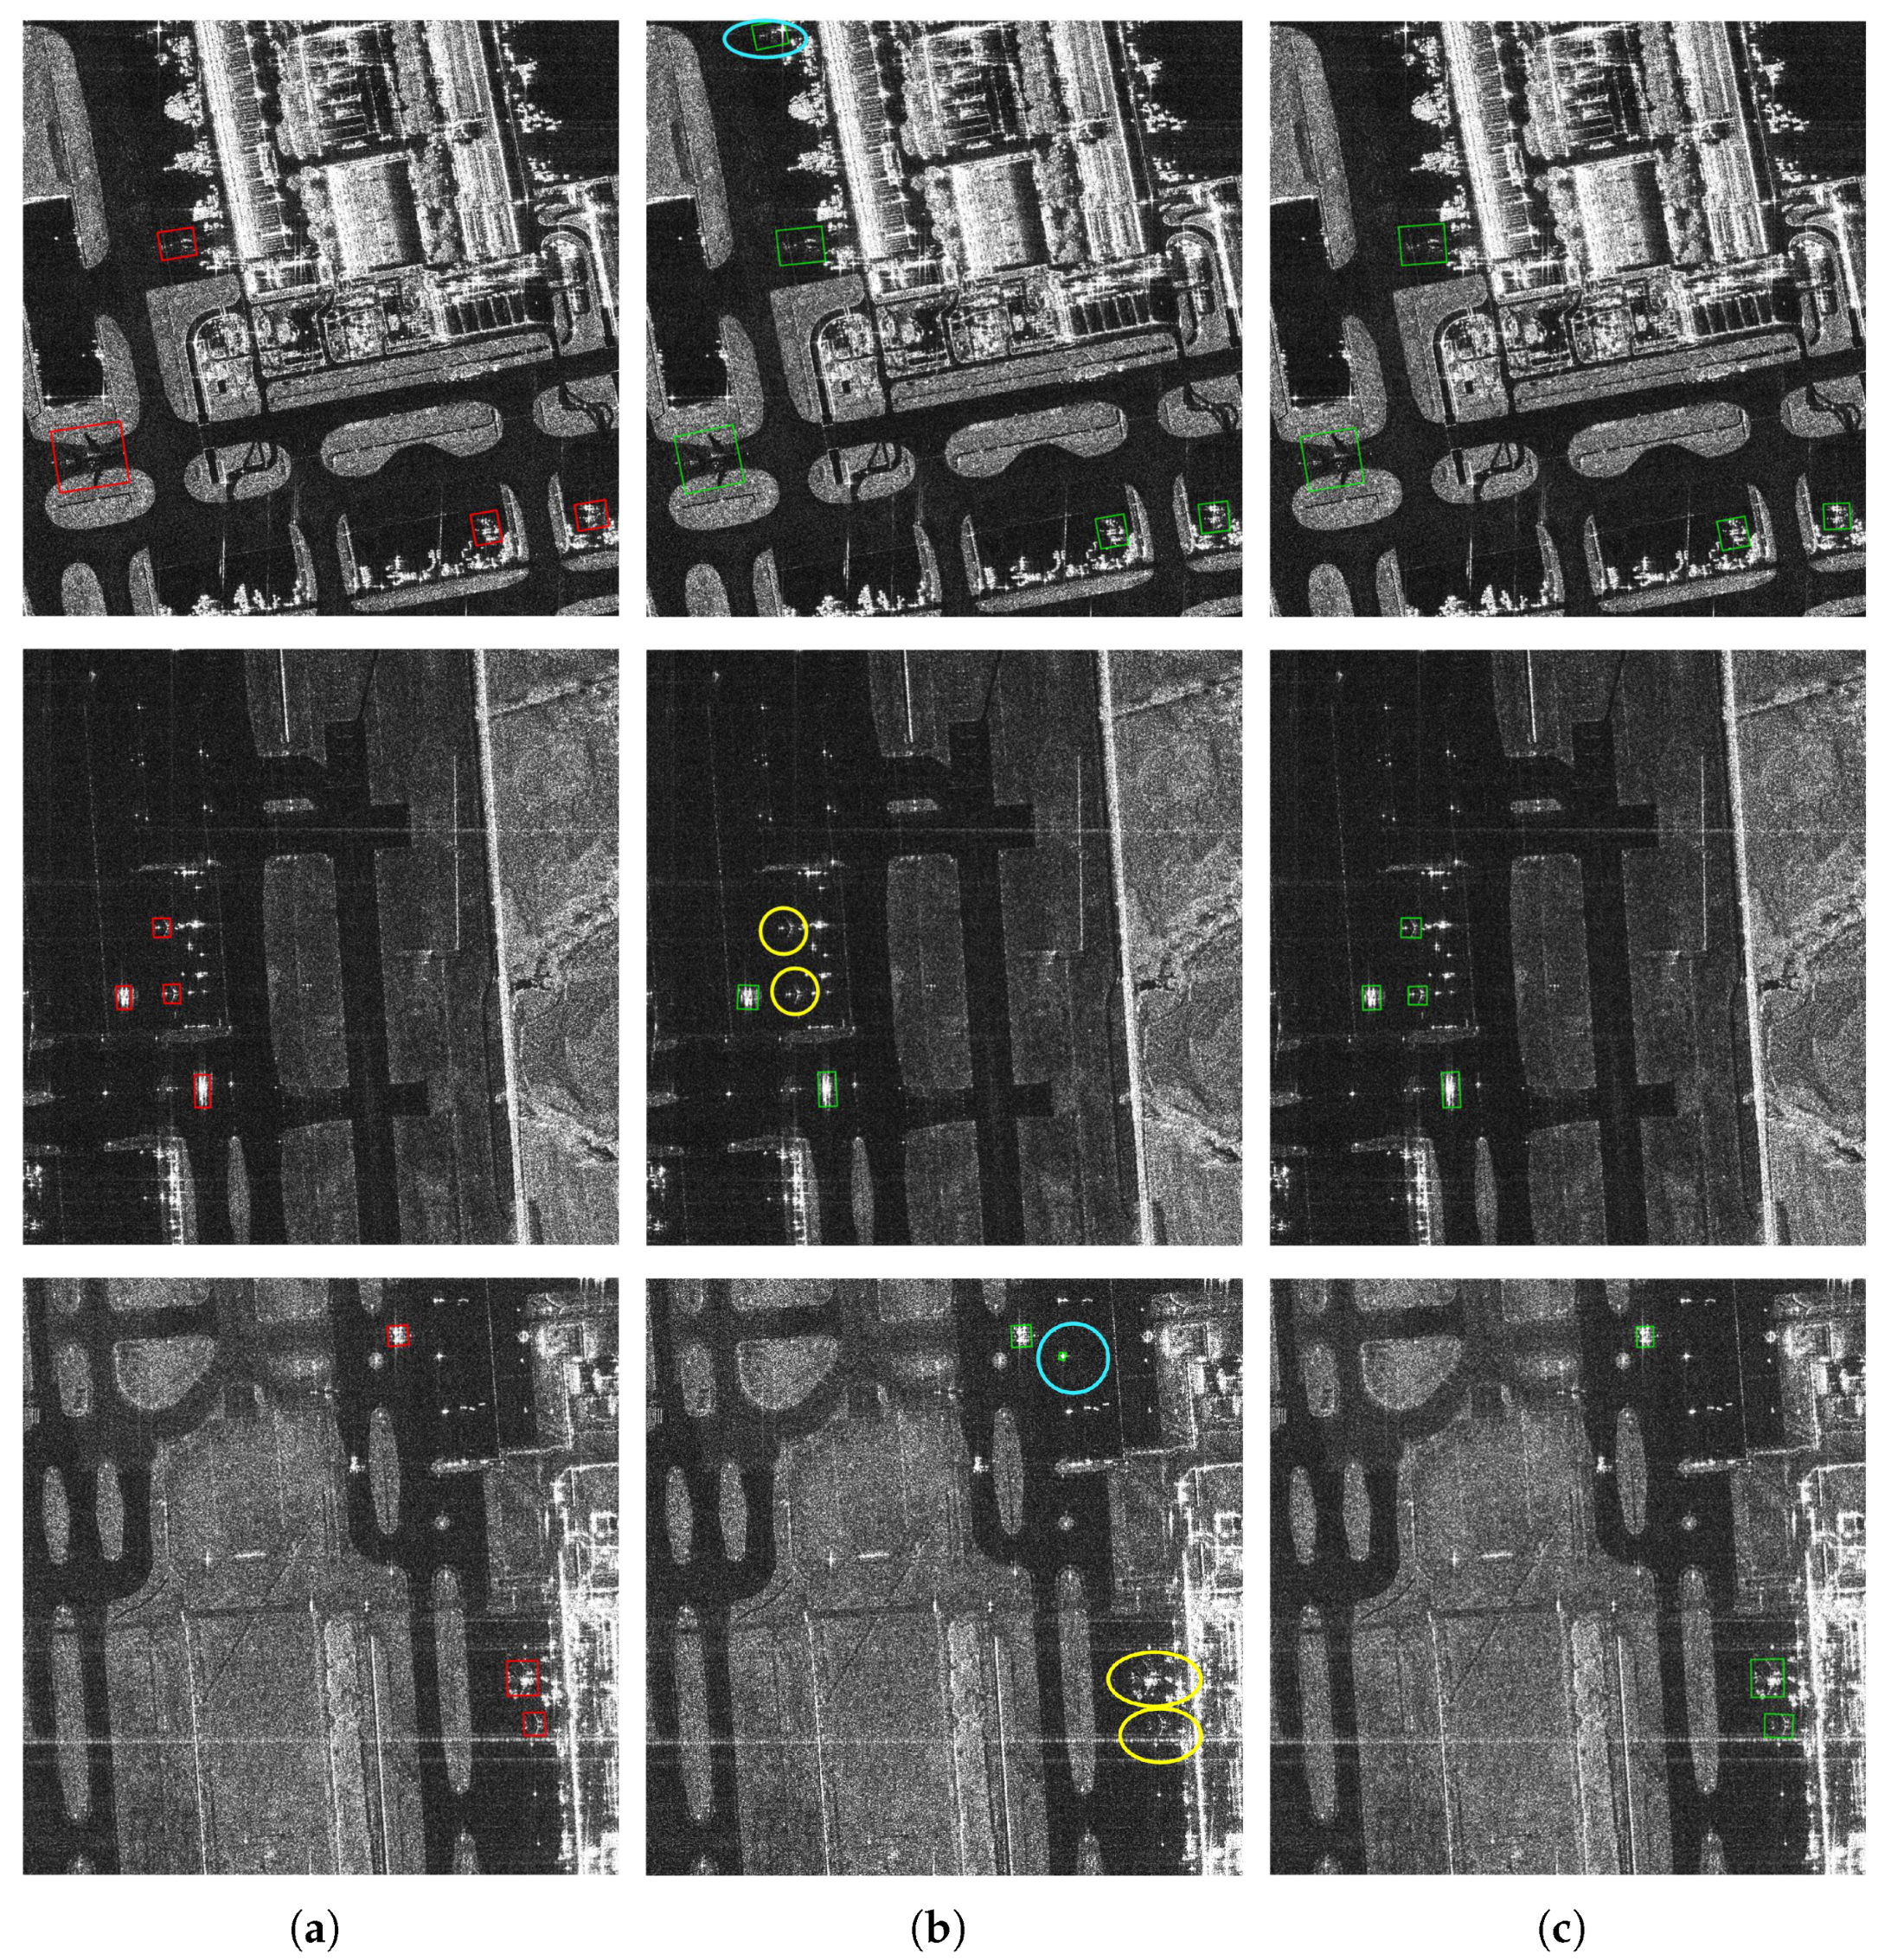
Table 1, the DFS module improves the baseline by 2.88% and 1.82% in terms of F1 and AP, respectively. The results indicate that the DFS module enhances feature representations and improve the model’s ability to detect targets with discrete features and indistinct textures and contours. A visualization of the comparison detection results is depicted in
Figure 11. In
Figure 11b, some indistinct aircraft targets that are are small or have weak scattering intensity fail to be detected by the baseline. The DFS expands the perception of low-level texture and contour information to enhance the extracted feature representations, thereby improving the detection of less prominent targets under complex conditions. Therefore, the baseline with DFS can better address the problems. The detection results presented in
Figure 11c demonstrate that the DFS effectively highlights less distinct targets and decreases missed detections by providing more contexts and enhanced contours and textures as a supplement to generate enriched representations with more details.
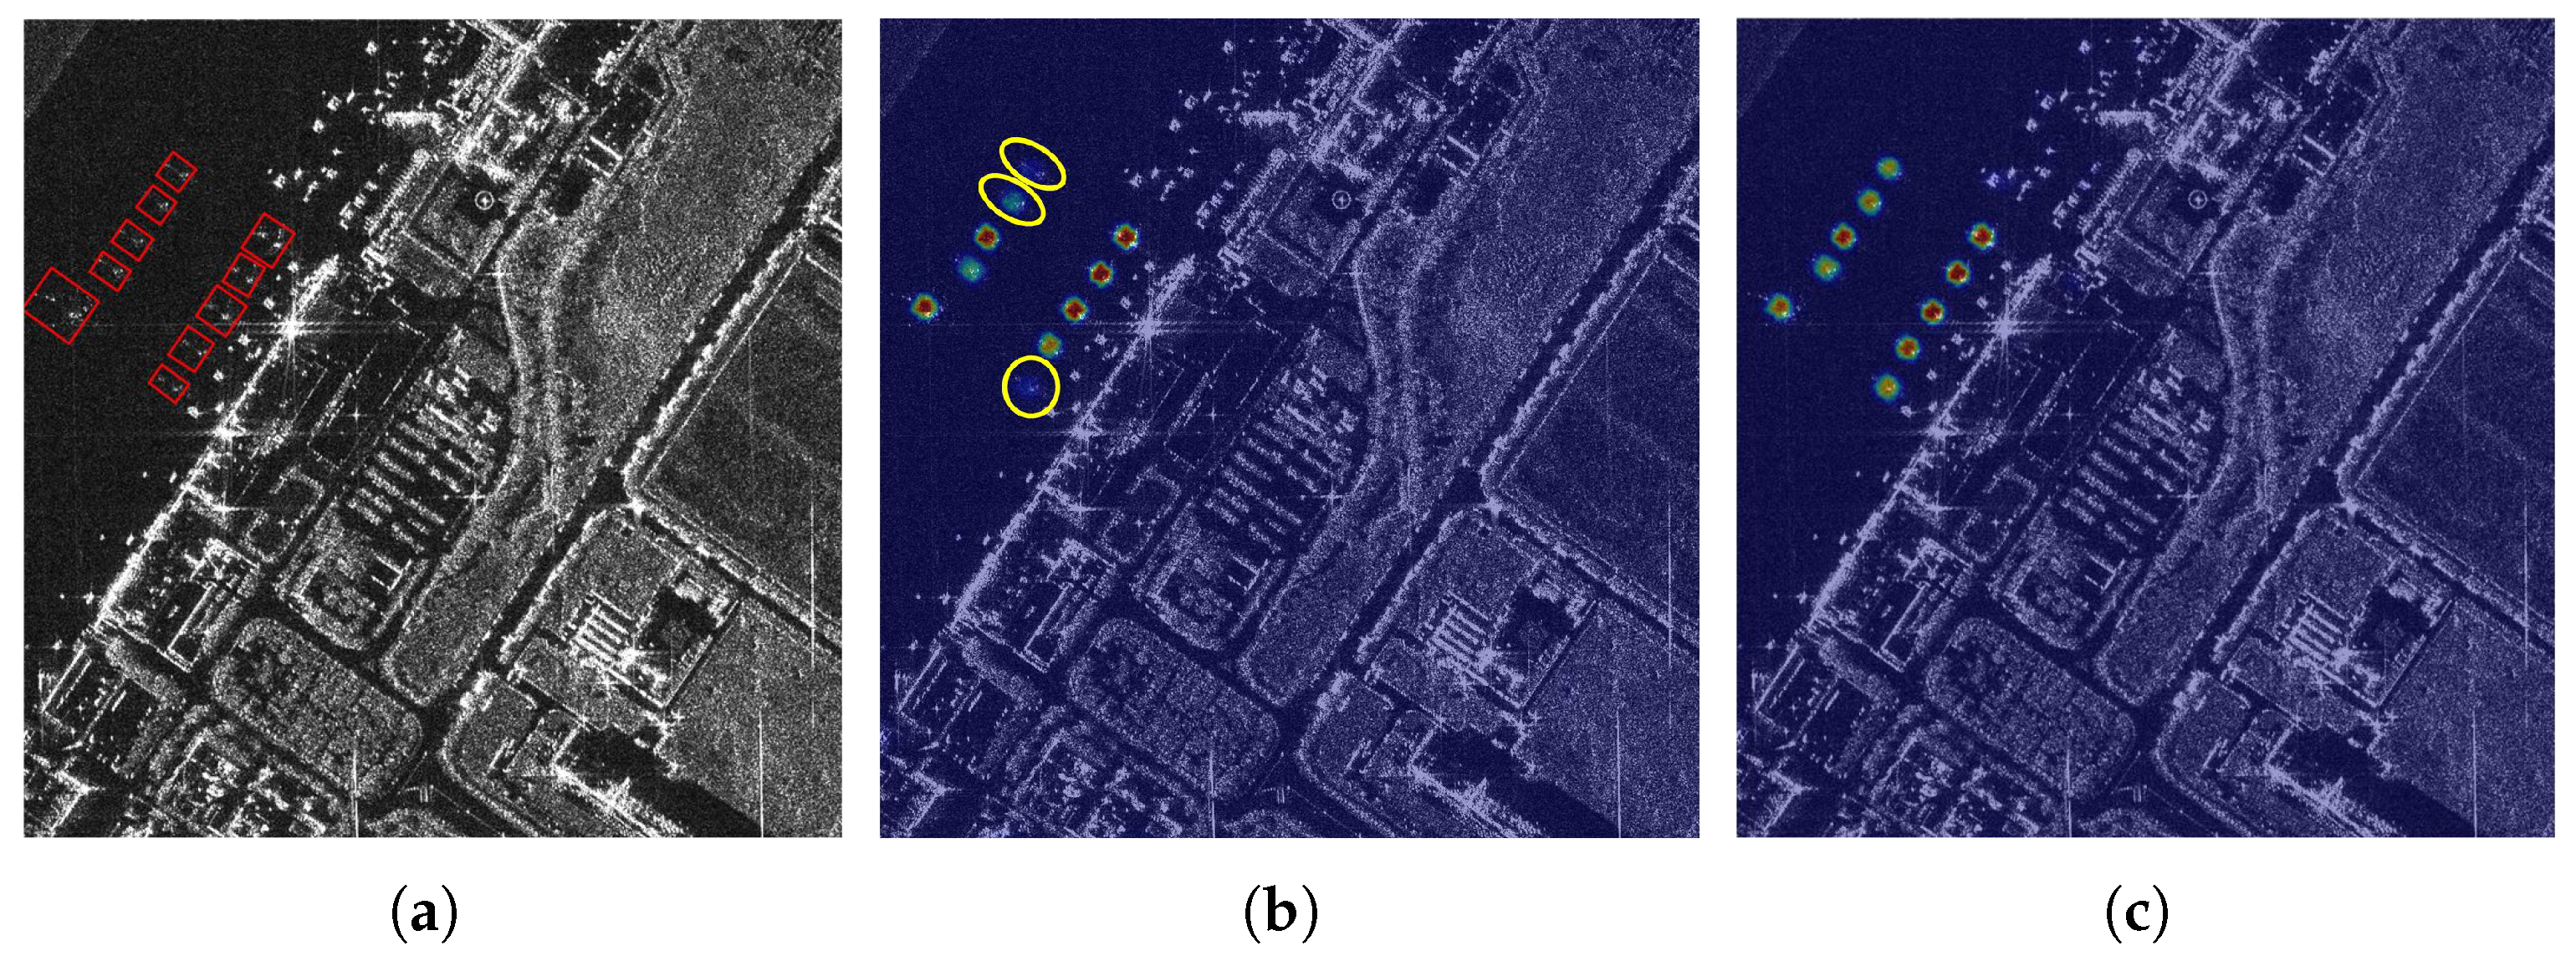
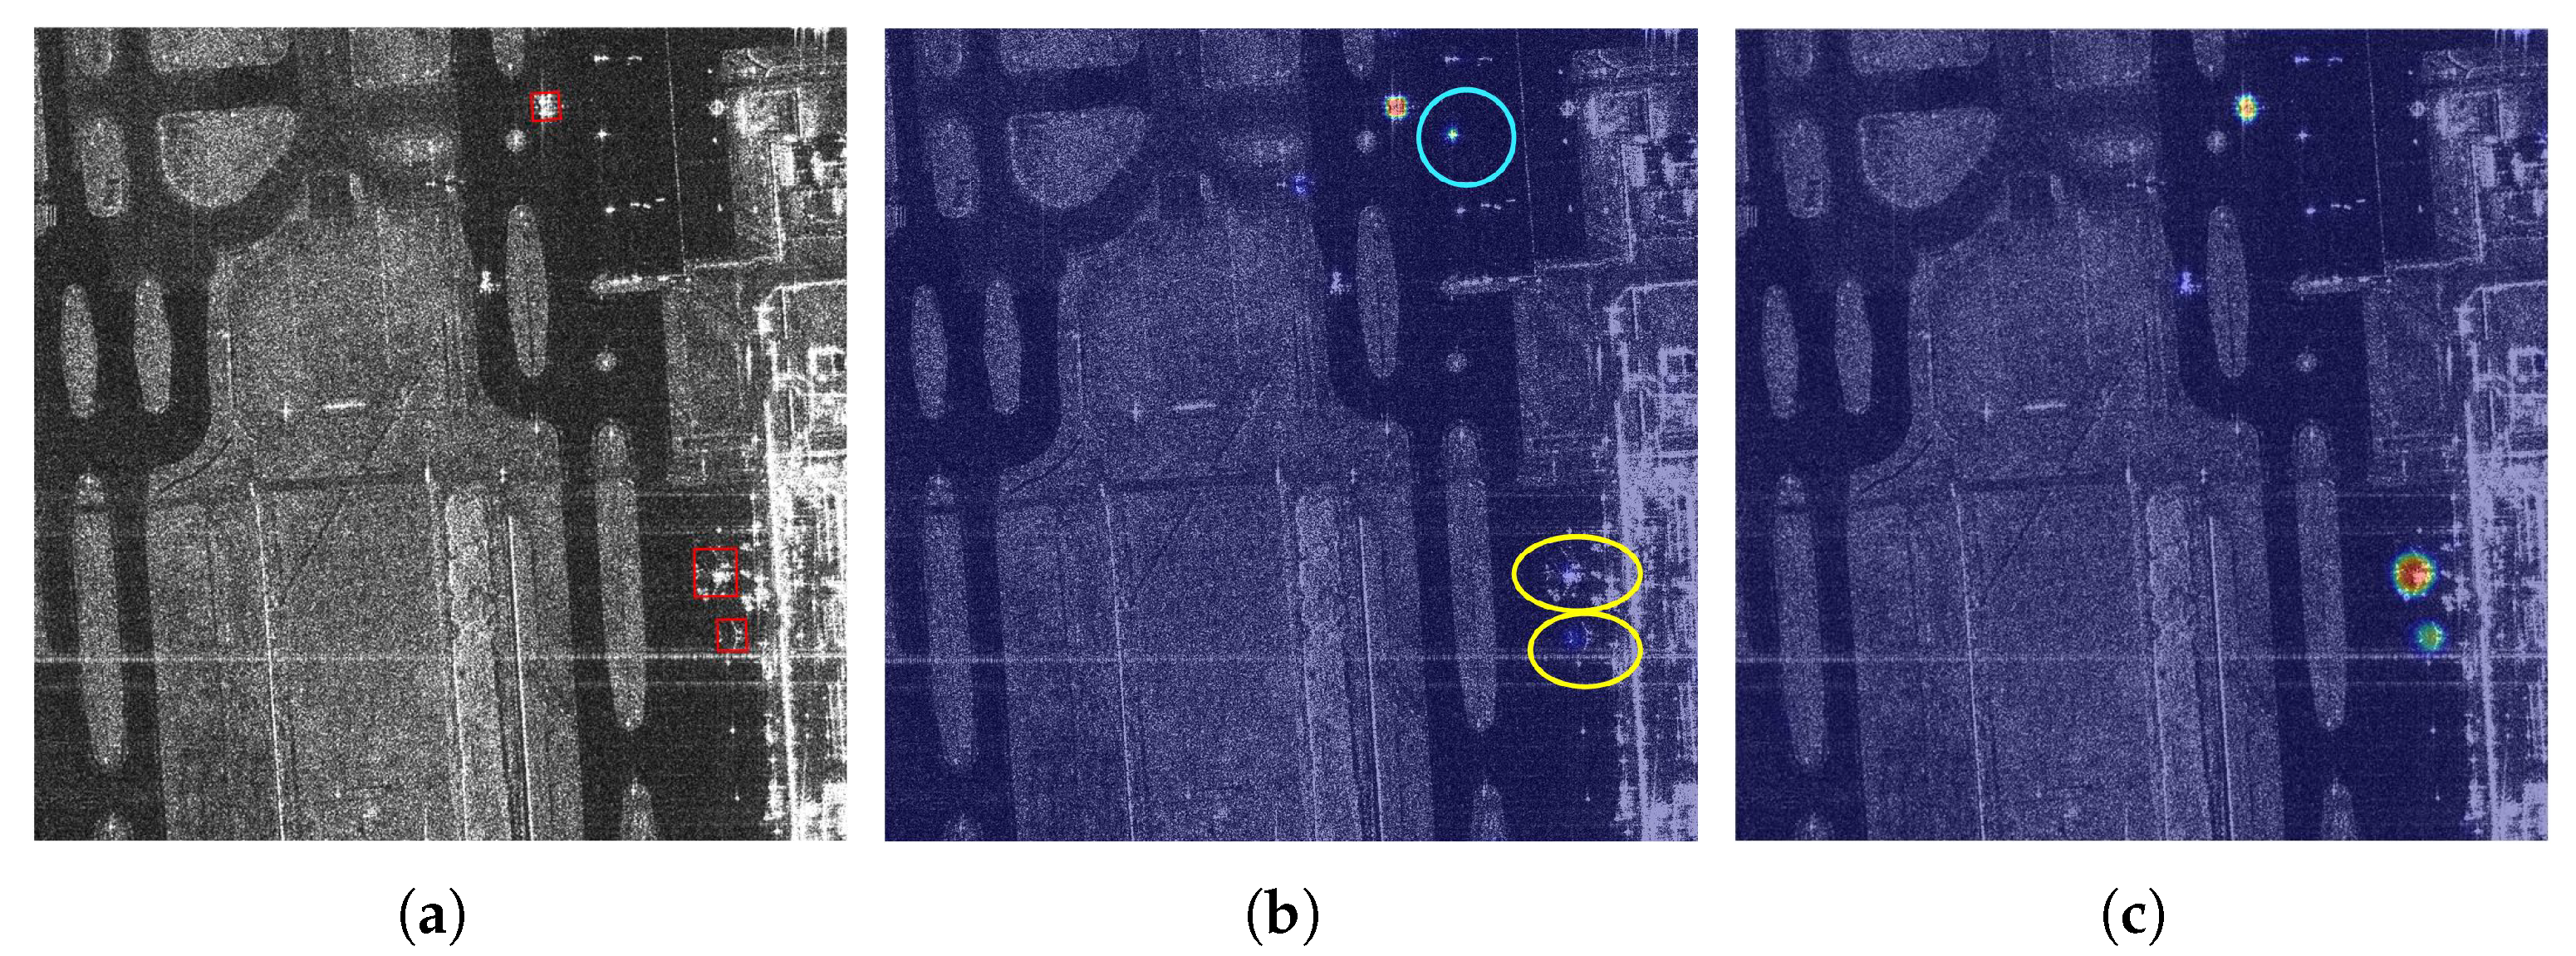
To better demonstrate the effectiveness of the DFS module,
Figure 12 illustrates the visualization results of classification heat maps generated by the original baseline method and the baseline equipped with the DFS module. As shown in
Figure 12b, some small targets were missed by the baseline model due to their small sizes. To alleviate this issue, we incorporate the DFS with the baseline.
Figure 12c illustrates that small targets have higher scores under the baseline method with DFS. Moreover, it can be seen that targets with similar patterns can be extracted more precisely due to the supplementation of detailed scattering information, which is beneficial for the detection of less prominent targets.
4.4.2. Effect of CAFE
The CAFE module is introduced to tackle the problem of discrete features and incomplete structural representations by conducting context-aware global information transfer, aggregation, and guidance.
Table 1 shows that the CAFE module boosts the F1 score and AP by 2.13% and 1.98%, respectively.
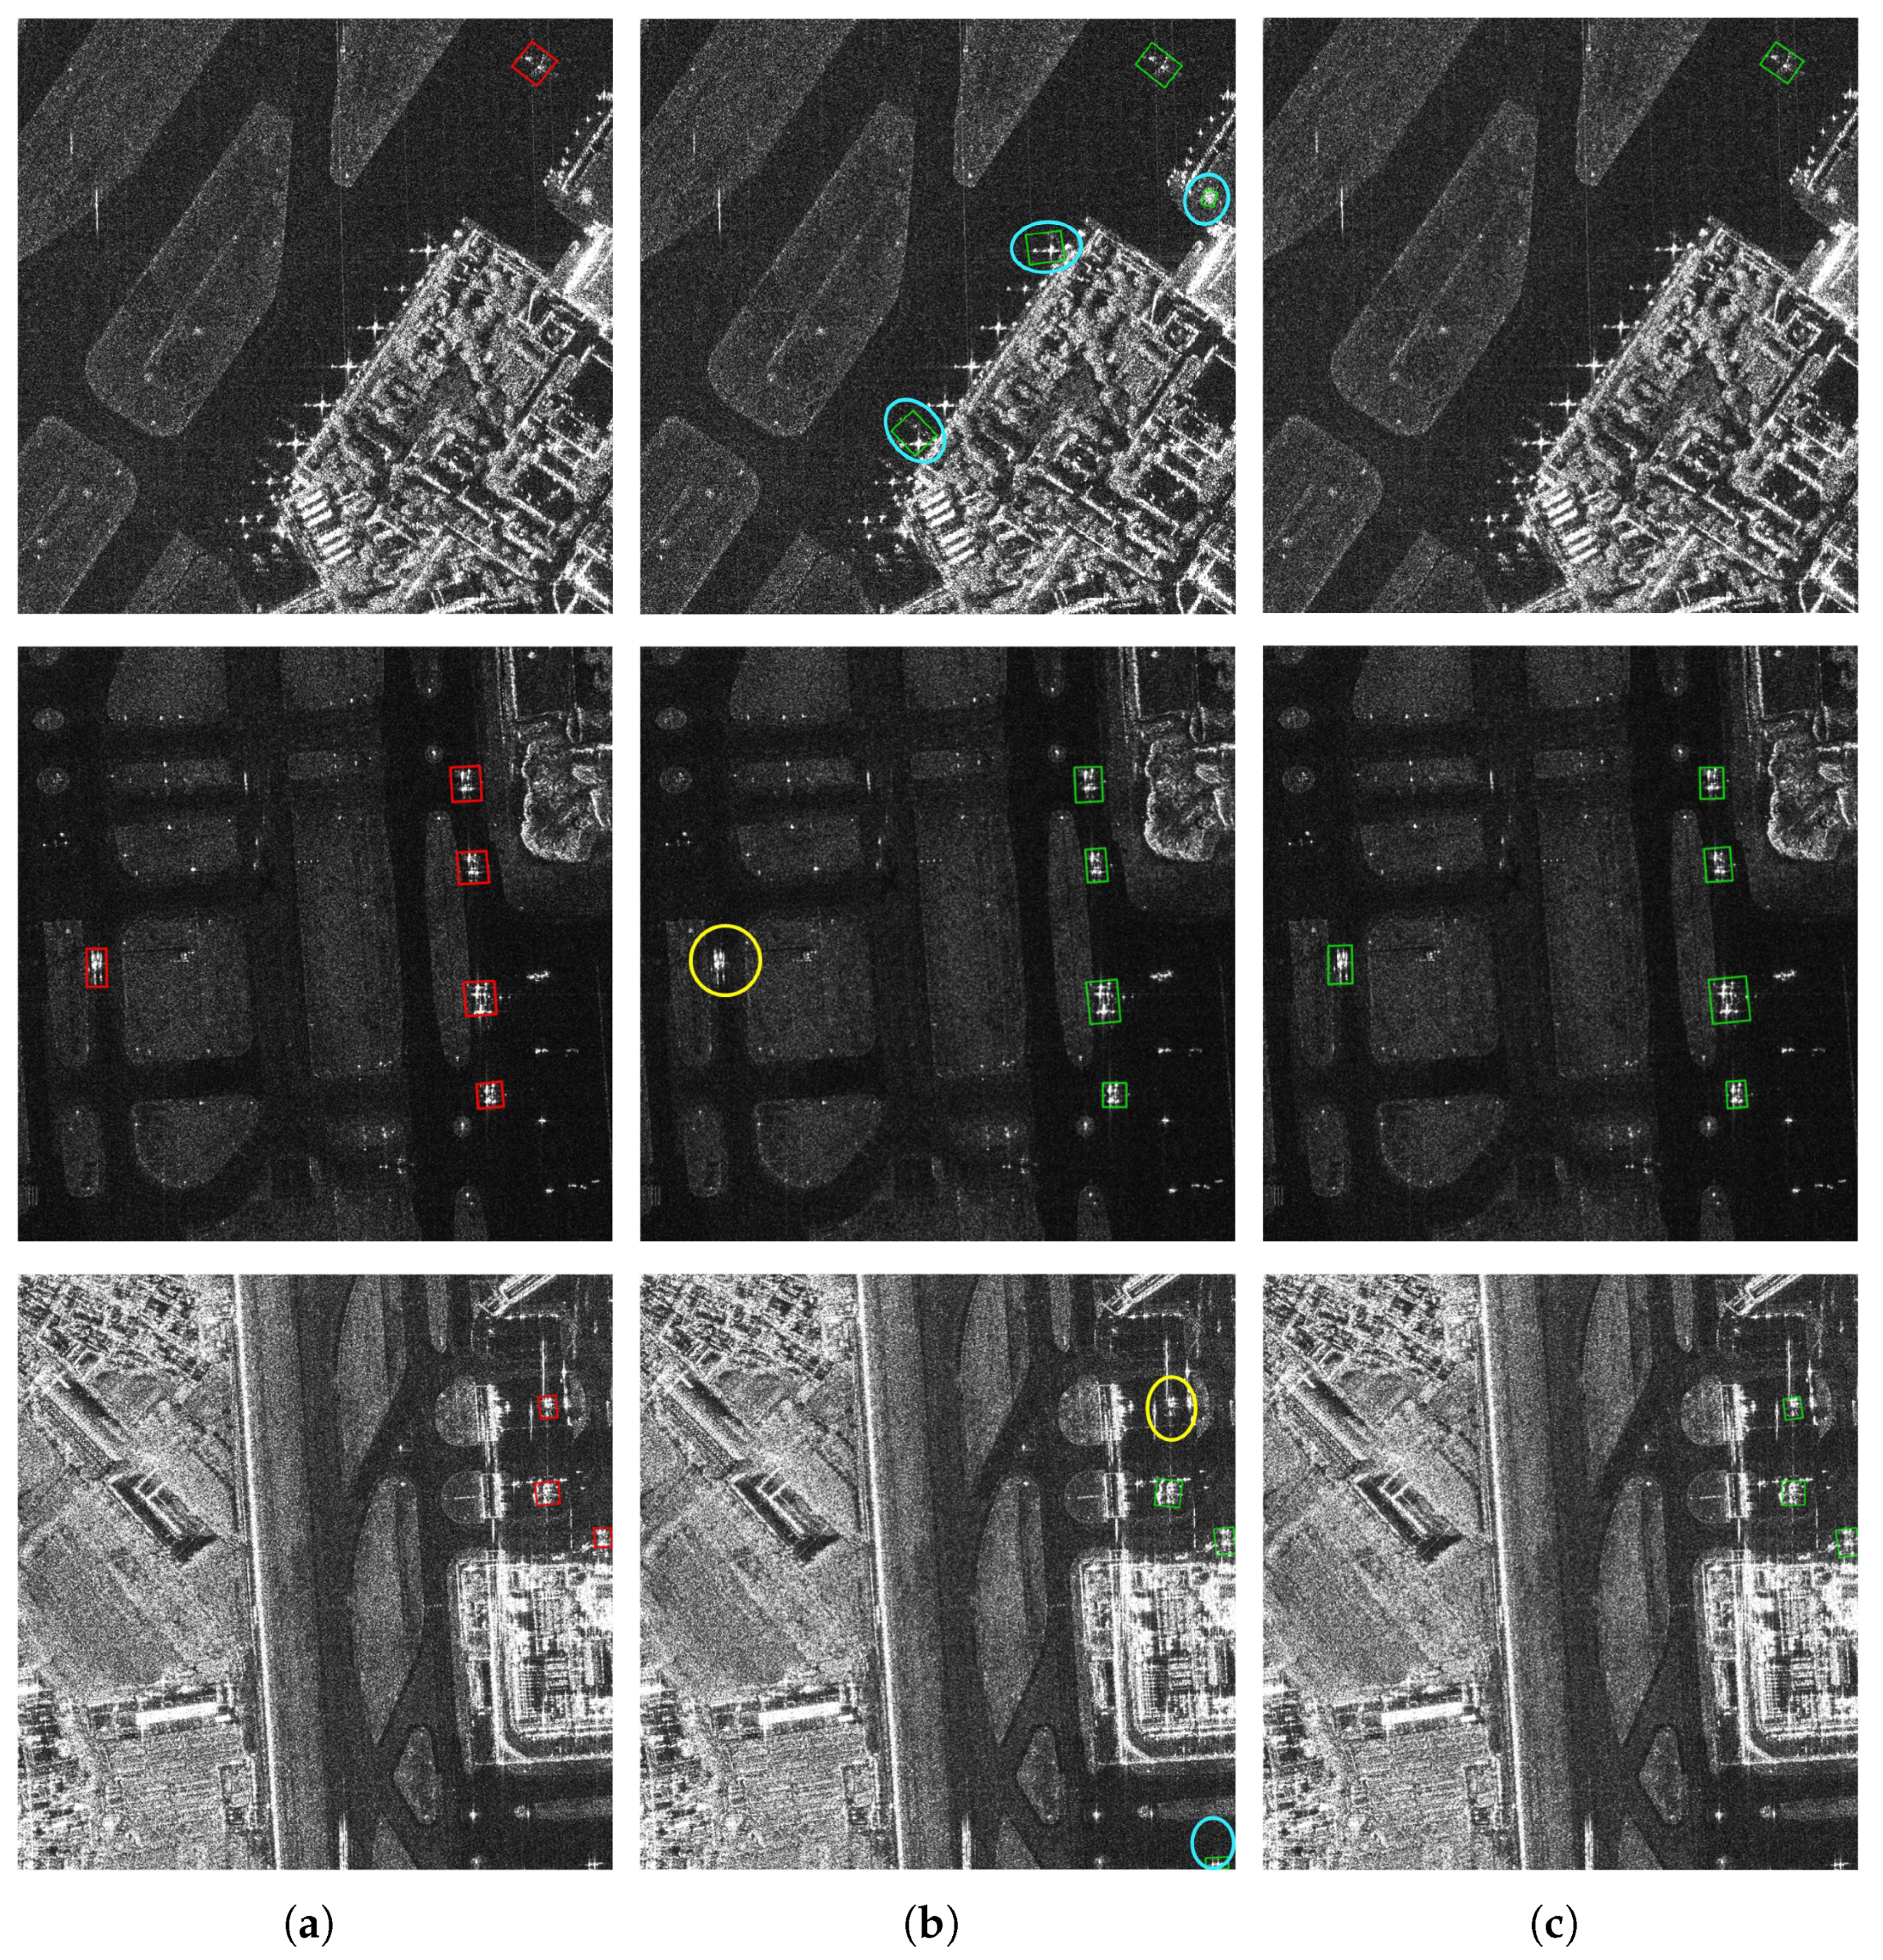
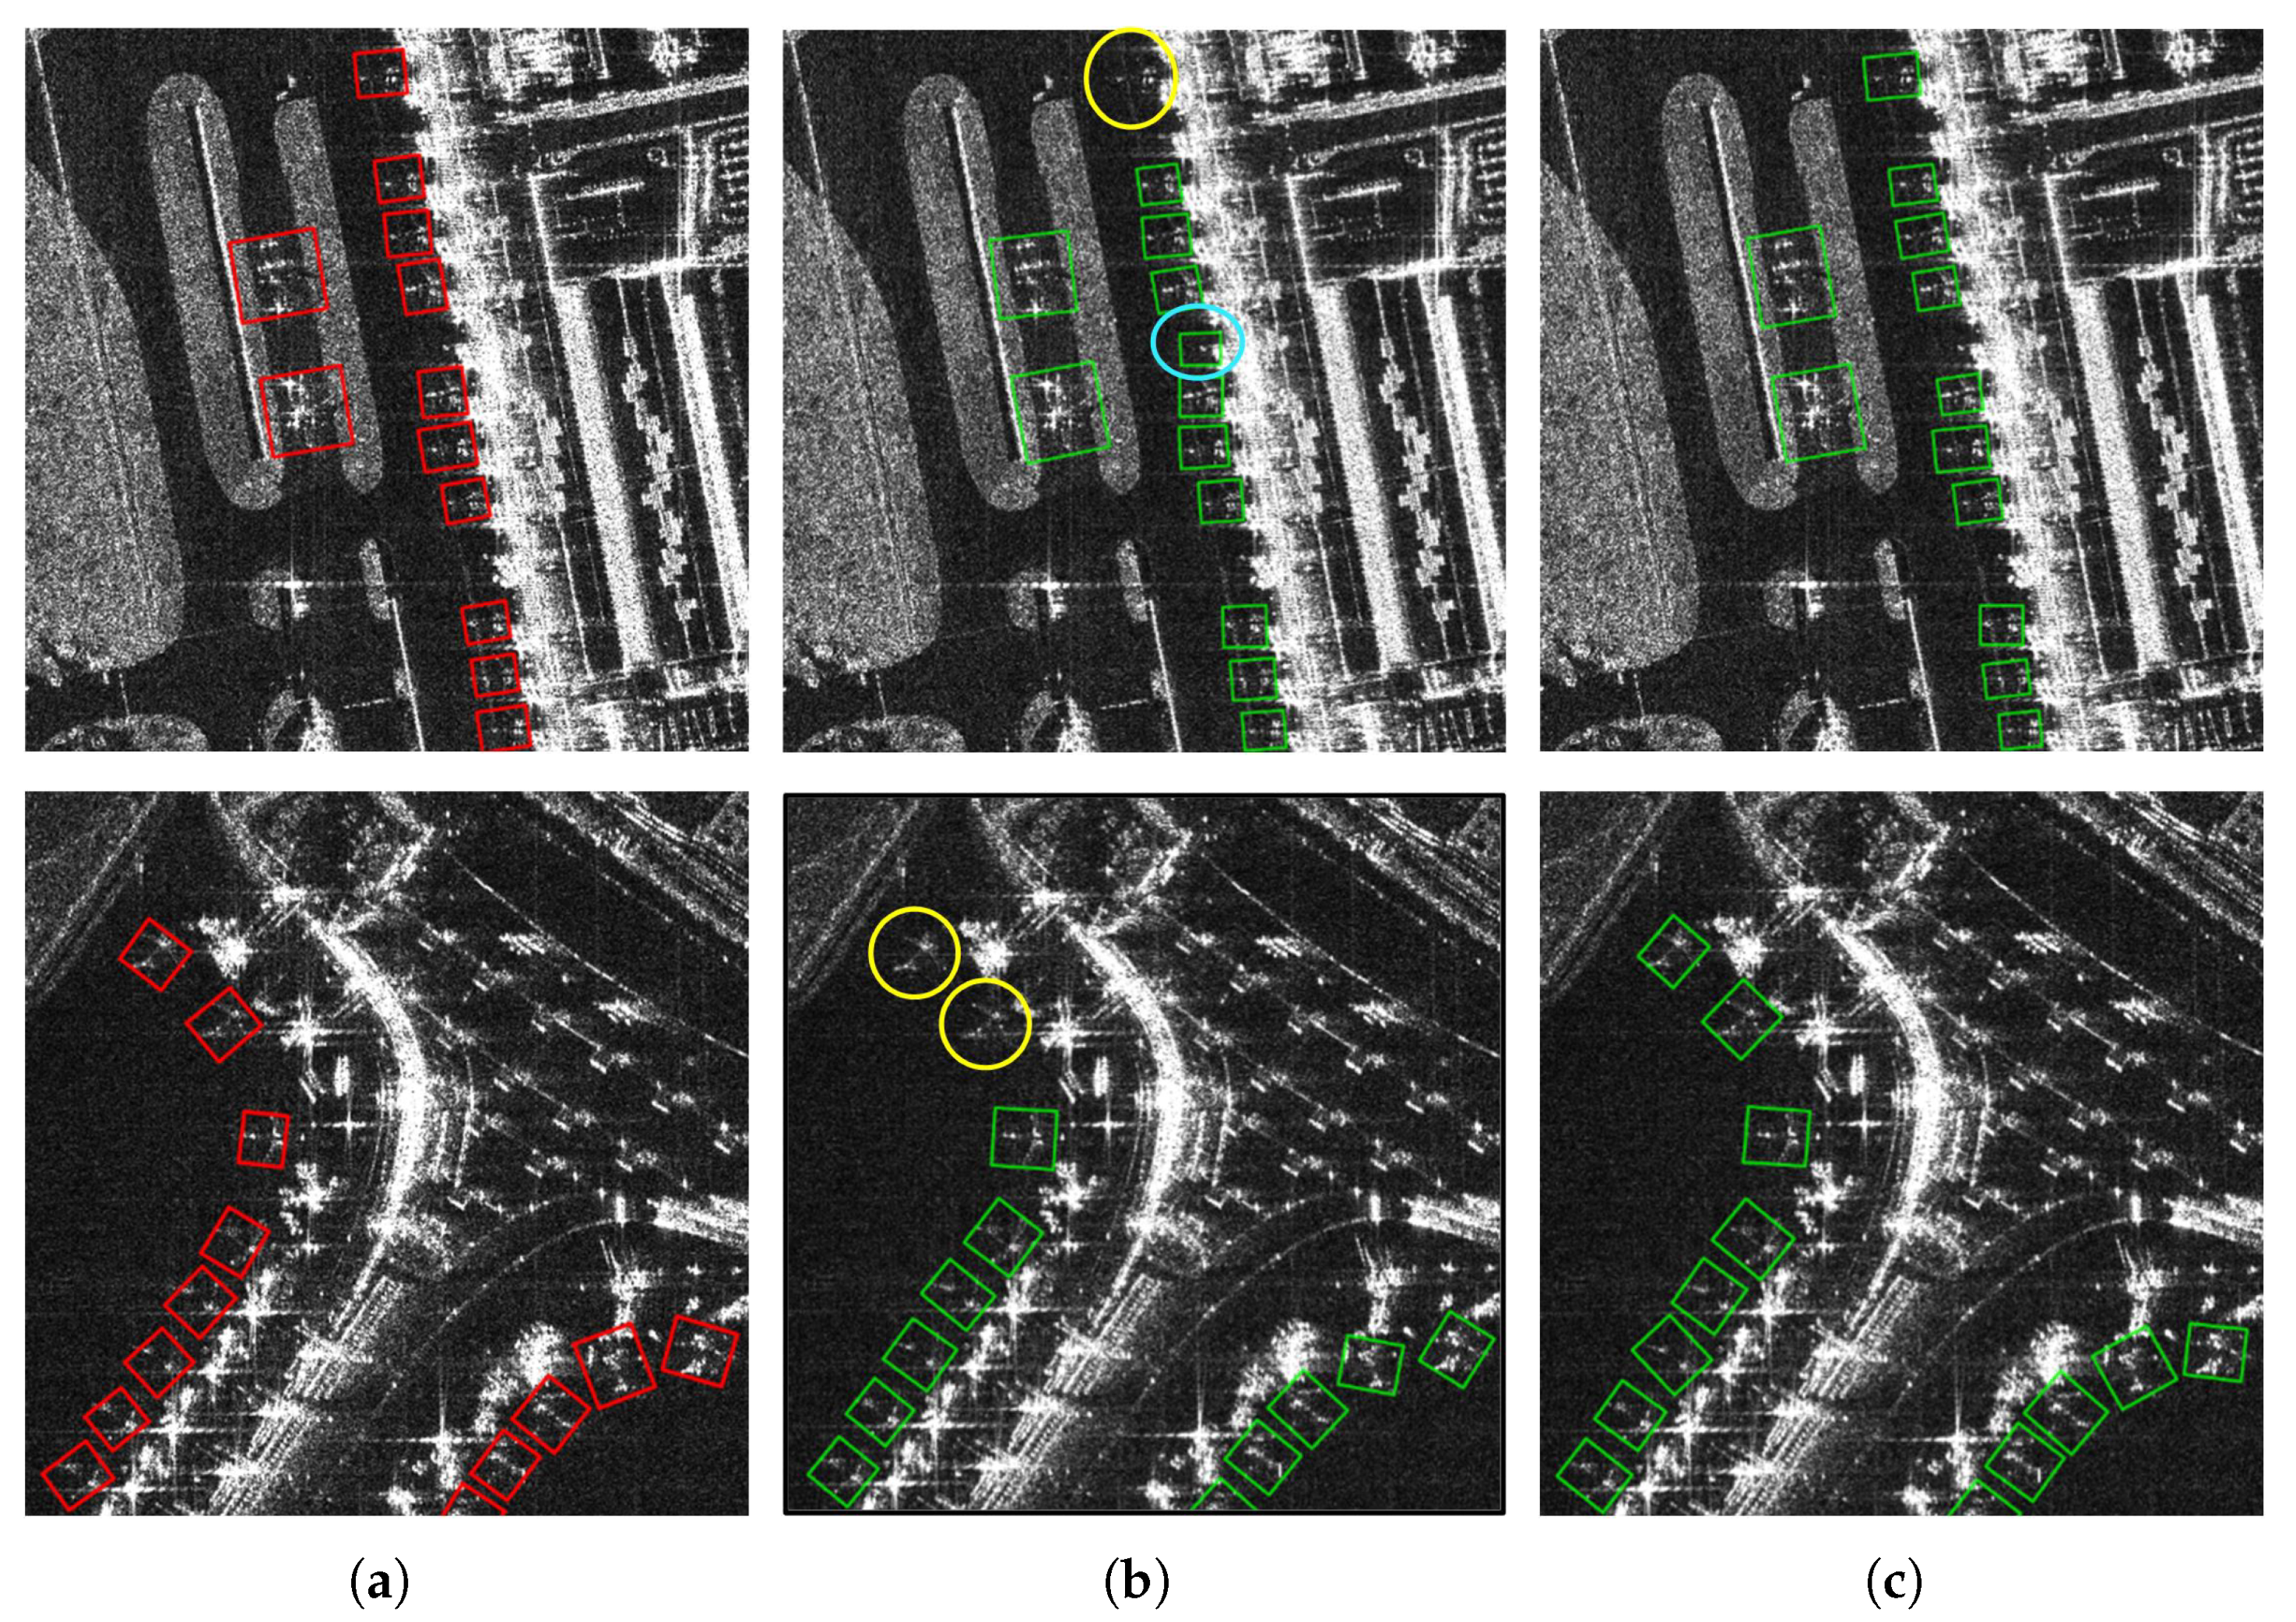
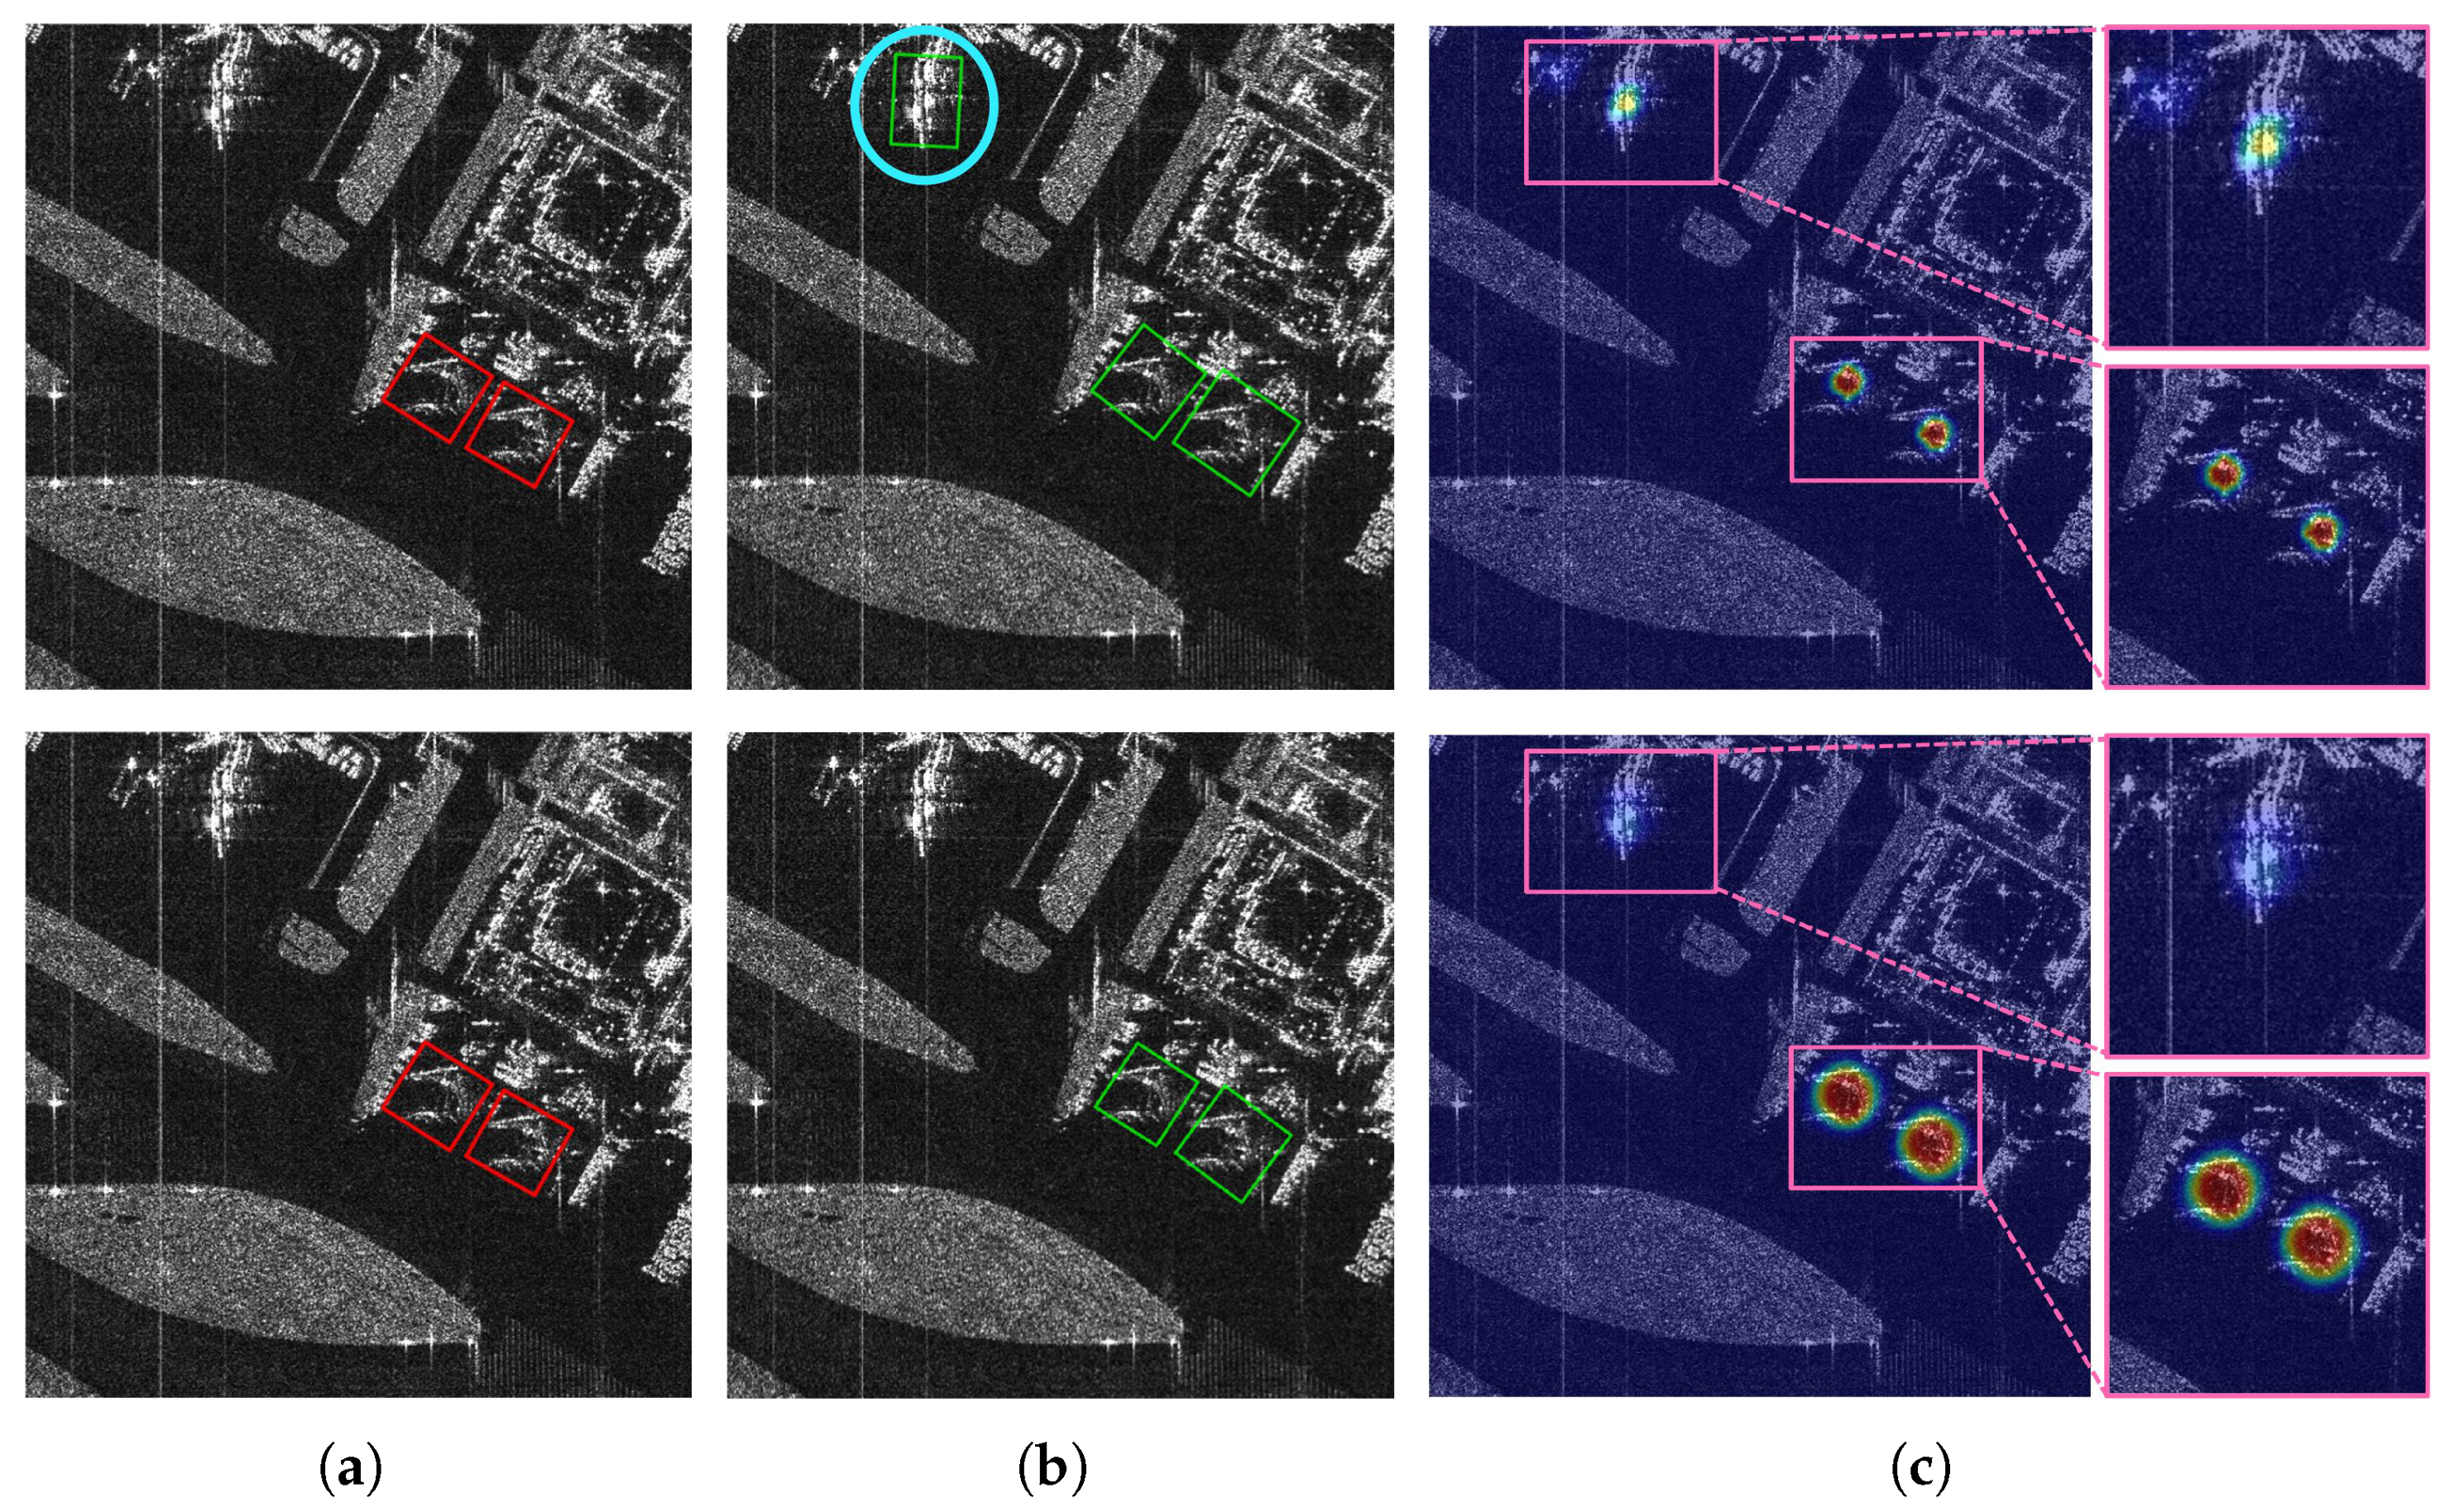
To further demonstrate the effectiveness of the CAFE module, the detection results of the baseline without and with CAFE are provided in
Figure 13. As shown in
Figure 13b, the baseline tends to misidentify ground facilities or other strong scattering targets with texture patterns similar to those of aircraft, leading to false alarms. Additionally, it fails to detect some aircraft targets that exhibit low saliency or are obscured by scattering noise, resulting in missed detections. The CAFE module addresses these issues by facilitating the exchange and aggregation of global contextual information, capturing global dependencies between strong scattering regions, guiding the network to focus on them and their geometric and spatial relationships. This enhances the structural integrity and feature consistency of aircraft targets while suppressing background clutters. As shown in
Figure 13c, the incorporation of the CAFE module enables correct identification and reduces false alarms by increasing target saliency and mitigating background interference.
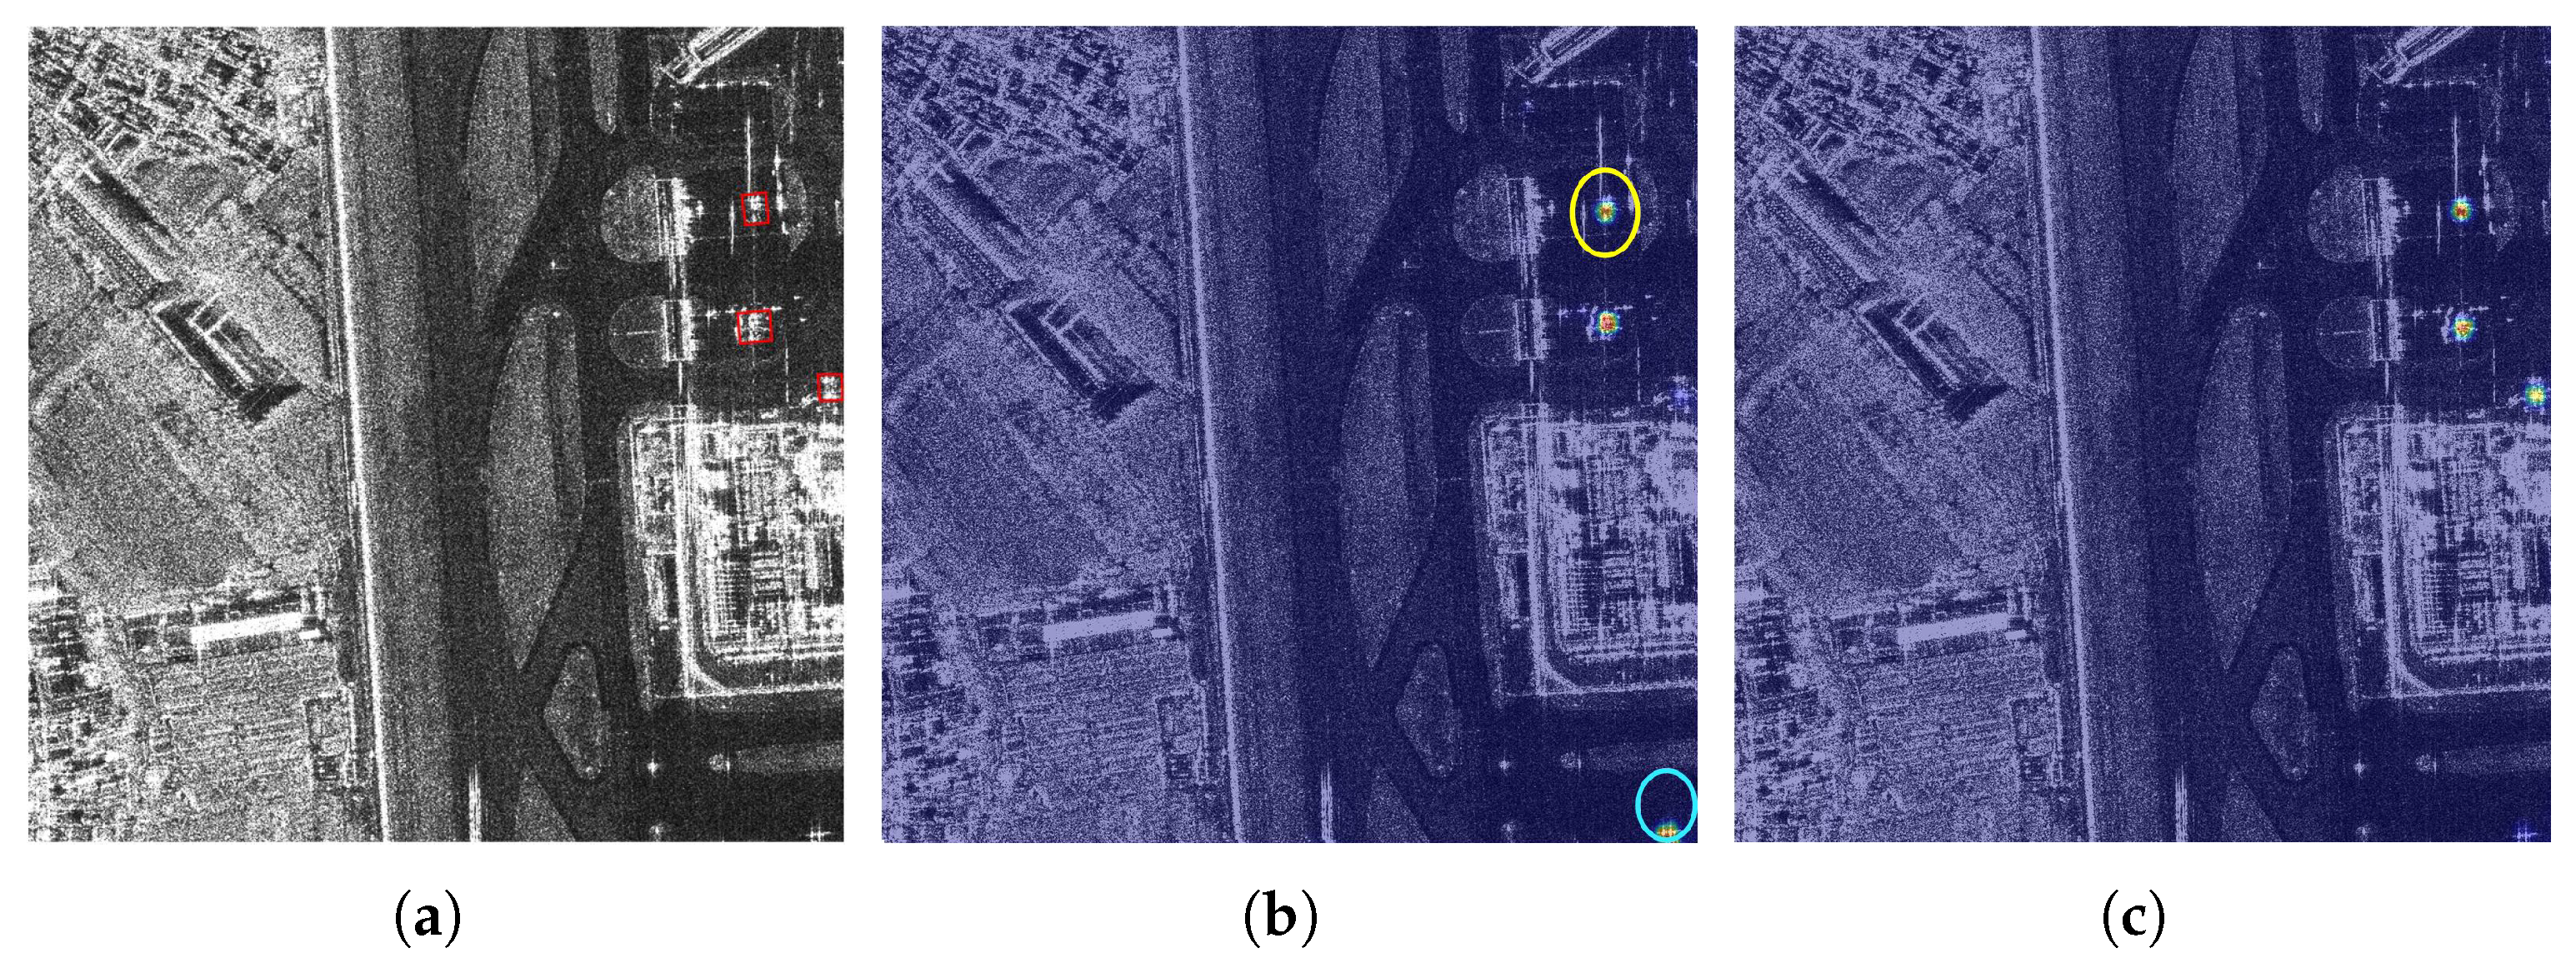
Classification heat maps are also illustrated in
Figure 14. It appears that missing detections by the baseline without CAFE obtain lower scores and false alarms have higher scores. The experimental results illustrate that the CAFE module enhances the saliency of aircraft targets by conducting global context transfer and guidance to strengthen the learning of structural and categorical features, thereby improving the detection of aircraft while suppressing background facility interference and false alarms under complex scenarios.
4.4.3. Effect of FLA Strategy
FLA is proposed to alleviate the label assignment issue caused by the irregular shapes and discrete scattering features of aircraft targets, which can lead to mislabeling of non-target points. As shown in
Table 1, FLA improves the F1 and AP by 1.26% and 1.29%, respectively. Moreover, FLA relies solely on additional ground-truth scattering points, without introducing extra parameters or computational cost from the network architecture.
Figure 15 exhibits the detection results of the baseline model without and with FLA. As can be seen in
Figure 15, the baseline without FLA fails to detect some targets under complex conditions, leading to missed detections and false alarms. FLA improves detection by covering more strong scattering regions while reducing non-target coverage. The results show that FLA effectively aligns positive sample regions with the spatial distribution of strong scattering regions, adaptively enhancing the structural perception, optimizing the training process, and enhancing the detection performance.
To further validate the impact of FLA, we visualize the classification heat maps from the baseline without and with FLA in
Figure 16.
Figure 16b reveals that without FLA employed, missed detections and false alarms exist under the baseline; in particular, for some structurally complex targets, features obtained from the baseline are not distinguishable. In contrast, detection with FLA, as shown in
Figure 16c, provides correct results with discriminative representations and higher classification scores. The experimental results show that FLA improves the learning of target structural features by leveraging the spatial distribution of scattering features and expanding coverage of overall scattering information with distinctive structural features, thereby enhancing the detection of aircraft targets.
4.5. Comparison Across Different Methods
To better demonstrate the performance of the proposed method, we design and conduct a series of experiments on the CSAR-AC dataset to compare the proposed method with other CNN-based methods. To ensure fairness in experiments, all models are configured with the same experimental settings. To comprehensively compare the detection performance, we select detectors including both two-stage and single-stages detections, as well as anchor-based and anchor-free detectors. STC-Net based on strong scattering points extraction is also included. To further validate the effectiveness and transferability of the proposed method, we conduct additional experiments on YOLOv5m-obb and YOLOv8m-obb and adapt components of SFG-Net into YOLOv8m-obb.
Table 2 shows the detection results of the comparative experiments on the CSAR-AC database. The integrated model on YOLOv8m-obb is denoted as “YOLOv8m-obb+” in the table.
The proposed components consistently demonstrate performance improvement across different baseline architectures. Specifically, while SFG-Net achieves accuracy gains over the original baseline, the YOLOv8m-obb+ variant surpasses the original YOLOv8-OBB by 3.62% in terms of AP and 2.84% with respect to F1 score.
To visualize the experimental results,
Figure 17 shows comparative dense detection results obtained by the widely adopted RetinaNet and the proposed method. In
Figure 17b, some ground facilities are misidentified as aircraft, and some aircraft targets are missed due to strong interference. In contrast, our proposed method achieves better performance with fewer missed detections and false positives, indicating that SFG-Net leverages scattering features to strengthen feature extraction and enhance structural integrity and target saliency under interference, leading to more accurate aircraft detection and fewer false alarms.
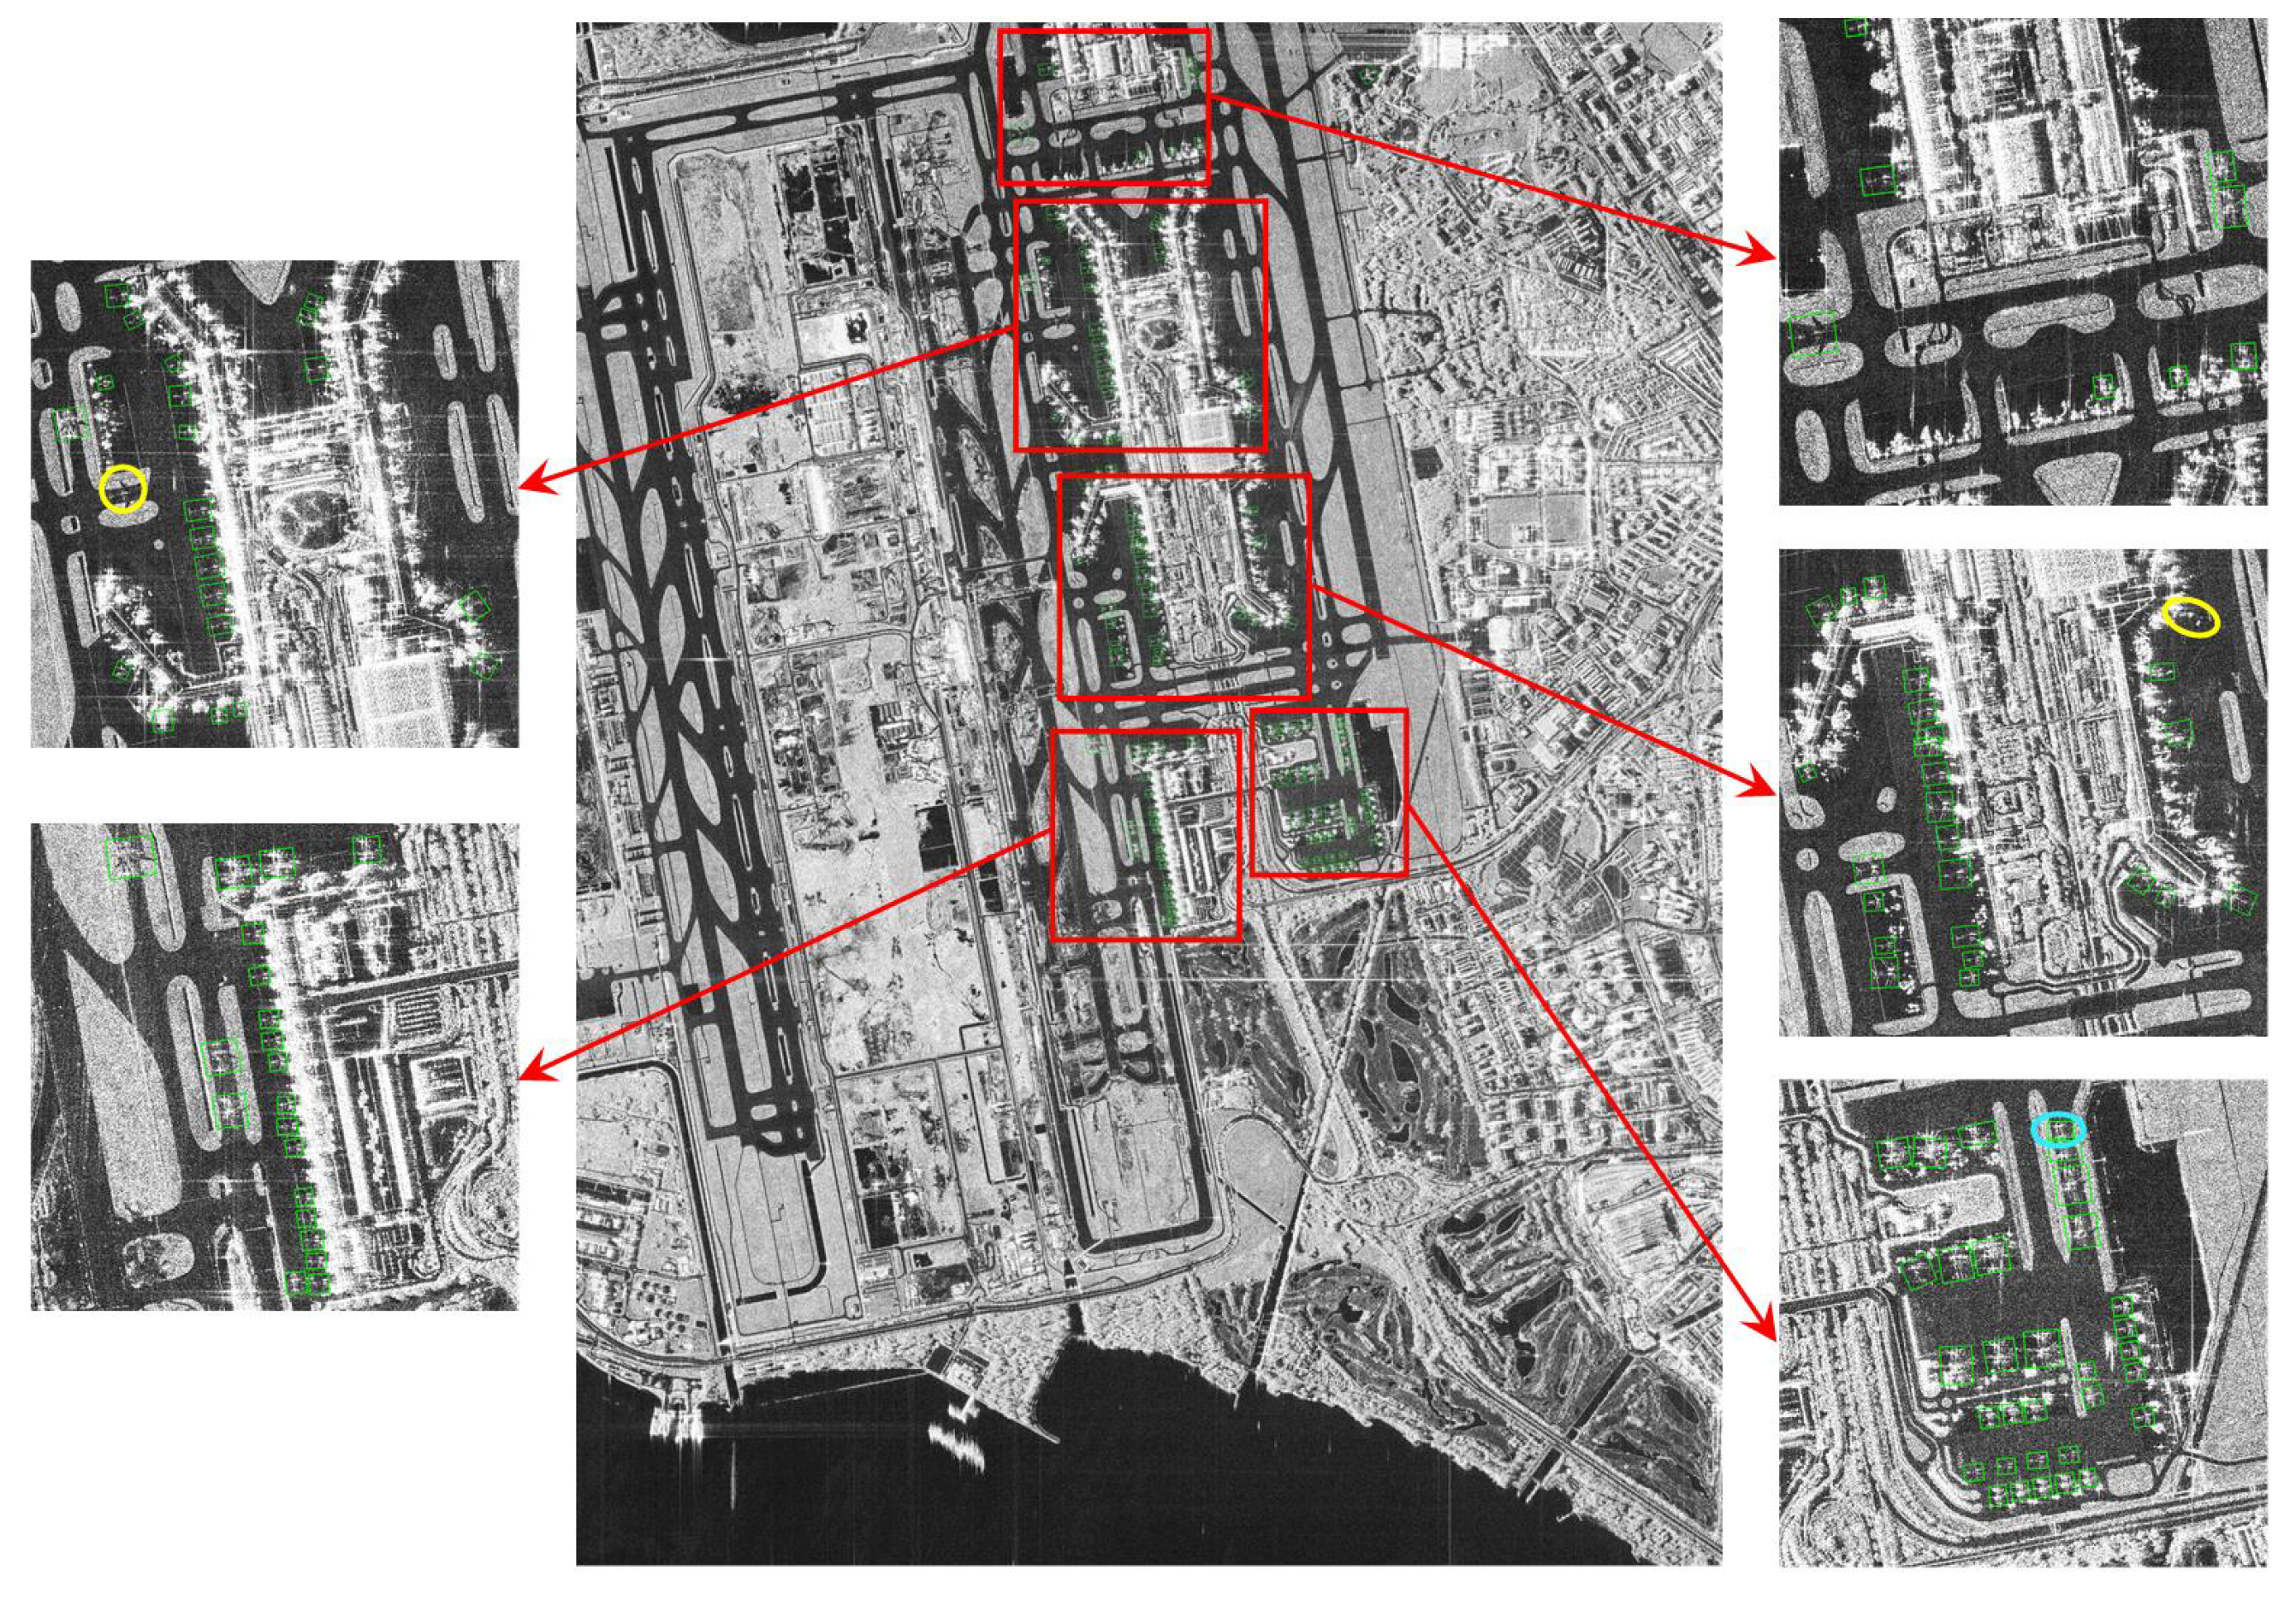
To further validate the performance of proposed method in complex scenes, detection results on a large-scale GF-3 image are provided in
Figure 18. The results show that the proposed method has good detection capability and robustness in terms of reducing background interference. Overall, the proposed approach demonstrates superior improvement in detection while effectively suppressing false alarms in complex scenes for aircraft targets.
6. Conclusions
In this paper, a scattering feature guidance network (SFG-Net) is proposed as a novel approach for oriented aircraft target detection in SAR images. The method integrates feature extraction, global feature aggregation, and adaptive label assignment, leveraging scattering-aware feature representations to enhance detection performance while suppressing interference. The core modules of SFG-Net include the detail feature supplement (DFS) module and the context-aware scattering feature enhancement (CAFE) module. The DFS module addresses the challenge of indistinct target details by expanding the perception of low-level texture and contour features, preserving crucial information and improving detection accuracy, especially for less prominent targets. Subsequently, the CAFE module enhances the structural integrity and feature consistency of aircraft targets by enabling global context-aware information exchange and guidance, increasing target saliency while suppressing false alarms. Additionally, we introduce the feature scattering center-based label assignment (FLA) strategy, which dynamically adjusts positive sample regions based on the spatial distribution of scattering features, optimizing the training process and reducing the impact of non-target samples. Relevant experiments on the CSAR-AC dataset validate the effectiveness of the proposed method. SFG-Net improves the F1 and AP by 3.2% and 3.3% over the baseline, respectively, and demonstrates its effectiveness as a general scattering feature-guided approach by improving performance across different frameworks. Future work will focus on lightweight adaptations, such as knowledge distillation and dynamic feature pruning, to achieve a better balance between efficiency and accuracy.


 ,
, 


