Abstract
As an important means to monitor atmospheric vertical temperature and humidity, the ground-based microwave radiometer has been widely used in environmental monitoring, climate prediction, and other fields, but its application in desert areas is particularly limited. At Minfeng Station on the southern edge of the Taklimakan Desert, Global Telecommunications System (GTS) detection technology was used to evaluate the microwave radiometer observations under different weather conditions and at different altitudes. The planetary boundary layer height (PBLH) was calculated using the potential temperature gradient method, and the planetary boundary layer results were calculated by analyzing dust and rainfall events. The results show that the determination coefficients (R2) of the overall observed temperature (T), specific humidity (q), and water vapor density () of the microwave radiometer are all above 0.8 under different weather conditions. When the relative humidity is 0–10%, the temperature is the best, and the R2 is 0.9819. When the relative humidity is 70–80%, the R2 of q and is the best, and the R2 is 0.9630 and 0.9777, respectively. This is in good agreement with the temperature observed by the FY–4A satellite; the observation effect is the best in May, and its R2 is 0.9142. Under the conditions of clear sky, precipitation day, and dusty weather, the R2 of the atmospheric boundary layer height calculated by the microwave radiometer is greater than 0.7 compared to the GTS sounding calculation results. These results demonstrate the reliability of microwave radiometry in extremely arid environments, providing valuable insights for boundary layer studies in desert regions.
1. Introduction
Dusty weather directly causes air pollution and large-scale climatic changes, significantly impacting arid regions. It has been observed that dust storms affect the planetary radiation balance, leading to climate change [1]. There are various observation methods available in meteorological observation operations that can be used to further investigate the variations in meteorological elements at different altitudes in dusty weather. GTS (Global Telecommunication System) sounding is a method used for high-altitude meteorological observation in meteorology. It is one of the basic means used to measure various meteorological elements in meteorological observation tasks because its accurate directional point position and timed hydrogen balloon sonde observations have good reliability. However, because of the need for fixed locations and scheduled launches, GTS sounding cannot be used to acquire continuous long-term vertical observation data series; thus, it cannot meet the demands of modern meteorological operations [2,3]. Over the past decade, many countries have installed ground-based microwave radiometers and applied them in the near-term forecasting of convective activity, data assimilation, and climate research. Ground-based microwave radiometers, such as passive microwave remote-sensing devices, enable all-weather and all-day operation [4,5,6]. Temperature and humidity are crucial meteorological parameters in the atmosphere and thus continuously influence the thermodynamic processes within it. Therefore, the high-precision detection of temperature and humidity plays a vital role in studying various weather phenomena [7]. Qi et al. [7] improved the distribution and intensity of hourly rainfall forecasts by using a ground-based microwave radiometer and predicted the precipitation intensification process in Northern China. Liu et al. [8] conducted feature analysis under different weather conditions with a multi-channel microwave radiometer and found that, under clear and cloudy conditions, the inversion temperature profile had the same root mean square error (RMSE) accuracy as the height, and the RMSE was lower than 2K when the height was lower than 4 km. By analyzing profiles from ground-based microwave radiometers, Temini et al. [2] evaluated their capacity for the near-term forecasting of fog formation and dissipation in hyper-arid environments. Faisal S. Boundala et al. [9] used ground equipment, such as a microwave radiometer, to observe cloud base height (CBH), and found that the measurement results of microwave radiometer were larger when the CBH was lower than 2 km, and the results were underestimated when the CBH was higher.
Several scholars have assessed the observational capabilities of different models of ground-based microwave radiometers both domestically and internationally [10,11]. By comparing a microwave radiometer with a GPS radiosonde, Chan et al. [12] analyzed the temperature and K index under conditions of strong convection weather and showed that the microwave radiometer could provide useful information for weather forecasting. Wu et al. [13] evaluated the detection performance of a microwave radiometer under different weather conditions in Northern China, and they calibrated the temperature and relative humidity data using the linear deviation correction method. Shen Fang et al. [14] compared the temperature and humidity measurements made using a QFW-6000 microwave radiometer in the north of China and found that the temperature detection accuracy was higher than the accuracy regarding relative humidity. Furthermore, there were significant errors in temperature and relative humidity below 1 km at 8:00 (Beijing time) and 20:00 (Beijing time). In recent years, ground-based microwave radiometers have been widely used for atmospheric boundary layer height retrieval [15]. Validating the accuracy of ground-based microwave radiometer observation data and further comparing the observed results regarding T, q, and lay a certain foundation for atmospheric boundary layer retrieval.
In order to further explore the applicability of microwave radiometers in arid and semi-arid regions, Huang et al. [16] analyzed the diurnal and annual variations of cloud liquid water paths in semi-arid regions based on microwave radiometer observations. Zeng et al. [17] analyzed the dynamic changes in the atmosphere during heavy rainfall in Urumqi using wind profiler radar and ground-based microwave radiometer data. Their results have deepened our understanding of the fine atmospheric structure during heavy rainfall. Yang et al. [18] analyzed the drought–wetness variation characteristics of drought and humidity in Central Asia by using the surface moisture index coupled with the multi-moisture component of a microwave scanning radiometer, and they identified the main concentration areas of drought and the changes in temperature, humidity, and water vapor flux of a typical atmospheric pressure layer as the main reasons for the variation in dryness and humidity.
Atmospheric boundary layer height, as a crucial indicator for studying atmospheric climate and weather, plays a vital role in obtaining rich and accurate observational values for numerical simulations and environmental planning. Scientists have conducted extensive research on dusty weather and its boundary layer height. Utilizing observations from micro-pulse lidar, Chen et al. [19] discovered fluctuations in boundary layer height over time and determined how it was influenced by turbulent mixing and vertical wind speed. Combining ground-based and spaceborne lidar measurements with ground-level aerosol mass concentrations, Kim et al. [20] analyzed the optical and physical characteristics of dust events. Liu, Xie, Dong, and Guo et al. [21,22,23,24] utilized polarization lidar to monitor urban pollution and dust storm weather, gradually studying the characteristics of the backward scattering coefficient, extinction coefficient, and depolarization ratio of dust aerosols. Through the direct observation of accumulated-stage dusty weather, it is possible to study the frequency and intensity of dust storms [25], thereby effectively evaluating the effectiveness of air pollution control [26]. Li et al. [27] analyzed the vertical structure of the atmospheric boundary layer and its impact on winter PM2.5 concentrations in Northwest China using tethered balloon soundings. Using radiosonde data, Kumar et al. [28] analyzed the daytime boundary layer behavior in semi-arid climates in India and found that sedimentation and radiative cooling levels, as well as the height of the boundary layer, were very low in winter. Nakamae et al. [29] analyzed the relationship between the convective mixed layer and dusty weather in arid and semi-arid regions of East Asia, and they showed that the deep mixed layer plays a greater role in the Gobi Desert than it does in the Taklimakan Desert. Wang et al. [30] studied the evolution of atmospheric boundary layer height in desert regions using reanalysis data. Song et al. [1] evaluated boundary layer height under dusty weather conditions using coherent Doppler lidar. In the past, more experiments focused on studying aerosols to understand dusty weather processes and on using different observation devices to study atmospheric boundary layer height.
Although there have been studies on the height of the atmospheric boundary layer in arid regions, there have not been any long-term and continuous observations and research on dust storms and dust-raising weather made and conducted, respectively, using microwave radiometers at the southern edge of the Taklimakan Desert. Whether the observations of microwave radiometers are accurate under different weather conditions in arid deserts and whether the vertical observations made using microwave radiometers will be affected during sustained sandy and dusty weather are issues worth exploring. In this project, we used the microwave radiometer installed at Minfeng Station on the southern edge of the Taklimakan Desert, combined with the GTS sounding comparison, to study the observation data on T, q, and obtained using this microwave radiometer in this location, with the purpose of evaluating the vertical detection accuracy of the microwave radiometer under different atmospheric conditions in the desert. Moreover, the atmospheric boundary layer height of the Taklimakan Desert was calculated through the observational data, providing new observational support for the research and development of atmospheric boundary layer height under different weather conditions at the southern margin of the Taklimakan Desert. By evaluating the applicability of a microwave radiometer under the dusty weather conditions of the Taklimakan Desert, this study provides a certain theoretical basis for the calculation of atmospheric boundary layer height and atmospheric environment evaluation [31].
The organizational structure of this paper is as follows: The site and data resources are detailed in Section 2. Section 3 provides a comparative analysis of the T, q, and obtained via the microwave radiometer and GTS sounding. This section also includes information on the retrieval of changes in atmospheric boundary layer height during dust processes using the potential temperature gradient method and evaluates the accuracy of the microwave radiometer observations. Section 4 and Section 5 contain the discussion and conclusions, respectively.
2. Materials and Methods
2.1. Data and Information
The Taklamakan Desert is located in the Tarim Basin of Xinjiang Uygur Autonomous Region, China (Figure 1a), and the unique topography of the region makes it frequent for sand and dust disasters (Figure 1b). In this study, we utilized ground-based multi-channel microwave radiometer (Figure 1c) data and GTS sounding (Figure 1d) data collected at Minfeng station (referred to as MF station, located at 37°04′N, 82°43′E, 1410.7 m (Figure 1e)) at the southern edge of the Taklimakan Desert from 24 April to 31 August 2021. The data were obtained using an MWP967KV ground-based multi-channel microwave radiometer produced by North Sky (Xi’an) Information Technology Co., Ltd., Xi’an, China. The sounding instrument used was a GTS 13 digital sounding device, which receives data through the GFE (L) 1 secondary wind radar. The equipment is produced by Taiyuan Radio No. 1 Factory Co., Ltd., Taiyuan, China.
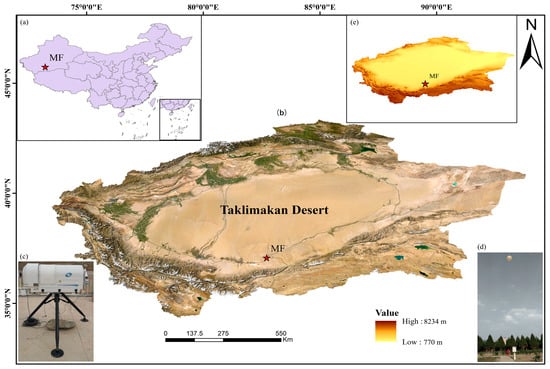
Figure 1.
Map showing the location of the field experiment station at the southern edge of the Taklimakan Desert. (a) indicates that the site is located in a province in China. (b) Indicates the topography and landform of southern Xinjiang. (c) represents the microwave radiometer, (d) represents the GTS sounding, and (e) represents the elevation of the southern Xinjiang region.
Basic information on the microwave radiometer and GTS sounding is shown in Table 1. The microwave radiometer made continuous observations 24 h a day, with an average observation time of 2 min per set. As a result, through the emission and reception of electromagnetic wave signals by the microwave radiometer, continuous temperature and humidity profile information over an extended period was obtained. The microwave radiometer has a maximum detection height of 10 km, with a resolution of 50 m from the ground to a height of 500 m, a resolution of 100 m below 2 km, and a resolution of 250 m between 2 and 10 km. During its atmospheric observation process, the MWP967KV ground-based multi-channel microwave radiometer generates meteorological products based on an atmospheric radiation transfer model derived from historical sounding data using a neural network algorithm. It also stores the observed atmospheric temperature, water vapor concentration, relative humidity, and liquid water profile data. The neural network method is derived from the Stuttgart neural network simulator and historical radio sounding profile data.

Table 1.
Basic information of the microwave radiometer and GTS sounding.
The GTS sounding observation data were obtained from the Meteorological Bureau of Minfeng County (37°04′N, 83°43′E). The allowable deviations of temperature detection, air pressure, and humidity measurement are−0.3 °C–0.3 °C, −2.0 hpa–2.0 hpa, and −4–4%, respectively. It can measure meteorological elements such as wind direction, wind speed, temperature, pressure (P), humidity, dew point, and virtual temperature in the upper atmosphere, with high vertical resolution and real-time observation capabilities. Since GTS sounding requires manual release, there was a fixed casting time, namely 08:00 and 20:00, and the encryption moments in July were 2:00 and 14:00. The vertical detection resolution of the microwave radiometer is 0 m–500 m for a 25 m interval, 550 m–2000 m for a 50 m interval, and 2250 m–10,000 m for a 250 m interval. To facilitate a comparative analysis of the two types of data, the same vertical resolution was selected to match the microwave radiometer at the MF station. The microwave radiometer selected the sample set closest to the GTS sounding release time for analysis. The temperature data set from the FY-4A satellite comes from https://satellite.nsmc.org.cn/PortalSite/Data/Satellite.aspx (accessed on 25 September 2023), with a temporal resolution of 2 h and a vertical resolution of 0–1100 hpa. All the times in this paper are presented in Beijing Time (BJT) unless otherwise specified.
2.2. Research Methods
2.2.1. Retrieval of Temperature, Specific Humidity, and Water Vapor Density at Different Heights
Using the data acquired by the microwave radiometer, the pressure at different heights was calculated using the pressure height formula, and was calculated using the saturated water vapor pressure and RH. The variables not derived in the equations can be referred to in the basic thermodynamic relationships presented in the “Atmospheric Physics” published by Peking University Press [32]. The specific calculation formulas are as follows [33]:
where represents the temperature in Celsius (°C); represents the saturation water vapor pressure (hpa).
where , denotes the molar mass of water vapor (g/mol), and represents the molar mass of dry air (g/mol).
where stands for the standard pressure (hpa), the value of which is 1000 hpa in this study; stands for temperature in Kelvin (K); is the gas constant for air [J/(kg·K)]; stands for Potential Temperature (K).
To unify the vertical resolution of the GTS sounding data below 10,000 m with that obtained by the microwave radiometer, the q and at each layer were calculated using the formula, as GTS sounding data include pressure profile data and do not require pressure profile calculation. However, water vapor density profile data were missing, so water vapor density was calculated before calculating . Then, the formula was applied to process the GTS sounding data to obtain the q and at each layer. The calculation formulas for q and are shown in Formulas (2) and (3) of the microwave radiometer. The formula for calculating the water vapor density is as follows:
In Formula (4), r stands for the mixing ratio (g/g), and e stands for water vapor pressure (hpa).
In the formula for calculating water vapor density, stands for the specific gas constant of water vapor; is the water vapor density (g/m3).
2.2.2. Evaluation Criteria for Accuracy
To validate the reliability of the microwave radiometer observational data, a comparison was made with the GTS sounding data. The coefficient of determination (R2), mean error (ME), and root mean square error (RMSE) were utilized to assess the suitability of the microwave radiometer observations made at the southern edge of the Taklimakan Desert.
The error is defined as the difference between the microwave radiometer dataset (Di) and the GTS sounding dataset (Fi).
The following are the formulas for calculating R2 (coefficient of determination), ME (mean error), and RMSE (root mean square error):
where and represent the mean values of the GTS sounding data and the microwave radiometer data, respectively.
2.2.3. The Potential Temperature Gradient Method Calculates the Planetary Boundary Layer
The PBLHs (planetary boundary layer heights) for both the microwave radiometer and GTS sounding were calculated using a method based on vertical temperature differences to determine the boundary layer height. Specifically, Liu and Liang’s method [33], known as the potential temperature gradient method, was utilized. This method categorizes the boundary layer into three types based on the predominant development stages of the atmospheric boundary layer: the convective boundary layer (CBL), the neutral boundary layer (NBL), and the stable boundary layer (SBL). The distinction between boundary layer types is made by calculating the difference in between 200 m and 50 m, as shown in the following:
where is the increment, representing the minimum strength for the criteria of CBL or SBL; 5 represents at 200 m, and 2 represents at 50 m.
The methods for determining the boundary layer height in convective and neutral boundary layers are as follows:
where is the increment for the minimum strength of the unstable layer. The difference between the kth layer and the 1st layer is taken as the minimum value in the category. The boundary layer height is determined as the height where the first occurrence of satisfying Equation (12) above the kth layer is found, which is shown as follows:
where indicates the gradient of with respect to height; represents the minimum strength of the overlying inversion layer and is considered the overshooting threshold of the rising parcel.
For the stable boundary layer, the boundary layer height is determined as the height where the slope between the kth layer and the k − 1th layer satisfies Equation (12) or where the slope between the k + 1th layer and the k + 2th layer satisfies the following Equation (13):
Liu and Liang [34] have experimentally demonstrated that the following applies in mid-latitude inland areas:
3. Results
Based on the temperature and humidity data and other data recorded by the microwave radiometer and via GTS sounding from 24 April 2021 to 31 August 2021, an analysis and a comparison of the samples were conducted.
3.1. Evaluation of the Accuracy of Temperature and Humidity Measurements Made by the Microwave Radiometer
Based on GTS sounding releases from MF stations from 24 April to 31 August 2021, all available samples from two time points (8:00, 20:00) and intensive time points (2:00, 14:00) were used for analysis, and the results of T, q, and were compared. Here, 08:00 is the time of sunrise and 20:00 is just before sunset. The corresponding scatter plot is shown in Figure 2. From the linear fitting results, the linear coefficients of determination (R2) of T, q, and were 0.9804, 0.8952, and 0.9119, respectively, which passed the significance test (p < 0.01, the results were omitted). The figure shows that the temperature results from the microwave radiometer and GTS sounding observations are mainly located between 280 K and 300 K. The specific humidity is primarily in the range from 0.008 g/g to 0.012 g/g, and the water vapor density is mainly above 7 g/m3. On the whole, the observation results of T, q, and from the microwave radiometer are satisfactory.
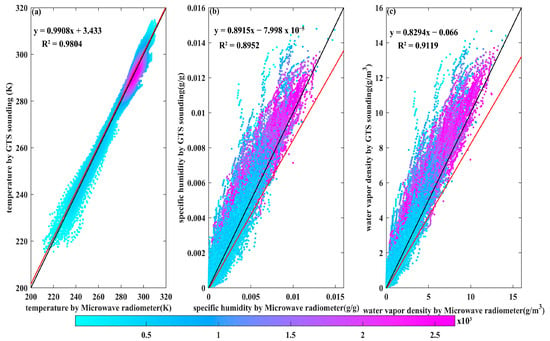
Figure 2.
A comparison of the data from the MF microwave radiometer and GTS sounding for the period from 24 April 2021 to 31 August 2021 for (a) temperature, (b) specific humidity, and (c) water vapor density. It displays the regression line (red line) and the reference line y = x (black line). Colors reflect the density of the data points.
In meteorology, GTS sounding observations are often used as a reference standard to compare other observational techniques [35,36]. In this study, the evaluation indicators were also calculated based on GTS sounding data. To further explore the accuracy of microwave radiometer observations under different weather conditions, we grouped all available sample data from 24 April to 31 August 2021 into five types: The sample sizes of dust storms, blowing sand, floating dust, precipitation day, and clear sky were 996, 3320, 10,624, 3652, and 6142, respectively, and the weather was classified according to weather phenomena observed in real time by weather stations. The observation times include all valid data from the regular observations (at 08:00 and 20:00) and the additional intensive observations (at 02:00 and 14:00) added in July. Under different weather conditions, the comparison results of the microwave radiometer and GTS sounding data are shown in Figure 3. The microwave radiometer has good applicability under different weather conditions, and the coefficient of determination (R2) calculated with GTS sounding data is more than 0.85 under various weather conditions. Among them, the temperature observed in sandstorm weather is the best, and the value is 0.992. The coefficients of determination (R2) of q and are the highest in sand-raising weather, which are 0.9334 and 0.8776, respectively.
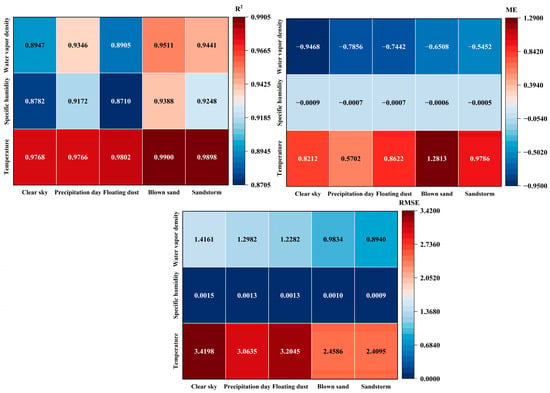
Figure 3.
Coefficient of determination (R2), mean error (ME), and root mean square error (RMSE) for the microwave radiometer and GTS sounding temperature, specific humidity, and water vapor density under different weather conditions.
The mean error (ME) shows that, for the microwave radiometer, T is underestimated, and q and are overestimated. Compared with the GTS sounding observation, the microwave radiometer has the largest temperature observation deviation under the sand blowing condition, with an average deviation of 1.3191 K, and the smallest deviation under the precipitation condition, with an average deviation of 0.4979 K. The average error results of specific humidity are basically the same, but the deviation of water vapor density is the largest and the smallest in clear sky and sandstorm conditions.
The root mean square error (RMSE) results show that the RMSE of the microwave radiometer T, q, and in clear weather conditions is the highest among the five weather types. Sandstorm weather conditions are the lowest. The large error of observation results of the clear sky condition may be caused by the significant influence of microwave radiometer on the detection error of the temperature inversion layer. Studies have shown that when the temperature inversion layer is greater than or equal to 650 m on clear sky days, the detection error of the microwave radiometer is more likely to exceed 3 °C [37]. On clear days, the water vapor content in the atmosphere is relatively low. The microwave radiometer has a high sensitivity to water vapor, and changes in water vapor content can also affect the accuracy of its retrievals [38]. Additionally, the distribution of atmospheric components, such as aerosols, changes on clear days, and the absorption and scattering characteristics of microwaves can influence the observational accuracy of the radiometer [39].
Figure 4 further compares and analyzes the situation of T, q, and at different heights of the MF station in the vertical direction, and it refers to floating dust, sandstorm, and sandstorm collectively as dust weather. After uniformly adjusting the vertical resolution of GTS sounding to match the resolution of the microwave radiometer, the results of different altitudes under different weather conditions are compared and analyzed.
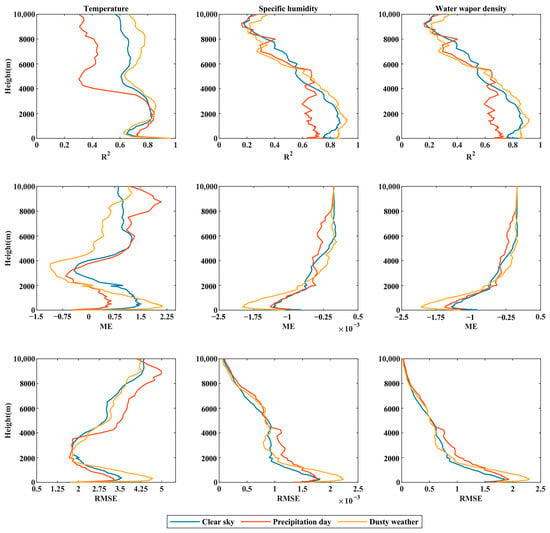
Figure 4.
The coefficient of determination (R2), mean error (ME), and root mean square error (RMSE) of the microwave radiator and GTS sounding results at different heights under different weather types.
The determination coefficient (R2) of the detection temperature of the microwave radiometer in clear sky and dusty weather is better than that of the GTS sounding (R2 > 0.55). Through the significance test, the specific humidity and water vapor density perform better below 6000 m (R2 > 0.4). For T, the results of microwave radiometer detection under three weather conditions show the same trend compared with GTS sounding. The microwave radiometer is below 3750 m, the coefficient of determination (R2) is the lowest at 0.57, and it has passed the significance test. ME shows that the temperatures observed by the microwave radiometer at 2000 m–4500 m on the precipitation day and in dusty weather are higher than that of sounding observation, and there is an overestimation between 2750 m and 4000 m in clear sky conditions. For q and , the results of the microwave radiometer and GTS sounding under three weather conditions show the same change trend. When the microwave radiometer is below 5700 m, the coefficient of determination (R2) exceeds 0.5 and passes the significance test. The overestimation of q and results of the microwave radiometer is found in all three kinds of weather, except for some altitudes. Microwave radiometers below 4250 m observe q and on precipitation day, and the coefficient of determination is lower than on clear sky days and in dusty weather. This may be due to the interference of the received signal of the microwave radiometer caused by precipitation and the increase of ground humidity affecting the reflection characteristics of the microwave signal, leading to the deviation of the humidity estimate [40]. The RMSE shows that the error of T, q, and detected by the microwave radiometer increases rapidly from the ground to 275 m, which may be due to the influence of the ground effect in the desert area, which interferes with the received signal of the radiometer [41].
3.2. The Evaluation of Observation Accuracy at Different Times
As can be seen from Table 2, the overall applicability of the microwave radiometer is relatively high on sunny days and in dusty weather conditions, and the R2 of each moment is higher than 0.85. Among these, T and q have the best observation effect at 20 points under dusty weather, and their R2 values are 0.9896 and 0.9636, respectively. has the best observation effect at 8:00 in dusty weather, and its R2 is 0.9266. The microwave radiometer and GTS sounding observations were made at 8:00 and 20:00 under clear sky and dusty weather conditions (Figure 5). On the whole, the microwave radiometer has high applicability to temperature observation at different altitudes and different times, and the coefficient of determination (R2) is higher than 0.52. While q and values above 9000 m and the observation results did not pass the significance test, the other altitudes all passed the significance test. For T, the microwave radiometer showed a trend of first decreasing, then increasing, and then decreasing as the altitude increased. In particular, the R2 of the microwave radiometer observation and GTS sounding observation at 8:00 was lower than that of the GTS sounding observation at 20:00 under two weather conditions below 4000 m. At 8:00, below 1300 m, the determination coefficient decreases rapidly and then rises, which may be due to the complex vertical structure of the inversion layer, and the microwave radiometer cannot use the neural network inversion algorithm to obtain good details of the inversion layer, resulting in poor detection effect [37]. For q and , below 4000 m, the observation results of microwave radiometer and GTS sounding R2 exceed 0.7, passing the significance test. Above 4000 m, the coefficient of determination (R2) shows a decreasing trend with the increase of altitude. According to ME and RMSE, the detection result of the microwave radiometer below 4500 m is higher than that of GTS sounding observation. The error decreases first and then increases with the increase of altitude, and the minimum error values are 0.00002 g/g and 0.03 g/m3.

Table 2.
The overall R2 of the microwave radiometer and GTS sounding at different times in clear sky and dusty weather conditions.
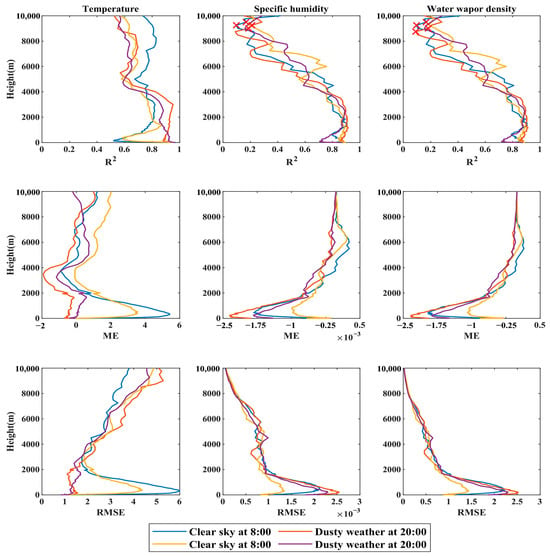
Figure 5.
The coefficient of determination (R2), mean error (ME), and root mean square error (RMSE) of temperature, specific humidity, and water vapor density captured by the microwave radiometer and GTS sounding at two times at different altitudes in clear sky and dusty weather conditions.
3.3. Evaluation of Observational Accuracy Under Different Humidity Conditions
The high sensitivity of microwave radiometers to humidity can be attributed to the pronounced absorptive capacity of water vapor molecules within the microwave frequency band. These radiometers discern temperature and humidity profiles by measuring the emissions of water vapor and oxygen present in the atmosphere [38,42]. In order to further verify the applicability of the microwave radiometer in the Taklimakan Desert and further verify the observation results of the microwave radiometer under different humidity conditions, the relative humidity is divided into 10 intervals. By calculating the determination coefficients of T, q, and observed by the microwave radiometer and GTS radiosonde, the optimum conditions of T, q, and observed by the microwave radiometer under different humidity conditions are discussed.
According to the observation results under different relative humidity conditions (Figure 6), with the increase of relative humidity, the microwave radiometer and GTS sounding observation T have a good consistency under different relative humidity conditions, and the determination coefficient is the largest in the range of 0–10%, with a value of 0.9819. This is consistent with the highest coefficient of determination of T observed under clear sky conditions among the five weather types. For q and , the coefficient of determination between 10% and 20% RH is the smallest, and the coefficient of determination between 70% and 80% RH is the largest, whose values are 0.963 and 0.9777, respectively. This is consistent with the observed minimum determination coefficients of q and in the five weather types under clear sky conditions. In the relative humidity range from 90% to 100%, the coefficient of determination is low, probably because liquid water in precipitation absorbs and scatters the microwaves and, thus, affects the radiometer measurement [43].
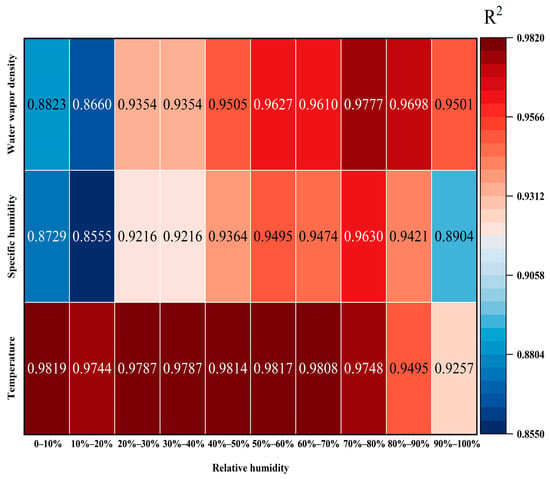
Figure 6.
Coefficients of determination of different elements monitored via the microwave radiometer and GTS sounding under various relative humidity conditions (p < 0.01).
3.4. Temperature Comparison Between Microwave Radiometer and FY–4A Data
Ma Yufen et al. analyzed the deviation distribution characteristics of the atmospheric temperature profile retrieved by the FY–4A satellite using data from one enhanced radiosonde station and seven conventional radiosonde stations [44]. The results indicated that the root mean square error (RMSE) of the FY–4A satellite’s atmospheric temperature inversion is within 3 K. To further validate the vertical detection accuracy of the microwave radiometer, its effective data were compared with the temperature data from the FY–4A satellite across different months. After extracting the effective data from both the microwave radiometer and the FY–4A satellite, the FY–4A data were interpolated to heights ranging from 0 m to 10,000 m. Using the FY–4A observations as the true values, the RMSE and coefficient of determination (R2) were calculated for each month.
Figure 7 shows that the microwave radiometer and the FY–4A satellite achieved good observational performance in terms of the coefficient of determination (R2) across different months. The best T observations were obtained in May, with an R2 value of 0.9142. In May, the RMSE between the FY–4A satellite and the microwave radiometer’s T observations was the smallest, at 7.52 K. By comparing the T observations from the FY–4A satellite and the microwave radiometer, it is evident that the microwave radiometer’s observations are highly accurate.
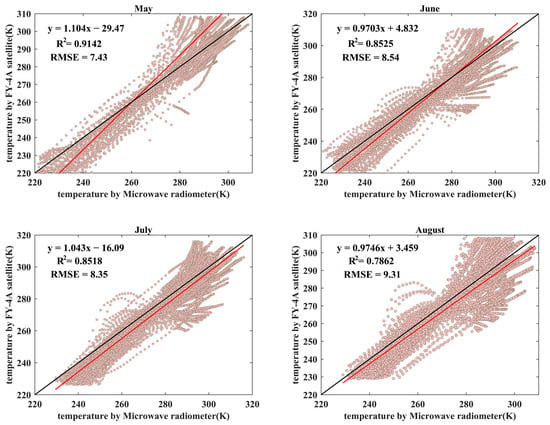
Figure 7.
The correlation between the microwave radiometer and the FY-4A temperature (the red line indicates the fitting line, and the black line indicates the 1:1 reference line).
3.5. Evaluation of the PBLH Inversion Results
As an important parameter describing the characteristics of the boundary layer, PBLH plays an important role in pollutant control and the parameterization schemes of numerical weather prediction models [45,46]. In order to comprehensively evaluate the PBLH calculation results of the microwave radiometer, the PBLH calculation results of the microwave radiometer under different weather conditions are compared.
The probability density distribution of PBLH calculated by the microwave radiometer and GTS sounding (Figure 8) shows that the frequency of PBLH is highest below 1000 m. The PBLH calculated by the microwave radiometer below 540 m is consistent with the results calculated by GTS sounding. However, the results of PBLH calculated by the microwave radiometer from 540 m to 2200 m and at 4275 m are overestimated, while there is an underestimation between 2200 m and 3000 m. The large aggregation of PBLH calculation results from the microwave radiometer near 2000 m may be caused by the change in the vertical resolution of the microwave radiometer at 2000 m. Conversely, the number of PBLH calculations of GTS sounding between 3000 m and 4000 m is higher than that of the microwave radiometer. Additionally, the PBLH values calculated by the microwave radiometer from 4000 m to 5000 m are more frequent than those calculated by GTS sounding.
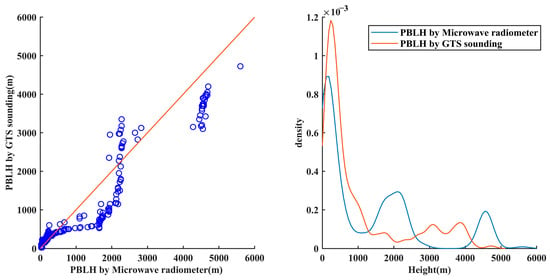
Figure 8.
Quantile–quantile plot and probability density distribution of the PBLH calculations of the microwave radiometer and GTS sounding.
In the QQ chart (Figure 9), the effective height range of the samples is divided into three weather types: clear sky, precipitation day, and dusty weather. The distribution of PBLH in clear sky is closest to the 1:1 baseline, followed by precipitation day, and then dusty weather. Under these three weather conditions, the atmospheric boundary layer observations of microwave radiometers are generally higher than those of sounding observations. The probability density distribution shows that the probability density of the atmospheric boundary layer observed by GTS sounding is higher than that of the microwave radiometer under clear sky and dusty weather conditions.
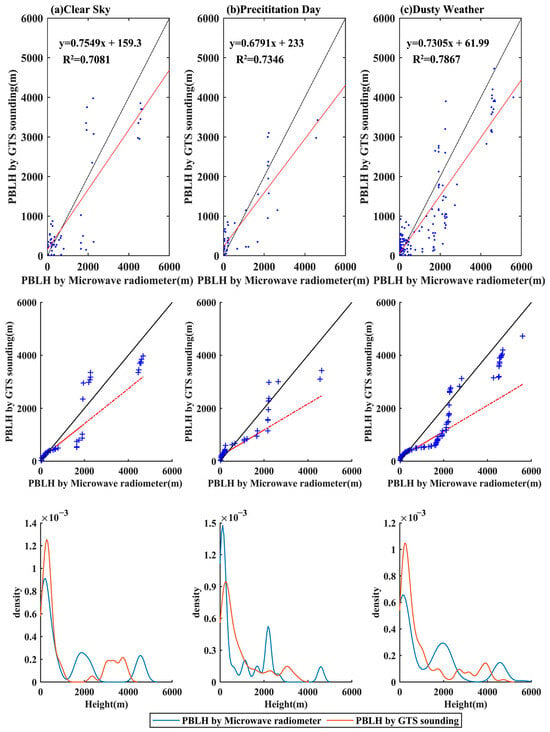
Figure 9.
Scatter plots, quantile–quantile plots, and probability density distributions of the planetary boundary layer height (PBLH) calculated by the microwave radiometer and GTS sounding, arranged according to (a) clear sky, (b) precipitation day, and (c) dusty weather. The plots also include regression lines (in red) and reference lines (in black) for comparison.
In the QQ plot (Figure 9), the samples’ effective height range is divided into three weather types: clear sky, precipitation day, and dusty weather. The distribution of the PBLH is closest to the 1:1 baseline for clear sky, followed by that for precipitation day, and then dusty weather. Under these three types of weather conditions, the results of the atmospheric boundary layer observations made by microwave radiometers are generally higher than those obtained through sounding observations. Under clear and dusty weather conditions, the distribution shows that the probability density of the atmospheric boundary layer observed via GTS sounding is higher than that for microwave radiometers at low altitudes and at 4000 m, while the observation results are the opposite on rainy days.
In order to evaluate the calculation results of boundary layer height under different weather conditions, linear fitting of the microwave radiometer and GTS sounding calculation PBLH was performed (Figure 9). Under different weather conditions, the fit of microwave radiometer and GTS radiosonde calculation results is high, and the determination coefficients R2 of dust weather, precipitation day, and clear sky are 0.7867, 0.7346, and 0.7081, respectively. The PBLH distributions under the three weather conditions all passed the significance test (p < 0.001), and the results were consistent with the PBLH calculation results of Huang Jun based on microwave radiometer and aerosol lidar [47].
4. Discussion
There has not been any research that compares and analyzes the accuracy of microwave radiometers observed at the MF station at the southern edge of the Taklimakan Desert. This study demonstrates that microwave radiometers are suitable for observations under different weather conditions in this area. In addition, they can also calculate the planetary boundary layer height (PBLH) within the effective height range.
The observation using the microwave radiometer has become a mature detection technique. Its advantages lie in being a passive remote sensing device, allowing for real-time, continuous, fully automated, all-weather detection. It provides higher temporal and spatial resolution atmospheric temperature and humidity sounding data, overcoming the limitations of traditional sounding observations. Its capability for independent operation has made it one of the important observational tools in atmospheric detection [38,48,49]. The results of the correlation between the microwave radiometer and GTS radiosonde as a whole and under different weather conditions show that the R2 is more than 0.85. According to the accuracy evaluation results, there is still some deviation between the microwave radiometer and GTS sounding results. According to the evaluation results of the microwave radiometer at different times, there is a significant difference between the observation error at 8:00 and the observation error at 20:00 in the lower atmosphere, which is mainly derived from the calculation of the secondary product of the MWP967KV microwave radiometer through the BP neural network model. The calculation accuracy is affected by the training sample, and the detection effect of the microwave radiometer is poor. There is also an error between the simulated microwave data and the radiosonde data, which leads to the backpropagation neural network model simulation results [50].
In the past, the focus in retrieving atmospheric boundary layer height was on different instruments for various regions. Typically, studies investigated the variation characteristics of atmospheric boundary layer height under different conditions, such as under urban air pollution in Northern China [51], Southwest China [52], and Southern China [53], and they conducted simulations of dust events using wind profiling lidar [1], haze processes using lidar [54], and high and low temperatures using the ERA5 dataset. No one has used a microwave radiometer to invert the height of the desert boundary layer. In this study, the simulation results using a microwave radiometer have similar results to those obtained by previous studies using other means to invert boundary layer in desert areas [31], which confirms the ability of the microwave radiometer used in this study to invert PBLH within the effective height. Simultaneously, we analyzed the results of PBLH retrieval using the microwave radiometer through practical examples of a dust event and a precipitation event. Figure 9 and Figure 10, respectively, depict the continuous time retrieval of PBLH using GTS sounding and the microwave radiometer at four time points in a day (02:00, 08:00, 14:00, and 20:00), displaying the entire sample range within that time period, including samples not meeting the effective retrieval height of the microwave radiometer. Individual instances of dust events occurred on 18–19 July (Figure 10) and a precipitation event occurred on 14 July (Figure 11). During the process, the PBLH calculated by the microwave radiometer and GTS sounding showed that, during clear sky periods before dust storms and precipitation events, the PBLH continued to rise. The changes in atmospheric boundary layer height before and during dust and precipitation events were clearly observed. During dust and precipitation events, the at the same height began to decrease, leading to a reduction in the atmospheric boundary layer height. In both dust and precipitation events, the retrieval of the atmospheric boundary layer height by the microwave radiometer in the southern edge of the Taklimakan Desert showed good consistency with the GTS sounding observations. During a dust storm, the PBLH significantly decreased compared to clear sky conditions. The reduction in diurnal variation of PBLH during dust events was due to the dust aerosols floating in the atmosphere reducing solar radiation reaching the surface, enhancing atmospheric scattering, reducing surface heating, weakening atmospheric effects, and inhibiting the increase in daytime PBLH. In contrast, during precipitation events, the increase in humidity and decrease in temperature due to precipitation led to enhanced atmospheric scattering, thereby inhibiting the increase in PBLH. The continuous retrieval of the atmospheric boundary layer height by the microwave radiometer exhibited a characteristic of initially rising and then decreasing. This is because the atmospheric boundary layer is the layer closest to the surface in the troposphere, where solar radiation received by the ground during the day is transported upwards in the form of sensible and latent heat through turbulent exchange, heating the air above. Conversely, radiation cooling of the surface at night gradually affects the atmosphere above it. This alternating process of heat transfer between day and night results in significant diurnal variations in temperature within the atmospheric boundary layer.
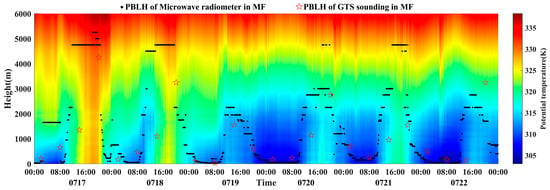
Figure 10.
Atmospheric boundary layer height variation under dusty conditions from 18 July to 19 July 2021.
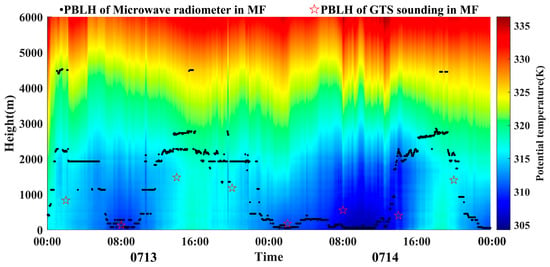
Figure 11.
Atmospheric boundary layer height variation during the precipitation process on 14 July 2021.
The limitations of this study are primarily related to the geographical and experimental constraints. Firstly, the MF station is located on the southern margin of the Taklimakan Desert, where rainfall events are infrequent. This scarcity of precipitation during the observation period restricts our ability to conduct a detailed evaluation of the microwave radiometer’s performance at different heights on rainy days.
Secondly, the vertical resolution of the microwave radiometer and the availability of training samples introduce challenges in accurately inverting the planetary boundary layer height (PBLH). Specifically, these factors lead to resolution breakpoint aggregations in the calculated PBLH, which hinder the precise retrieval of the atmospheric boundary layer.
Lastly, the verification of the microwave radiometer’s applicability in desert areas is limited by the restricted release times of the GTS sounding experiments. As a result, verification can only be performed during specific periods. To address these limitations, we recommend increasing the frequency of daily radiosonde experiments in future experimental designs. This enhancement would provide a more comprehensive dataset and improve the accuracy of our evaluations.
5. Conclusions
In this study, we collected microwave radiometer data from 24 April 2021 to 31 August 2021 at MF Station in Minfeng County, on the south edge of the Taklimakan Desert. At the same time, we are also supported by the GTS sounding observation experiment carried out by the National Meteorological Bureau in Minfeng County in the same period. In order to verify the accuracy of the observation results of the microwave radiometer and to analyze the applicability of the microwave radiometer in the Minfeng area, the T value observed by the microwave radiometer, the value, and the calculated q value as well as the calculation results of the atmospheric boundary layer height of the two devices were compared and analyzed, and the following conclusions were obtained:
- (1)
- The comparison between microwave radiometer and radiosonde shows that it had good applicability in sunny, rainy, and dusty weather conditions. In sandstorm weather, the best observation result of T was obtained by the microwave radiometer, with an R2 of 0.992. The accuracy of q and was the highest under the sand blowing condition, with R2 values of 0.9334 and 0.9452.
- (2)
- When the relative humidity was 0–10%, the detection temperature of the microwave radiometer was the best, and its R2 was 0.9819. When RH was 70–80%, the best results were obtained from q and , and the R2 values were 0.963 and 0.9777, respectively.
- (3)
- The comparison of the effective results of the temperature observed by the microwave radiometer and the FY–4A satellite showed that there was a good correlation between different months, in which the temperature observed in May had the best correlation, and the R2 was 0.9142.
- (4)
- The effective calculation height of the microwave radiometer was better in sunny, rainy, and dusty weather, and the R2 values were 0.7801, 0.7346, and 0.7867, respectively.
These results demonstrate the good applicability of the microwave radiometer in desert regions. By evaluating the observational accuracy of the microwave radiometer at the southern edge of the Taklamakan Desert, this study provides a reference for numerical simulation and environmental management.
Author Contributions
Conceptualization, J.G. (Jiawei Guo) and A.M.; methodology, J.G. (Jiawei Guo) and M.S.; software, Y.W.; validation, J.L., J.P., and J.G. (Jiacheng Gao); formal analysis, F.Y., C.Z., and W.H.; data curation, J.G. (Jiacheng Gao) and A.A.; resources, A.M.; writing—original draft preparation, J.G. (Jiawei Guo); writing—review and editing, C.W., A.M., and Y.X.; visualization, J.G. (Jiawei Guo) and H.S.; supervision, Y.W.; project administration, A.M.; funding acquisition, M.S., Y.W., and A.M. All authors have read and agreed to the published version of the manuscript.
Funding
This work was supported in part by Natural Science Youth Fund of the Autonomous Region, grant number: 2022D01B229; Tianshan Talents Cultivation Program—Young Talent Elevation Special Project, grant number: 2025TSYCQNTJ (WangYu); the 2024 Detection Center Observation Test Program Project, grant number: GCSYJH24-01, GCSYJH24-11, GCSYJH24-18; Xinjiang Meteorological Bureau guided program project, grant number: YD2024046; the Youth Innovation Team of China Meteorological Administration, grant number: CMA2024QN13, CMA2023QN11; the Xinjiang Key Laboratory of Desert Meteorology and Sandstorms Award Funding: Grant number: 2023-38; the National Natural Science Foundation of China: 42375084, 42030612.
Data Availability Statement
The data used in this paper will be provided by A.M. (ali@idm.cn) upon request.
Acknowledgments
The authors would like to acknowledge the GTS sounding data support provided by Minfeng County Meteorological Bureau, Hotan.
Conflicts of Interest
The authors declare there are no conflicts of interest.
References
- Song, M.; Wang, Y.; Mamtimin, A.; Gao, J.; Aihaiti, A.; Zhou, C.; Yang, F.; Huo, W.; Wen, C.; Wang, B. Applicability Assessment of Coherent Doppler Wind LiDAR for Monitoring during Dusty Weather at the Northern Edge of the Tibetan Plateau. Remote Sens. 2022, 14, 5264. [Google Scholar] [CrossRef]
- Temimi, M.; Fonseca, R.; Nelli, N.; Valappil, V.; Weston, M.; Thota, M.; Wehbe, Y.; Yousef, L. On the analysis of ground-based microwave radiometer data during fog conditions. Atmos. Res. 2020, 231, 104652. [Google Scholar] [CrossRef]
- Zhao, L.; Ma, Y.; Zhang, G.; Yang, L. The detection principle and error analysis of MP-3000A microwave radiometer. Desert Oasis Meteorol. 2009, 3, 54–57. [Google Scholar]
- Cimini, D.; Campos, E.; Ware, R.; Albers, S.; Giuliani, G.; Oreamuno, J.; Joe, P.; Koch, S.; Cober, S.; Westwater, E. Thermodynamic Atmospheric Profiling During the 2010 Winter Olympics Using Ground-Based Microwave Radiometry. IEEE Trans. Geosci. Remote Sens. 2011, 49, 4959–4969. [Google Scholar] [CrossRef]
- Cimini, D.; Nelson, M.; Güldner, J.; Ware, R. Forecast indices from a ground-based microwave radiometer for operational meteorology. Atmos. Meas. Tech. 2015, 8, 315–333. [Google Scholar] [CrossRef]
- Pan, Y.; Lei, L.; Li, Q.; Jiang, S.; Wang, Z. Analysis on the solar influence to brightness temperatures observed with a ground-based microwave radiometer. J. Atmos. Sol. Terr. Phys. 2021, 222, 105725. [Google Scholar] [CrossRef]
- Qi, Y.; Fan, S.; Li, B.; Mao, J.; Lin, D. Assimilation of Ground-Based Microwave Radiometer on Heavy Rainfall Forecast in Beijing. Atmosphere 2022, 13, 74. [Google Scholar] [CrossRef]
- Liu, M.; Liu, Y.; Shu, J. Characteristics Analysis of the Multi-Channel Ground-Based Microwave Radiometer Observations during Various Weather Conditions. Atmosphere 2022, 13, 1556. [Google Scholar] [CrossRef]
- Boudala, F.S.; Gultepe, I.; Milbrandt, J.A. The Performance of Commonly Used Surface-Based Instruments for Measuring Visibility, Cloud Ceiling, and Humidity at Cold Lake, Alberta. Remote Sens. 2021, 13, 5058. [Google Scholar] [CrossRef]
- Hall, G.E. Measurement of atmospheric liquid water by a ground-based single-frequency microwave radiometer. J. Atmos. Ocean. Technol. 2009, 8, 685–690. [Google Scholar] [CrossRef]
- Liu, G.; Liu, C.; Kuo, T. Rainfall intensity estimation by ground-based dual-frequency microwave radiometers. J. Appl. Meteorol. 2001, 40, 1035–1041. [Google Scholar] [CrossRef]
- Chan, P. Performance and application of a multi-wavelength, ground-based microwave radiometer in intense convective weather. Meteorol. Z. 2009, 18, 253–265. [Google Scholar] [CrossRef]
- Mengying, W.; Yansong, B.; Jiajia, M.; Heng, Z.; Wenbin, L. Research on bias analysis and correction of temperature and humidity data with ground-based microwave radiometer. Torrential Rain Disasters 2023, 42, 467–478. [Google Scholar] [CrossRef]
- Fang, S.; Haojie, H.; Yudu, Z.; Min, X.; Xianghan, Z. Evaluation and analysis of retrieval products of atmospheric temperature and humidity profiles from ground-based microwave radiometer in Langfang. J. Mar. Meteorol. 2023, 43, 71–83. [Google Scholar] [CrossRef]
- Chakraborty, R.; Das, S.; Jana, S.; Maitra, A. Nowcasting of rain events using multi-frequency radiometric observations. J. Hydrol. 2014, 513, 467–474. [Google Scholar] [CrossRef]
- Jianping, H.; Min, H.; Hongru, Y.; Beidou, Z.; Jianrong, B.; Qinjian, J. A Study of Liquid Water Path and Precipitable Water Vapor in Lanzhou Area Using Ground-Based Microwave Radiometer. Chin. J. Atmos. Sci. 2010, 34, 548–558. [Google Scholar]
- Zeng, Y.; Yang, L. Analysis on Mesoscale Impact System and Atmospheric Vertical Structure of Two Types of Heavy Rains in Urumqi. Plateau Meteorol. 2020, 39, 774–787. [Google Scholar]
- Yang, P.; Xia, J.; Chen, Y.; Zhang, Y.; Li, Z.; Zhang, S.; Wang, W. Dynamic evolution of recent droughts in Central Asia based on microwave remote sensing satellite products. J. Hydrol. 2023, 620, 129497. [Google Scholar] [CrossRef]
- Chen, W.; Kuze, H.; Uchiyama, A.; Suzuki, Y.; Takeuchi, N. One-year observation of urban mixed layer characteristics at Tsukuba, Japan using a micro pulse lidar. Atmos. Environ. 2001, 35, 4273–4280. [Google Scholar] [CrossRef]
- Kim, S.; Yoon, S.; Kim, J.; Kang, J.; Sugimoto, N. Asian dust event observed in Seoul, Korea, during 29–31 May 2008: Analysis of transport and vertical distribution of dust particles from lidar and surface measurements. Sci. Total Environ. 2010, 408, 1707–1718. [Google Scholar] [CrossRef]
- Guo, B.; Liu, L.; Huang, D.; Wang, L.; Li, X. Analysis of Lidar Measurements from a Dust Event. Meteorol. Mon. 2008, 34, 52–57. [Google Scholar]
- Dong, L.; Fudi, Q.; Chuanjia, J.; Guming, Y.; Jun, Z. Polarization Lidar Observations of Cirrus Clouds and Asian Dust Aerosols over Hefei. Chin. J. Atmos. Sci. 2003, 27, 1093–1100. [Google Scholar]
- Xie, C.; Nishizawa, T.; Sugimoto, N.; Matsui, I.; Wang, Z. Characteristics of aerosol optical properties in pollution and Asian dust episodes over Beijing, China. Appl. Opt. 2008, 47, 4945–4951. [Google Scholar] [CrossRef]
- Dong, X.; Qi, H.; Ren, L.; Wang, Y.; Di, Y.; Chen, Y.; Sugimoto, N.; Sakamoto, K.; Wang, Q. Application and Data Demonstration of Application and Data Demonstration of Lidar in Sandstorm Observation. Res. Environ. Sci. 2007, 20, 106–111. [Google Scholar]
- Yanpeng, W.; Yan, C.; Xuhui, D.; Huimin, Y. Observation of Sand-Dust Weather by Lidar in the Spring of 2005 at Beijing. Chin. J. Spectrosc. Lab. 2008, 25, 265–267. [Google Scholar] [CrossRef]
- Yang, T.; Wang, Z.; Zhang, B.; Wang, X.; Wang, W.; Gbauidi, A.; Gong, Y. Evaluation of the effect of air pollution control during the Beijing 2008 Olympic Games using Lidar data. Chin. Sci. Bull. 2010, 55, 1311–1316. [Google Scholar] [CrossRef]
- Li, S.; Li, X.; Deng, Z.; Xia, X.; Ren, G.; An, D.; Ayikan, M.; Zhong, Y. Characteristics of atmospheric boundary layer and its relation with PM2.5 during winter in Shihezi, an Oasis city in Northwest China. Atmos. Pollut. Res. 2023, 14, 101902. [Google Scholar] [CrossRef]
- Kumar, M.; Mallik, C.; Kumar, A.; Mahanti, N.C.; Shekh, A.M. Evaluation of the boundary layer depth in semi-arid region of India. Dyn Atmos. Ocean. 2010, 49, 96–107. [Google Scholar] [CrossRef]
- Nakamae, K.; Takemi, T. Relationship between the development of a convective mixed layer and dust weather in arid and semi-arid regions of East Asia. Int. J. Clim. 2022, 42, 3076–3093. [Google Scholar] [CrossRef]
- Wang, Y.; Gao, J.; Mamtimin, A.; Sayit, H.; Zhou, C.; Li, R.; Dawut, M.; Yang, F.; Huo, W.; Wen, C.; et al. Evolution law of atmospheric boundary layer in Gurbantünggüt Desert based on reanalysis dataset and in situ observation data. Heliyon 2023, 9, e14147. [Google Scholar] [CrossRef]
- Zhang, J.; Wang, M.; He, Q.; Wang, Y.; Pan, H.; Zhang, Z. Comparative analysis of atmospheric boundary layer sunny day and sandstorm in the hinterland of Taklimakan Desert. Desert Oasis Meteorol. 2024, 18, 50–58. [Google Scholar] [CrossRef]
- Sheng, P.; Mao, Z.; Li, J.; Ge, Z.; Zhang, A.; Sang, J.; Pai, N.; Zhang, H.S. Atmospheric Physics, 2nd ed.; Peking University Press: Beijing, China, 2013. [Google Scholar]
- Yang, F. Comparison of Determination Methods and Characteristics of Boundary Layer Height in Semi-Arid Area. Ph.D. Thesis, Lanzhou University, Lanzhou, China, 2018. [Google Scholar]
- Liu, S.; Liang, X. Observed Diurnal Cycle Climatology of Planetary Boundary Layer Height. J. Clim. 2010, 23, 5790–5809. [Google Scholar] [CrossRef]
- Yin, R.; Han, W. Impact of Targeted Sounding Observations From FY-4B GIIRS on Two Super Typhoon Forecasts in 2024. IEEE Trans. Geosci. Remote Sens. 2024, 22, 5500805. [Google Scholar] [CrossRef]
- Zhang, X.; Sun, L.; Ma, X.; Guo, H.; Gong, Z.; Yan, X. Can the Assimilation of the Ascending and Descending Sections’ Data from Round-Trip Drifting Soundings Improve the Forecasting of Rainstorms in Eastern China? Atmosphere 2023, 14, 1127. [Google Scholar] [CrossRef]
- Zhou, Y.; Yuan, Y.; Yang, L.; Wang, J.; Yan, X. Bias analysis of retrieval profile of temperature with microwave radiometer in clear sky. Torrential Rain Disasters 2022, 41, 720–726. [Google Scholar] [CrossRef]
- Cao, M.; Wang, B.; Yang, Z.; Zhang, Y. Comparison Analysis of Ground-Based Microwave Radiometer and Radiosonde Data. J. Shaanxi Meteorol. 2021, 47–54. [Google Scholar] [CrossRef]
- Fu, X.; Peng, J.; Wang, X.; Zhang, Y.; Chen, Z.; Wu, J.; Xue, H.; Chen, H. Comprehensive Analysis on Accuracy of Ground-Based Microwave Radiometer Measurements. Meteorol. Mon. 2023, 49, 1235–1245. [Google Scholar] [CrossRef]
- Zhou, B.; Zhu, L.; Wu, H.; Dong, Z.; Wang, X.; Luo, Y. Accuracy of Atmospheric Profiles Retrieved from Microwave Radiometer and Its Application to Precipitation Forecast. J. Appl. Meteorol. Sci. 2023, 34, 717–728. [Google Scholar] [CrossRef]
- Wang, Z.; Zhang, X.; Mao, J.; Wang, Z. Comparison analysis on detection performance of ground-based microwave radiometers under different weather conditions. J. Appl. Meteorol. Sci. 2018, 29, 282–295. [Google Scholar] [CrossRef]
- Wang, W.; Lei, H.; Nie, H.; Wang, Z.; Guo, X. A study on channel saturation of atmospheric water vapor detection based on airborne microwave radiometer. Acta Meteorol. Sin. 2021, 79, 509–520. [Google Scholar] [CrossRef]
- Zhang, W.; Xu, G.; Liao, K.; Lu, Y.; Zhu, W.; Feng, G. Impact of precipitation on the retrieval deviation of ground-based microwave radiometer. Torrential Rain Disasters 2013, 32, 70–76. [Google Scholar] [CrossRef]
- Ma, Y.; Liu, J.; Mamtimin, A.; Aihaiti, A.; Xu, L. Validation of FY-4A Temperature Profiles by Radiosonde Observations in Taklimakan Desert in China. Remote Sens. 2023, 15, 2925. [Google Scholar] [CrossRef]
- Wang, J.; Liao, Q.; Yan, S.; Wang, Y.; Xiang, J. Determining of atmospheric boundary layer heights and its applications to numerical weather prediction models. Torrential Rain Disasters 2022, 41, 515–524. [Google Scholar] [CrossRef]
- Zhang, H.; Zhang, X.; Li, Q.; Cai, X.; Fan, S.; Song, Y.; Hu, F.; Che, H.; Quan, J.; Kang, L.; et al. Research progress on estimation of atmospheric boundary layer height. Acta Meteorol. Sin. 2020, 78, 522–536. [Google Scholar] [CrossRef]
- Huang, J.; Liao, B.; Shen, Z.; Zhang, Z.; Lan, J.; Wang, C. Research and application of boundary layer height based on microwave radiometer and aerosol lidar. J. Trop. Meteorol. 2022, 38, 180–192. [Google Scholar] [CrossRef]
- Cao, M.; Wang, B.; Ren, D.; Yang, Y.; Bai, S. Analysis of the Low-Level Atmospheric Inversion Detection Capability of Ground-Based Microwave Radiometers. J. Shaanxi Meteorol. 2022, 70–75. [Google Scholar]
- Wang, W.; Wang, R.; Lei, L.; Fan, C.; Li, G. Distribution characteristics of atmospheric vapor and liquid water in central Guanzhong Plain based on observation data of ground-based microwave radiometer. J. Arid. Meteorol. 2023, 41, 774–782. [Google Scholar] [CrossRef]
- Bao, Y.; Cai, X.; Qian, C.; Min, J.; Lu, Q.; Zuo, Q. 0-10 km temperature and humidity profiles retrieval from ground-based microwave radiometer. J. Trop. Meteorol. 2016, 32, 163–171. [Google Scholar]
- Zhang, C.; Jiang, Z.; Liu, M.; Dong, Y.; Li, J. Relationship between summer time near-surface ozone concentration and planetary boundary layer height in Beijing. Atmos. Res. 2023, 293, 106892. [Google Scholar]
- Zhao, P.; Duan, S.; Shi, J.; Luo, C.; Zhang, J.; Zhong, M.; Li, S.; Chen, J. Analysis on the evolution of atmospheric boundary layer in Yunnan province and its effect on the change of PM2.5 concentration. Progress. Inquisitiones De. Mutat. Clim. 2023, 19, 278–292. [Google Scholar]
- Song, L.; Deng, T.; Li, Z.; Wu, C.; He, G.; Li, F.; Wu, M.; Wu, D. Retrieval of Boundary Layer Height and Its Influence on PM2.5 Concentration Based on Lidar Observation over Guangzhou. J. Trop. Meteorol. 2022, 27, 303–318. [Google Scholar] [CrossRef]
- Song, L.; Deng, T.; Wu, D.; He, G.; Sun, J.; Weng, J.; Cheng, W. Study on planetary boundary layer height in a typical haze period and different weather types over Guangzhou. Acta Sci. Circumstantiae 2019, 29, 1381–1391. [Google Scholar]
Disclaimer/Publisher’s Note: The statements, opinions and data contained in all publications are solely those of the individual author(s) and contributor(s) and not of MDPI and/or the editor(s). MDPI and/or the editor(s) disclaim responsibility for any injury to people or property resulting from any ideas, methods, instructions or products referred to in the content. |
© 2025 by the authors. Licensee MDPI, Basel, Switzerland. This article is an open access article distributed under the terms and conditions of the Creative Commons Attribution (CC BY) license (https://creativecommons.org/licenses/by/4.0/).