
Creation of ICESat-2 Footprint Level Global Geodetic Control Points Using Crossover Analysis


Abstract
1. Introduction
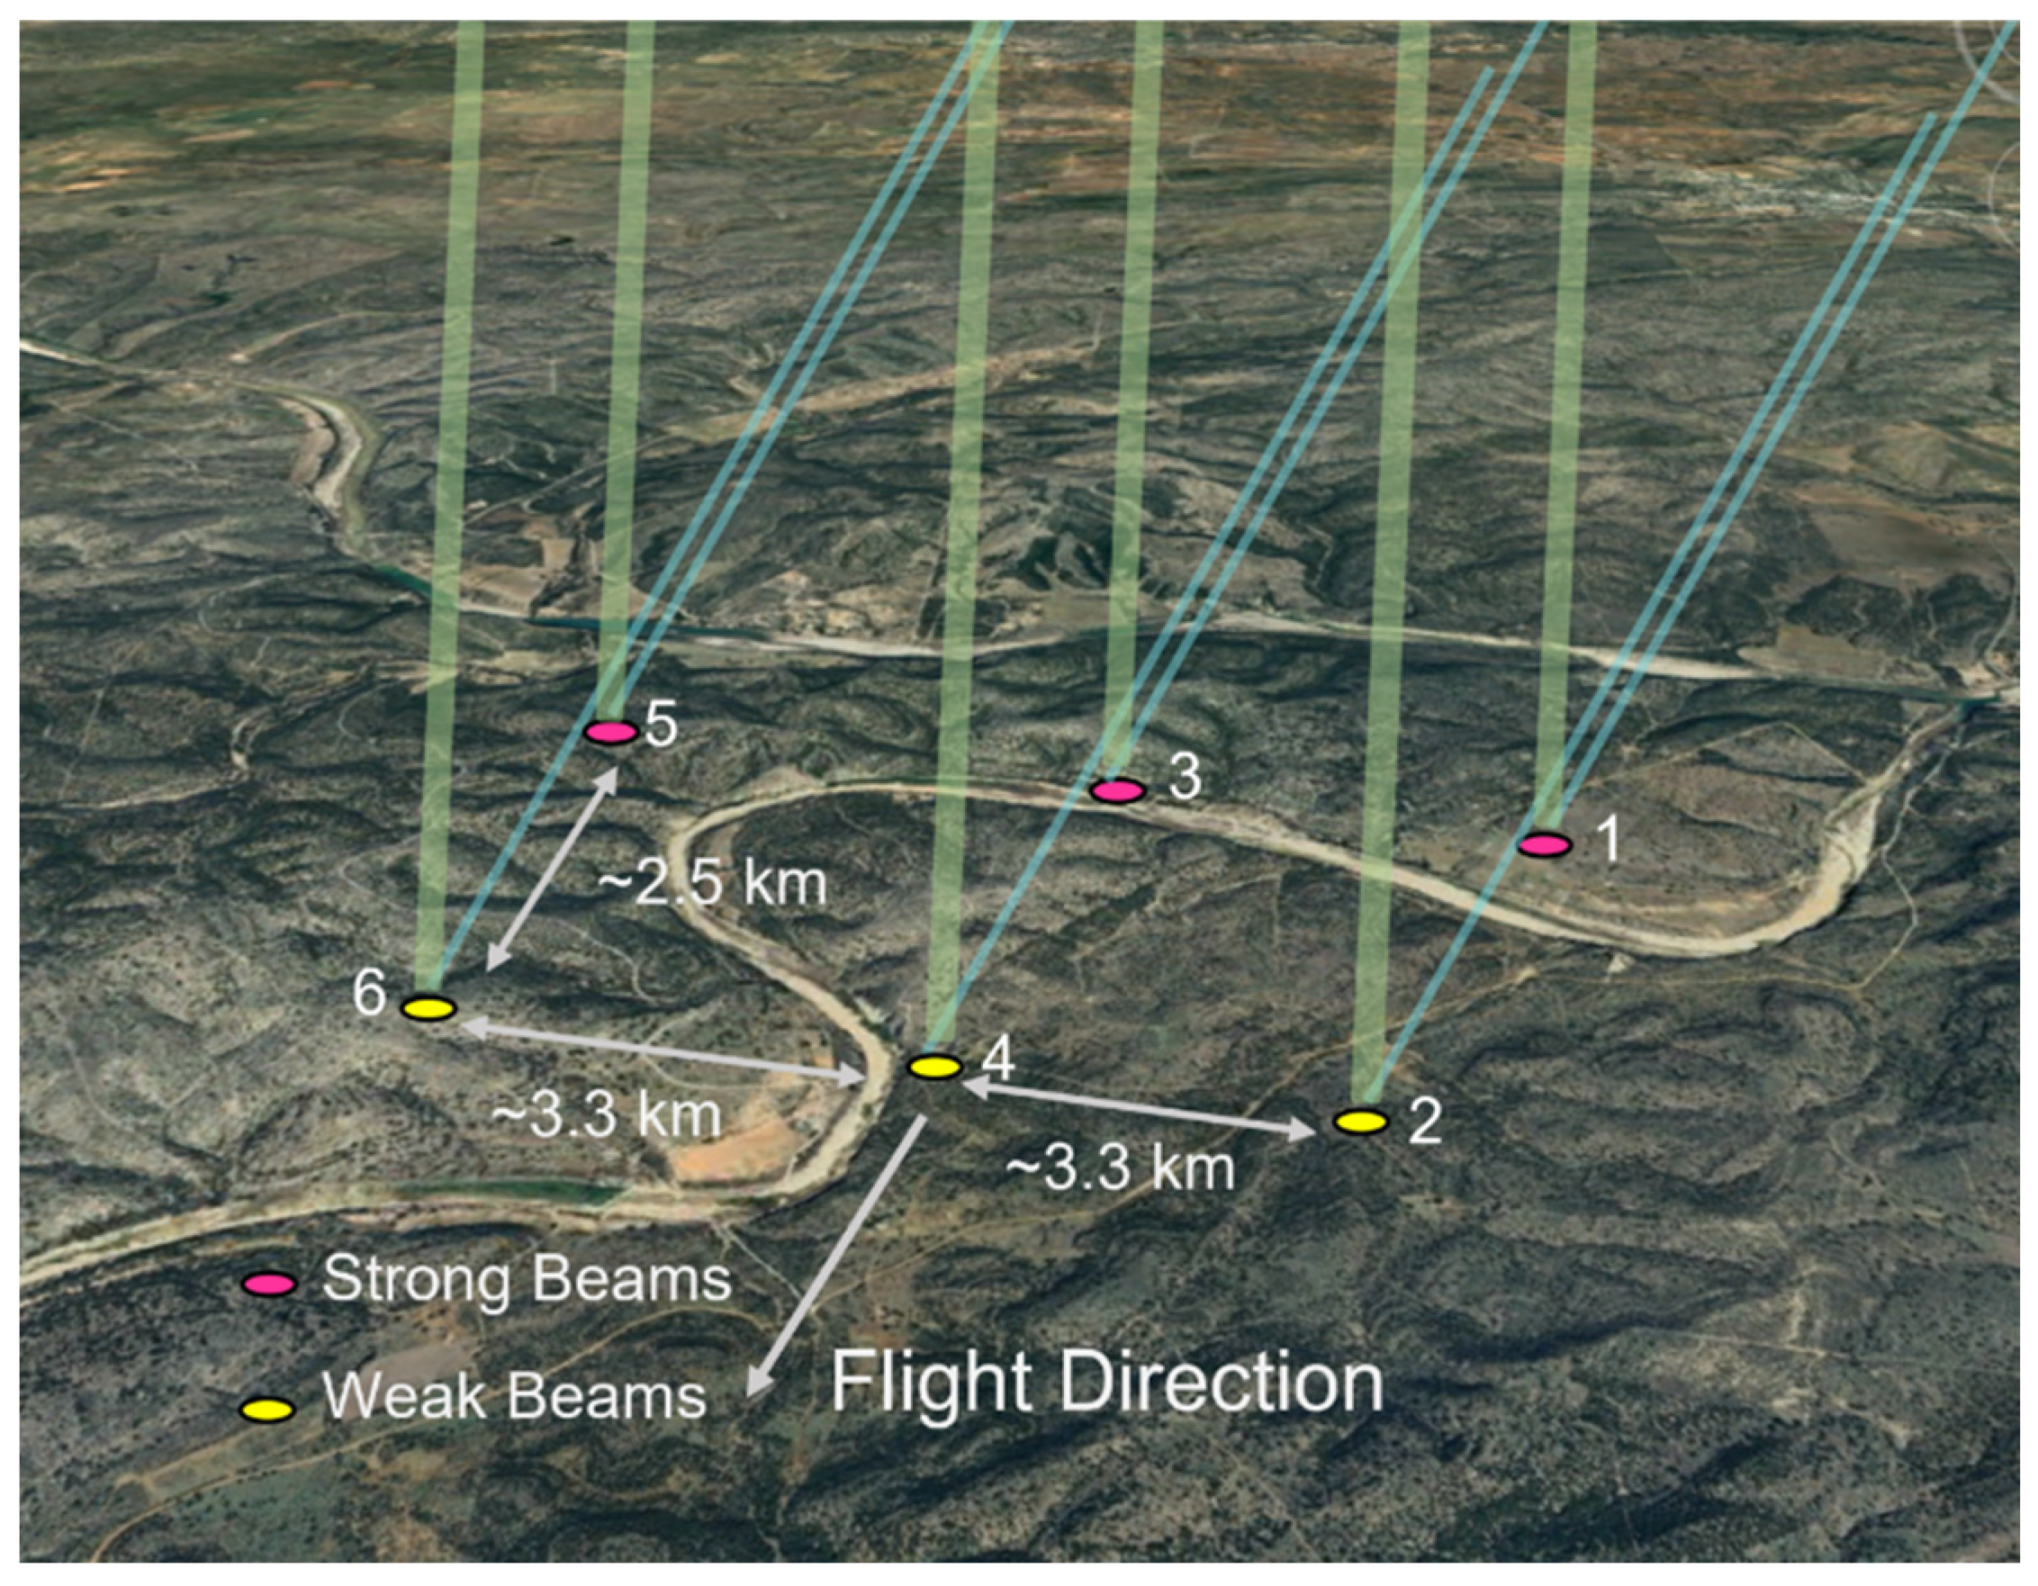
ICESat-2
2. Materials and Methods
2.1. Reference Data
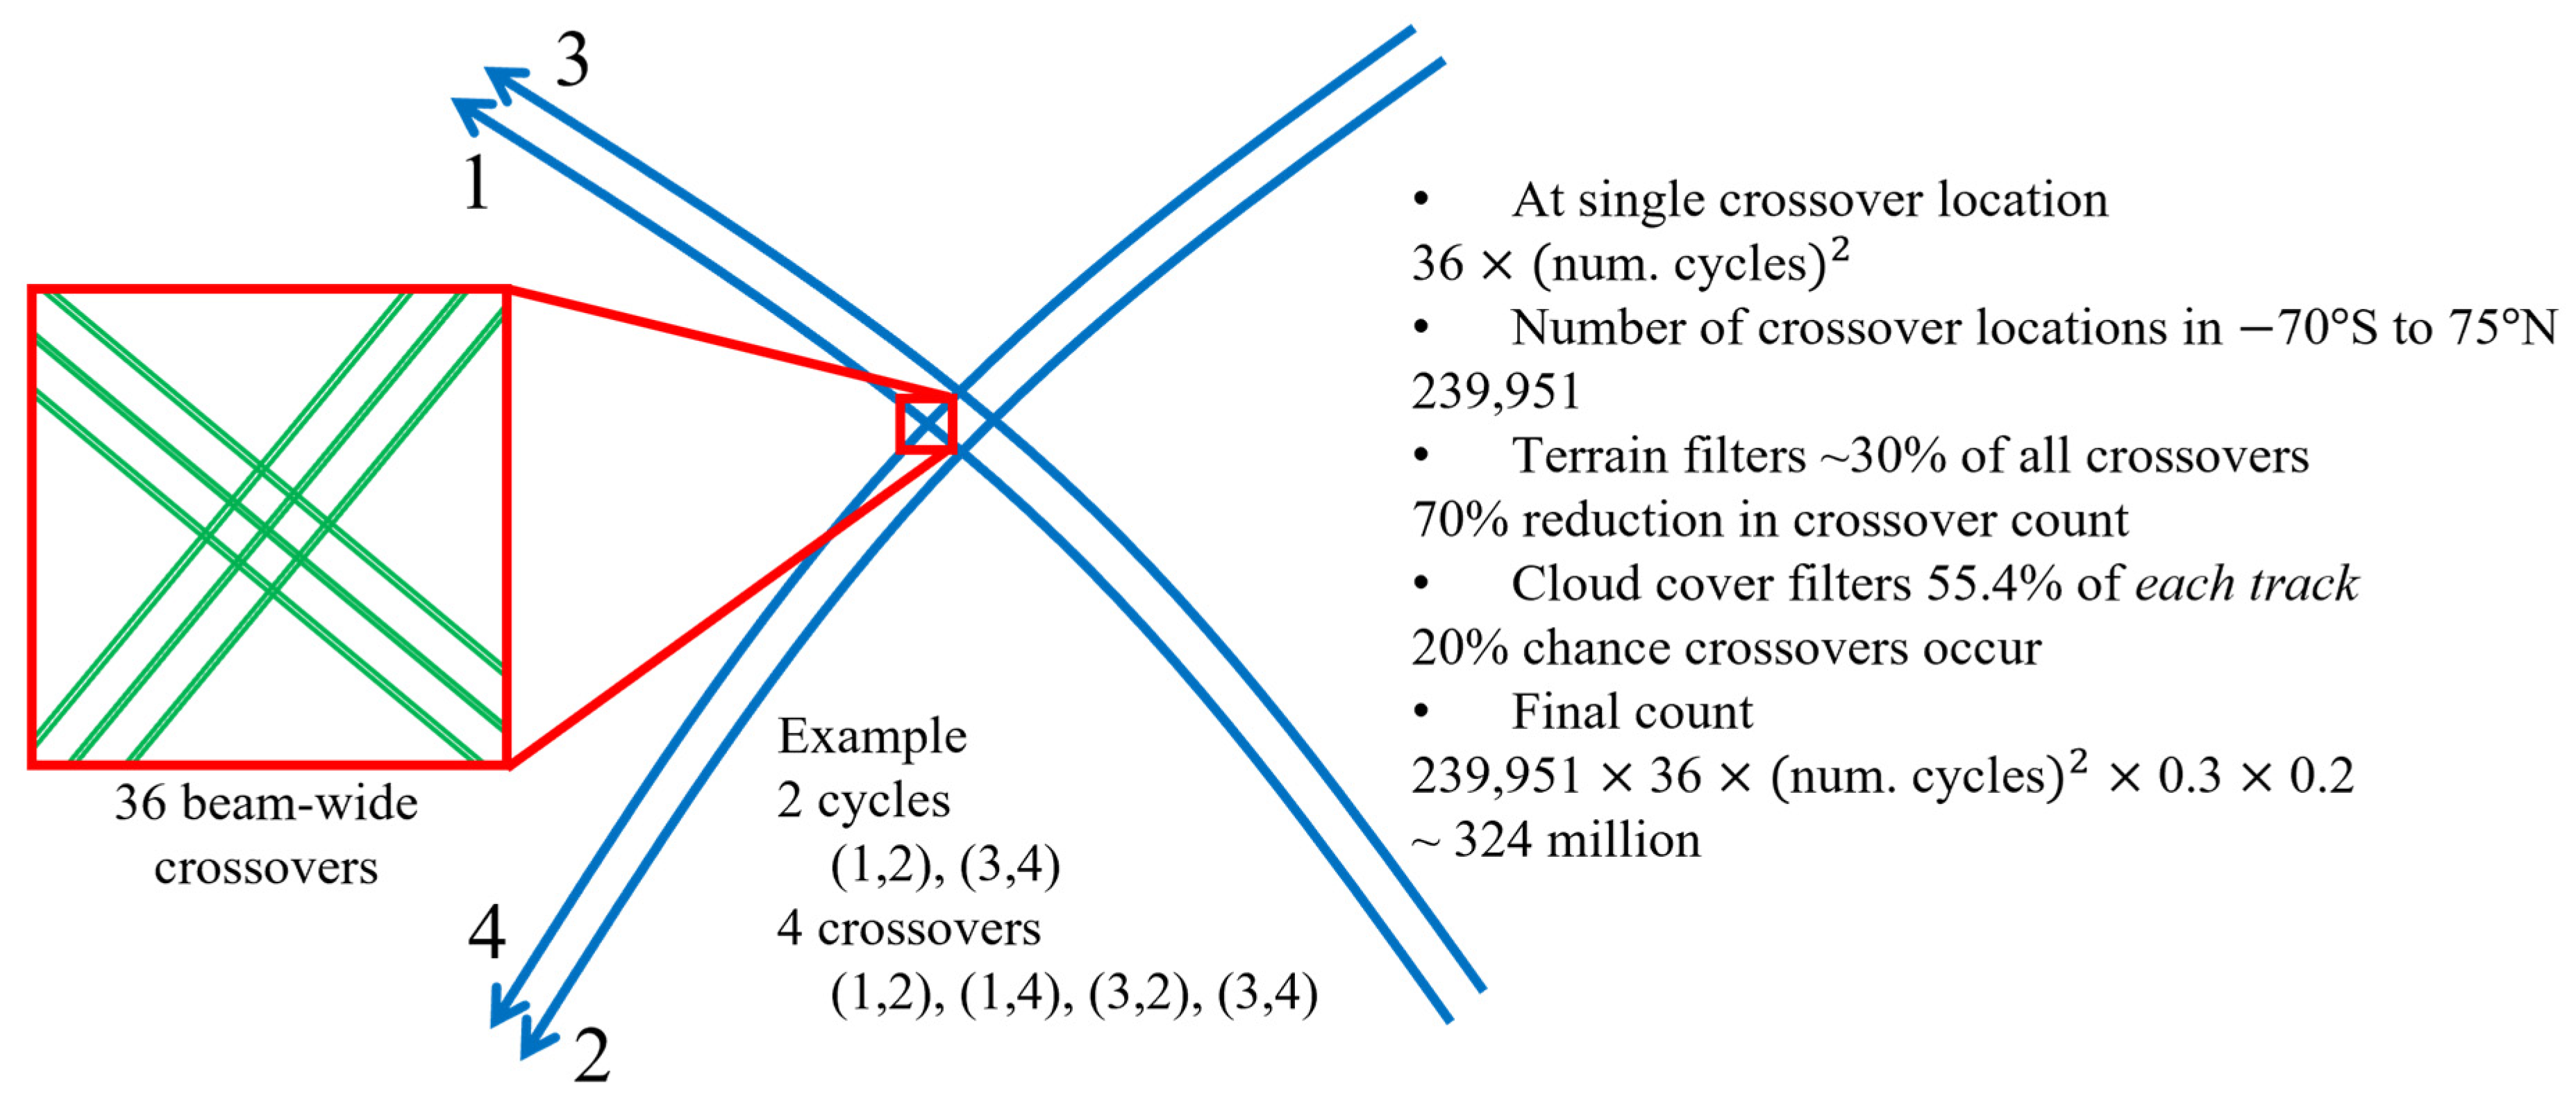
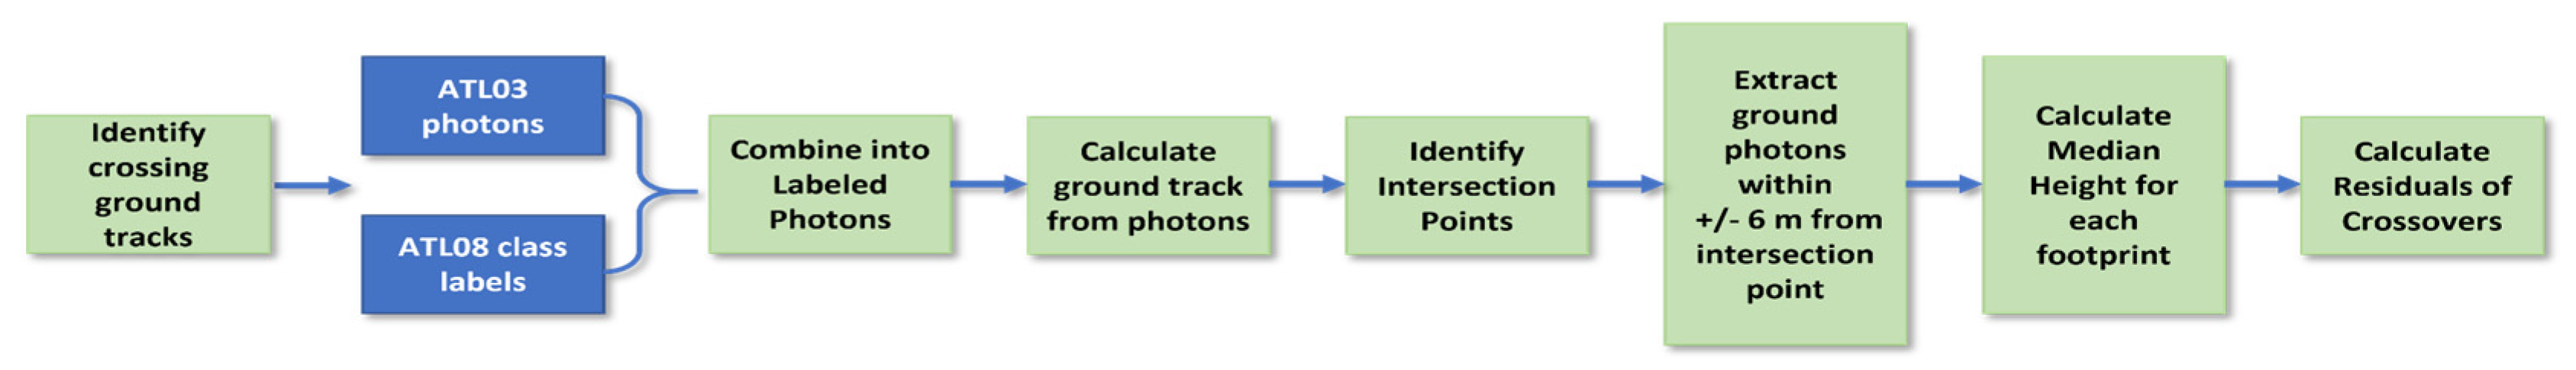
2.2. Methodology
3. Results
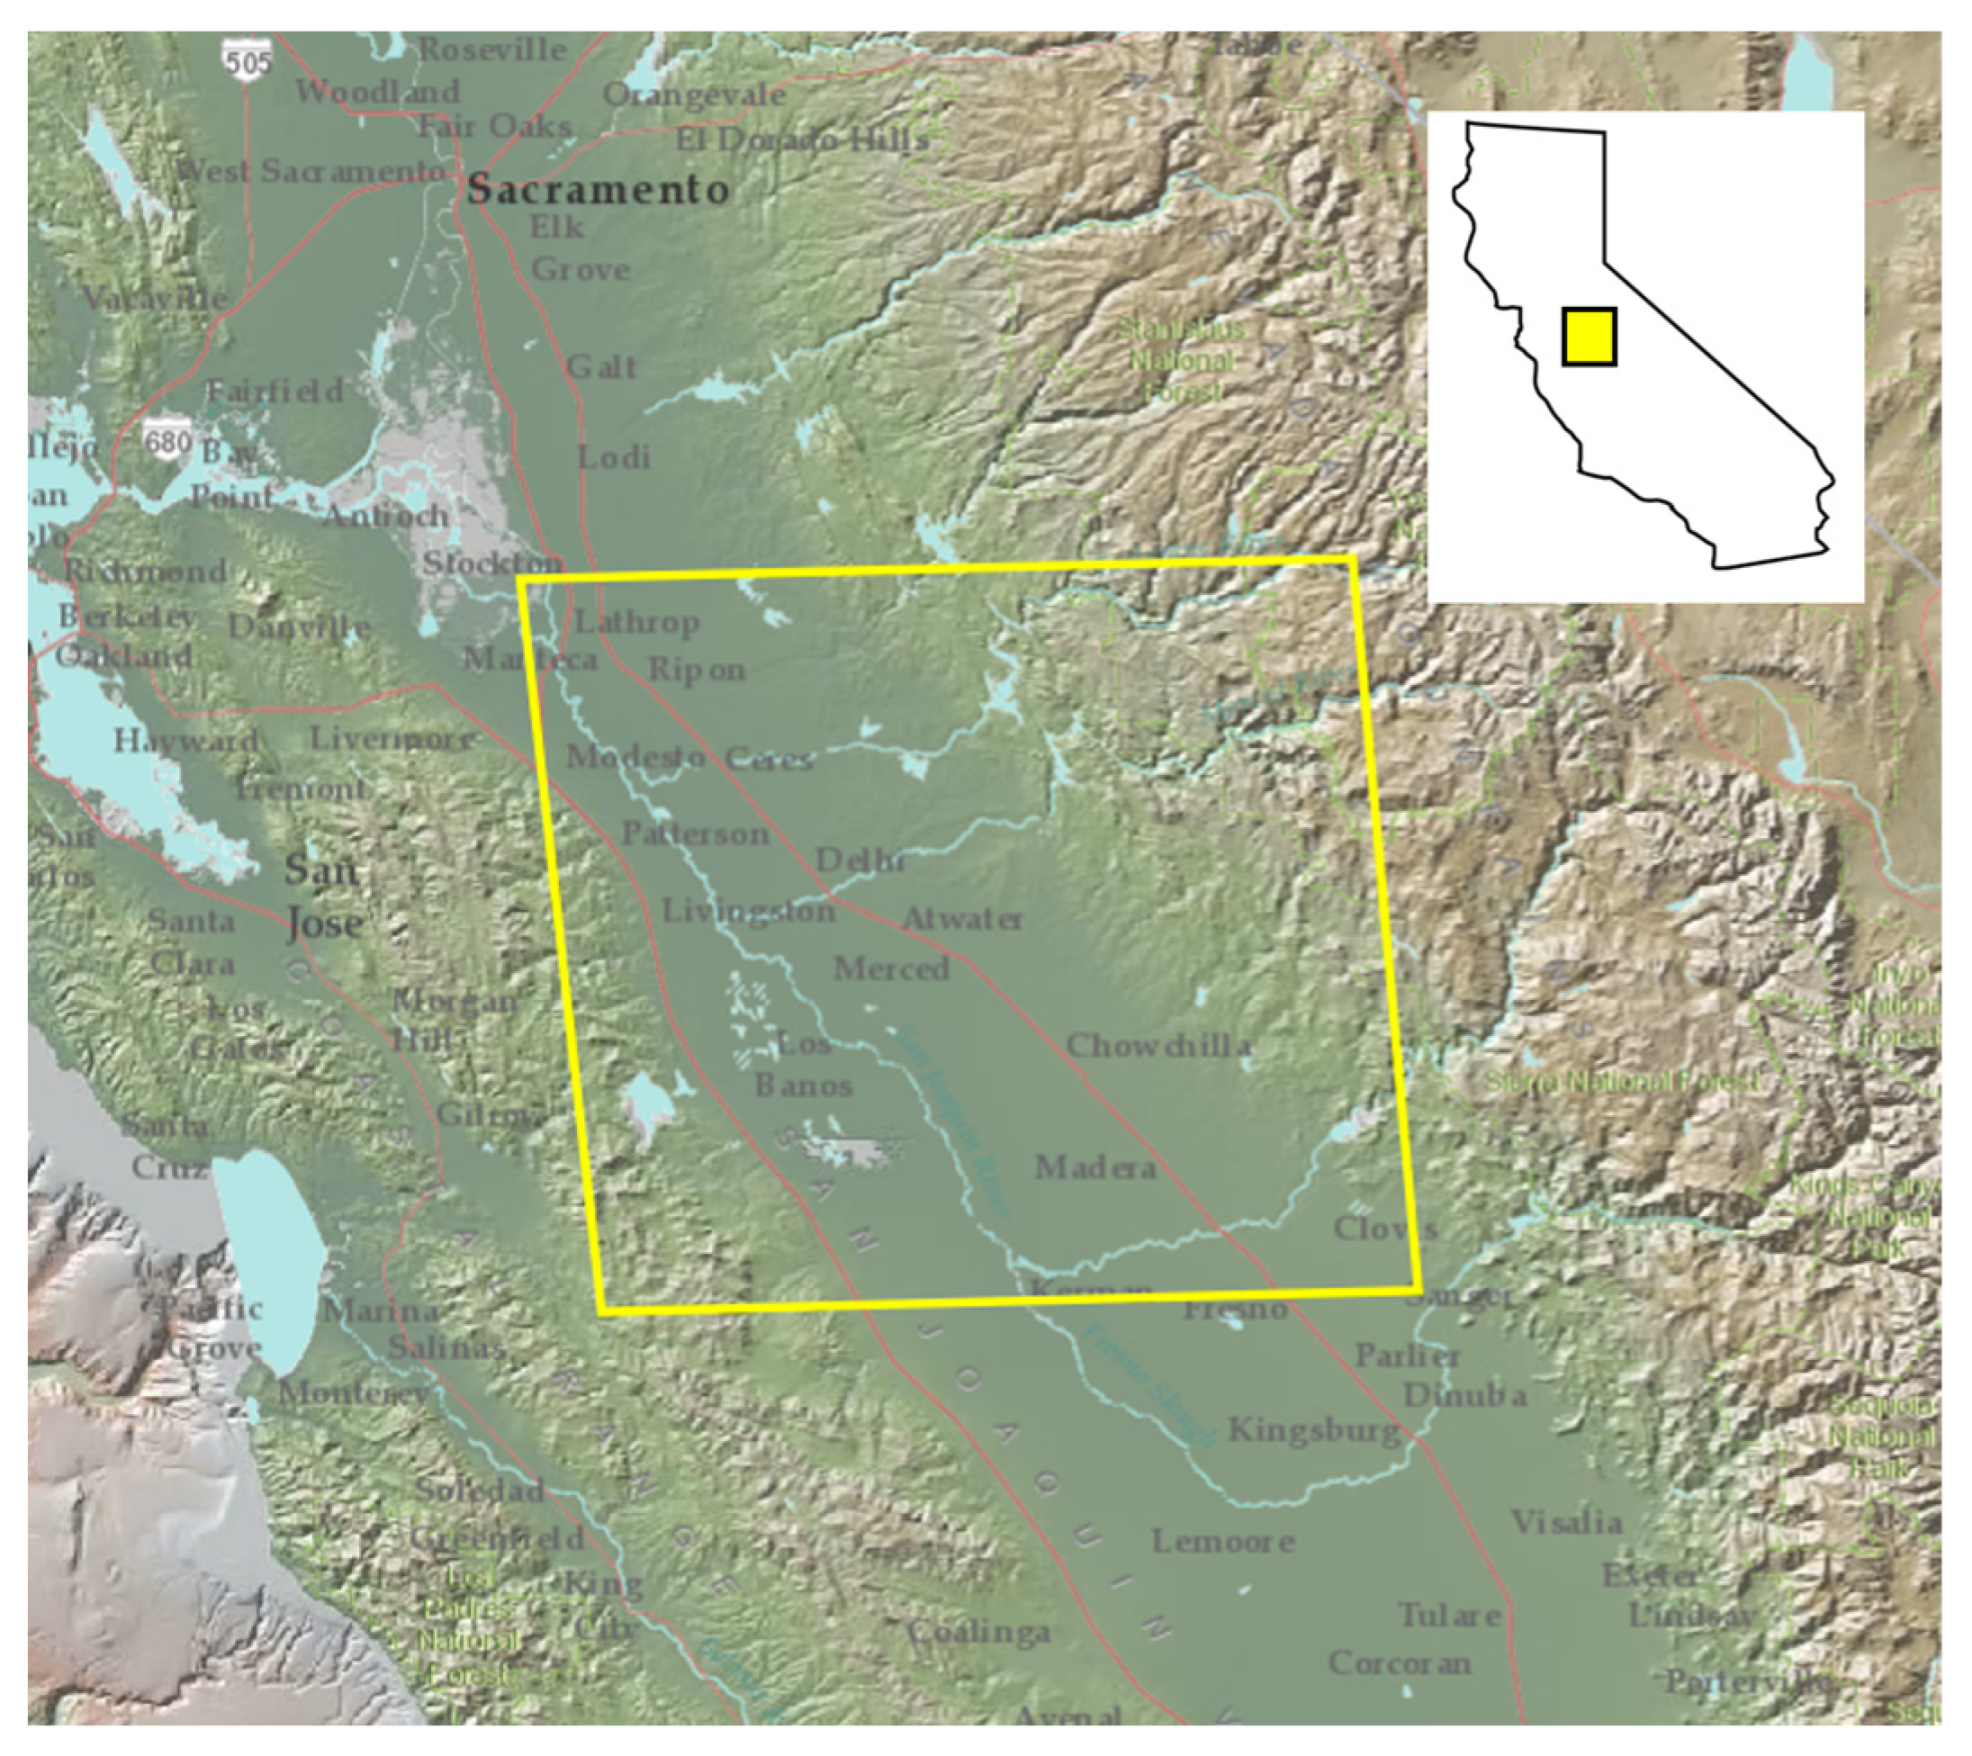
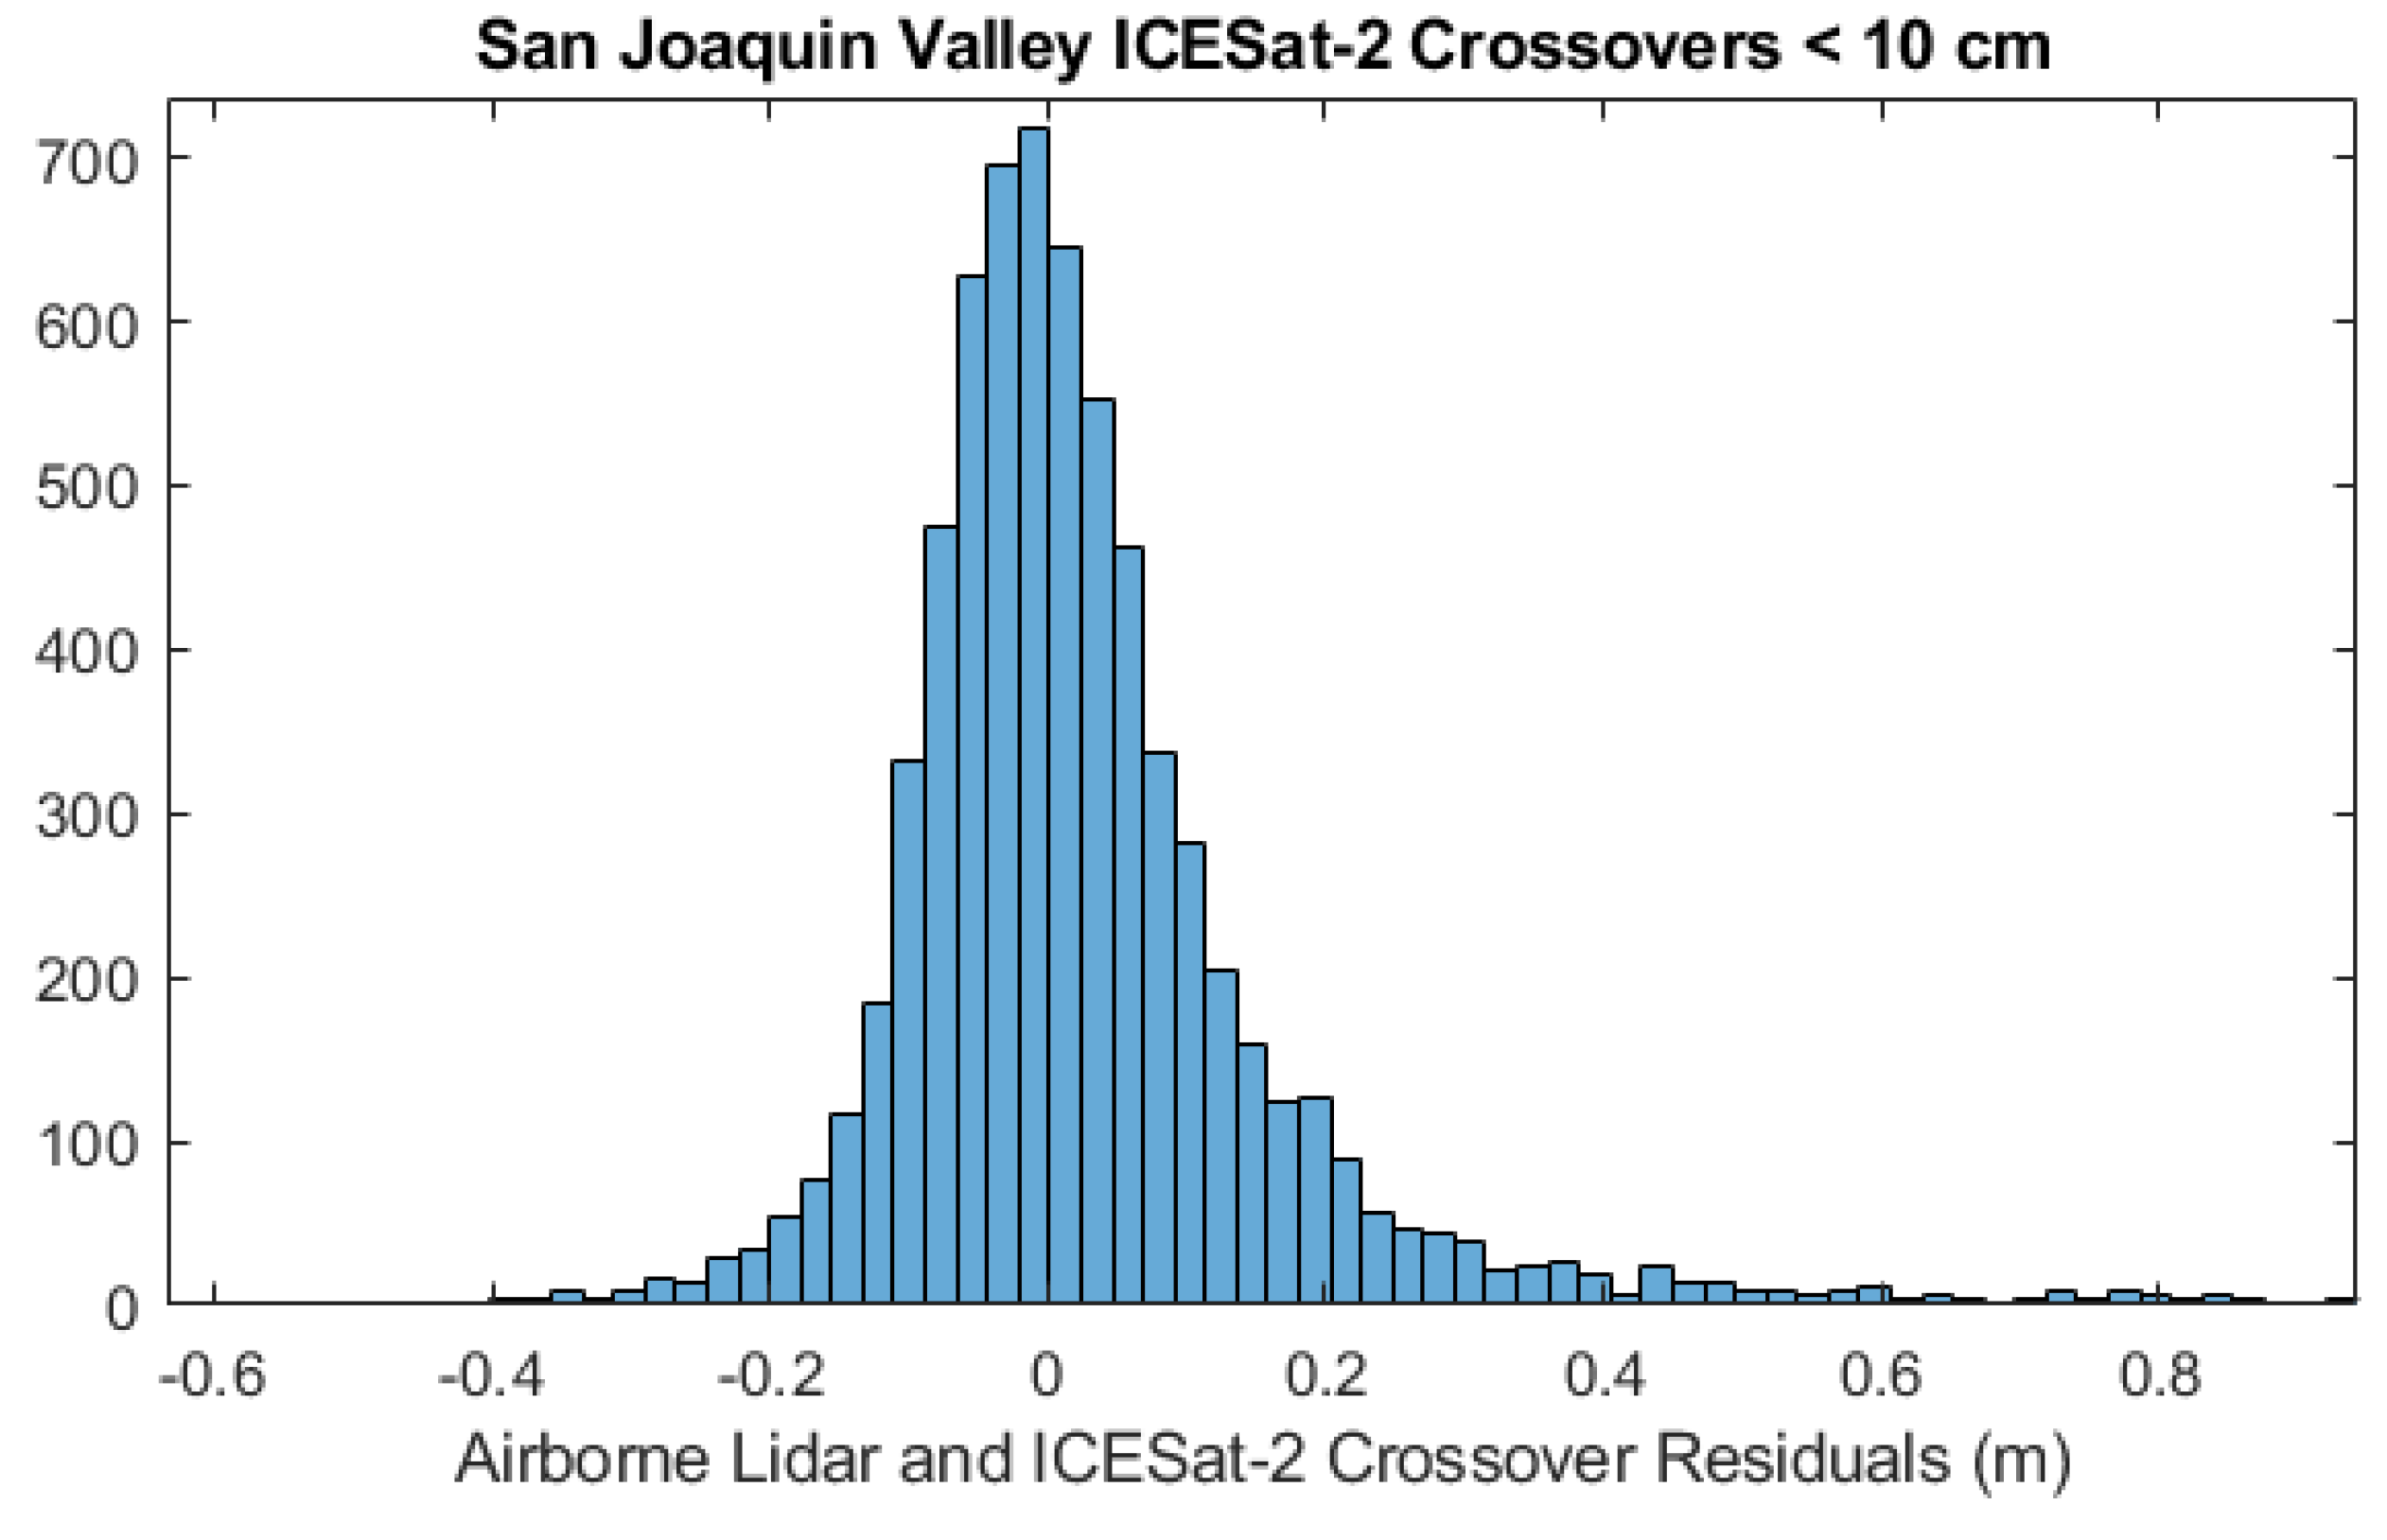
3.1. San Joaquin Valley, California
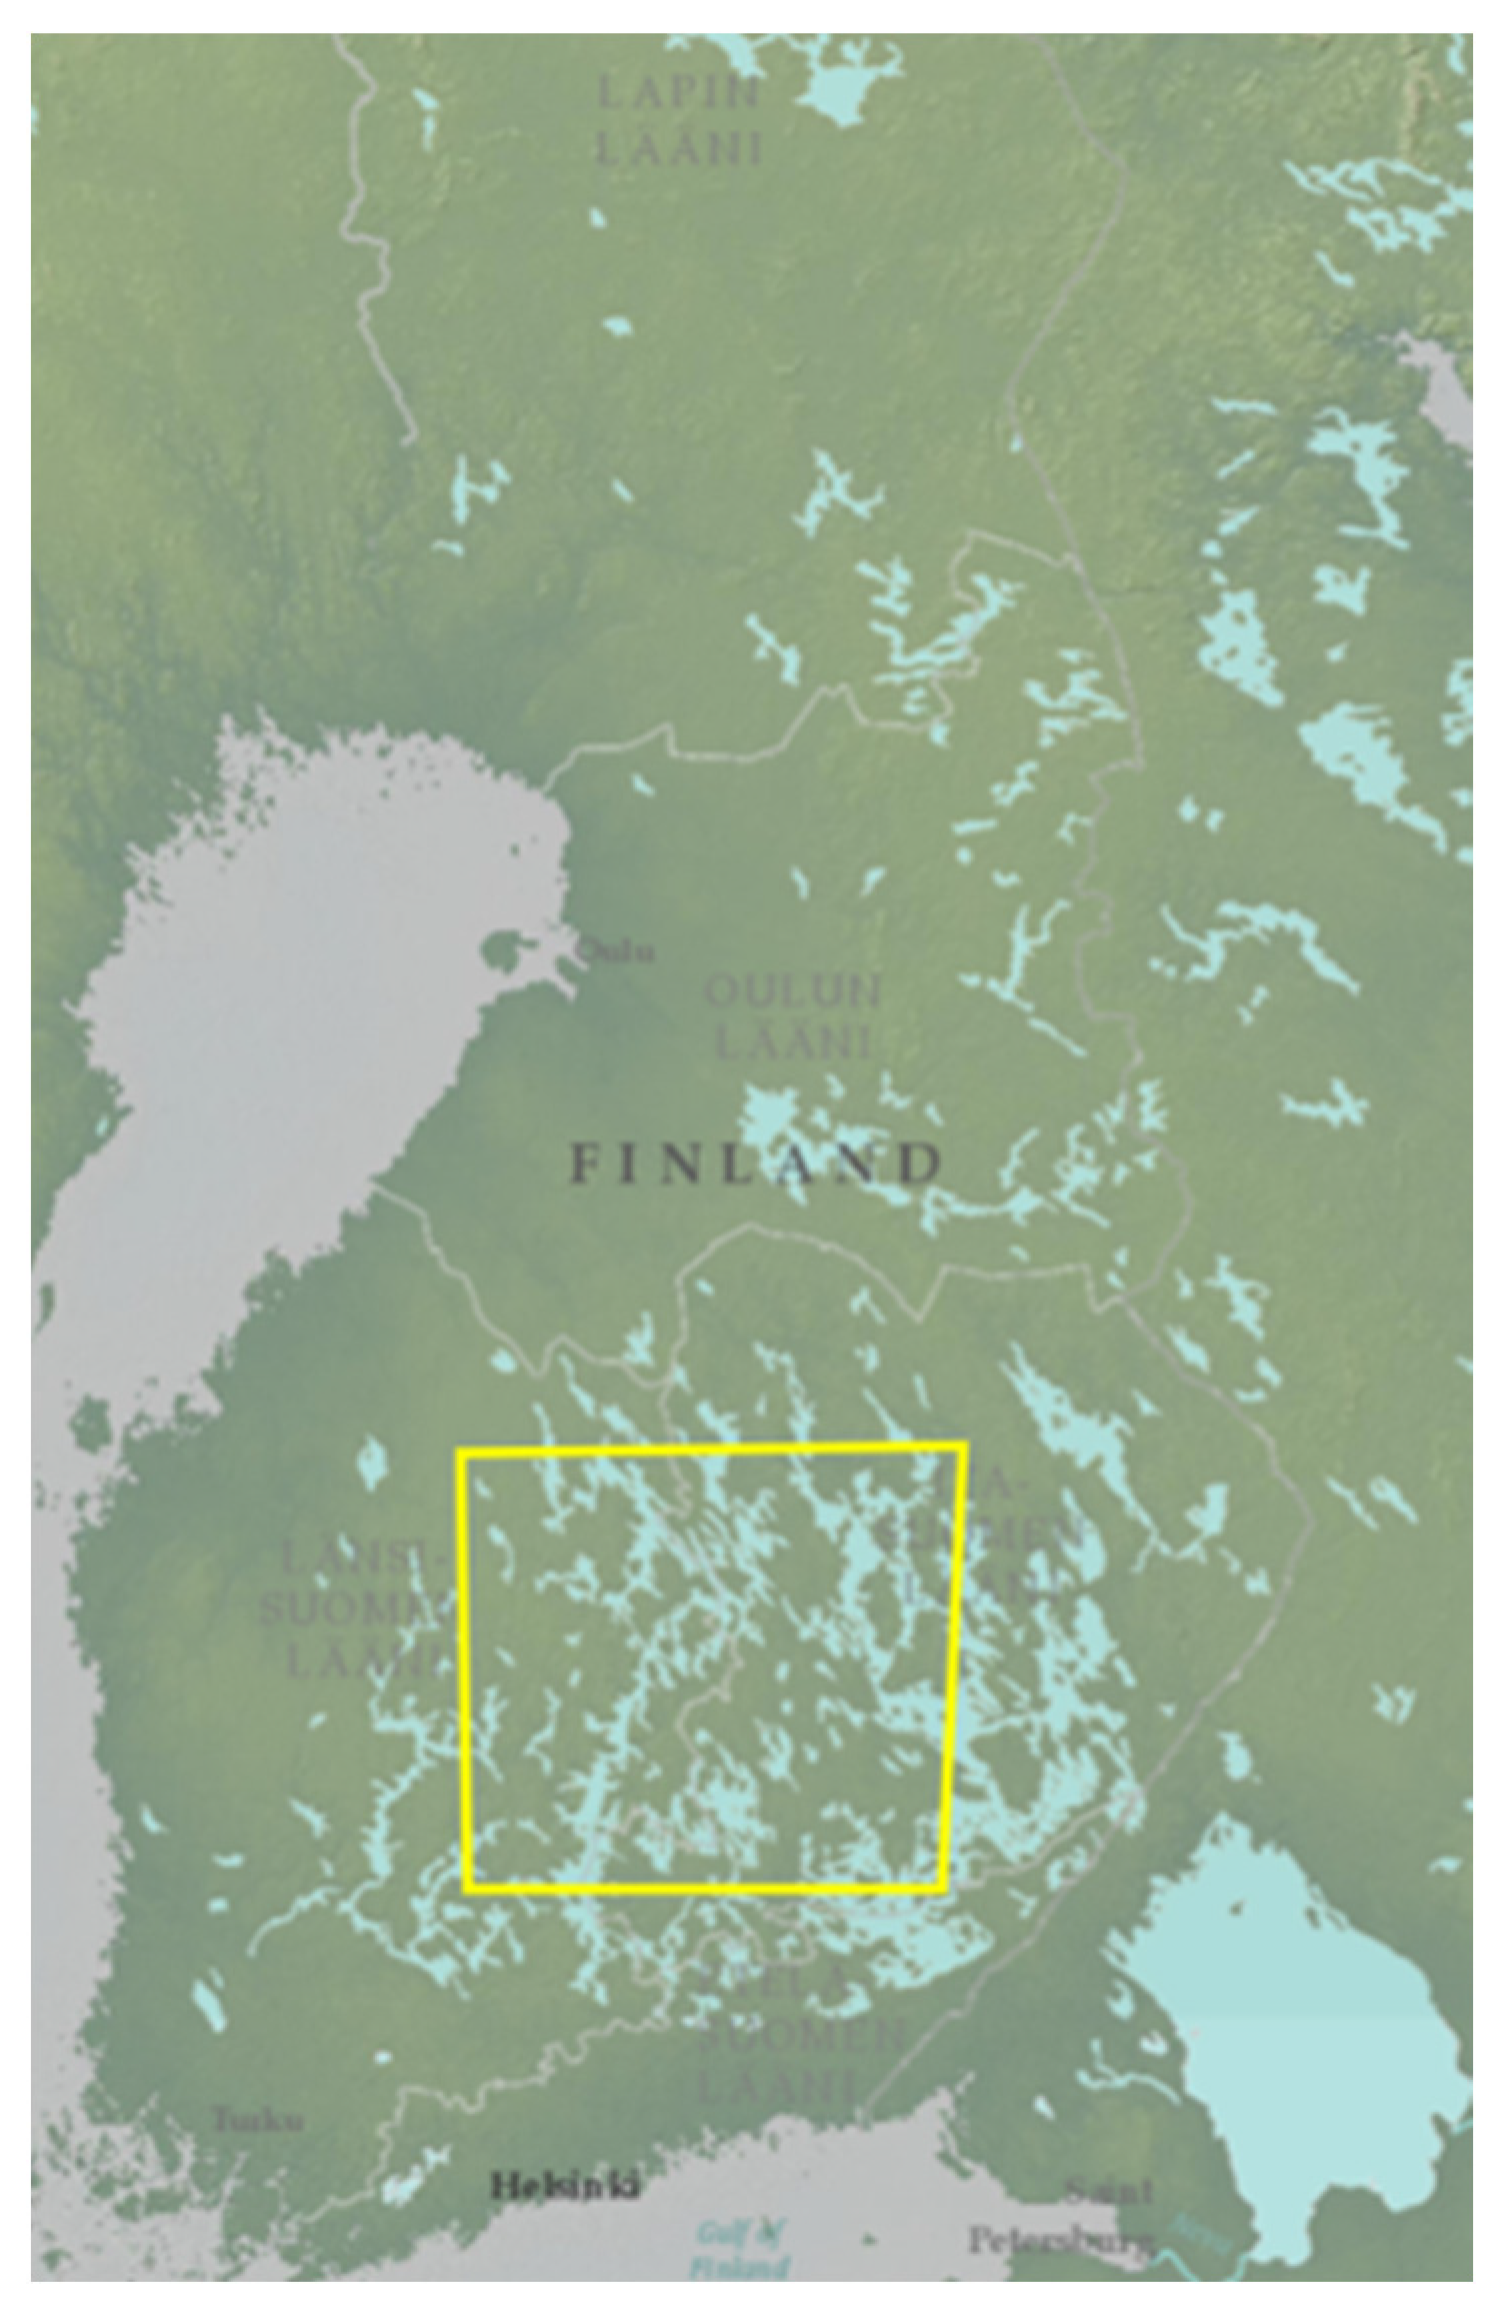
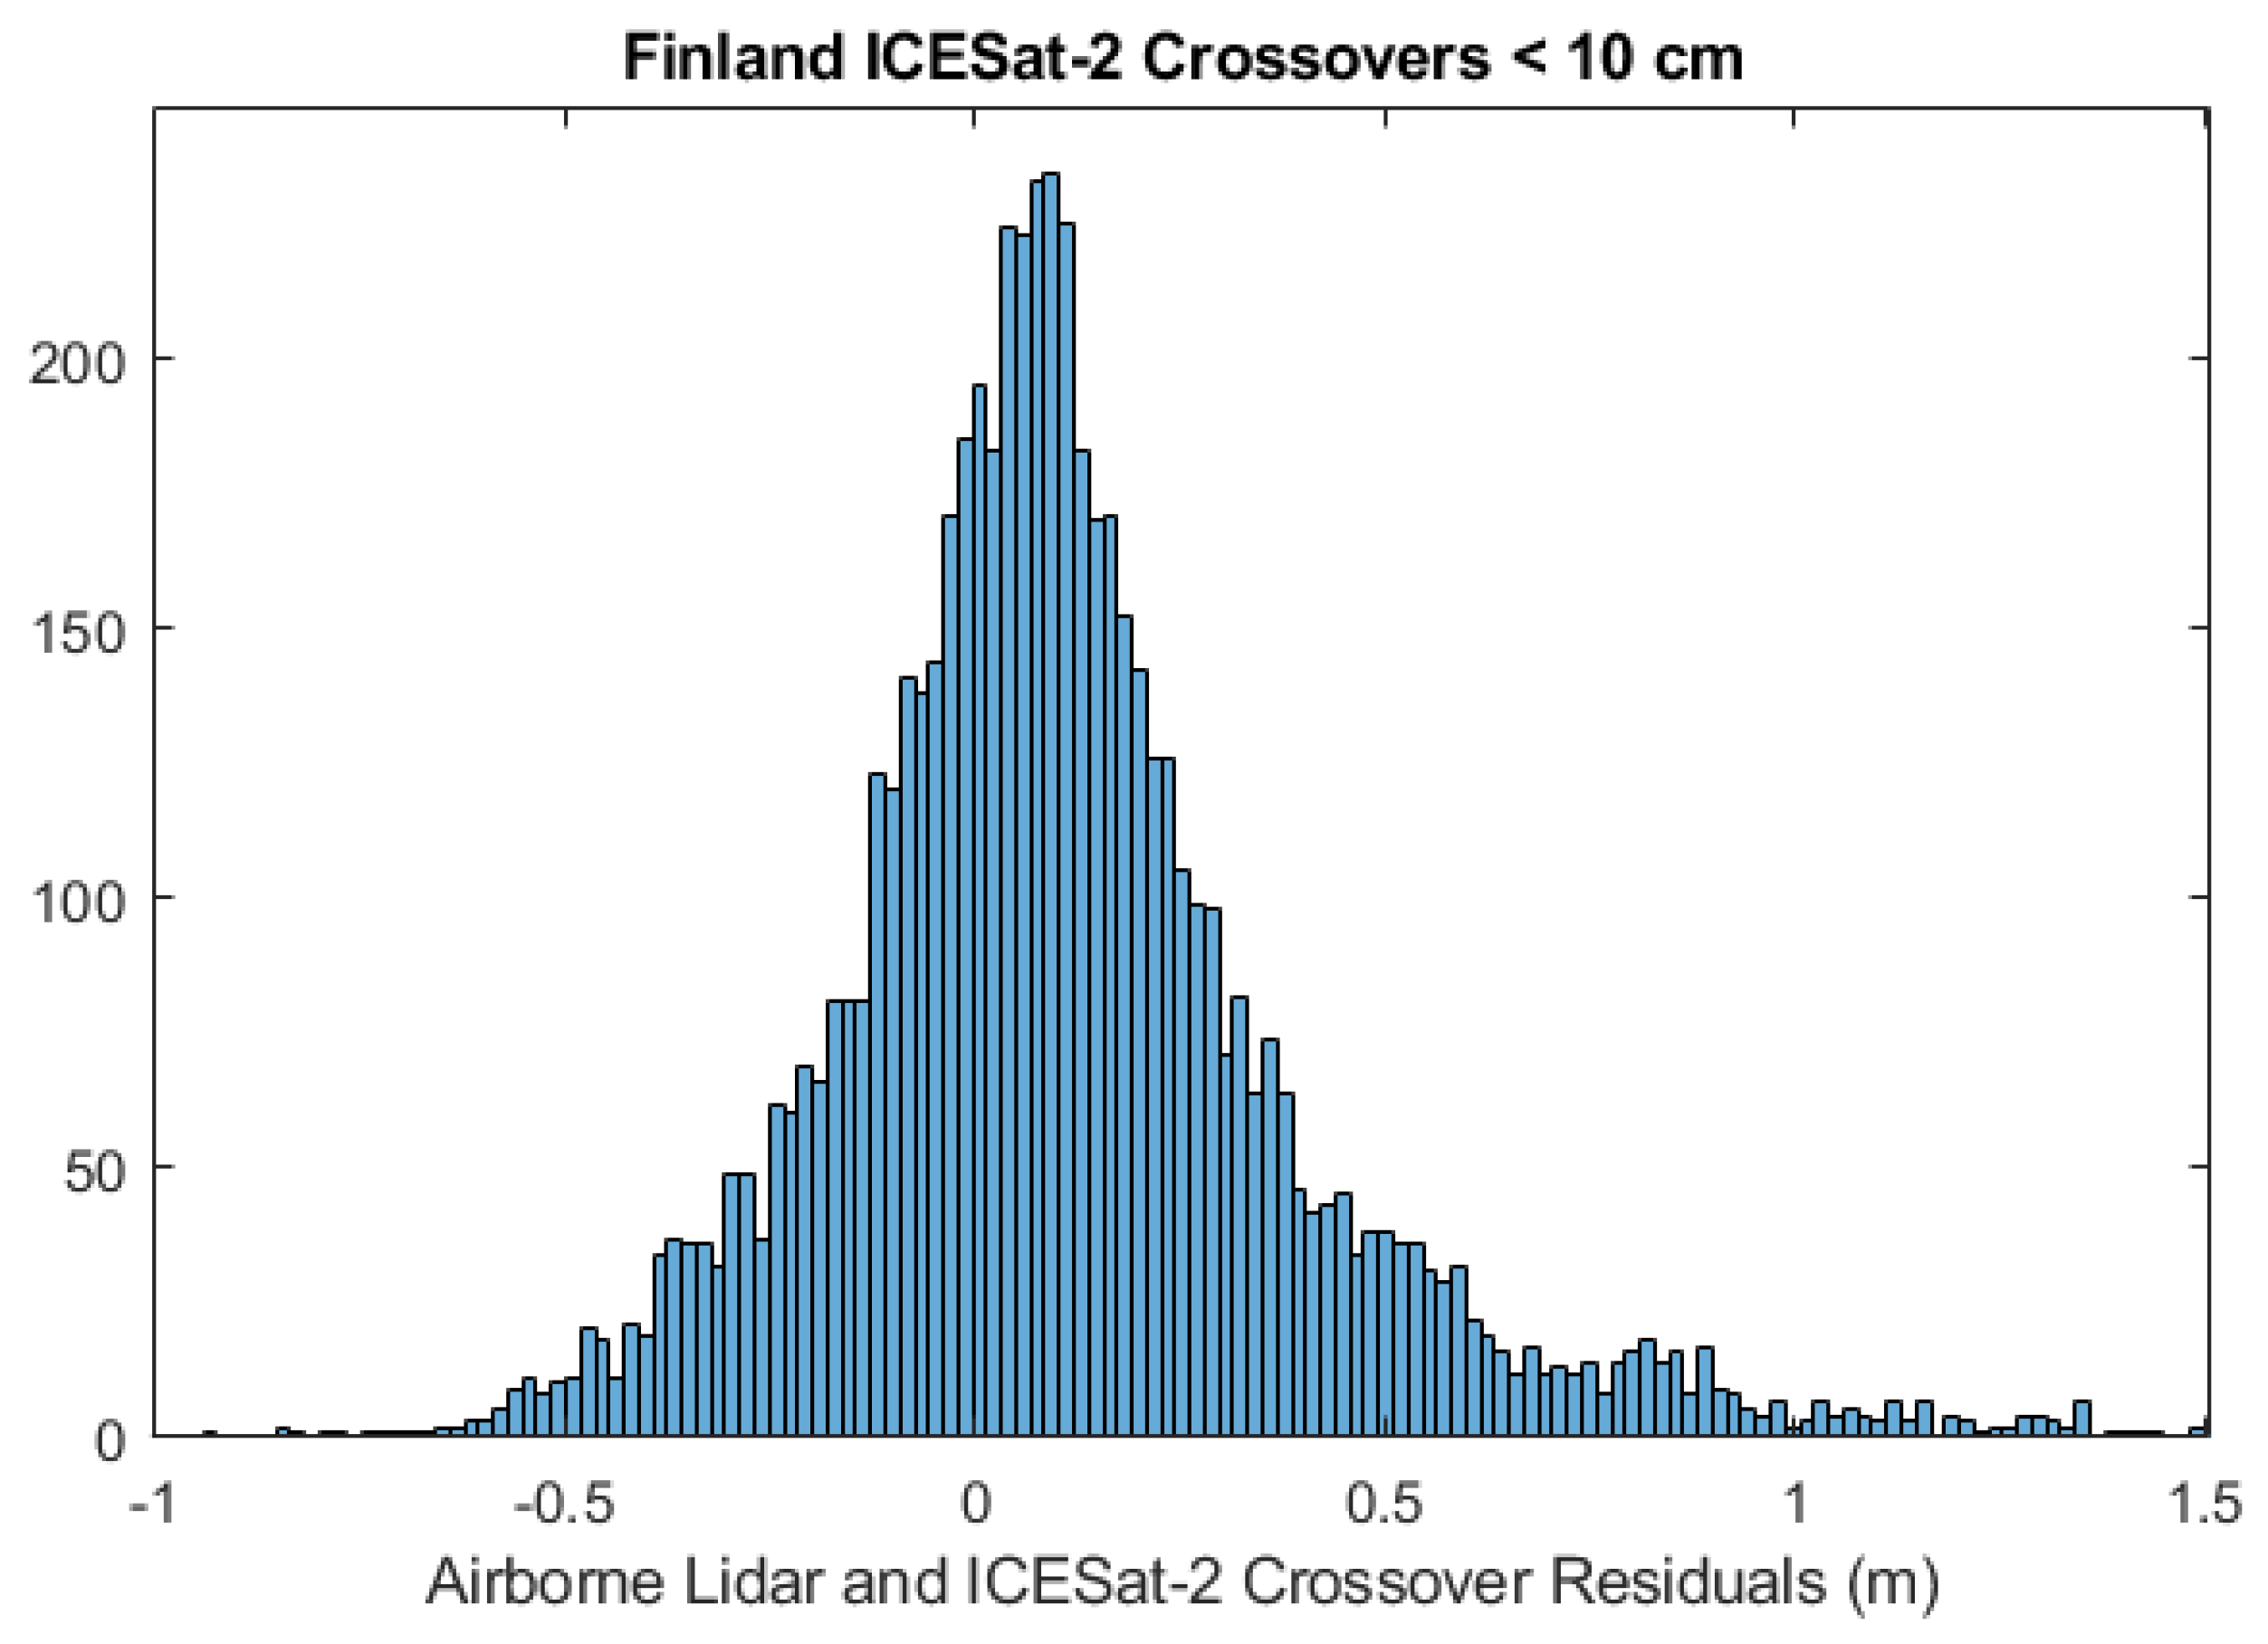
3.2. Finland
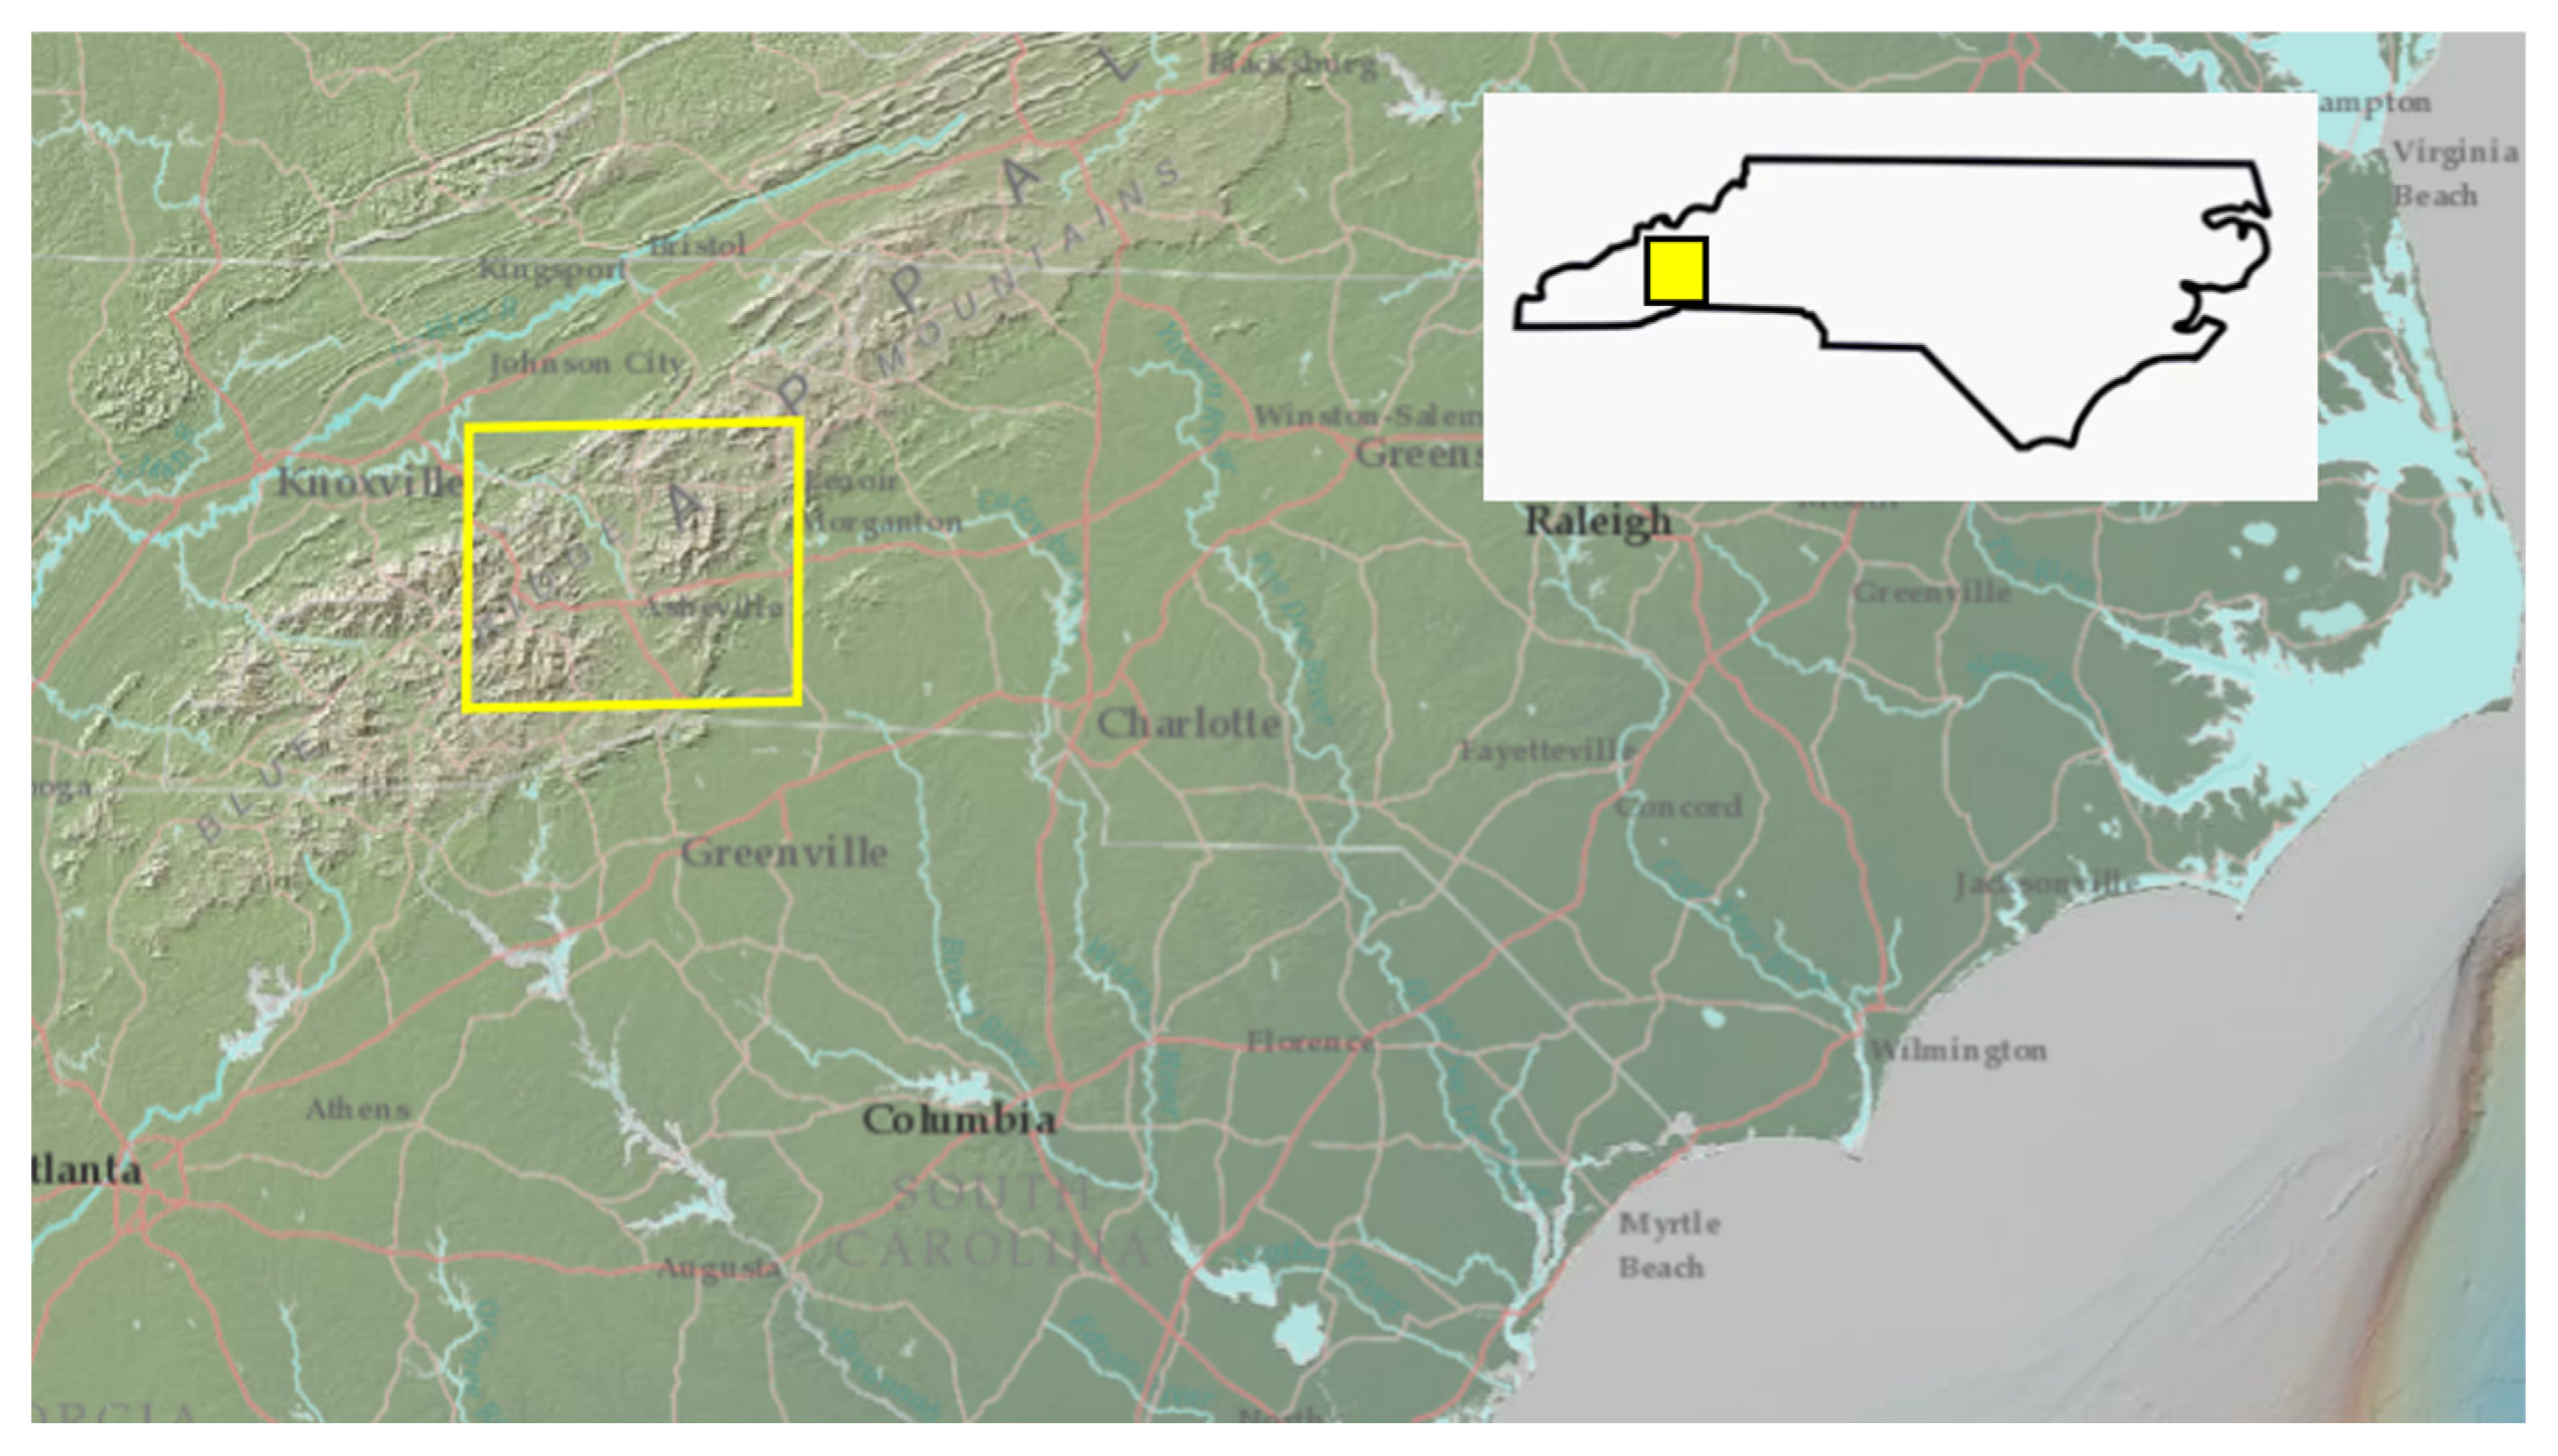
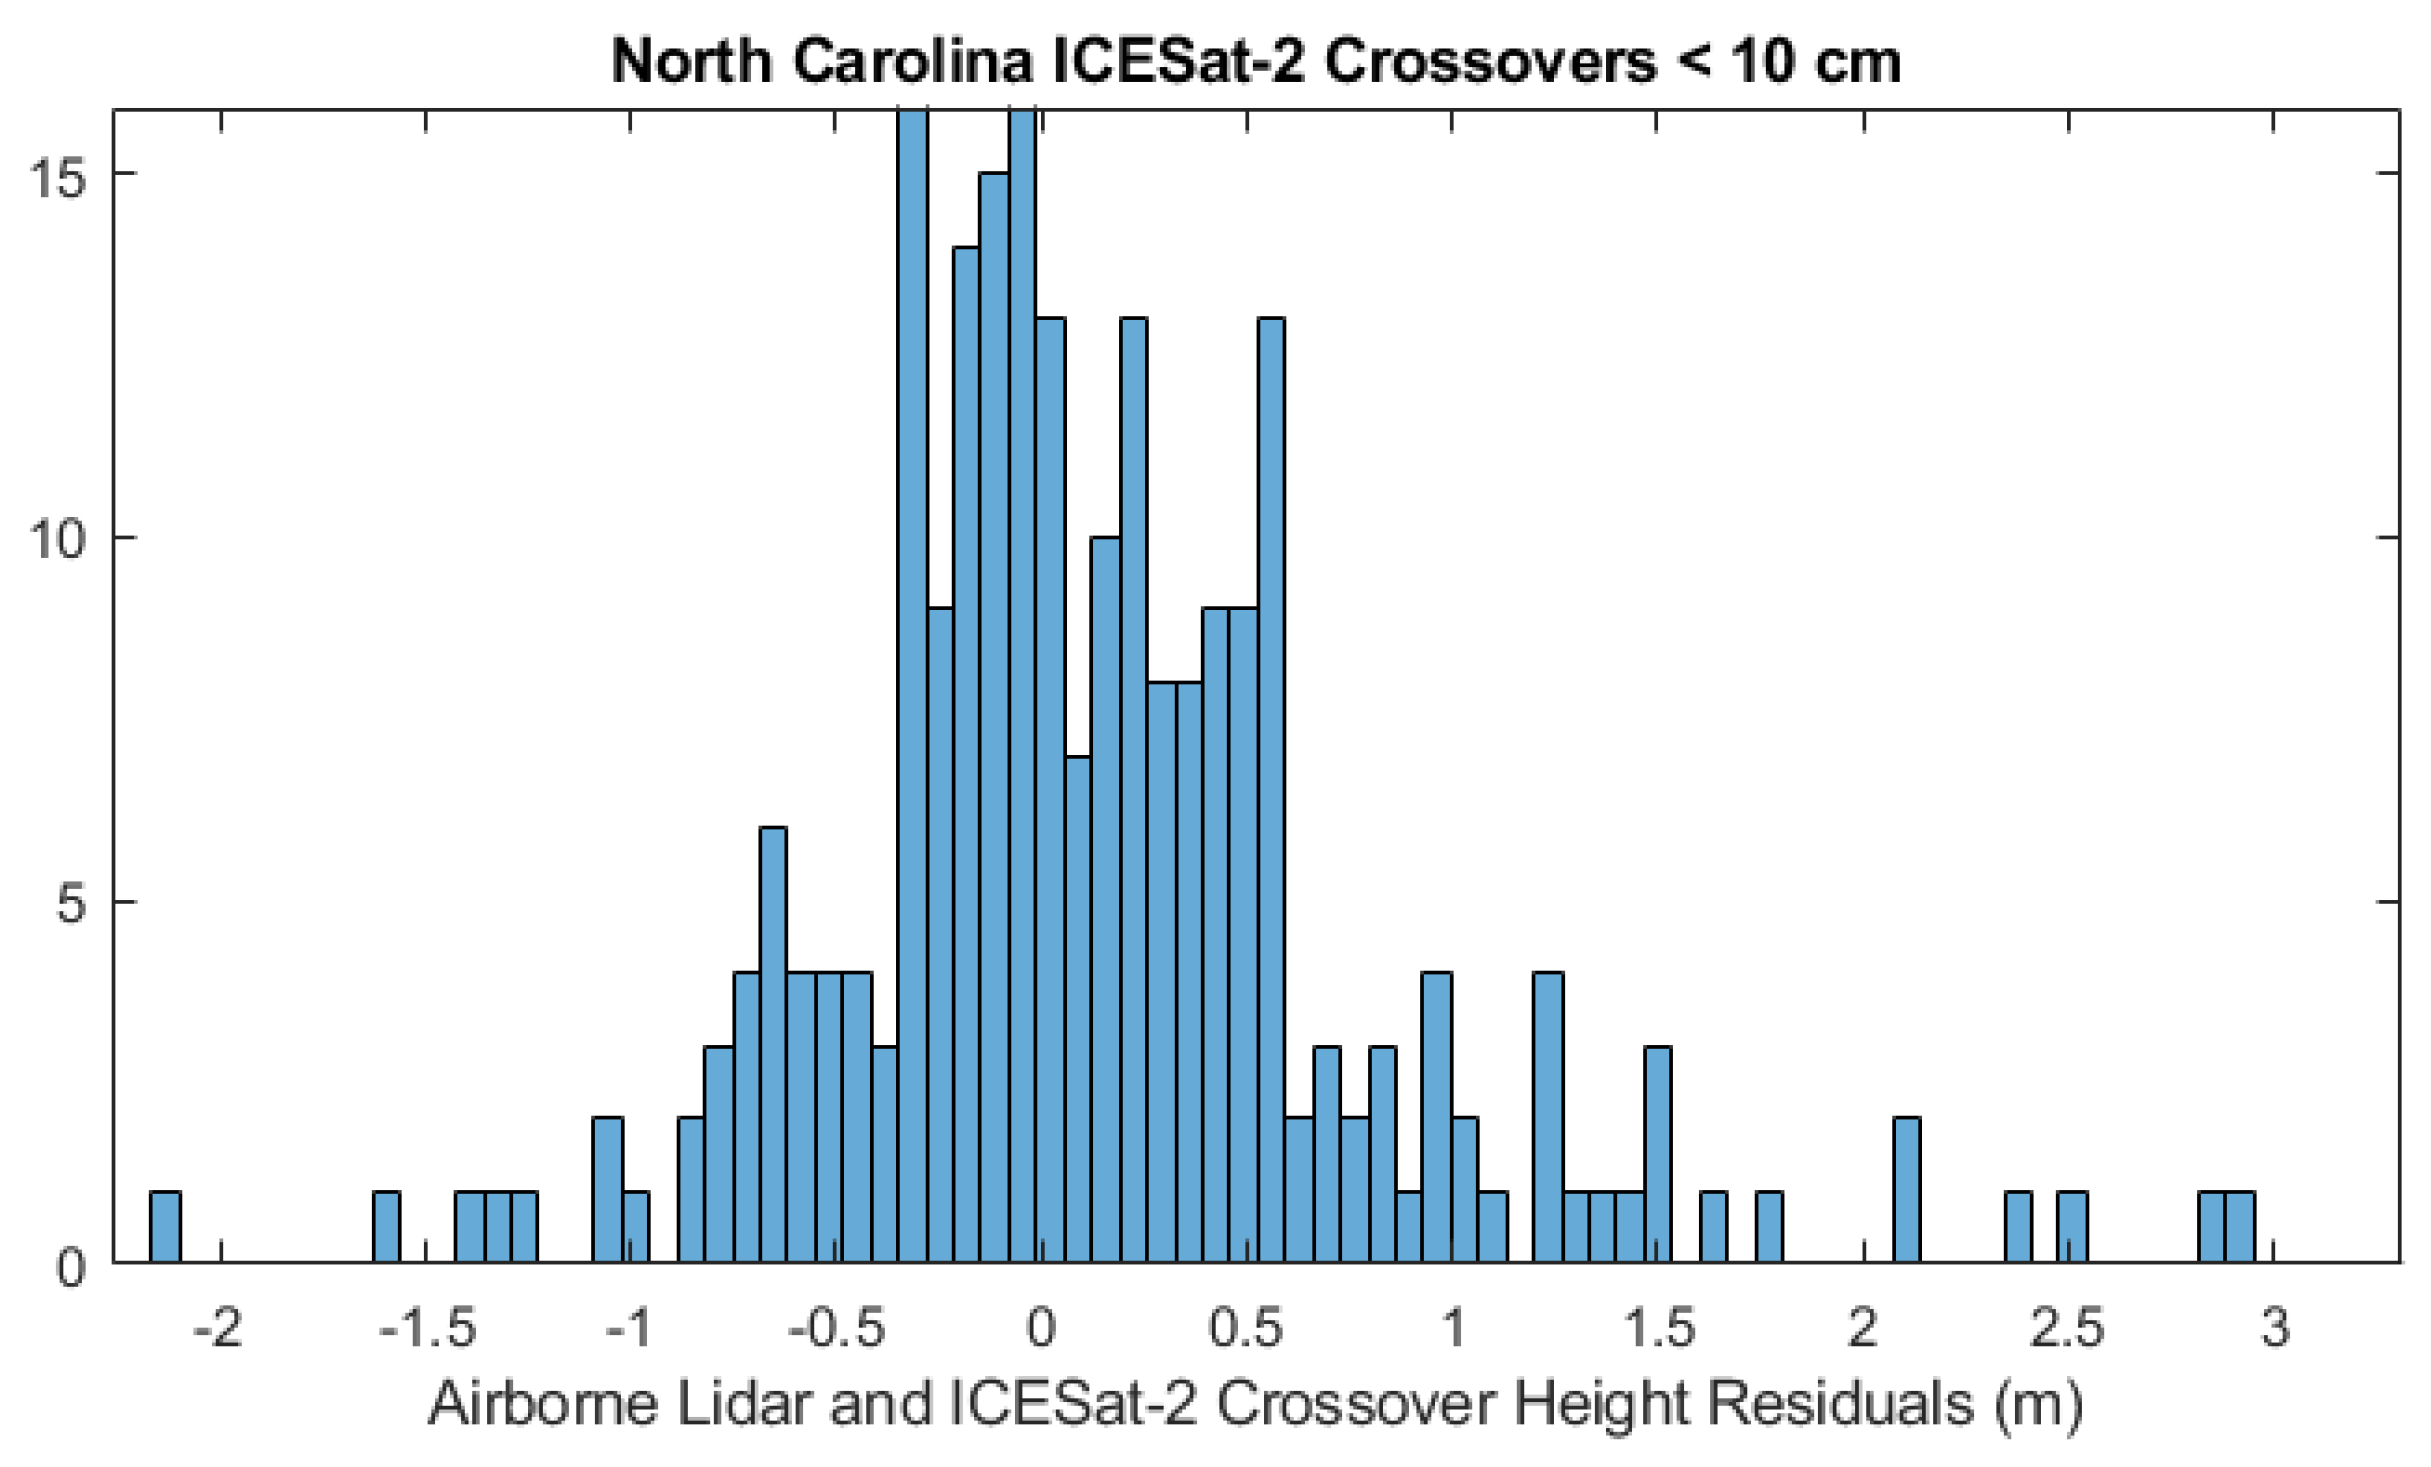
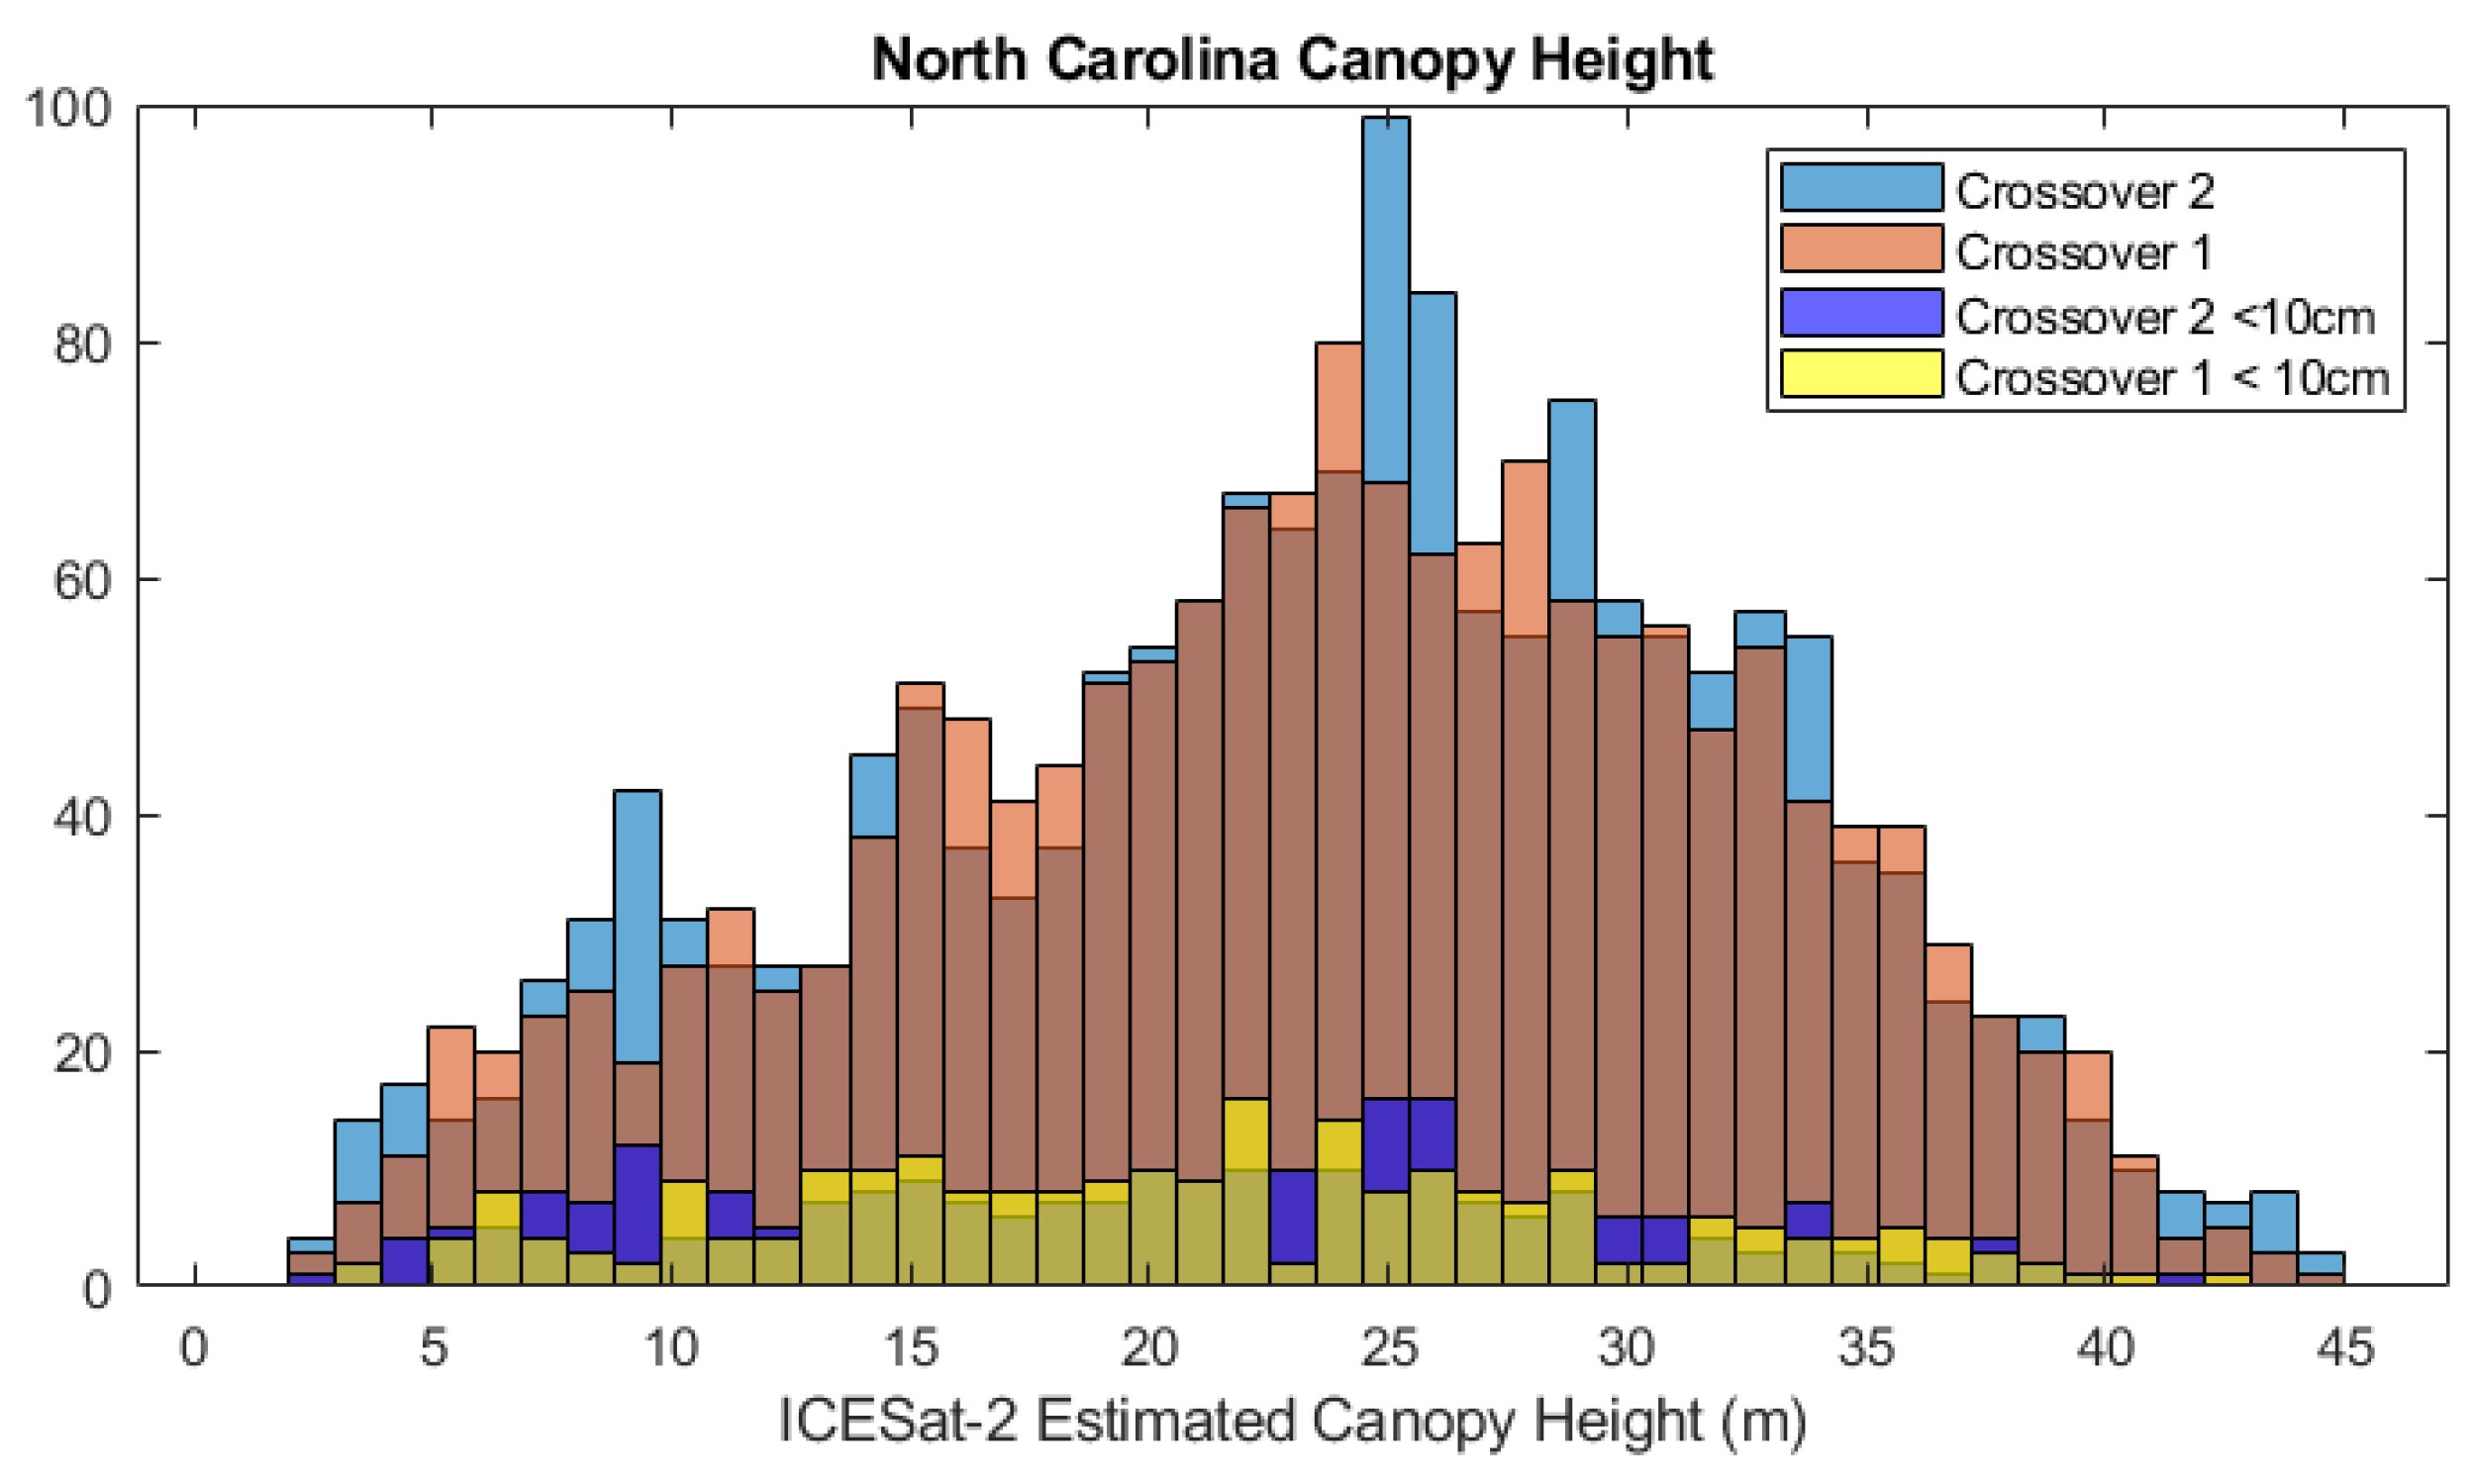
3.3. Western North Carolina/Eastern Tennessee
4. Discussion
5. Conclusions
Author Contributions
Funding
Data Availability Statement
Conflicts of Interest
References
- Abdalati, W.; Zwally, H.J.; Bindschadler, R.; Csatho, B.; Farrell, S.L.; Fricker, H.A.; Harding, D.; Kwok, R.; Lefsky, M.; Markus, T.; et al. The ICESat-2 Laser Altimetry Mission. Proc. IEEE 2010, 98, 735–751. [Google Scholar] [CrossRef]
- Dubayah, R.; Blair, J.B.; Goetz, S.; Fatoyinbo, L.; Hansen, M.; Healey, S.; Hofton, M.; Hurtt, G.; Kellner, J.; Luthcke, S.; et al. The Global Ecosystem Dynamics Investigation: High-resolution laser ranging of the Earth’s forests and topography. Sci. Remote Sens. 2020, 1, 100002. [Google Scholar] [CrossRef]
- Schutz, B.E.; Zwally, H.J.; Shuman, C.A.; Hancock, D.; DiMarzio, J.P. Overview of the ICESat Mission. Geophys. Res. Lett. 2005, 32, L21S01. [Google Scholar] [CrossRef]
- Markus, T.; Neumann, T.; Martino, A.; Abdalati, W.; Brunt, K.; Csatho, B.; Farrell, S.; Fricker, H.; Gardner, A.; Harding, D.; et al. The Ice, Cloud, and land Elevation Satellite-2 (ICESat-2): Science requirements, concept, and implementation. Remote Sens. Environ. 2017, 190, 260–273. [Google Scholar] [CrossRef]
- Magruder, L.A.; Farrell, S.L.; Neuenschwander, A.; Duncanson, L.; Csatho, B.; Kacimi, S.; Fricker, H.A. Monitoring Earth’s climate variables with satellite laser altimetry. Nat. Rev. Earth Environ. 2024, 5, 120–136. [Google Scholar] [CrossRef]
- Wang, T.; Fang, Y.; Zhang, S.; Cao, B.; Wang, Z. Biases Analysis and Calibration of ICESat-2/ATLAS Data Based on Crossover Adjustment Method. Remote Sens. 2022, 14, 5125. [Google Scholar] [CrossRef]
- Luthcke, S.B.; Thomas, T.C.; Pennington, T.A.; Rebold, T.W.; Nicholas, J.B.; Rowlands, D.D.; Gardner, A.S.; Bae, S. ICESat-2 Pointing Calibration and Geolocation Performance. Earth Space Sci. 2021, 8, e2020EA001494. [Google Scholar] [CrossRef]
- Luthcke, S.B.; Rebold, T.; Thomas, T.; Pennington, T. Algorithm Theoretical Basis Document (ATBD); NASA: Washington, DC, USA, 2021. [Google Scholar]
- Martino, A.J.; Neumann, T.A.; Kurtz, N.T.; McLennan, D. ICESat-2 mission overview and early performance. In Proceedings of the Sensors, Systems, and Next-Generation Satellites XXIII, Strasbourg, France, 9–12 September 2019; SPIE: Bellingham, WA, USA, 2019; pp. 68–77. [Google Scholar]
- Borsa, A.A.; Moholdt, G.; Fricker, H.A.; Brunt, K.M. A range correction for ICESat and its potential impact on ice-sheet mass balance studies. Cryosphere 2014, 8, 345–357. [Google Scholar] [CrossRef]
- Rudenko, S.; Dettmering, D.; Zeitlhöfler, J.; Alkahal, R.; Upadhyay, D.; Bloßfeld, M. Radial Orbit Errors of Contemporary Altimetry Satellite Orbits. Surv. Geophys. 2023, 44, 705–737. [Google Scholar] [CrossRef]
- Kim, M.C. Theory of satellite ground-track crossovers. J. Geod. 1997, 71, 749–767. [Google Scholar] [CrossRef]
- Smith, B.; Fricker, H.A.; Gardner, A.S.; Medley, B.; Nilsson, J.; Paolo, F.S.; Holschuh, N.; Adusumilli, S.; Brunt, K.; Csatho, B.; et al. Pervasive ice sheet mass loss reflects competing ocean and atmosphere processes. Science 2020, 368, 1239–1242. [Google Scholar] [CrossRef] [PubMed]
- Sochor, L.; Seehaus, T.; Braun, M.H. Increased Ice Thinning over Svalbard Measured by ICESat/ICESat-2 Laser Altimetry. Remote Sens. 2021, 13, 2089. [Google Scholar] [CrossRef]
- Suad Corbetta, F.; Richter, A.; Marderwald, E. Surface elevation changes of the Patagonian Icefields: Insights from an ICESat(-2) crossover analysis. Int. Arch. Photogramm. Remote Sens. Spat. Inf. Sci. 2024, 48, 59–64. [Google Scholar] [CrossRef]
- Carabajal, C.C.; Harding, D.J. ICESat validation of SRTM C-band digital elevation models. Geophys. Res. Lett. 2005, 32, L21S01. [Google Scholar] [CrossRef]
- Carabajal, C.C.; Harding, D.J. SRTM C-Band and ICESat Laser Altimetry Elevation Comparisons as a Function of Tree Cover and Relief. Photogramm. Eng. Remote Sens. 2006, 72, 287–298. [Google Scholar] [CrossRef]
- Simard, M.; Denbina, M.; Marshak, C.; Neumann, M. A Global Evaluation of Radar-Derived Digital Elevation Models: SRTM, NASADEM, and GLO-30. J. Geophys. Res. Biogeosci. 2024, 129, e2023JG007672. [Google Scholar] [CrossRef]
- Braun, A.; Fotopoulos, G. Assessment of SRTM, ICESat, and Survey Control Monument Elevations in Canada. Photogramm. Eng. Remote Sens. 2007, 73, 1333–1342. [Google Scholar] [CrossRef]
- Roy, D.P.; Kashongwe, H.B.; Armston, J. The impact of geolocation uncertainty on GEDI tropical forest canopy height estimation and change monitoring. Sci. Remote Sens. 2021, 4, 100024. [Google Scholar] [CrossRef]
- Dubayah, R.; Armston, J.; Healey, S.P.; Bruening, J.M.; Patterson, P.L.; Kellner, J.R.; Duncanson, L.; Saarela, S.; Ståhl, G.; Yang, Z.; et al. GEDI launches a new era of biomass inference from space. Environ. Res. Lett. 2022, 17, 095001. [Google Scholar] [CrossRef]
- Neuenschwander, A.; Pitts, K. The ATL08 land and vegetation product for the ICESat-2 Mission. Remote Sens. Environ. 2019, 221, 247–259. [Google Scholar] [CrossRef]
- Urbazaev, M.; Hess, L.L.; Hancock, S.; Sato, L.Y.; Ometto, J.P.; Thiel, C.; Dubois, C.; Heckel, K.; Urban, M.; Adam, M.; et al. Assessment of terrain elevation estimates from ICESat-2 and GEDI spaceborne LiDAR missions across different land cover and forest types. Sci. Remote Sens. 2022, 6, 100067. [Google Scholar] [CrossRef]
- Li, B.; Xie, H.; Tong, X.; Liu, S.; Xu, Q.; Sun, Y. Extracting accurate terrain in vegetated areas from ICESat-2 data. Int. J. Appl. Earth Obs. Geoinf. 2023, 117, 103200. [Google Scholar] [CrossRef]
- Moudrý, V.; Gdulová, K.; Gábor, L.; Šárovcová, E.; Barták, V.; Leroy, F.; Špatenková, O.; Rocchini, D.; Prošek, J. Effects of environmental conditions on ICESat-2 terrain and canopy heights retrievals in Central European mountains. Remote Sens. Environ. 2022, 279, 113112. [Google Scholar] [CrossRef]
- Malambo, L.; Popescu, S.C. Assessing the agreement of ICESat-2 terrain and canopy height with airborne lidar over US ecozones. Remote Sens. Environ. 2021, 266, 112711. [Google Scholar] [CrossRef]
- Neuenschwander, A.; Guenther, E.; White, J.C.; Duncanson, L.; Montesano, P. Validation of ICESat-2 terrain and canopy heights in boreal forests. Remote Sens. Environ. 2020, 251, 112110. [Google Scholar] [CrossRef]
- Xing, Y.; Huang, J.; Gruen, A.; Qin, L. Assessing the Performance of ICESat-2/ATLAS Multi-Channel Photon Data for Estimating Ground Topography in Forested Terrain. Remote Sens. 2020, 12, 2084. [Google Scholar] [CrossRef]
- Tian, X.; Shan, J. Comprehensive Evaluation of the ICESat-2 ATL08 Terrain Product. IEEE Trans. Geosci. Remote Sens. 2021, 59, 8195–8209. [Google Scholar] [CrossRef]
- Zhu, J.; Yang, P.; Li, Y.; Xie, Y.; Fu, H. Accuracy assessment of ICESat-2 ATL08 terrain estimates: A case study in Spain. J. Cent. South Univ. 2022, 29, 226–238. [Google Scholar] [CrossRef]
- Brunt, K.M.; Neumann, T.A.; Smith, B.E. Assessment of ICESat-2 Ice Sheet Surface Heights, Based on Comparisons over the Interior of the Antarctic Ice Sheet. Geophys. Res. Lett. 2019, 46, 13072–13078. [Google Scholar] [CrossRef]
- Li, B.; Xie, H.; Liu, S.; Tong, X.; Tang, H.; Wang, X. A Method of Extracting High-Accuracy Elevation Control Points from ICESat-2 Altimetry Data. Photogramm. Eng. Remote Sens. 2021, 87, 821–830. [Google Scholar] [CrossRef]
- Guth, P.L.; Geoffroy, T.M. LiDAR point cloud and ICESat-2 evaluation of 1 second global digital elevation models: Copernicus wins. Trans. GIS 2021, 25, 2245–2261. [Google Scholar] [CrossRef]
- Liu, Z.; Zhu, J.; Fu, H.; Zhou, C.; Zuo, T. Evaluation of the Vertical Accuracy of Open Global DEMs over Steep Terrain Regions Using ICESat Data: A Case Study over Hunan Province, China. Sensors 2020, 20, 4865. [Google Scholar] [CrossRef] [PubMed]
- Narin, O.G.; Gullu, M. A comparison of vertical accuracy of global DEMs and DEMs produced by GEDI, ICESat-2. Earth Sci. Inform. 2023, 16, 2693–2707. [Google Scholar] [CrossRef]
- Vernimmen, R.; Hooijer, A.; Pronk, M. New ICESat-2 Satellite LiDAR Data Allow First Global Lowland DTM Suitable for Accurate Coastal Flood Risk Assessment. Remote Sens. 2020, 12, 2827. [Google Scholar] [CrossRef]
- Guenther, E.; Magruder, L.; Neuenschwander, A.; Maze-England, D.; Dietrich, J. Examining CNN terrain model for TanDEM-X DEMs using ICESat-2 data in Southeastern United States. Remote Sens. Environ. 2024, 311, 114293. [Google Scholar] [CrossRef]
- Magruder, L.; Neumann, T.; Kurtz, N. ICESat-2 Early Mission Synopsis and Observatory Performance. Earth Space Sci. 2021, 8, e2020EA001555. [Google Scholar] [CrossRef]
- Magruder, L.A.; Brunt, K.M.; Alonzo, M. Early ICESat-2 On-Orbit Geolocation Validation Using Ground-Based Corner Cube Retro-Reflectors. Remote Sens. 2020, 12, 3653. [Google Scholar] [CrossRef]
- Gibbons, A.; Neumann, T.; Hancock, D.; Harbeck, K.; Lee, J. On-Orbit Radiometric Performance on ICESat-2. Earth Space Sci. 2021, 8, e2020EA001503. [Google Scholar] [CrossRef]
- Neuenschwander, A.; Magruder, L.; Guenther, E.; Hancock, S.; Purslow, M. Radiometric Assessment of ICESat-2 over Vegetated Surfaces. Remote Sens. 2022, 14, 787. [Google Scholar] [CrossRef]
- Palm, S.P.; Yang, Y.; Herzfeld, U.; Hancock, D.; Hayes, A.; Selmer, P.; Hart, W.; Hlavka, D. ICESat-2 Atmospheric Channel Description, Data Processing and First Results. Earth Space Sci. 2021, 8, e2020EA001470. [Google Scholar] [CrossRef]
- Hancock, S.; McGrath, C.; Lowe, C.; Davenport, I.; Woodhouse, I. Requirements for a global lidar system: Spaceborne lidar with wall-to-wall coverage. R. Soc. Open Sci. 2021, 8, 211166. [Google Scholar] [CrossRef] [PubMed]
- Feng, T.; Duncanson, L.; Montesano, P.; Hancock, S.; Minor, D.; Guenther, E.; Neuenschwander, A. A systematic evaluation of multi-resolution ICESat-2 ATL08 terrain and canopy heights in boreal forests. Remote Sens. Environ. 2023, 291, 113570. [Google Scholar] [CrossRef]
- Fernandez-Diaz, J.C.; Velikova, M.; Glennie, C.L. Validation of ICESat-2 ATL08 Terrain and Canopy Height Retrievals in Tropical Mesoamerican Forests. IEEE J. Sel. Top. Appl. Earth Obs. Remote Sens. 2022, 15, 2956–2970. [Google Scholar] [CrossRef]
- Wang, X.; Liang, X.; Gong, W.; Häkli, P.; Wang, Y. Accuracy fluctuations of ICESat-2 height measurements in time series. Int. J. Appl. Earth Obs. Geoinf. 2024, 135, 104234. [Google Scholar] [CrossRef]
- Wilson, T.H.; Fovell, R.G. Modeling the Evolution and Life Cycle of Radiative Cold Pools and Fog. Weather. Forecast. 2018, 33, 203–220. [Google Scholar] [CrossRef]
- Li, B.; Xie, H.; Liu, S.; Xi, Y.; Liu, C.; Xu, Y.; Ye, Z.; Hong, Z.; Weng, Q.; Sun, Y.; et al. A high-quality global elevation control point dataset from ICESat-2 altimeter data. Int. J. Digit. Earth 2024, 17, 2361724. [Google Scholar] [CrossRef]
- Varvia, P.; Korhonen, L.; Bruguière, A.; Toivonen, J.; Packalen, P.; Maltamo, M.; Saarela, S.; Popescu, S.C. How to consider the effects of time of day, beam strength, and snow cover in ICESat-2 based estimation of boreal forest biomass? Remote Sens. Environ. 2022, 280, 113174. [Google Scholar] [CrossRef]
- Wang, T.; Fang, Y.; Zhang, S.; Cao, B. A Crossover Evaluation and Calibration Method for Geolocation Error of Spaceborne Photon-Counting Laser Altimeter. IEEE Trans. Geosci. Remote Sens. 2023, 61, 5705616. [Google Scholar] [CrossRef]


| MAE (m) | Mean Error (m) | RMSE (m) | Number and Percentage of Crossovers < 10 cm | |
|---|---|---|---|---|
| Strong–Strong | 0.103 | 0.032 | 0.299 | 2814 (29.61%) |
| Strong–Weak | 0.105 | 0.035 | 0.227 | 4712 (49.57%) |
| Weak–Weak | 0.113 | 0.037 | 0.209 | 1979 (20.82%) |
| Night–Night | 0.106 | 0.029 | 0.259 | 1311 (13.79%) |
| Night–Day | 0.104 | 0.032 | 0.257 | 4460 (46.92%) |
| Day–Day | 0.109 | 0.041 | 0.228 | 3734 (39.28%) |
| Snow–Snow | N/A | N/A | N/A | 1 (0.01%) |
| Snow–No Snow | N/A | N/A | N/A | 4 (0.04%) |
| No Snow–No Snow | 0.104 | 0.025 | 0.243 | 9500 (99.95%) |
| Low Veg | 0.106 | 0.040 | 0.234 | 8256 (86.86%) |
| Water | 0.144 | 0.144 | 0.147 | 21 (0.22%) |
| Urban | 0.097 | 0.024 | 0.311 | 620 (6.52%) |
| Closed Forest | 0.094 | 0.028 | 0.341 | 301 (3.17%) |
| Open Forest | 0.122 | 0.055 | 0.27 | 307 (3.23%) |
| MAE (m) | Mean Error (m) | RMSE (m) | Number and Percentage of Crossovers < 10 cm | |
|---|---|---|---|---|
| Strong–Strong | 0.225 | 0.106 | 0.349 | 2473 (32.97%) |
| Strong–Weak | 0.240 | 0.129 | 0.372 | 3603 (48.03%) |
| Weak–Weak | 0.255 | 0.148 | 0.385 | 1425 (19%) |
| Night–Night | 0.228 | 0.065 | 0.335 | 1288 (17.17%) |
| Night–Day | 0.235 | 0.117 | 0.350 | 3603 (48.03%) |
| Day–Day | 0.247 | 0.169 | 0.406 | 2610 (34.80%) |
| Snow–Snow | 0.252 | −0.042 | 0.349 | 865 (11.53%) |
| Snow–No Snow | 0.226 | 0.096 | 0.343 | 2517 (33.56%) |
| No Snow–No Snow | 0.242 | 0.181 | 0.385 | 4119 (54.91%) |
| Low Veg | 0.196 | 0.087 | 0.315 | 297 (3.96%) |
| Urban | 0.173 | 0.113 | 0.403 | 135 (1.8%) |
| Water | 0.281 | 0.230 | 0.376 | 2369 (31.58%) |
| Closed Forest | 0.221 | 0.085 | 0.352 | 4072 (54.29%) |
| Open Forest | 0.259 | 0.148 | 0.447 | 705 (9.4%) |
| MAE (m) | Mean Error (m) | RMSE (m) | Number and Percentage of Crossovers < 10 cm | |
|---|---|---|---|---|
| Strong–Strong | 0.567 | 0.193 | 0.939 | 221 (46.53%) |
| Strong–Weak | 0.492 | 0.116 | 0.767 | 204 (42.95%) |
| Weak–Weak | 0.496 | 0.008 | 0.668 | 50 (10.53%) |
| Night–Night | 0.519 | −0.083 | 1.057 | 120 (25.26%) |
| Night–Day | 0.524 | 0.178 | 0.789 | 235 (49.47%) |
| Day–Day | 0.541 | 0.290 | 0.680 | 120 (25.26%) |
| Snow–Snow | 0.04 | 0.04 | N/A | 1 (0.2%) |
| Snow–No Snow | 0.231 | −0.231 | 0.287 | 4 (0.8%) |
| No Snow–No Snow | 0.533 | 0.146 | 0.848 | 467 (98.32) |
| Low Veg | 0.406 | −0.009 | 0.56 | 141 (29.68%) |
| Water | N/A | N/A | N/A | 8 (1.68%) |
| Urban | 0.204 | −0.141 | 0.286 | 27 (5.68%) |
| Closed Forest | 0.692 | 0.245 | 1.124 | 146 (30.74%) |
| Open Forest | 0.482 | 0.168 | 0.683 | 153 (32.21%) |
Disclaimer/Publisher’s Note: The statements, opinions and data contained in all publications are solely those of the individual author(s) and contributor(s) and not of MDPI and/or the editor(s). MDPI and/or the editor(s) disclaim responsibility for any injury to people or property resulting from any ideas, methods, instructions or products referred to in the content. |
© 2025 by the authors. Licensee MDPI, Basel, Switzerland. This article is an open access article distributed under the terms and conditions of the Creative Commons Attribution (CC BY) license (https://creativecommons.org/licenses/by/4.0/).
Share and Cite
Neuenschwander, A.; Guenther, E.; Magruder, L.; Sipps, J. Creation of ICESat-2 Footprint Level Global Geodetic Control Points Using Crossover Analysis. Remote Sens. 2025, 17, 1159. https://doi.org/10.3390/rs17071159
Neuenschwander A, Guenther E, Magruder L, Sipps J. Creation of ICESat-2 Footprint Level Global Geodetic Control Points Using Crossover Analysis. Remote Sensing. 2025; 17(7):1159. https://doi.org/10.3390/rs17071159
Chicago/Turabian StyleNeuenschwander, Amy, Eric Guenther, Lori Magruder, and Jonathan Sipps. 2025. "Creation of ICESat-2 Footprint Level Global Geodetic Control Points Using Crossover Analysis" Remote Sensing 17, no. 7: 1159. https://doi.org/10.3390/rs17071159
APA StyleNeuenschwander, A., Guenther, E., Magruder, L., & Sipps, J. (2025). Creation of ICESat-2 Footprint Level Global Geodetic Control Points Using Crossover Analysis. Remote Sensing, 17(7), 1159. https://doi.org/10.3390/rs17071159