1. Introduction
In recent years, weakly supervised object detection (WSOD) and low-shot WSOD (LS-WSOD) have gained significant traction in both traditional computer vision and remote sensing image (RSI) applications. WSOD utilizes image-level labels that only contain the classification information of the samples, while LS-WSOD introduces a small number of instance-level labels into WSOD. WSOD methods significantly reduce the demand for detailed manual annotations, enabling large-scale exploitation of partially labeled data. LS-WSOD enhances detection performance with bounding box annotation. Most research on WSOD has primarily focused on integrating multiple-instance learning (MIL) techniques into deep neural network architectures, tackling persistent challenges such as part domination, missed detection, context confusion, and so on [
1,
2,
3,
4,
5,
6]. As these MIL-based WSOD approaches have matured, researchers have recognized their potential in the RSI domain [
7,
8,
9,
10,
11], where expansive scenes, complex geospatial features, and unbalanced categories create additional detection hurdles.
Nevertheless, WSOD frameworks remain much less accurate than fully supervised frameworks, highlighting the need for more robust strategies. To narrow this gap, recent studies have introduced the concept of low-shot weakly supervised learning [
12,
13,
14,
15], which involves supplementing weak labels with a limited amount of strong supervision (instance-level labels). These LS-WSOD methods can considerably improve detection fidelity. By injecting a small set of fully annotated examples, LS-WSOD offers a more efficient means of boosting performance without incurring the high costs associated with labeling every instance. The experiments in these studies show that using a very small number of strong labels (10 shots at most) can significantly improve the performance of WSOD. This demonstrates the importance of low-shot learning in the field of weakly supervised object detection, as well as the strong potential for utilizing the information in weakly supervised labels.
Despite substantial advancements, existing WSOD and LS-WSOD approaches still need to address the following issues:
(1) Part domination. In WSOD, because only image-level labels are provided, the training process lacks explicit information about object location and size. Consequently, the network often prioritizes the most discriminative local features of the object in the image-level classification task, which is shown in
Figure 1. This overreliance on local features frequently leads the model to focus on a small portion of the object. As a result, WSOD methods tends to produce bounding boxes that are too small or excessively localized, failing to encompass the entire object region. Affected by part domination, detection accuracy suffers significantly. For example, in conventional vision tasks, WSOD models may detect only a cat’s head instead of the entire cat; in remote sensing images, they may detect only the opening of a chimney rather than the full chimney structure.
(2) Context confusion. As only image-level labels are available, WSOD models in training often overemphasize background and contextual features that frequently co-occur with the object, leading to “context confusion”. Specifically, the model may regard frequently appearing background elements as part of the object itself, which easily results in false positives or missed detections, as shown in
Figure 1. This reliance on contextual information not only decreases detection accuracy but also limits the applicability of weakly supervised methods in complex environments. In remote sensing images, where many object categories exhibit strong geographical correlations (e.g., bridges with rivers, dams with reservoirs, and harbors with ships), contextual confusion becomes even more pronounced.
(3) Class imbalance. A long-tailed distribution is commonly observed in most object detection datasets and practical applications, indicating that samples of different classes are unevenly distributed within the dataset. In LS-WSOD, class imbalance leads to fewer strongly labeled samples being selected for minority classes, thereby causing a significant drop in performance for under-performed categories. This issue is particularly prominent in remote sensing tasks, where certain ground objects (e.g., dams, golf, and fields) are far rarer than others (e.g., vehicles and ships), further exacerbating the class imbalance problem.
(4) Excessive noise. Current state-of-the-art LS-WSOD approaches still rely on WSOD models or their outputs for fine-tuning or refinement. However, as WSOD methods generally yield relatively low performance, their models contain a considerable number of errors. Consequently, these LS-WSOD methods are still not capable of effectively harnessing strongly labeled data to overcome the large volume of noise and achieve efficient training. As a result, excessive noise prolongs the training process and adversely affects the model’s performance.
Facing the issues above, potential research directions for LS-WSOD include introducing the following three alternatives. First, active learning strategies can be used, where we strategically choose the most informative samples for strong labeling instead of randomly selecting samples. Specifically, for the LS-WSOD task, active learning can select samples severely affected by part domination. In the meantime, the long-tail distribution of classes should be taken in to consideration. Thereby, active learning could alleviate part domination and class imbalance and improve how the model handles the geospatial complexities of remote sensing images. Second, effective attention mechanisms can be incorporated to enable the model to more clearly distinguish between foreground and background features, thus reducing context confusion and improving the effectiveness of the fine-tuning process. Finally, the model’s detection performance can be actively evaluated during multi-stage fine-tuning. By discovering under-performed classes and adaptively modifying training strategies, the model can better overcome the noise introduced by WSOD methods.
To address the aforementioned issues, we propose a part domination-based active learning and enhanced fine-tuning (PDEF) framework. PDEF includes three novel modules: part domination-based adaptive active learning (PDAAL) is an active learning strategy that identifies the part domination pattern in model outputs to select hard samples for strong label annotation. Meanwhile, it employs an adaptive confidence threshold as a preliminary filter to balance sampling frequencies across classes with imbalanced, long-tailed distributions. Finally, it adopts a least-confidence method to further pinpoint the most challenging samples for the model. Parameter-efficient attention for context (PAC) introduces a parameter-efficient attention mechanism that can be effectively trained during fine-tuning. Unlike the convolutional block attention module (CBAM) and crossed post-decoder refinement (CPDR) [
16,
17], PAC utilizes one-dimensional (1D) horizontal and vertical convolutions for feature extraction instead of 2D convolutions, improving parameter efficiency while achieving more precise feature representation. Moreover, 1D convolutions can obtain larger receptive fields with a lower parameter cost, which helps capture long attention relationships within images, enhancing the model’s focus on context. As a result, it alleviates context confusion and accelerates the convergence of the training loss. Adaptive category resampling for tuning (ACRT) is employed in multi-stage active learning, where categories with suboptimal performance are resampled along with the corresponding samples in each stage. This process, supported by strong label annotations, enables the model to correct errors from WSOD through fine-tuning, thereby mitigating issues introduced by extensive noise. In summary, the key contributions of this study are as follows:
- 1.
We propose PDAAL to replace the traditional random strong label sampling in LS-WSOD, specifically addressing the part domination issue commonly encountered in WSOD. Through the discovery of the part domination pattern, adaptive parameters, and confidence evaluation, PDAAL identifies difficult samples, reduces sampling imbalance, and improves the quality of the selected strong annotation samples.
- 2.
We developed the PAC module to mitigate context confusion in WSOD models. Through the parameter-efficient design of 1D depthwise convolutions, PAC can be effectively trained, even in short-step fine-tuning.
- 3.
We adopt a multi-stage active learning approach and introduce ACRT. In each stage, we dynamically evaluate performance for each category and resample classes with poor model performance using a targeted approach. This effectively corrects errors in the original WSOD model without significantly increasing training costs.
- 4.
To the best of our knowledge, this is the first work to apply active learning to remote sensing LS-WSOD. We further integrate PAC and ACRT into our PDEF framework, achieving state-of-the-art results on the NWPU VHR-10.v2 [
18] and DIOR [
19] datasets. Extensive experiments verify the effectiveness of each proposed module.
In summary, our objective in this study is to propose a novel low-shot weakly supervised object detection framework for remote sensing images that is specifically designed to overcome part domination, context confusion, class imbalance, and noise. To achieve this, we introduce a PDAAL strategy, a PAC module, and an ACRT mechanism, thus enhancing detection performance under limited-annotation conditions.
The remainder of this paper is structured as follows:
Section 2 summarizes related research on WSOD, LS-WSOD, and active learning methods in object detection.
Section 3 describes our proposed framework. First, the overall structure and loss functions are introduced. Then, each proposed component of the framework—PDAAL, PAC, and ACRT—is introduced individually.
Section 4 introduces the experimental setup and analyzes the results of an ablation study, comparative experiments, qualitative analysis, and hyperparameter experiments.
Section 5 concludes the paper and outlines future research directions.
3. Methods
3.1. Overall Framework and Loss Functions
First, we introduce the overall framework. The proposed PDEF is trained on dataset
, which consists of two subsets: the weakly supervised subset
and the strongly supervised subset
. As shown in
Figure 2, we first pretrain a base model,
, only on the weakly supervised dataset
, and the strongly supervised subset
is empty. Subsequently, through
N-stage fine-tuning on a low-shot weakly supervised dataset
, the model is iteratively updated to
, which is based on
. In each stage, PDAAL actively selects and annotates the most informative samples from
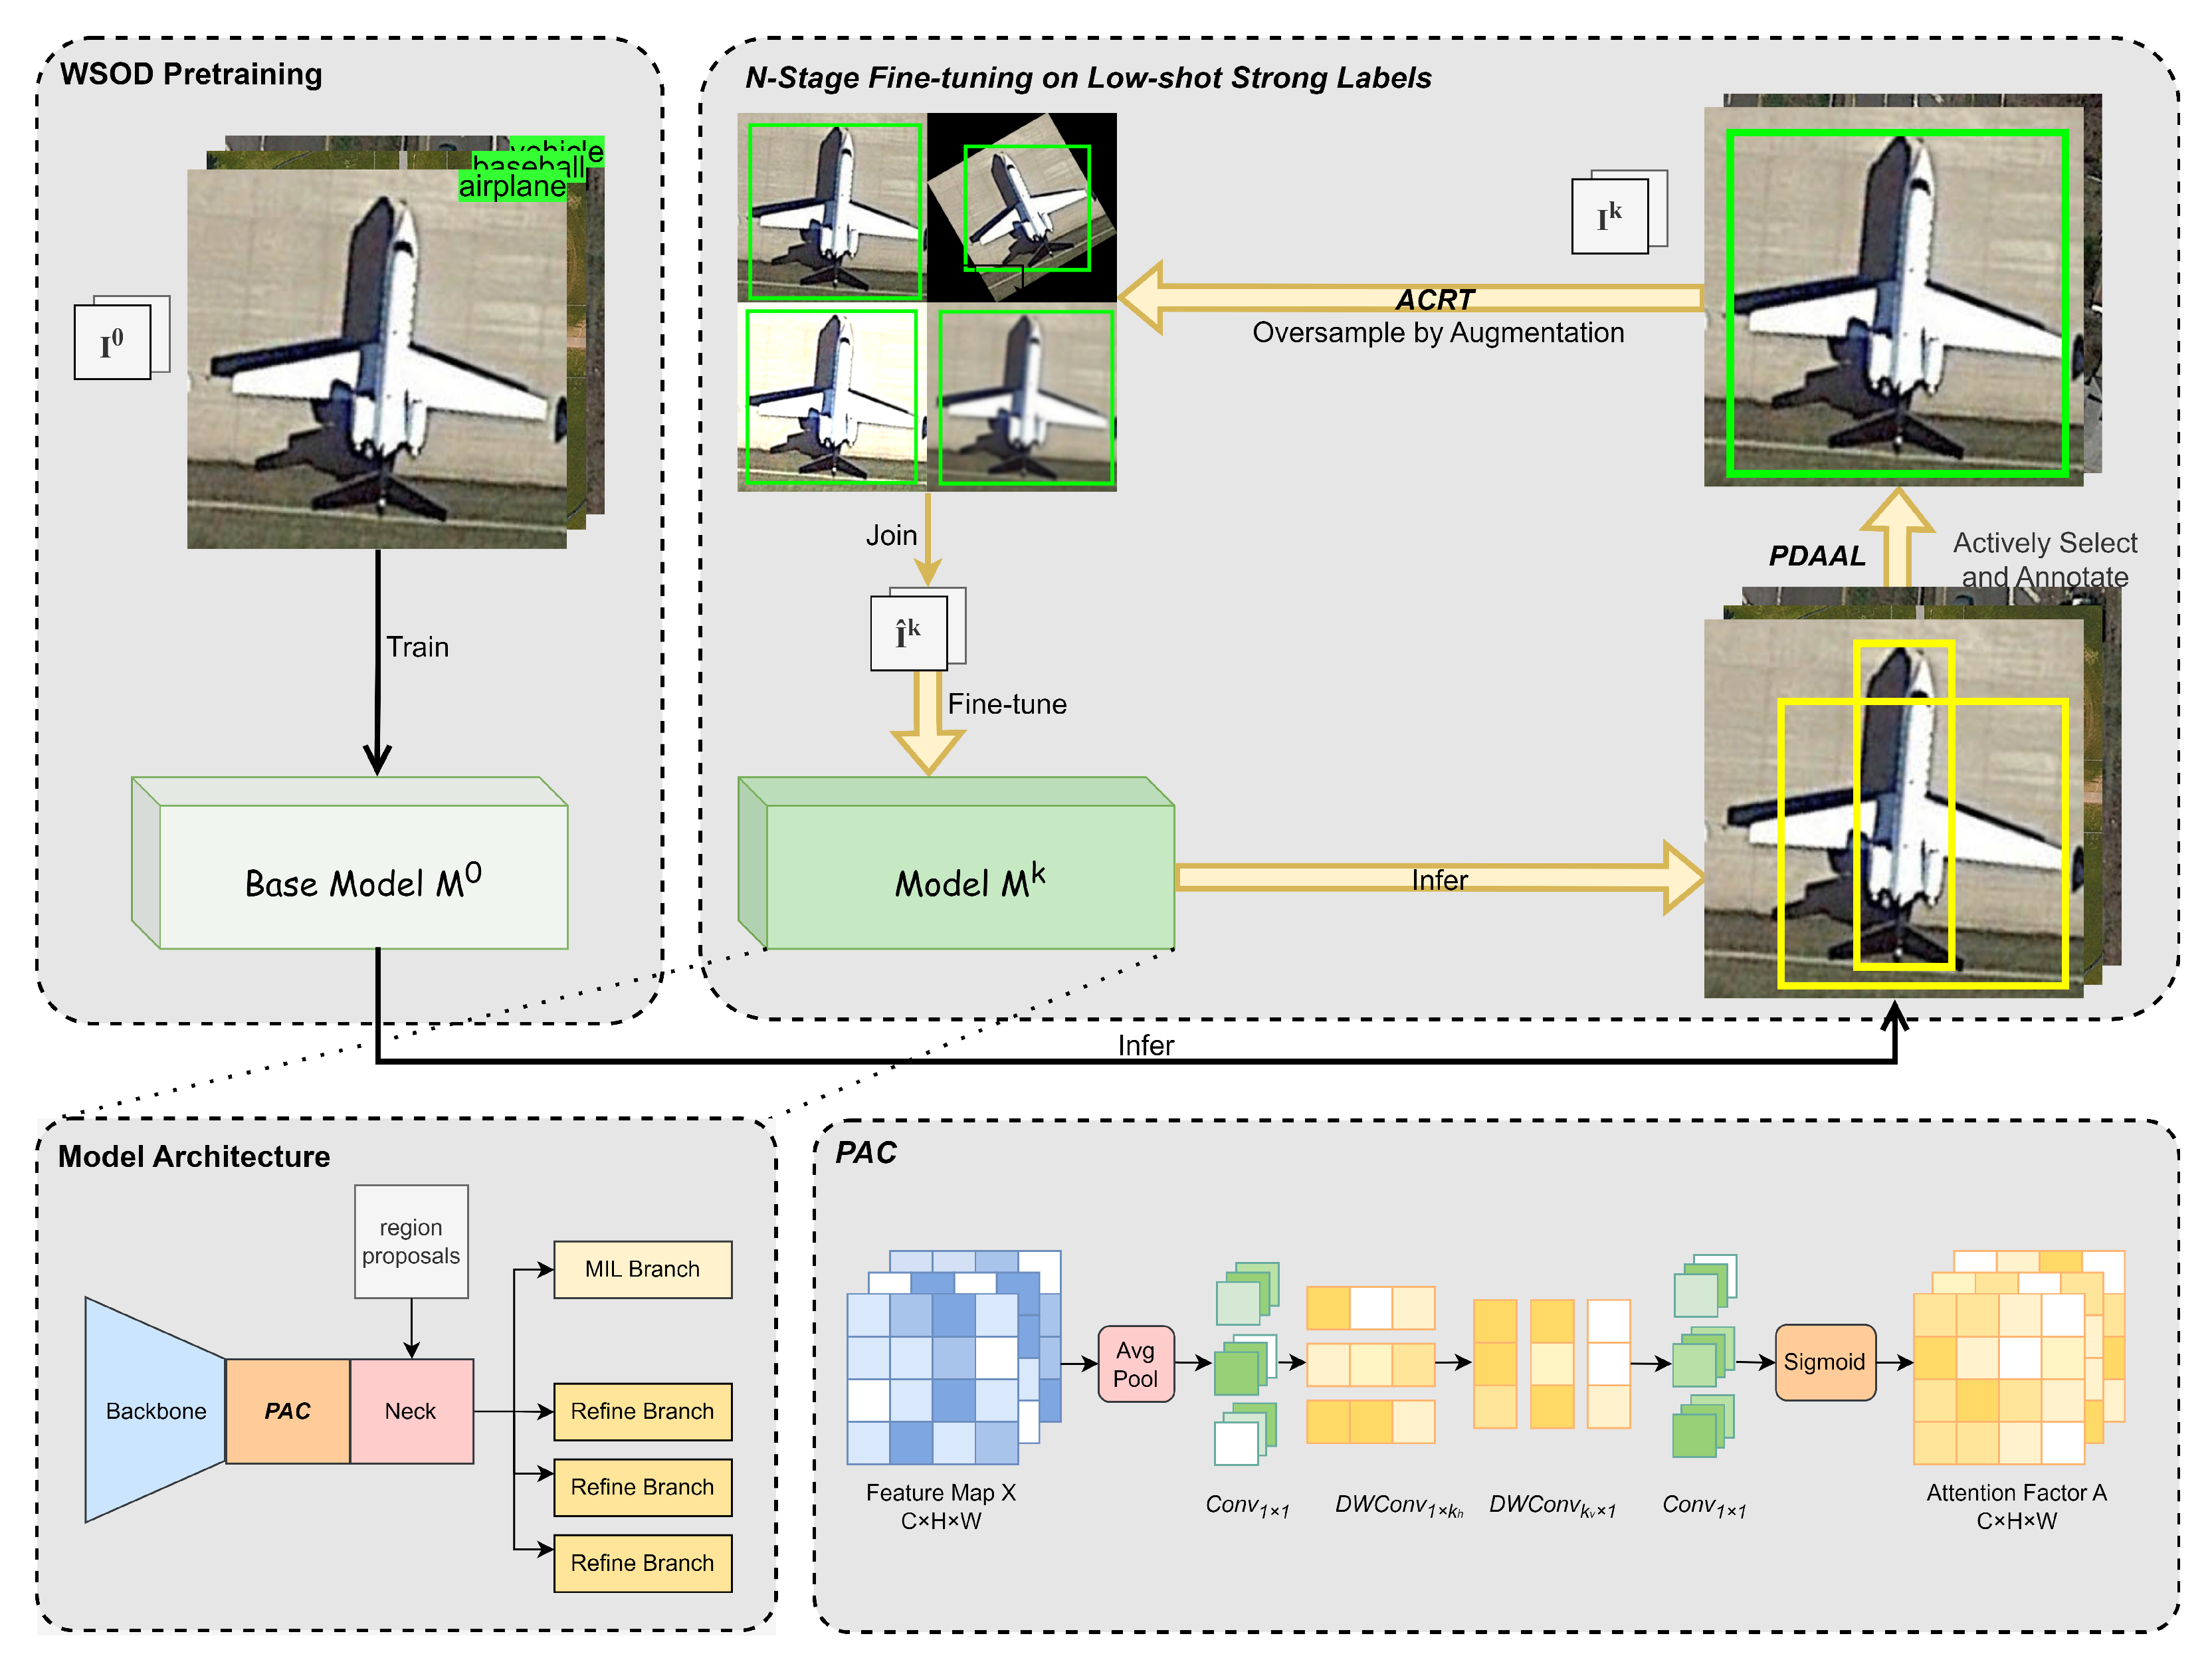
, while ACRT handles data augmentation and oversampling to mitigate the scarcity of labeled samples of under-performed classes. Additionally, our proposed PAC is integrated to exploit contextual cues, further enhancing low-shot detection performance. By integrating new strong annotations and refining the model, PDEF effectively leverages limited strong labels to achieve robust object detection performance in RSIs.
Second, we introduce loss functions under different types of supervision. As mentioned above, PDEF involves two training phases: pretraining using only weak supervision labels and fine-tuning under low-shot strong supervision. Below, we will explain the loss calculations in these two scenarios.
Pretraining Loss Calculation: In the pretraining phase, the loss is computed using weak labels (image-level labels) without bounding box annotations. This is based on the MIL [
21] paradigm, combined with pseudo-boxes. The overall loss consists of a combination of the MIL loss and refinement loss.
1. MIL Loss: The overall loss for MIL is
where
I is the input image,
R is the set of region proposals,
q represents the image-level class labels,
C is the set of object classes, and
is the classification score for region
r belonging to class
c.
2. Refinement Loss: Refinement is performed iteratively using pseudo-boxes generated from the MIL output. The loss at refinement step
m is
where
represents pseudo-boxes generated in the previous refinement step.
is the classification loss, and
is the bounding box regression loss.
3. Total Weak Supervision Loss: The overall loss for weak supervision is
where
M is the total number of refinement steps. We adopt
, in alignment with most WSOD method settings.
Fine-tuning Loss Calculation: In the fine-tuning phase with low-shot strong supervision (bounding box annotations available), the loss is calculated using ground-truth bounding boxes instead of pseudo-boxes.
1. Refinement Loss with Strong Annotations: Using ground-truth bounding boxes
G, the loss for the refinement step
m is
2. Total Strong Supervision Loss: The combined loss for strong supervision becomes
3.2. Part Domination-Based Adaptive Active Learning (PDAAL)
The purpose of PDAAL is to actively and adaptively select the most informative samples, which helps to alleviate part domination and class imbalance. PDAAL identifies hard samples in the training set after completing the previous training stage using the model . Specifically, these hard samples exhibit a part domination pattern in their predictions. PDAAL selects these hard samples in a class-balanced manner.
PDAAL is described in the following content, as well as in Algorithm 1. Given a dataset
, the corresponding detection results are represented as
. For each sample
, we analyze
to determine whether it contains a part domination pattern.
| Algorithm 1 Partdomination-based adaptive active learning (PDAAL) |
- Require:
Dataset with corresponding detection results , model , adaptive thresholds , selection budget B. - 1:
Initialize - 2:
for each sample in and each in do - 3:
for each pair of detection boxes in such that do - 4:
if and satisfy the following conditions: then - 5:
▹ Condition 1: and belong to the same category c. - 6:
▹ Condition 2: . - 7:
▹ Condition 3: . - 8:
▹ Condition 4: . - 9:
Add to . - 10:
end if - 11:
end for - 12:
end for - 13:
Using the least-confidence method [ 41], select the top- B samples from as . - 14:
Remove the selected samples from : . - 15:
Annotate and add the selected samples to : . - 16:
return ,
|
Let contain detection results, where the j-th detection box is denoted by . If two detection boxes satisfy the requirements for the part domination pattern, they are defined as and , where the area of is smaller than that of . These two boxes are considered to form a part domination pattern if the following conditions are met:
1. and belong to the same category c;
2. ;
3. , where ;
4. , where .
To achieve class-balanced sampling and prevent the excessive selection of samples from high-proportion categories, we introduce
to adaptively filter the detection results. The computation of
is shown in Equation (
6). It can be observed that the higher the proportion of a category in the dataset, the larger its
, resulting in fewer samples eligible for part domination pattern computation.
where
is the ratio of the sample count
of category
c to the maximum sample count
across all categories, and
is 0.3, which is selected based on a hyperparameter experiment. The normalized exponential method is introduced to
so that classes with high proportions quickly receive higher confidence penalties.
Subsequently, samples that satisfy the part domination pattern are grouped into a set,
. Using the least-confidence method [
41], the top-
B samples are selected from
for strong label annotation. These annotated samples are added to the set
to form
.
3.3. Parameter-Efficient Attention for Context (PAC)
The PAC module captures spatial correlations by introducing context refinement along both the horizontal and vertical dimensions, which is inspired by [
42,
43]. In contrast to previous attention-based approaches that focus primarily on channel-wise gating or standard spatial transformations, PAC integrates context via average pooling and local cues through 1D depthwise convolutions [
44]. This design provides a lightweight yet effective mechanism that can be seamlessly inserted into a convolutional backbone with negligible computational overhead. Moreover, PAC notably enhances the proposed PDEF framework by selectively strengthening or suppressing salient spatial features, thereby improving its performance under diverse visual conditions.
As shown in
Figure 2, given an input feature map
the PAC module first employs a
average pooling layer:
where the kernel size, stride, and padding are configured to maintain the original spatial resolution. Next, a
convolution refines the pooled features:
To extract horizontal and vertical contextual cues,
is passed through two 1D depthwise convolutions:
where
adopts a kernel size of
and
adopts
, where
and
are 13. The depthwise convolutions (DWConvs) have fewer parameters than standard convolution, and 1D strip convolution further reduces the parameter count compared to 2D convolution. This makes the module parameter-efficient, computationally efficient, and easy to train during fine-tuning. Additionally, average pooling combined with 1D strip DWConv enables the model to capture richer contextual information, alleviating context confusion and accelerating the correction of cognitive biases in the model. Both DWConvs use a group setting equal to the number of channels, preserving the channel dimension. Finally, another
convolution is applied, followed by a sigmoid function:
producing the attention factor
. In practice,
can be multiplied element-wise with the original feature map
(or a subsequent feature tensor) to emphasize or attenuate spatial regions in a context-aware manner. By combining horizontal and vertical cues in a channel-preserving manner, PAC provides an efficient means to improve feature representation quality in PDEF, which alleviates context confusion.
3.4. Adaptive Category Resampling for Tuning (ACRT)
The goal of ACRT is to enhance the error-correction capability of the original WSOD model during the fine-tuning phase using strong labels without significantly increasing training costs. Due to the absence of instance-level labels in WSOD tasks, the initial model may develop substantial cognitive biases. Such issues are particularly prominent in RSIs due to several inherent challenges in remote sensing images. The challenges include the wide range of object scales, the complexity of background information, and the varied orientations of objects caused by different viewing angles. On the one hand, brief fine-tuning may not effectively correct such excessive noise, especially for under-performed categories and scenarios. On the other hand, prolonged fine-tuning may lead to the overfitting of the model to classes that already perform well. This limitation can hinder the fine-tuning process, preventing the fully supervised samples from providing maximum benefit during training. ACRT employs adaptive class resampling to address these issues.
Before commencing fine-tuning at stage k, ACRT evaluates the performance of on the training set . It selects the bottom 10% of categories for which the model’s average precision (AP) is more than 50% lower than its best performance. For these categories, ACRT performs data augmentation-based resampling of the strong label data in . The augmentation techniques include brightness stretching, rotation, blurring, color transformation, and random cropping; three of these methods are randomly selected in each resampling. If no categories meet the criteria, ACRT refrains from additional resampling to avoid unnecessary training costs.
We introduce a set of categories for which the model performs poorly:
Among the categories in the bottom 10%, we include only those that satisfy the above criterion to form the final . For simplicity, we assume that already represents the exact set of categories to be enhanced.
If
, we perform data augmentation on the images of those categories in the training set
. Let the set of possible augmentations be
where, for example,
For each image
I, three different augmentation operations are randomly selected from
; this selection operation is denoted by
. For an image
x, the data augmentation function is defined as follows:
where
represents the operator that applies augmentation
t to the image.
Hence, for each category
,
All newly augmented samples are combined with the original training data to form
If
, no additional resampling will be performed. Finally, the updated training set
is used to perform fine-tuning at stage
k:
4. Experiments
4.1. Experimental Setup
4.1.1. Datasets and Evaluation Metrics
To evaluate the performance of PDEF, we conducted experiments using two widely recognized datasets in the field of WSOD in RSIs: NWPU VHR-10.v2 and DIOR. These datasets provide comprehensive scenarios to rigorously test the performance of PDEF across diverse remote sensing contexts.
The NWPU VHR-10.v2 (Northwestern Polytechnical University Very High Resolution) dataset is derived from the NWPU VHR-10 dataset [
18], designed for object detection tasks in high-resolution remote sensing images. It comprises training and testing sets of 879 and 293 images, respectively, and 3599 annotated object instances with horizontal bounding boxes across 10 categories. The dataset’s images are derived from various high-resolution sources and feature diverse backgrounds and environmental conditions. NWPU VHR-10.v2 was derived from NWPU VHR-10 by cropping the images to a fixed size (400 × 400 pixels), and it is widely used for weakly supervised object detection algorithms in RSIs.
The DIOR (object detection in optical remote sensing) dataset is a large-scale benchmark designed to address the challenges of object detection in remote sensing images [
19]. It contains 11,725 images for training, 11,738 images for testing, and 192,472 annotated object instances with horizontal bounding boxes across 20 categories. The dimensions of the images are fixed at 800 × 800 pixels. DIOR contains images with diverse conditions, weather, seasons, and spatial resolutions, offering high inter-class similarity and intra-class variability. The dataset also features a wide range of object scales, making it ideal for evaluating algorithm performance for targets with significant size variations. DIOR serves as a comprehensive resource for the development and validation of deep learning-based object detection methods for RSIs.
Average precision (AP) and the mean of AP (mAP) are adopted as evaluation metrics to illustrate the detection performance of our PDEF and other detection models. AP and mAP are defined as follows:
(true positive): The count of actual positive samples that were accurately classified as positive.
(false positive): The count of actual negative samples that were mistakenly classified as positive.
(false negative): The count of actual positive samples that were incorrectly classified as negative.
where
and
are the recall and precision at the
n-th threshold, respectively. Since both OICR [
2] and multiple instance self-training (MIST) [
21] were evaluated using the VOC07 [
45] protocol, which calculates AP using an 11-point interpolation method, we also followed this discrete AP calculation method in our experiments.
where
N is the number of categories in the dataset, and
is the average precision for the
i-th category.
4.1.2. Implementation Details
Experimental environment: Table 1 presents the hardware and software configurations used for our experiments, including an i7-13700KF CPU, 16 GB DDR5 RAM, and an RTX 4090 GPU running on Ubuntu 22.04.4. We implemented our models in Python 3.8 using PyTorch 2.2, with CUDA 11.8 providing GPU acceleration.
Network architecture: VGG16 [
46] serves as the backbone of our model, as it is utilized in the majority of WSOD and LS-WSOD algorithms. Given the outstanding performance and stability of MIST [
21] in WSOD tasks, we selected MIST as the baseline model. Furthermore, the PAC module is integrated before the model’s neck to enhance the feature maps, thereby improving the model’s ability to capture contextual information.
Training and testing setup: We used the official splits provided by the NWPU VHR-10.v2 and DIOR datasets to partition the data into training, validation, and test sets. For data preprocessing and augmentation, samples were resized to scales of (480, 576, 688, 864, 1000, 1200), and horizontal flipping augmentation was applied to improve the robustness and performance of PDEF. We employed the stochastic gradient descent (SGD) optimizer with a learning rate of
. The SGD optimizer incorporates a warm-up phase followed by decay, and a momentum of 0.9 to stabilize and accelerate training. The batch size was 1. The fine-tuning process was divided into five stages. As illustrated in
Section 3.2, PDEF selects
B samples for strong label annotation at each stage. The budget
B is set to 20 for NWPU VHR-10.v2 and 40 for DIOR. The fine-tuning step size is determined by the number of strong labels, with each strong label sample undergoing 300 iterations. During inference, non-maximum suppression (NMS) is applied to prevent the model from introducing excessive boxes. All experiments were repeated three times on different base models to ensure robustness, and the results were averaged to mitigate randomness.
4.2. Ablation Study
An ablation study was carried out with different module combinations to validate the effectiveness of our proposed modules: PDAAL, PAC, and ACRT. Additionally, we compared PDAAL with the random sampling method; in the attention module, we compared PAC with CBAM [
16]. The experiments were performed on the NWPU VHR-10.v2 and DIOR datasets using five base models, and the average results are reported in
Table 2 and
Table 3.
In the experiments on the NWPU VHR-10.v2 dataset, method A, employing only a random sampling strategy, served as the baseline model, which resulted in an mAP of 76.2%, showing relatively weak performance. Method B (PDAAL only) incorporates PDAAL as the active sampling strategy, which raises the mAP to 77.6%, highlighting PDAAL’s significant contribution to hard sample selection and balanced sampling. Methods D (PAC only) and E (ACRT only) introduce the PAC and ACRT modules, respectively, improving the mAP to 77.4% and 77.5%. This demonstrates that PAC enhances contextual understanding, while ACRT excels in mining samples of under-performed classes. Experiments combining multiple modules further reveal substantial synergy: method F (PDAAL + PAC) and method G (PDAAL + ACRT) achieve mAPs of 78.5% and 78.7%, respectively, showcasing the strong collaborative potential of PDAAL with other modules. Finally, method I (PDAAL + PAC + ACRT) achieves the highest mAP of 79.8% by integrating all modules, validating the complementary nature of the modules and their effectiveness in joint optimization.
The ablation study on the DIOR dataset revealed a similar trend to that on NWPU VHR-10.v2. The baseline model, method A, achieves an mAP of 41.5%. When adding PDAAL alone (method B), the mAP increases to 43.3%, underscoring PDAAL’s versatility and effectiveness across different datasets. Methods D (PAC only) and E (ACRT only) raise the mAP to 42.4% and 42.9%, respectively, confirming the independent contributions of PAC and ACRT. Methods F (PDAAL + PAC) and G (PDAAL + ACRT) reach mAPs of 44.0% and 44.5%, demonstrating the superior performance of module collaboration. Finally, method I (PDAAL + PAC + ACRT) achieves the highest mAP of 45.4%, significantly outperforming other combinations, indicating the comprehensive effectiveness of PDAAL, PAC, and ACRT.
A comparison of methods C (CBAM only) and D (PAC only) shows that, on the NWPU dataset, method C achieves an mAP of 76.7%, while method D achieves 77.4%. On the DIOR dataset, method C reaches an mAP of 42.1%, compared to 42.4% for method D. This comparison suggests that PAC outperforms CBAM in feature extraction, especially on the NWPU dataset. Moreover, the advantages of PAC are further validated in multi-module combinations, such as method H (PAC + ACRT). Method H achieves mAPs of 78.5% and 43.6% on the NWPU and DIOR datasets, respectively, significantly surpassing the independent performance of method C. Although CBAM contributes to feature attention allocation, its performance improvement is limited compared to PAC, indicating that PAC is better suited for the feature requirements of remote sensing images and the field of LS-WSOD fine-tuning.
We also employed the
t-test to verify the differences resulting from the incorporation of our modules. Using the performance metrics obtained on the NWPU VHR-10.v2 and DIOR datasets, we performed
t-tests comparing method set A (baseline) and method sets B (PDAAL only), D (PAC only), E (ACRT only), and I (PDAAL + PAC + ACRT). The resulting
p-values were all below 0.05, indicating that each of our modules, whether integrated individually or combined, clearly improves performance. However, when performing a
t-test comparing method sets C (CBAM only) and D (PAC only), the
p-values obtained on NWPU VHR-10.v2 and DIOR are 0.12 and 0.32, which are over 0.1. This is primarily because CBAM itself provides some improvement (+0.5% and +0.6%), which results in a smaller performance gap between sets C and D. Moreover, the
t-test requires more experimental repetitions for clearer differentiation. Nevertheless, our PAC module achieves a greater performance improvement (+1.2% and +0.9%) and generates superior attention maps compared to CBAM, as further discussed in
Section 4.4.2.
4.3. Comparisons
4.3.1. Comparisons with the State of the Art
Table 4 shows the mAPs of various weakly supervised and low-shot weakly supervised object detection methods on the NWPU VHR-10.v2 dataset. “WSOD” refers to methods that use only image-level labels (such as WSDDN, OICR), while “LS-WSOD” denotes methods that use image-level labels and 200 additional fully annotated samples (e.g., BCNet, ITNet, and Ours).
From
Table 4, we see that even the best WSOD methods (such as IMIN) achieve an mAP of only 65.2%, indicating room for improvement. By contrast, the low-shot weakly supervised methods BCNet and ITNet reach 70.5% and 75.3% mAP, respectively, far exceeding the performance of the WSOD approaches. This shows that a small number of fully annotated data samples play a vital role in boosting detection performance.
With the same low-shot setting (Budget 100), our PDEF achieves an mAP of 79.8%, improving upon BCNet and ITNet by 9.3% and 4.5%, respectively. The per-class results show that our approach has clear advantages in multiple categories. For example, its AP rises from 15.7% (ITNet) to 24.8% for the Bridge category and from 78.0% to 91.4% for Harbor. The AP for the Vehicle category also increases by 12.1%.
Table 5 presents the detection results of both the WSOD and LS-WSOD methods on the DIOR dataset, which contains 20 categories. For easier viewing,
Table 5 is split into two parts: the first 10 categories are shown in the top half, and the last 10 categories plus the final mAP are shown in the bottom half.
In the “WSOD” section, classical WSOD methods (such as WSDDN, OICR, and TCANet) have relatively low overall performance on DIOR, with most mAP values being around 20–30%. The highest in this group is IMIN, reaching only 29.1%. When we add 200 fully labeled images, BCNet and ITNet show improved mAPs of 36.1% and 42.3%, respectively, demonstrating the importance of limited fully annotated data for complex object detection tasks in RSIs.
In comparison, our PDEF reaches an mAP of 45.4%, which is 9.3% and 3.1% higher than those of BCNet and ITNet, respectively. Our method also performs better on most single categories. Our improvements are especially noticeable for Overpass, Ship, Storage Tank, and Vehicle—categories that are often more complex or confusing. For instance, the AP for Overpass increases from 26.8% (BCNet) or 30.5% (ITNet) to 40.8%, while that for Ship jumps from 21.0% or 26.7% to 58.2%. These findings show that combining a small number of fully labeled samples with an improved weakly supervised detection strategy can effectively handle diverse and complicated targets in RSIs.
Observing the mAP results on NWPU VHR-10.v2 and DIOR, we can further analyze the contributions of the different modules. First, ACRT performs adaptive resampling for low-performance classes during fine-tuning, thereby improving performance for those classes. Compared to LS-WSOD methods such as ITNet, PDEF shows improvements for classes with relatively low performance, such as Bridge in NWPU VHR-10.v2 and Bridge, Dam, and Train Station in DIOR. Second, the contribution of PAC to performance improvements in classes with severe context confusion, such as Bridge, Dam, and Overpass, is also significant. By focusing on generating attention weights for contextual information, PAC enables the model to better distinguish between objects in these classes and their accompanying backgrounds. However, despite PDEF achieving considerable improvements in detection performance compared to previous work, there remains room for further enhancement. Most of the failed detections arise from low-resolution samples, in which the objects are too small and the backgrounds are too extensive. Therefore, in future work, we can focus on multiscale feature fusion or introduce a scale classifier for remote sensing images to improve how the model handles such samples. In summary, on both the NWPU VHR-10.v2 and DIOR datasets, our PDEF outperforms not only WSOD approaches but also state-of-the-art LS-WSOD methods using the same weak labels plus a limited strong label budget. These results confirm that LS-WSOD can lead to higher performance and demonstrate the effectiveness of our proposed approach.
4.3.2. Comparison of Different Active Learning Strategies
In this part, we compare the performance of our proposed PDEF with that of other active learning strategies. To ensure fairness, we used MIST as the baseline model and evaluated both the standalone PDAAL method and PDAAL + PAC + ACRT (ensemble) in comparison with other active learning methods combined with MIST. The active learning methods included in the comparison are as follows: (1) u-random, which performs uniform random sampling for strong label annotation; (2) b-random, which performs balanced sampling to ensure uniform selection across all classes; (3) entropy-sum, which calculates the total entropy of the predicted boxes in each image to determine sample uncertainty and selects the most uncertain samples; (4) entropy-max, which calculates the maximum entropy of the predicted boxes in each image to determine sample uncertainty and selects the most uncertain samples; (5) core-set, which follows the approach described in [
50] for sample selection based on a core-set strategy; (6) core-set-ent, which follows the core-set approach described in [
51] with additional strong label annotations; and (7) box-in-box (BiB), which follows the active strategy proposed by [
39]. All experiments were conducted on three different base models, and the average results across the three experiments are reported.
As shown in
Figure 3, on the NWPU VHR-10.v2 dataset, our proposed PDEF (ensemble) method demonstrates superior performance, consistently leading across all stages. Its mAP steadily improves with each stage, showcasing excellent overall performance. In comparison, the PDAAL method, though slightly behind PDEF, exhibits a very stable improvement trend.
As shown in
Figure 4, our PDEF also performs exceptionally well on the DIOR dataset. In the first stage, its mAP is significantly higher than those of other methods and continues to increase substantially with each stage, ultimately reaching the highest level. PDAAL’s performance on the DIOR dataset is similar to its results on the NWPU VHR-10.v2 dataset. Although slightly inferior to PDEF, its improvement trend remains consistent and steady. Alongside PDEF, it significantly outperforms other methods across all stages, demonstrating its ability to maintain efficient learning and highlighting its robustness and broad applicability.
The significant performance improvements seen in the ensemble and PDAAL methods arise because PDAAL strategy effectively adapts to the LS-WOSD task in RSIs. PDAAL can efficiently select challenging samples exhibiting the part domination pattern at each stage, while also accounting for class imbalance. As a result, given the same budget, PDAAL better addresses issues related to part domination and class imbalance compared to other strategies. Meanwhile, the ensemble approach incorporates PAC and ACRT, placing emphasis on mitigating context confusion and model noise, thus further enhancing the model’s ability to utilize the samples selected by PDAAL. These methods complement each other to jointly enhance model performance. Overall, the PDEF method achieves the best performance on both datasets, reflecting its strong active learning selection strategy, excellent feature-learning capability, and superior fine-tuning for base model correction. PDAAL, as an effective active learning strategy, ranks just behind PDEF in performance. Both methods exhibit significant performance improvements across multiple stages, validating their application value in active learning. Specifically, the PDEF method is ideal for scenarios requiring the highest performance, while PDAAL, through comparative analysis, is proven to be an efficient active learning strategy tailored for LS-WSOD in RSIs.
4.3.3. Comparison of Computational Performance
Table 6 summarizes the inference efficiency of our proposed PDEF model compared with four state-of-the-art weakly supervised object detection methods on the DIOR test dataset. We compare the methods in terms of mAP, the number of parameters (in millions), floating-point operations (FLOPs, in billions), and latency (second). Among these methods, PDEF achieves the highest detection accuracy at 45.4% mAP. In terms of model complexity, PDEF contains 135.5 M parameters, which is similar to BCNet and ITNet (134.7M). PDEF does not have an advantage from the perspective of FLOPs and latency, being 2.45× and 1.62× those of OICR, respectively. However, OICR is a WSOD method and does not incorporate instance-level labels, resulting in significantly lower mAP performance (16.5%). Our method’s FLOPs and latency are 1.13× and 1.14× those of the LS-WSOD methods (BCNet and ITNet), respectively. On this basis, our method achieves a clear performance improvement, making the computational cost of inference acceptable. To reduce the computational cost during inference, future research can focus on retraining with lightweight models. Overall, our approach effectively balances accuracy and computational overhead, highlighting its potential for large-scale, real-world object detection tasks under low-shot weak supervision.
Another point worth mentioning is the training cost of PDEF. Based on the experimental environment in
Section 4.1.2, training the pretraining model with PDEF on the DIOR dataset takes approximately 13 h, while fine-tuning with low-shot strong labels requires an additional 7 h (including time for PDAAL sample selection and ACRT performance evaluation). Active learning selects samples to annotate by measuring model uncertainty and analyzing output distributions, which inevitably increases computational overhead. However, active learning enhances the cost-effectiveness of manual labeling. With advancements in active learning techniques and hardware computing performance, active learning will become increasingly important and practical.
4.3.4. Comparison Between Image Budget and Box Budget
In this part, we discuss the impact of using different units as the budget in active learning. In traditional LS-WSOD tasks, the budget is typically based on the number of images, such as 200 in total or 40 images per stage for strong label annotation. However, the number of objects in different samples varies significantly. For instance, in the DIOR training dataset, the number of objects per sample ranges from 1 to about 30, with an average of 5.8. If certain active learning strategies tend to select samples with more objects for strong label annotation, the model will gain access to more trainable positive samples using the same image budget. This could lead to an unfair comparison.
To address this, we conducted experiments using the number of ground-truth bounding boxes as the budget instead of the number of images. Using MIST as the base model, we tested various active learning methods on the DIOR dataset. In each experiment, we set the number of stages to 5. Referring to the average number of objects per sample in the DIOR training set, we set the bounding box budget per stage to 240.
Table 7 reports the number of box or image samples that each active learning method can select per stage, as well as the corresponding mAP performance in both the box-based and image-based budget settings.
The results show that, compared to the image-based budget, all methods experience performance degradation when using the box-based budget. Notably, the entropy-sum and core-set methods exhibit the largest performance drops, decreasing by 3.2% and 2.5%, respectively. It is also evident that, under the box-based budget constraint, these two methods select the fewest image samples per stage, as they tend to prefer samples with more objects.
In contrast, although our PDAAL method also encounters a performance decline, the decrease is relatively limited. PDAAL remains the best-performing method among all active learning strategies. This further demonstrates the effectiveness and robustness of our PDAAL approach, showing that it can identify the most challenging samples while maintaining a more balanced selection of samples.
4.4. Qualitative Results
4.4.1. Strong Samples Selected by PDAAL
Figure 5 illustrates some samples selected by PDAAL on the DIOR dataset, along with the corresponding inference results of the model at the last stage. It can be observed that PDAAL successfully selects many part-dominated samples. For instance, the object is dominated by parts of an airplane fuselage or portions of a golf course. This demonstrates that our proposed PDAAL method effectively identifies the most challenging samples in WSOD tasks for strong label annotation, thereby maximizing the efficiency of manual annotation.
4.4.2. Attention Maps
Figure 6 shows spatial attention maps obtained by employing CBAM or PAC as the attention module. The examples include overpasses, tennis courts, airplanes, and ships combined with harbors as detection targets. The comparison clearly demonstrates that our proposed PAC module produces more precise attention maps, whereas the attention generated by CBAM tends to aggregate broadly, covering significant portions of irrelevant background regions. By contrast, PAC can more effectively distinguish between foreground and background features, thereby alleviating context confusion.
This advantage arises because PAC’s 1D convolution modules capture fine-grained features, allowing the model to more accurately focus on object regions. While CBAM generates coarse-grained and broad attention aggregation. Furthermore, PAC uses convolutions to effectively fuse channel information, followed by horizontal and vertical spatial convolutions, efficiently capturing local spatial contextual relationships. Capturing spatial context further improves the ability to distinguish objects from backgrounds, reducing irrelevant background responses.
4.4.3. Results on NWPU VHR-10.v2 and DIOR
Figure 7 presents the object detection results of our proposed PDEF on the NWPU VHR-10.v2 dataset compared with the baseline MIST. From left to right, the detection effects of four object categories—Airplane, Baseball Field, Bridge, and Ship—are displayed. The comparison shows that PDEF demonstrates superior performance in object detection. First, for airplane detection, PDEF aligns more accurately with the ground-truth bounding boxes while avoiding some false positives observed in the baseline method. For baseball field detection, PDEF also achieves closer alignment with the ground truth, with more precise bounding in fine-grained regions such as the infield and outfield. Regarding bridges and ships, PDEF reduces the excessive redundant boxes in the baseline results, showcasing stronger localization capabilities and boundary consistency. This indicates that the PDEF method is more robust in handling complex backgrounds and occluded scenes.
Similarly,
Figure 8 illustrates the detection results on the DIOR dataset. From left to right, the detection effects of four object categories—Baseball Field and Basketball Court, Ship, Dam, and Chimney—are shown. It can be observed that PDEF is closer to the ground truth in most scenarios, demonstrating higher detection recall. For baseball field and basketball court detection, PDEF exhibits stronger separation capabilities for multiple objects, such as basketball and tennis courts, avoiding the excessive overlap of boxes seen in the baseline method. In ship detection, PDEF significantly reduces the false negatives and false positives in the baseline results, especially in densely arranged ship areas, where the bounding boxes capture more objects and are clearer. For dams, PDEF better preserves the integrity of the objects, whereas the baseline method shows imprecise bounding box edges. Finally, in chimney detection, the PDEF method provides finer predictions of object boundaries, avoiding the part-dominated boxes seen in the baseline results and demonstrating its superiority. This shows that PDEF achieves significant improvements in robustness and performance on the DIOR dataset.
The detection result comparisons on NWPU VHR-10.v2 and DIOR reveal some phenomena that are worth further in-depth investigation. First, we can clearly observe that PDEF effectively reduces false positives in the background. This is because the introduction of PAC enhances the model’s understanding of context, increasing its ability to distinguish between foreground and background. Second, the part domination phenomenon is significantly alleviated; compared with the baseline, the proposed model can detect objects more completely instead of only detecting parts of objects. This is because the introduction of PDAAL allows the model to sufficiently learn from samples exhibiting the part domination pattern. As a result, PDEF greatly reduces the occurrence of missed detections, as ACRT can dynamically address insufficient training for specific classes during fine-tuning and reinforce training for those classes. Furthermore, the high-quality strong label samples provided by PDAAL and feature enhancement from PAC yield true positive detection results with higher confidence.
4.5. Hyperparameters
Table 8 and
Table 9 present the results of hyperparameter experiments for the PDAAL and PAC modules, aiming to determine the optimal hyperparameter combination. The DIOR dataset was used in these experiments, during which only the relevant module (PDAAL or PAC) was included in MIST. From the results, the optimal hyperparameters are found to be
,
,
, and
.
5. Conclusions
In this article, we proposed PDEF, a novel active learning framework for LS-WSOD in RSIs. To address the prominent challenges in WSOD and LS-WSOD for RSIs—such as part domination, context confusion, imbalance, and noise—we introduce PDAAL, PAC, and ACRT as solutions. Specifically, PDAAL is designed to mitigate the part domination issue through actively and evenly sampling challenging instances for annotation. PAC incorporates an efficient parametric module to focus on contextual information during fine-tuning, alleviating context confusion and accelerating the correction of errors in the original model. ACRT evaluates the model’s detection performance for each category during training and resamples challenging categories to correct biases in the model’s understanding of under-performed classes. Our PDEF achieves state-of-the-art mAP performance on NWPU VHR-10.v2 (79.8%) and DIOR (45.4%), outperforming the previous state-of-the-art method by 4.5% and 3.1%, respectively. Extensive experiments demonstrate the effectiveness of our proposed PDEF framework.
Furthermore, PDEF provides new insights and paradigms for practical remote sensing image object detection tasks. In real-world RSI engineering scenarios, dataset processing typically involves cleaning, slicing, and progressive annotation. After slicing, image-level annotations can be easily obtained for WSOD tasks, while during progressive annotation, a combination of abundant image-level and limited instance-level annotations can be utilized for LS-WSOD tasks. This approach enables the development of high-performing models in the early stages of the task, facilitating a soft launch. Additionally, incorporating active learning strategies can maximize the annotation efficiency and benefits.
Despite these encouraging results, several limitations remain. First, the proposals used in our method are still generated by traditional approaches, such as selective search [
52]. These methods produce an excessive number of proposals with insufficient precision, thereby affecting both efficiency and performance. Second, the proposed LS-WSOD method is unable to predict rotated bounding boxes, which hampers its detection performance for densely arranged objects in remote sensing images.
One promising avenue for future research is to optimize the quality and quantity of proposals to enhance the efficiency and performance of LS-WSOD methods. For example, the SAM can be used to generate the proposals [
6]. Another potential direction lies in exploring rotated bounding box detection to improve the detection performance for elongated and densely arranged objects, making it more suitable for object detection in RSIs. By exploring the aforementioned methods, we aim to move the LS-WSOD approach toward a more practical stage and further close the gap with fully supervised object detection performance in remote sensing images.


