Article

Investigation of the Spatiotemporal Patterns in Water Surface Temperature from Landsat Data in Plateau Rivers

1
State Key Laboratory of Hydraulics and Mountain River Engineering, Sichuan University, Chengdu 610065, China
2
PowerChina Chengdu Engineering Corporation Limited, Chengdu 610072, China
*
Author to whom correspondence should be addressed.
Remote Sens. 2025, 17(7), 1141; https://doi.org/10.3390/rs17071141
Submission received: 13 February 2025 / Revised: 16 March 2025 / Accepted: 20 March 2025 / Published: 23 March 2025

Abstract

:
Water temperature, a key environmental factor in river ecosystems, plays an important role in understanding the health of river ecosystems and addressing climate change. The Tibetan Plateau is sensitive to global climate change, and owing to its unique geographic and climatic conditions, the spatiotemporal distribution of water temperature in plateau rivers is highly heterogeneous. However, owing to the complex terrain and harsh climate, traditional water temperature monitoring methods struggle to provide comprehensive coverage. This study focuses on the downstream section of the Yarlung Tsangpo River and uses Landsat 7 and 8 images from 2004–2022. Considering the high water vapor content in the region and the satellite’s inherent system errors, a remote sensing-based model for interpreting water temperature in plateau rivers was developed. This model aims to address the limitations of traditional monitoring methods and provide a new technological approach for studying the spatiotemporal variations in water temperature in plateau rivers. The results show that the model has high accuracy (RMSE ranging from 1.00 °C to 1.85 °C), and regression correction can reduce the relative error by 1.6% to 22.2%. The water temperature downstream of the Yarlung Tsangpo River is influenced by a combination of climate, topography, and runoff inputs, resulting in clear spatiotemporal variation characteristics. Air temperature is the most important factor affecting water temperature, and both the intra-annual variations and spatial distributions of water temperature show significant regional differences. This study provides important data support and technical methods for long-term monitoring and ecological research on water temperature in plateau rivers, as well as scientific evidence for water resource management in plateau regions.

1. Introduction

Water temperature, an important environmental factor in river ecosystems, regulates many physical, chemical, and biological processes in rivers [1,2]. Accurately understanding and monitoring the spatial and temporal patterns of water temperature is key to comprehending the health status of river ecosystems, addressing climate change, and managing water resources in a scientifically sound manner [3]. The Tibetan Plateau is a region sensitive to global climate change, and its unique geographical and climatic conditions contribute to the spatial heterogeneity of plateau river ecosystems. Clarifying the water temperature status of a plateau river not only has profound implications for the study of its regional ecosystem status but is also highly important for understanding global climate change [4,5,6]. However, plateau rivers are characterized by vast uninhabited areas due to their high elevation, rugged terrain, and harsh climatic conditions, which pose significant challenges for river monitoring. The unique hydrographical conditions and extreme climate lead to specific water temperature distributions in the river [7,8]. Moreover, accurately monitoring and understanding the spatial and temporal distribution patterns of water temperature in plateau rivers are crucial for maintaining the health of river ecosystems, assessing the impacts of climate change, and optimizing water resource management strategies.
Remote sensing technology, with its advantages of wide spatial coverage, high-frequency observations, and noncontact measurements, provides an effective approach for large-scale and continuous monitoring of surface water temperature [9,10,11,12,13]. This method compensates for the limitations of in situ monitoring, such as sparse observation sites, limited data availability, and high costs. Significant progress has been made in remote sensing studies of lakes on the Tibetan Plateau. Researchers have used satellites such as AVHRR and MODIS to monitor lake surface temperature and analyze its spatiotemporal variations and influencing factors [9,14,15,16,17,18]. For example, Liu et al. utilized AVHRR data to construct a lake water temperature dataset covering 97 large lakes over a period of up to 35 years, providing valuable data support for water temperature studies of plateau lakes [16]. Using MODIS data, Song et al. analyzed the spatiotemporal variations in lake water temperature in 56 large lakes over 15 years, revealing the influences of water volume, elevation, and air temperature on water temperature [15]. Remote sensing captures long-term trends in lake surface temperature, revealing its sensitivity to climate change and deepening our understanding of climate-driven changes in plateau lakes [9,17,18,19]. In contrast, thermal monitoring of plateau rivers remains largely unexplored. The key limitations include the difficulty of accurately capturing narrow river channels with existing medium- and low-resolution satellites, the pronounced mixed-pixel effect caused by complex terrain, and the need to validate the applicability of traditional water temperature retrieval methods in riverine environments [20,21,22].
Landsat data, with their finer spatial resolution (60–120 m) and long temporal coverage (since 1984), offer the potential for high-precision retrieval of river thermal conditions [22]. The feasibility and accuracy of Landsat in studying river thermal patterns have been validated in various rivers worldwide, including the Green River, Yakima River, and Columbia River in the United States; the Rhône River in France; the Tisza River in Central Europe; and the Qingjiang, Yangtze, and Han Rivers in China [10,22,23,24,25,26]. However, river water temperature retrievals still face multiple challenges. Rivers are typically narrow and morphologically complex (e.g., braided channels and mid-channel bars), making water pixels susceptible to interference from land pixels [21]. Handcock et al. noted that for rivers narrower than three pixels in Landsat 7 imagery, the retrieved water temperatures can be overestimated by 2.2–7.6 °C [22]. Additionally, Landsat thermal infrared imagery is resampled (using cubic convolution to 30 m) before being provided to users, introducing mixed water–land pixels and further increasing uncertainties in retrieval accuracy [27]. Accurately extracting water temperature while minimizing shoreline effects is crucial; however, research on optimal water temperature sampling locations remains limited. Shi et al. reported that selecting water pixels via square or circular regions outperformed single-grid selection methods, although these approaches may not be suitable for narrow rivers [10]. Furthermore, Landsat-derived water temperatures tend to underestimate low temperatures and overestimate high temperatures. These errors may result from multiple interacting factors and are difficult to characterize fully, highlighting the necessity of appropriate correction methods to improve temperature retrieval accuracy [10,28]. Currently, various surface temperature retrieval methods have been developed, including the split-window algorithm, the single-channel algorithm, and the radiative transfer method [29,30,31]. However, the application of the split-window algorithm is hindered for Landsat 7 and 8 because of the presence of only a single thermal infrared band and stray light issues, respectively [32,33]. The single-channel algorithm, particularly the Qin algorithm and JM&S algorithm, is among the most representative methods [34,35]. However, it is highly sensitive to water vapor inputs, and when atmospheric water vapor exceeds 3 g/cm2, the retrieval accuracy decreases significantly, with errors exceeding 3K [36,37]. In the complex climatic conditions of the Tibetan Plateau, its retrieval accuracy may be suboptimal. In contrast, the radiative transfer method, which incorporates atmospheric parameters to correct radiative transfer processes, has demonstrated relatively high accuracy and stability in river water temperature studies, as shown in numerous studies [28,38,39].
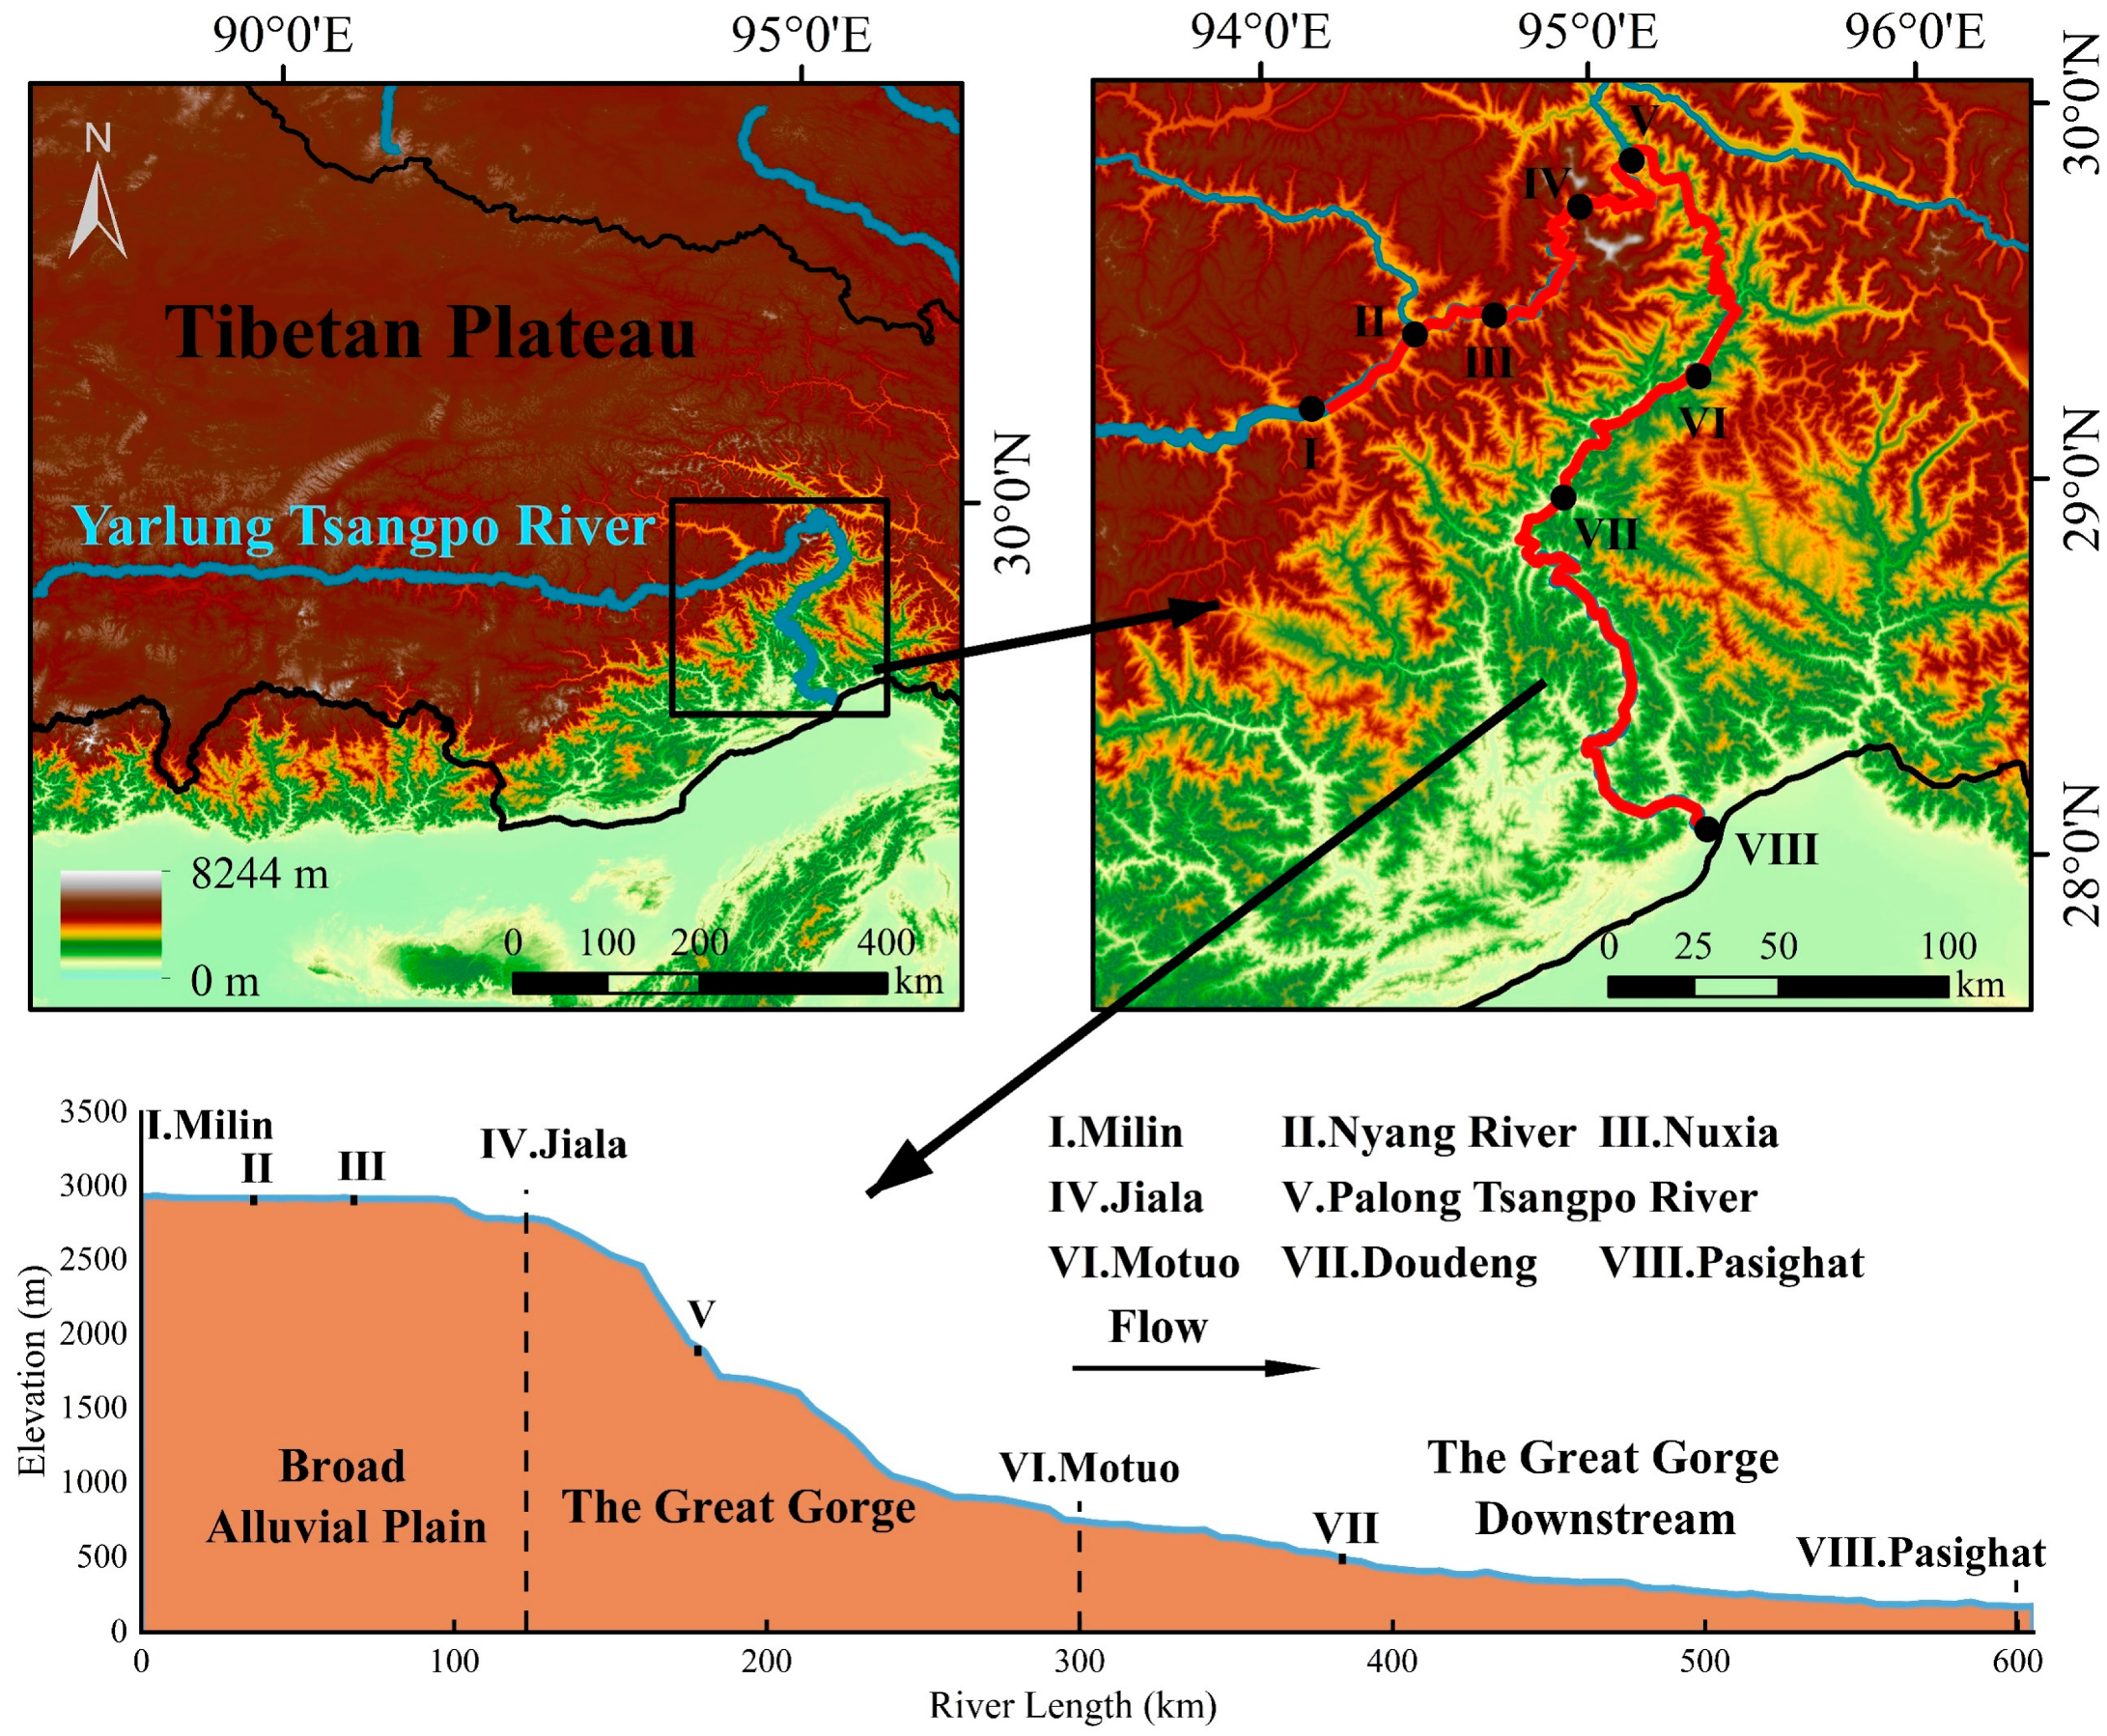
As one of the most representative plateau rivers, the Yarlung Tsangpo River serves as a reference area for studying ecosystem changes and vulnerabilities in response to climate change [
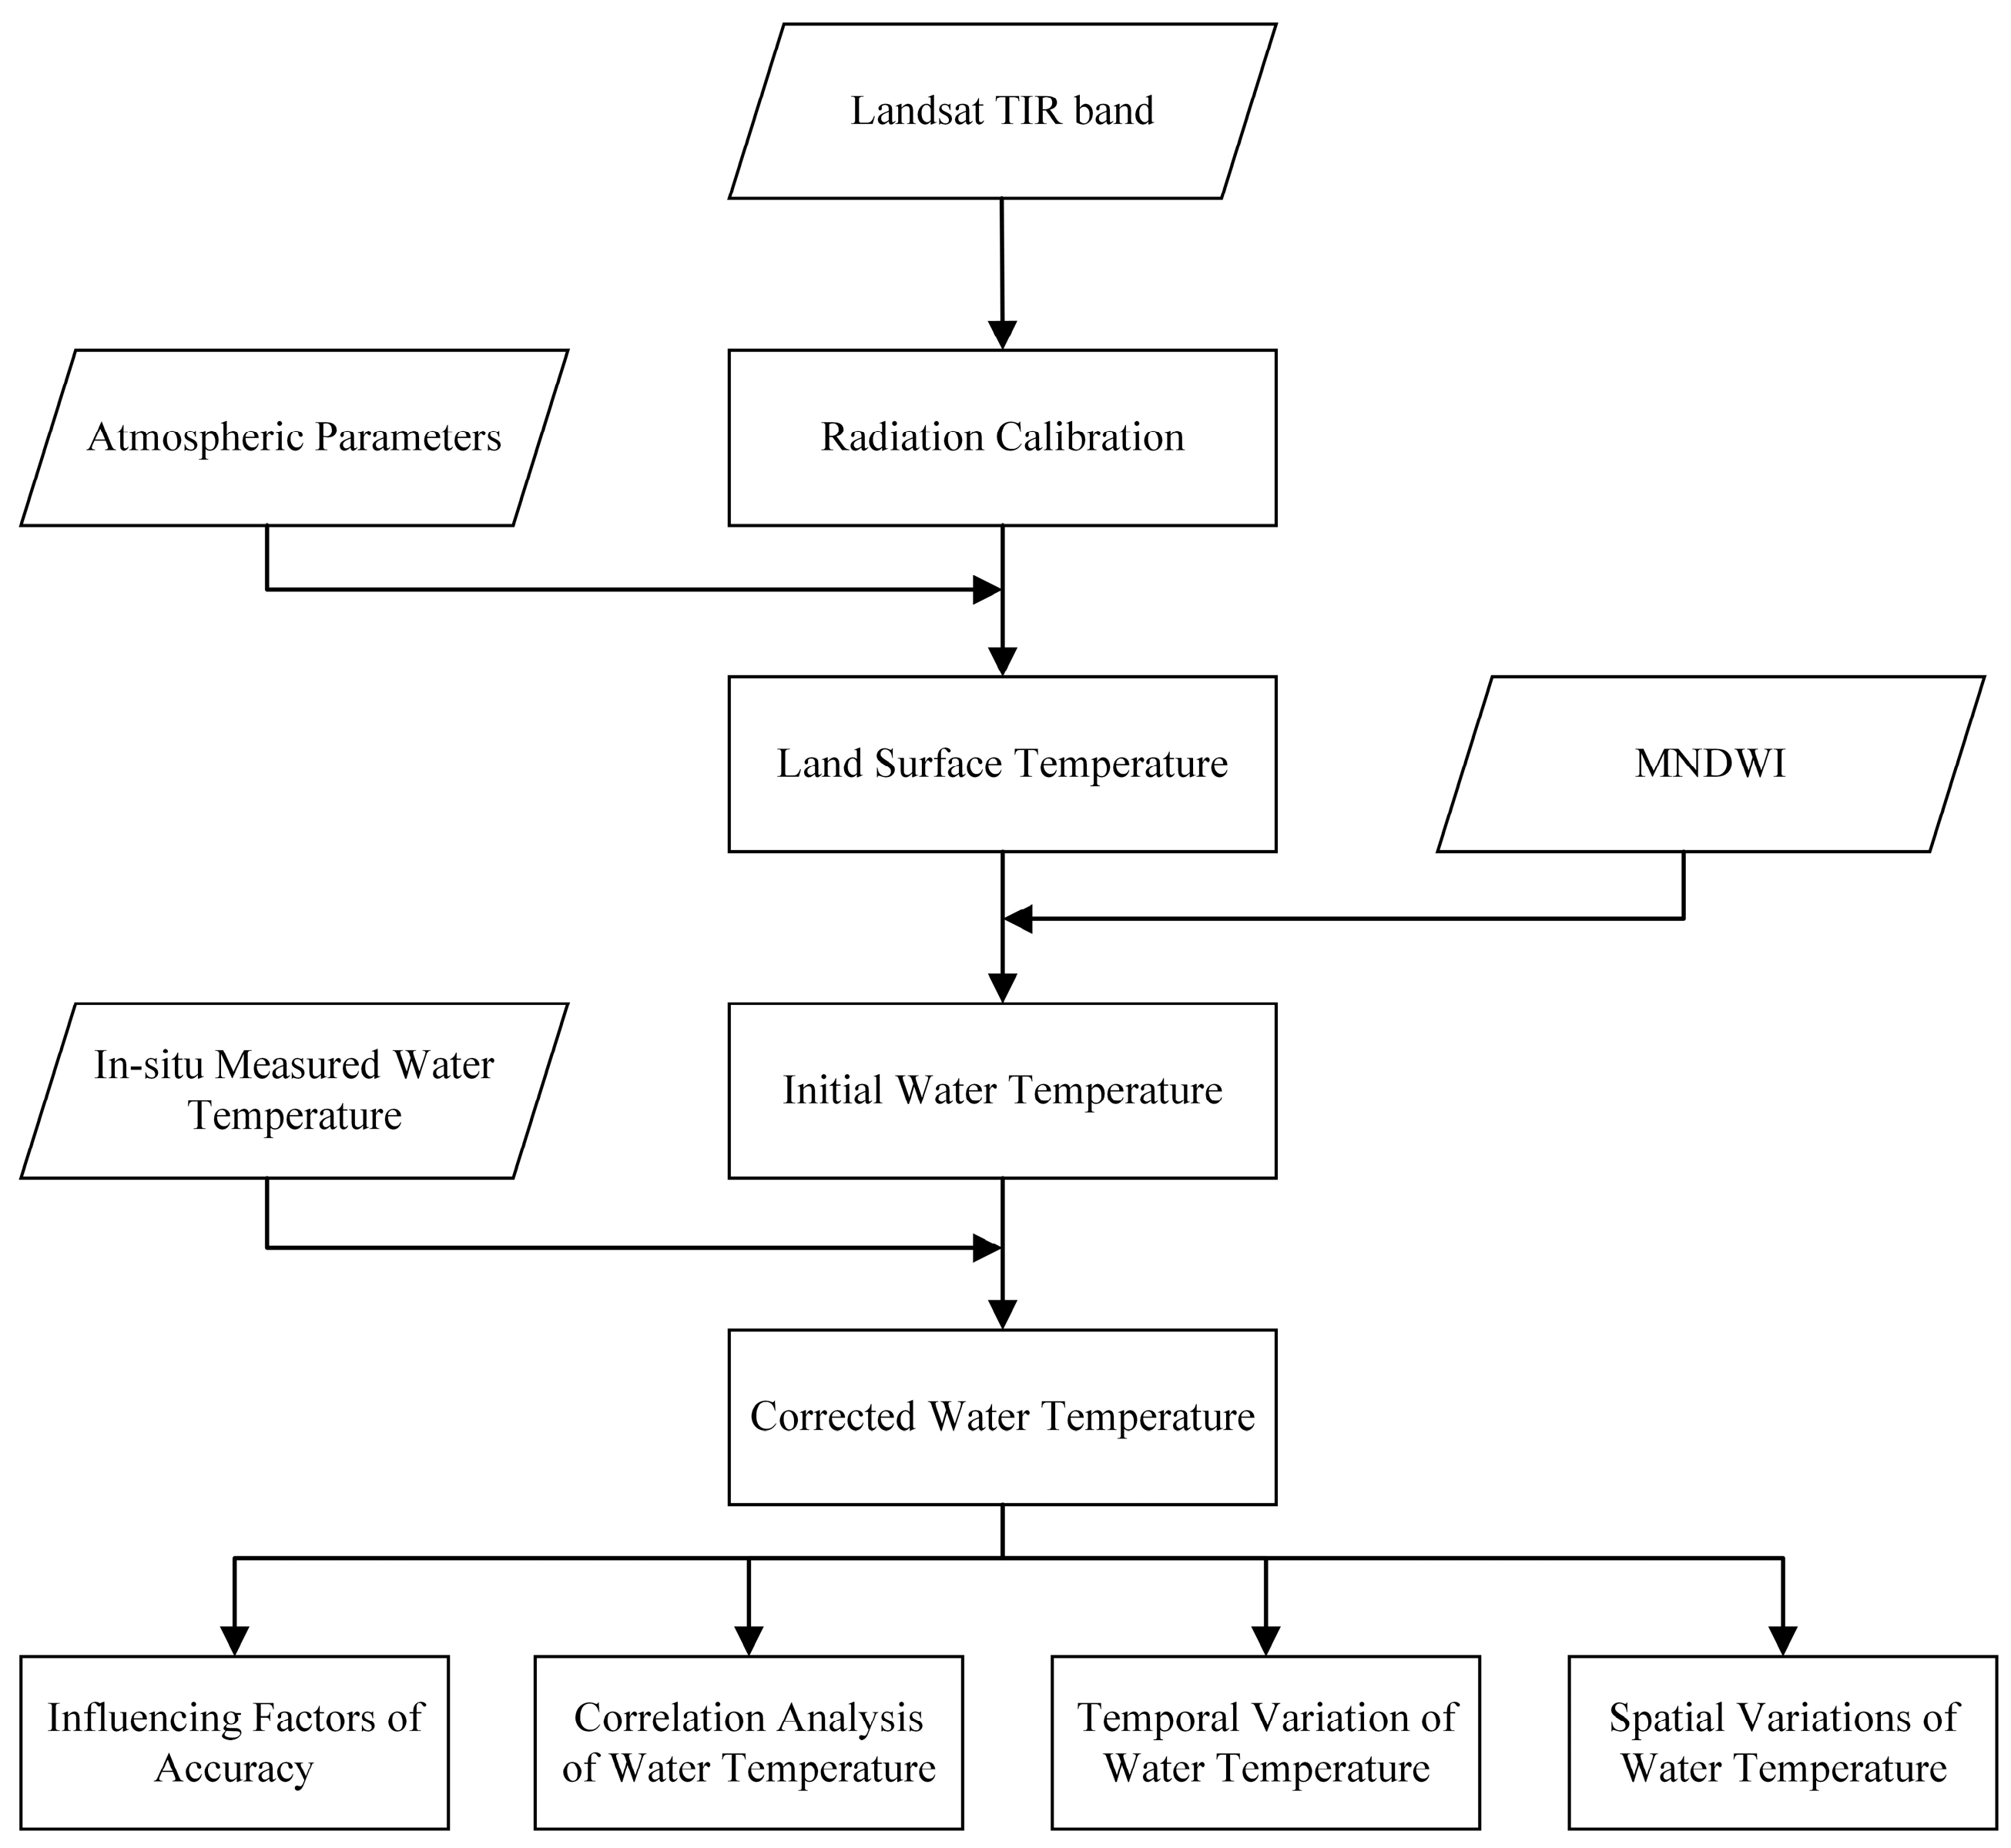
40]. The water temperature in its lower reaches varies in response to environmental changes, yet the harsh geographical conditions hinder the acquisition of fundamental data, posing challenges for in-depth water temperature research. This study focuses on the lower reaches of the Yarlung Tsangpo River: (1) constructing a remote sensing interpretation model for plateau river water temperature based on Landsat 7 ETM+ and Landsat 8 TIRS satellites, incorporating Landsat surface temperature products for simultaneous analysis to assess the feasibility and potential of using Landsat data to obtain precise water temperature measurements for narrow plateau rivers; (2) analyzing and evaluating the impact of river width, hydrology, geomorphology, and water temperature sampling locations on the accuracy of temperature inversion; and (3) investigating the correlation between river water temperature and hydrological and climatic factors, identifying the spatiotemporal variation patterns of water temperature in the lower reaches of the Yarlung Tsangpo River, and analyzing the influence of plateau topography, climate, and runoff supply on the spatial distribution of water temperature. Therefore, this study not only fills the research gap in the thermal dynamics of plateau rivers but also provides novel technical approaches and spatial data support for studying heat transfer processes in plateau river ecosystems.

2. Study Area and Methodology

2.1. Study Area

The Yarlung Tsangpo River is the highest river in the world and originates from Jiemayangzong Glacier in the south-central part of Tibet. It flows from west to east, bends northeast in the southeastern part of Tibet, and then rapidly turns south, flowing into the Brahmaputra River via Pasighat [40,41]. In this study, we selected the lower reaches of the Yarlung Tsangpo River, specifically the 600 km segment from Milin to Pasighat (Figure 1), as the research area. The famous Yarlung Tsangpo Great Gorge is located within this segment and is noted as the steepest canyon in the Himalayas; the elevation decreases sharply from approximately 2900 m to approximately 600 m, and the average slope reaches 20‰ [42,43]. The segment is divided into three parts according to changes in river morphology: the broad alluvial plain section from Milin to Jiala, the Great Gorge section from Jiala to Motuo, and the Great Gorge downstream section below Motuo. The heat generated by fluid friction may be a significant thermal source in steep rivers, and its contribution to warming efficiency cannot be overlooked in this river segment [44]. The climate in the study area transitions from a continental climate to a subtropical climate, with significant variations in meteorological conditions along the course [45]. The average annual temperature ranges from 10 °C to 23 °C, while the annual rainfall increases from 300–600 mm to over 2000 mm [46], with an extremely uneven distribution throughout the year [47]. This occurs because the moisture carried by the monsoons is blocked by the Himalayas, which rise along the main river channel of the study area, creating a significant precipitation zone and a warm area downstream (Figure 2) [48]. There are regional variations in vegetation cover within the watershed, and riparian vegetation regulates river water temperature [49,50]. Meltwater from snow and ice, along with precipitation from monsoons, is the primary source of river recharge [51], and tributaries such as the Nyang River and the Palong Tsangpo River are mainly recharged by snowmelt. Through field measurements, satellite imagery, and onsite observations, the main channel of the studied river does not experience freezing in winter and remains in a flowing state throughout the year. Owing to the unique topography, climate, and runoff recharge, different characteristics exist throughout the entire study river section, leading to distinct patterns in the spatial and temporal distributions of water temperature.

2.2. Data Acquisition

Currently, satellites with thermal infrared bands, such as AVHRR, MODIS, and Landsat, are widely used for water temperature retrieval. Datasets generated via AVHRR and MODIS have been used to monitor water temperature in lakes on the Tibetan Plateau, but their coarse spatial resolution is not suitable for the rivers studied in this research [9,52]. Among publicly available satellite thermal data, ASTER/Terra, Landsat 7, and Landsat 8 provide the highest spatial resolutions, at 90 m, 60 m, and 100 m, respectively [33]. Landsat offers high spatial resolution in thermal infrared channels, complete data sequences, and advanced technology, making it more suitable for water bodies with elongated spatial scales [53,54,55]. In this study, we utilized thermal infrared remote sensing images from Landsat 7 and 8. Both satellites have the same temporal resolution (16 days), with original spatial resolutions of 60 m and 100 m for Landsat 7 and 8, respectively, which have been resampled to 30 m for users by the U.S. Geological Survey [27]. The time series for the Landsat 7 and 8 images spans from 2004 to2022 and from 2013 to 2022, respectively, totaling 210 images. During the flood period from May to September, the number of usable images is relatively low due to high humidity and strong cloud interference (Table 1). On the other hand, the USGS provides interpreted temperature products that can be compared and selected against the results from this study. We also used Landsat Level-2 surface temperature scientific (LST) products for supplementary analysis [56]. Some studies have validated Landsat 7 and 8 LST products, with RMSEs for surface water temperature ranging from 0.7–1.1 K [57,58,59,60]. All satellite data used in this study were downloaded for free from the United States Geological Survey Earth Explorer Database (http://earthexplorer.usgs.gov/) (accessed on 1 May 2024).
Measured water temperature data were collected from three stations in the study area: Milin, Nuxia and Motuo. The time series for the measured data at Milin and Motuo spans from 2015 to 2022 (excluding 2020), whereas the time series for Nuxia spans from 2004 to 2013. A total of 38 sets of Landsat 7 data and 34 sets of valid Landsat 8 data were used to verify the water temperature accuracy at Milin, 63 sets of Landsat 7 data were used at Nuxia, and 31 sets of Landsat 7 data and 33 sets of Landsat 8 data were used at Motuo.

2.3. Research Methodology

The interpretation of water temperature involved three stages: preprocessing, atmospheric correction, and temperature calibration (Figure 3). The preprocessing included radiometric calibration, local cropping, and water body extraction. Radiometric calibration (Equation (1)) converts the digital number from the original image into the spectral radiance detected by the sensor at the top of the atmosphere. Local clipping and the MNDWI (Equation (2)) were used to obtain the water body mask. The MNDWI effectively enhances water body information while limiting the influence of buildings, vegetation, and soil characteristics [61,62,63]. It is one of the most widely used water indices for surface water mapping and change analysis, with simple, practical, and efficient calculations. The above steps are realized through ENVI (Exelis Visual Information Solutions, American, 5.3 version).
Atmospheric correction is crucial, as atmospheric effects can cause a change in surface water temperature of ±2 °C [64]. Atmospheric correction was performed via the radiative transfer method (RTM, Equation (3)) with the Atmcorr atmospheric parameter database to eliminate the effects of the atmosphere on the thermal radiation reaching the sensor. The corrected spectral radiance is then converted to temperature via the Planck equation (Equation (4)). The RTM, combined with the atmospheric correction parameters from Atmcorr, provides stable results and higher accuracy among various water temperature retrieval methods [11,28,65]. Atmcorr is a database of atmospheric correction parameters developed by NASA; satellite and ground-based atmospheric data collected by the National Centers for Environmental Prediction are used as raw data and are generated through the MODTRAN 4.0 atmospheric radiation transfer model, which has a spatial resolution of 1° × 1° and a temporal resolution of 6 h [66]. The upstream and downstream water vapor contents in the studied river segment vary significantly. Therefore, on the basis of elevation, different atmospheric parameters were applied for temperature retrieval in the broad alluvial plain section and the other sections.
The water temperature retrieved from Landsat data may contain systematic errors caused by multiple factors, and incorporating measured data to calibrate the retrieved water temperature can improve the retrieval results and enhance accuracy [10,11,25]. Therefore, two methods, linear regression and polynomial regression, were used to calibrate the water temperature in this study. Fifty percent of the remotely sensed data and the corresponding measured data were used to rate the parameters of the regression equations. The calibrated correction equation was then applied to correct all the datasets.
A total of 10 validation sets were set up according to three locations, two satellites, and two water temperature acquisition methods (Table 2). The root mean square error (RMSE), mean absolute error (MAE), bias (Bias), standard deviation (SD), and correlation coefficient (R) were used to quantify the differences between the inversion results and the measured data to assess the accuracy of the model.
L s e n s o r = G · D N + B
M N D W I = G r e e n M I R / G r e e n + M I R
L s e n s o r = ε · R B + 1 ε L d o w n τ + L u p
T = K 2 / ln K 1 / R B + 1
where L s e n s o r is the spectral radiance at the top of the atmosphere, W/(sr·m2·nm); DN is the digital number in the original thermal infrared data; G and B are calibration parameters, which are shown in Table 3 for the Landsat 7 and Landsat 8 TIR bands and surface temperature products; “Green” and “MIR” represent the brightness of the green light band and the mid-infrared band, respectively; ε is the water surface, where a value of 0.9885 is selected on the basis of previous studies [67]; R B is the brightness of a black body at the same temperature as the water body, W/(sr·m2·nm); L d o w n is the downward atmospheric radiation, W/(sr·m2·nm); L u p is the upward atmospheric radiation, W/(sr·m2·nm); and τ is the atmospheric transmittance. T is the water surface temperature and K 1 and K 2 are the thermal constants.

3. Calibration and Validation

3.1. Initial Results

Table 4 shows that the initial inversion accuracy is generally high, with R values ranging from 0.84–0.99, and the accuracy of the RTM is slightly higher than that of the LST. The RMSE for the atmospheric correction method ranges from 1.20–2.16 °C, the MAE ranges from 0.82–1.64 °C, and the Bias ranges from −0.33–0.70 °C. The Landsat inversion water temperatures are plotted against the measured water temperatures on scatter plots, and a significant portion of the original inversion results that land outside the ±2 °C domain are high-temperature anomalies (Figure 4). Except for the inversion results of Landsat 7 in Motuo, the Bias in the remaining validation groups is greater than 0, indicating that the inverted water temperatures are higher than the measured values (Figure 5). Additionally, different accuracy characteristics are observed among the various sites. Milin shows the highest accuracy, with an RMSE of approximately 1.20 °C obtained via the RTM, whereas the RMSEs for Nuxia and Motuo are greater, ranging from 1.84 °C–2.16 °C. The estimates of the river surface water temperatures from the LST show more errors than the results from the RTM. Its inverted water temperatures are significantly higher than the measured values, with RMSEs ranging from 1.50–2.49 °C, MAEs ranging from 1.14–2.07 °C, and an average increase in Bias of 0.63 °C compared with the RTM results.

3.2. Results After Regression Correction

Owing to the overall higher initial inversion of river water temperatures compared with the measured values, two correction methods were employed. The results indicate that the linear regression performed better, with a significant improvement in accuracy across all the validation groups after correction, particularly for the high-temperature anomaly points (Table 5 and Figure 4). After linear regression correction, the RMSE for all the validation groups ranged from 0.77 to 1.85 °C, with errors reduced by 1.6%~65.0%. The improvement in accuracy for the LST is the most significant, with the average error decreasing by 32.3%. The RMSE of the corrected temperature from the LST is 0.77~1.84 °C, and the RMSE of the corrected temperature from the RTM is 1.00~1.85 °C. The inverted water temperature from the LST is higher and shows a more significant overall offset (Figure 4), whereas regression correction effectively corrects the systemic error of the overall offset. Related studies have also indicated that after correction, the accuracy of the LST improves significantly, with the RMSE decreasing from 3.68 °C to 2.59 °C [11]. However, regression correction also involves some uncertainty, and the significant improvement in accuracy may be associated with overfitting. Although polynomial regression also reduces errors to some extent, some validation groups exhibit negative corrections (Conditions 4, 5, and 9); as a result, the correction accuracy is slightly lower than that of linear regression. Therefore, linear regression was adopted as the correction method. To incorporate as much available data as possible for analysis and considering that the water temperatures retrieved from Landsat 7 and 8 via the same method have similar accuracies, we combined the data from Landsat 7 and 8 for spatial analysis.
Figure 6 shows the validation results for the spatial variation rate of the retrieved water temperature. Since the times of the measured data for Nuxia are not synchronized with those of the other two sites, this study used multiyear average data to minimize the impact of this discrepancy. The measured data indicate that the rate of change in the annual temperature from Milin to Nuxia is −1.3 °C/100 km, whereas those of the RTM and the LST are −1.0 °C/100 km and −0.3 °C/100 km, respectively. The measured results reveal that the temperature decreases from March to November, whereas the RTM results reveal that the temperature decreases from April to November. In contrast, the results of the LST data reveal a relatively high rate of temperature change along the course, especially in spring and autumn, with a temperature decrease occurring only from May to September, which is inconsistent with the measured results. From Nuxia to Motuo, the measured rate of temperature change was relatively high, averaging 1.7 °C/100 km annually, indicating a pattern of lower values during the flood season and higher values during the dry season. The RTM and LST results are 1.9 °C/100 km and 1.6 °C/100 km, respectively. The annual variation patterns are generally consistent with the measured results. However, the temperature product has lower values in July and August, at only 0.7 °C/100 km, which is much lower than the measured value of 1.3 °C/100 km. The rate of temperature change obtained from the RTM is more accurate in terms of both accuracy and pattern of change over the year. Moreover, related studies have noted that the accuracy of the atmospheric correction method with respect to spatial temperature differences is not strongly affected by atmospheric parameters. In certain months, the rate of temperature change in the retrieved water temperature data is opposite to that in the measured data (e.g., March and May in Figure 6a). March to May is a transition period from warming to cooling from Milin to Nuxia, and the timing and extent of this transition vary each year. However, the mismatch in the time series length between the measured and retrieved data led to an opposite trend in the warming rates in March and May.
Although the water temperature accuracy of the RTM is slightly lower than that of the LST, it is more accurate in terms of the rate of temperature change. In addition, measured water data are often scarce in outdoor settings. Even without correction, the RTM result still performs well in terms of accuracy. Therefore, this study used Landsat 7 and 8 data from 2003–2022, along with the RTM, which yielded relatively stable results, as the final approach for analyzing the spatial characteristics of water temperature.

4. Results

4.1. Analysis of Factors Affecting Inversion Accuracy

The studied river section has a high water vapor content and significant local climate variability, which affects the accuracy of the water surface temperature inversion. The Great Gorge is a passage for warm and humid air currents from the Indian Ocean to the Tibetan Plateau. In summer, high water vapor content, heavy rainfall, and severe cloud interference not only reduce data availability but also increase the difficulty of atmospheric correction. The RTM with the atmospheric correction parameters of Atmcorr has high accuracy in water temperature inversion, but Atmcorr represents the atmospheric state of the whole region with only one data point. To address the variability in atmospheric conditions across the entire watershed, in this study, the river was divided into a plateau area and a Grand Canyon area for the acquisition of atmospheric parameters, which helped reduce the impact of atmospheric changes on the water temperature inversion. However, differing atmospheric states may still interfere with the accuracy of temperature interpretation.
The temporal and spatial discrepancies in the inverted water temperature data compared with the measured water temperature data led to a higher inversion temperature, with some extreme high-temperature outliers present. The study area experiences significant daily temperature variations; for example, the average diurnal temperature range in Milin is 12 °C. The satellite’s overpass time is approximately 12 noon local time, whereas the measured water temperature is collected at approximately 8 a.m. local time. This discrepancy between the satellite overpass time and the water temperature measurement time partially explains why most inversion values are higher than the measured values. Moreover, the measurements from the thermal infrared radiometer represent the “skin temperature” of the water surface at approximately 10~20 µm, whereas the measured water temperature is typically taken at a depth of 0.5 m. Factors such as strong solar radiation can create differences in temperature at various layers between the surface water temperature and the water body temperature [68]. The use of regression correction can partially reduce errors caused by temporal discrepancies and the “skin effect” [69]. However, the errors in water temperature arise from multiple factors, and regression correction cannot completely eliminate them.
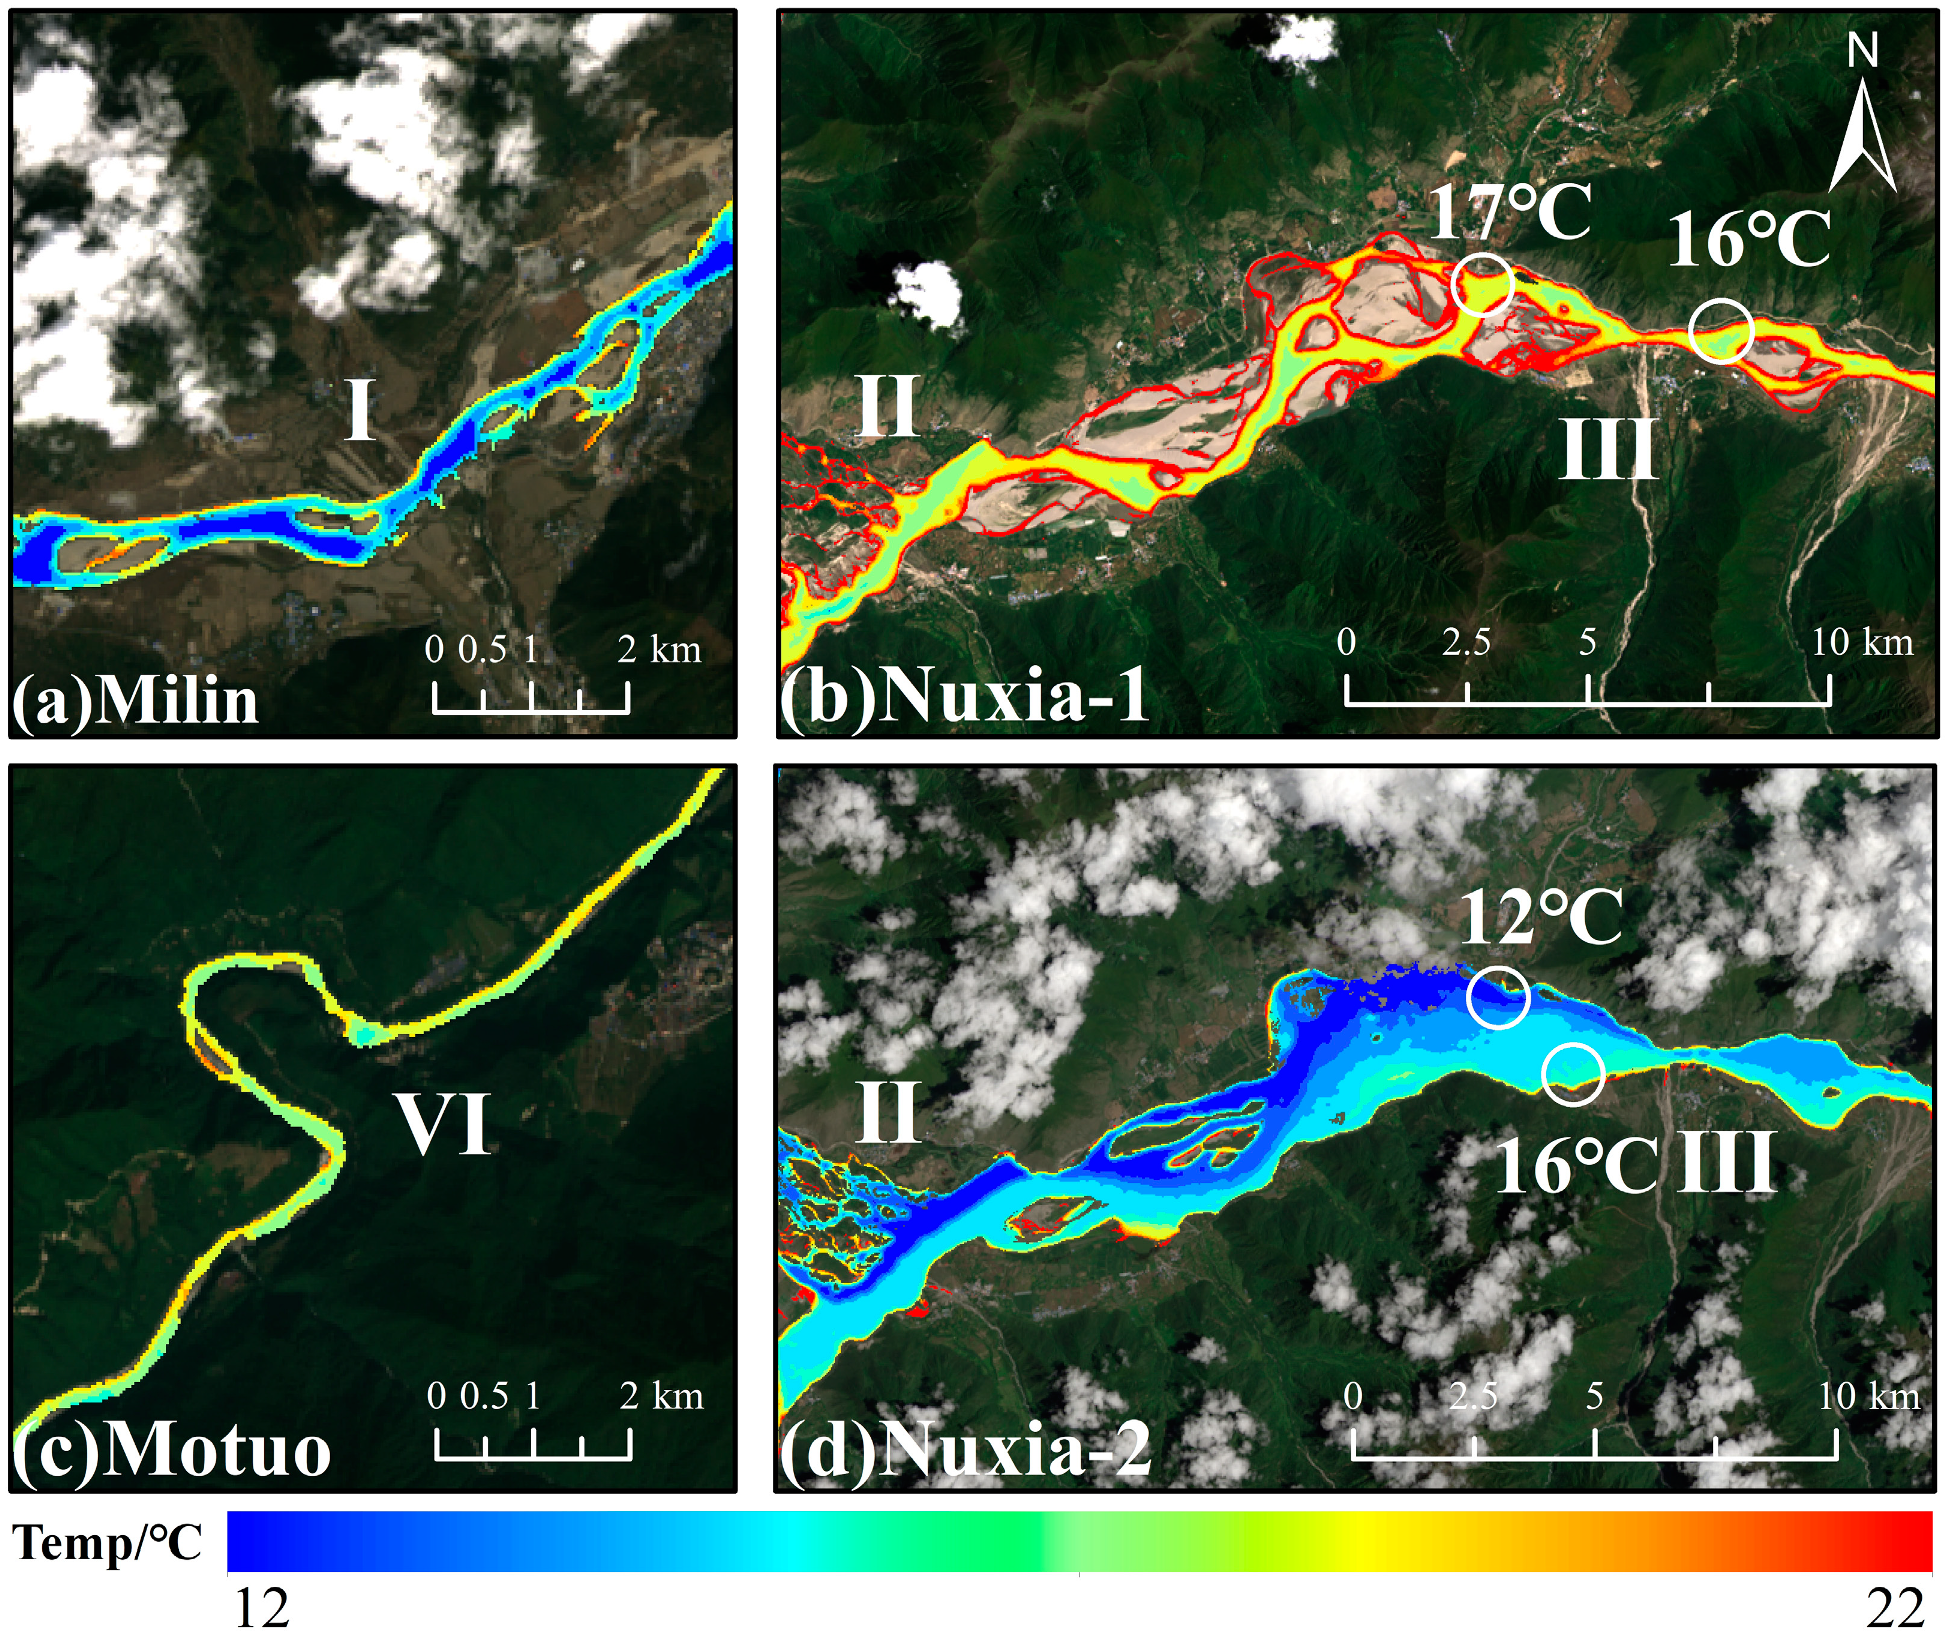
The river topography and geomorphology, tributary confluence and riverbanks all interfere with the accuracy of the river water temperature inversion, resulting in lower accuracy at the Nuxia and Motuo sites than at the Milin site. The Milin section has a suitable river width of approximately 300–450 m, with no large tributaries converging in the interval and a uniform mixing of water bodies (Figure 7a). In contrast, Nuxia is located in the broad alluvial plain section, where the maximum river width can reach 3300 m. However, the morphology of the braided channel is complex, with land and water areas interspersed, leading to higher temperatures in wide shallow areas than in deep pools (Figure 7b). The meltwater from the Nyang River tributary results in lateral temperature unevenness, with low-temperature water not fully mixing with the river water as it approaches Nuxia, causing the water temperature to be lower on the left and higher on the right, with a lateral temperature difference of up to 2 °C (Figure 7d). The spatial unevenness of water temperature is influenced by tributary inflows and braided topography, and discrepancies between reading locations and measurement locations contribute to larger inversion result errors at Nuxia. The Motuo section of the river is narrow and meandering, with an average river width of approximately 200 m. For a river with only 1–3 water pixels, the mixing of water and land significantly increases the temperature error and uncertainty in the images [22]. Owing to the narrow river channel in Motuo, the water pixels are affected by the riverbanks, resulting in lower accuracy, with an RMSE of 1.62~2.49 °C and a postcorrection error reduction of 1.6~26.1% (Figure 7c). Linear regression shows better correction effects for Milin, with secondary effectiveness for Nuxia and Motuo, confirming the differences in error sources at the three sites. Figure 8 shows the temperature differences between the left and right banks and the centerline at Nuxia. For the complex braided river channel, after the water–land mixed pixels at the riverbank edges are removed, the water temperature still exhibits lateral unevenness. The water temperatures on the left and right banks are generally higher than that at the centerline, with an average difference of 0.7 °C. To minimize the interference of topography and riverbanks on water temperature extraction, the water temperature values along the river centerline were extracted as the cross-sectional water temperature [70].

4.2. Correlation Analysis of the Water Temperature

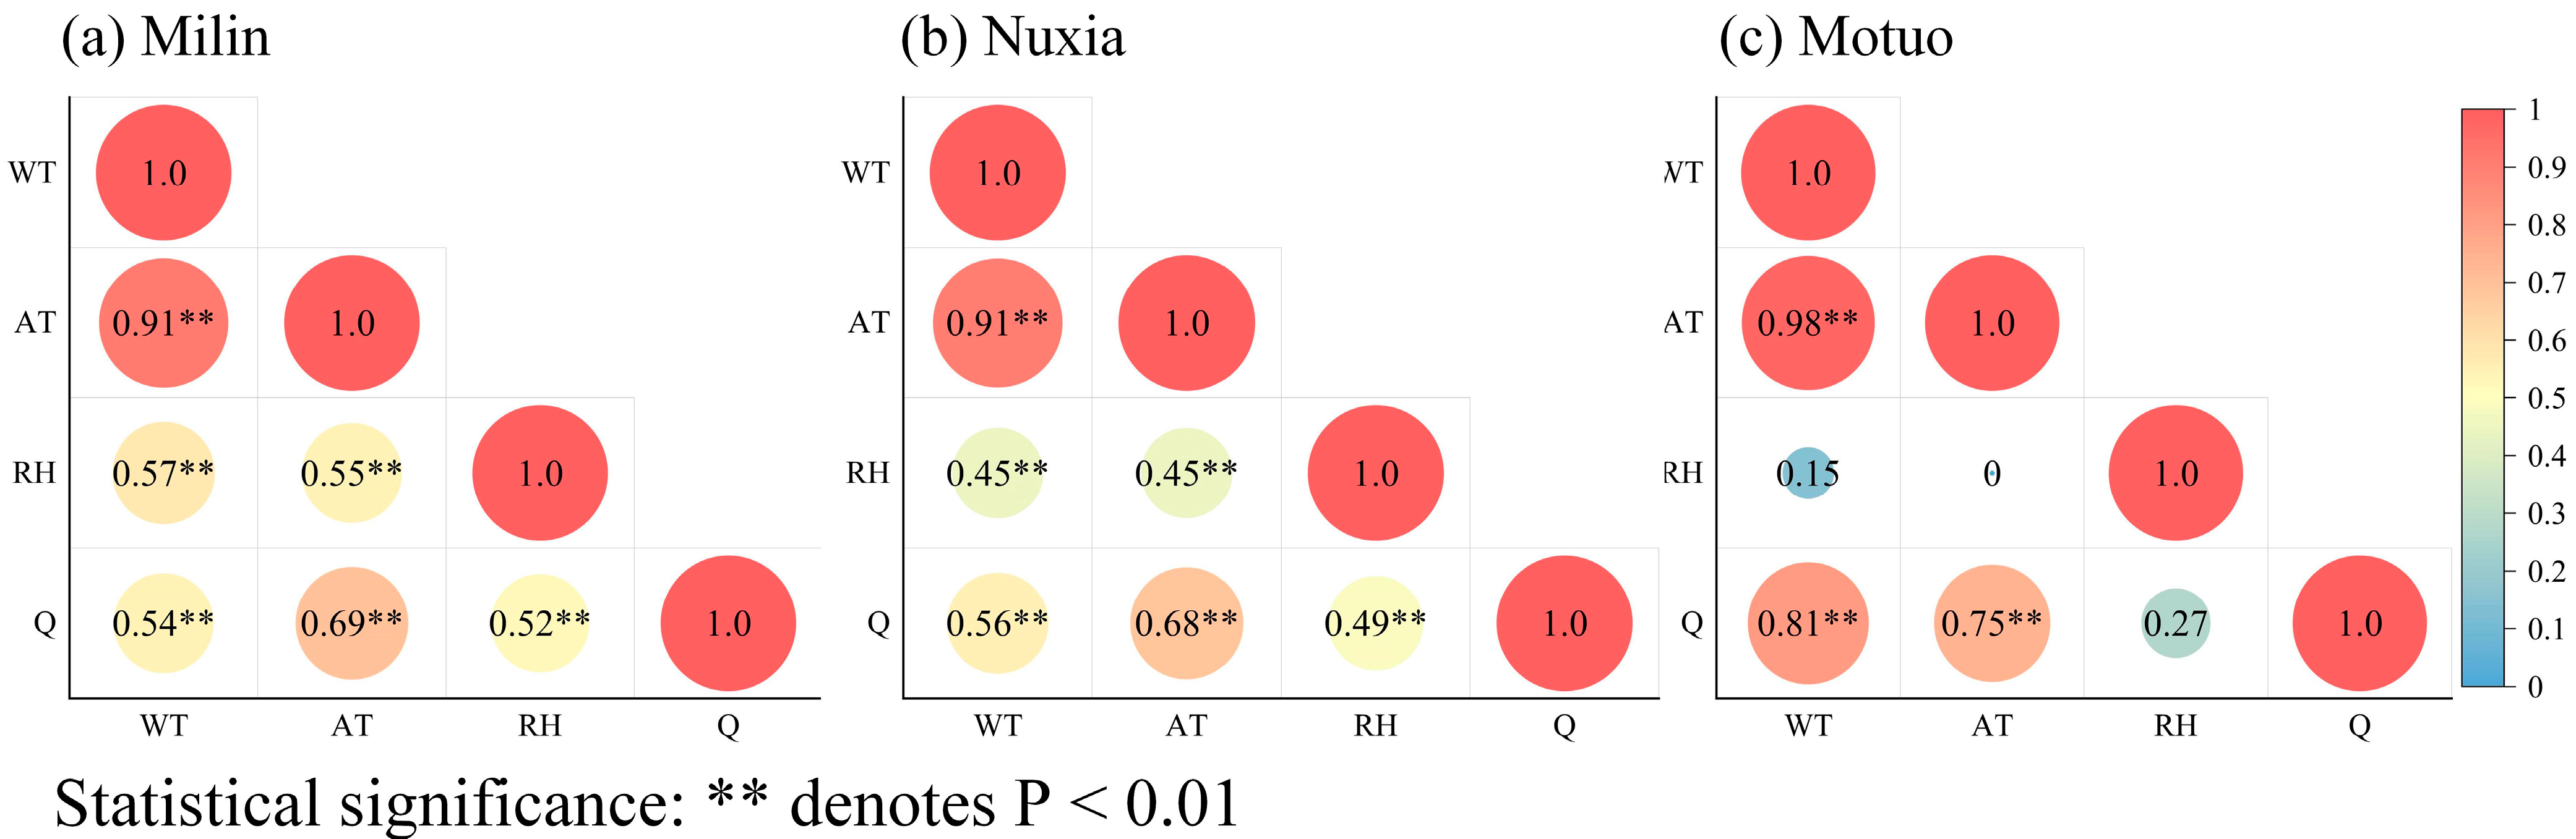
To investigate the influences of the plateau climate and hydrological conditions on the river water temperature, correlation analysis and multiple linear regression were conducted between the water temperature, air temperature, relative humidity, and flow. Figure 9 presents the correlation coefficients among the variables, whereas Table 6 lists the multiple linear regression equations and parameters. In Milin, water temperature and flow did not reach statistical significance in the multiple linear regression (p > 0.05), so only air temperature and relative humidity were included in the regression analysis for this site.
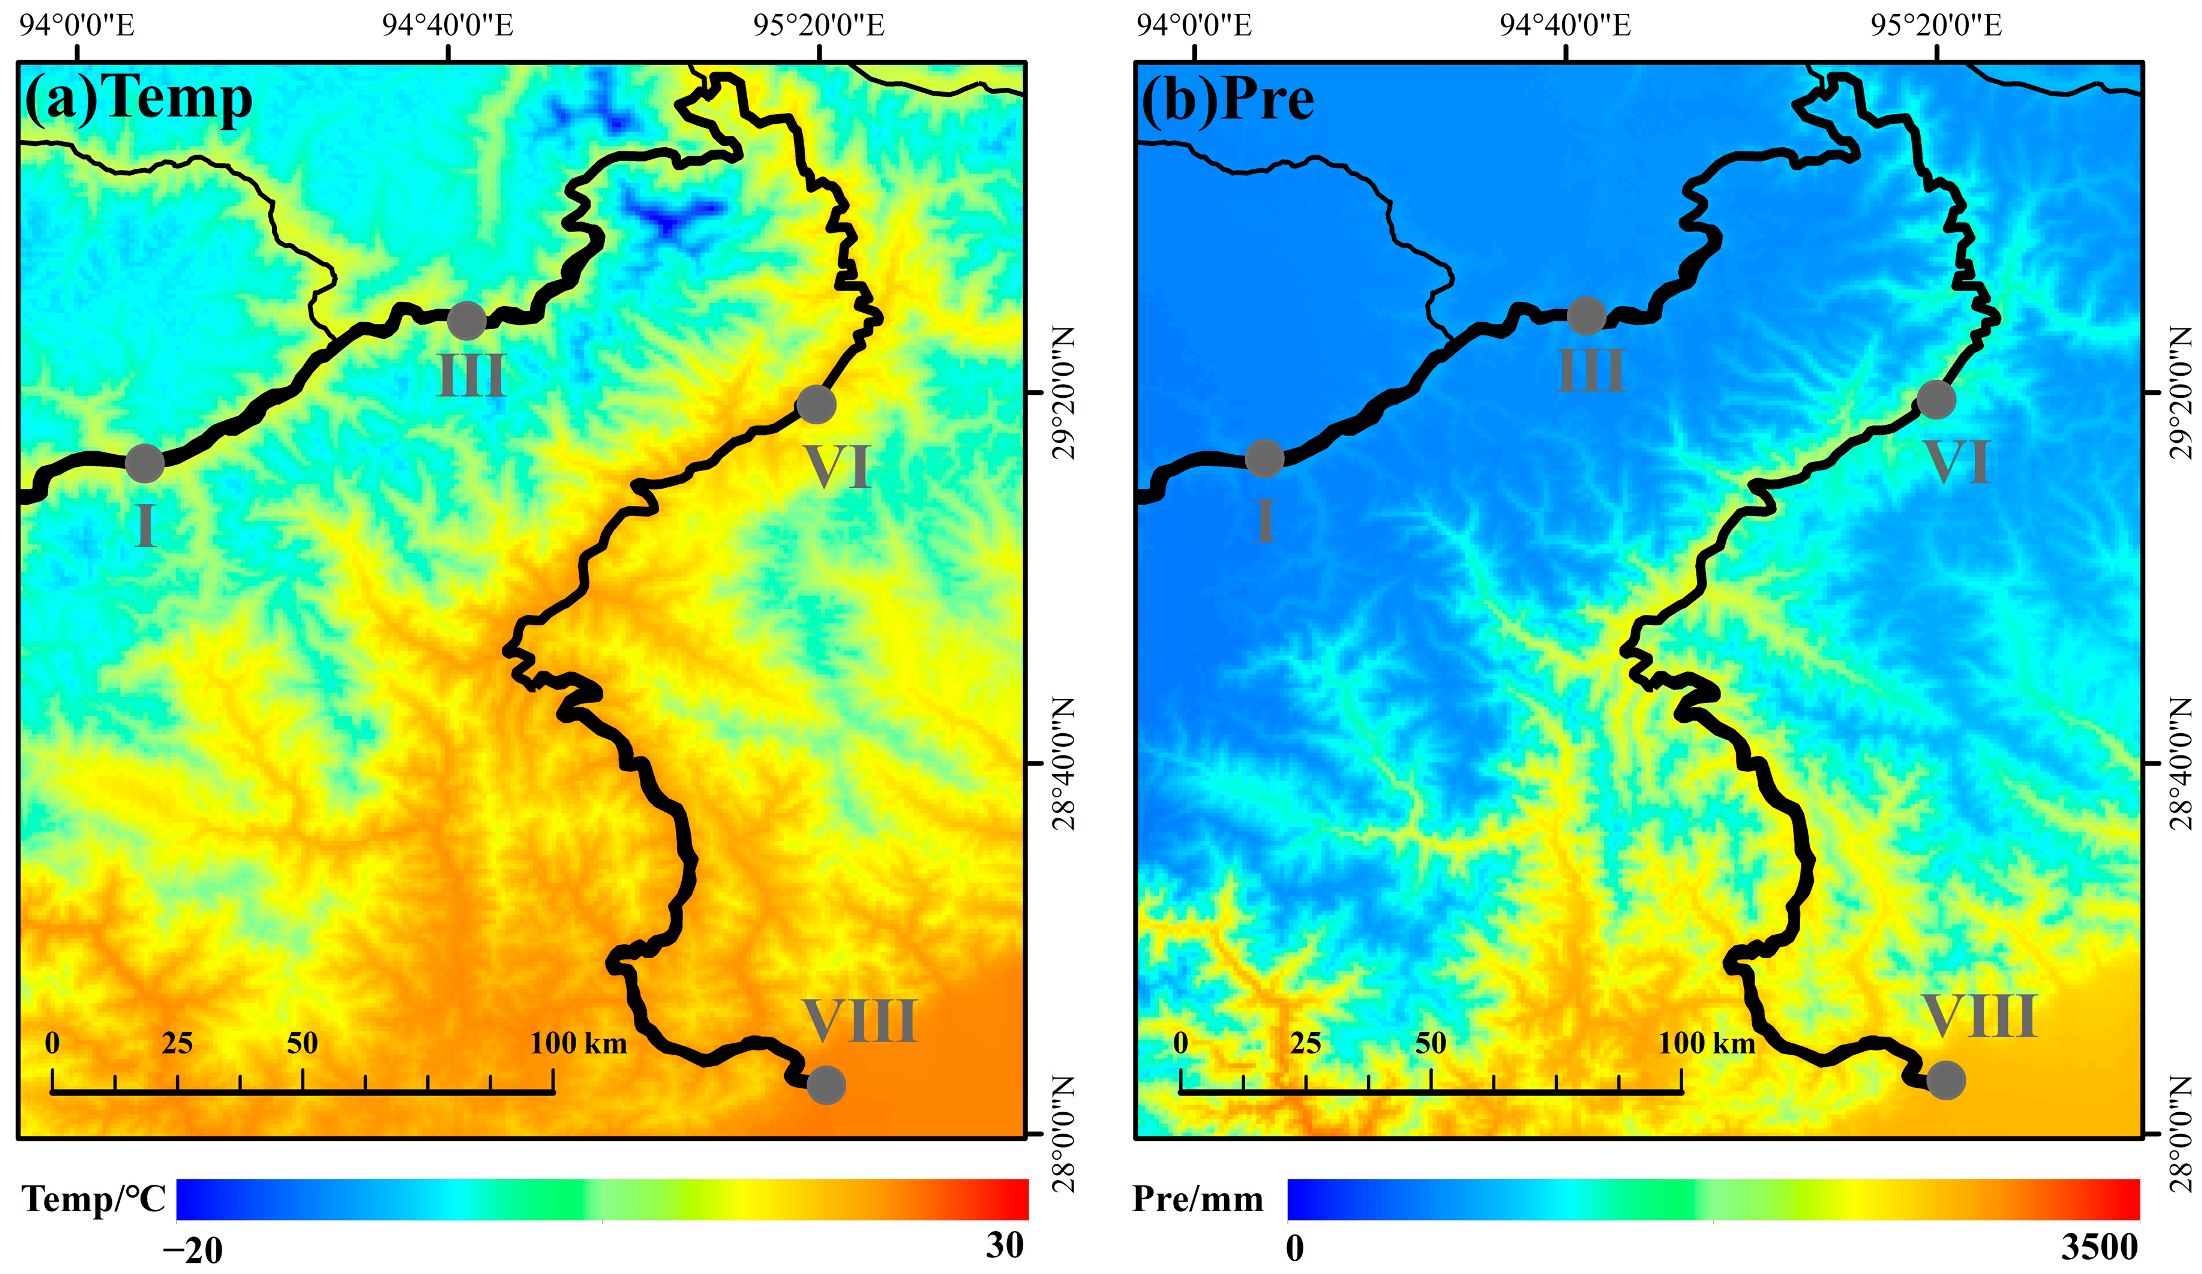
The results indicate that water temperature variations in the study area are jointly driven by climatic and hydrological factors, resulting in significant spatial heterogeneity. Air temperature is the dominant factor influencing water temperature variations in the study area. Correlation analysis revealed a strong positive relationship between air temperature and water temperature, with correlation coefficients exceeding 0.9 at all three sites. The multiple regression model further confirmed the dominant role of air temperature, with standardized coefficients (β) of 0.947 (Milin), 0.829 (Nuxia), and 0.786 (Motuo), all of which were statistically significant (p < 0.01). Relative humidity had a positive effect on the regression model, with β values of 0.203 (Milin), 0.099 (Nuxia), and 0.135 (Motuo), which were statistically significant (p < 0.05). However, correlation analysis revealed that relative humidity was not significantly correlated with water temperature in Motuo. This discrepancy may be attributed to the distinct climatic conditions in the study area. The upper reach is located in a temperate plateau climate zone, where high altitudes result in thinner air and relatively low humidity (monthly average: 40–80%). Strong evapotranspiration leads to significant heat loss from the water body, making relative humidity an important factor influencing river water temperature. In contrast, the lower Motuo reach lies in a tropical humid climate zone with abundant precipitation and consistently high annual relative humidity (>80%). Weaker evapotranspiration reduces the direct impact of relative humidity on water temperature. The regression analysis, which comprehensively considers multiple interacting factors, suggested that relative humidity may influence water temperature indirectly by affecting precipitation and, consequently, flow.
The effect of flow exhibited significant regional differences. Correlation analysis revealed a significant positive relationship between flow and water temperature at all three sites (p < 0.01). In the regression analysis, the influence of flow on the water temperature varied spatially. In Milin, flow was not statistically significant. In Nuxia, flow was significantly negatively correlated with water temperature (β = −0.161, p < 0.01), whereas in Motuo, a significant positive correlation was observed (β = 0.135, p < 0.05). This may be related to the sources of runoff in the basin. In the upper reaches, glacial meltwater contributes a large proportion of runoff, and variations in different water sources directly influence water temperature. In Milin, a mix of local meltwater and precipitation may explain the lack of statistical significance. In Nuxia, a major tributary, the Nyang River, joins the mainstem. During the flood season, the influx of glacial meltwater lowers the water temperature (Figure 6a), resulting in a negative correlation between flow and water temperature. In contrast, the Motuo reach serves as a conduit for warm, humid air masses from the Indian Ocean, with substantial precipitation contributions. High air temperatures reduce the relative proportion of glacial meltwater input, leading to overall significant regression analysis, which, by accounting for all relevant factors, more accurately captures the effect of flow on water temperature, highlighting both the commonalities and regional differences in environmental influences on water temperature in the study area and the positive correlation between flow and water temperature.

4.3. Annual Variation

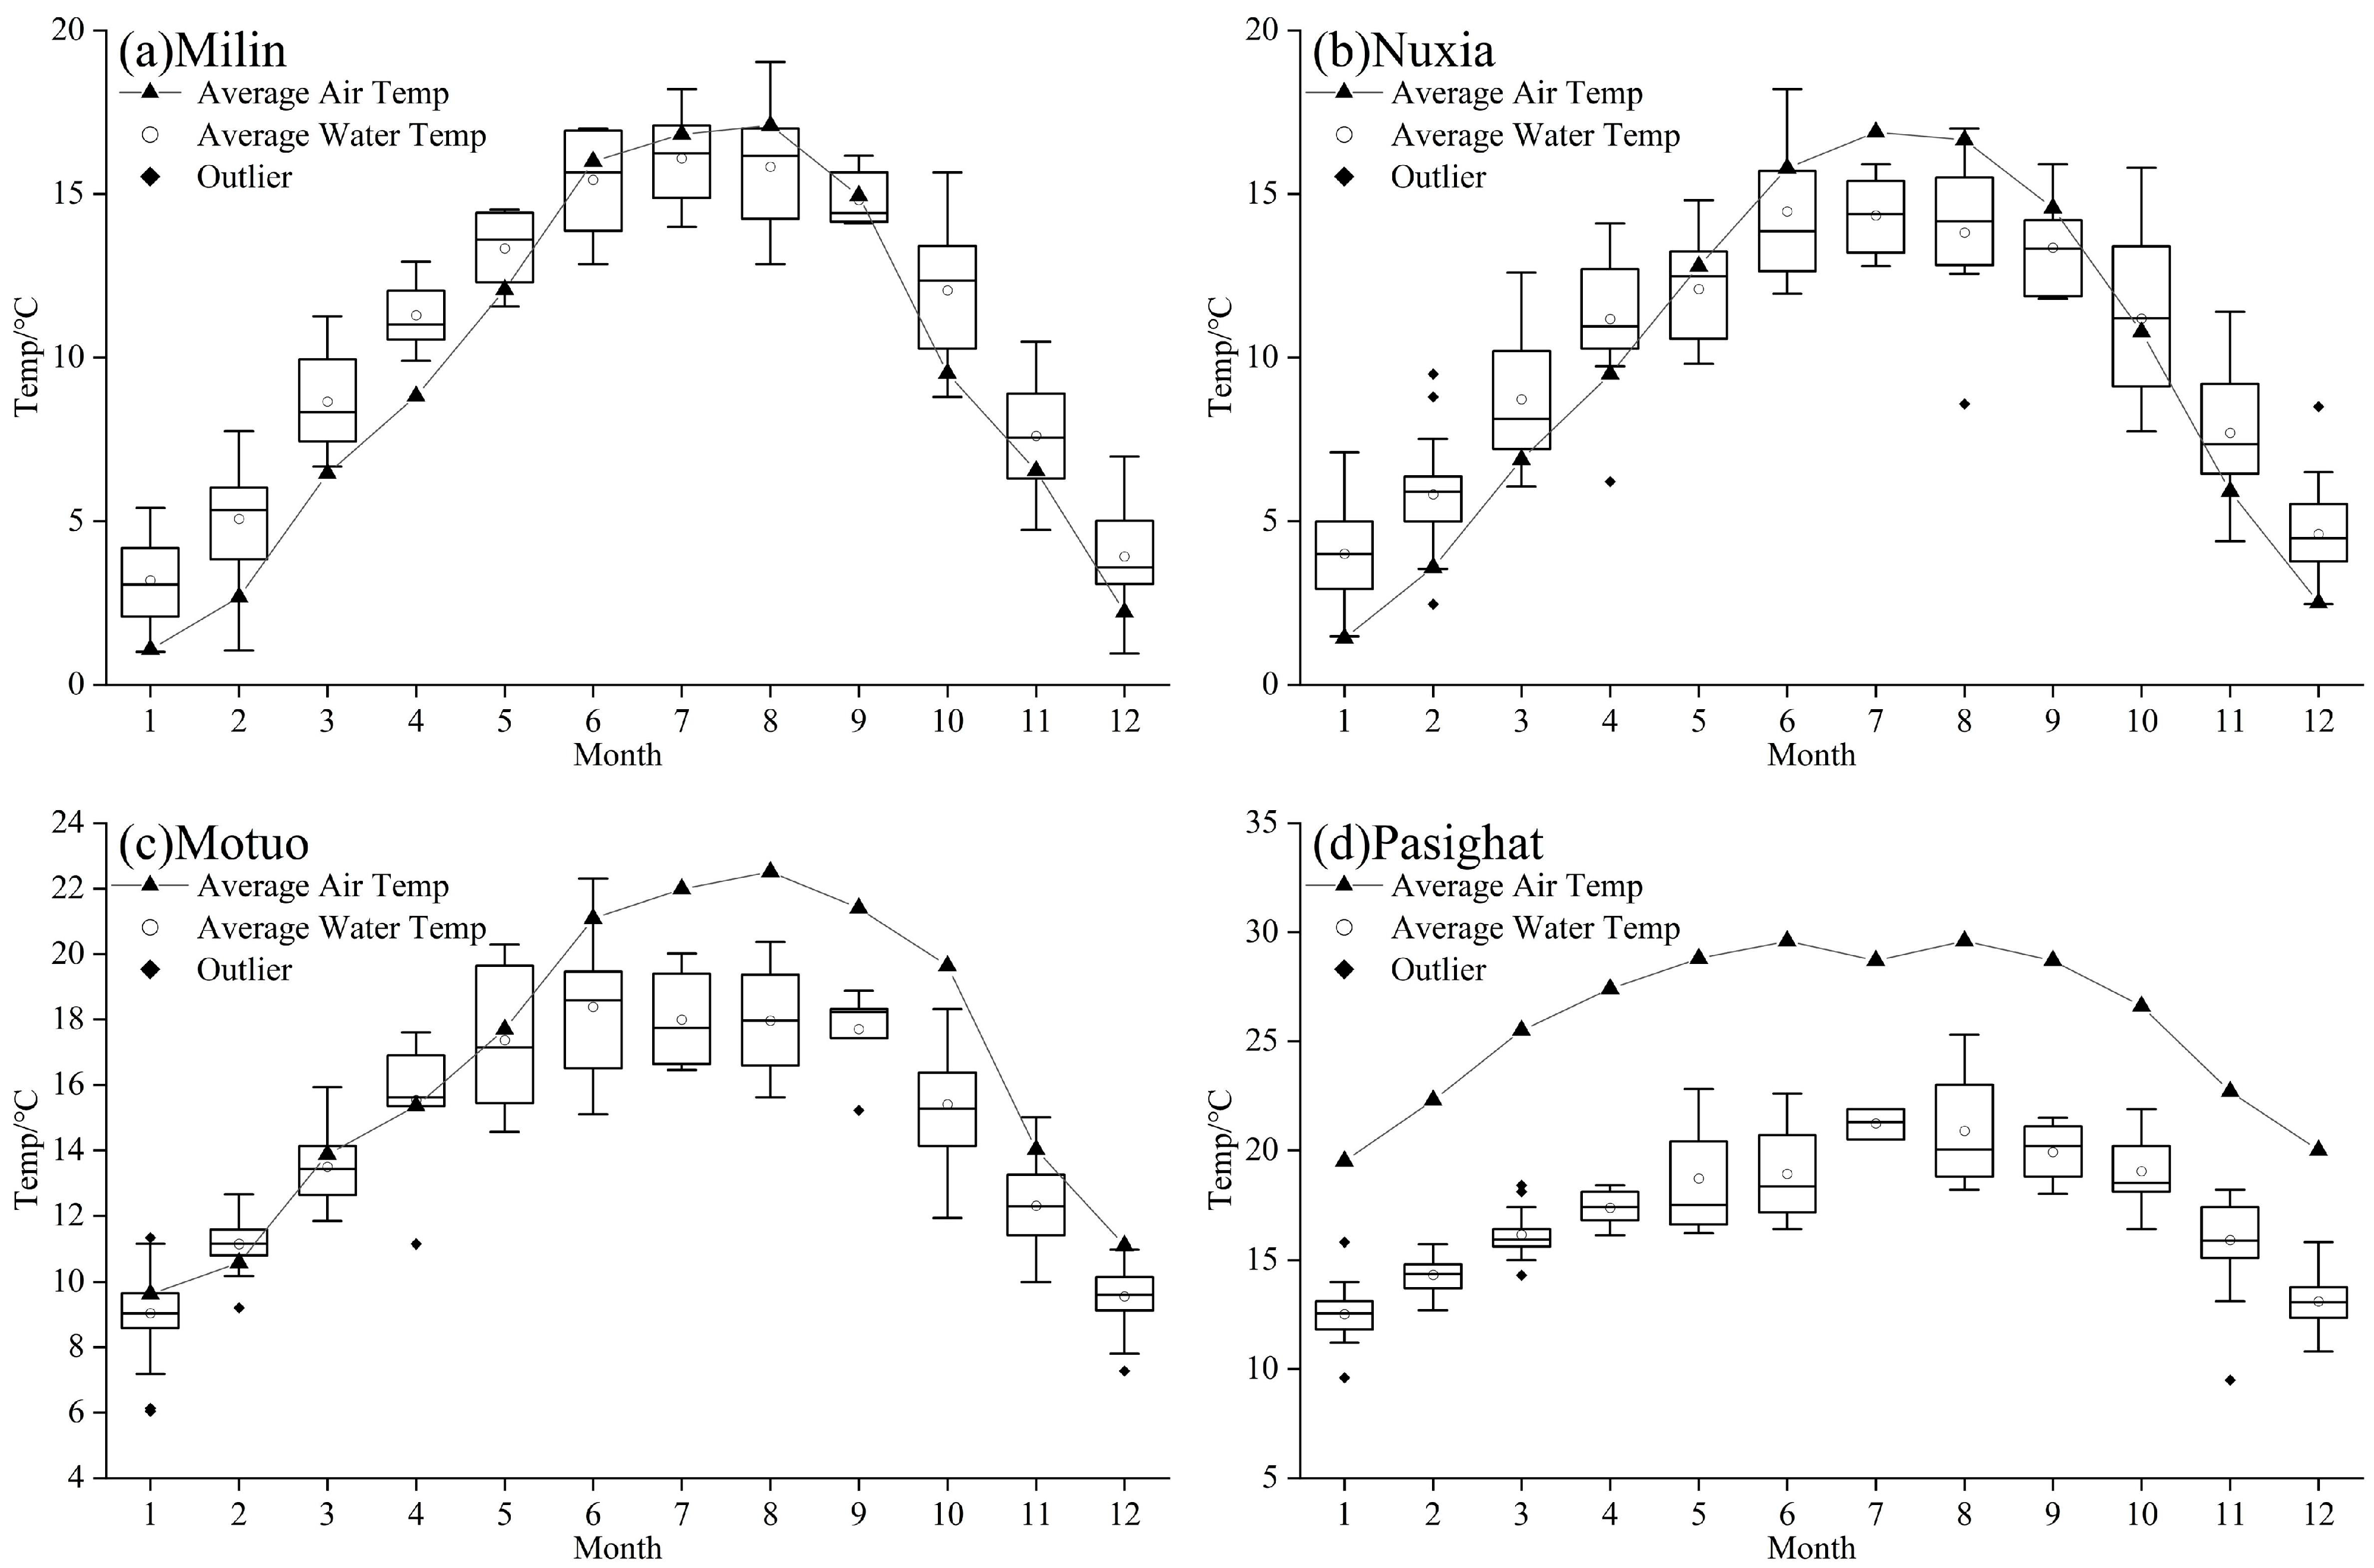
Four representative sites, Milin, Nuxia, Motuo, and Pasighat, were selected for the analysis of annual water temperature variation. Overall, the water temperature in the lower reaches is greater than that in the upper reaches, and the annual variation in the water temperature is greater in the downstream reaches than in the upstream reaches (
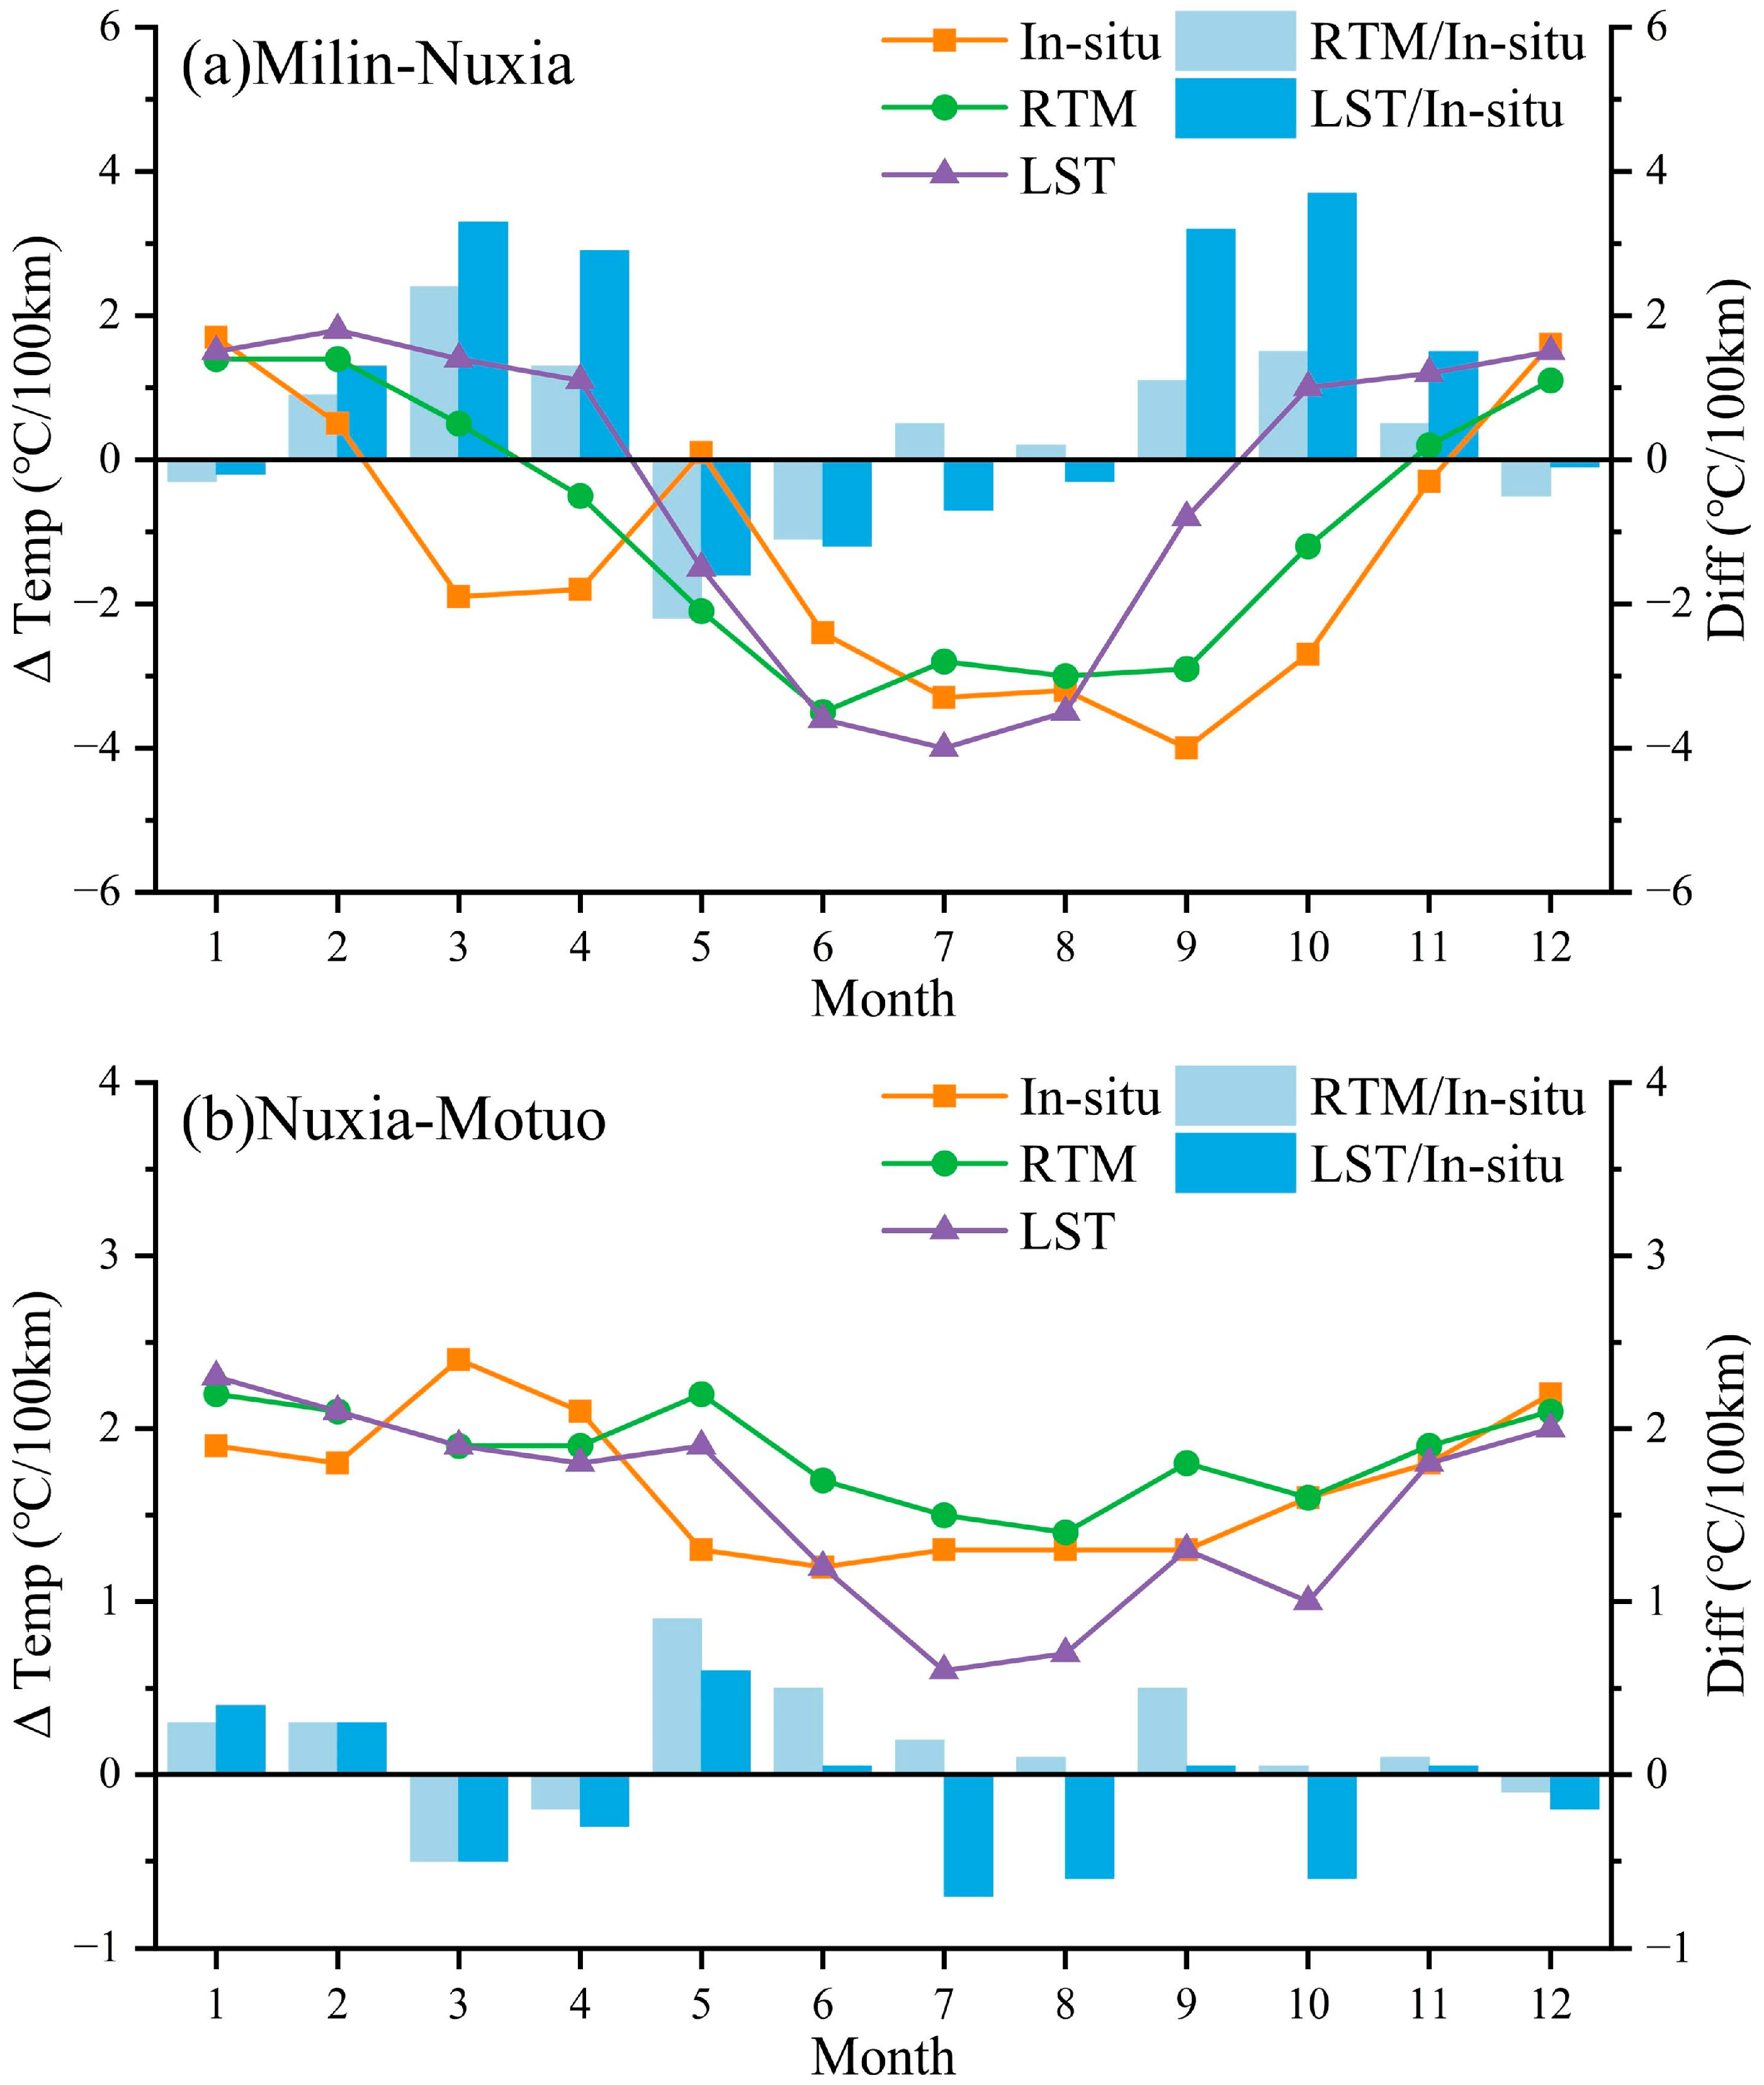
Figure 10). The annual fluctuations in water temperature decrease from the upstream to downstream sites, measuring 12.9 °C, 10.5 °C, 9.3 °C, and 8.7 °C at Milin, Nuxia, Motuo, and Pasighat, respectively. Additionally, the monthly variation in water temperature shows a more stable pattern downstream, especially during the spring and winter months from October to March, where the average interquartile range for Pasighat is 1.1 °C, and for Milin, it is 2.1 °C. This stability is attributed to the fact that the lower reaches fall within a subtropical climatic zone, where temperatures are generally higher throughout the year, and there are no significant tributaries entering the area, resulting in smaller and more stable fluctuations in downstream water temperature. The lowest water temperatures at the four sites occurred in January, at 3.1 °C, 4.0 °C, 9.0 °C, and 12.5 °C, with an average increase of 1.6 °C/100 km along the river. The highest water temperatures are recorded from June to August, at 15.8 °C, 14.5 °C, 18.4 °C, and 21.2 °C, with an average increase of 0.9 °C/100 km along the river. The highest temperature in Milin is reached in July, whereas Nuxia and Motuo experienced increased contributions of glacial meltwater during the high-temperature period in July because of the inflow of the tributaries Nyang River and Palong Tsangpo River, with peak temperatures occurring in June.
There are significant differences in the relationships between the water temperature and air temperature between the upstream and downstream regions of the studied river. In the upper reaches, the water temperatures at Milin and Nuxia are lower than the air temperatures only during the summer when snowmelt occurs. In other seasons, the water temperatures are higher than the air temperatures. The annual air temperature is 9.6 °C, which is 0.8 °C higher than the water temperature. This may be related to the strong solar radiation in the region and the low heat retention capacity of the thin highland air. In the downstream gorge section, the altitude decreases rapidly, causing air temperatures to rise quickly with decreasing elevation, while the rate of increase in water temperature is significantly lower than that of air temperature, particularly during the summer and autumn months. The annual air temperature in Motuo is 17.2 °C, which is 2.5 °C higher than the annual water temperature, and from June to October, the air temperature is 3.7 °C higher than the water temperature. Downstream at Pasighat, a subtropical climate zone prevails, with temperatures reaching 25.8 °C, which is 8.5 °C higher than the water temperature. Compared with the rapid increase in air temperature, the rate of increase in water temperature significantly lagged.

4.4. Spatial Variation

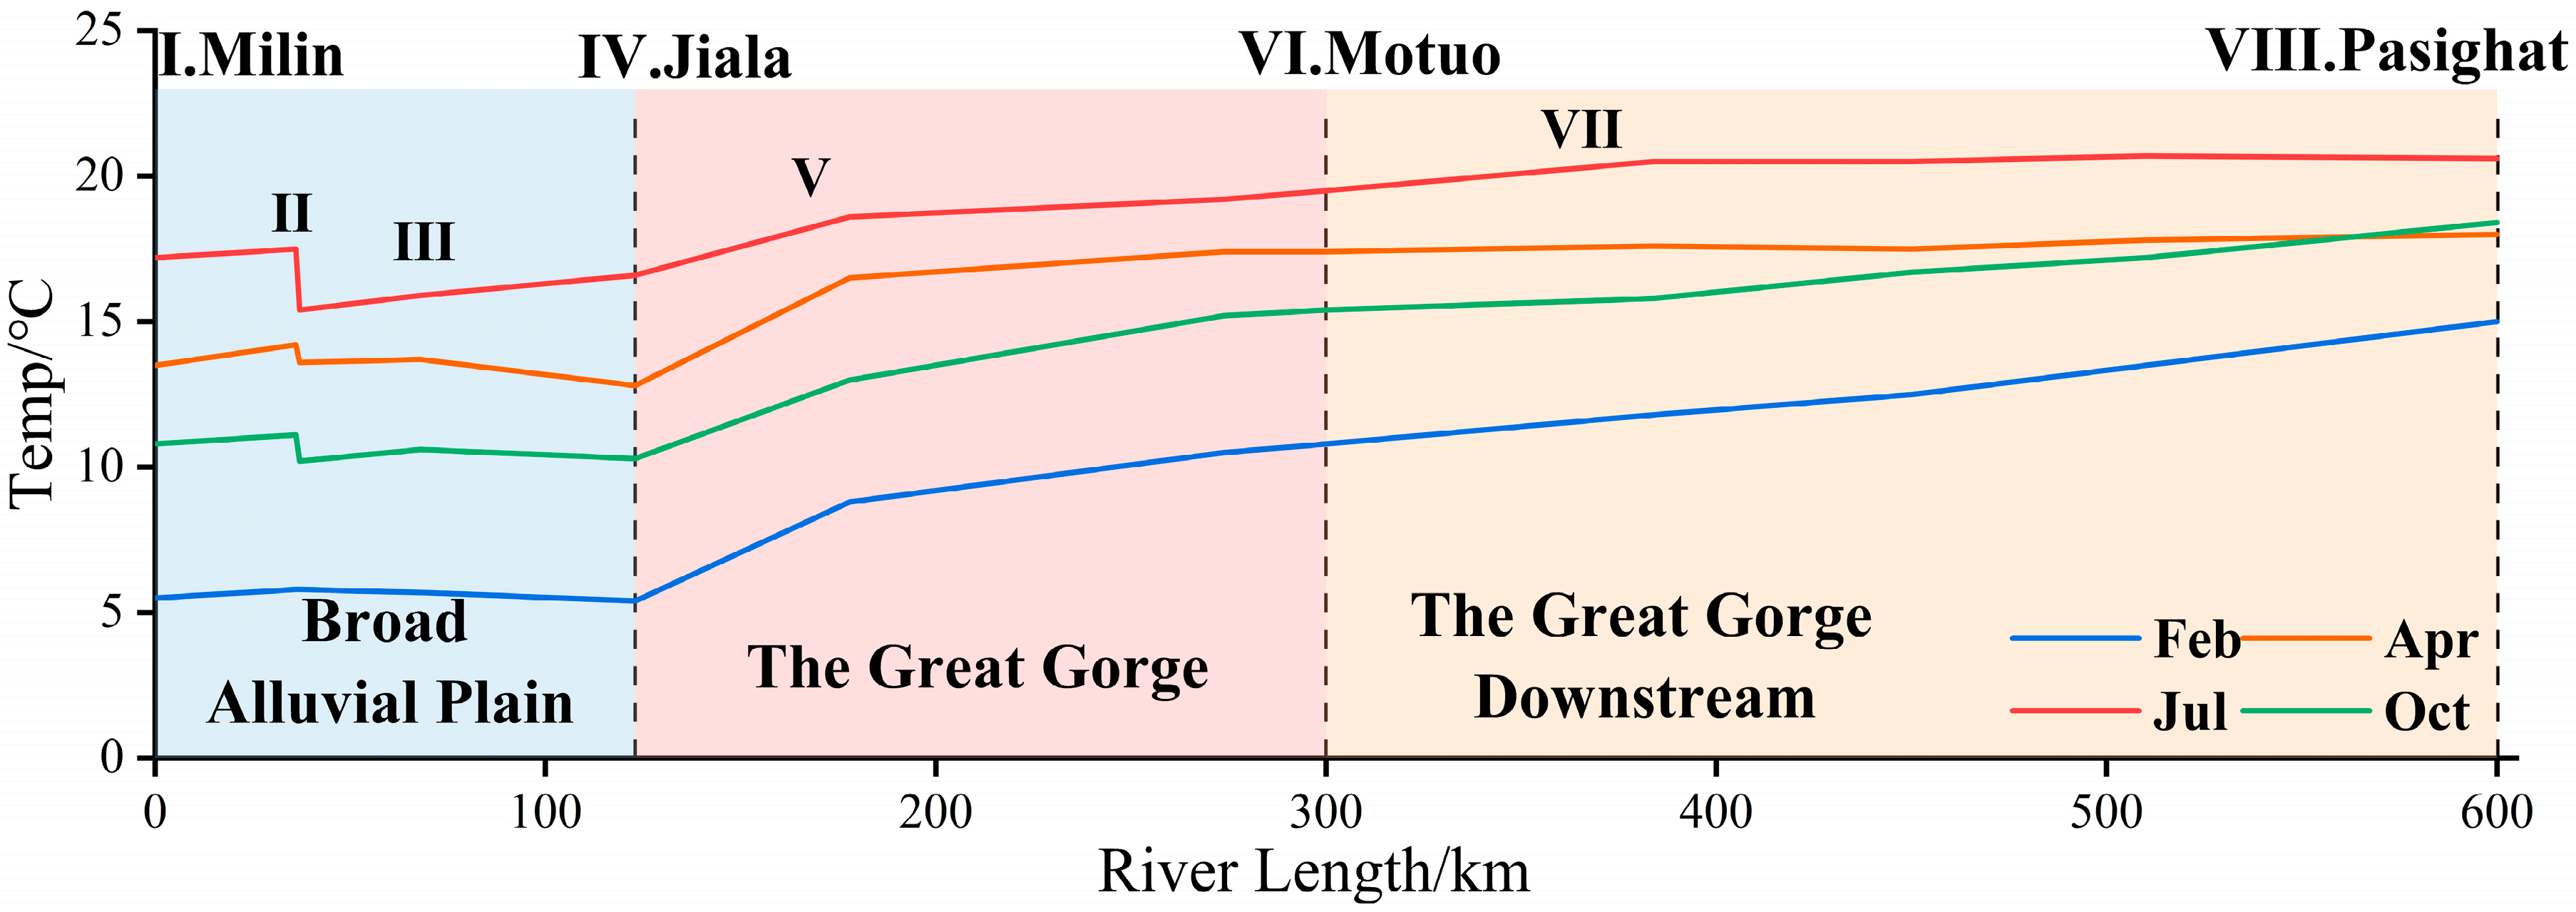
Figure 11 shows the longitudinal variation in water temperature in the downstream section of the study river during typical months across different seasons. The water temperature increases along the 600 km river stretch. However, due to influences from climate, elevation differences, and tributary inflows, the water temperature exhibits segmented characteristics in variation.
In the broad alluvial plain section (from Milin to Jiala), the river is approximately 400 m wide, and the flow is gentle, with most segments having slopes of less than 1‰. The water temperature remains higher than the air temperature throughout the year. The water temperature in this segment exhibited an overall temperature decrease, with an average rate of temperature change of −0.3 °C/100 km, varying between −0.8 and 0.1 °C/100 km. The tributary Nyang River accounts for approximately 25% of the main river’s flow, and its inflow significantly affects the water temperature of the main river. For example, in July, the water temperature of the studied river section gradually increased before the confluence and then sharply decreased by approximately 3 °C at the Nyang River junction. As the water mixes, the water temperature gradually stabilizes, resulting in a decrease of approximately 1 °C compared with the preconfluence temperature at Jiala (Figure 11). During the dry season, the inflow from the Nyang River has little effect on the water temperature of the main river, which results in relatively stable water temperature changes in this section. 
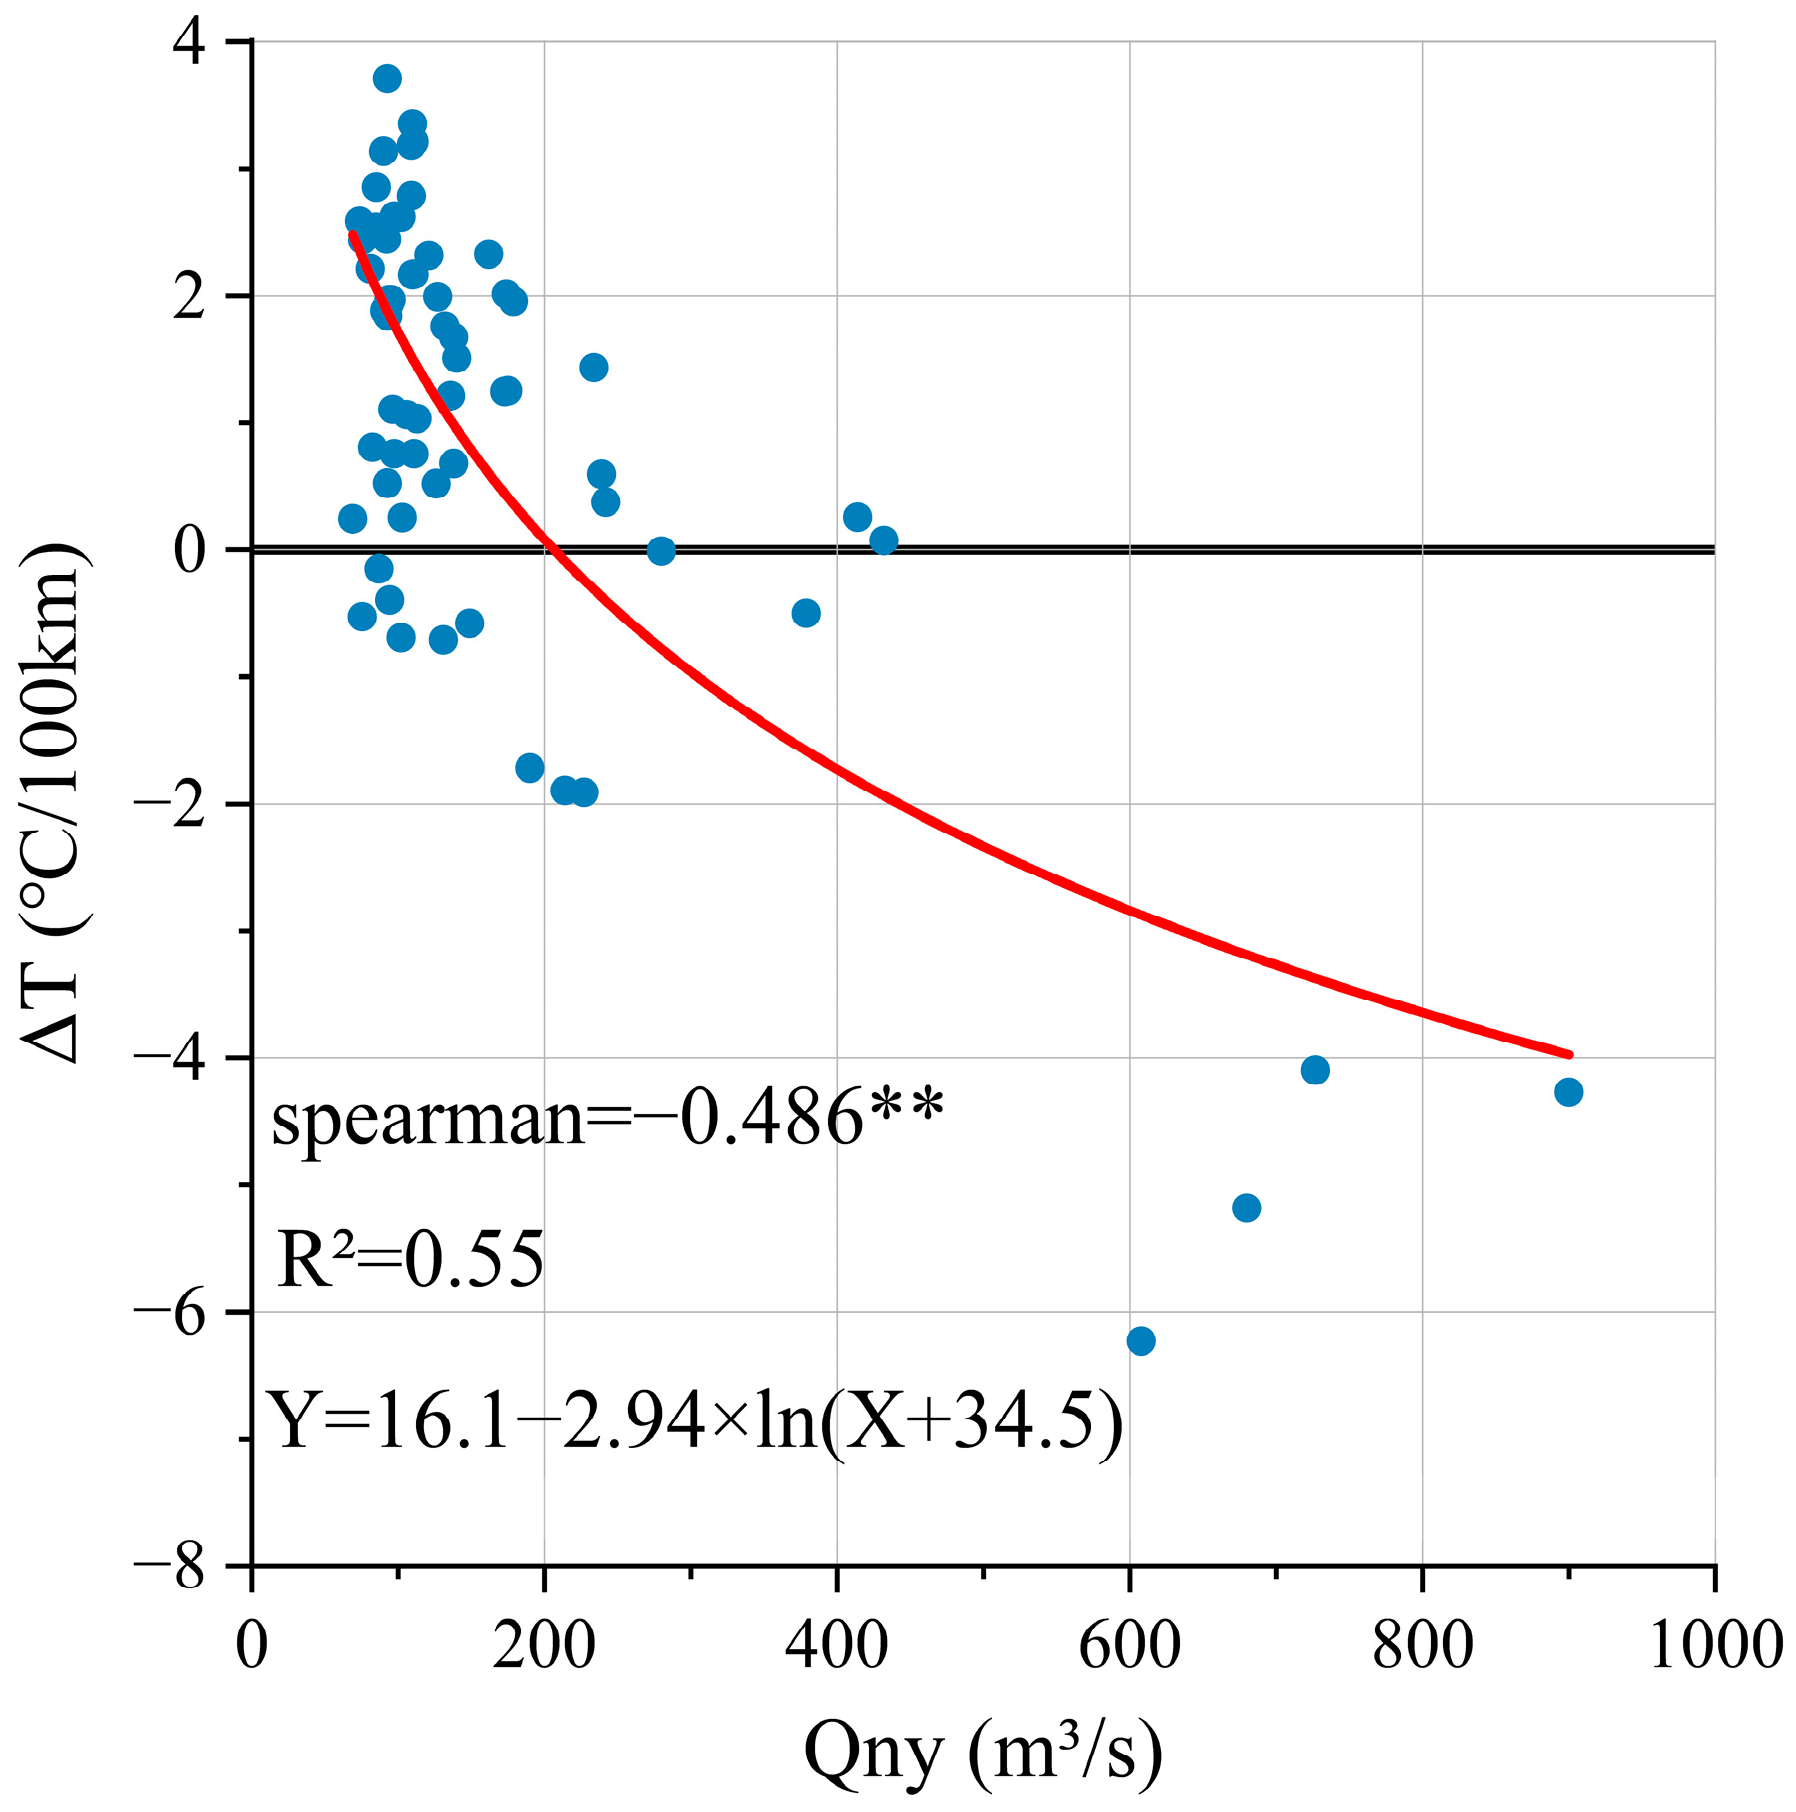
Figure 12 shows the correlation between the flow rate of the Nyang River and the warming rate from Milin to Nuxia. The results indicate a significant moderate negative correlation (Spearman’s rho = −0.486, p < 0.01). The sudden decrease in water temperature at the Nyang River confluence reflects the significant cooling effect of glacial meltwater on the water temperature of the downstream section of the study river, which is an important factor affecting the river water temperature in this study.
In the Great Gorge section (from Jiala to Motuo), the river is narrow, with a width of 60 to 180 m and a significant vertical drop (approximately 2300 m), resulting in an average slope of up to 20‰. The water temperature steadily and rapidly increased along this 175 km stretch, rising by 3.9 °C, with a rate of temperature change of 2.2 °C/100 km. This segment features larger tributaries, such as the Palong Tsangpo River, which are mainly recharged by snowmelt, which causes the rate of temperature change during the flood season to be slightly lower than that during the dry season (Figure 13). The summer temperature change rate was 1.5 °C/100 km, whereas the winter temperature change rate reached 3.0 °C/100 km (Table 7). In the Great Gorge, the air temperature is slightly higher than the water temperature, and the tributary water temperatures are relatively low. The strong increase in water temperature along this segment is due primarily to significant elevation decreases in the region, which lead to substantial energy conversion from kinetic to thermal energy. Relevant studies indicate that a 100 m drop can cause an increase in water temperature of approximately 0.16 °C, whereas a 2 km drop can result in a nearly 3 °C increase. The “drop-internal energy” conversion in this river section accounts for 90% of the water temperature increase [71].
After flowing through Motuo and entering the Great Gorge downstream section, the slope decreases, with an average gradient of 2‰. The rate of water temperature change along this stretch is slightly lower than that in the Great Gorge stretch, with an average rate of temperature change of 0.8 °C/100 km, varying between 0.5 and 1.2 °C/100 km. The Great Gorge downstream section experiences abundant rainfall and a warm climate due to the influence of warm, moist air currents, allowing the water temperature to maintain a relatively high rate of temperature change. The rate of temperature change along the section is also greater in the dry season than in the flood season, with an average rate of temperature change of 0.5 °C/100 km in spring and summer and an average rate of temperature change of 1.1 °C/100 km in autumn and winter.

5. Discussion

Remote sensing provides an important means to obtain historical water temperature data for rivers in data-scarce plateau regions. Landsat data accurately depict the patterns of water temperature variation in the lower reaches of the studied river section under high vertical drops and unique climatic conditions, providing long-term, spatially continuous water temperature data that can serve as a supplementary dataset for data-scarce regions. Owing to the limitations imposed by the 16-day revisit cycle of the satellite and cloud cover, the number of usable images per year is relatively limited. In this study, a total of 210 Landsat images were utilized, and this large dataset was leveraged to increase the reliability of the results. To obtain continuous water temperature data for precise interannual variation studies, models such as Air2Stream and CE-QUAL-W2can be integrated to acquire continuous datasets [10,28,72].
The spatial resolution of thermal infrared data is a significant factor affecting the accuracy of water temperature measurements. Since the thermal infrared bands of the Landsat satellite undergo three rounds of convolution resampling, radiative mixing can affect the selection of pure water pixels [22,27,70]. The native pixel spacings of the thermal infrared bands of Landsat 7 and 8 are 60 m and 100 m, respectively, which means that this method can obtain relatively reliable results for rivers with widths greater than 180 m to 300 m. To avoid edge effects, the width of the river being inverted should comply with the three-pixel rule. When the river width exceeds three pixels, the average error is only 1.2 °C. However, for river segments that are only 1–3 pixels wide, the error can increase to 2.2 °C because of the arrangement of the pixels [22]. In the Great Gorge and downstream sections, the river width mostly ranges from 100 to 300 m, leading to noticeable edge interference in the water temperature inversion, so Motuo has the lowest inversion accuracy among the three locations. In this study, we extracted the water temperature along the centerline of the river to represent the overall water temperature, achieving an RMSE ranging from 1.55 °C to 1.85 °C for Motuo, which still indicates good accuracy. To obtain water temperature measurements for rivers narrower than the pixel size, image thermal sharpening algorithms can be considered. This approach not only improves the accuracy of the results to some extent but also enables the inversion of surface temperatures for rivers as narrow as 120 m, which is lower than the recommended 300 m for Landsat 8 [27,28].
The inversion algorithm also affects the inversion accuracy, and the RTM with Atmcorr atmospheric parameters demonstrates good accuracy in the lower reaches of the studied river section, where the water vapor content is high. The precipitation bands and warm zones formed in the studied river section not only cause cloud interference and contamination of satellite imagery but also impact inversion accuracy. Owing to the occurrence of stray light issues in only one thermal infrared band, the split-window algorithm is not applicable to Landsat 7 and 8. The accuracy of single-channel algorithms significantly decreases under high-humidity conditions (w > 3 g/cm2) [32,33]. The studied river section is characterized by a high-humidity environment, making the atmospheric correction method the most suitable inversion algorithm for this region. The results show that the water temperature data obtained via RTM are highly accurate and can meet the needs of studies on the spatial and temporal patterns of water temperature in the lower reaches of the studied river section. Atmcorr represents the atmospheric state of the entire region when only one dataset is used, which may introduce certain errors over large areas. Additionally, there are significant differences in meteorological conditions within the study area [28], but dividing the region to obtain different atmospheric parameters overcomes these drawbacks and results in good accuracy.
The incorporation of additional data and the correction of data contribute to improvements in inversion accuracy to some extent. For example, using an improved single-channel algorithm that incorporates Ta and w can effectively increase the accuracy of temperature inversion, resulting in smaller errors than a single-channel algorithm based only on w [33]. Utilizing machine learning algorithms based on land cover, topography, and satellite surface temperature allows for the assessment of monthly average water temperatures in rivers ranging from 300–1000 m wide, with an overall median RMSE of approximately 1.5 °C and a Bias of 0% [73]. Combining measured water temperatures with thermal infrared images can improve the accuracy of water temperature inversions [74], and simple corrections based on existing field observations can enhance the consistency between “skin temperature” and water body temperature [69]. Even though the water surface temperature derived from Landsat data generally underestimates low temperatures and overestimates high temperatures, the correction of measured data can improve the accuracy of the results [10]. The results of this study are consistent with those of other studies, indicating that while ideal improvements may not be achieved in all cases, the incorporation of measured data effectively enhances the inversion accuracy.
Landsat satellite data provide valuable information for studying the thermal state of plateau rivers; however, this study still has certain limitations. First, the relatively low temporal resolution of satellite sensors and cloud interference, particularly the significant loss of valid imagery during the warm season, prevented this study from fully analyzing the interannual variations in water temperature under the interaction of climate change and hydrological processes. Second, this study utilized the Atmcorr atmospheric parameter database to obtain atmospheric data. However, the USGS has now adopted the Landsat L2 product to replace Atmcorr, and the accuracy and effectiveness of L2 atmospheric parameters for atmospheric correction require further evaluation. For water temperature correction, this study employed linear regression to eliminate systematic satellite errors. While this method is simple and effective, it also involves uncertainties. Future studies could integrate multiple environmental covariates, such as air temperature, land surface temperature, and elevation, while incorporating machine learning algorithms, such as random forests and neural networks, to increase the accuracy of thermal infrared temperature retrieval.

6. Conclusions

In this study, we utilized a total of 210 Landsat 7 and 8 satellite images from 2004–2022 and constructed a water temperature interpretation model to obtain water temperature data for the lower Yarlung Tsangpo River, aiming to analyze its spatiotemporal variation patterns. The verification results indicate that the water temperature interpretation model constructed using Landsat 7 and 8 images along with the RTM method has good accuracy and stability for the studied river section, with RMSEs ranging from 1.00 to 1.85 °C, and regression corrections reduce errors by 1.6% to 22.2%. The results of the RTM are better than those of the LST, making it more suitable for analyzing the spatiotemporal patterns of the lower Yarlung Tsangpo River water temperature under complex terrain and meteorological conditions. The correlation analysis results revealed that the impacts of climate and hydrological factors on river water temperature are spatially heterogeneous, with air temperature being the most significant factor. The studied section is influenced by a high-altitude climate and significant vertical drops, resulting in greater intra-annual and intramonth variations in water temperature in the upstream areas, with a notable lag in water temperature increases relative to the air temperature along the river. From a spatial perspective, water temperature exhibits segmented and differential characteristics that are influenced by geographical features, climate, and runoff supply. The broad alluvial plain section upstream shows an overall decreasing trend in temperature due to the localized snowmelt supply, whereas the influx of large tributaries results in significant lateral differences. In the Great Gorge section, mechanical energy conversion due to large vertical drops led to rapid water temperature increases, with an average rate of temperature change of 2.2 °C/100 km. In the Great Gorge downstream section, there is a subtropical climate zone, with an annual average warming rate of 0.8 °C/100 km. In summary, the water temperature interpretation model constructed on the basis of Landsat 7 and 8 data overcomes geographical and temporal limitations, providing good accuracy for the high-altitude Yarlung Tsangpo River. This method offers a convenient and feasible means of obtaining water temperature data for data-scarce rivers, revealing the unique spatiotemporal variation patterns of water temperature in the study area and deepening the understanding of the complex habitats of plateau rivers.

Author Contributions

Y.W.: conceptualization, methodology, software, validations, formal analysis, original draft and visualization. Y.D.: conceptualization, methodology, review and editing, project administration, supervision and funding. Y.Y.: methodology, software, resources and review and editing. Y.T.: conceptualization, methodology, supervision, review and editing. X.W.: data acquisition, validations and software. J.Z.: methodology, data acquisition, review and editing. All authors have read and agreed to the published version of the manuscript.

Funding

This research did not receive any specific grant from funding agencies in the public, commercial, or not-for-profit sectors.

Data Availability Statement

The original contributions presented in the study are included in the article, further inquiries can be directed to the corresponding author.

Conflicts of Interest

Author Yanjing Yang was employed by the company PowerChina Chengdu Engineering Corporation Limited. The remaining authors declare that the research was conducted in the absence of any commercial or financial relationships that could be construed as a potential conflict of interest.

References

  1. Caissie, D. The thermal regime of rivers: A review. Freshw. Biol. 2006, 51, 1389–1406. [Google Scholar] [CrossRef]
  2. van Vliet, M.T.H.; Franssen, W.H.P.; Yearsley, J.R.; Ludwig, F.; Haddeland, I.; Lettenmaier, D.P.; Kabat, P. Global river discharge and water temperature under climate change. Glob. Environ. Change-Hum. Policy Dimens. 2013, 23, 450–464. [Google Scholar] [CrossRef]
  3. Braun, D.C.; Reynolds, J.D.; Patterson, D.A. Using watershed characteristics to inform cost-effective stream temperature monitoring. Aquat. Ecol. 2015, 49, 373–388. [Google Scholar] [CrossRef]
  4. Bookhagen, B.; Burbank, D.W. Toward a complete Himalayan hydrological budget: Spatiotemporal distribution of snowmelt and rainfall and their impact on river discharge. J. Geophys. Res.-Earth Surf. 2010, 115, F03019. [Google Scholar] [CrossRef]
  5. Immerzeel, W.W.; van Beek, L.P.H.; Bierkens, M.F.P. Climate Change Will Affect the Asian Water Towers. Science 2010, 328, 1382–1385. [Google Scholar] [CrossRef] [PubMed]
  6. Yao, T.D.; Thompson, L.; Yang, W.; Yu, W.S.; Gao, Y.; Guo, X.J.; Yang, X.X.; Duan, K.Q.; Zhao, H.B.; Xu, B.Q.; et al. Different glacier status with atmospheric circulations in Tibetan Plateau and surroundings. Nat. Clim. Change 2012, 2, 663–667. [Google Scholar] [CrossRef]
  7. Liu, Z.F.; Yao, Z.J.; Wang, R.; Yu, G.A. Estimation of the Qinghai-Tibetan Plateau runoff and its contribution to large Asian rivers. Sci. Total Environ. 2020, 749, 141570. [Google Scholar] [CrossRef]
  8. Sun, F.D.; Ma, R.H.; He, B.; Zhao, X.L.; Zeng, Y.C.; Zhang, S.Y.; Tang, S.L. Changing Patterns of Lakes on The Southern Tibetan Plateau Based on Multi-Source Satellite Data. Remote Sens. 2020, 12, 3450. [Google Scholar] [CrossRef]
  9. Wan, W.; Zhao, L.; Xie, H.; Liu, B.; Li, H.; Cui, Y.; Ma, Y.; Hong, Y. Lake Surface Water Temperature Change Over the Tibetan Plateau from 2001 to 2015: A Sensitive Indicator of the Warming Climate. Geophys. Res. Lett. 2018, 45, 11177–11186. [Google Scholar] [CrossRef]
  10. Shi, X.; Sun, J.; Xiao, Z.J. Investigation on River Thermal Regime under Dam Influence by Integrating Remote Sensing and Water Temperature Model. Water 2021, 13, 133. [Google Scholar] [CrossRef]
  11. Dyba, K.; Ermida, S.; Ptak, M.; Piekarczyk, J.; Sojka, M. Evaluation of Methods for Estimating Lake Surface Water Temperature Using Landsat 8. Remote Sens. 2022, 14, 3839. [Google Scholar] [CrossRef]
  12. Kallio, K. Remote Sensing as a Tool for Monitoring Lake Water Quality. In Water Quality Measurements Series; John Wiley & Sons, Ltd.: Hoboken, NJ, USA, 2000; pp. 237–245. [Google Scholar]
  13. Gholizadeh, M.H.; Melesse, A.M.; Reddi, L. A Comprehensive Review on Water Quality Parameters Estimation Using Remote Sensing Techniques. Sensors 2016, 16, 1298. [Google Scholar] [CrossRef] [PubMed]
  14. Song, C.Q.; Huang, B.; Ke, L.H.; Richards, K.S. Remote sensing of alpine lake water environment changes on the Tibetan Plateau and surroundings: A review. ISPRS-J. Photogramm. Remote Sens. 2014, 92, 26–37. [Google Scholar] [CrossRef]
  15. Song, K.S.; Wang, M.; Du, J.; Yuan, Y.; Ma, J.H.; Wang, M.; Mu, G.Y. Spatiotemporal Variations of Lake Surface Temperature across the Tibetan Plateau Using MODIS LST Product. Remote Sens. 2016, 8, 854. [Google Scholar] [CrossRef]
  16. Liu, B.J.; Wan, W.; Xie, H.J.; Li, H.; Zhu, S.Y.; Zhang, G.Q.; Wen, L.J.; Hong, Y. A long-term dataset of lake surface water temperature over the Tibetan Plateau derived from AVHRR 1981–2015. Sci. Data 2019, 6, 48. [Google Scholar] [CrossRef]
  17. Zhao, W.; Xiong, D.H.; Wen, F.P.; Wang, X.D. Lake area monitoring based on land surface temperature in the Tibetan Plateau from 2000 to 2018. Environ. Res. Lett. 2020, 15, 084033. [Google Scholar] [CrossRef]
  18. Zhang, G.Q.; Yao, T.D.; Xie, H.J.; Qin, J.; Ye, Q.H.; Dai, Y.F.; Guo, R.F. Estimating surface temperature changes of lakes in the Tibetan Plateau using MODIS LST data. J. Geophys. Res.-Atmos. 2014, 119, 8552–8567. [Google Scholar] [CrossRef]
  19. Zhang, G.Q.; Duan, S.Q. Lakes as sentinels of climate change on the Tibetan Plateau. All Earth 2021, 33, 161–165. [Google Scholar] [CrossRef]
  20. Palmer, S.C.J.; Kutser, T.; Hunter, P.D. Remote sensing of inland waters: Challenges, progress and future directions. Remote Sens. Environ. 2015, 157, 1–8. [Google Scholar] [CrossRef]
  21. Murphy, R.D., Jr.; Hagan, J.A.; Harris, B.P.; Sethi, S.A.; Smeltz, T.S.; Restrepo, F. Can Landsat Thermal Imagery and Environmental Data Accurately Estimate Water Temperatures in Small Streams? J. Fish Wildl. Manag. 2021, 12, 12–26. [Google Scholar] [CrossRef]
  22. Handcock, R.N.; Gillespie, A.R.; Cherkauer, K.A.; Kay, J.E.; Burges, S.J.; Kampf, S.K. Accuracy and uncertainty of thermal-infrared remote sensing of stream temperatures at multiple spatial scales. Remote Sens. Environ. 2006, 100, 427–440. [Google Scholar]
  23. Wawrzyniak, V.; Piégay, H.; Poirel, A. Longitudinal and temporal thermal patterns of the French Rhône River using Landsat ETM+ thermal infrared images. Aquat. Sci. 2012, 74, 405–414. [Google Scholar] [CrossRef]
  24. Mohsen, A.; Kiss, T.; Baranya, S.; Balla, A.; Kovács, F. Thermal Profile Dynamics of a Central European River Based on Landsat Images: Natural and Anthropogenic Influencing Factors. Remote Sens. 2024, 16, 3196. [Google Scholar] [CrossRef]
  25. Ling, F.; Foody, G.M.; Du, H.; Ban, X.; Li, X.D.; Zhang, Y.H.; Du, Y. Monitoring Thermal Pollution in Rivers Downstream of Dams with Landsat ETM plus Thermal Infrared Images. Remote Sens. 2017, 9, 1175. [Google Scholar] [CrossRef]
  26. Zhao, J.Y.; Li, H.; Cai, X.B.; Chen, F.; Wang, L.C.; Yu, D.Q.; Li, C.A. Long-term (2002–2017) impacts of Danjiangkou dam on thermal regimes of downstream Han River (China) using Landsat thermal infrared imagery. J. Hydrol. 2020, 589, 125135. [Google Scholar] [CrossRef]
  27. Martí-Cardona, B.; Prats, J.; Niclòs, R. Enhancing the retrieval of stream surface temperature from Landsat data. Remote Sens. Environ. 2019, 224, 182–191. [Google Scholar] [CrossRef]
  28. Tavares, M.H.; Cunha, A.H.F.; Motta-Marques, D.; Ruhoff, A.L.; Fragoso, C.R., Jr.; Munar, A.M.; Bonnet, M.P. Derivation of consistent, continuous daily river temperature data series by combining remote sensing and water temperature models. Remote Sens. Environ. 2020, 241, 111721. [Google Scholar] [CrossRef]
  29. Aliabad, F.A.; Zare, M.; Malamiri, H.G. Comparison of the accuracy of daytime land surface temperature retrieval methods using Landsat 8 images in arid regions. Infrared Phys. Technol. 2021, 115, 103692. [Google Scholar] [CrossRef]
  30. Yu, X.L.; Guo, X.L.; Wu, Z.C. Land Surface Temperature Retrieval from Landsat 8 TIRS-Comparison between Radiative Transfer Equation-Based Method, Split Window Algorithm and Single Channel Method. Remote Sens. 2014, 6, 9829–9852. [Google Scholar] [CrossRef]
  31. Zheng, X.; Guo, Y.; Zhou, Z.; Wang, T. Improvements in land surface temperature and emissivity retrieval from Landsat-9 thermal infrared data. Remote Sens. Environ. 2024, 315, 114471. [Google Scholar] [CrossRef]
  32. Du, C.; Ren, H.Z.; Qin, Q.M.; Meng, J.J.; Zhao, S.H. A Practical Split-Window Algorithm for Estimating Land Surface Temperature from Landsat 8 Data. Remote Sens. 2015, 7, 647–665. [Google Scholar] [CrossRef]
  33. Cristóbal, J.; Jiménez-Muñoz, J.C.; Prakash, A.; Mattar, C.; Skokovic, D.; Sobrino, J.A. An Improved Single-Channel Method to Retrieve Land Surface Temperature from the Landsat-8 Thermal Band. Remote Sens. 2018, 10, 431. [Google Scholar] [CrossRef]
  34. Qin, Z.; Karnieli, A.; Berliner, P. A mono-window algorithm for retrieving land surface temperature from Landsat TM data and its application to the Israel-Egypt border region. Int. J. Remote Sens. 2001, 22, 3719–3746. [Google Scholar] [CrossRef]
  35. Jiménez-Muñoz, J.C.; Sobrino, J.A. A generalized single-channel method for retrieving land surface temperature from remote sensing data. J. Geophys. Res.-Atmos. 2004, 109, D08112. [Google Scholar] [CrossRef]
  36. Jiménez-Muñoz, J.C.; Cristóbal, J.; Sobrino, J.A.; Sória, G.; Ninyerola, M.; Pons, X. Revision of the Single-Channel Algorithm for Land Surface Temperature Retrieval From Landsat Thermal-Infrared Data. IEEE Trans. Geosci. Remote Sens. 2009, 47, 339–349. [Google Scholar] [CrossRef]
  37. Wang, F.; Qin, Z.H.; Song, C.Y.; Tu, L.L.; Karnieli, A.; Zhao, S.H. An Improved Mono-Window Algorithm for Land Surface Temperature Retrieval from Landsat 8 Thermal Infrared Sensor Data. Remote Sens. 2015, 7, 4268–4289. [Google Scholar] [CrossRef]
  38. Li, Z.L.; Tang, B.H.; Wu, H.; Ren, H.Z.; Yan, G.J.; Wan, Z.M.; Trigo, I.F.; Sobrino, J.A. Satellite-derived land surface temperature: Current status and perspectives. Remote Sens. Environ. 2013, 131, 14–37. [Google Scholar] [CrossRef]
  39. Vanhellemont, Q. Automated water surface temperature retrieval from Landsat 8/TIRS. Remote Sens. Environ. 2020, 237, 111518. [Google Scholar] [CrossRef]
  40. Sun, W.C.; Wang, Y.Y.; Fu, Y.S.H.; Xue, B.L.; Wang, G.Q.; Yu, J.S.; Zuo, D.P.; Xu, Z.X. Spatial heterogeneity of changes in vegetation growth and their driving forces based on satellite observations of the Yarlung Zangbo River Basin in the Tibetan Plateau. J. Hydrol. 2019, 574, 324–332. [Google Scholar] [CrossRef]
  41. Li, C.Y.; Hao, J.S.; Zhang, G.T.; Fang, H.Y.; Wang, Y.; Lu, H.J. Runoff variations affected by climate change and human activities in Yarlung Zangbo River, southeastern Tibetan Plateau. Catena 2023, 230, 107184. [Google Scholar] [CrossRef]
  42. Wang, P.; Scherler, D.; Jing, L.Z.; Mey, J.; Avouac, J.P.; Zhang, Y.D.; Shi, D.G. Tectonic control of Yarlung Tsangpo Gorge revealed by a buried canyon in Southern Tibet. Science 2014, 346, 978–981. [Google Scholar] [CrossRef] [PubMed]
  43. Wang, Y.Z.; Zhang, H.P.; Zheng, D.W.; von Dassow, W.; Zhang, Z.Q.; Yu, J.X.; Pang, J.Z. How a stationary knickpoint is sustained: New insights into the formation of the deep Yarlung Tsangpo Gorge. Geomorphology 2017, 285, 28–43. [Google Scholar] [CrossRef]
  44. Webb, B.W.; Zhang, Y. Spatial and seasonal variability in the components of the river heat budget. Hydrol. Process. 1997, 11, 79–101. [Google Scholar] [CrossRef]
  45. Li, F.P.; Zhang, Y.Q.; Xu, Z.X.; Teng, J.; Liu, C.M.; Liu, W.F.; Mpelasoka, F. The impact of climate change on runoff in the southeastern Tibetan Plateau. J. Hydrol. 2013, 505, 188–201. [Google Scholar] [CrossRef]
  46. Zeng, C.; Zhang, F.; Lu, X.X.; Wang, G.X.; Gong, T.L. Improving sediment load estimations: The case of the Yarlung Zangbo River (the upper Brahmaputra, Tibet Plateau). Catena 2018, 160, 201–211. [Google Scholar] [CrossRef]
  47. Li, H.; Liu, L.; Shan, B.Y.; Xu, Z.C.; Niu, Q.K.; Cheng, L.; Liu, X.C.; Xu, Z.X. Spatiotemporal Variation of Drought and Associated Multi-Scale Response to Climate Change over the Yarlung Zangbo River Basin of Qinghai-Tibet Plateau, China. Remote Sens. 2019, 11, 1596. [Google Scholar] [CrossRef]
  48. Chen, C.; Zhang, L.M.; Xiao, T.; He, J. Barrier lake bursting and flood routing in the Yarlung Tsangpo Grand Canyon in October 2018. J. Hydrol. 2020, 583, 124603. [Google Scholar] [CrossRef]
  49. Dugdale, S.J.; Hannah, D.M.; Malcolm, I.A. River temperature modelling: A review of process-based approaches and future directions. Earth-Sci. Rev. 2017, 175, 97–113. [Google Scholar] [CrossRef]
  50. Garner, G.; Malcolm, I.A.; Sadler, J.P.; Hannah, D.M. What causes cooling water temperature gradients in a forested stream reach? Hydrol. Earth Syst. Sci. 2014, 18, 5361–5376. [Google Scholar] [CrossRef]
  51. Liu, C.Y.; Li, Y.G.; Ji, X.; Luo, X.; Zhu, M.T. Observed Changes in Temperature and Precipitation Extremes over the Yarlung Tsangpo River Basin during 1970–2017. Atmosphere 2019, 10, 815. [Google Scholar] [CrossRef]
  52. Wan, W.; Li, H.; Xie, H.; Hong, Y.; Long, D.; Zhao, L.; Han, Z.; Cui, Y.; Liu, B.; Wang, C.; et al. A comprehensive data set of lake surface water temperature over the Tibetan Plateau derived from MODIS LST products 2001–2015. Sci. Data 2017, 4, 170095. [Google Scholar] [CrossRef] [PubMed]
  53. Lieberherr, G.; Wunderle, S. Lake Surface Water Temperature Derived from 35 Years of AVHRR Sensor Data for European Lakes. Remote Sens. 2018, 10, 990. [Google Scholar] [CrossRef]
  54. Tavares, M.H.; Cunha, A.H.F.; Motta-Marques, D.; Ruhoff, A.L.; Cavalcanti, J.R.; Fragoso, C.R.; Bravo, J.M.; Munar, A.M.; Fan, F.M.; Rodrigues, L.H.R. Comparison of Methods to Estimate Lake-Surface-Water Temperature Using Landsat 7 ETM+ and MODIS Imagery: Case Study of a Large Shallow Subtropical Lake in Southern Brazil. Water 2019, 11, 168. [Google Scholar] [CrossRef]
  55. Shi, X.; Sun, J.; Shi, L. Derivation of river surface temperature from Landsat thermal infrared data. J. Hydroelectr Eng. 2021, 40, 121–130. (In Chinese) [Google Scholar] [CrossRef]
  56. USGS. Landsat 8-9 Collection 2 (C2) Level 2 Science Product (L2SP) Guide; United States Geological Survey: Asheville, NC, USA, 2022; pp. 1–42.
  57. Malakar, N.K.; Hulley, G.C.; Hook, S.J.; Laraby, K.; Cook, M.; Schott, J.R. An Operational Land Surface Temperature Product for Landsat Thermal Data: Methodology and Validation. IEEE Trans. Geosci. Remote Sens. 2018, 56, 5717–5735. [Google Scholar] [CrossRef]
  58. Schaeffer, B.A.; Iiames, J.; Dwyer, J.; Urquhart, E.; Salls, W.; Rover, J.; Seegers, B. An initial validation of Landsat 5 and 7 derived surface water temperature for US lakes, reservoirs, and estuaries. Int. J. Remote Sens. 2018, 39, 7789–7805. [Google Scholar] [CrossRef]
  59. Laraby, K.G.; Schott, J.R. Uncertainty estimation method and Landsat 7 global validation for the Landsat surface temperature product. Remote Sens. Environ. 2018, 216, 472–481. [Google Scholar] [CrossRef]
  60. Duan, S.B.; Li, Z.L.; Zhao, W.; Wu, P.H.; Huang, C.; Han, X.J.; Gao, M.F.; Leng, P.; Shang, G.F. Validation of Landsat land surface temperature product in the conterminous United States using in situ measurements from SURFRAD, ARM, and NDBC sites. Int. J. Digit. Earth 2021, 14, 640–660. [Google Scholar] [CrossRef]
  61. McFeeters, S.K. The use of the normalized difference water index (NDWI) in the delineation of open water features. Int. J. Remote Sens. 1996, 17, 1425–1432. [Google Scholar] [CrossRef]
  62. Zhang, G.Q.; Li, J.L.; Zheng, G.X. Lake-area mapping in the Tibetan Plateau: An evaluation of data and methods. Int. J. Remote Sens. 2017, 38, 742–772. [Google Scholar] [CrossRef]
  63. Li, W.B.; Du, Z.Q.; Ling, F.; Zhou, D.B.; Wang, H.L.; Gui, Y.M.; Sun, B.Y.; Zhang, X.M. A Comparison of Land Surface Water Mapping Using the Normalized Difference Water Index from TM, ETM plus and ALI. Remote Sens. 2013, 5, 5530–5549. [Google Scholar] [CrossRef]
  64. Lamaro, A.A.; Mariñelarena, A.; Torrusio, S.E.; Sala, S.E. Water surface temperature estimation from Landsat 7 ETM+ thermal infrared data using the generalized single-channel method: Case study of Embalse del Rio Tercero (Cordoba, Argentina). Adv. Space Res. 2013, 51, 492–500. [Google Scholar] [CrossRef]
  65. Shi, X.; Xia, J.; Sun, J. Comparison of methods to derive river water temperature using thermal infrared imagery: A case study of the upper Yangtze River catchment. J. Lake Sci. 2022, 34, 307–319. (In Chinese) [Google Scholar]
  66. Barsi, J.A.; Barker, J.L.; Schott, J.R. An Atmospheric Correction Parameter Calculator for a single thermal band earth-sensing instrument. In Proceedings of the IGARSS 2003. 2003 IEEE International Geoscience and Remote Sensing Symposium. Proceedings (IEEE Cat. No.03CH37477), Toulouse, France, 21–25 July 2003; Volume 3015, pp. 3014–3016. [Google Scholar]
  67. Simon, R.N.; Tormos, T.; Danis, P.A. Retrieving water surface temperature from archive LANDSAT thermal infrared data: Application of the mono-channel atmospheric correction algorithm over two freshwater reservoirs. Int. J. Appl. Earth Obs. Geoinf. 2014, 30, 247–250. [Google Scholar] [CrossRef]
  68. Chen, Z.; Wang, W.; Zhang, Z.; Wang, Y. Comparison of algorithms to retrieve water surface temperature using Landsat 8 image with in-situ observations in Lake Taihu. Sci. Technol. Eng. 2020, 20, 13317–13326. (In Chinese) [Google Scholar] [CrossRef]
  69. Pivato, M.; Carniello, L.; Viero, D.P.; Soranzo, C.; Defina, A.; Silvestri, S. Remote Sensing for Optimal Estimation of Water Temperature Dynamics in Shallow Tidal Environments. Remote Sens. 2020, 12, 51. [Google Scholar] [CrossRef]
  70. Cherkauer, K.A.; Burges, S.J.; Handcock, R.N.; Kay, J.E.; Kampf, S.K.; Gillespie, A.R. Assessing satellite-based and aircraft-based thermal infrared remote sensing for monitoring pacific northwest river temperature. JAWRA J. Am. Water Resour. Assoc. 2005, 41, 1149–1159. [Google Scholar] [CrossRef]
  71. Zhong, J.; Tuo, Y.; Deng, Y.; Zhang, J.; Cheng, H. Study on influence of friction internal energy on water temperature of mountainous rivers of high gradient ratio. Yangze River 2021, 52, 95–99. (In Chinese) [Google Scholar] [CrossRef]
  72. Al-Murib, M.D.; Wells, S.A.; Talke, S.A. Integrating Landsat TM/ETM plus and Numerical Modeling to Estimate Water Temperature in the Tigris River under Future Climate and Management Scenarios. Water 2019, 11, 892. [Google Scholar] [CrossRef]
  73. Philippus, D.; Sytsma, A.; Rust, A.; Hogue, T.S. A machine learning model for estimating the temperature of small rivers using satellite-based spatial data. Remote Sens. Environ. 2024, 311, 114271. [Google Scholar] [CrossRef]
  74. Vatland, S.J.; Gresswell, R.E.; Poole, G.C. Quantifying stream thermal regimes at multiple scales: Combining thermal infrared imagery and stationary stream temperature data in a novel modeling framework. Water Resour. Res. 2015, 51, 31–46. [Google Scholar] [CrossRef]
Figure 1. Geographic location of the study area and longitudinal riverbed slope variation.
Remotesensing 17 01141 g001
Figure 2. Spatial variations in the annual mean temperature and annual precipitation of the study area ((a): annual mean temperature; (b): annual precipitation).
Remotesensing 17 01141 g002
Figure 3. Research workflow.
Remotesensing 17 01141 g003
Figure 4. Comparison of linear regression of retrieved water temperature before and after correction under different conditions (the solid line in the figure represents the 1:1 line, the dashed line represents the trendline of the original surface water temperature, and the equation is the linear regression correction equation used).
Remotesensing 17 01141 g004
Figure 5. Boxplot and violin plot of errors in water temperature retrieval using the RTM and the LST.
Remotesensing 17 01141 g005
Figure 6. Comparison of the temperature change rates of the RTM, LST, and measured water temperature, and the difference between retrieved and measured temperature change rates ((a): from Milin to Nuxia; (b): from Nuxia to Motuo; the line graph represents the temperature change rates, and the bar chart shows the difference between retrieved and measured temperature change rates).
Remotesensing 17 01141 g006
Figure 7. Schematic diagram of the effects of topography, tributary inflows, and riverbanks on water temperature.
Remotesensing 17 01141 g007
Figure 8. Temperature differences between the left and right banks and the centerline water temperature. ((a). Nuxia water temperature distribution; (b). variation in water temperature along the cross-section; (c). difference between the left bank and centerline water temperatures; (d). difference between the right bank and centerline water temperatures).
Remotesensing 17 01141 g008
Figure 9. Correlation coefficients between water temperature, climate factors, and flow. WT represents the inferred water temperature, AT represents the air temperature, RH represents the relative humidity, and Q represents the flow.
Remotesensing 17 01141 g009
Figure 10. Monthly variation comparison of the retrieved water temperature and air temperature at each site (the boxplot represents the retrieved surface water temperature, with white dots indicating the mean and black dots indicating outliers; the line graph with triangles represents the monthly average air temperature).
Remotesensing 17 01141 g010
Figure 11. Variation of typical monthly water temperature from Milin to Pasighat.
Remotesensing 17 01141 g011
Figure 12. Correlation analysis between Nyang River flow and the rate of water temperature change from Milin to Nuxia (** denotes p < 0.01, The red line represents the log-fit line).
Remotesensing 17 01141 g012
Figure 13. Spatial distribution of water temperature in the Great Gorge section across different seasons.
Remotesensing 17 01141 g013
Table 1. Temporal distribution of the image data.
TimeJanuaryFebruaryMarchAprilMayJuneJulyAugustSeptemberOctoberNovemberDecemberTotal
Amount271917141098117194029210
Table 2. The validation conditions for the retrieved temperature.
Study AreaLandsat 7Landsat 8
RTMLSTRTMLST
Milin
Nuxia
Motuo
Table 3. Radiometric calibration and Planck equation constants for the Landsat thermal infrared band.
SensorGB K 1 /(sr·m2·nm) K 2 /K
Landsat 70.0373.16666.091282.71
Landsat 80.000330.10774.891321.08
Landsat 7—LST0.0034149
Landsat 8—LST0.0034149
Table 4. Errors in water temperature retrieval using the RTM and the LST.
ConditionsMethodStudy AreaSensorRMSE (°C)MAE (°C)Bias (°C)SD (°C)R
1RTMMilinLandsat 71.230.980.585.22 0.98
2Landsat 81.200.820.654.46 0.97
3NuxiaLandsat 72.161.640.703.39 0.88
4MotuoLandsat 71.841.38−0.333.64 0.88
5Landsat 81.881.440.073.34 0.87
6LSTMilinLandsat 71.501.141.015.40 0.99
7Landsat 82.201.921.874.92 0.98
8NuxiaLandsat 72.231.680.873.97 0.88
9MotuoLandsat 71.621.21−0.333.72 0.91
10Landsat 82.492.071.393.68 0.84
Table 5. Comparison of errors between initial water temperature and corrected water temperature.
ConditionsMethodStudy AreaSensorOriginal RWTLinear RegressionPolynomial Regression
RMSE/°CRMSE/°CReduction/%RMSE/°CReduction/%
1RTMMilinLandsat 71.23 1.01 17.9 0.99 19.5
2Landsat 81.20 1.00 16.7 0.99 17.5
3NuxiaLandsat 72.16 1.68 22.2 1.57 27.3
4MotuoLandsat 71.84 1.77 3.8 1.88 −2.2
5Landsat 81.88 1.85 1.6 1.90 −1.1
6LSTMilinLandsat 71.51 0.92 39.1 0.89 41.1
7Landsat 82.20 0.77 65.0 0.76 65.5
8NuxiaLandsat 72.23 1.67 25.1 2.07 7.2
9MotuoLandsat 71.62 1.55 4.3 1.74 −7.4
10Landsat 82.49 1.84 26.1 1.83 26.5
Table 6. Parameters of the multiple linear regression equation.
SiteFactorMultiple Linear Regression EquationRR2Fp
MilinATWT = 0.947 × AT + 0.203 × RH − 0.0970.9550.912237.36 **0 **
RH0.011 *
NuxiaATWT = 0.829 × AT + 0.099 × RH − 0.161 × Q + 0.0640.9140.933268.99 **0 **
RH0.018 *
Q0.001 **
MotuoATWT = 0.786 × AT + 0.135 × RH + 0.217 × Q0.9840.969174.48 **0 **
RH0.015 *
Q0.012 *
Statistical significance: * denotes p < 0.05, ** denotes p < 0.01.
Table 7. Segmental temperature change rates for different seasons.
ReachSpringSummerAutumnWinterAverage
Broad Alluvial Plain−0.4 −0.5 −0.4 0.0 −0.3
Great Gorge2.3 1.5 2.1 3.0 2.2
Gorge Downstream0.6 0.5 1.1 1.2 0.8
Disclaimer/Publisher’s Note: The statements, opinions and data contained in all publications are solely those of the individual author(s) and contributor(s) and not of MDPI and/or the editor(s). MDPI and/or the editor(s) disclaim responsibility for any injury to people or property resulting from any ideas, methods, instructions or products referred to in the content.

