
The Distribution Characteristics of Large Landslides Along the Daduhe River in the Eastern Tibetan Plateau and Their Effects on Landscape Evolution

Abstract

1. Introduction
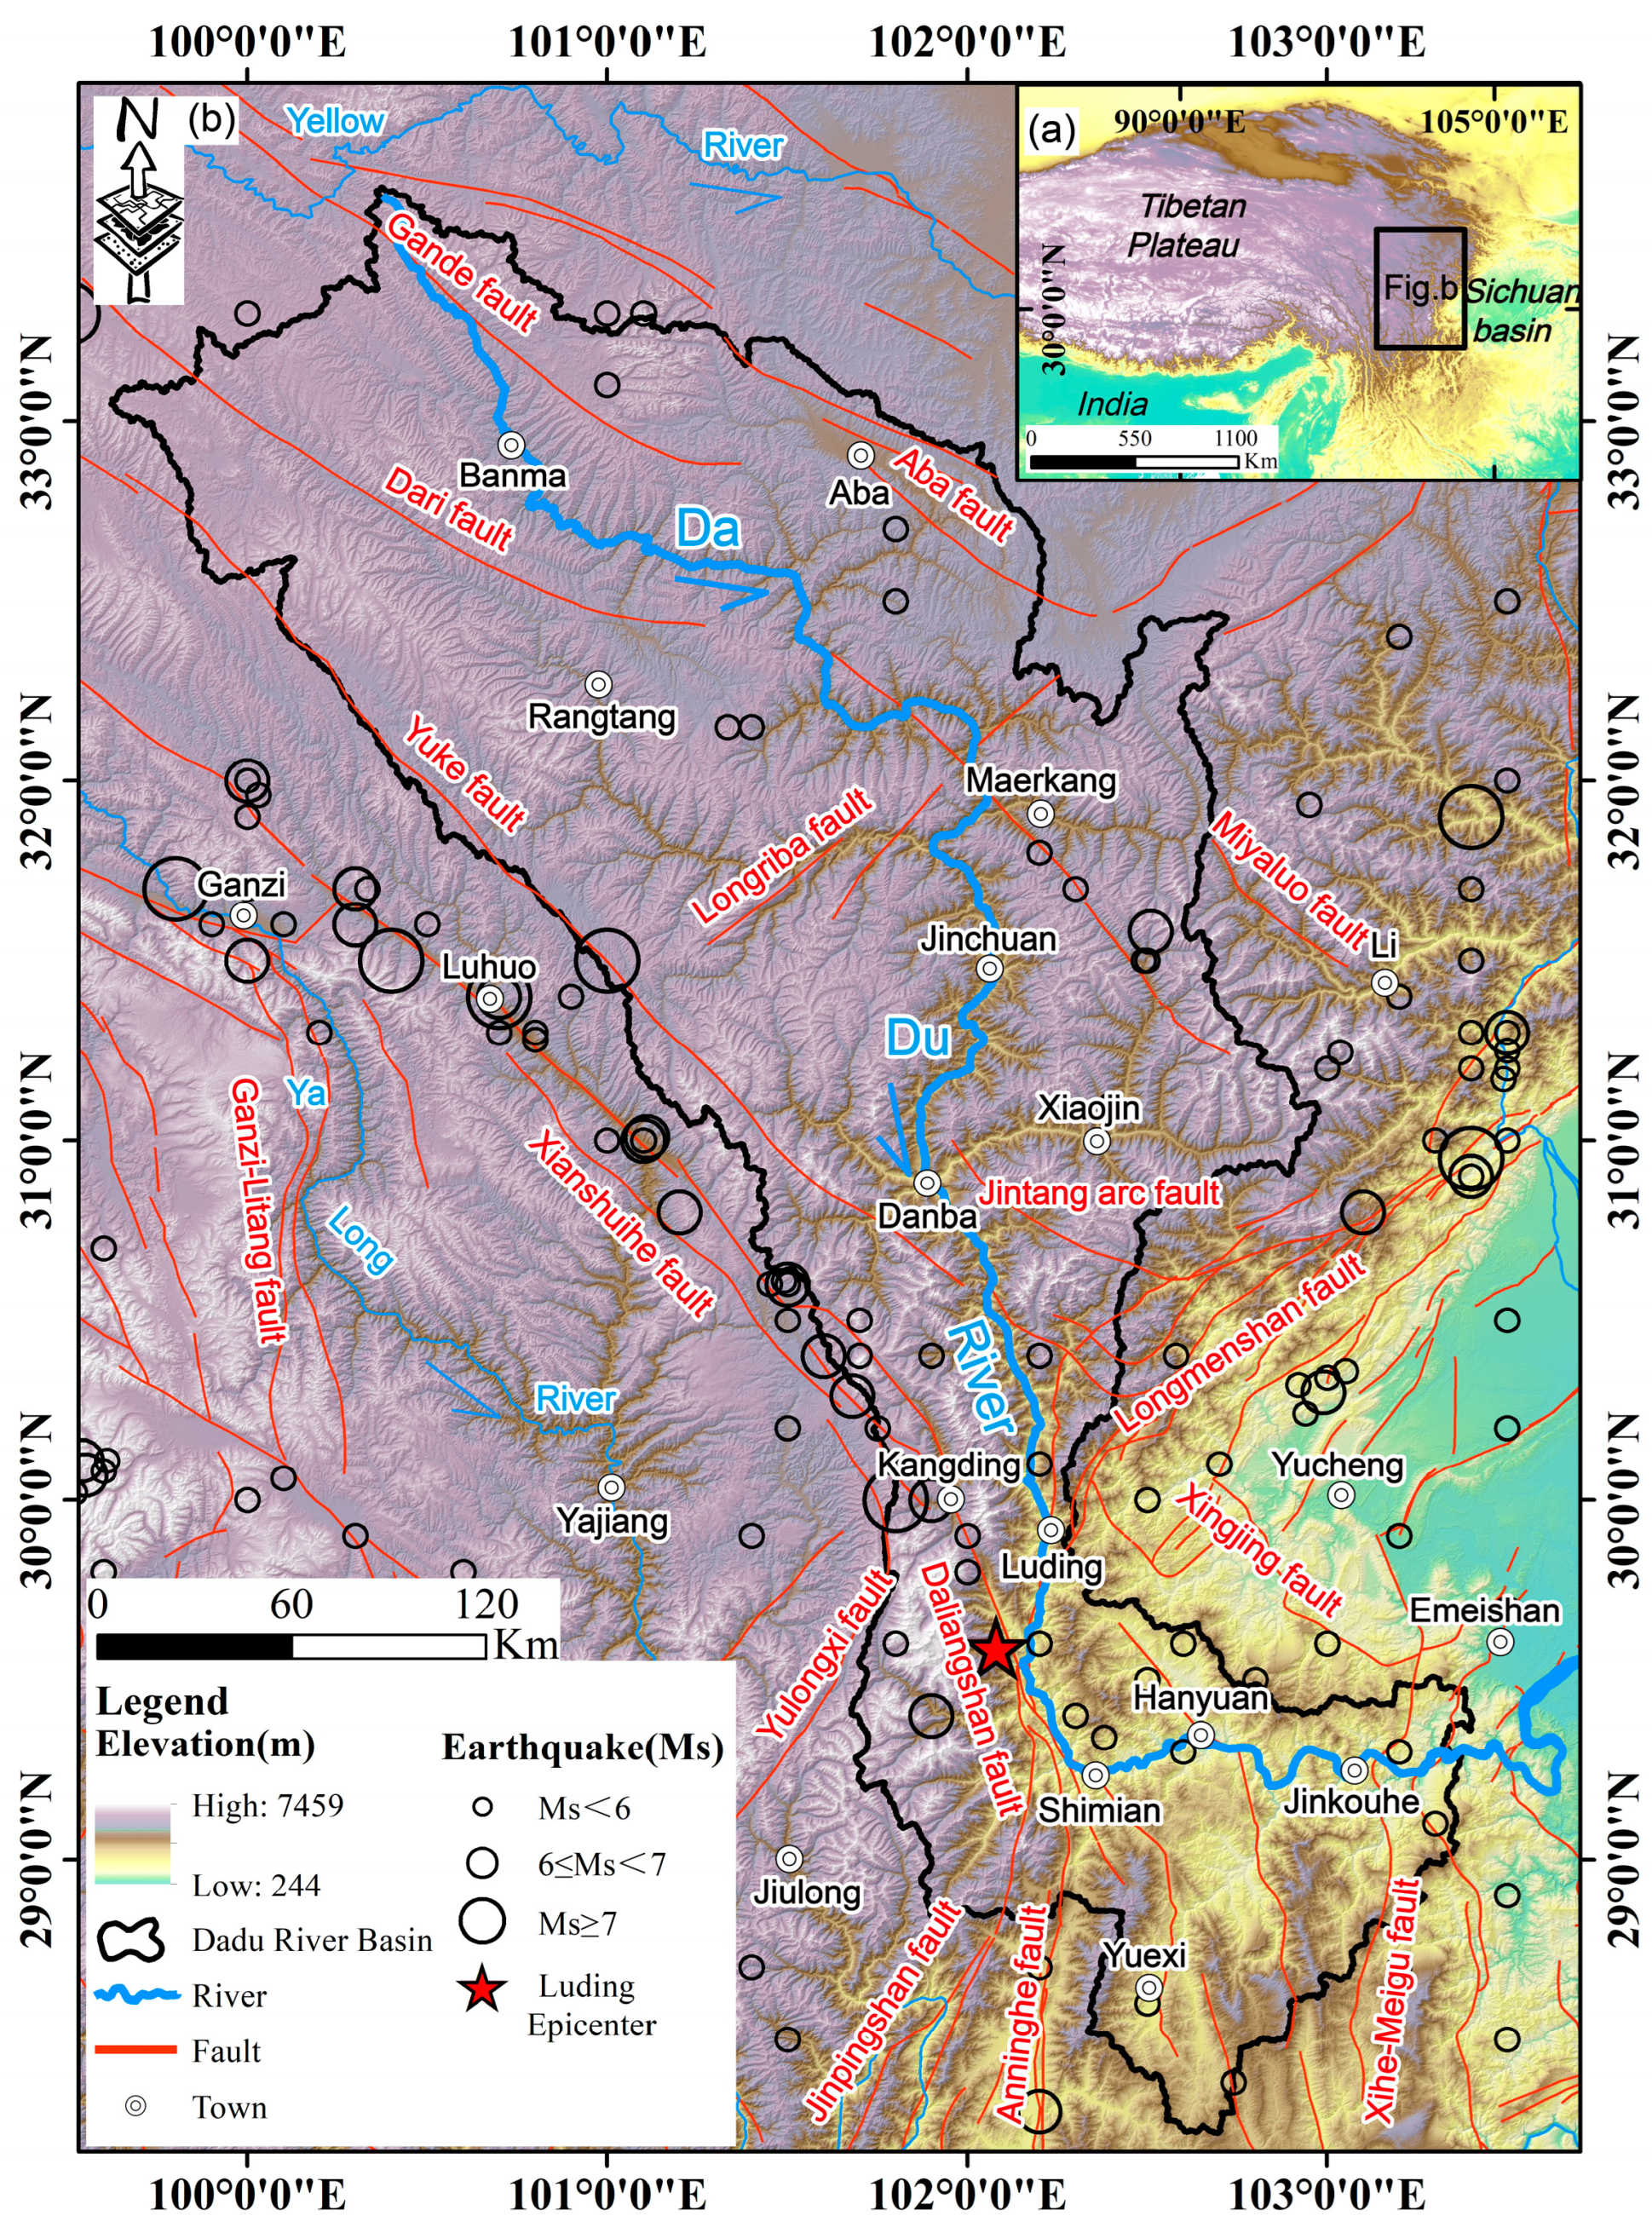
2. Study Area
3. Data and Method
3.1. DEM and Remote Sensing Image Data
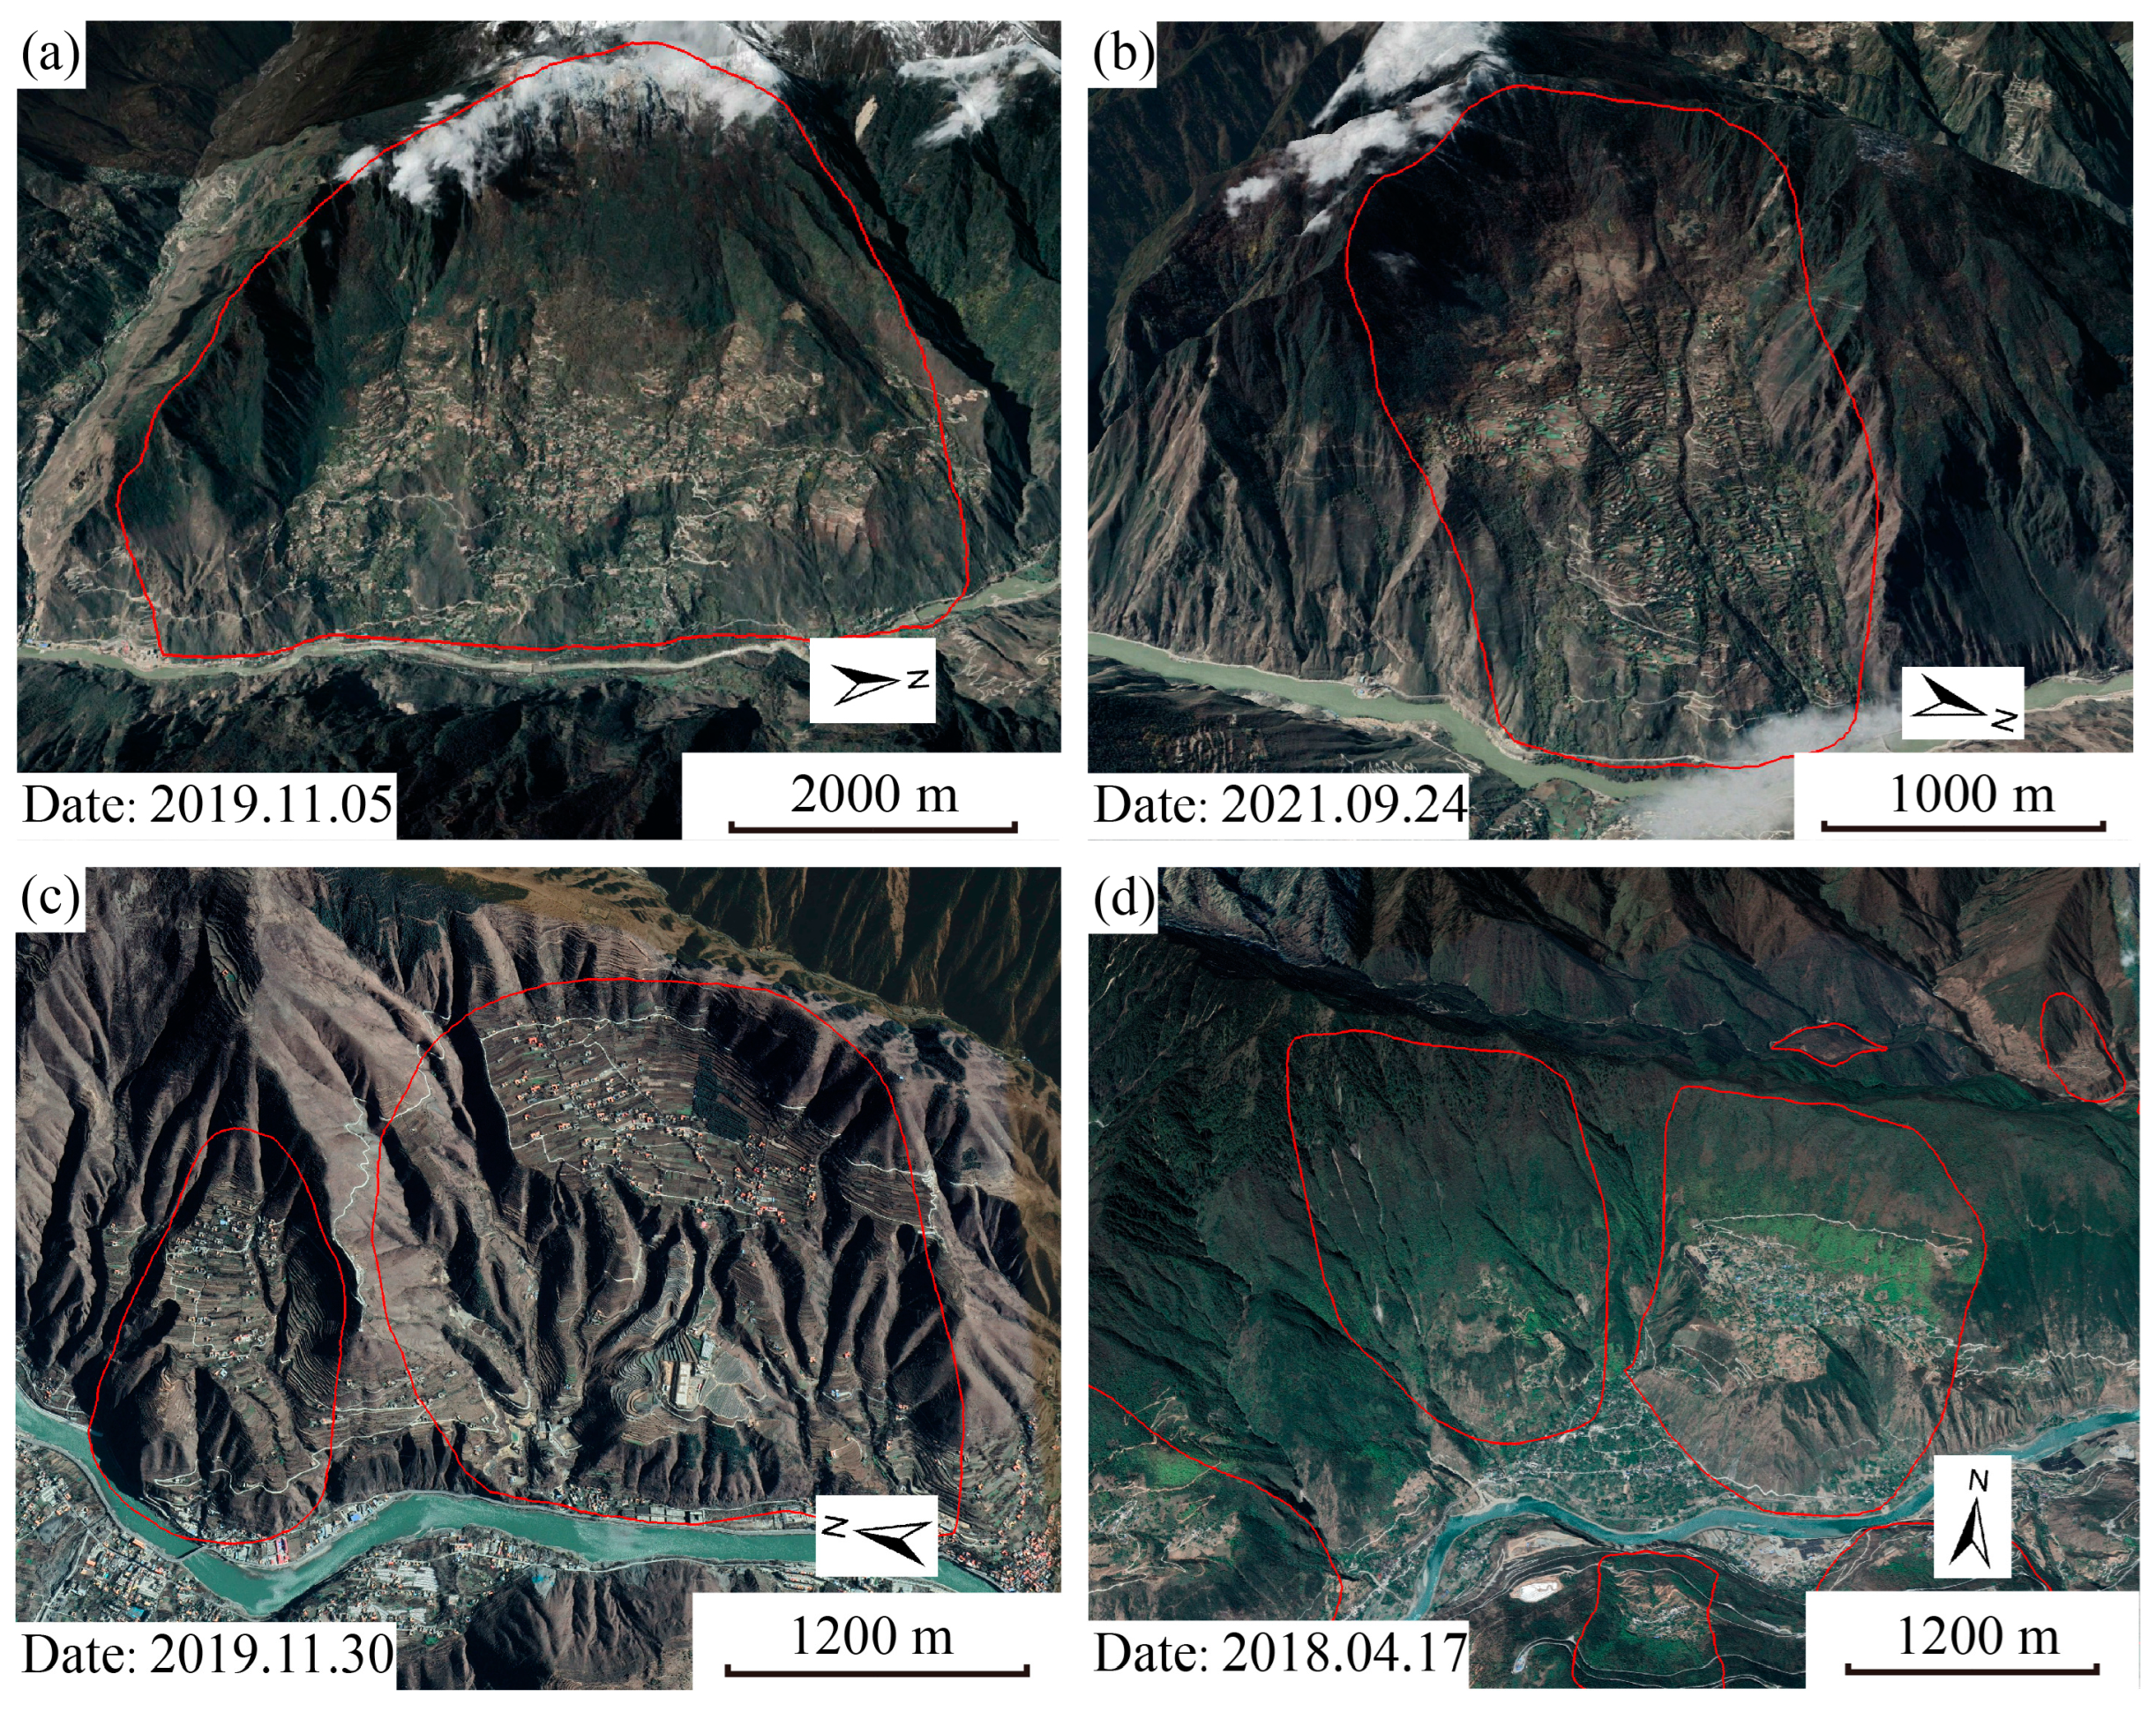
3.2. Visual Interpretation Signs and Identification Methods of Large Ancient Landslides
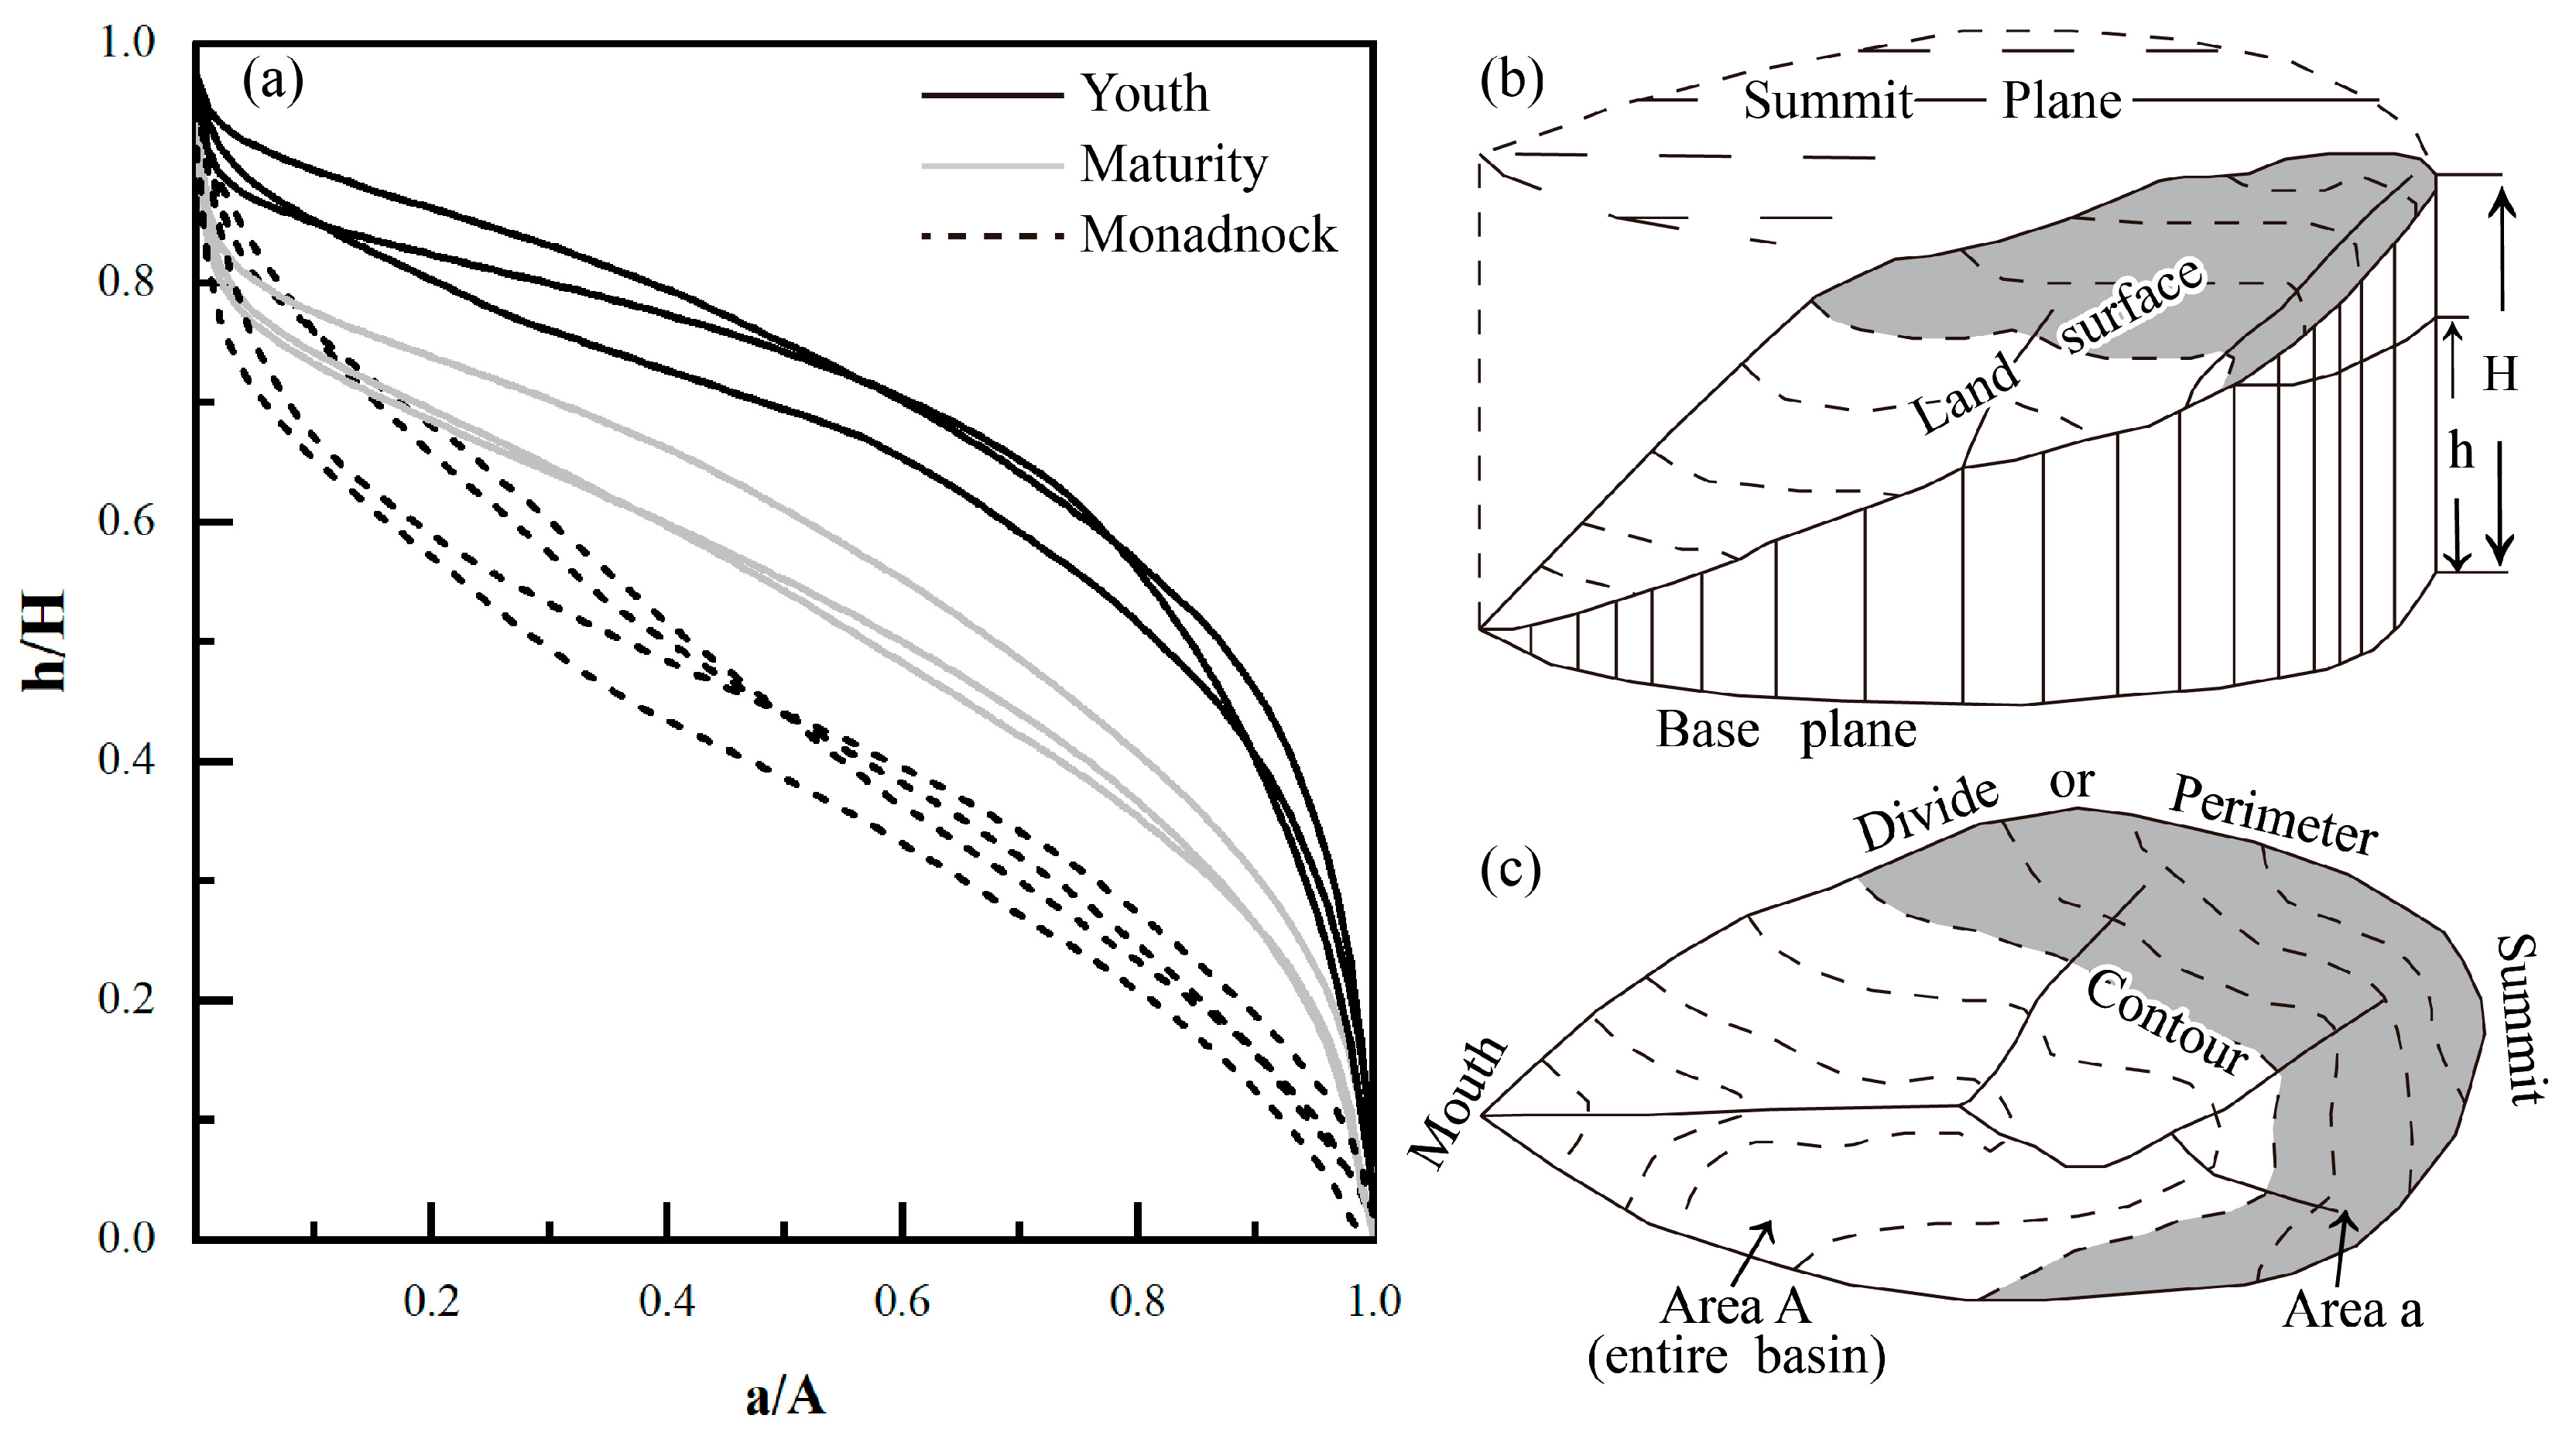
3.3. Hypsometric Integral
4. Results
4.1. Distribution of HI Values in Catchments of Daduhe River’s Mainstem
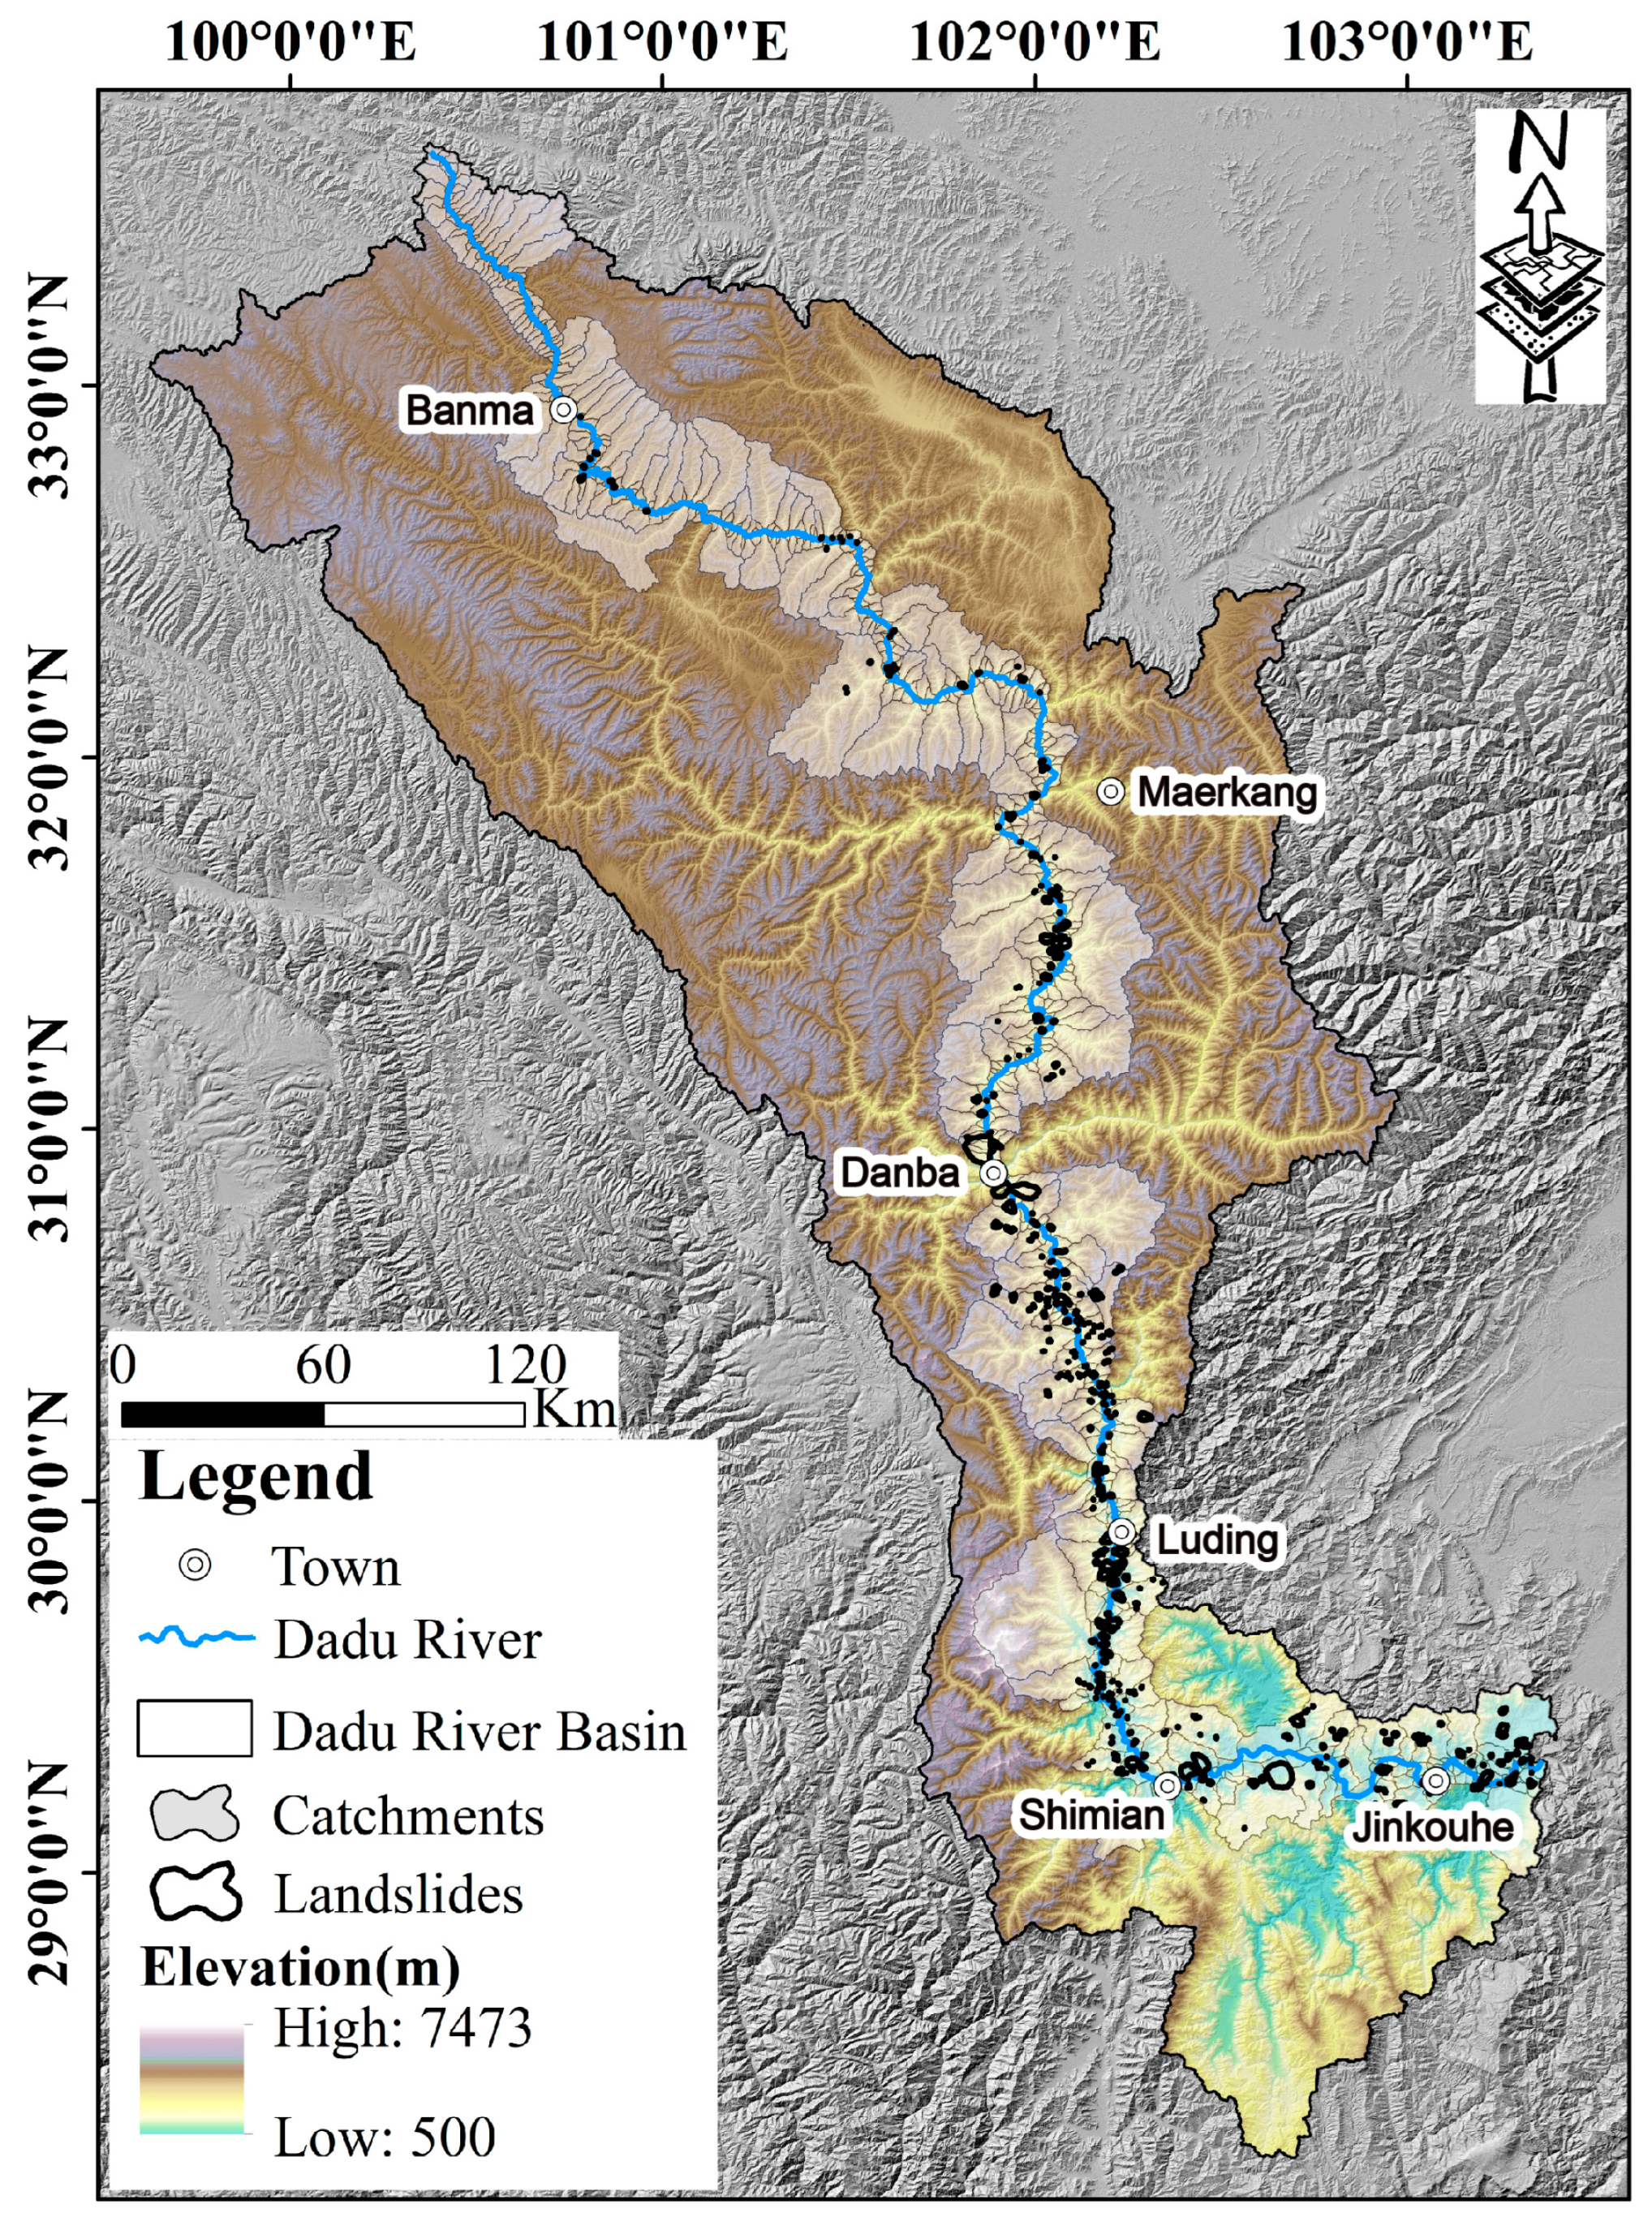
4.2. Distribution of Large Landslides in the Catchments of Daduhe River’s Mainstem
4.3. Relationship Between Catchment Type, HI Values, and Large Landslide Distribution
5. Discussion
5.1. Intrinsic Link Between River Longitudinal Profile Morphology and Landslide Distribution
5.2. The Relationship Between Uneven Distribution of Large Landslides and Landscape Evolution
6. Conclusions
- (1)
- The HI values within the catchments of the Daduhe river’s mainstem ranged from 0.35 to 0.71, showing a phased progression from youth to maturity and monadnock stages from upstream to downstream. The Banma–Danba section corresponds to the youth stage, the Danba–Shimian section corresponds to the maturity stage, and the regions between Shimian and Jinkouhe are characteristic of the monadnock stage of fluvial landscape evolution. This progression suggests an overall transition from an active incision in the upper reaches to a more stabilized landscape in the lower reaches;
- (2)
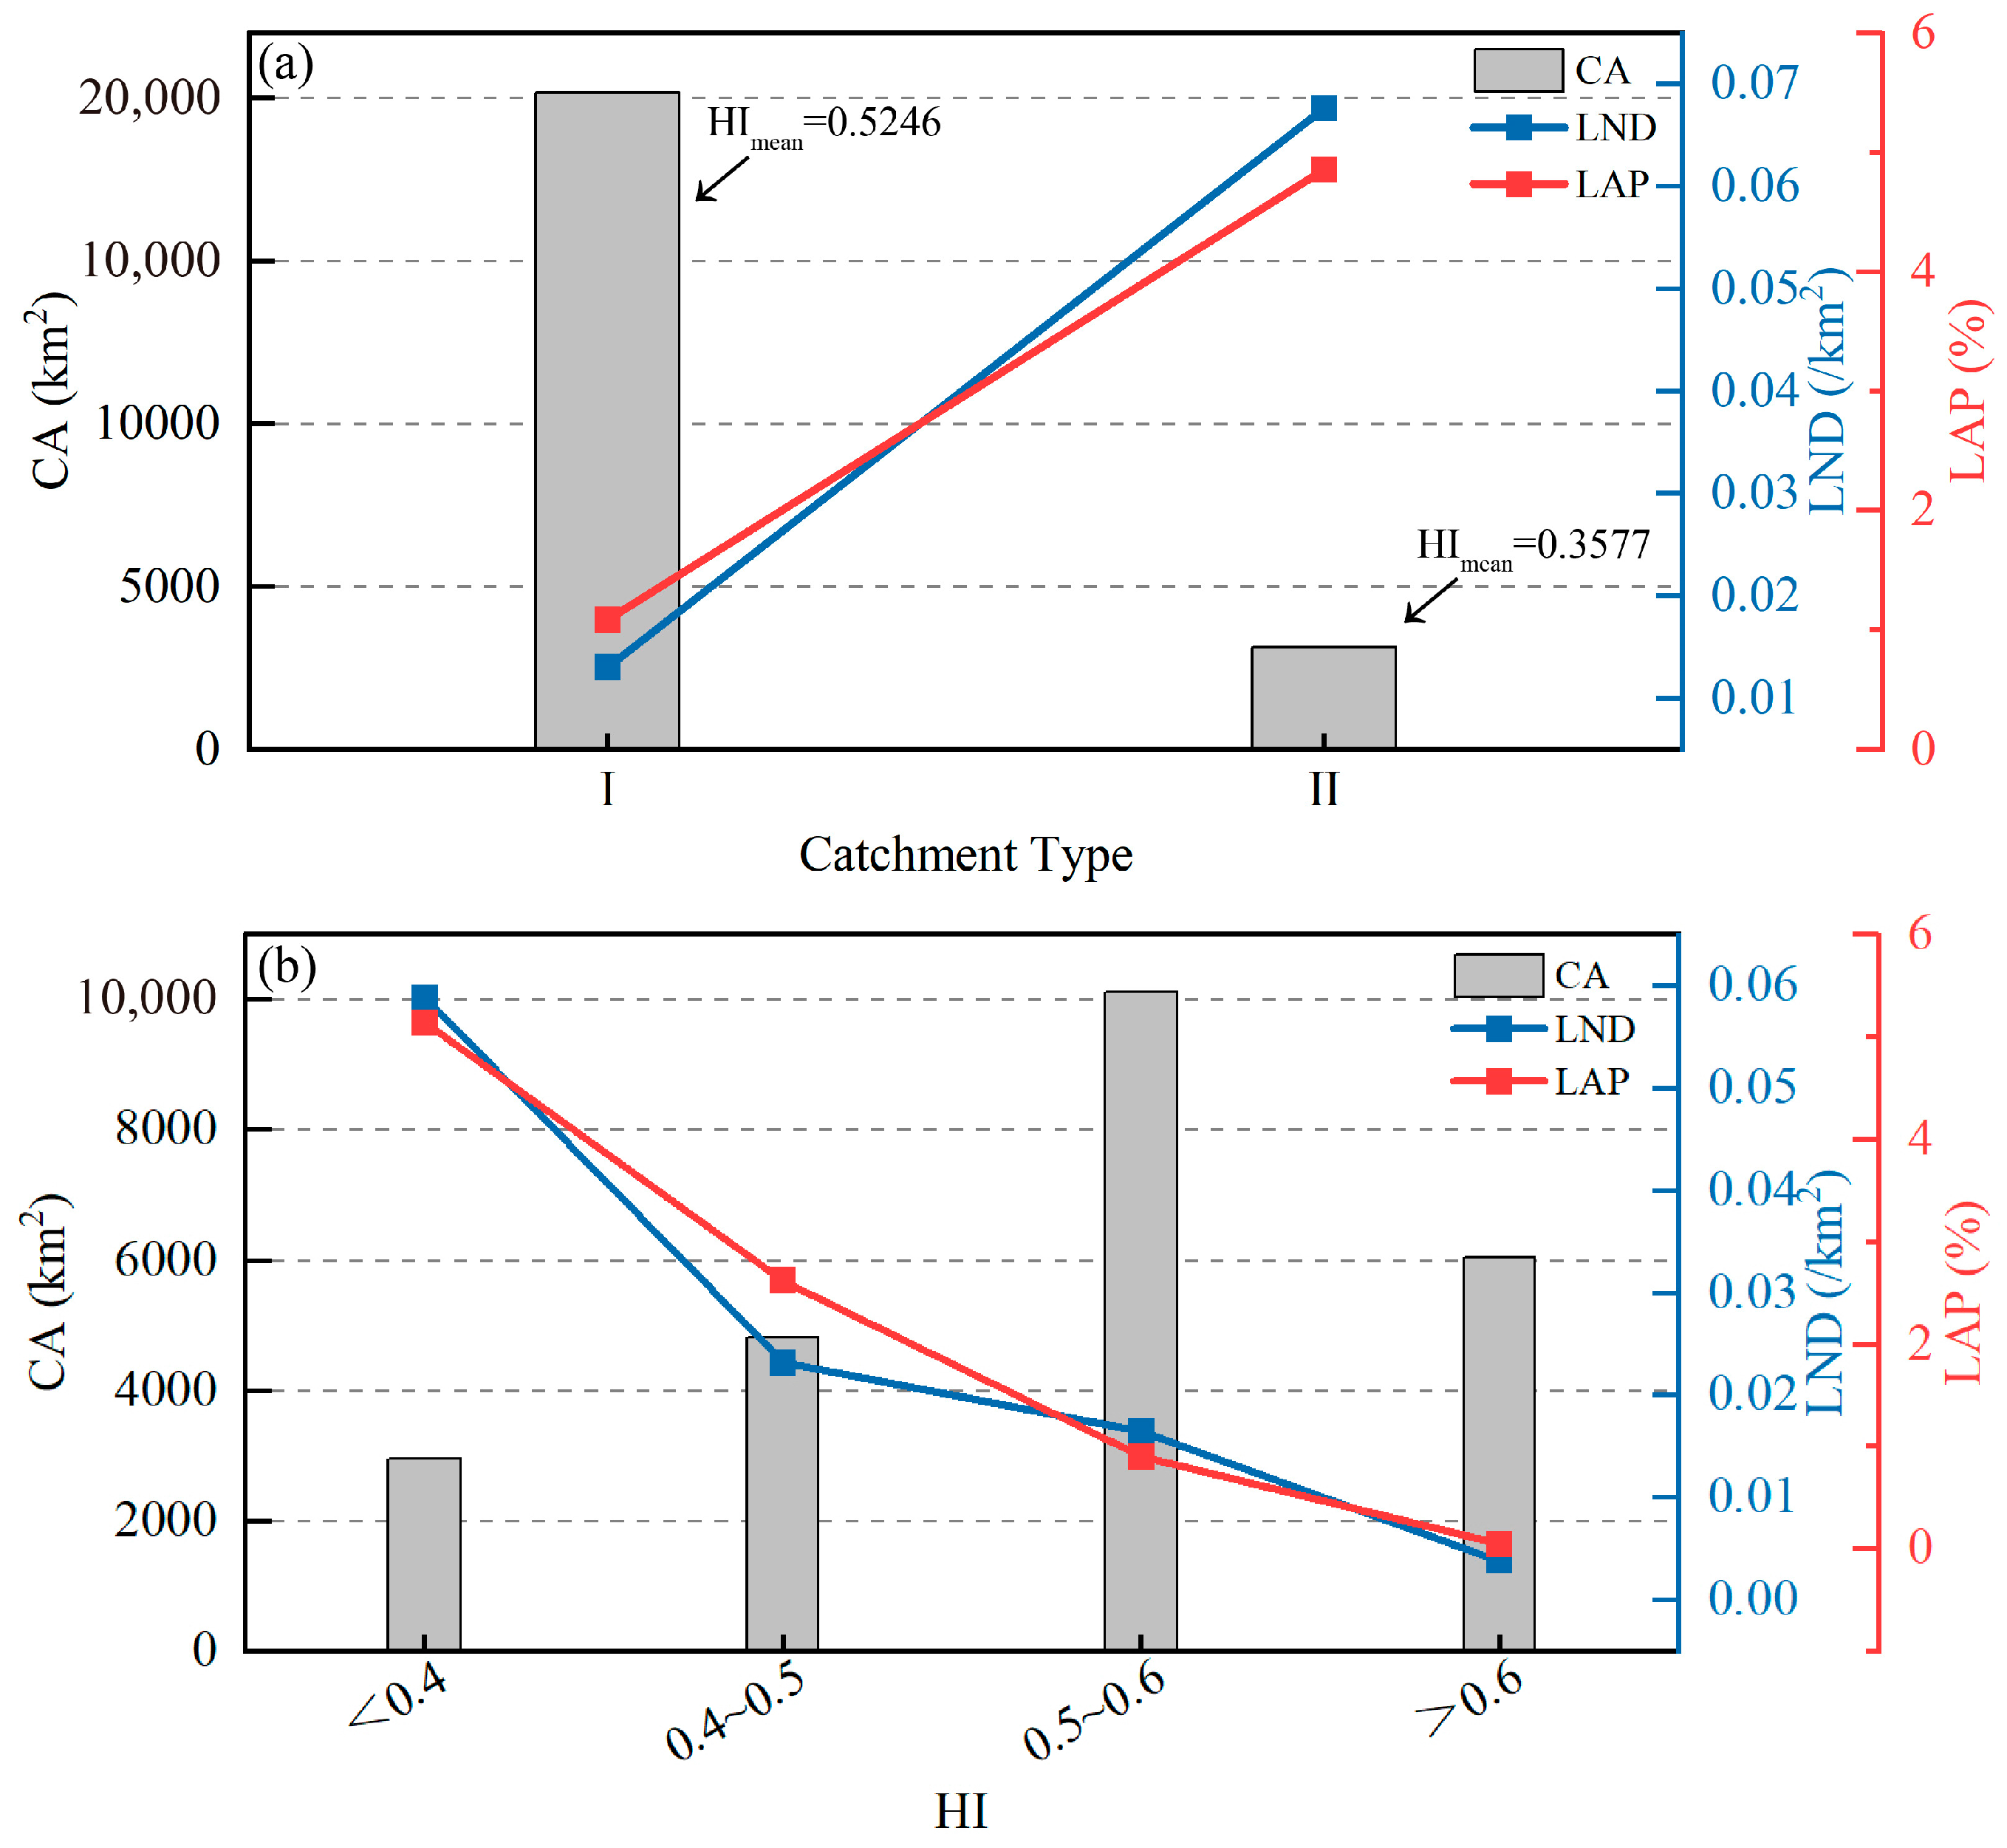
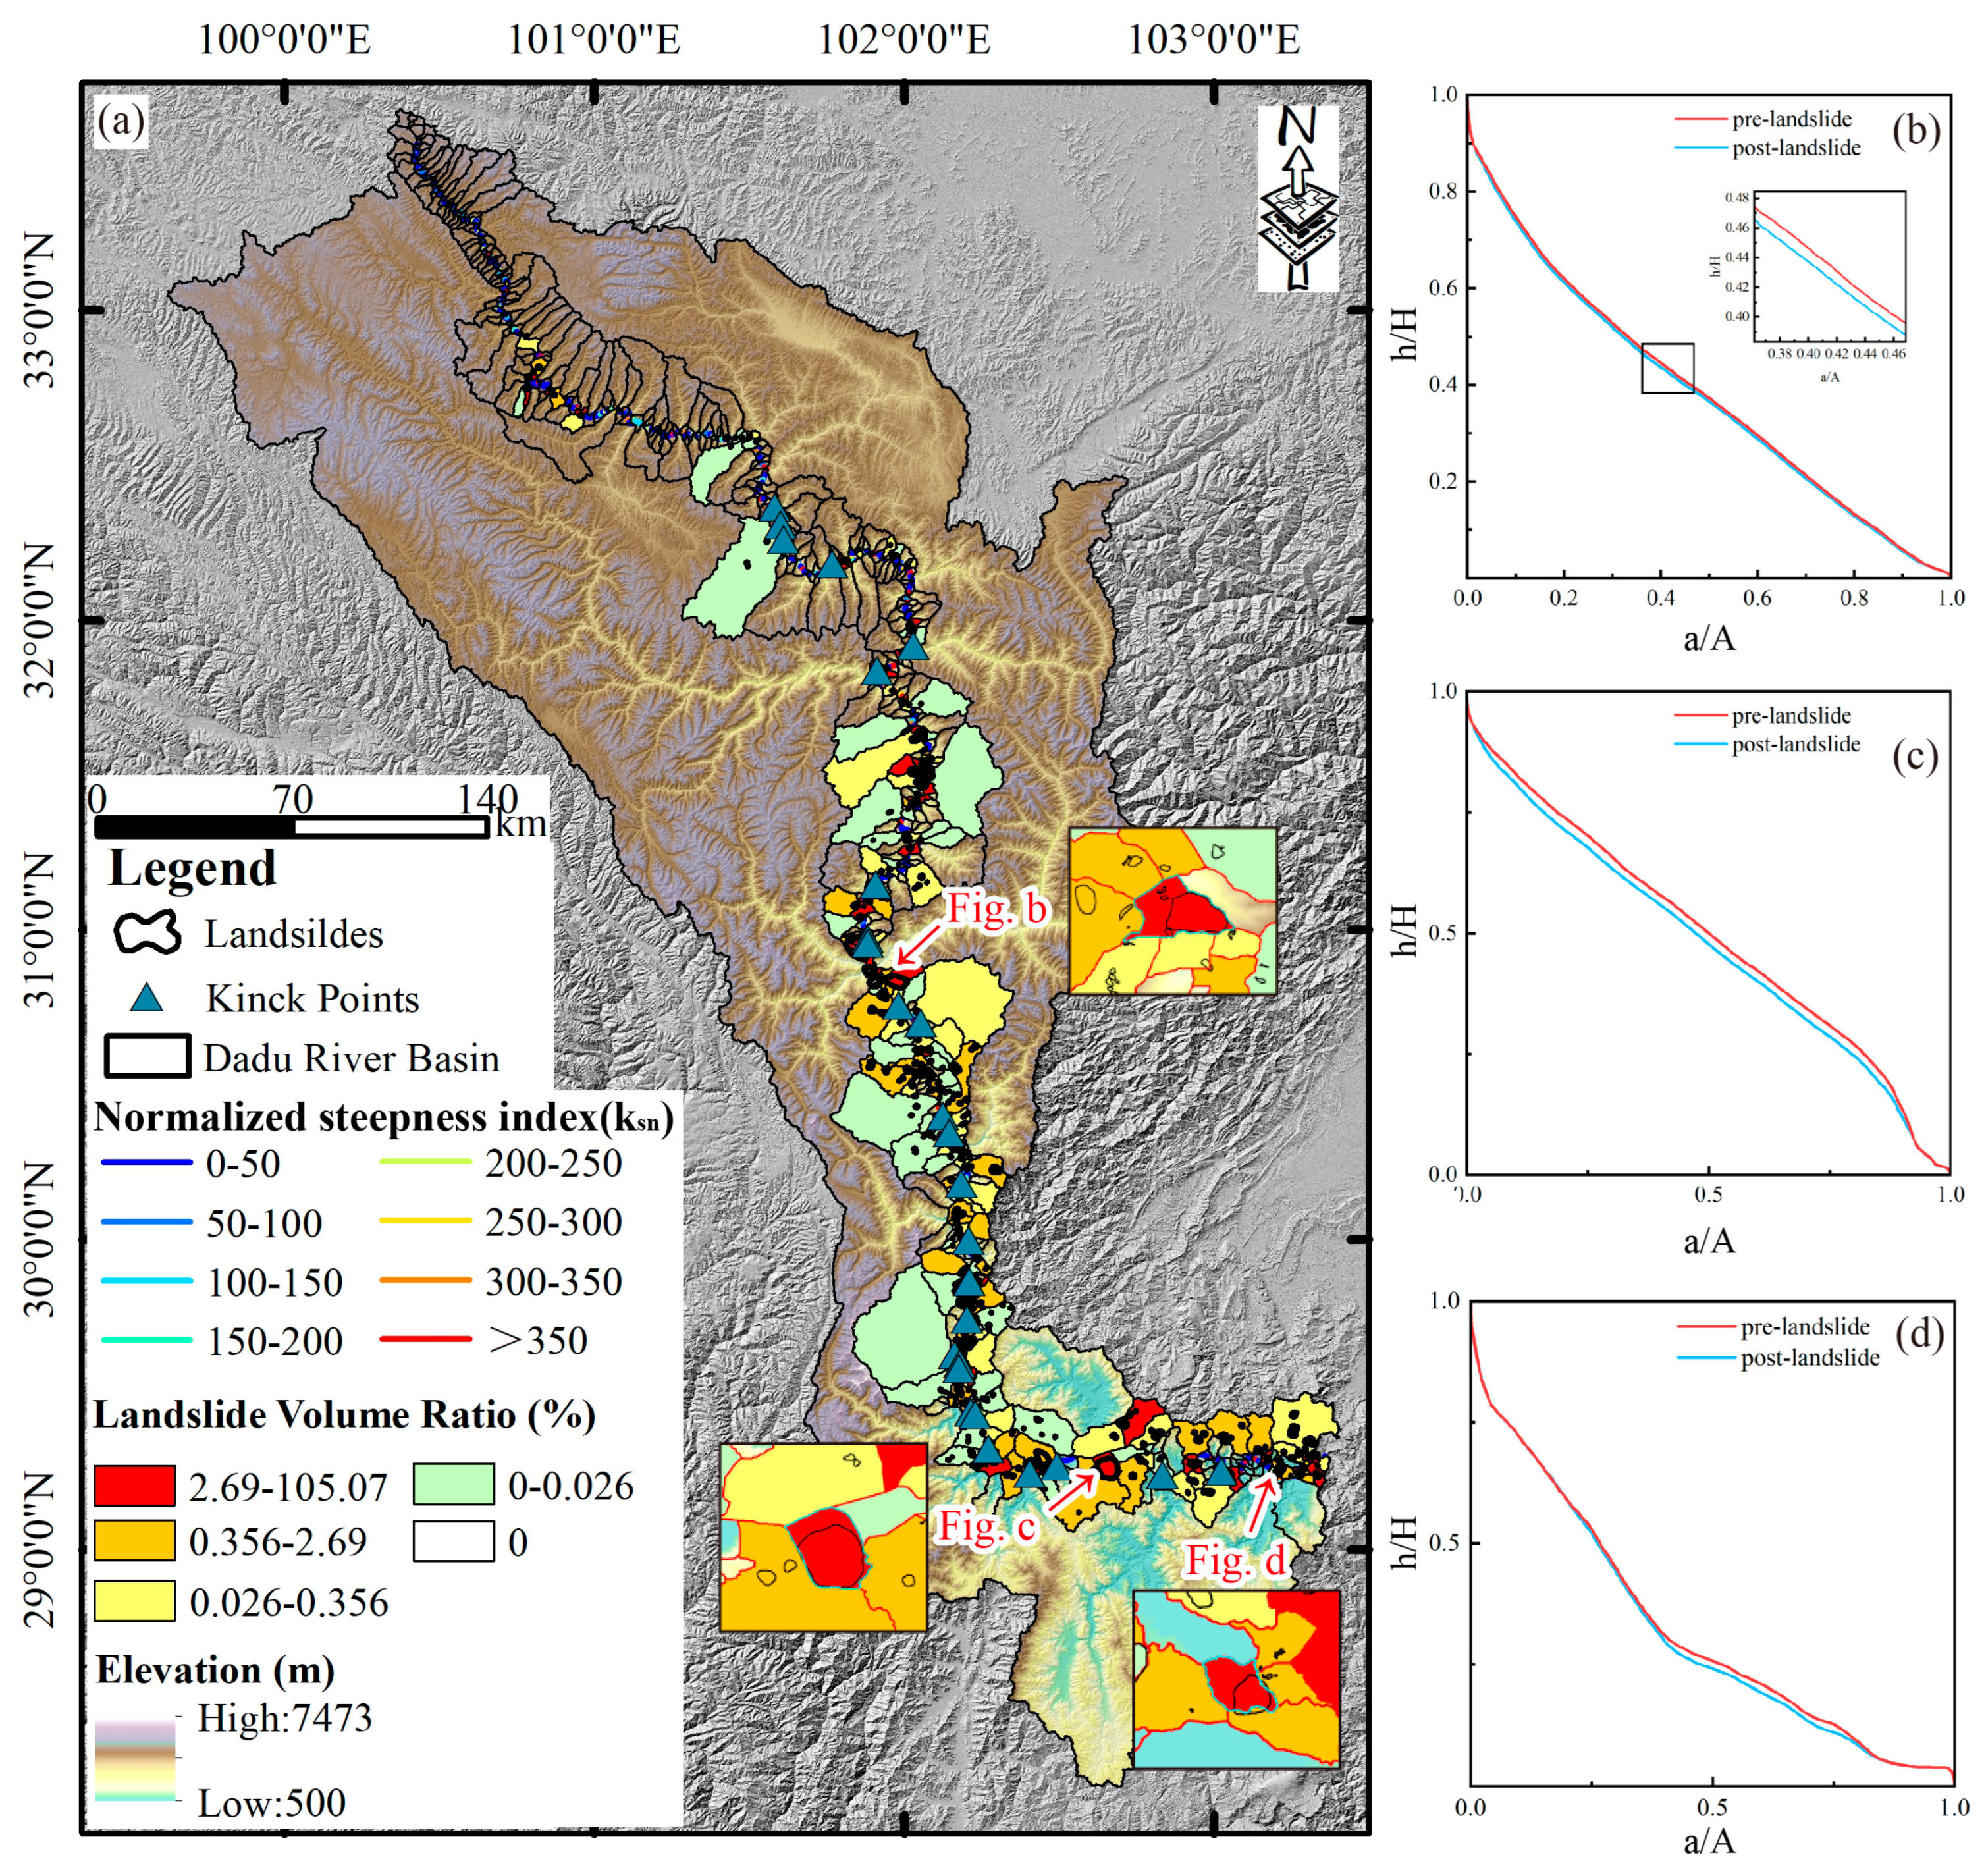
- In catchments along the Daduhe river’s mainstem, 477 large landslides were identified, which exhibit a clear spatial correlation with the HI values. Landslides were less frequent in the Banma county–Danba county area (HI > 0.5), while a higher density was observed in the section from Danba county to the river outlet (HI < 0.5). Most large landslides occurred in areas with elevations between 1000 and 2000 m, slopes < 40°, HI values < 0.4, higher ksn values, and a dense distribution of knickpoints. These findings indicate that catchments in the maturity to monadnock stages are more susceptible to large landslides, likely due to the combined effects of river incisions and structural weakening;
- (3)
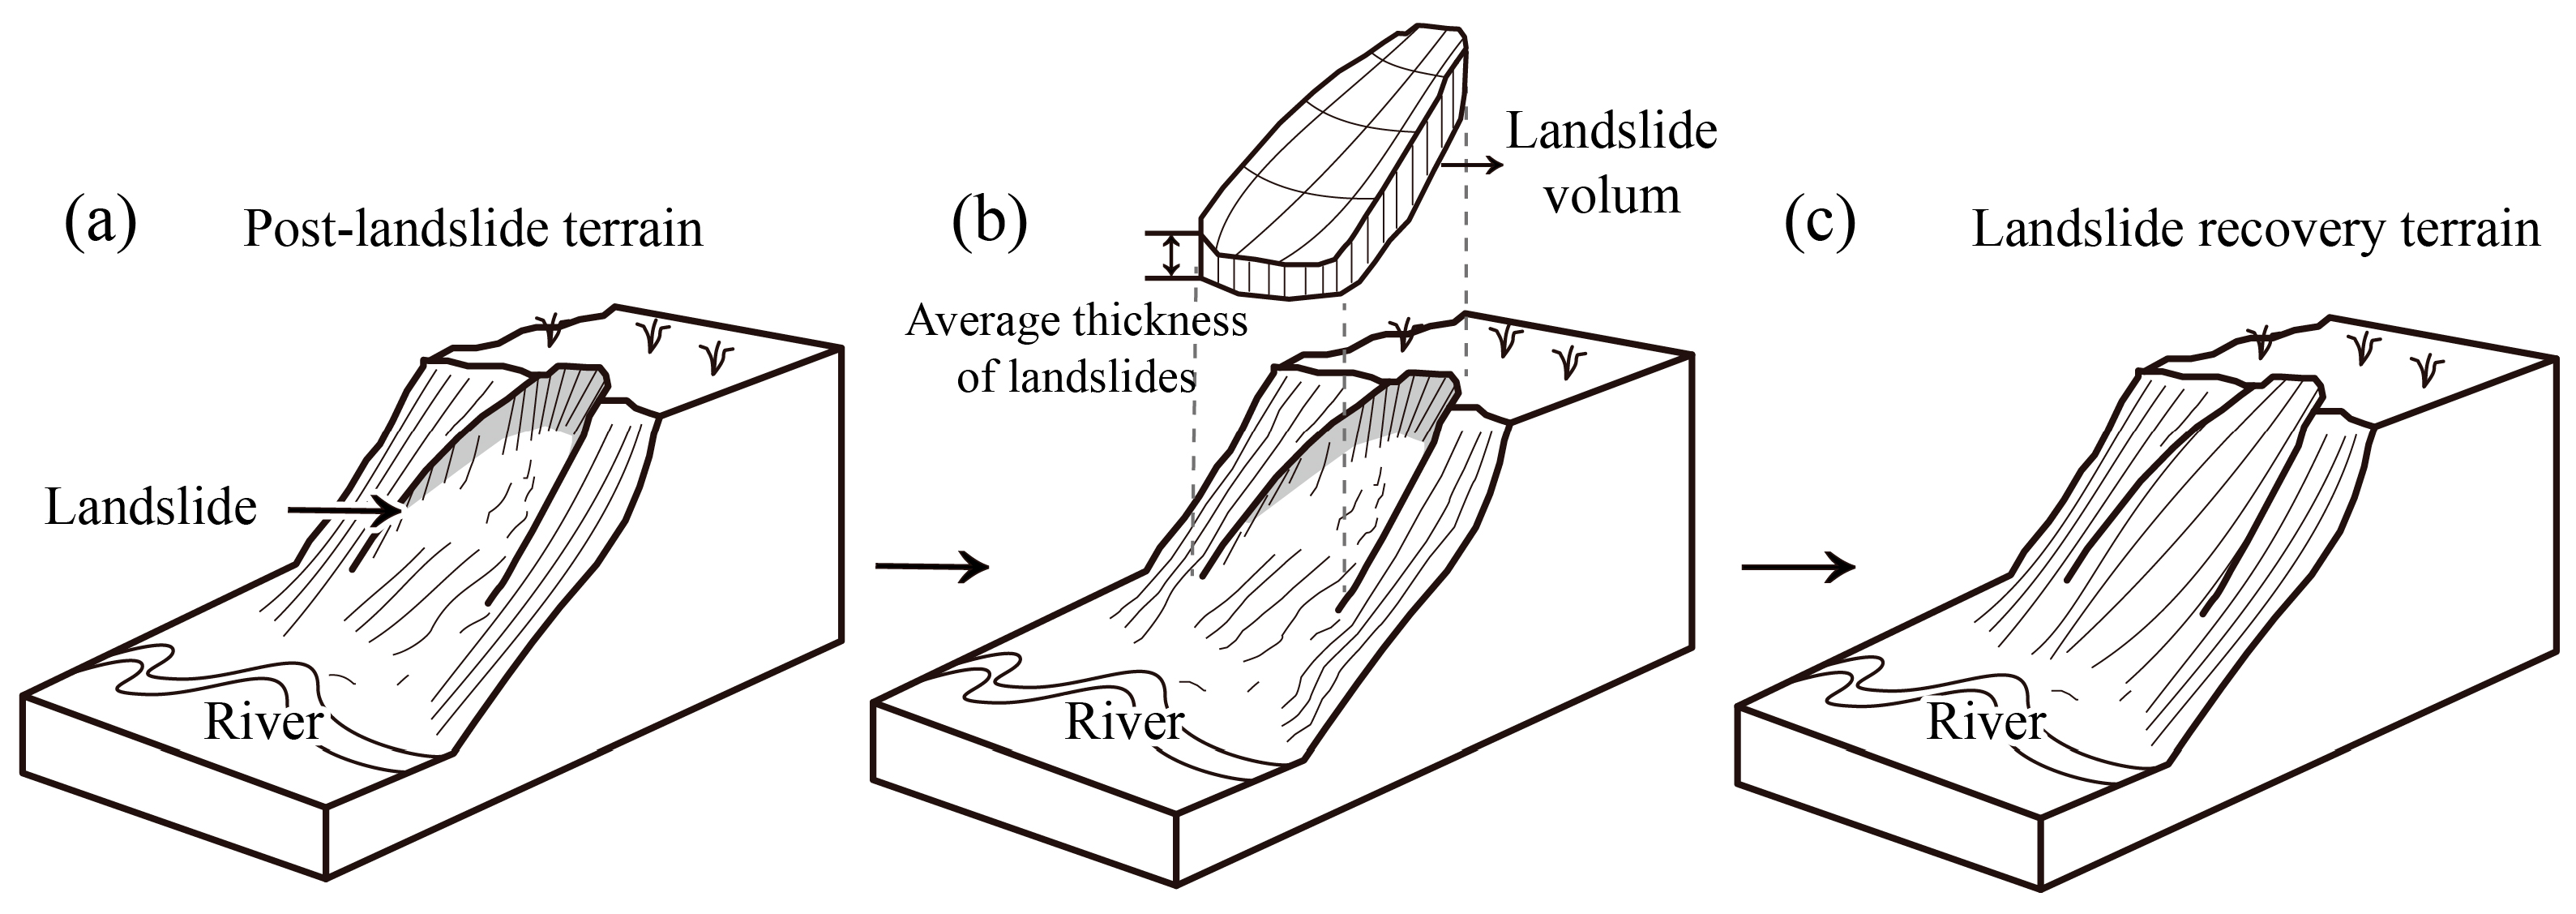
- Large landslides significantly influence river morphology by obstructing the river’s flow and promoting knickpoint formation. Their influence on catchment landscapes increases progressively from north to south, aligning with the observed transition in landscape evolution stages. On average, landslide volume constitutes 2.68% of the total pre-denudation volume of catchments. Following the occurrence of large landslides, the HI curves of the catchments become concave, highlighting the critical role of landslides in driving rapid landscape evolution.
Author Contributions
Funding
Data Availability Statement
Acknowledgments
Conflicts of Interest
References
- Harkins, N.; Kirby, E.; Heimsath, A.; Robinson, R.; Reiser, U. Transient fluvial incision in the headwaters of the Yellow River, northeastern Tibet, China. J. Geophys. Res. 2007, 112. [Google Scholar] [CrossRef]
- Ouimet, W.B.; Whipple, K.X.; Royden, L.H.; Sun, Z.; Chen, Z. The influence of large landslides on river incision in a transient landscape: Eastern margin of the Tibetan Plateau (Sichuan, China). Geol. Soc. Am. Bull. 2007, 119, 1462–1476. [Google Scholar] [CrossRef]
- Burbank, D.; Blythe, A.; Putkonen, J.; Pratt-Sitaula, B.; Gabet, E.; Oskin, M.; Barros, A.; Ojha, T. Decoupling of erosion and precipitation in the Himalayas. Nature 2003, 426, 652–655. [Google Scholar] [CrossRef]
- Densmore, A.L.; Anderson, R.S.; McAdoo, B.G.; Ellis, M.A. Hillslope evolution by bedrock landslides. Science 1997, 275, 369–372. [Google Scholar] [CrossRef] [PubMed]
- Hales, T.; Roering, J.J. Climatic controls on frost cracking and implications for the evolution of bedrock landscapes. J. Geophys. Res. 2007, 112. [Google Scholar] [CrossRef]
- Korup, O.; Montgomery, D.R.; Hewitt, K. Glacier and landslide feedbacks to topographic relief in the Himalayan syntaxes. Proc. Natl. Acad. Sci. USA 2010, 107, 5317–5322. [Google Scholar] [CrossRef]
- Larsen, I.J.; Montgomery, D.R.; Korup, O. Landslide erosion controlled by hillslope material. Nat. Geosci. 2010, 3, 247–251. [Google Scholar] [CrossRef]
- Montgomery, D.R. Slope distributions, threshold hillslopes, and steady-state topography. Am. J. Sci. 2001, 301, 432–454. [Google Scholar]
- Montgomery, D.R.; Brandon, M.T. Topographic controls on erosion rates in tectonically active mountain ranges. Earth Planet. Sci. Lett. 2002, 201, 481–489. [Google Scholar] [CrossRef]
- Tian, Y.; Xu, C.; Xu, X.; Chen, J. Detailed inventory mapping and spatial analyses to landslides induced by the 2013 Ms 6.6 Minxian earthquake of China. J. Earth Sci. 2016, 27, 1016–1026. [Google Scholar] [CrossRef]
- Wang, W.; Ma, S.; Yan, W.; Yuan, R. The Spatial Distribution Characteristics and Possible Influencing Factors of Landslide Disasters in the Zhaotong Area, Yunnan Province of China. Appl. Sci. 2024, 14, 5093. [Google Scholar] [CrossRef]
- Xu, C. A preliminary spatial distribution analysis of landslides triggered by the 2010 Haiti earthquake. In Proceedings of the Landslide Science for a Safer Geoenvironment: Volume 3: Targeted Landslides; Springer: Cham, Switzerland, 2014; pp. 183–190. [Google Scholar]
- Yueping, Y. Researches on the geo-hazards triggered by Wenchuan earthquake, Sichuan. J. Eng. Geol. 2008, 16, 433–444. [Google Scholar]
- Dai, F.C.; Xu, C.; Yao, X.; Xu, L.; Tu, X.B.; Gong, Q.M. Spatial distribution of landslides triggered by the 2008 Ms 8.0 Wenchuan earthquake, China. J. Asian Earth Sci. 2011, 40, 883–895. [Google Scholar]
- Huang, F.; Ye, Z.; Jiang, S.-H.; Huang, J.; Chang, Z.; Chen, J. Uncertainty study of landslide susceptibility prediction considering the different attribute interval numbers of environmental factors and different data-based models. Catena 2021, 202, 105250. [Google Scholar]
- Zou, Y.; Qi, S.; Guo, S.; Zheng, B.; Zhan, Z.; He, N.; Huang, X.; Hou, X.; Liu, H. Factors controlling the spatial distribution of coseismic landslides triggered by the Mw 6.1 Ludian earthquake in China. Eng. Geol. 2022, 296, 106477. [Google Scholar] [CrossRef]
- Jin, J.-l.; Cui, Y.-l.; Xu, C.; Zheng, J.; Miao, H.-b. Application of logistic regression model for hazard assessment of landslides caused by the 2012 Yiliang Ms 5.7 earthquake in Yunnan Province, China. J. Mt. Sci. 2023, 20, 657–669. [Google Scholar] [CrossRef]
- Makrari, S.; Sharma, G.; Taloor, A.K.; Singh, M.S.; Sarma, K.; Aggarwal, S. Assessment of the geomorphic indices in relation to tectonics along selected sectors of Borpani River Basin, Assam using Cartosat DEM data. Geosystems Geoenvironment 2022, 1, 100068. [Google Scholar] [CrossRef]
- Davis, W.M. The geographical cycle. In Climatic Geomorphology; Springer: Berlin/Heidelberg, Germany, 1973; pp. 19–50. [Google Scholar]
- Strahler, A.N. Hypsometric (area-altitude) analysis of erosional topography. Geol. Soc. Am. Bull. 1952, 63, 1117–1142. [Google Scholar]
- Schumm, S.A. Evolution of drainage systems and slopes in badlands at Perth Amboy, New Jersey. Geol. Soc. Am. Bull. 1956, 67, 597–646. [Google Scholar]
- Zhou, C.; He, H.-l.; Wei, Z.-y.; Su, P.; Ren, G.-x. The application of geomorphic indexes in small-scale geomorphology: A case study in dushanzi anticline in the northern chinese tian shan foreland. Seismol. Geol. 2020, 42, 1492–1508. [Google Scholar]
- Lifton, N.A.; Chase, C.G. Tectonic, climatic and lithologic influences on landscape fractal dimension and hypsometry: Implications for landscape evolution in the San Gabriel Mountains, California. Geomorphology 1992, 5, 77–114. [Google Scholar]
- Ohmori, H. Changes in the hypsometric curve through mountain building resulting from concurrent tectonics and denudation. Geomorphology 1993, 8, 263–277. [Google Scholar]
- Willgoose, G. A physical explanation for an observed area-slope-elevation relationship for catchments with declining relief. Water Resour. Res. 1994, 30, 151–159. [Google Scholar]
- Chen, Y.-C.; Sung, Q.; Cheng, K.-Y. Along-strike variations of morphotectonic features in the Western Foothills of Taiwan: Tectonic implications based on stream-gradient and hypsometric analysis. Geomorphology 2003, 56, 109–137. [Google Scholar]
- Masek, J.G.; Isacks, B.L.; Gubbels, T.L.; Fielding, E.J. Erosion and tectonics at the margins of continental plateaus. J. Geophys. Res. Solid Earth 1994, 99, 13941–13956. [Google Scholar]
- Duan, S.-S.; Yao, L.-K.; Guo, C.-W. Tendency Evaluation of Collapse-landslide Caused by Earthquake Based on the Erosion Cycle Theory. J. Hunan Univ. (Nat. Sci.) 2015, 42, 116–123. [Google Scholar]
- Yan, Z.; Xingmin, M.; Feng, Q.; Lintong, L.; Fuyun, G. Stage Division of Debris Flow Torrent Based on Geomorphologic Parameter. J. Catastrophology 2018, 33, 48–52. [Google Scholar]
- Jing, Z.; Shujun, T.; Pengli, H. The material supply ability analysis of debris flows based on areahypsometric integral and area-gradient integral. Chin. J. Geol. Hazard Control 2021, 32, 9–16. [Google Scholar] [CrossRef]
- Korup, O.; Densmore, A.L.; Schlunegger, F. The role of landslides in mountain range evolution. Geomorphology 2010, 120, 77–90. [Google Scholar]
- Willett, S.D.; Hovius, N.; Brandon, M.T.; Fisher, D.M. Tectonics, Climate, and Landscape Evolution; Geological Society of America: Boulder, CO, USA, 2006; Volume 398. [Google Scholar]
- Duvall, S.F.; Delquadri, J.C.; Ward, D.L. A preliminary investigation of the effectiveness of homeschool instructional environments for students with attention-deficit/hyperactivity disorder. Sch. Psychol. Rev. 2004, 33, 140–158. [Google Scholar]
- Kirby, E.; Whipple, K.X. Expression of active tectonics in erosional landscapes. J. Struct. Geol. 2012, 44, 54–75. [Google Scholar] [CrossRef]
- Kirby, E.; Whipple, K.X.; Tang, W.; Chen, Z. Distribution of active rock uplift along the eastern margin of the Tibetan Plateau: Inferences from bedrock channel longitudinal profiles. J. Geophys. Res. 2003, 108. [Google Scholar] [CrossRef]
- Hongzhuang, Z.; Youli, L.; Jingchun, Y.; Supei, S. Geomorphology Characteristic and Tectonic Response of the Northern Tianshan Represented by Hypsometric Integral. Mt. Res. 2009, 27, 285–292. [Google Scholar]
- Xiaoqian, S.; Jianzhang, P.; Yizhou, W.; Dewen, Z.; Huiping, Z.; Yuqi, H. Late miocene uplift history of the northern qilian shan constrained by the longitudinal profile. Quat. Sci. 2024, 44, 338–353. [Google Scholar]
- Suhail, H.A.; Yang, R.; Chen, H.; Rao, G. The impact of river capture on the landscape development of the Dadu River drainage basin, eastern Tibetan plateau. J. Asian Earth Sci. 2020, 198, 104377. [Google Scholar] [CrossRef]
- Xu, X.; Gao, R.; Guo, X.; Li, W.; Li, H.; Wang, H.; Huang, X.; Lu, Z. Outlining tectonic inheritance and construction of the Min Shan region, eastern Tibet, using crustal geometry. Sci. Rep. 2017, 7, 13798. [Google Scholar] [CrossRef]
- Renji, B.; Li, W.; Wanmo, Z.; Zongliang, L.; Minhui, L.; Yujie, L.; Huayong, N.; Ruge, X. Characteristics and distribution of the geology disasters of the Dadu River in Sichuan, China. J. Chengdu Univ. Technol. (Sci. Technol. Ed.) 2011, 38, 529–537. [Google Scholar]
- Tachikawa, T.; Kaku, M.; Iwasaki, A.; Gesch, D.B.; Oimoen, M.J.; Zhang, Z.; Danielson, J.J.; Krieger, T.; Curtis, B.; Haase, J. ASTER Global Digital Elevation Model Version 2-Summary of Validation Results. USGS Report. 2011, p. 37. Available online: https://ui.adsabs.harvard.edu/abs/2011usgs.rept...37T/abstract (accessed on 9 February 2025).
- Zhang, P.; Qiu, H.; Xu, C.; Chen, X.; Zhou, Q. Analysis of the controlling effect of excess topography on the distribution of coseismic landslides during the Iburi earthquake, Japan, on 6 September 2018. Remote Sens. 2023, 15, 5035. [Google Scholar] [CrossRef]
- Pike, R.J.; Wilson, S.E. Elevation-relief ratio, hypsometric integral, and geomorphic area-altitude analysis. Geol. Soc. Am. Bull. 1971, 82, 1079–1084. [Google Scholar] [CrossRef]
- Faul, F.; Erdfelder, E.; Lang, A.-G.; Buchner, A. G* Power 3: A flexible statistical power analysis program for the social, behavioral, and biomedical sciences. Behav. Res. Methods 2007, 39, 175–191. [Google Scholar] [CrossRef]
- Edward, K.A.; Nicholas, P. Active Tectonics: Earthquakes, Uplift, and Landscape; Prentice-Hall: Upper Saddle River, NJ, USA, 2002. [Google Scholar]
- Hovius, N.; Stark, C.P.; Allen, P.A. Sediment flux from a mountain belt derived by landslide mapping. Geology 1997, 25, 231–234. [Google Scholar]
- Malamud, B.D.; Turcotte, D.L.; Guzzetti, F.; Reichenbach, P. Landslides, earthquakes, and erosion. Earth Planet. Sci. Lett. 2004, 229, 45–59. [Google Scholar]
- Stark, C.P.; Hovius, N. The characterization of landslide size distributions. Geophys. Res. Lett. 2001, 28, 1091–1094. [Google Scholar]
- Çellek, S. Morphological parameters causing landslides: A case study of elevation. Bull. Miner. Res. Explor. 2020, 162, 197–224. [Google Scholar]
- Nalgire, T.; Dahale, P.; Mehta, A.; Hiwase, P. Slope stability analysis by GeoSlope. Helix 2020, 10, 71–75. [Google Scholar]
- Whipple, K.X. Bedrock rivers and the geomorphology of active orogens. Annu. Rev. Earth Planet. Sci. 2004, 32, 151–185. [Google Scholar] [CrossRef]
- Snyder, N.P.; Whipple, K.X.; Tucker, G.E.; Merritts, D.J. Landscape response to tectonic forcing: Digital elevation model analysis of stream profiles in the Mendocino triple junction region, northern California. Geol. Soc. Am. Bull. 2000, 112, 1250–1263. [Google Scholar]


Disclaimer/Publisher’s Note: The statements, opinions and data contained in all publications are solely those of the individual author(s) and contributor(s) and not of MDPI and/or the editor(s). MDPI and/or the editor(s) disclaim responsibility for any injury to people or property resulting from any ideas, methods, instructions or products referred to in the content. |
© 2025 by the authors. Licensee MDPI, Basel, Switzerland. This article is an open access article distributed under the terms and conditions of the Creative Commons Attribution (CC BY) license (https://creativecommons.org/licenses/by/4.0/).
Share and Cite
Bian, M.; Qiu, H.; Chen, X. The Distribution Characteristics of Large Landslides Along the Daduhe River in the Eastern Tibetan Plateau and Their Effects on Landscape Evolution. Remote Sens. 2025, 17, 1133. https://doi.org/10.3390/rs17071133
Bian M, Qiu H, Chen X. The Distribution Characteristics of Large Landslides Along the Daduhe River in the Eastern Tibetan Plateau and Their Effects on Landscape Evolution. Remote Sensing. 2025; 17(7):1133. https://doi.org/10.3390/rs17071133
Chicago/Turabian StyleBian, Meifang, Hengzhi Qiu, and Xiaoli Chen. 2025. "The Distribution Characteristics of Large Landslides Along the Daduhe River in the Eastern Tibetan Plateau and Their Effects on Landscape Evolution" Remote Sensing 17, no. 7: 1133. https://doi.org/10.3390/rs17071133
APA StyleBian, M., Qiu, H., & Chen, X. (2025). The Distribution Characteristics of Large Landslides Along the Daduhe River in the Eastern Tibetan Plateau and Their Effects on Landscape Evolution. Remote Sensing, 17(7), 1133. https://doi.org/10.3390/rs17071133