
An Approach for Multi-Source Land Use and Land Cover Data Fusion Considering Spatial Correlations

Abstract

1. Introduction
2. Methodology
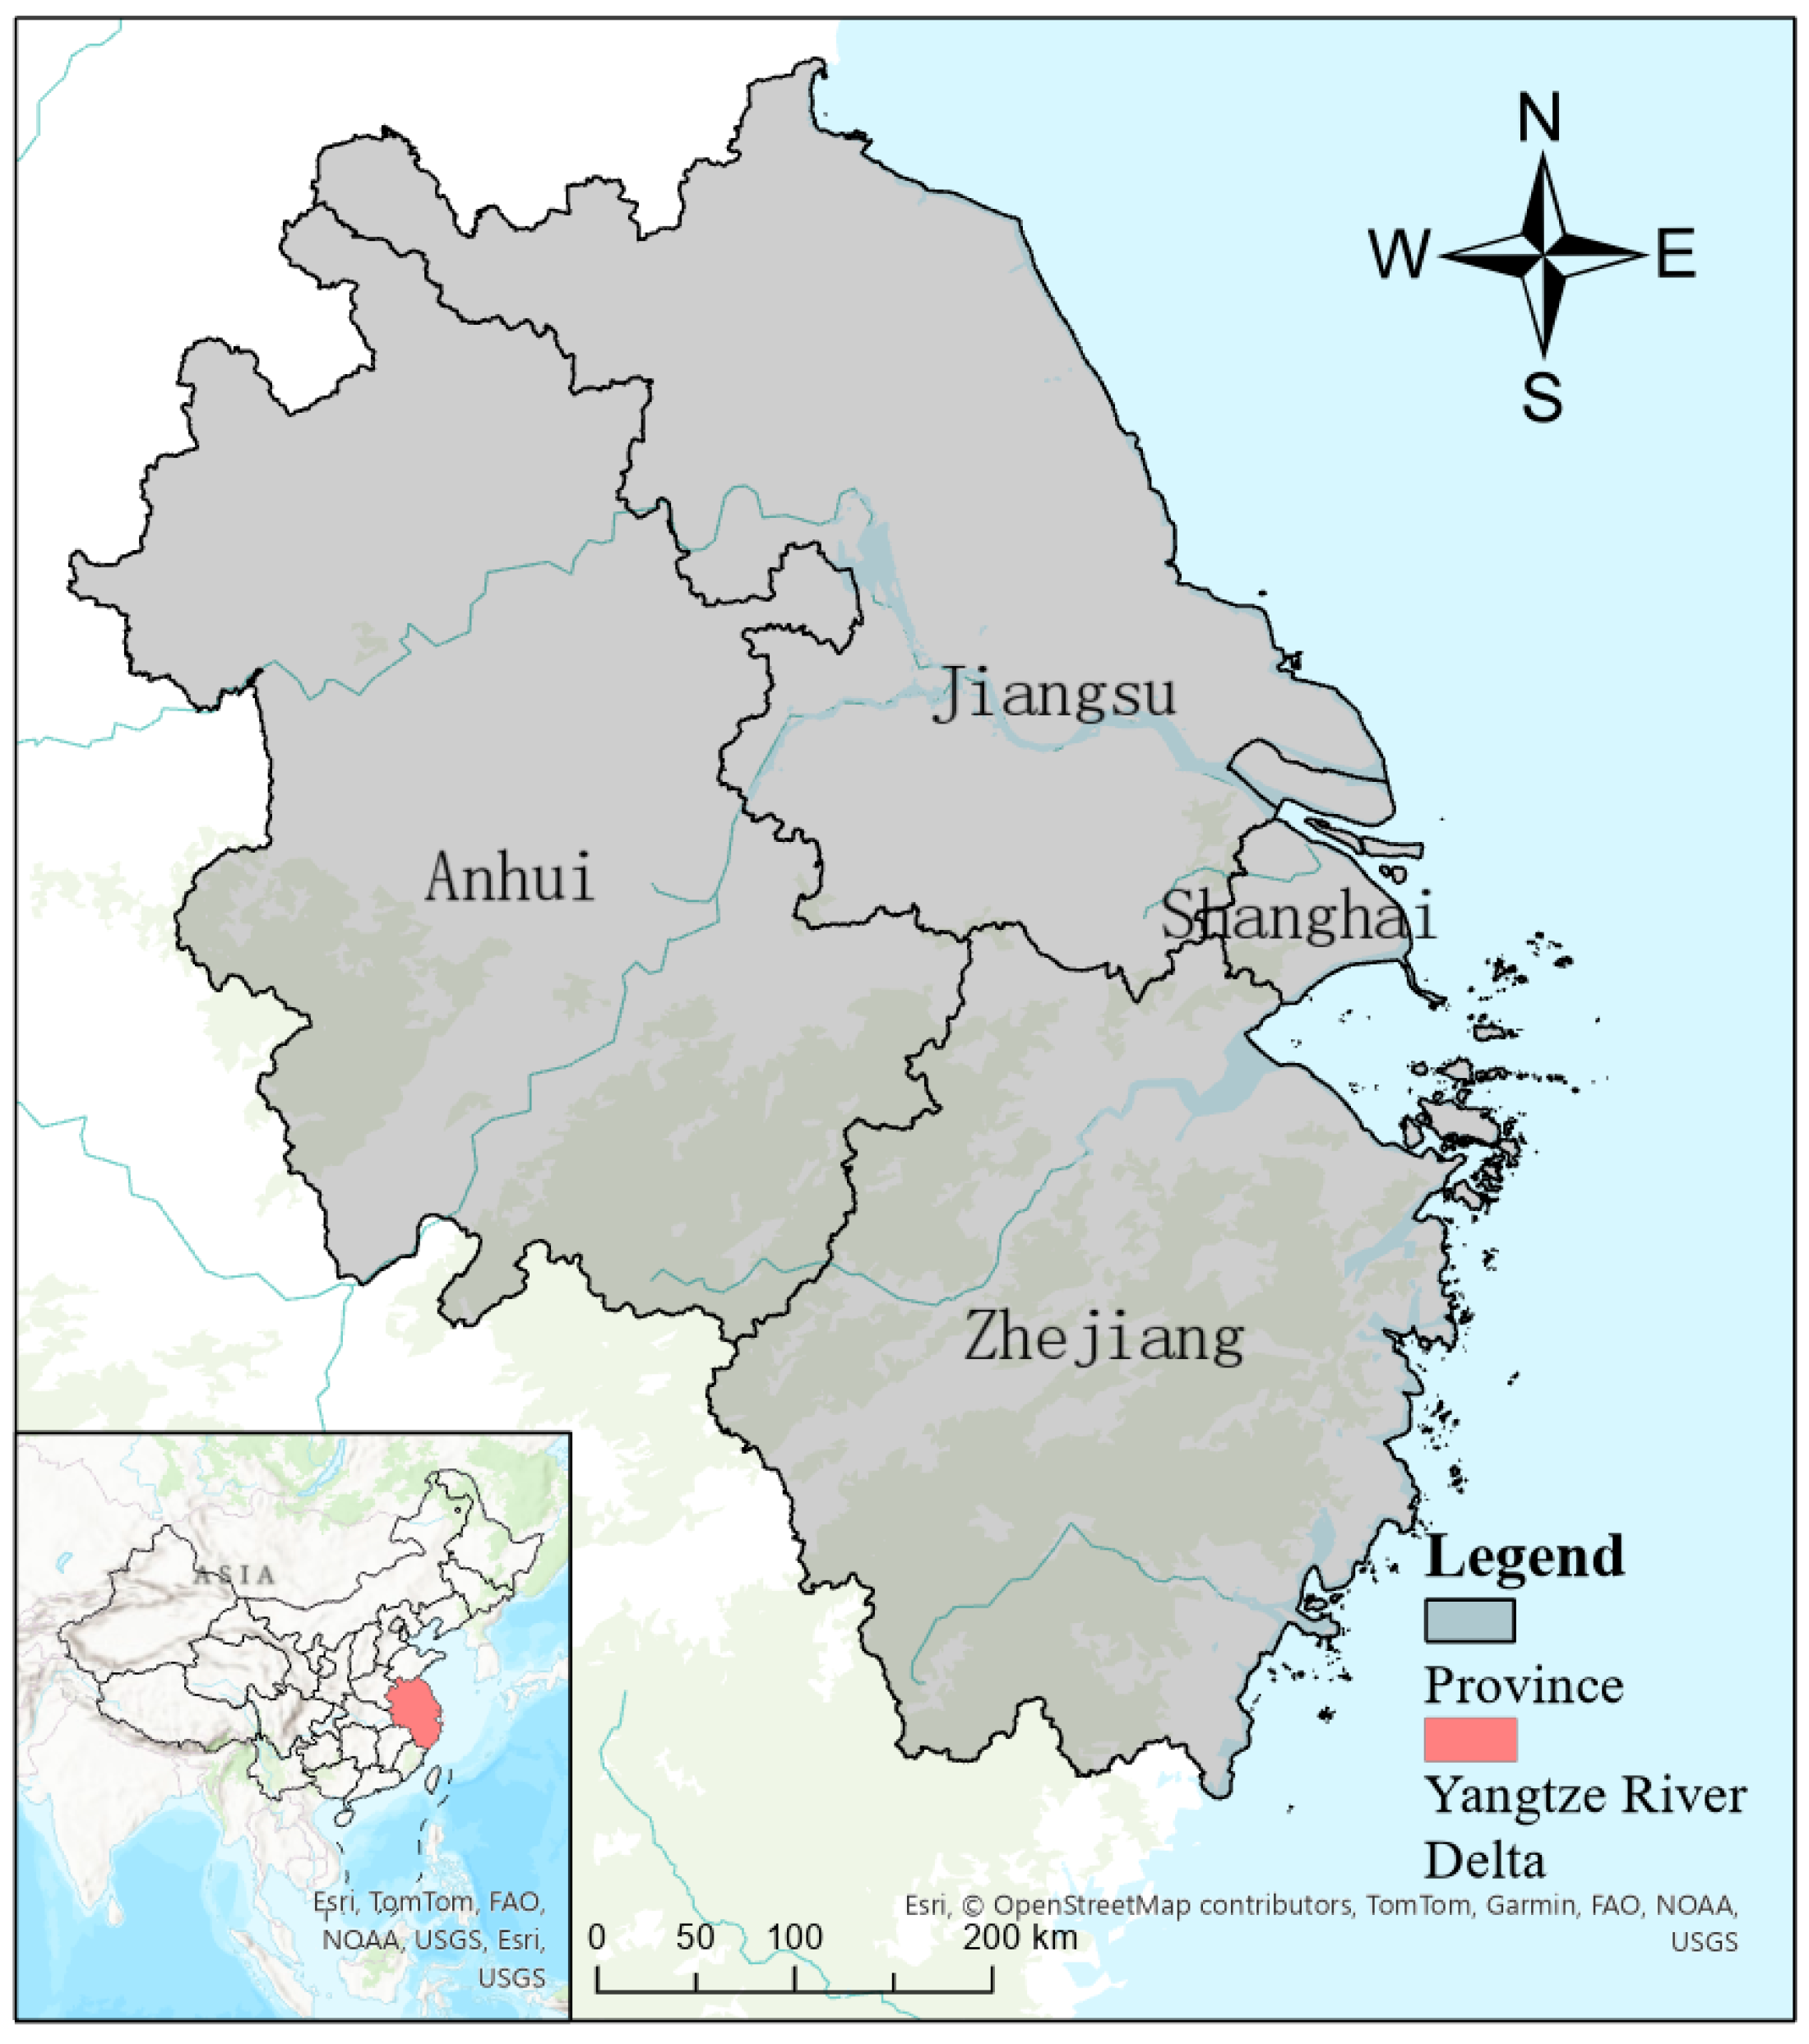
2.1. Study Area
2.2. Study Data
2.3. Determination of Geographical Environment Factors
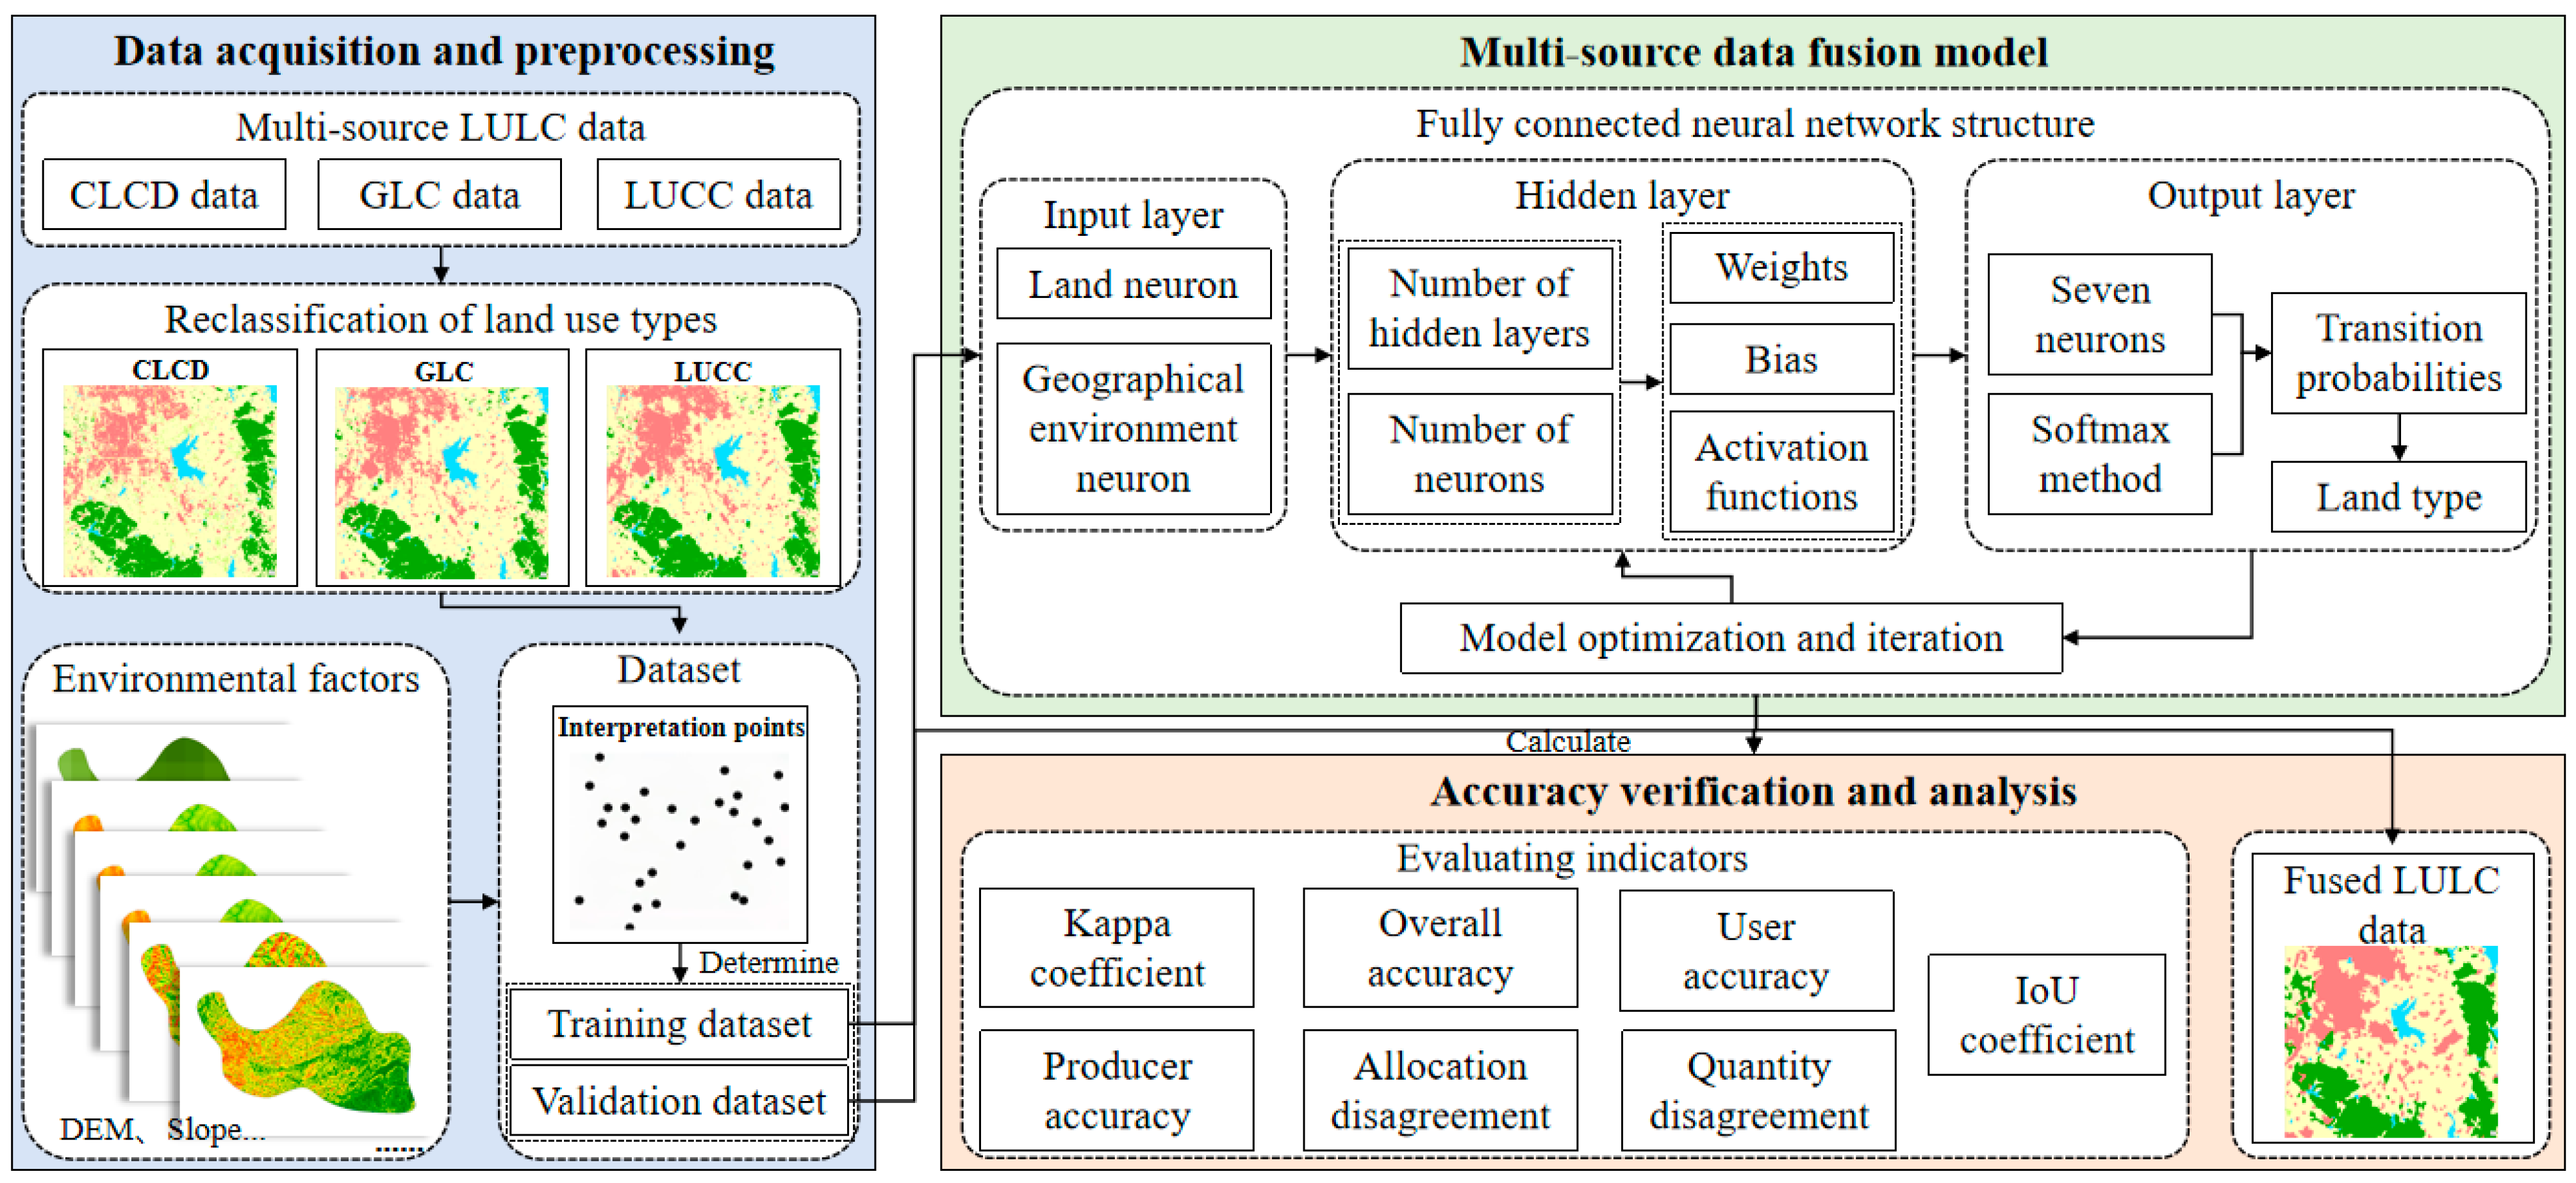
2.4. Construction of Land Use and Land Cover Data Fusion Model
2.4.1. Input Layer
2.4.2. Hidden Layer
2.4.3. Output Layer
2.4.4. Model Optimization and Iteration
2.5. Accuracy Verification
3. Results
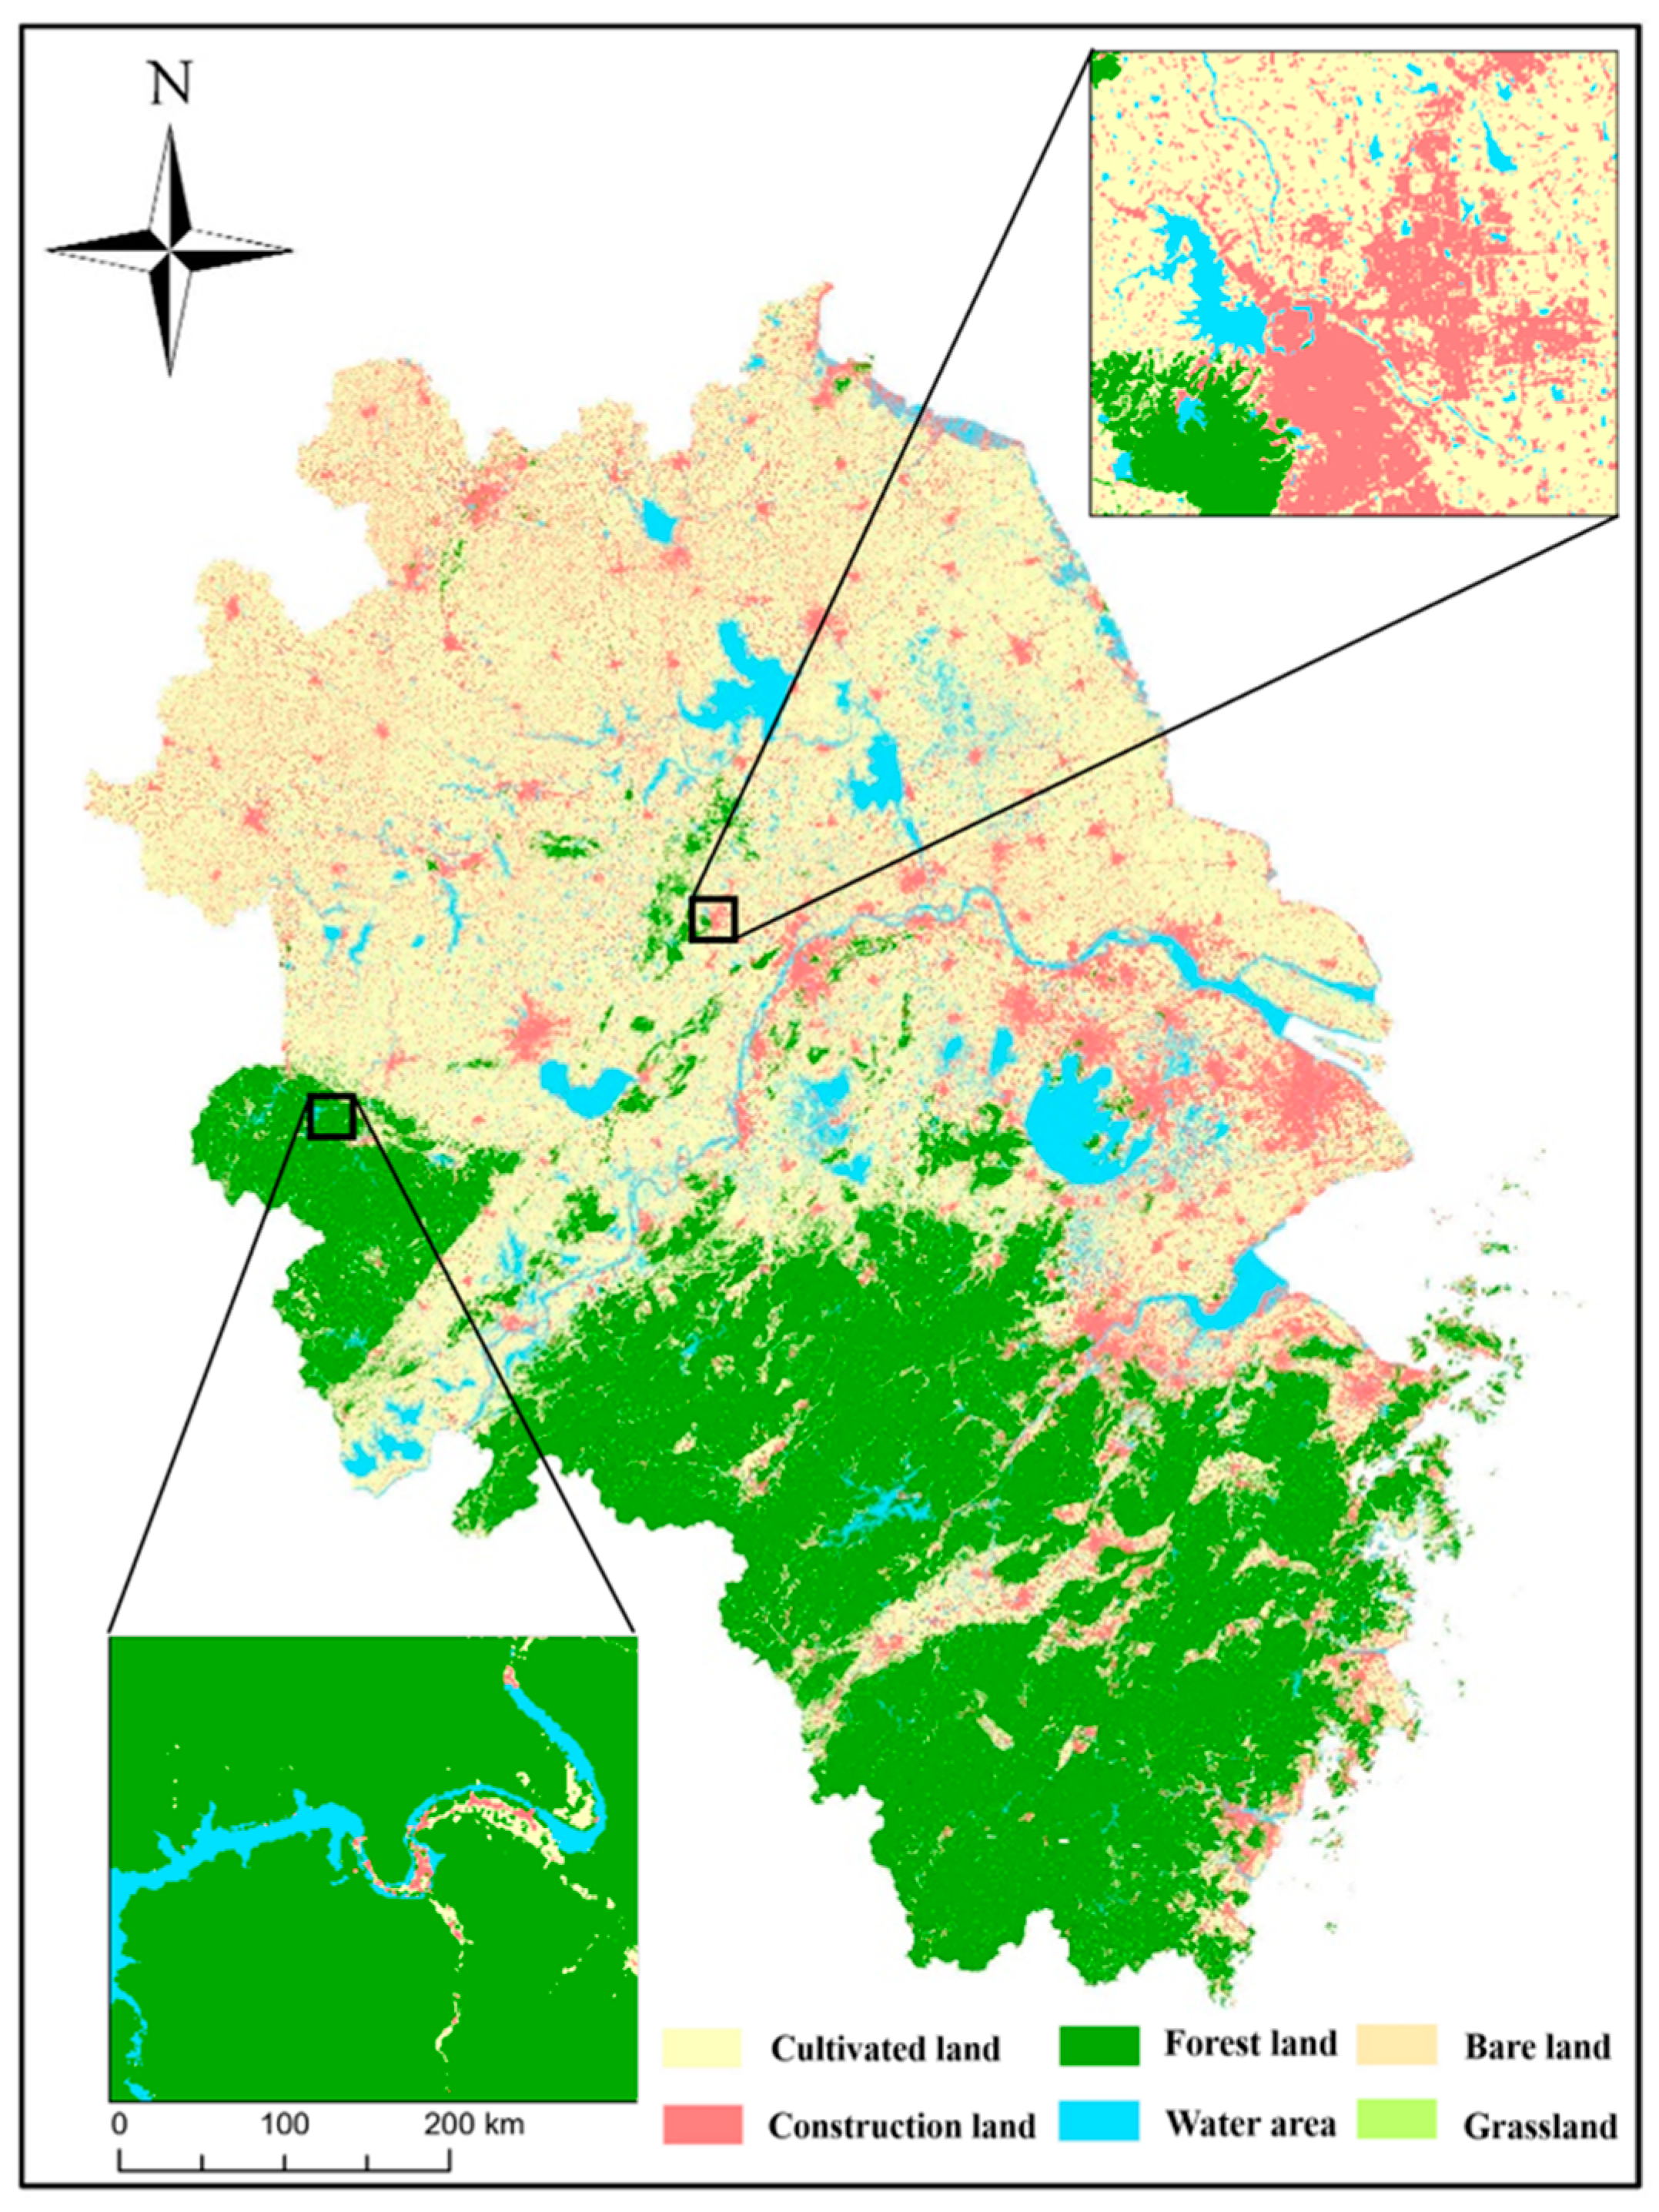
3.1. Results of the Multi-Source LULC Data Fusion
3.2. Comparison and Analysis of Fused Data
3.2.1. Spatial Comparison and Analysis
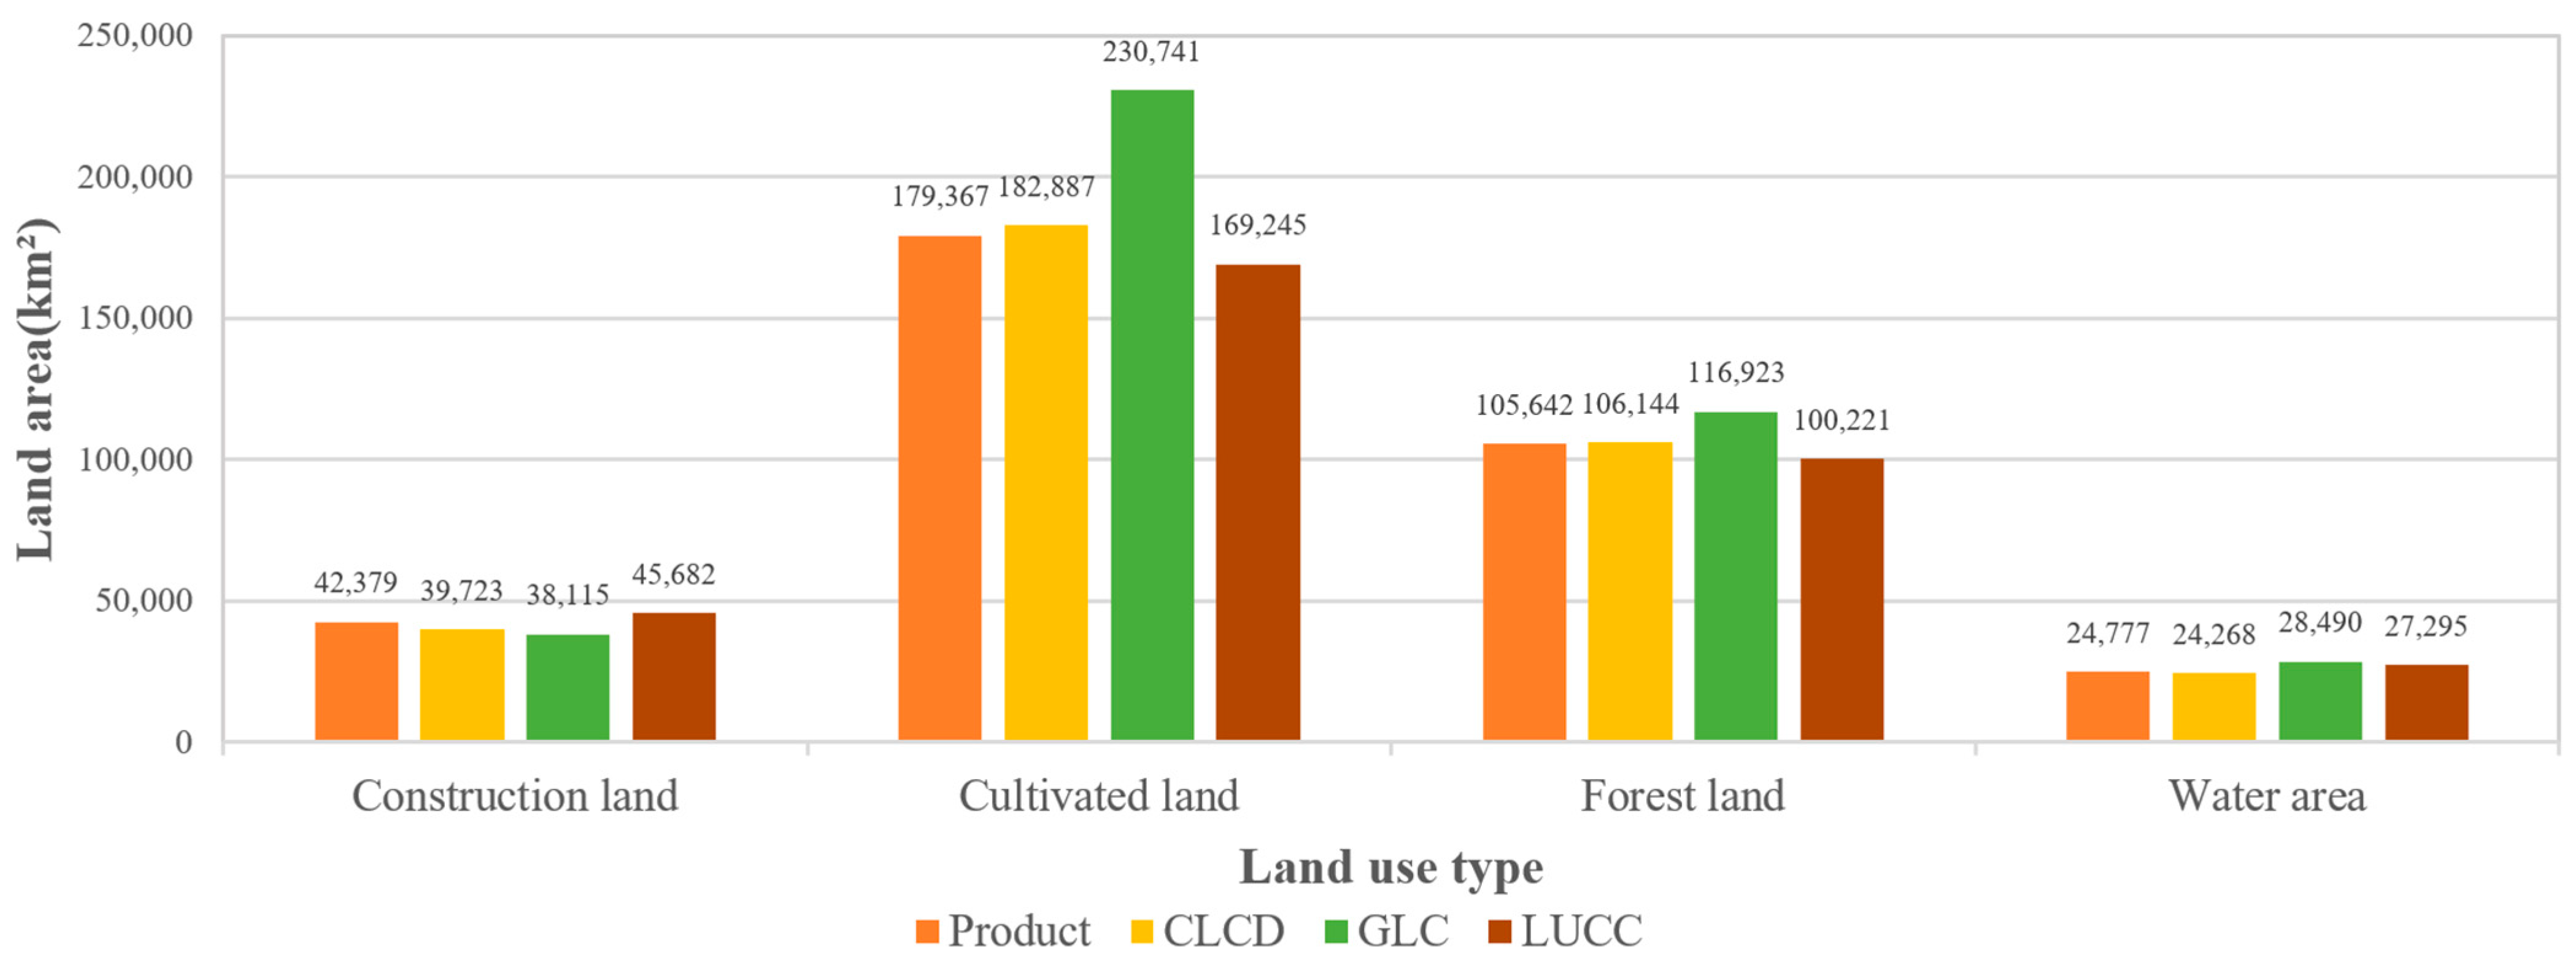
3.2.2. Area Comparison and Analysis
3.2.3. Accuracy Comparison and Analysis
4. Discussion
5. Conclusions
Supplementary Materials
Author Contributions
Funding
Data Availability Statement
Conflicts of Interest
References
- Tan, J.; Yu, D.; Li, Q.; Tan, X.; Zhou, W. Spatial relationship between land-use/land-cover change and land surface temperature in the Dongting Lake area, China. Sci. Rep. 2020, 10, 9245. [Google Scholar] [CrossRef]
- Ramzan, M.; Saqib, Z.A.; Hussain, E.; Khan, J.A.; Nazir, A.; Dasti, M.Y.S.; Ali, S.; Niazi, N.K. Remote sensing-based prediction of temporal changes in land surface temperature and land use-land cover (LULC) in urban environments. Land 2022, 11, 1610. [Google Scholar] [CrossRef]
- Wang, J.; Bretz, M.; Dewan, M.A.A.; Delavar, M.A. Machine learning in modelling land-use and land cover-change (LULCC): Current status, challenges and prospects. Sci. Total Environ. 2022, 822, 153559. [Google Scholar] [CrossRef] [PubMed]
- Chen, B.; Xu, B.; Gong, P. Mapping essential urban land use categories (EULUC) using geospatial big data: Progress, challenges, and opportunities. Big Earth Data 2021, 5, 410–441. [Google Scholar] [CrossRef]
- Ye, J.; Hu, Y.; Zhen, L.; Wang, H.; Zhang, Y. Analysis on Land-Use Change and its driving mechanism in Xilingol, China, during 2000–2020 using the google earth engine. Remote Sens. 2021, 13, 5134. [Google Scholar] [CrossRef]
- Zhang, H.; Zheng, J.; Hunjra, A.I.; Zhao, S.; Bouri, E. How does urban land use efficiency improve resource and environment carrying capacity? Socio-Econ. Plan. Sci. 2024, 91, 101760. [Google Scholar] [CrossRef]
- Koroso, N.H.; Lengoiboni, M.; Zevenbergen, J.A. Urbanization and urban land use efficiency: Evidence from regional and Addis Ababa satellite cities, Ethiopia. Habitat Int. 2021, 117, 102437. [Google Scholar] [CrossRef]
- Bodhankar, S.; Gupta, K.; Kumar, P.; Srivastav, S.K. GIS-based multi-objective urban land allocation approach for optimal allocation of urban land uses. J. Indian Soc. Remote Sens. 2022, 50, 763–774. [Google Scholar] [CrossRef]
- Mohammadyari, F.; Tavakoli, M.; Zarandian, A.; Abdollahi, S. Optimization land use based on multi-scenario simulation of ecosystem service for sustainable landscape planning in a mixed urban-Forest watershed. Ecol. Model. 2023, 483, 110440. [Google Scholar] [CrossRef]
- MohanRajan, S.N.; Loganathan, A.; Manoharan, P. Survey on Land Use/Land Cover (LU/LC) change analysis in remote sensing and GIS environment: Techniques and Challenges. Environ. Sci. Pollut. Res. 2020, 27, 29900–29926. [Google Scholar] [CrossRef]
- Lippe, M.; Rummel, L.; Günter, S. Simulating land use and land cover change under contrasting levels of policy enforcement and its spatially-explicit impact on tropical forest landscapes in Ecuador. Land Use Policy 2022, 119, 106207. [Google Scholar] [CrossRef]
- Chao, W.; Yu, Y.; Fanzong, G. Using street view images to examine the association between human perceptions of locale and urban vitality in Shenzhen, China. Sustain. Cities Soc. 2023, 88, 104291. [Google Scholar] [CrossRef]
- Qu, L.A.; Chen, Z.; Li, M.; Zhi, J.; Wang, H. Accuracy improvements to pixel-based and object-based lulc classification with auxiliary datasets from Google Earth engine. Remote Sens. 2021, 13, 453. [Google Scholar] [CrossRef]
- Wang, H.; Yan, H.; Hu, Y.; Xi, Y.; Yang, Y. Consistency and accuracy of four high-resolution LULC datasets—Indochina Peninsula case study. Land 2022, 11, 758. [Google Scholar] [CrossRef]
- Dash, P.; Sanders, S.L.; Parajuli, P.; Ouyang, Y. Improving the accuracy of land use and land cover classification of landsat data in an agricultural watershed. Remote Sens. 2023, 15, 4020. [Google Scholar] [CrossRef]
- Vivekananda, G.N.; Swathi, R.; Sujith, A.V.L.N. RETRACTED ARTICLE: Multi-temporal image analysis for LULC classification and change detection. Eur. J. Remote Sens. 2021, 54 (Suppl. S2), 189–199. [Google Scholar] [CrossRef]
- Richards, J.A.; Richards, J.A. Remote Sensing Digital Image Analysis; Springer: Berlin/Heidelberg, Germany, 2022; Volume 5, pp. 256–258. [Google Scholar]
- Kotaridis, I.; Lazaridou, M. Remote sensing image segmentation advances: A meta-analysis. ISPRS J. Photogramm. Remote Sens. 2021, 173, 309–322. [Google Scholar] [CrossRef]
- Song, X.P.; Huang, W.; Hansen, M.C.; Potapov, P. An evaluation of Landsat, Sentinel-2, Sentinel-1 and MODIS data for crop type mapping. Sci. Remote Sens. 2021, 3, 100018. [Google Scholar] [CrossRef]
- Sun, X.; Wang, B.; Wang, Z.; Li, H.; Li, H.; Fu, K. Research progress on few-shot learning for remote sensing image interpretation. IEEE J. Sel. Top. Appl. Earth Obs. Remote Sens. 2021, 14, 2387–2402. [Google Scholar] [CrossRef]
- Tian, L.; Cao, Y.; He, B.; Zhang, Y.; He, C.; Li, D. Image enhancement driven by object characteristics and dense feature reuse network for ship target detection in remote sensing imagery. Remote Sens. 2021, 13, 1327. [Google Scholar] [CrossRef]
- Wang, Z.; Ma, Y.; Zhang, Y. Review of pixel-level remote sensing image fusion based on deep learning. Inf. Fusion 2023, 90, 36–58. [Google Scholar] [CrossRef]
- Lyu, P.; He, L.; He, Z.; Liu, Y.; Deng, H.; Qu, R.; Wang, J.; Zhao, Y.; Wei, Y. Research on remote sensing prospecting technology based on multi-source data fusion in deep-cutting areas. Ore Geol. Rev. 2021, 138, 104359. [Google Scholar] [CrossRef]
- Mohammadpour, P.; Viegas, C. Applications of Multi-Source and Multi-Sensor Data Fusion of Remote Sensing for Forest Species Mapping. In Advances in Remote Sensing for Forest Monitoring; John Wiley & Sons Ltd.: Hoboken, NJ, USA, 2022; pp. 255–287. [Google Scholar] [CrossRef]
- Li, R.; Zhou, M.; Zhang, D.; Yan, Y.; Huo, Q. A survey of multi-source image fusion. Multimed. Tools Appl. 2024, 83, 18573–18605. [Google Scholar] [CrossRef]
- Vali, A.; Comai, S.; Matteucci, M. Deep learning for land use and land cover classification based on hyperspectral and multispectral earth observation data: A review. Remote Sens. 2020, 12, 2495. [Google Scholar] [CrossRef]
- Macarringue, L.S.; Bolfe, É.L.; Pereira, P.R.M. Developments in land use and land cover classification techniques in remote sensing: A review. J. Geogr. Inf. Syst. 2022, 14, 1–28. [Google Scholar] [CrossRef]
- Ali, K.; Johnson, B.A. Land-use and land-cover classification in semi-arid areas from medium-resolution remote-sensing imagery: A deep learning approach. Sensors 2022, 22, 8750. [Google Scholar] [CrossRef]
- Chen, W.; Ouyang, S.; Tong, W.; Li, X.; Zheng, X.; Wang, L. GCSANet: A global context spatial attention deep learning network for remote sensing scene classification. IEEE J. Sel. Top. Appl. Earth Obs. Remote Sens. 2022, 15, 1150–1162. [Google Scholar] [CrossRef]
- Gao, Y.; Ruan, Y.; Fang, C.; Yin, S. Deep learning and transfer learning models of energy consumption forecasting for a building with poor information data. Energy Build. 2020, 223, 110156. [Google Scholar] [CrossRef]
- Zheng, Q.H.; Chen, W.; Li, S.L.; Yu, L.; Zhang, X.; Liu, L.F.; Singh, R.P.; Liu, C.Q. Accuracy comparison and driving factor analysis of LULC changes using multi-source time-series remote sensing data in a coastal area. Ecol. Inform. 2021, 66, 101457. [Google Scholar] [CrossRef]
- Balha, A.; Mallick, J.; Pandey, S.; Gupta, S.; Singh, C.K. A comparative analysis of different pixel and object-based classification algorithms using multi-source high spatial resolution satellite data for LULC mapping. Earth Sci. Inform. 2021, 14, 2231–2247. [Google Scholar] [CrossRef]
- Asenso Barnieh, B.; Jia, L.; Menenti, M.; Yu, L.; Nyantakyi, E.K.; Kabo-Bah, A.T.; Jiang, M.; Zhou, J.; Lv, Y.; Zeng, Y.; et al. Spatiotemporal Patterns in Land Use/Land Cover Observed by Fusion of Multi-Source Fine-Resolution Data in West Africa. Land 2023, 12, 1032. [Google Scholar] [CrossRef]
- Sillero, N.; Barbosa, A.M. Common mistakes in ecological niche models. Int. J. Geogr. Inf. Sci. 2021, 35, 213–226. [Google Scholar] [CrossRef]
- Liang, X.; Jin, X.; Yang, X.; Xu, W.; Lin, J.; Zhou, Y. Exploring cultivated land evolution in mountainous areas of Southwest China, an empirical study of developments since the 1980s. Land Degrad. Dev. 2021, 32, 546–558. [Google Scholar] [CrossRef]
- Lu, X.; Shi, Z.; Li, J.; Dong, J.; Song, M.; Hou, J. Research on the impact of factor flow on urban land use efficiency from the perspective of urbanization. Land 2022, 11, 389. [Google Scholar] [CrossRef]
- Yang, J.; Huang, X. China Land Cover Dataset (CLCD) [Data Set]; Wuhan University: Wuhan, China, 2021; Available online: https://zenodo.org/record/5816591 (accessed on 19 March 2025).
- Gong, P.; Liu, H.; Zhang, M. Global 30 m Land Cover Dynamic Dataset (GLC_FCS30) [Data Set]; CAS Big Earth Data Platform: Beijing, China, 2019. [Google Scholar] [CrossRef]
- Liu, J.; Kuang, W.; Zhang, Z. China Multi-Period Land Use/Cover Remote Sensing Monitoring Dataset (LUCC) [Data Set]; Resource and Environment Science and Data Center (RESDC): 2020. Available online: https://www.resdc.cn/DOI/DOI.aspx?DOIid=XXX%EF%BC%89%E3%80%82 (accessed on 19 March 2025).
- Liang, H.; Kasimu, A.; Ma, H.; Zhao, Y.; Zhang, X.; Wei, B. Exploring the Variations and Influencing Factors of Land Surface Temperature in the Urban Agglomeration on the Northern Slope of the Tianshan Mountains. Sustainability 2022, 14, 10663. [Google Scholar] [CrossRef]
- Li, Z.; Fan, Y.; Zhang, R.; Chen, P.; Jing, X.; Lyu, C.; Zhang, R.; Li, Y.; Liu, Y. Synergistic impacts of Landscape, Soil, and environmental factors on the spatial distribution of soil aggregates stability in the Danjiangkou reservoir area. Catena 2024, 237, 107840. [Google Scholar] [CrossRef]
- Zhang, X.; Wang, J.; Gao, Y.; Wang, L. Variations and controlling factors of vegetation dynamics on the Qingzang Plateau of China over the recent 20 years. Geogr. Sustain. 2021, 2, 74–85. [Google Scholar] [CrossRef]
- Huang, S.; Tang, L.; Hupy, J.P.; Wang, Y.; Shao, G. A commentary review on the use of normalized difference vegetation index (NDVI) in the era of popular remote sensing. J. For. Res. 2021, 32, 1–6. [Google Scholar] [CrossRef]
- Ustaoğlu, F.; Tepe, Y.; Taş, B. Assessment of stream quality and health risk in a subtropical Turkey river system: A combined approach using statistical analysis and water quality index. Ecol. Indic. 2020, 113, 105815. [Google Scholar] [CrossRef]
- Rocha, J.; Duarte, A.; Silva, M.; Fabres, S.; Vasques, J.; Revilla-Romero, B.; Quintela, A. The importance of high resolution digital elevation models for improved hydrological simulations of a mediterranean forested catchment. Remote Sens. 2020, 12, 3287. [Google Scholar] [CrossRef]
- Bakhshianlamouki, E.; Masia, S.; Karimi, P.; van der Zaag, P.; Sušnik, J. A system dynamics model to quantify the impacts of restoration measures on the water-energy-food nexus in the Urmia lake Basin, Iran. Sci. Total Environ. 2020, 708, 134874. [Google Scholar] [CrossRef]
- Bijeesh, T.V.; Narasimhamurthy, K.N. Surface water detection and delineation using remote sensing images: A review of methods and algorithms. Sustain. Water Resour. Manag. 2020, 6, 68. [Google Scholar] [CrossRef]
- Dong, L.; Li, J.; Xu, Y.; Yang, Y.; Li, X.; Zhang, H. Study on the spatial classification of construction land types in Chinese cities: A case study in Zhejiang province. Land 2021, 10, 523. [Google Scholar] [CrossRef]
- Zhai, D.; Zhang, X.; Zhuo, J.; Mao, Y. Driving the Evolution of Land Use Patterns: The Impact of Urban Agglomeration Construction Land in the Yangtze River Delta, China. Land 2024, 13, 1514. [Google Scholar] [CrossRef]
- Nguyen, C.T.; Chidthaisong, A.; Kieu Diem, P.; Huo, L.Z. A modified bare soil index to identify bare land features during agricultural fallow-period in southeast Asia using Landsat 8. Land 2021, 10, 231. [Google Scholar] [CrossRef]
- Nautiyal, S.; Goswami, M.; Prakash, S.; Rao, K.S.; Maikhuri, R.K.; Saxena, K.G.; Baksi, S.; Banerjee, S. Spatio-temporal variations of geo-climatic environment in a high-altitude landscape of Central Himalaya: An assessment from the perspective of vulnerability of glacial lakes. Nat. Hazards Res. 2022, 2, 343–362. [Google Scholar] [CrossRef]
- Upadhyay, S.K.; Kumar, A. A novel approach for rice plant diseases classification with deep convolutional neural network. Int. J. Inf. Technol. 2022, 14, 185–199. [Google Scholar] [CrossRef]
- Li, Z.; Chen, B.; Wu, S.; Su, M.; Chen, J.M.; Xu, B. Deep learning for urban land use category classification: A review and experimental assessment. Remote Sens. Environ. 2024, 311, 114290. [Google Scholar] [CrossRef]
- Sankararaman, K.A.; De, S.; Xu, Z.; Huang, W.R.; Goldstein, T.; PMLR. The impact of neural network overparameterization on gradient confusion and stochastic gradient descent. In Proceedings of the 37th International Conference on Machine Learning, Virtual, 13–18 July 2020; Available online: https://proceedings.mlr.press/v119/sankararaman20a (accessed on 4 May 2024).
- Uzair, M.; Jamil, N.; IEEE. Effects of hidden layers on the efficiency of neural networks. In Proceedings of the 2020 IEEE 23rd International Multitopic Conference (INMIC), Bahawalpur, Pakistan, 5–7 November 2020. [Google Scholar] [CrossRef]
- Liu, M.; Chen, L.; Du, X.; Jin, L.; Shang, M. Activated gradients for deep neural networks. IEEE Trans. Neural Netw. Learn. Syst. 2021, 34, 2156–2168. [Google Scholar] [CrossRef]
- Mao, A.; Mohri, M.; Zhong, Y.; PMLR. Cross-entropy loss functions: Theoretical analysis and applications. In Proceedings of the 40th International Conference on Machine Learning, Honolulu, HI, USA, 23–29 July 2023; Available online: https://proceedings.mlr.press/v202/mao23a.html (accessed on 4 May 2024).
- Reyad, M.; Sarhan, A.M.; Arafa, M. A modified Adam algorithm for deep neural network optimization. Neural Comput. Appl. 2023, 35, 17095–17112. [Google Scholar] [CrossRef]
- Guo, X.; Zhang, W.; Zhang, L. Robust structural topology optimization considering boundary uncertainties. Comput. Methods Appl. Mech. Eng. 2013, 253, 356–368. [Google Scholar] [CrossRef]
- Roodposhti, S.M.; Aryal, J.; Lucieer, A. Uncertainty Assessment of Hyperspectral Image Classification: Deep Learning vs. Random Fores. Entropy 2019, 21, 78. [Google Scholar] [CrossRef]
- Maxwell, A.E.; Warner, T.A. Thematic classification accuracy assessment with inherently uncertain boundaries: An argument for center-weighted accuracy assessment metrics. Remote Sens. 2020, 12, 1905. [Google Scholar] [CrossRef]
- Pontius, R.G., Jr.; Millones, M. Death to Kappa: Birth of quantity disagreement and allocation disagreement for accuracy assessment. Int. J. Remote Sens. 2011, 32, 4407–4429. [Google Scholar] [CrossRef]
- Choi, H.; Lee, H.J.; You, H.J.; Rhee, S.Y.; Jeon, W.S. Comparative Analysis of Generalized Intersection over Union and Error Matrix for Vegetation Cover Classification Assessment. Sens. Mater. 2019, 31, 3849. [Google Scholar] [CrossRef]
- He, T.; Zhang, M.; Guo, A.; Zhai, G.; Wu, C.; Xiao, W. A novel index combining temperature and vegetation conditions for monitoring surface mining disturbance using Landsat time series. Catena 2023, 229, 107235. [Google Scholar] [CrossRef]
- Meraner, A.; Ebel, P.; Zhu, X.X.; Schmitt, M. Cloud removal in Sentinel-2 imagery using a deep residual neural network and SAR-optical data fusion. ISPRS J. Photogramm. Remote Sens. 2020, 166, 333–346. [Google Scholar] [CrossRef]
- Kahraman, S.; Bacher, R. A comprehensive review of hyperspectral data fusion with lidar and sar data. Annu. Rev. Control. 2021, 51, 236–253. [Google Scholar] [CrossRef]
- Ji, X.; Han, X.; Zhu, X.; Huang, Y.; Song, Z.; Wang, J.; Zhou, M.; Wang, X. Comparison and Validation of Multiple Medium-and High-Resolution Land Cover Products in Southwest China. Remote Sens. 2024, 16, 1111. [Google Scholar] [CrossRef]
- Li, Z.; Li, L.; Wang, Y.; Man, W.; Liu, W.; Nie, Q. Spatial Change of the Farming–Pastoral Ecotone in Northern China from 1985 to 2021. Land 2022, 11, 2179. [Google Scholar] [CrossRef]
- Wu, F.; Wang, C.; Zhang, H.; Li, J.; Li, L.; Chen, W.; Zhang, B. Built-up area mapping in China from GF-3 SAR imagery based on the framework of deep learning. Remote Sens. Environ. 2021, 262, 112515. [Google Scholar] [CrossRef]
- Nair, P.R.; Kumar, B.M.; Nair, V.D. Classification of agroforestry systems. In An Introduction to Agroforestry: Four Decades of Scientific Developments; Springer Nature: Berlin/Heidelberg, Germany, 2021; pp. 29–44. [Google Scholar] [CrossRef]
- Zhao, D.; Ji, L.; Yang, F.; Liu, X. A Possibility-Based Method for Urban Land Cover Classification Using Airborne Lidar Data. Remote Sens. 2022, 14, 5941. [Google Scholar] [CrossRef]
- Zhao, J.; Wang, L.; Yang, H.; Wu, P.; Wang, B.; Pan, C.; Wu, Y. A land cover classification method for high-resolution remote sensing images based on NDVI deep learning fusion network. Remote Sens. 2022, 14, 5455. [Google Scholar] [CrossRef]
- Rao, A.S.; Radanovic, M.; Liu, Y.; Hu, S.; Fang, Y.; Khoshelham, K.; Palaniswami, M.; Ngo, T. Real-time monitoring of construction sites: Sensors, methods, and applications. Autom. Constr. 2022, 136, 104099. [Google Scholar] [CrossRef]
- Zhang, Y.; Niu, X.; Hu, Y.; Yan, H.; Zhen, L. Temporal and spatial evolution characteristics and its driving mechanism of land use/land cover change in Laos from 2000 to 2020. Land 2022, 11, 1188. [Google Scholar] [CrossRef]
- Zhang, J.; Liu, Z.; Jiang, W.; Liu, Y.; Zhou, X.; Li, X. Application of deep generative networks for SAR/ISAR: A review. Artif. Intell. Rev. 2023, 56, 11905–11983. [Google Scholar] [CrossRef]


| Data Type | Data Name | Data Resolution | Data Source | Data Year |
|---|---|---|---|---|
| Land use dataset | CLCD | 30 m | https://open.geovisearth.com/service/resource/31 (accessed on 12 December 2023) | 2015 |
| GLC | 30 m | https://data.casearth.cn/sdo/detail/6523adf6819aec0c3a438252 (accessed on 12 December 2023) | 2015 | |
| LUCC | 30 m | https://www.resdc.cn/ (accessed on 12 December 2023) | 2015 | |
| Geographical environmental factors | DEM | 1 km | https://zhuanlan.zhihu.com/p/30702123 (accessed on 4 May 2024) | 2017 |
| Slope | 1 km | Author | 2017 | |
| Aspect | 1 km | Author | 2017 | |
| Distance to city | 20 km | Author | 2017 | |
| Distance to county center | 20 km | Author | 2017 | |
| Distance to national highway | 20 km | Author | 2017 | |
| Distance to expressway | 20 km | Author | 2017 | |
| Distance to railway | 20 km | Author | 2017 | |
| Nighttime light intensity | 1 km | https://eogdata.mines.edu/products/vnl/ (accessed on 4 May 2024) | 2015 | |
| Surface reflectance effectively | 30 m | https://data.casearth.cn/thematic/RTU_Data/303 (accessed on 4 May 2024) | 2018 | |
| Average precipitation | 1 km | https://blog.csdn.net/m0_63269495/article/details/135645183 (accessed on 4 May 2024) | 2015 | |
| Normalized Difference Vegetation Index (NDVI) | 1 km | http://www.gisrs.cn/infofordata?id=05b59e69-ba30-4454-a9c0-67ca038fb9f3 (accessed on 6 May 2024) | 2015 | |
| Mean temperature | 1 km | http://www.gisrs.cn/infofordata?id=3f816a8e-ebea-4484-b9e6-c27761fdb85f (accessed on 6 May 2024) | 2015 |
| Land Use | Evaluating Indicator | Dataset | |||
|---|---|---|---|---|---|
| Fusion Data | CLCD | LUCC | GLC | ||
| Cultivated land | OA | 0.894 | 0.746 | 0.789 | 0.741 |
| Kappa | 0.794 | 0.702 | 0.656 | 0.577 | |
| User accuracy | 0.879 | 0.931 | 0.832 | 0.791 | |
| Producer accuracy | 0.897 | 0.746 | 0.789 | 0.741 | |
| IoU | 0.798 | 0.707 | 0.680 | 0.619 | |
| Forest land | OA | 0.919 | 0.902 | 0.851 | 0.704 |
| Kappa | 0.891 | 0.774 | 0.857 | 0.659 | |
| User accuracy | 0.930 | 0.824 | 0.936 | 0.782 | |
| Producer accuracy | 0.925 | 0.902 | 0.851 | 0.704 | |
| IoU | 0.857 | 0.756 | 0.804 | 0.589 | |
| Grassland | OA | 0.930 | 0.794 | 0.728 | 0.584 |
| Kappa | 0.914 | 0.794 | 0.501 | 0.455 | |
| User accuracy | 0.963 | 0.727 | 0.438 | 0.438 | |
| Producer accuracy | 0.907 | 0.915 | 0.728 | 0.584 | |
| IoU | 0.832 | 0.682 | 0.376 | 0.334 | |
| Water area | OA | 0.807 | 0.747 | 0.710 | 0.732 |
| Kappa | 0.750 | 0.690 | 0.714 | 0.615 | |
| User accuracy | 0.758 | 0.719 | 0.764 | 0.583 | |
| Producer accuracy | 0.774 | 0.747 | 0.710 | 0.732 | |
| IoU | 0.620 | 0.578 | 0.583 | 0.481 | |
| Construction land | OA | 0.705 | 0.695 | 0.626 | 0.591 |
| Kappa | 0.700 | 0.616 | 0.619 | 0.510 | |
| User accuracy | 0.726 | 0.642 | 0.702 | 0.551 | |
| Producer accuracy | 0.711 | 0.695 | 0.626 | 0.591 | |
| IoU | 0.577 | 0.501 | 0.495 | 0.399 | |
| Bare land | OA | 0.690 | 0.726 | 0.588 | 0.519 |
| Kappa | 0.764 | 0.195 | 0.369 | 0.491 | |
| User accuracy | 0.800 | 0.224 | 0.284 | 0.482 | |
| Producer accuracy | 0.690 | 0.726 | 0.588 | 0.520 | |
| IoU | 0.625 | 0.207 | 0.237 | 0.333 | |
| Global | OA | 0.869 | 0.791 | 0.771 | 0.698 |
| Kappa | 0.813 | 0.714 | 0.679 | 0.591 | |
| User accuracy | 0.843 | 0.678 | 0.659 | 0.605 | |
| Producer accuracy | 0.817 | 0.788 | 0.715 | 0.645 | |
| IoU | 0.718 | 0.572 | 0.529 | 0.459 | |
Disclaimer/Publisher’s Note: The statements, opinions and data contained in all publications are solely those of the individual author(s) and contributor(s) and not of MDPI and/or the editor(s). MDPI and/or the editor(s) disclaim responsibility for any injury to people or property resulting from any ideas, methods, instructions or products referred to in the content. |
© 2025 by the authors. Licensee MDPI, Basel, Switzerland. This article is an open access article distributed under the terms and conditions of the Creative Commons Attribution (CC BY) license (https://creativecommons.org/licenses/by/4.0/).
Share and Cite
Yang, J.; Jiang, Y.; Song, Q.; Wang, Z.; Hu, Y.; Li, K.; Sun, Y. An Approach for Multi-Source Land Use and Land Cover Data Fusion Considering Spatial Correlations. Remote Sens. 2025, 17, 1131. https://doi.org/10.3390/rs17071131
Yang J, Jiang Y, Song Q, Wang Z, Hu Y, Li K, Sun Y. An Approach for Multi-Source Land Use and Land Cover Data Fusion Considering Spatial Correlations. Remote Sensing. 2025; 17(7):1131. https://doi.org/10.3390/rs17071131
Chicago/Turabian StyleYang, Jing, Yiheng Jiang, Qirui Song, Zheng Wang, Yang Hu, Kaiqiang Li, and Yizhong Sun. 2025. "An Approach for Multi-Source Land Use and Land Cover Data Fusion Considering Spatial Correlations" Remote Sensing 17, no. 7: 1131. https://doi.org/10.3390/rs17071131
APA StyleYang, J., Jiang, Y., Song, Q., Wang, Z., Hu, Y., Li, K., & Sun, Y. (2025). An Approach for Multi-Source Land Use and Land Cover Data Fusion Considering Spatial Correlations. Remote Sensing, 17(7), 1131. https://doi.org/10.3390/rs17071131