Abstract
While most recent work in room instance segmentation relies on orthographic top-down projections of 3D point clouds to 2D density maps, leading to information loss of one dimension, 3D instance segmentation methods based on deep learning were rarely considered. We explore the potential of the general 3D instance segmentation deep learning model Mask3D for room instance segmentation in indoor building point clouds. We show that Mask3D generates meaningful predictions for multi-floor scenes. After hyperparameter optimization, Mask3D outperforms the current state-of-the-art method RoomFormer evaluated in 3D on the synthetic Structured3D dataset. We provide generalization results of Mask3D trained on Structured3D to the real-world S3DIS and Matterport3D datasets, showing a domain gap. Fine-tuning improves the results. In contrast to related work in room instance segmentation, we employ the more expressive mean average precision (mAP) metric, and we propose the more intuitive successfully detected rooms (SDR) metric, which is an absolute recall measure. Our results indicate potential for the digitization of the construction industry.
1. Introduction
Following [1], in computer vision, 3D instance segmentation in point clouds assigns up to one instance label to each point. For each instance, it predicts a semantic class.
Instance segmentation of rooms in indoor building point clouds, as shown in Figure 1, has the potential to improve business processes in the construction industry. It could be applied to generate floor plans, or it could be the first step towards building information models (BIMs).

Figure 1.
Room instance segmentation example: scene 2 from Structured3D. Point clouds were computed from panoramic images. (a) Input point cloud. (b) Ground truth. In the ground truth, colors indicate different room instances. Dark blue is clutter. Scale in meters.
Saving memory and computational resources, many recent approaches perform an orthographic top-down projection of the 3D point cloud into a 2D density map [2,3,4,5,6,7,8,9], resulting in a loss of information. These methods output a 2D floor plan. Such single-view, top-down projection approaches typically fail for point clouds with more than one floor [10], such as staircases, entire buildings, and maisonette apartments with a common room shared by both floors. Without the third dimension, the detection of architectural structures such as stairs becomes more difficult.
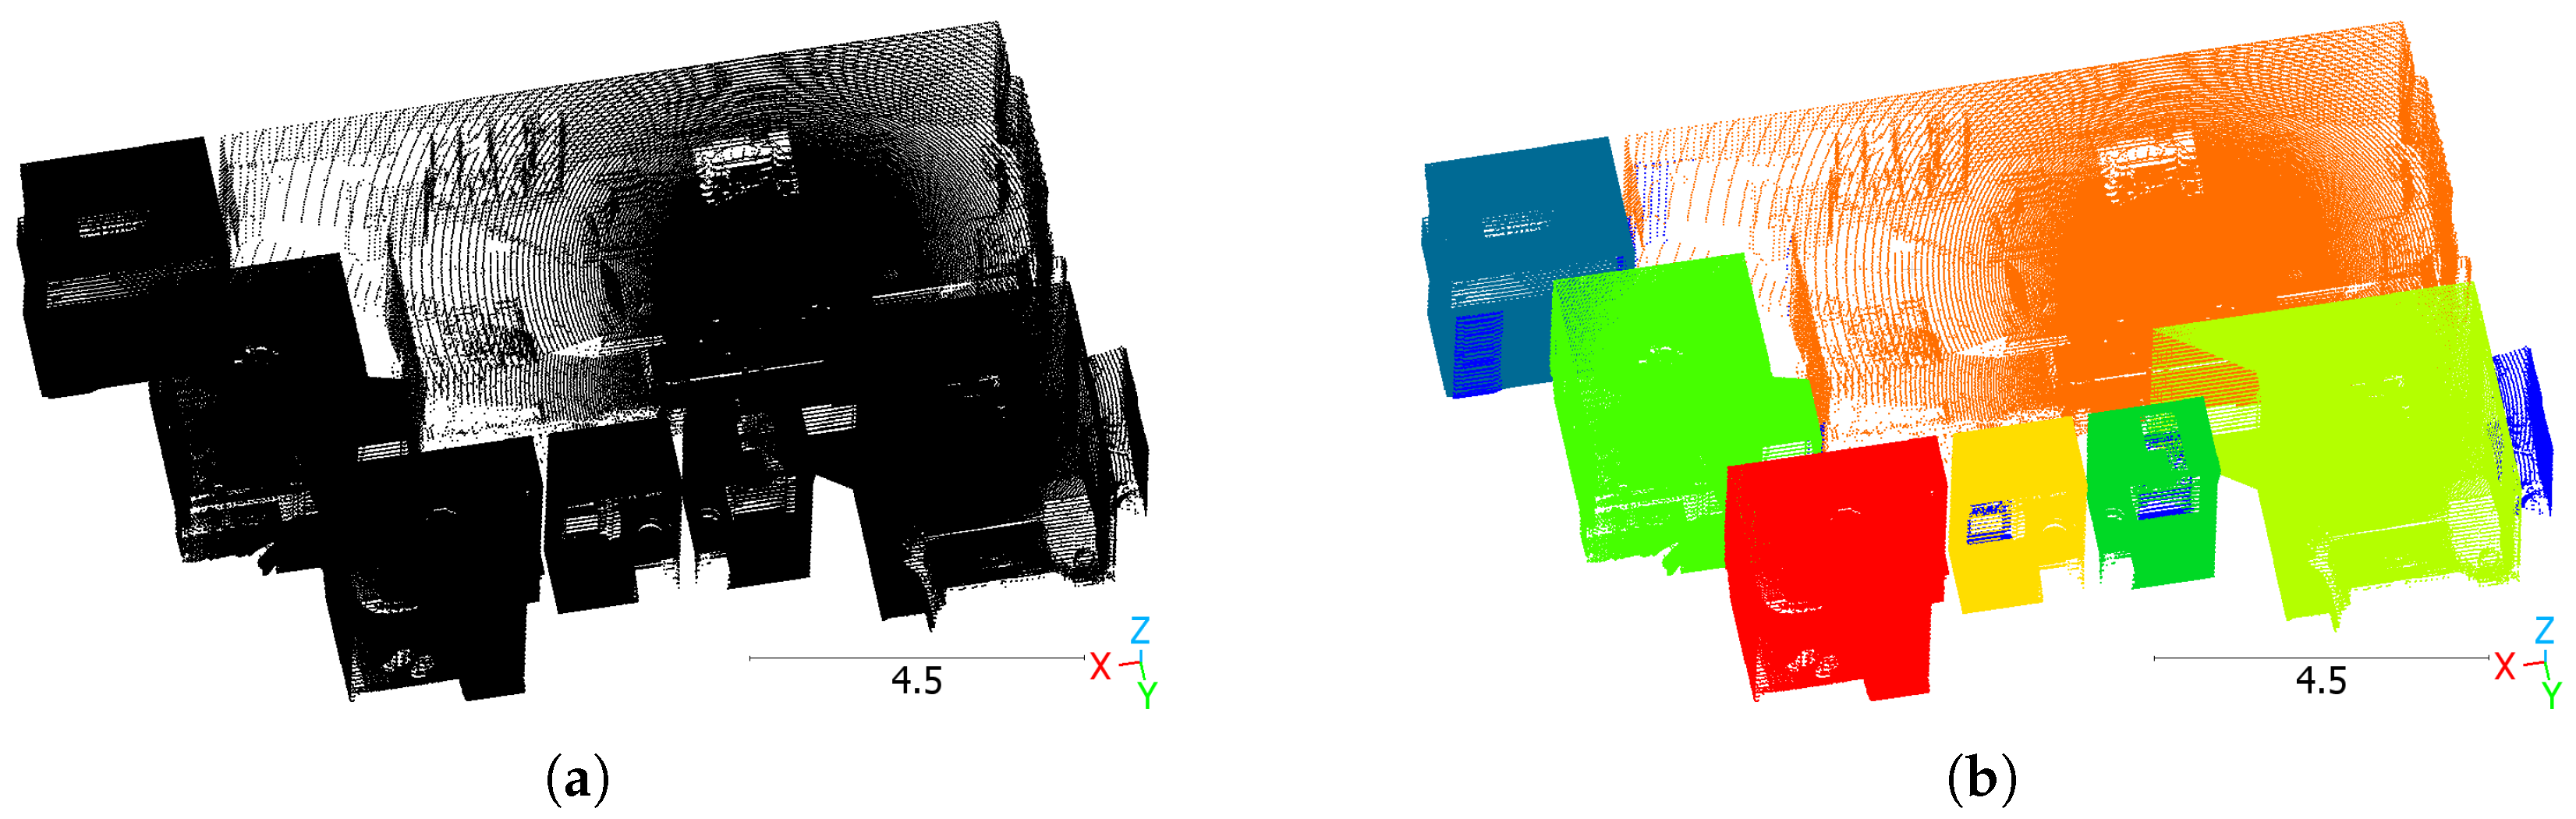
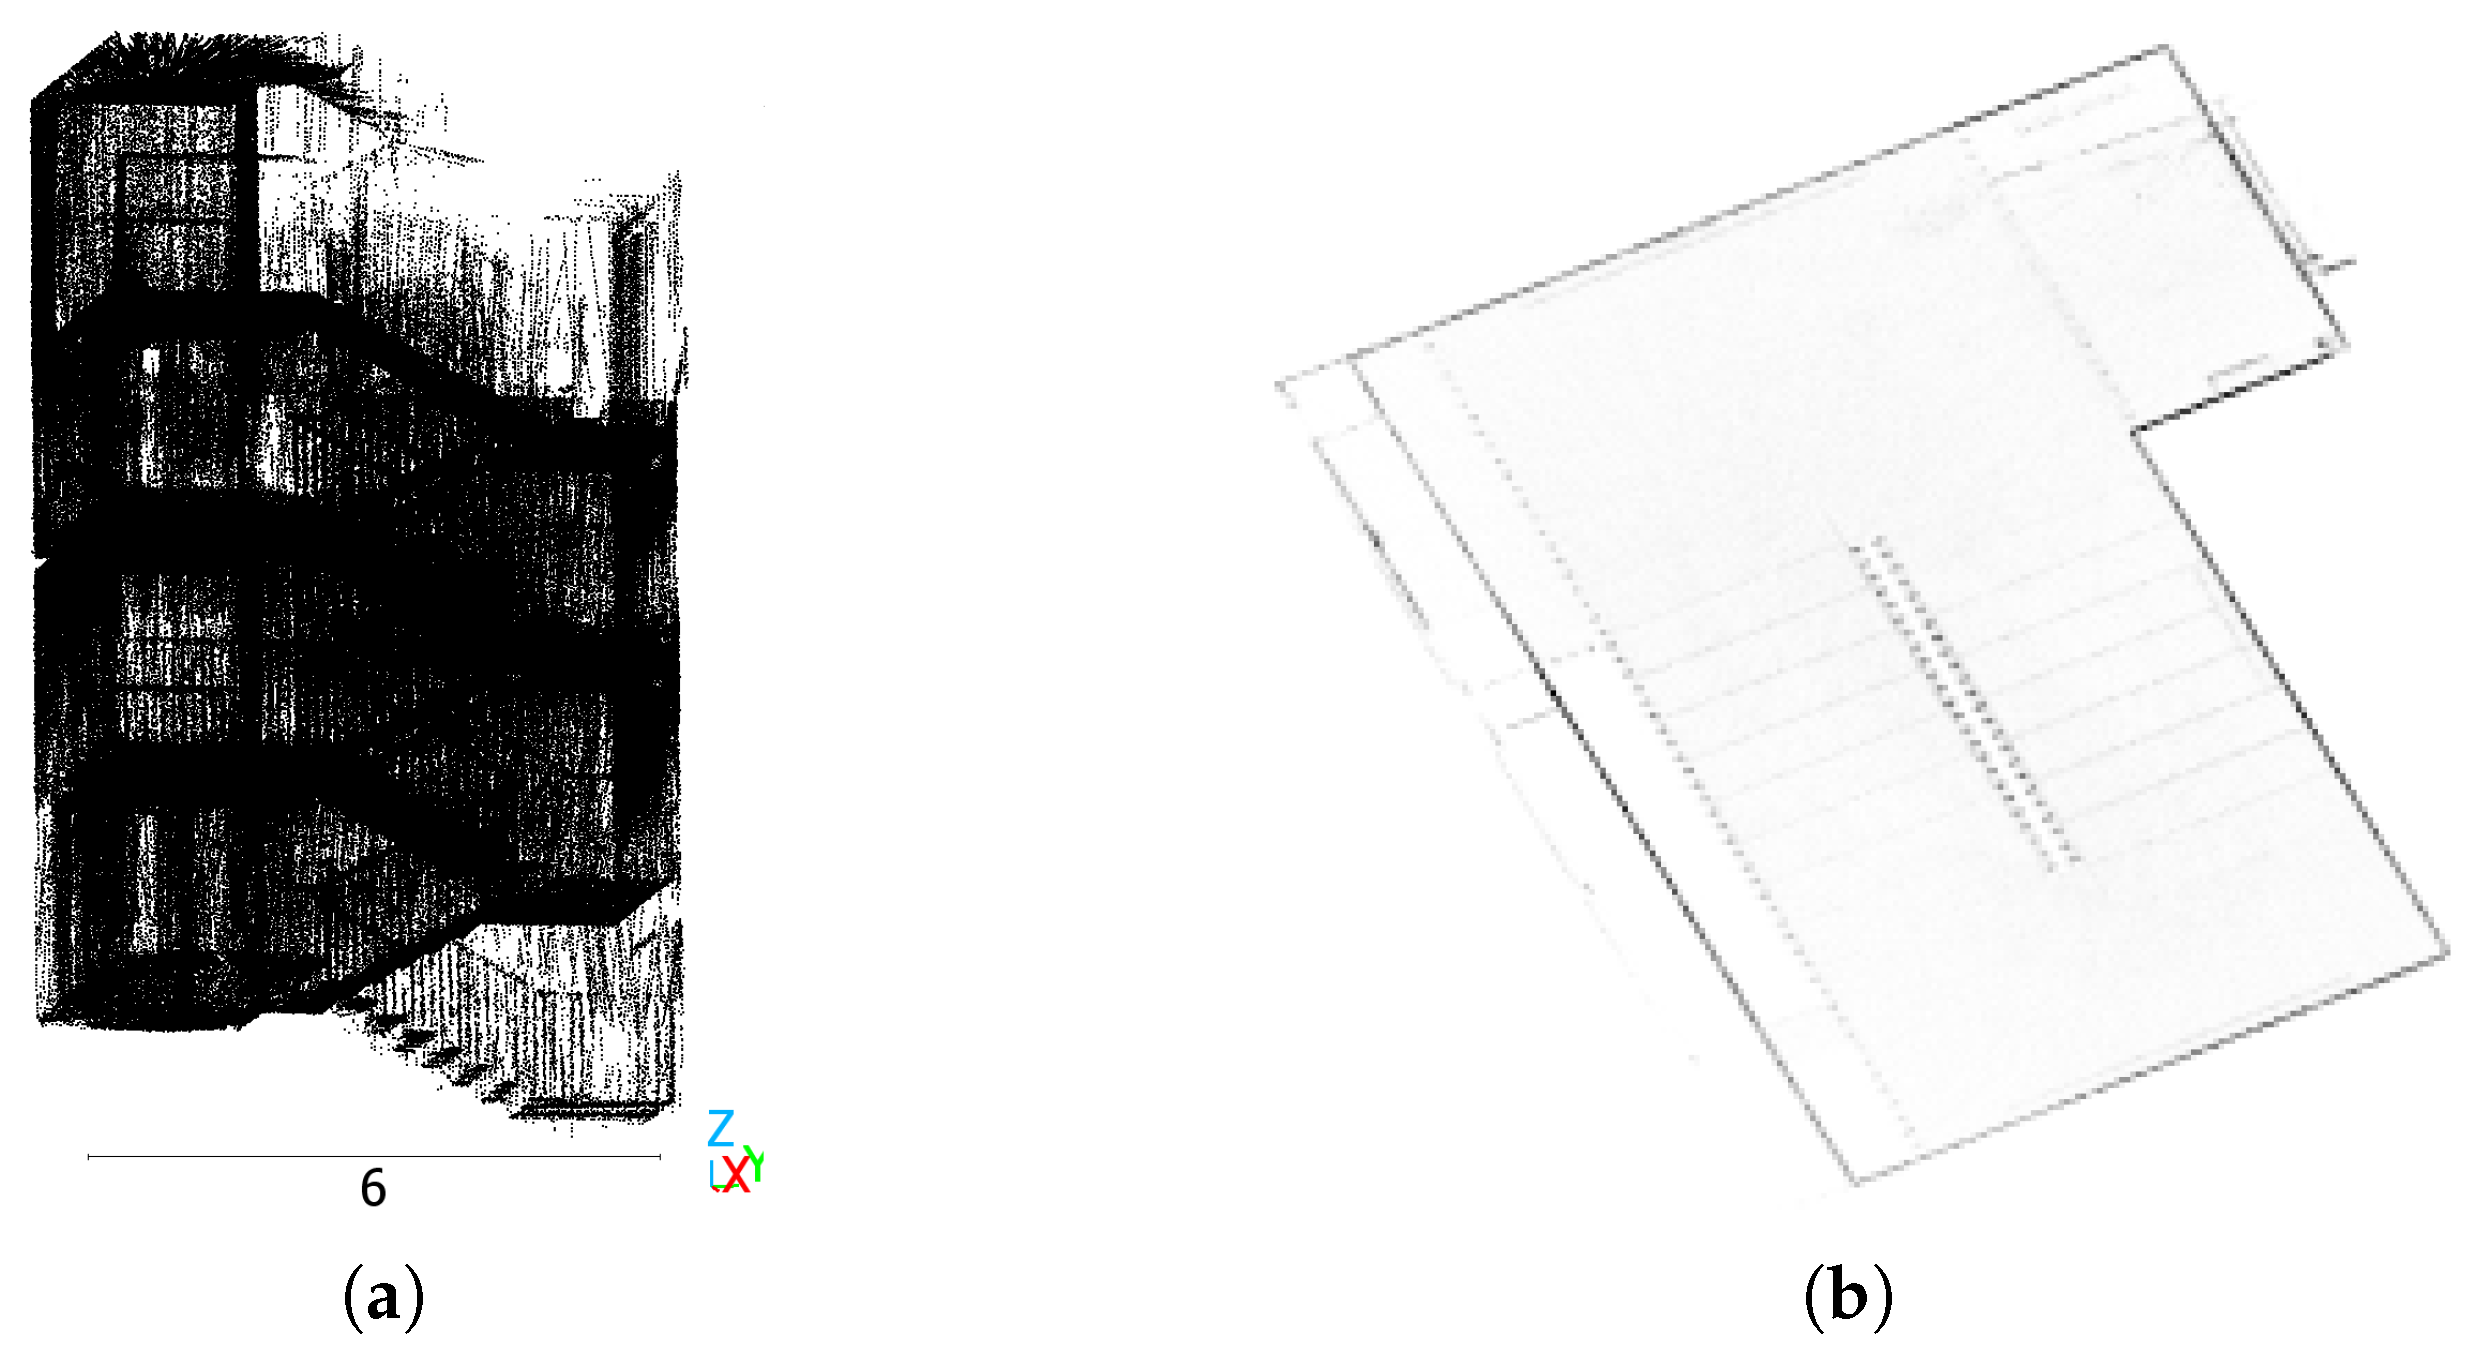
Figure 2 compares two representations of a staircase. Figure 2a shows a 3D point cloud, Figure 2b depicts the top-down orthographic projection of the 3D point cloud, created by the preprocessing of the state-of-the-art method RoomFormer [2]. In Figure 2b, the steps of the stairs are almost invisible, and it is impossible to determine the floor level each pixel belongs to.
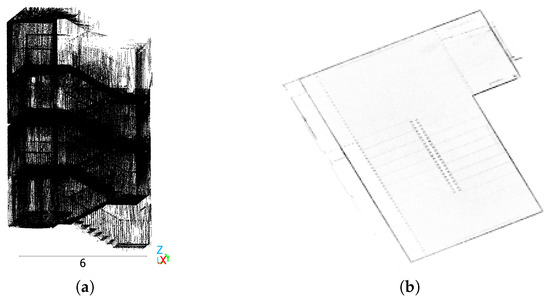
Figure 2.
Comparison of a 3D point cloud and the 2D orthographic top-down projection of a staircase in the Fraunhofer Institute for Physical Measurement Techniques IPM in Freiburg, Germany. (a) The 3D point cloud. Scale in meters. (b) Density map of top-down projection created using the preprocessing of RoomFormer. Its size is 256 × 256 pixels. Colors are inverted to enhance visibility.
Additionally, methods that output predictions with discrete coordinates, such as RoomFormer, require a backprojection of the output to the continuous coordinate input 3D point cloud. This causes a quantization error. With the output size of 256 × 256 pixels of RoomFormer, the quantization error can reach values such as 0.5 m for large scenes, yielding incorrect predictions.
Furthermore, existing approaches to room instance segmentation in computer vision and deep learning suffer from limitations caused by overly strong assumptions, such as the Manhattan assumption [3,11,12] or the assumption of parallelism between the ceiling and the floor [13]. These are not true in real-world scenarios; for example, corners may have angles other than 90° and rooms on the top floor may have sloped ceilings due to sloped roofs, violating the parallelism assumption.
While related work in 2D suffers from limitations, general 3D instance segmentation methods do not rely on the mentioned restrictive assumptions and operate directly on 3D point clouds or voxel grids. Therefore, they do not suffer from the limitations imposed by projection approaches. Despite these advantages, general deep learning techniques for 3D instance segmentation have rarely been adopted, trained, and evaluated specifically for room instance segmentation in buildings. Hence, we apply Mask3D [1], the first transformer-based deep learning instance segmentation model for 3D voxel grids, to the task of room instance segmentation. We aim to only segment room instances, without incorporating predictions of the room type.
Many approaches in room instance segmentation are evaluated using metrics that rely on a constant threshold, such as precision and recall [2,3,4,5,6,7,8,9,12,14,15]. The definitions of true positives, false positives, and false negatives vary. For example, the precision metric used in this work relies on an intersection over union (IoU) threshold of >0.5. This lacks expressiveness since does not change for IoU values higher than the threshold. Therefore, we additionally employ the mean average precision (mAP) metric, which offers a continuous measure of instance segmentation quality, and which is rarely found in the literature on room instance segmentation and floor plan reconstruction.
In summary, our contributions are as follows:
- Conducting the first evaluation of the current state-of-the-art method RoomFormer in 3D, on the Structured3D and S3DIS [16] datasets.
- Optimizing hyperparameters of the Mask3D model on the synthetic Structured3D dataset, and fine-tuning Mask3D on the real-world S3DIS and real-world multi-floor Matterport3D [17] datasets.
- Employing the more expressive mAP metric as implemented in [1], for 3D room instance segmentation.
- Proposing the novel successfully detected rooms (SDR) metric specific to room instance segmentation, which is intuitive to understand.
2. Related Work
2.1. Room Instance Segmentation
Many approaches follow the related floor plan reconstruction task [2,4,5,7] instead of segmenting room instances in 3D. As described by RoomFormer, the floor plan reconstruction task is a 2D instance segmentation of rooms in point clouds, where instance masks are represented as polygons. The output is a 2D floor plan from an orthographic top-down view [2]. The output of floor plan reconstruction can be used to solve the room instance segmentation of point clouds by applying a projection (see Section 3.4).
2.1.1. Heuristic Approaches
Before deep learning methods gained prominence in computer vision research, heuristic methods were commonly employed. Early work by Xiong et al. [18] used voxelized point clouds of building interiors and assumed planar surfaces to estimate walls, floors, ceilings, windows, and doors using heuristic algorithms and logistic regression. Assuming perfectly horizontal floors and ceilings and vertical walls, Turner et al. [13] applied a wall position triangulation algorithm to create a 2D room map from 3D point clouds. Armeni et al. [16] used a heuristic approach to segment rooms by detecting walls as empty space in the point cloud, bounded by two approximately parallel surfaces. Murali et al. [11] created a 3D mesh of indoor environments. After filtering the input point cloud, they determined walls by selecting candidate planes. They employed heuristics to determine the room layout [11]. Yang et al. [10] computed the distance from each voxel to each closest occupied point. Following thresholding of the resulting distance map, spheres were grown inside the 3D model to represent 3D space. Subsequently, adjacent spheres were connected using a topological graph, and the wavefront growth algorithm [19] refined the output. As maxima of the distance maps are located in room centers, and assuming that rooms are connected by narrow spaces such as doors, the method yields the room instance segmentation.
2.1.2. Deep Learning Approaches
Yue et al. [2] classified two-stage deep learning approaches into two categories: Typical top-down approaches rely on segmentation networks, such as Mask R-CNN [20], as the first stage, and then solve shortest path problems or perform other refinement steps to generate the output polygons. Typical bottom-up methods first detect room corners, followed by an optimization problem to detect walls. There are also generative AI approaches [9].
Liu et al. [12] proposed the FloorNet deep learning model architecture, which uses four-channel RGB-D video data captured by a person walking through a house. Then, they used integer programming to vectorize the rasterized output floor plan of the deep learning model [12].
SceneCAD [14] employs a 3D approach, which is simpler but limited to rectangular shapes in the room layout. They followed a bottom-up approach, predicting corners first, then edges, then planar elements. They used a graph neural network to predict a collection of scene-related edges. The edges of a plane are identified by a cycle-finding algorithm. Without heuristic postprocessing, a multilayer perceptron selects which of the candidate planes to include in the model output [14].
With the goal of reducing the amount of training data and hyperparameters required, Hampali et al. [21] first generated proposals for 3D models and poses using object detection models. Subsequently, they employed a variant of the Monte Carlo tree search (MCTS) algorithm to select the best candidates [21].
Chen et al. [4] proposed Floor-SP, which is a system that utilizes aligned RGB-D scans as input. First, they projected the 3D point cloud along the z-axis to obtain a 2D orthographic top-down density map. Including the normal vectors, they applied the 2D instance segmentation network Mask R-CNN [20] to obtain room instances. Subsequently, they determined the polygons from the instance predictions by solving an optimization problem. Finally, they employed heuristics to merge the polygons into the output floor plan [4].
Similarly, MonteFloor [5] starts by running Mask R-CNN on 2D point cloud density maps to obtain room proposals. After converting the instance mask predictions into polygons, they applied MCTS to determine a set of polygons that best matched the top-view density map. The MCTS algorithm is guided by a neural network that predicts the IoU [5].
HEAT [7] is a transformer-based approach. They merged features from a ConvNet backbone with edge candidates using the deformable transformer approach [22], filtered them, and learned structural patterns using transformer decoders. They claimed to outperform all previous fully neural methods, and achieved performance similar to MonteFloor [5]. The runtime is more than three orders of magnitude smaller compared to Floor-SP and MonteFloor [7].
Jin et al. [6] applied Mask R-CNN to 2D point cloud density maps and employed a generative adversarial network-based approach to refine the segmentation masks. They improved precision, recall, and F1 scores over Floor-SP and MonteFloor [6].
As the current state-of-the-art method, RoomFormer is 10 times faster than HEAT [2]. It utilizes polygons, thereby it does not rely on the Manhattan assumption. First, the point cloud is projected onto the ground plane to obtain a 2D density map, which is sent through a feature backbone. It is then sent through a transformer, where two-level queries are used to detect both room polygons and corners. A feedforward neural network predicts a class for each room polygon. Su et al. [3] claimed that RoomFormer generates inaccurate room shapes. Talotta et al. [23] claimed that the performance of RoomFormer, which was trained only on synthetic data, would be significantly diminished on real-world data. Therefore, they first trained on synthetic data, as in the previous work, and then fine-tuned on a real-world dataset with a lower learning rate [23].
In 2023, Su et al. proposed SLIBO-Net [3]. As input data, they utilized 2D density maps along with geometric priors, which represent walls and are extracted from the 3D point cloud. To facilitate training, they employed a data structure that slices the floor plan into multiple boxes. Two transformers and postprocessing produced the output floor plan. The method outperformed RoomFormer in precision, recall, and F1 for room detection. However, SLIBO-Net can only handle Manhattan layouts [3].
Kellner et al. [24] predicted 3D room wireframes by first removing room interiors using a neural network. By projecting the point cloud to 2D, regions of interest were identified. Subsequently, the results were backprojected to 3D and predictions were refined.
PolyWorld Remastered [8] is a graph neural network approach. It runs on 2D top-down projection results and predicts the strength of relationships between pairs of vertices in the scene. It subsequently uses an optimal transport problem [8].
Other related work involves producing entire 3D BIM using a graph filtering problem [15], or employing generative diffusion models [9].
In conclusion, a significant amount of recent research employs deep learning. Many approaches project into a 2D density map [2,3,4,5,6,7,8,9], and other approaches run directly on 3D data [11,12,14,16,18,21]. Some approaches use RGB data [4,8,12,15,21]. Only few approaches were evaluated on real-world data [2,4,10,12,23]. Evaluations on multi-floor real-world datasets are rarely seen.
2.2. 3D Instance Segmentation
Machines can improve their vision understanding by incorporating a third dimension in the data [25]. Additionally, this eliminates the need to reduce the dimensionality of the point cloud using projection algorithms. However, the use of a third dimension also increases the computational and memory complexity. As noted in [26], because point clouds are sparse and unordered, techniques other than those used in 2D image segmentation have been developed. Guo et al. [25] and Lu et al. [27] provided an introduction to general 3D methods. Lu et al. [27] classified related work in three categories: proposal-based, grouping-based, and query-based. Query-based methods are based on transformer architectures [27].
Sun et al. [28] proposed SPFormer. The method clusters potential features generated by a U-Net architecture into superpoints. Using query vectors and transformers, the top-down architecture directly predict instances, avoiding the use of object detection or semantic segmentation, which would limit the performance [28].
An example of a one-stage network for 3D instance segmentation is OSIS [29]. The approach does not use any computationally expensive pre- or postprocessing, thereby increasing the inference speed. Another advantage is the increased use of learned prediction rules instead of hand-crafted algorithms [29].
Mask3D reached 56.6% mAP on area 5 of the real-world S3DIS dataset for the task of room interior object instance segmentation. It was used in the experiments of this work (see Section 3). As the first transformer-based model for 3D instance segmentation and in contrast to other deep learning methods, it predicts instance segmentation masks without voting or geometric clustering.
The Query Refinement Transformer [27] first generated superpoint features using the encoder and sampled seed points from the input point cloud. Then, it initialized queries and sent them through the decoder to generate final instance masks. It reached 57.7% mAP on area 5 of the real-world S3DIS dataset for room interior object instance segmentation [27].
OneFormer [30] is a unified model that addresses three tasks at once: instance segmentation, semantic segmentation, and panoptic segmentation. Like SPFormer, it uses a 3D U-Net backbone to compute superpoint features. By passing instance and semantic queries through a transformer decoder, it generates predictions for all three tasks. It also proposed a more efficient disentangled matching strategy that does not rely on the Hungarian algorithm, which makes use of the superpoints. It reached 58.7% mAP on area 5 of the real-world S3DIS dataset for room interior object instance segmentation [30].
SphericalMask [26] represents instances by defining a polygon center and rays from the center to the polygon edges. After feeding the input point cloud through the 3D backbone, it predicted coarse instance masks. It then transformed the input point cloud to a spherical coordinate system and refined the mask prediction using an algorithm called radial point migration. The method moves and thus migrates points towards the instance center to include them in the instance mask, or away from the center to exclude them from the instance mask. It reached 60.5% mAP on area 5 of the real-world S3DIS dataset for room interior object instance segmentation [26].
3. Method
The primary objective of this research is to enhance the performance of the 3D instance segmentation model Mask3D, with the aim of predicting room instance segmentation masks in indoor building point clouds. Therefore, this work trains the Mask3D model and optimizes its hyperparameters.
3.1. Mask3D
Mask3D consists of a sparse convolutional Res16UNet34C feature backbone, which resembles the U-Net [31] architecture and outputs features at different scaling levels. Features are sent to a stacked transformer decoder as implemented in [32,33]. Each decoder block consists of mask modules that predict binary segmentation masks and classify instances. After the mask module, the backbone voxel features, the binary instance masks, and the instance queries from the mask module are sent to a query refinement module. Query refinement consists of three steps in the following order: cross-attention, self-attention, and a fully connected feedforward network. Three iterations are performed through the decoder. The model output is a binary segmentation mask for each detected instance, along with semantic class probabilities for each instance. Each mask encompasses all points of the input point cloud.
Mask3D leverages the Minkowski Engine library [34] for sparse tensor operations. The model has ≈39.6 million parameters. As the first transformer-based model for 3D instance segmentation and having been recently published, Mask3D is an interesting candidate to solve this task in 3D.
3.2. Model Input
The model input is an indoor building point cloud containing only occupancy information. As in [1], the model outputs instance segmentation masks along with a semantic class prediction for each instance. Since predicting room types is beyond the scope of this work, one placeholder semantic class is utilized.
As room shapes have a larger spatial extent and are coarser than a room’s interior, we downsample and voxelize point clouds, which reduces the level of detail in the scene. We expect this to ease the learning of room shapes, and we evaluate different voxel sizes for downsampling. We also expect that downsampling reduces the influence of varying laser scanner or depth camera capturing patterns between the datasets, as well as the effects of varying point densities. Reducing the amount of data reduces the runtime and memory requirements of the model.
3.3. Evaluation Metrics
Using constant IoU thresholds for metrics lacks expressiveness, as the segmentation quality does not influence the metric as soon as the minimum IoU threshold is reached. Therefore, in contrast to related work, we report room instance segmentation performance using the mean average precision (mAP) metric, which is the strictest and most fine-grained measure used in our work for measuring instance segmentation quality. Hence, it was used as the main decision metric for hyperparameter decisions and for selecting model weight checkpoints from training runs. For more specific analysis, we also report , precision, recall, F1, and IoU metrics. Being easier to understand, we introduce the successfully detected rooms (SDR) metric, which is an absolute recall measure.
In the Mask3D paper, only ground truth instances with a minimum of 100 points were considered. In this work, to enhance the significance of the metrics, all instances were included in the evaluation. All evaluations were performed in 3D.
3.3.1. Common Instance Segmentation Metrics
The ScanNet mAP metric variants [35] were employed as implemented in Mask3D. The mAP is based on the AP metric , which is computed for a single semantic class c at IoU threshold . iterates over pairs of ground truth and predicted instances. A pair is considered a match if the IoU exceeds 0.5. If there are multiple matches for the same ground truth instance, the one with the highest confidence score is considered a true positive, and the other predictions are considered false positives. True positives, false positives, and false negatives are computed based on segmentation mask voxels. A precision–recall curve is created, with each match creating a point. is the area under the resulting curve.
The metric is the arithmetic mean of all across all semantic classes. For example, describes the instance segmentation performance at an IoU threshold of 50%. The mAP metric is the arithmetic mean of all across all semantic classes and all IoU thresholds from 0.5 to 0.9 with a step size of 0.05. Equations (1)–(3) describe the computation. The mAP and metrics were computed per batch and averaged over the dataset split. We set the test batch size to 1.
The mean match intersection over union (mmIoU) metric was implemented following RoomFormer. The evaluation iterates over pairs of ground truth and predicted instances that share the same semantic class. For each ground truth instance, the pair with the highest IoU was determined. If the IoU exceeded 0.5, it was considered a match. The mmIoU is the arithmetic mean of the IoUs of all matches across the dataset split. If there are no matches between model predictions and ground truth, we set mmIoU to 0.
The implementation of instance mean precision and recall follows Mask3D. As for the mmIoU, for each ground truth instance, the pair of prediction and ground truth instance with the highest IoU was determined. If the highest IoU exceeded 0.5, the pair was counted as a true positive. Otherwise, it was counted as a false positive. In contrast to Mask3D and following RoomFormer, the IoU threshold was changed from ≥0.5 to >0.5 to ensure a unique assignment. Precision and recall were calculated per semantic class, and the results were aggregated via the arithmetic mean, yielding mean precision and mean recall .
In this work, the mean F1 score is calculated by combining and into a single metric using the harmonic mean. It is set to 0 if precision and recall are 0.
The experiments in the Mask3D paper excluded NaN values from averaging for the mAP score variants. In this work, other values were used instead of NaN to more accurately reflect the contribution of the individual class or dataset item to the mean. The revised computation enhances the representativeness of the metric for the model performance. Appendix B.1 provides the details. This effect is expected to be negligible in later training epochs when the model has learned to predict meaningful instances.
3.3.2. Successfully Detected Rooms (SDR)
While the aforementioned metrics are suitable for comparing the segmentation performance of models, they are not intuitively easy to understand. Hence, this work introduces a new metric for this task, named successfully detected rooms (SDR), with a straightforward computation algorithm. SDR can be thought of as an absolute recall measure, quantifying the number of rooms that the model missed detecting per scene. The minimum value of SDR is the negative number of rooms in the scene. The maximum value is 0. For example, a value of −4 indicates that the model missed detecting four room instances per scene. SDR uses the same matching algorithm as the instance mean precision and mean recall metrics, with a threshold of . The metric does not account for false positive predictions. Higher values indicate better instance segmentation quality. Appendix B.2 illustrates the computation.
3.4. Obtaining Instance Segmentation from Floor Plan Reconstruction Output
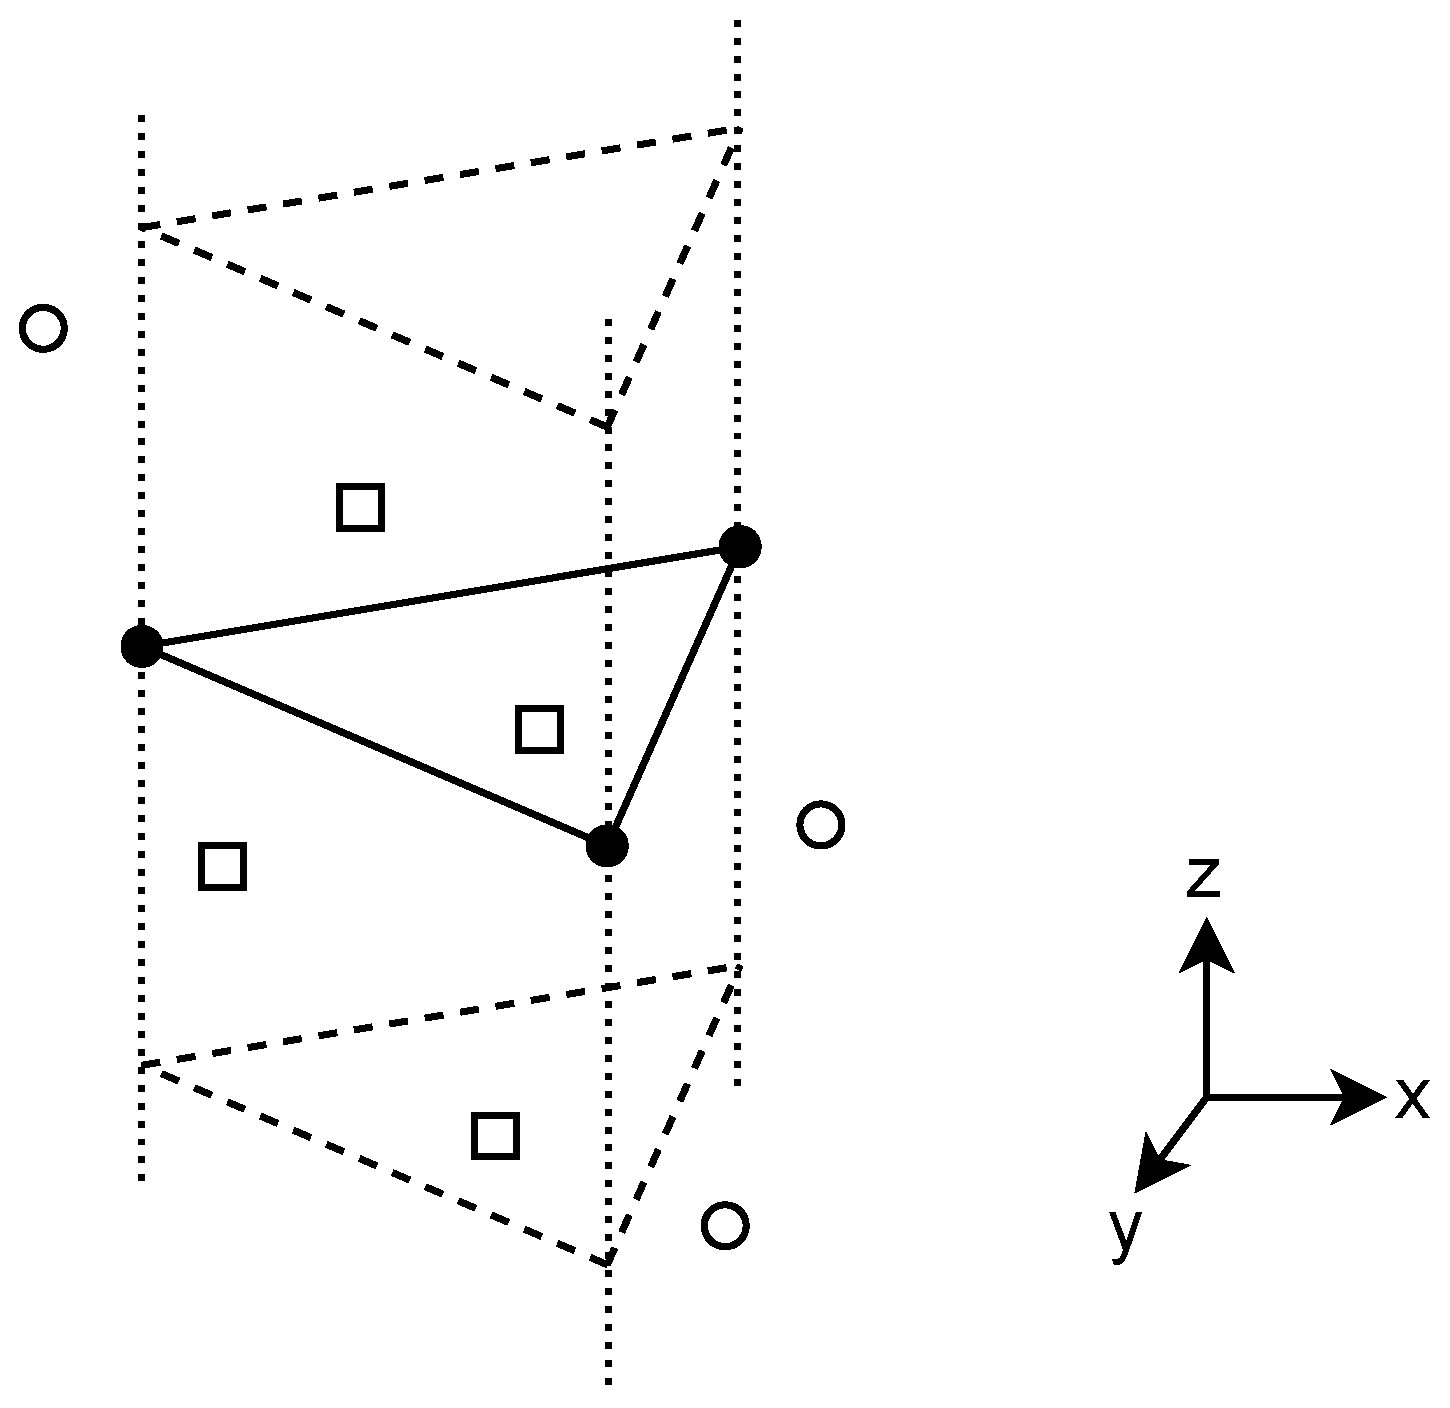
As described in Section 2.1, many approaches solve the related floor plan reconstruction task instead of room instance segmentation of point clouds. Expanding the 2D floor plan infinitely along the vertical axis to determine the room instance prediction for all points of the point cloud that are located inside the expanded volume, and neglecting the small quantization error, the floor plan reconstruction and 3D room instance segmentation tasks are equivalent. This holds assuming that the input point cloud contains one floor and that all walls are perpendicular to the ground, which is true for the Structured3D dataset. Figure 3 visualizes the procedure for one example output polygon of the floor plan reconstruction task.

Figure 3.
Obtaining the instance segmentation prediction from a floor plan reconstruction output polygon (shown with solid lines and full circles at the corners). Dashed lines show the infinite expansion of the polygon along the z-axis. Squares indicate points that are located inside the polygon, belonging to the polygon’s instance prediction. Empty circles indicate points that are located outside.
4. Experiments
4.1. Datasets
4.1.1. Structured3D
Structured3D is one of the largest publicly available datasets of indoor 3D building models. It contains 3500 scenes of apartments, with a total of 21,835 rooms provided. The dataset contains perspective and panoramic 360° RGB and depth images in different lighting situations from different perspectives. Annotations include camera positions and 15 room type annotations (living room, kitchen, bedroom, bathroom, balcony, corridor, dining room, study, studio, store room, garden, laundry room, office, basement, garage), and labels for outwalls, doors, and windows. Moreover, it includes information about 3D primitives such as junctions, lines, and planes. The RGB-D images have been rendered photorealistically, and the annotations were generated automatically. Thus, it is a synthetic dataset. Only single-floor scenes are comprised. As stated in [2], the dataset includes both Manhattan and non-Manhattan layouts. Following the supplementary of Structured3D, we used scenes 0 to 2999 for training, scenes 3000 to 3249 for validation, and scenes 3250 to 3499 for testing. The dataset preprocessing pipeline is detailed in Appendix A.
4.1.2. S3DIS
S3DIS or BuildingParser, published in 2016, is a real-world dataset of 3D indoor building models covering . It is publicly available and consists of point clouds from six areas captured in different buildings with different architectural styles. It primarily consists of office and conference areas. No Manhattan assumption is made.
The dataset is mainly composed of single-floor scenes. However, three of the six areas contain building structures that span more than one floor, including stairways. Area 4 consists of three rooms on an upper second floor. Following [36], areas 1–4 and area 6 were used for training. Area 5 was used for testing. Therefore, the test split included only building structures belonging to single floors.
First, all point clouds of the individual rooms were loaded into CloudCompare [37]. The single room point clouds were merged into one encompassing point cloud covering the entire area, and a scalar field describing the room instance ID was added. An additional scalar field was added to indicate the room type. As this work does not predict a room type, it was set to 1 for all points. The coordinates were scaled by a factor of 1000 to yield millimeter scaling for the input to the subsequent dataset preprocessing (Appendix A.2 and Appendix A.3), as with Structured3D.
4.1.3. Matterport3D
The Matterport3D dataset provides RGB-D scans of 90 entire real-world houses. In contrast to Structured3D and S3DIS, Matterport3D includes many scenes that span multiple floors. A computed point cloud file is provided for each of the manually defined regions which correspond to rooms. The "trainval" split was used for training, and the test split was used for testing. The scenes included in each split can be found in the examples within the Matterport3D supplementary. Single-room point clouds were merged, and the subsequent preprocessing detailed in Appendix A.2 and Appendix A.3 was applied.
4.2. Mask3D
4.2.1. Training Details
As in the experiments reported in the Mask3D paper, the parameters were optimized using AdamW [38]. An exponential learning rate scheduler [39] was used for all datasets, as it resulted in a faster loss decrease on Structured3D than the one-cycle learning rate scheduler [40] employed in the Mask3D paper. The initial learning rate was set to 0.0001. The factor was tuned manually during initial experiments on Structured3D, and , as proposed in Mask3D, yielded the best results found in the mAP metric. As in the Mask3D paper, the learning rate was reduced after each batch.
For Structured3D and S3DIS, the batch size was set to 16. For Matterport3D, it was set to 8. Entire scenes were used as batch items.
In Mask3D, the number of queries is the maximum number of instances that can be detected. As shown in Table 1, its value was based on the maximum number of rooms per scene in the dataset, plus an additional margin.

Table 1.
Maximum number of rooms per dataset, and chosen number of queries for Mask3D.
Since room type prediction is beyond the scope of this work, a single semantic class was used.
For experiments on Structured3D, the same data augmentations as those used in the experiments of the Mask3D paper were applied to the training split:
- Scale the input point cloud [42]. Randomize the scaling factor between ±0.1 for each of the three axes.
- Rotate the input point cloud around the z-axis [42]. Randomize the rotation angle between ±180°.
- Rotate the input point cloud around the x- and y-axes [42]. Randomize the rotation angle between ±7.5°.
The amount of data augmentation was increased for S3DIS and Matterport3D, as they contain fewer scenes and to reduce overfitting:
- Randomly drop points from the input point cloud [42]. Drop 10% of the points.
- Scale the input point cloud [42]. Randomize the scaling factor between ±0.3 for each of the three axes.
- Rotate the input point cloud around the z-axis [42]. Apply the operation with a probability of 0.75. Randomize the rotation angle between ±180°.
- Rotate the input point cloud around the x- and y-axes [42]. Randomize the rotation angle between ±15°.
4.2.2. Finding Best Downsampling Voxel Size on Structured3D
The choice of voxel size is a trade-off between the amount of detail in the data, memory usage, processing time, and quantization error when backprojected to the full-resolution point cloud. The larger the voxel size, the smaller the memory usage and the smaller the expected effect of the LiDAR sensor’s capturing pattern. The voxel size was tuned for optimal validation split mAP. We considered the following voxel sizes: 0.1 m as previously selected in [43], 0.15 m, and 0.2 m.
For each of the voxel sizes, the model was trained for 30 epochs on Structured3D. No overfitting was observed. Table 2 reports the metrics for the epoch with the highest mAP. The training duration per epoch is the mean over all epochs and was measured on an A100-SXM4-80GB GPU by NVIDIA, Santa Clara, CA, USA.
Table 2.
Mask3D training results on Structured3D for different voxel sizes. Metrics were computed on the validation split.
We observed that a voxel size of 0.15 m performs best. This can be explained as follows: Most room shapes are simple and have a large spatial extent. The furniture inside the rooms usually has a more complicated shape and a smaller spatial extent. When the voxel size is small, many details of the furniture are preserved, complicating the process of learning the fundamental room shape, as the model has to learn to ignore the furniture. Hence, a larger voxel size is beneficial. However, if the voxel size is increased to a too large extent, the amount of detail in the room shape becomes too small, making it more challenging to learn the fundamental room shape. This is evident in the lower scores of the 0.2 m voxel size. A voxel size of 0.15 m seems to be a good compromise.
4.2.3. Extensive Training on Structured3D
Training of the best found voxel size (0.15 m) was continued until 150 epochs were reached and the model converged. Table 3 shows the metrics for the checkpoint with the highest validation mAP. This checkpoint was used for all subsequent experiments.
Table 3.
Mask3D training results on Structured3D after 150 epochs for a voxel size of 0.15 m. Metrics are computed on the validation split.
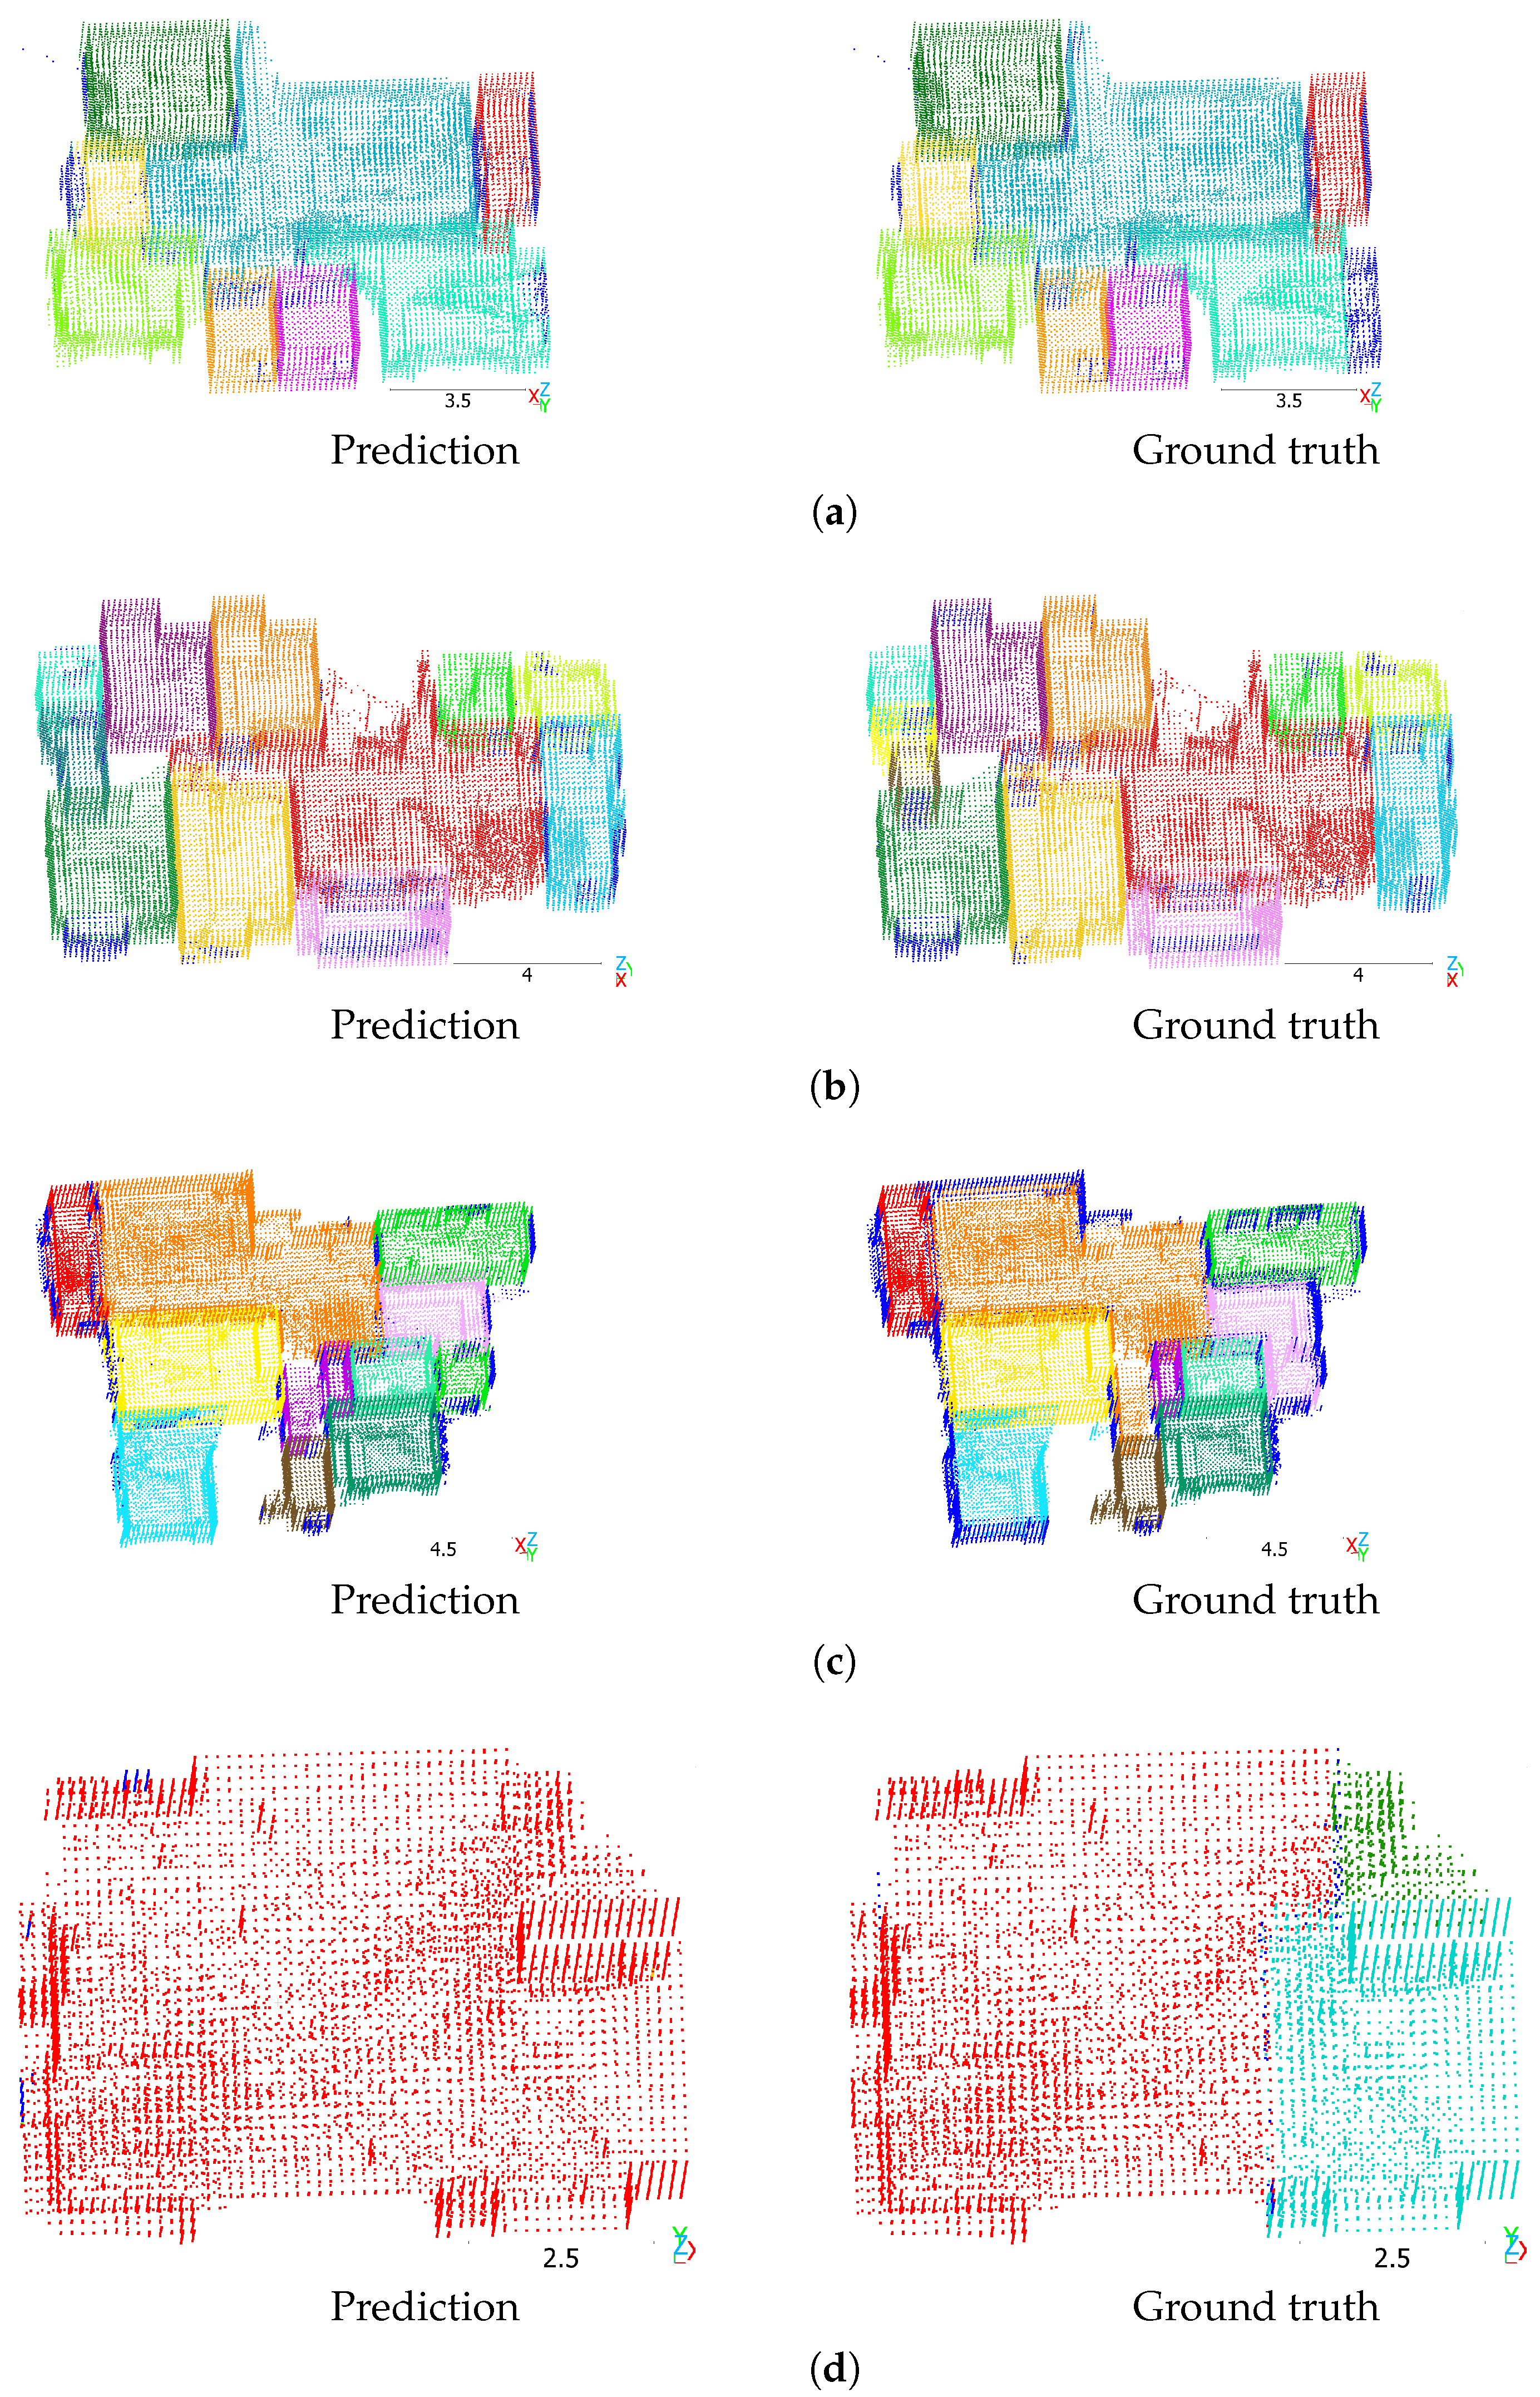
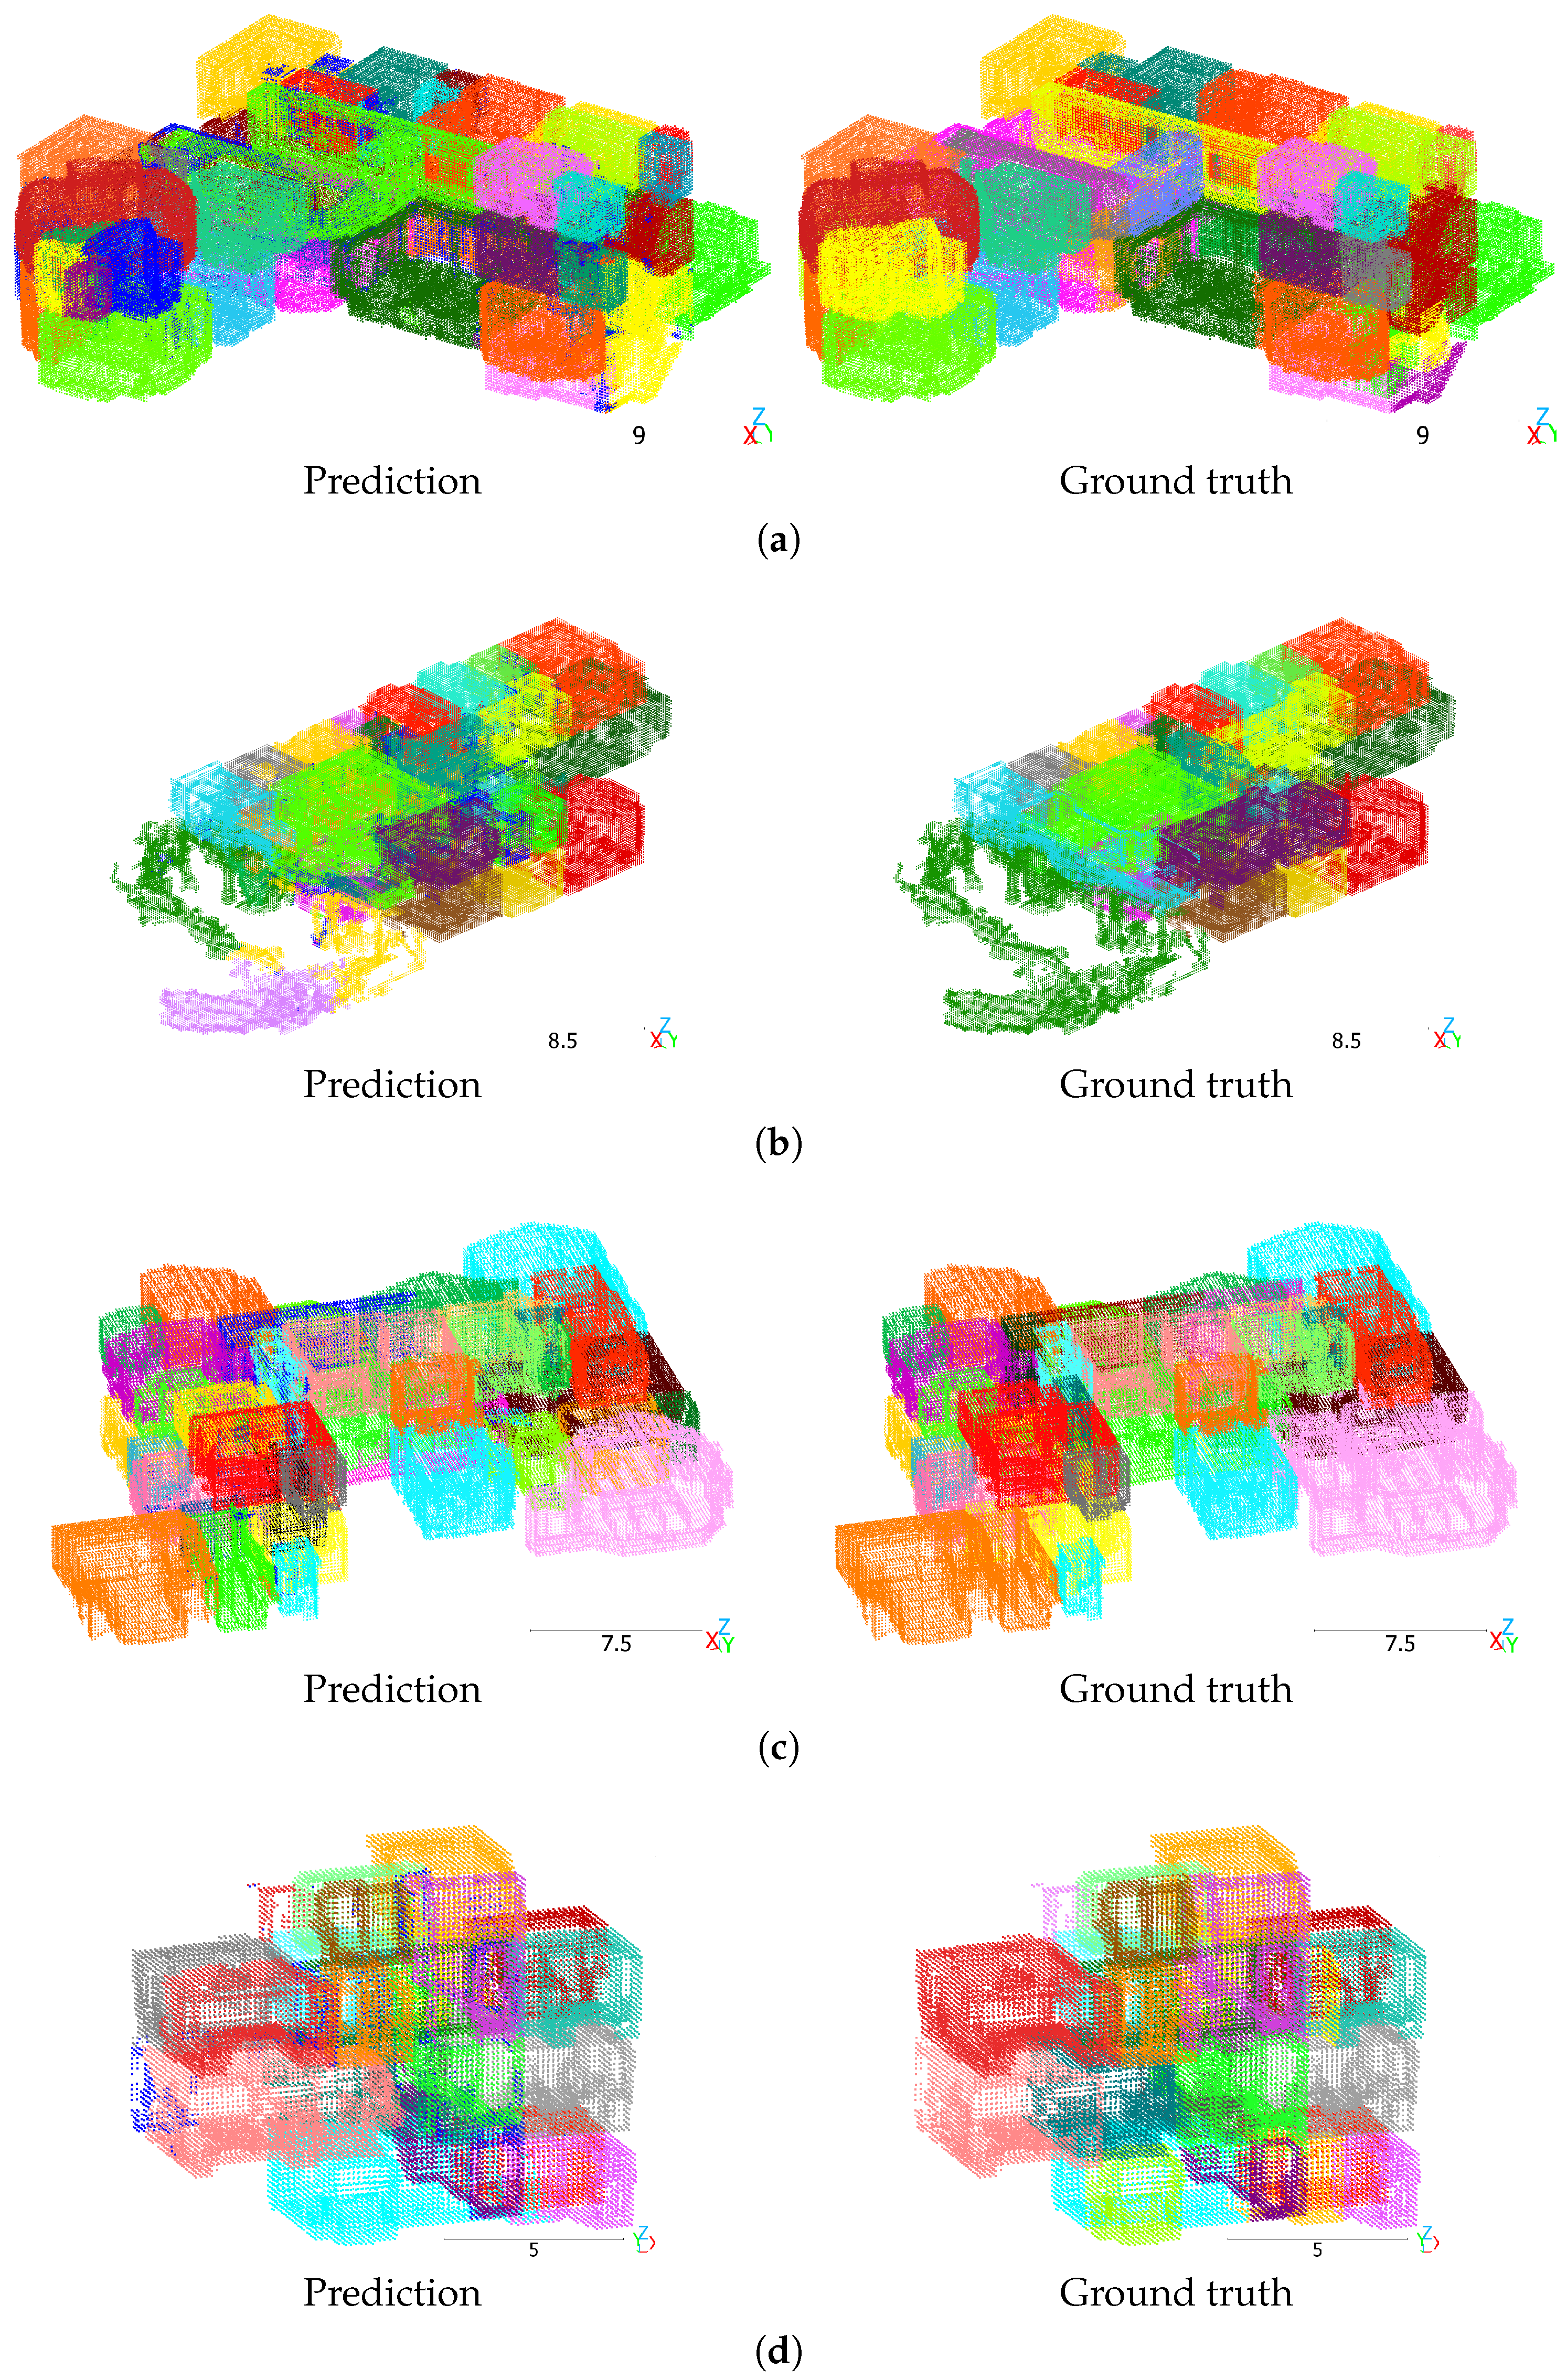
Figure 4a shows a high-quality prediction and ground truth of a multiroom scene from the Structured3D validation split. The rooms were precisely segmented, and the few single voxels in the top left outside the apartment were correctly predicted as clutter. However, the model incorrectly predicted a few voxels of the middle left room (yellow), the top right room (red), and the bottom right room (cyan) as clutter that are part of the rooms, or vice versa.
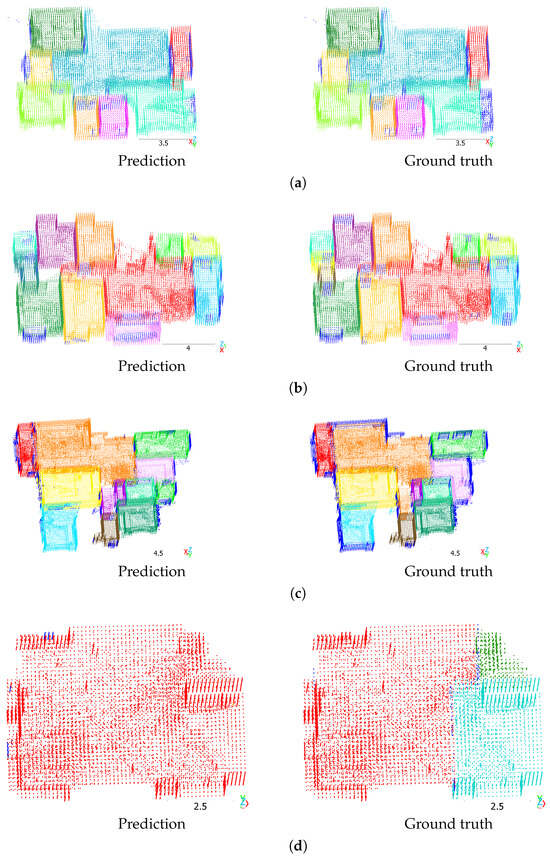
Figure 4.
Mask3D predictions on the Structured3D validation split. Scenes: (a) 3003, (b) 3022, (c) 3173, (d) 3249. Different colors denote different room instances. Dark blue indicates clutter. Scale in meters.
To illustrate the limits of the predictions with our best-found hyperparameter configuration, Figure 4b–d show examples of scenes with low mAP scores. In Figure 4b on the left side, the model predicted the yellow and brown room as one room instead of two. In Figure 4c, the model included more voxels belonging to the walls in the room prediction than are given in the ground truth. Furthermore, the large orange room in the ground truth is partly predicted as the adjacent pink room. In Figure 4d, the model predicted one room instead of three, and it incorrectly predicted few voxels in the top left as clutter.
While the model generally performed well in qualitative results, even segmenting the doors between rooms in many cases, it occasionally predicted room voxels as clutter incorrectly. Furthermore, the model occasionally predicted voxels labeled as “outwall” as belonging to rooms, which is correct from an application point of view. However, this behavior was penalized by the dataset annotations, as the “outwall” class is excluded from the room instances. In this case, the difference between the predicted and ground truth segmentation masks is a limitation of the dataset, which hinders learning through the loss and incorrectly decreases the metrics.
Given that most room voxels belong to walls, ceiling, and floor of the room, and that most room volume is empty space, such incorrectly predicted voxels have a significant influence on the metrics. Considering the predominantly good qualitative results, the mAP score is lower than expected. This may additionally be due to its computation, which penalizes the model for multiple predictions of the same ground truth instance. For each prediction, the evaluation iterates over all ground truth instances. If there are multiple pairs with an IoU above 0.5, the one with the lower confidence is considered a false positive, which also affects the and metrics. In the predictions shown in this paper, the voxel colors are taken from the predicted instance with the higher confidence score, although there may be overlapping predictions. Thus, the problem is hardly visible in the qualitative results.
In some cases, instance predictions in the qualitative results consist of less than five voxels. A possible explanation is that these are overlapping predictions of the same room as other predicted instances with a higher number of voxels but with lower confidence. However, the Mask3D paper described that the self-attention step during query refinement would prevent multiple queries from locking on the same instance. Another possible explanation is that the mentioned single voxels are unrelated to the large room instances. Since the penalty is independent of the number of voxels in the prediction, it could result in a lower mAP score than expected from the qualitative results.
4.2.4. Effect of Filtering Predictions with a Low Confidence Score on Structured3D
The Mask3D paper reported that in their experiments, filtering predictions with a confidence score below 80% reduced the number of false positives. Therefore, the effect of filtering predictions with a confidence score below 0.8 was evaluated for this task. The Structured3D validation set was used. Other hyperparameters remained unchanged. Table 4 shows the evaluation results.
Table 4.
Effect of filtering predictions with a low confidence score. Mask3D evaluation results on the validation split of Structured3D.
Filtering predictions with a confidence score below 80% improved the metric by 22.0 percentage points, confirming the expressiveness of the confidence score prediction. The effect is visible in the qualitative results, although the improvement is smaller. Filtering was enabled in all subsequent experiments.
4.2.5. Effect of Prediction Refinement with DBSCAN on Structured3D
A limitation of Mask3D is that it tends to predict objects with similar geometry and semantic class as a single instance, even if they are separated by a large distance [1]. Its authors recommended applying the density-based spatial clustering of applications with noise (DBSCAN) algorithm [44] to the model predictions as a postprocessing step. As mentioned in the supplementary of Mask3D, based on the spatial proximity of the points, it splits each predicted instance into one or more instances, attempting to resolve the limitation.
DBSCAN requires two hyperparameters: the largest distance at which two samples are considered neighbors (eps), and the minimum number of neighbor points for a point to qualify as a core point (minPts) [44,45]. Both hyperparameters were tuned on the Structured3D validation set using a 2D grid search [46]. Otherwise, the same hyperparameters as in Section 4.2.4 were used. Table 5 shows the results.
Table 5.
Prediction refinement using density-based spatial clustering of applications with noise (DBSCAN) [44]. Evaluation results of Mask3D on the Structured3D validation split.
On Structured3D, Mask3D performs approximately equally well with or without DBSCAN enabled. This could mean that the model already performs well at separating instances, and the DBSCAN step is not required. This could be verified by implementing a metric that measures the number of instances that are merged into one. Alternatively, the DBSCAN hyperparameters may not have been tuned properly, and the performance could benefit from a different hyperparameter configuration. The grid search space could be extended, or alternative hyperparameter optimization methods could be employed. Another possibility is that DBSCAN is generally ineffective for the task of room instance segmentation. This could be verified by training and evaluating the model on additional datasets.
Since DBSCAN accounts for ≈ of runtime per batch, which is 89% (see Section 4.2.8), and since it does not lead to mAP score improvements, its practical benefit in applications is small. It was disabled in subsequent experiments.
4.2.6. Evaluation and Cross-Data Generalization
After training Mask3D on the Structured3D training split and optimizing the hyperparameters on the Structured3D validation split, Mask3D was evaluated on the Structured3D test split. To assess the real-world generalization, it was evaluated on test and training splits of S3DIS and Matterport3D.
To compare the results with the state-of-the-art model RoomFormer, we evaluated RoomFormer on Structured3D and S3DIS using the same voxel size of 0.15 m as for Mask3D. We backprojected the 2D output to 3D to apply the metrics of this work, which differ from the ones used in the RoomFormer paper. Used RoomFormer weights were trained on Structured3D and provided by the RoomFormer authors. Table 6 shows the evaluation results.
Table 6.
Evaluation results of RoomFormer and Mask3D when trained on the synthetic Structured3D training split. Results are shown for synthetic Structured3D, real-world S3DIS, and real-world Matterport3D.
Figure 5 presents qualitative results of RoomFormer on the single-floor Structured3D test split. Voxels belonging to the walls of the predicted rooms are incorrectly predicted as clutter, and a substantial number of scenes in the dataset exhibit this pattern. Figure 5a,b show high-quality predictions of the RoomFormer model along with the ground truth. Except for the consistent prediction error at the walls, the rooms were precisely segmented. Figure 5c,d show examples of scenes with low mAP scores. In both examples, one room was not detected by the model and was predicted as clutter.
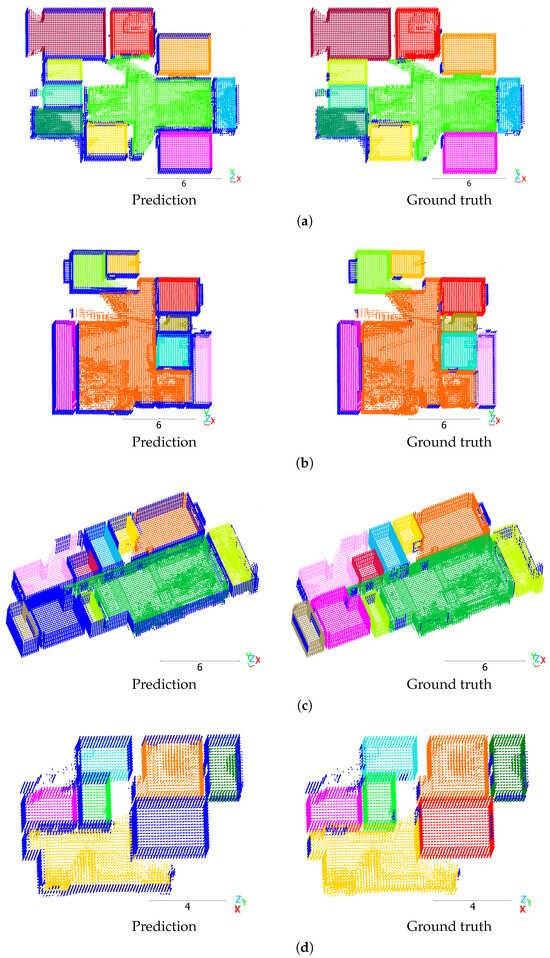
Figure 5.
RoomFormer predictions on the Structured3D test split. Scenes: (a) 3256, (b) 3474, (c) 3263, (d) 3255. Different colors denote different room instances. Dark blue indicates clutter. Scale in meters.
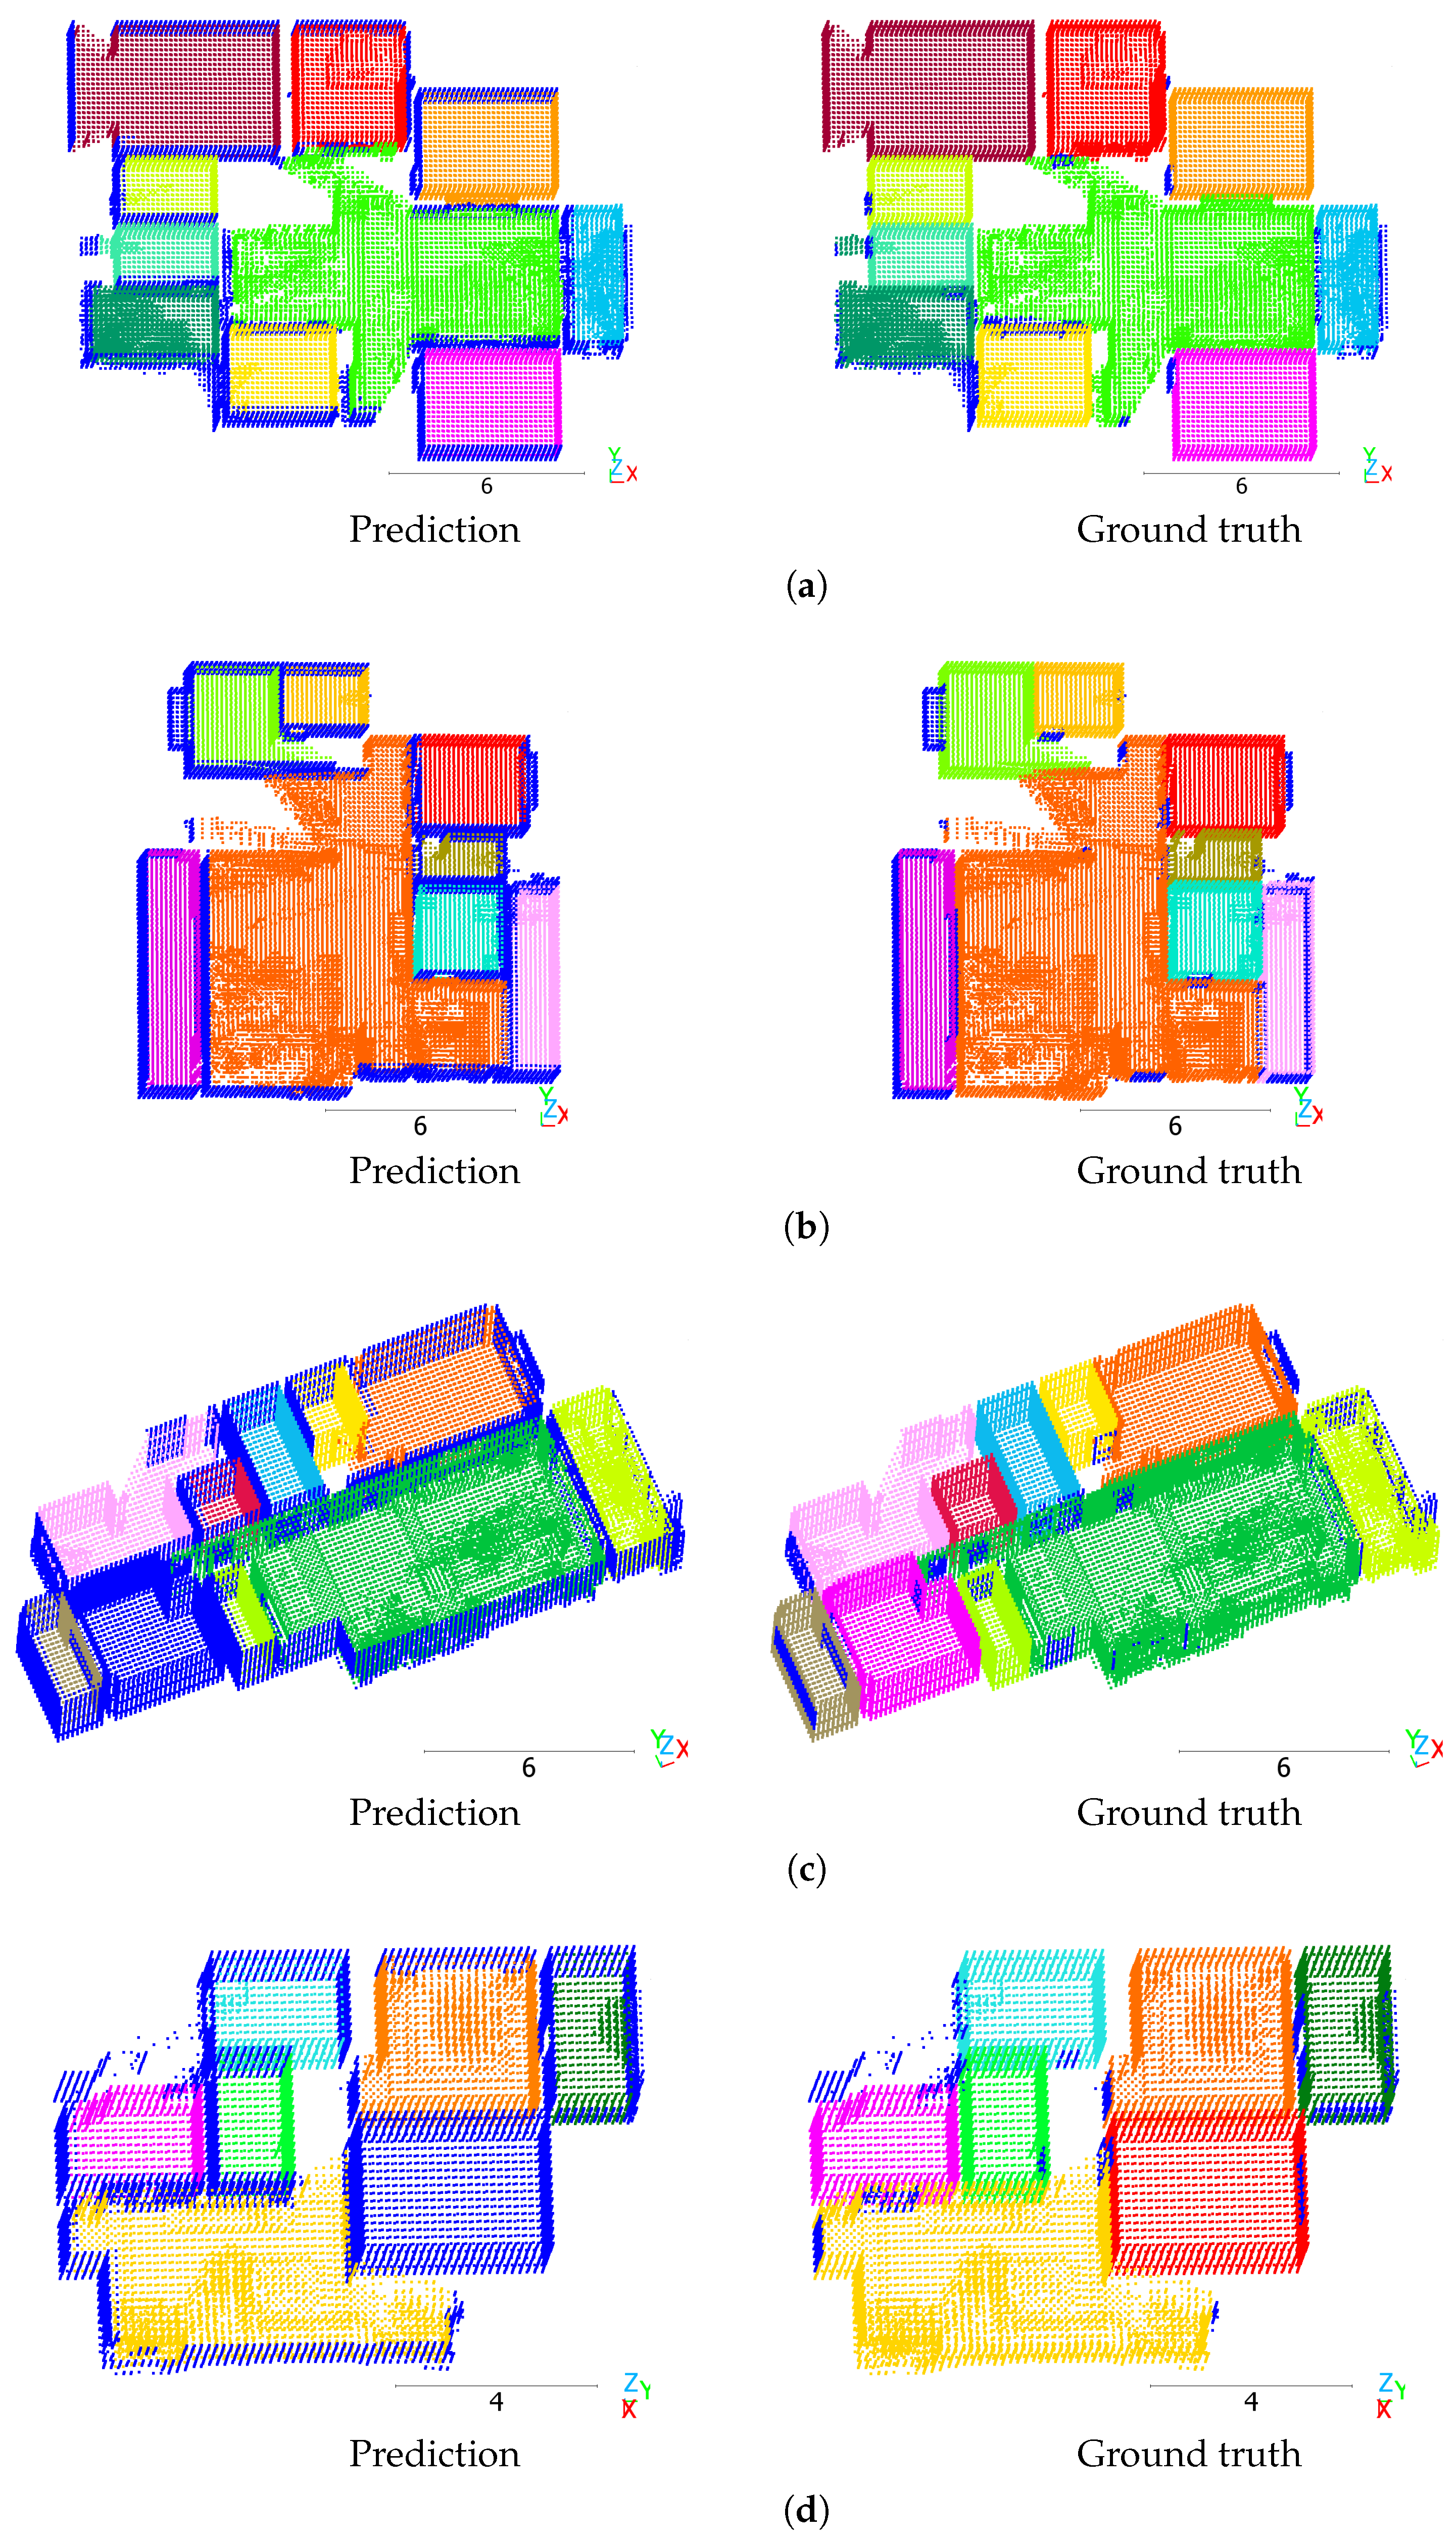
Figure 6 shows Mask3D predictions on the Structured3D test split. In Figure 6a, all rooms were segmented correctly, except for a few voxels that were missed to be predicted as clutter, especially near windows and doors. However, they diminished the scene’s mAP score to 58.3%. In Figure 6b, the model did not detect that hallway and a room (green in ground truth) are one room. Instead, it incorrectly predicted the yellow room to be the same room as the hallway. In Figure 6c, some rooms were segmented correctly. However, many voxels of some rooms were predicted as clutter, and some rooms have mixed predictions. The scene’s mAP is 20.0%.
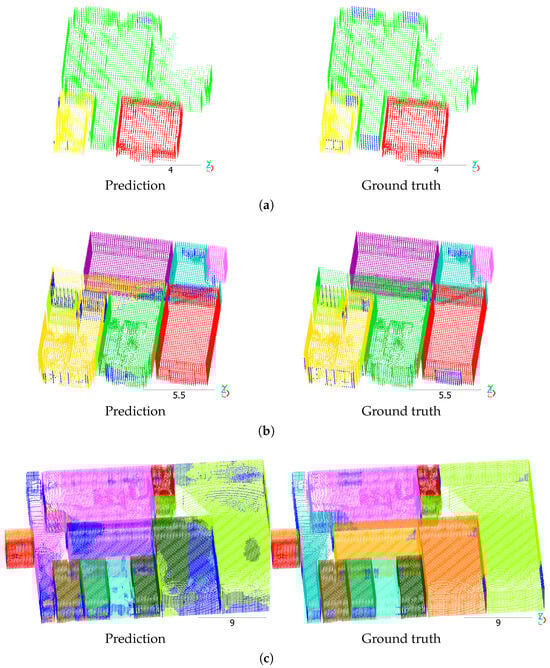
Figure 6.
Mask3D predictions on the Structured3D test split. Scenes: (a) 3437, (b) 3277, (c) 3261. Different colors denote different room instances. Dark blue indicates clutter. Scale in meters.
On Structured3D, Mask3D outperforms RoomFormer in all metrics except for the less expressive . It improves the mAP score by 8.5 percentage points.
RoomFormer operates on a 2D density map of the input point cloud and requires a backprojection that introduces quantization error. In contrast, Mask3D operates on a 3D representation. Thus, Mask3D can leverage a higher level of detail in the input data and segment the room instances more precisely.
The low metrics on both real-world S3DIS and Matterport3D when trained solely on Structured3D indicate that RoomFormer and Mask3D do not generalize well to real-world data. This domain gap [46] was expected for several reasons: Given that Structured3D is synthetically generated, it does not include measurement noise. However, being captured with a real-world scanner, S3DIS and Matteport3D contain measurement noise.
The different sensors used between the datasets each produce a different capturing pattern. Although downsampling the input point clouds to a voxel size of 0.15 m was expected to reduce the effect of the capturing pattern and improve generalization, the results indicate that the capturing pattern might still significantly impact segmentation performance.
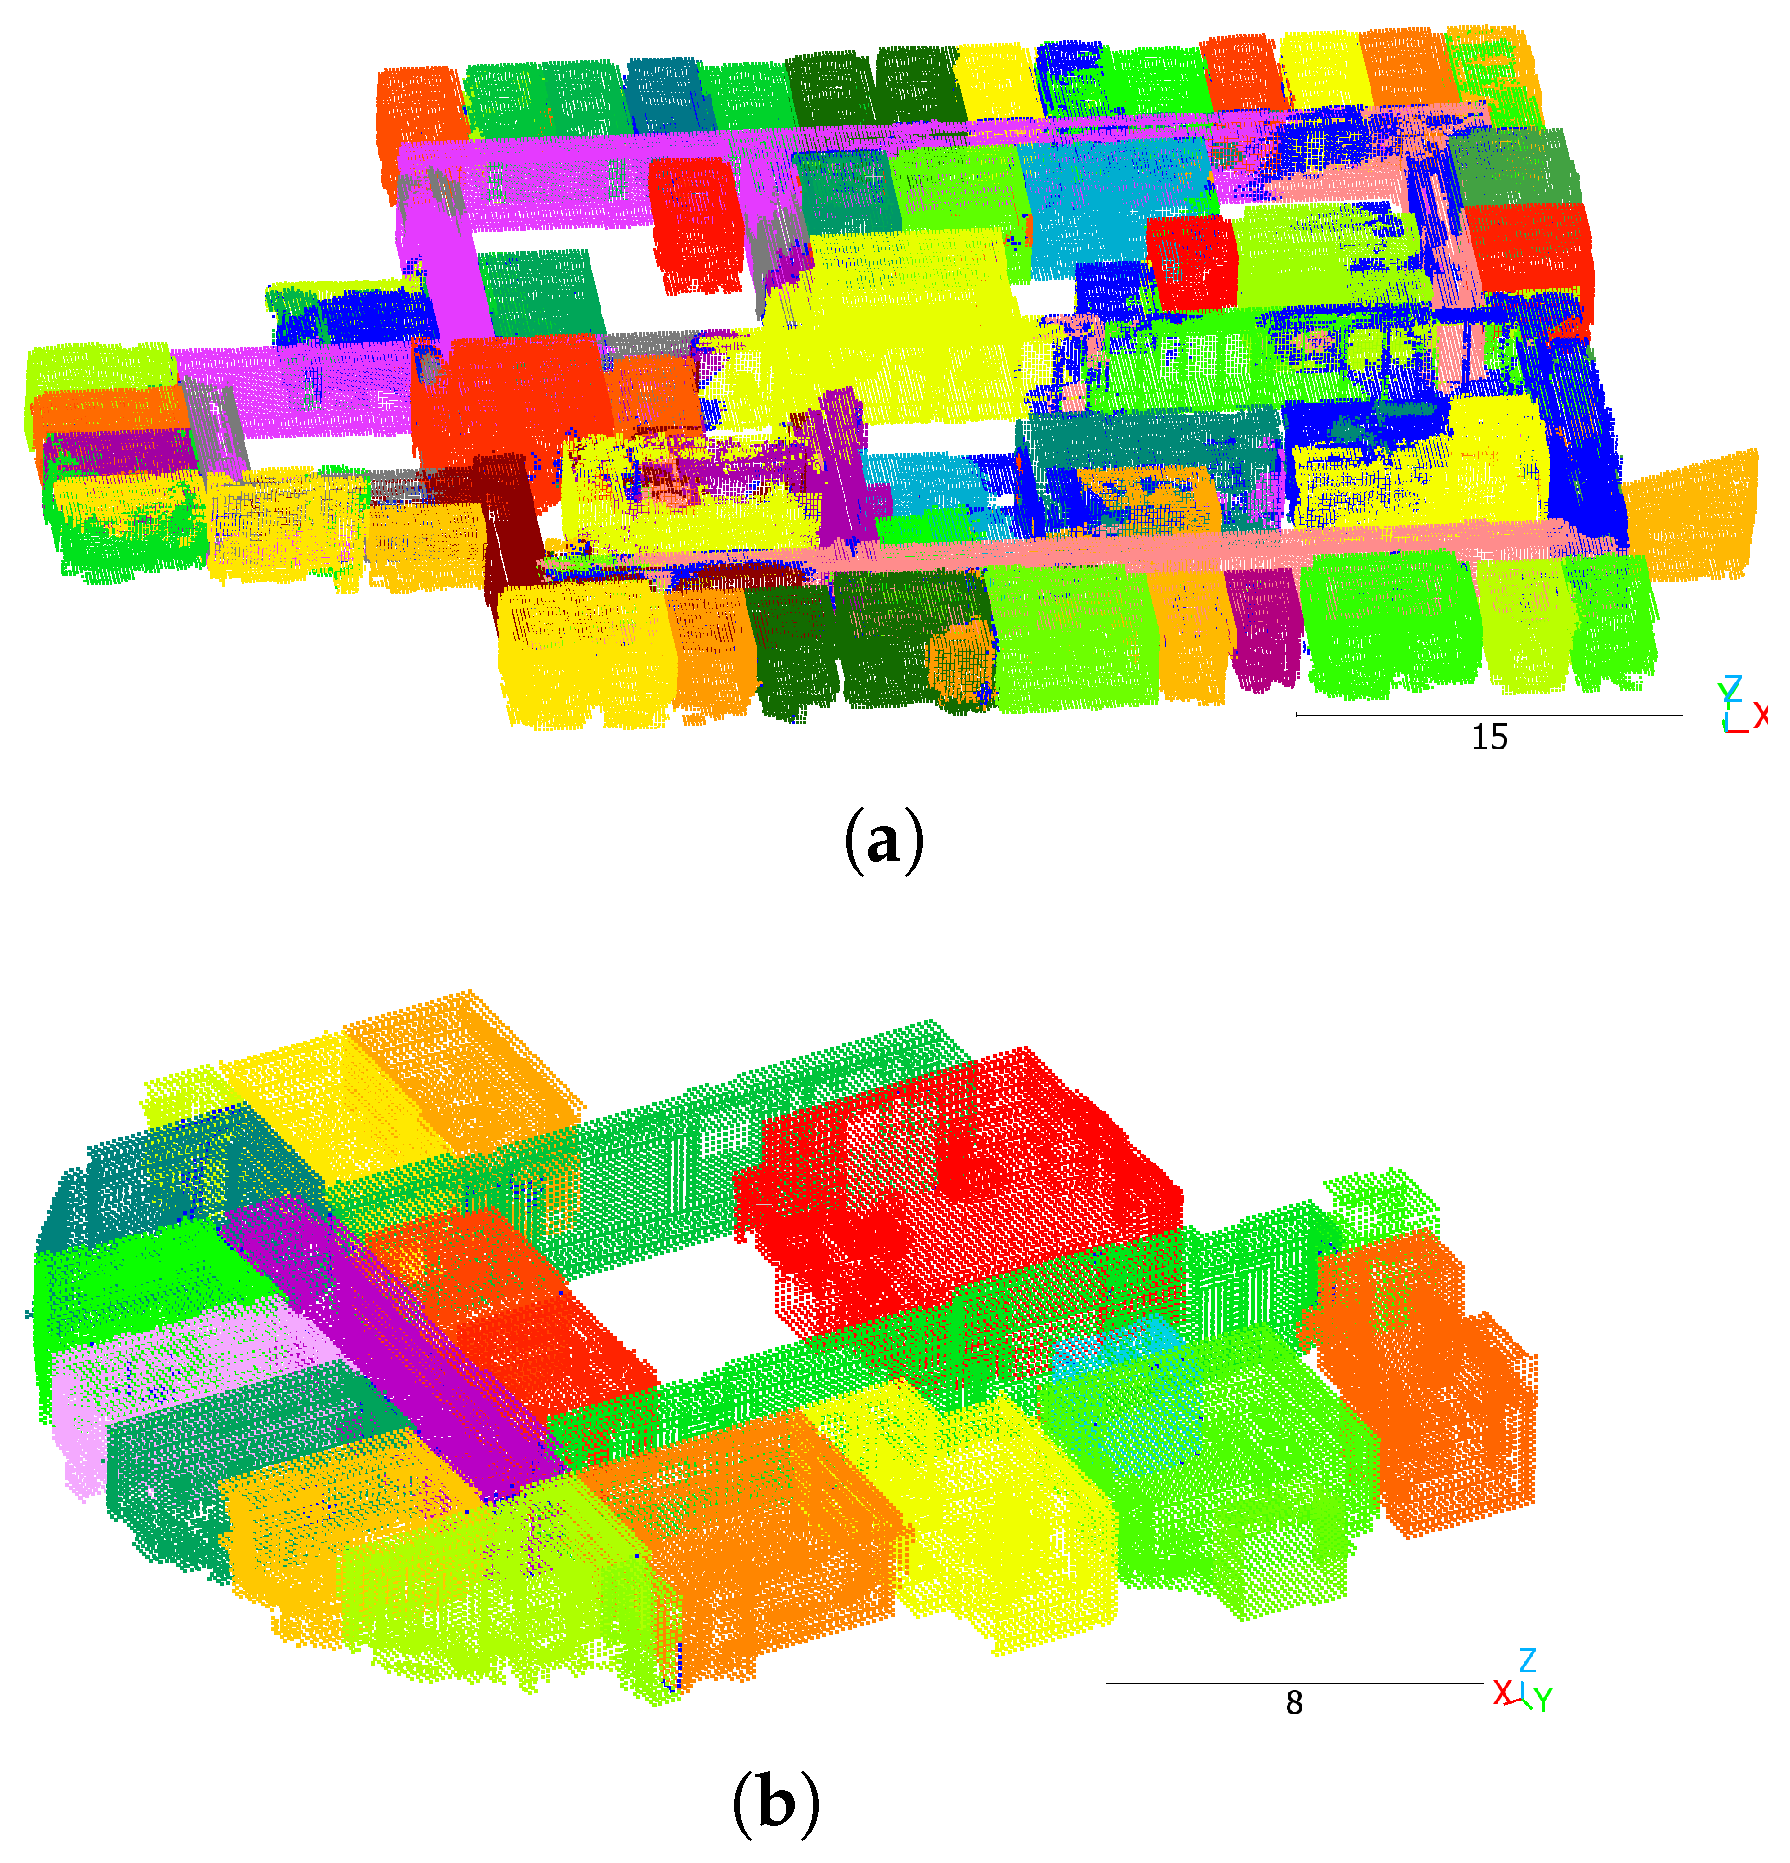
Moreover, the test split of S3DIS contains many holes between rooms, as shown in Figure 7a, which may belong to courtyards. In Structured3D, this type of architectural structure is not frequently present. The fact that metrics on the S3DIS training split, which contains fewer holes, are better than those on the test split supports this hypothesis.
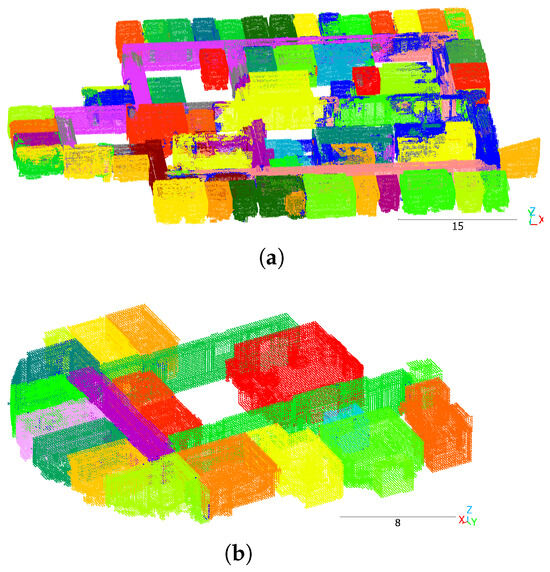
Figure 7.
Mask3D predictions on S3DIS. (a) Test split area 5, (b) Training split area 3. Different colors denote different room instances. Dark blue indicates clutter. Scale in meters.
Structured3D scenes primarily contain apartments. Office scenes, as in S3DIS, are not significantly represented in Structured3D. Both datasets include different architectural styles, which is expected to negatively influence the cross-dataset generalization. Another difference is the spatial extent of the scenes: while the model was trained on relatively small scenes, the spatial extent of typical S3DIS scenes is larger by an order of magnitude.
4.2.7. Fine-Tuning on Real-World S3DIS and Matterport3D Datasets
In [23], the approach of initially training on Structured3D and then fine-tuning on a real-world dataset has already been successfully applied to the RoomFormer model. To overcome the domain gap between the synthetic and real-world datasets, all Mask3D layers trained on Structured3D were fine-tuned for 9030 epochs (4 days) on the training split of S3DIS. The Structured3D weights were also fine-tuned for 2683 epochs (4.6 days) on the train+val split of Matterport3D. Both training processes were stopped as no further mAP improvement was expected. Table 7 shows the results.
Table 7.
Fine-tuning Mask3D weights first trained on Structured3D (Stru3D) on S3DIS and Matterport3D (M3D). Metrics were computed on the shown test split datasets.
Figure 7 presents qualitative results on S3DIS. Test split scene Figure 7a lacks segmentation quality. Approximately one-third of the rooms were correctly segmented, and despite walls or free air in between, some distinct rooms were predicted as one joint room (e.g., the two dark green at the top and the two dark green rooms at the bottom). Training split scene Figure 7b looks optimal.
Fine-tuning on the real-world datasets improved the performance of Mask3D on real-world data. However, the model did not achieve similar metric values on S3DIS or Matterport3D as it did on Structured3D. Possible reasons for the performance difference between Structured3D and S3DIS after fine-tuning include the small amount of training data in both S3DIS and Matterport3D, and the annotation of the hallways in S3DIS. The model tends to predict entire hallways as a single instance, whereas the ground truth splits hallways into multiple instances. However, the annotation rules for splitting hallways appear to be inconsistent.
The fact that the metrics on the training split indicate good segmentation performance, but the metrics on the validation split are significantly worse, while there is no overfitting, suggests that the model capacity is too low, or that content or architectural styles are different between training and test scenes. The latter is true for S3DIS, given that the scenes were recorded in different buildings, and given the high number of holes or courtyards between the rooms in area 5, which are not present to this extent in the other scenes.
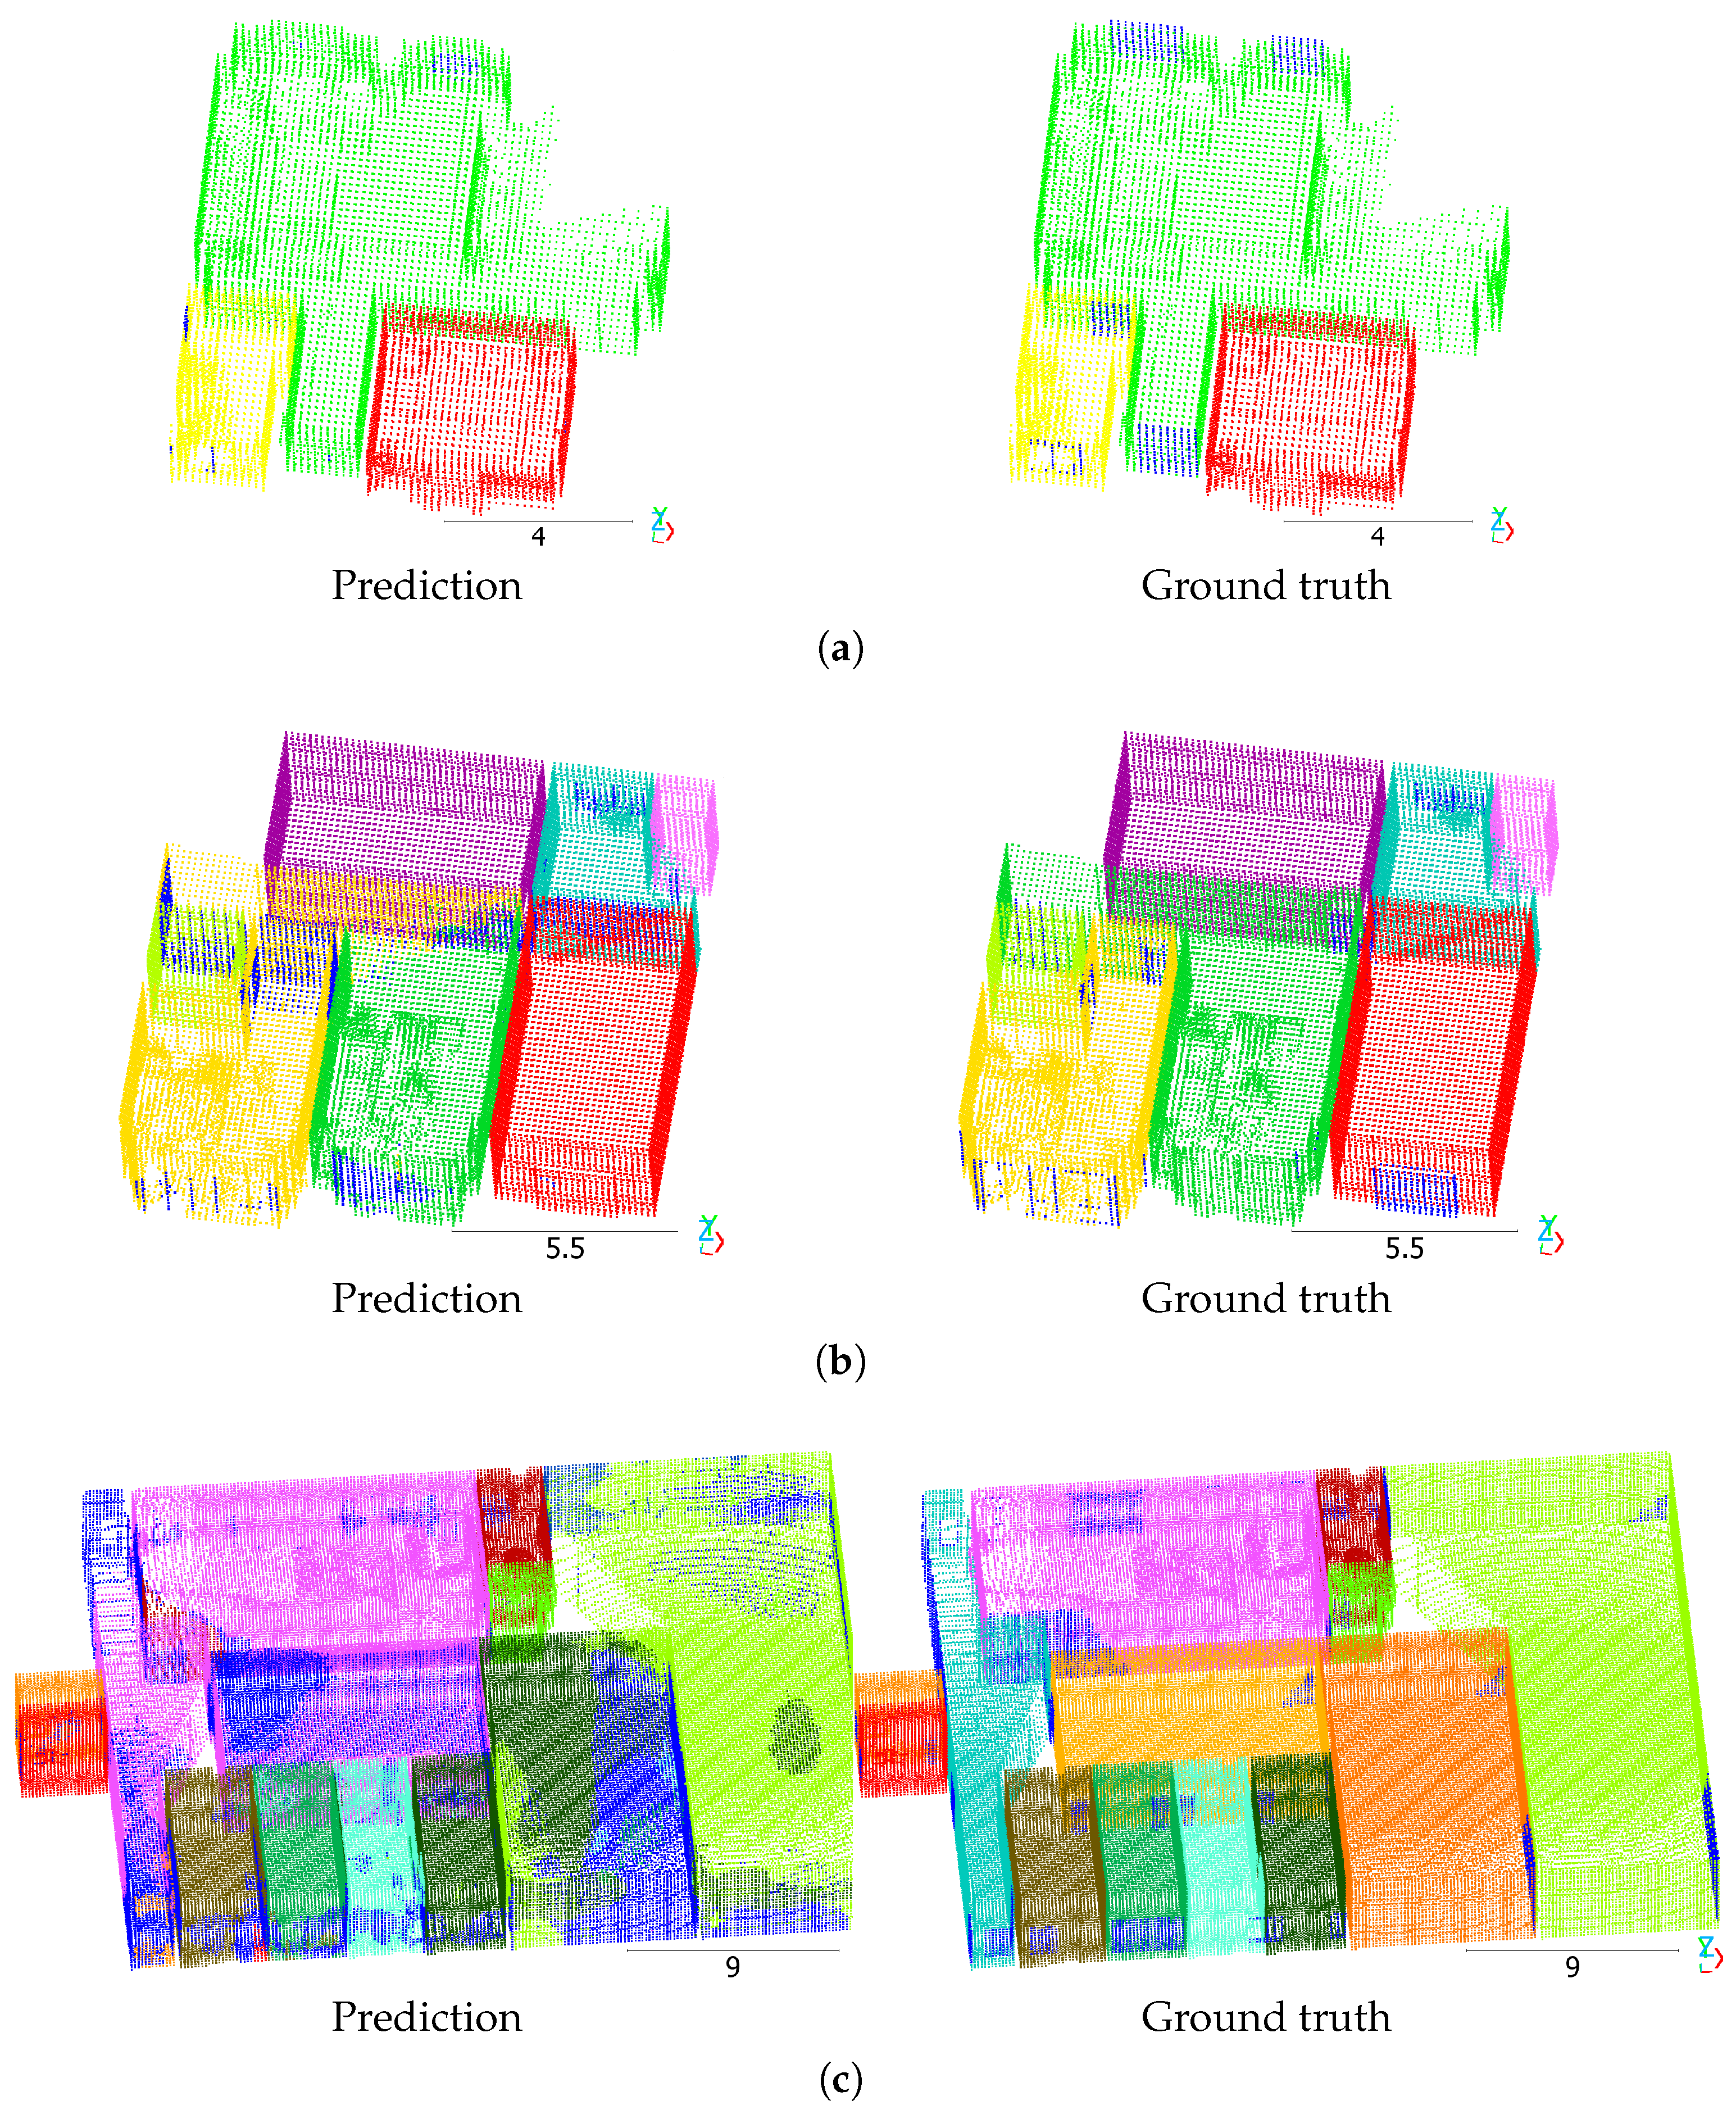
Figure 8 shows qualitative results on Matterport3D. Most rooms are segmented correctly, but the model struggles with separating some rooms that are close to each other. In Figure 8d, there are differences in the segmentation of stairs between the prediction and ground truth in the center-right of the figure, which are annotated as separate instances for each floor.

Figure 8.
Mask3D predictions on Matterport3D. Test split scans with ID (a) pa4otMbVnkk, (b) 5ZKStnWn8Zo, (c) jtcxE69GiFV, (d) WYY7iVyf5p8. Different colors denote different room instances. Dark blue indicates clutter. Scale in meters.
4.2.8. Runtime Measurement
For the runtime measurement, as in RoomFormer, the runtime of Mask3D was averaged over the test split of Structured3D during evaluation. The batch size was set to 1. The measurements shown in Table 8 were performed on an NVIDIA Multi Instance GPU device [47] with 40 GB of memory, which is part of an NVIDIA A100 GPU with 80 GB of memory. The background system load was low during the measurements, and it was not expected to affect the results significantly.
Table 8.
Runtime measurement of Mask3D on Structured3D. Durations are shown for a single dataset item and were averaged over all items in the test split. Significant step durations over 100 ms are highlighted in bold.
Prediction refinement using DBSCAN [44] (step 6) is the major contributor to the runtime. In order to speed up DBSCAN, one DBSCAN worker was started for each item in the batch in this work, processing the masks of each batch item sequentially. For the batch size of 1 used in this experiment, this does not lead to increased speed. With a higher batch size, parallelization decreases the runtime compared to the single-threaded implementation, as confirmed during initial experiments. Alternative implementations could parallelize the DBSCAN algorithm by processing all masks of all batch items in parallel, thus achieving increased speed even with a batch size of 1.
5. Limitations and Future Research
This work evaluated the performance of Mask3D and RoomFormer on voxelized point clouds, which is expected to provide enough resolution for many practical applications. In cases where higher spatial resolution is required and decreasing the voxel size is not applicable, predictions can be backprojected to the full-resolution input point cloud, causing quantization error. Its influence on the metrics was not assessed; however, because Mask3D uses varying-size and RoomFormer uses fixed-size data, the quantization error is expected to be smaller for Mask3D.
Since minimal variations in the spatial xy extent of predictions can affect many voxels in wall areas, and as the same holds true for the z-axis with floor and ceiling, metrics that consider the room volume instead of occupied voxels may be more suitable for assessing the prediction quality relevant to downstream tasks.
For future research, it is recommended to increase the dataset size and the extent of data augmentation. When training on synthetic Structured3D, to simulate measurement noise, the point jitter augmentation [48] is expected to help with domain adaptation and enhance performance on real-world data.
Area 5 of S3DIS, used as the test split, contains holes between rooms, which may represent courtyards. However, Structured3D does not adequately represent such architectural structures. Therefore, it is recommended to simulate courtyards by randomly dropping entire inner rooms from the scenes. In [31], random elastic deformations on the dataset improved performance with a small dataset size. It is advised to evaluate this approach with Mask3D.
Learning could be accelerated by including surface normals in the voxel features, which provide explicit neighborhood information [49]. The effect of transfer learning from large 3D datasets, such as ScanNet [35], should be evaluated. If Mask3D is sensitive to the number of rooms per scene or the spatial extent of the scenes, splitting S3DIS scenes into smaller parts with fewer than 10 rooms may lead to better results, as similar scene sizes worked well for Structured3D. Structured3D preprocessing could be enhanced by using the same point spacing on the z-axis as on the x- and y-axes and by discarding voxels with the “outwall” class or by integrating them into adjacent room instances.
Further investigation is recommended to determine how effectively the self-attention mechanism prevents multiple queries from locking onto the same instance. The effectiveness of DBSCAN could be verified by implementing a metric that measures the number of instances merged into one. To improve the performance of RoomFormer after backprojecting to the input point cloud, a heuristic could be developed to spatially extend the RoomFormer predictions, thereby reducing the quantization error.
Given that the utilized datasets contain both Manhattan and non-Manhattan layouts, we hypothesize that trained models will show robust performance in handling irregular room geometries. Future research should evaluate this based on metrics. Since Structured3D point clouds were computed from panoramic depth images, since S3DIS and Matterport3D were captured with a real-world scanner, and since all datasets apparently aimed at a high scene coverage, we expect only small amounts of occlusions to be present. Subsequent work could strengthen the robustness for higher occlusion degrees.
Finally, the resulting segmentation quality of Mask3D depends on the chosen hyperparameters. Instead of utilizing a combination of manual tuning and grid search, automated optimization methods such as random search [46] or Bayesian optimization with Hyperband [50] could be employed, also on the real-world datasets.
6. Conclusions
While recent research in room instance segmentation in 3D point clouds utilized orthographic top-down projections into 2D density maps, which only works for single-floor scenes, we explored the general 3D instance segmentation deep learning model Mask3D for the instance segmentation of rooms in 3D building point clouds, including real-world data and multi-floor scenes. This paves the way for advancements in practical applications, such as for BIMs and robotics, and especially for the automatic modeling of structural elements such as walls, floors, and ceilings.
We used the mAP metric, which is more expressive than the threshold-based metrics used in related work. We proposed the more intuitive SDR metric to evaluate instance segmentation quality, and we also evaluated RoomFormer, representing the current state of the art, with our metrics. Evaluation results on Structured3D point clouds show that RoomFormer is capable of room instance segmentation of single-floor scenes. However, quantization error caused by backprojecting the 2D room polygon predictions to the 3D point clouds is the main contributor to poor metrics, particularly near room walls.
Training and hyperparameter optimization of Mask3D demonstrated that Mask3D is capable of room instance segmentation. The optimal voxel size found is 0.15 m, and filtering predictions with a low predicted confidence score improves the segmentation quality. Mask3D outperforms RoomFormer by 8.5 percentage points in mAP, 9.1 percentage points in , 20.8 percentage points in mmIoU, and 3.9 in SDR on the Structured3D test split. Although qualitative results are promising for downstream applications, the metrics leave room for improvement, which is due to imperfect dataset annotations and metrics focusing on occupied voxels instead of spatial room volume.
Both Mask3D and RoomFormer do not generalize well to real-world datasets when trained solely on synthetic Structured3D. Fine-tuning Mask3D on real-world S3DIS and Matterport3D improved the performance on real-world data, although the model did not achieve similarly high metric values as for Structured3D.
Author Contributions
Conceptualization, M.K.; methodology, M.B. and M.K.; software, M.B.; validation, M.B.; formal analysis, M.B.; investigation, M.B.; resources, M.K. and A.R.; data curation, M.B.; writing—original draft preparation, M.B.; writing—review and editing, M.K. and A.R.; visualization, M.B.; supervision, M.K. and A.R.; project administration, M.K. and A.R.; funding acquisition, A.R. All authors have read and agreed to the published version of the manuscript.
Funding
This research was funded by the German Federal Ministry for Digital and Transport (BMDV) as part of the mFUND project “RoboTUNN”, funding line 2, grant number 19F2280B, and as part of the mFUND project “mdfBIM+”, funding line 2, grant number 19FS2021B. We acknowledge support by the Open Access Publication Fund of the University of Freiburg.
Data Availability Statement
We make our source code openly available at https://github.com/mvg-inatech/room-instance-segmentation-mask3d. The datasets supporting the findings of this study are available on request from their respective authors: (a) Structured3D dataset [41]: https://structured3d-dataset.org/ (b) S3DIS dataset [16]: https://openaccess.thecvf.com/content_cvpr_2016/html/Armeni_3D_Semantic_Parsing_CVPR_2016_paper.html (c) Matterport3D dataset [17]: https://niessner.github.io/Matterport/, license agreement: https://kaldir.vc.in.tum.de/matterport/MP_TOS.pdf.
Acknowledgments
We thank Tanja Hagios for her valuable assistance in proofreading this manuscript.
Conflicts of Interest
The authors declare no conflicts of interest.
Abbreviations
The following abbreviations are used in this manuscript:
| BIM | Building Information Model |
| DBSCAN | Density-Based Spatial Clustering of Applications with Noise |
| IoU | Intersection over Union |
| M3D | Matterport3D |
| mAP | mean Average Precision |
| MCTS | Monte Carlo Tree Search |
| mmIoU | mean match Intersection over Union |
| SDR | Successfully Detected Rooms |
| Stru3D | Structured3D |
Appendix A. Dataset Preprocessing
Appendix A.1. Structured3D: Generating Point Clouds from RGB-D Images
In contrast to S3DIS and Matterport3D, Structured3D does not provide point clouds. In order to imitate the output of a LiDAR scanner, the panoramic RGB-D images of the dataset were converted to point clouds, following the preprocessing of RoomFormer. The RoomFormer preprocessing was extended by correcting faulty room type annotations, and by adding annotations for room instance IDs and room types to the point clouds.
Polygon annotations were filtered by type so that only polygons of type “floor” remained. For each of these polygons, if the semantic type was neither “door”, “window”, nor “outwall”, the polygon represented a room. In this case, an integer room instance ID was assigned to the polygon. It is unique within each scene and starts at 1.
Some scenes in Structured3D were found to have incorrect room type annotations. For example, scene 37 consists of one room, three windows, and a door. The room polygon is labeled “undefined”, which indicates that the room would be clutter. Thus, the model is penalized for a correct prediction, and the computed metrics are less representative.
An analysis of Structured3D showed that 1547 of 3392 successfully preprocessed scenes contain floor polygons with the semantic type label “undefined”. In total, the dataset contains 3620 affected floor polygons. Each scene contains on average ≈1 floor-type polygon with the label “undefined”. The average scene area in Structured3D is ≈80 . Room polygons with the type "undefined" cover an average of ≈9.2 per scene (≈12%).
To solve this problem, the additional room type classes “other” and “invalid” were introduced. During the training of the deep learning model, the “other” room type class was treated as the room type classes provided by Structured3D. The “invalid” class was treated as clutter. The semantic label of rooms with the type “undefined” was changed to “other” if the polygon annotation encompassed an area of at least . The threshold was chosen to ensure plausibility.
Although Structured3D annotations were generated synthetically and one might expect that points belonging to the walls of a room are located within the room polygon, this is not always the case. Hence, before performing the point-in-polygon membership test using [51], the polygons were enlarged in all directions by 15 mm. This value was tuned empirically using scenes 2, 19, 20, and 21, which were considered representative in the number of rooms and in the apartment layout. It was validated that this approach yields good results in practice on the entire dataset.
Due to enlarging the room polygons, a point may be located inside more than one polygon. Appendix A.4 shows heuristics that resolved the ambiguity in the case where there was more than one matching polygon for a point.
Each point was annotated with an integer representation of its assigned room type and its integer room instance ID. Then, RoomFormer preprocessing rounded x- and y-point coordinates to tens and z-point coordinates to hundreds of millimeters.
The point cloud generation was successful for 3392 of 3500 scenes (≈96.9%). Reasons for failure included discarding scenes because no unambiguous room assignment could be found, assertion errors within the RoomFormer preprocessing logic, corrupt image files in the dataset, and corrupt annotations. The small number of scenes excluded in successive model training was considered negligible.
Appendix A.2. Downsampling and Quantizing Point Clouds
Given memory and computational constraints of the hardware, the generated point clouds (for Structured3D) and provided point clouds (for S3DIS and Matterport3D) were downsampled and thus quantized to enable training deep learning models with 3D data. As in [52], each voxel was defined as occupied if it contained one or more points. The voxel size is a hyperparameter and was tuned in the experiments.
The process outputs points aligned with the 3D grid, resulting in a slightly varying shift in point coordinates and thus a quantization error. The quantization error also applies when backprojecting predictions from a low-resolution point cloud to the original high-resolution point cloud. However, with this approach, unlike RoomFormer, the quantization error during backprojection does not depend on the size of the apartment. Hence, for sufficiently large apartments, the quantization error of Mask3D is smaller than in RoomFormer. With voxel size values used in this work, the quantization error is considered insignificant for practical applications.
Appendix A.3. Downscaling the Downsampled Point Clouds
As noted by Goodfellow et al. [46], when training a neural network, a larger batch size leads to a more precise gradient approximation. Since computation of batch items is typically performed in parallel [46], a larger batch size is expected to increase the speed of training and inference. Initial experiments showed that the memory consumption of Mask3D is influenced by the maximum coordinate values on all three axes. To reduce memory consumption and to allow a higher batch size, the voxel coordinates in the output point cloud were divided by the voxel size, thus reducing the maximum coordinate values on all three axes. This resulted in zero or one voxel per coordinate step.
Note that using only downscaled point clouds as training data is expected to reduce model performance on point clouds with real-world scaling. This is due to the difference in spatial extent of a building’s interior, which is caused by the scaling operation.
Appendix A.4. Structured3D: Room Polygon Ambiguity Resolving
Algorithm A1 shows heuristics that resolved the ambiguity in the case where there was more than one matching polygon for a point. This procedure was applied to Structured3D during preprocessing. It returns a tuple of the point and the room to which the point was assigned, if the assignment is unambiguous. In this case, error state e is false. If the assignment is ambiguous, error state e is true, and the scene was discarded from subsequent deep learning model training and evaluation.
| Algorithm A1 Room polygon ambiguity resolution for a single point and a single scene in Structured3D preprocessing. Note that polygon belongs to room and has type . |
Input: set of rooms , point
Output: unambiguous point-to-room assignment a, error state e |
Appendix B. Details About Metrics
Reported metrics are cut off after the number of digits shown, without rounding.
Appendix B.1. Improving the Metric Representativeness
Appendix B.1.1. Mean Precision
In case the model does not predict any instance, Mask3D set the metric of the dataset item to NaN. We set it to 0 to penalize the behavior of the model, assuming that there is at least one ground truth instance.
Appendix B.1.2. Mean Recall
In Mask3D, if there are no ground truth instances, the metric was NaN. Technically, the model successfully predicted 0 out of 0 ground truth instances. We set the metric to 1 to avoid penalizing correct behavior of the model.
Appendix B.2. Successfully Detected Rooms (SDR) Metric
| Algorithm A2 Computation of the successfully detected rooms (SDR) metric for a single dataset item in room instance segmentation. |
Input: set of predicted room instances , set of ground truth room instances , set of valid classes
Output: SDR |
References
- Schult, J.; Engelmann, F.; Hermans, A.; Litany, O.; Tang, S.; Leibe, B. Mask3D: Mask Transformer for 3D Semantic Instance Segmentation. In Proceedings of the 2023 IEEE International Conference on Robotics and Automation (ICRA), London, UK, 29 May–2 June 2023; pp. 8216–8223. [Google Scholar] [CrossRef]
- Yue, Y.; Kontogianni, T.; Schindler, K.; Engelmann, F. Connecting the Dots: Floorplan Reconstruction Using Two-Level Queries. In Proceedings of the 2023 IEEE/CVF Conference on Computer Vision and Pattern Recognition (CVPR), Vancouver, BC, Canada, 17–24 June 2023; pp. 845–854. [Google Scholar] [CrossRef]
- Su, J.W.; Tung, K.Y.; Peng, C.H.; Wonka, P.; Chu, H.K. SLIBO-net: Floorplan reconstruction via slicing box representation with local geometry regularization. In Proceedings of the NIPS ’23: 37th International Conference on Neural Information Processing Systems, New Orleans, LA, USA, 10–16 December 2024. [Google Scholar]
- Chen, J.; Liu, C.; Wu, J.; Furukawa, Y. Floor-SP: Inverse CAD for Floorplans by Sequential Room-Wise Shortest Path. In Proceedings of the 2019 IEEE/CVF International Conference on Computer Vision (ICCV), Seoul, Republic of Korea, 27 October–2 November 2019; pp. 2661–2670. [Google Scholar] [CrossRef]
- Stekovic, S.; Rad, M.; Fraundorfer, F.; Lepetit, V. MonteFloor: Extending MCTS for Reconstructing Accurate Large-Scale Floor Plans. In Proceedings of the 2021 IEEE/CVF International Conference on Computer Vision (ICCV), Montreal, QC, Canada, 10–17 October 2021; pp. 16014–16023. [Google Scholar] [CrossRef]
- Jin, T.; Zhuang, J.; Xiao, J.; Xu, N.; Qin, S. Reconstructing Floorplans from Point Clouds Using GAN. J. Imaging 2023, 9, 39. [Google Scholar] [CrossRef]
- Chen, J.; Qian, Y.; Furukawa, Y. HEAT: Holistic Edge Attention Transformer for Structured Reconstruction. In Proceedings of the 2022 IEEE/CVF Conference on Computer Vision and Pattern Recognition (CVPR), New Orleans, LA, USA, 18–24 June 2022; pp. 3856–3865. [Google Scholar] [CrossRef]
- Zorzi, S.; Fraundorfer, F. Re:PolyWorld—A Graph Neural Network for Polygonal Scene Parsing. In Proceedings of the 2023 IEEE/CVF International Conference on Computer Vision (ICCV), Paris, France, 1–6 October 2023; pp. 16716–16725. [Google Scholar] [CrossRef]
- Chen, J.; Deng, R.; Furukawa, Y. PolyDiffuse: Polygonal Shape Reconstruction via Guided Set Diffusion Models. In Proceedings of the 37th International Conference on Neural Information Processing Systems, New Orleans, LA, USA, 10–16 December 2023; Oh, A., Naumann, T., Globerson, A., Saenko, K., Hardt, M., Levine, S., Eds.; Curran Associates, Inc.: Red Hook, NY, USA, 2023; Volume 36, pp. 1863–1888. [Google Scholar]
- Yang, F.; Che, M.; Zuo, X.; Li, L.; Zhang, J.; Zhang, C. Volumetric Representation and Sphere Packing of Indoor Space for Three-Dimensional Room Segmentation. ISPRS Int. J.-Geo-Inf. 2021, 10, 739. [Google Scholar] [CrossRef]
- Murali, S.; Speciale, P.; Oswald, M.R.; Pollefeys, M. Indoor Scan2BIM: Building information models of house interiors. In Proceedings of the 2017 IEEE/RSJ International Conference on Intelligent Robots and Systems (IROS), Vancouver, BC, Canada, 24–28 September 2017; pp. 6126–6133. [Google Scholar] [CrossRef]
- Liu, C.; Wu, J.; Furukawa, Y. FloorNet: A Unified Framework for Floorplan Reconstruction from 3D Scans. In Proceedings of the European Conference on Computer Vision (ECCV), Munich, Germany, 8–14 September 2018. [Google Scholar]
- Turner, E.; Zakhor, A. Floor plan generation and room labeling of indoor environments from laser range data. In Proceedings of the 2014 International Conference on Computer Graphics Theory and Applications (GRAPP), Lisbon, Portugal, 5–8 January 2014; pp. 1–12. [Google Scholar]
- Avetisyan, A.; Khanova, T.; Choy, C.; Dash, D.; Dai, A.; Nießner, M. SceneCAD: Predicting Object Alignments and Layouts in RGB-D Scans. In Proceedings of the Computer Vision—ECCV 2020, Glasgow, UK, 23–28 August 2020; Springer International Publishing: Cham, Switzerland, 2020; pp. 596–612. [Google Scholar] [CrossRef]
- Huang, J.; Zhang, S.; Duan, B.; Zhang, Y.; Guo, X.; Sun, M.; Yi, L. ArrangementNet: Learning Scene Arrangements for Vectorized Indoor Scene Modeling. ACM Trans. Graph. 2023, 42, 1–15. [Google Scholar] [CrossRef]
- Armeni, I.; Sener, O.; Zamir, A.R.; Jiang, H.; Brilakis, I.; Fischer, M.; Savarese, S. 3D Semantic Parsing of Large-Scale Indoor Spaces. In Proceedings of the 2016 IEEE Conference on Computer Vision and Pattern Recognition (CVPR), Las Vegas, NV, USA, 27–30 June 2016. [Google Scholar] [CrossRef]
- Chang, A.; Dai, A.; Funkhouser, T.; Halber, M.; Niebner, M.; Savva, M.; Song, S.; Zeng, A.; Zhang, Y. Matterport3D: Learning from RGB-D Data in Indoor Environments. In Proceedings of the 2017 International Conference on 3D Vision (3DV), Qingdao, China, 10–12 October 2017. [Google Scholar] [CrossRef]
- Xiong, X.; Adan, A.; Akinci, B.; Huber, D. Automatic creation of semantically rich 3D building models from laser scanner data. Autom. Constr. 2013, 31, 325–337. [Google Scholar] [CrossRef]
- Zidane, I.M.; Ibrahim, K. Wavefront and A-Star Algorithms for Mobile Robot Path Planning. In Proceedings of the International Conference on Advanced Intelligent Systems and Informatics, Cairo, Egypt, 9–11 September 2017; Springer International Publishing: Cham, Switzerland, 2017; pp. 69–80. [Google Scholar] [CrossRef]
- He, K.; Gkioxari, G.; Dollar, P.; Girshick, R. Mask R-CNN. In Proceedings of the 2017 IEEE International Conference on Computer Vision (ICCV), Venice, Italy, 22–29 October 2017. [Google Scholar] [CrossRef]
- Hampali, S.; Stekovic, S.; Sarkar, S.D.; Kumar, C.S.; Fraundorfer, F.; Lepetit, V. Monte Carlo Scene Search for 3D Scene Understanding. In Proceedings of the 2021 IEEE/CVF Conference on Computer Vision and Pattern Recognition (CVPR), Nashville, TN, USA, 20–25 June 2021; pp. 13799–13808. [Google Scholar] [CrossRef]
- Zhu, X.; Su, W.; Lu, L.; Li, B.; Wang, X.; Dai, J. Deformable DETR: Deformable Transformers for End-to-End Object Detection. arXiv 2021, arXiv:2010.04159. [Google Scholar] [CrossRef]
- Talotta, A.; Radu, V.; Sorgi, L. Floorplan Generation from Noisy Point Cloud. In Proceedings of the 2nd ACM SIGSPATIAL International Workshop on Spatial Big Data and AI for Industrial Applications, Hamburg, Germany, 13 November 2023; pp. 8–15. [Google Scholar] [CrossRef]
- Kellner, M.; Stahl, B.; Reiterer, A. Reconstructing Geometrical Models of Indoor Environments Based on Point Clouds. Remote Sens. 2023, 15, 4421. [Google Scholar] [CrossRef]
- Guo, Y.; Wang, H.; Hu, Q.; Liu, H.; Liu, L.; Bennamoun, M. Deep Learning for 3D Point Clouds: A Survey. IEEE Trans. Pattern Anal. Mach. Intell. 2021, 43, 4338–4364. [Google Scholar] [CrossRef]
- Shin, S.; Zhou, K.; Vankadari, M.; Markham, A.; Trigoni, N. Spherical Mask: Coarse-to-Fine 3D Point Cloud Instance Segmentation with Spherical Representation. In Proceedings of the IEEE/CVF Conference on Computer Vision and Pattern Recognition (CVPR), Seattle, WA, USA, 16–22 June 2024; pp. 4060–4069. [Google Scholar] [CrossRef]
- Lu, J.; Deng, J.; Wang, C.; He, J.; Zhang, T. Query Refinement Transformer for 3D Instance Segmentation. In Proceedings of the 2023 IEEE/CVF International Conference on Computer Vision (ICCV), Paris, France, 1–6 October 2023; pp. 18470–18480. [Google Scholar] [CrossRef]
- Sun, J.; Qing, C.; Tan, J.; Xu, X. Superpoint Transformer for 3D Scene Instance Segmentation. In Proceedings of the AAAI Conference on Artificial Intelligence, Washington DC, USA, 7–14 February 2023; Volume 37, pp. 2393–2401. [Google Scholar] [CrossRef]
- Tang, C.; Yang, X. OSIS: Efficient One-Stage Network for 3D Instance Segmentation. In Proceedings of the 2023 9th International Conference on Virtual Reality (ICVR), Xianyang, China, 12–14 May 2023; pp. 23–29. [Google Scholar] [CrossRef]
- Kolodiazhnyi, M.; Vorontsova, A.; Konushin, A.; Rukhovich, D. OneFormer3D: One Transformer for Unified Point Cloud Segmentation. In Proceedings of the 2024 IEEE/CVF Conference on Computer Vision and Pattern Recognition (CVPR), Seattle, WA, USA, 16–22 June 2024; pp. 20943–20953. [Google Scholar] [CrossRef]
- Çiçek, O.; Abdulkadir, A.; Lienkamp, S.S.; Brox, T.; Ronneberger, O. 3D U-Net: Learning Dense Volumetric Segmentation from Sparse Annotation. In Medical Image Computing and Computer-Assisted Intervention, Proceedings of the MICCAI 2016; Springer International Publishing: Cham, Switzerland, 2016; Volume 9901, pp. 424–432. [Google Scholar] [CrossRef]
- Cheng, B.; Misra, I.; Schwing, A.G.; Kirillov, A.; Girdhar, R. Masked-attention Mask Transformer for Universal Image Segmentation. In Proceedings of the 2022 IEEE/CVF Conference on Computer Vision and Pattern Recognition (CVPR), New Orleans, LA, USA, 18–24 June 2022. [Google Scholar] [CrossRef]
- Cheng, B.; Schwing, A.; Kirillov, A. Per-Pixel Classification is Not All You Need for Semantic Segmentation. In Proceedings of the 35th International Conference on Neural Information Processing Systems, Virtual, 6–14 December 2021; Ranzato, M., Beygelzimer, A., Dauphin, Y., Liang, P., Vaughan, J.W., Eds.; Curran Associates, Inc.: Red Hook, NY, USA, 2021; Volume 34, pp. 17864–17875. [Google Scholar]
- Choy, C.; Gwak, J.; Savarese, S. 4D Spatio-Temporal ConvNets: Minkowski Convolutional Neural Networks. In Proceedings of the 2019 IEEE/CVF Conference on Computer Vision and Pattern Recognition (CVPR), Long Beach, CA, USA, 15–20 June 2019; pp. 3070–3079. [Google Scholar] [CrossRef]
- Dai, A.; Chang, A.X.; Savva, M.; Halber, M.; Funkhouser, T.; Niessner, M. ScanNet: Richly-Annotated 3D Reconstructions of Indoor Scenes. In Proceedings of the 2017 IEEE Conference on Computer Vision and Pattern Recognition (CVPR), Honolulu, HI, USA, 21–26 July 2017; pp. 2432–2443. [Google Scholar] [CrossRef]
- Armeni, I.; Sax, S.; Zamir, A.R.; Savarese, S. Joint 2D-3D-Semantic Data for Indoor Scene Understanding. arXiv 2017, arXiv:1702.01105. [Google Scholar] [CrossRef]
- CloudCompare, Version 2.13.2. Available online: https://www.cloudcompare.org/ (accessed on 1 September 2024).
- Loshchilov, I.; Hutter, F. Decoupled Weight Decay Regularization. arXiv 2019, arXiv:1711.05101. [Google Scholar] [CrossRef]
- PyTorch Contributors. ExponentialLR—PyTorch 2.3 Documentation. Available online: https://pytorch.org/docs/2.3/generated/torch.optim.lr_scheduler.ExponentialLR.html (accessed on 21 October 2024).
- Smith, L.N.; Topin, N. Super-convergence: Very fast training of neural networks using large learning rates. In Proceedings of the Artificial Intelligence and Machine Learning for Multi-Domain Operations Applications, Baltimore, MD, USA, 14–18 April 2019; Pham, T., Ed.; p. 36. [Google Scholar] [CrossRef]
- Zheng, J.; Zhang, J.; Li, J.; Tang, R.; Gao, S.; Zhou, Z. Structured3D: A Large Photo-Realistic Dataset for Structured 3D Modeling. In Proceedings of the Computer Vision—ECCV 2020, Glasgow, UK, 23–28 August 2020; Springer International Publishing: Cham, Switzerland, 2020; pp. 519–535. [Google Scholar] [CrossRef]
- Nekrasov, A. Kumuji/Volumentations. Available online: https://github.com/kumuji/volumentations (accessed on 21 October 2024).
- Maturana, D.; Scherer, S. VoxNet: A 3D Convolutional Neural Network for real-time object recognition. In Proceedings of the 2015 IEEE/RSJ International Conference on Intelligent Robots and Systems (IROS), Hamburg, Germany, 28 September–2 October 2015; pp. 922–928. [Google Scholar] [CrossRef]
- Ester, M.; Kriegel, H.P.; Sander, J.; Xu, X. A density-based algorithm for discovering clusters in large spatial databases with noise. In Proceedings of the KDD’96: Second International Conference on Knowledge Discovery and Data Mining, Portland, OR, USA, 2–4 August 1996; pp. 226–231. [Google Scholar]
- Scikit-Learn Developers. DBSCAN. Available online: https://scikit-learn.org/stable/modules/generated/sklearn.cluster.DBSCAN.html (accessed on 20 October 2024).
- Goodfellow, I.; Bengio, Y.; Courville, A. Deep Learning; MIT Press: Cambridge, MA, USA, 2016. [Google Scholar]
- NVIDIA Corporation. NVIDIA Multi-Instance GPU (MIG). Available online: https://www.nvidia.com/en-us/technologies/multi-instance-gpu/ (accessed on 26 October 2024).
- Wickham, H. ggplot2; Springer International Publishing: Cham, Switzerland, 2016. [Google Scholar] [CrossRef]
- Yin, Q.; Ren, Q.; Zhao, L.; Wang, W.; Chen, J. Lossless Point Cloud Attribute Compression with Normal-based Intra Prediction. In Proceedings of the 2021 IEEE International Symposium on Broadband Multimedia Systems and Broadcasting (BMSB), Chengdu, China, 4–6 August 2021; pp. 1–5. [Google Scholar] [CrossRef]
- Falkner, S.; Klein, A.; Hutter, F. BOHB: Robust and Efficient Hyperparameter Optimization at Scale. In Proceedings of the 35th International Conference on Machine Learning, PMLR, Stockholm, Sweden, 10–15 July 2018; Dy, J., Krause, A., Eds.; Volume 80, pp. 1437–1446. [Google Scholar]
- Shapely; Version 2.0.3; Zenodo: Geneva, Switzerland, 2024. [CrossRef]
- de Queiroz, R.L.; Chou, P.A. Motion-Compensated Compression of Dynamic Voxelized Point Clouds. IEEE Trans. Image Process. 2017, 26, 3886–3895. [Google Scholar] [CrossRef] [PubMed]
Disclaimer/Publisher’s Note: The statements, opinions and data contained in all publications are solely those of the individual author(s) and contributor(s) and not of MDPI and/or the editor(s). MDPI and/or the editor(s) disclaim responsibility for any injury to people or property resulting from any ideas, methods, instructions or products referred to in the content. |
© 2025 by the authors. Licensee MDPI, Basel, Switzerland. This article is an open access article distributed under the terms and conditions of the Creative Commons Attribution (CC BY) license (https://creativecommons.org/licenses/by/4.0/).