Article

Multi-Timescale Validation of Satellite-Derived Global Horizontal Irradiance in Côte d’Ivoire

by
Pierre-Claver Konin Kakou
1,
Dungall Laouali
2,
Boko Aka
3,
Janet Appiah Osei
1,
Nicaise Franck Kassi Ette
4 and
Georg Frey
5,*
1
Doctoral Research Program in Climate Change and Energy, West African Science Service Centre on Climate Change and Adapted Land Use (WASCAL), Niamey BP 10662, Niger
2
Département de Physique, Université Abdou Moumouni, Niamey BP 10662, Niger
3
Institut de Recherche sur les Energies Nouvelles, Abidjan 02 BP 801, Côte d’Ivoire
4
Département de la Climatologie et de l’Agrométéorologie, Société d’Exploitation et de Développement Aéroportuaire, Aéronautique et Météorologique (SODEXAM), Abidjan 15 BP 990, Côte d’Ivoire
5
Chair of Automation and Energy Systems, Saarland University, 66123 Saarbrücken, Germany
*
Author to whom correspondence should be addressed.
Remote Sens. 2025, 17(6), 998; https://doi.org/10.3390/rs17060998
Submission received: 30 December 2024 / Revised: 8 March 2025 / Accepted: 10 March 2025 / Published: 12 March 2025
(This article belongs to the Topic Solar Forecasting and Smart Photovoltaic Systems)

Abstract

:
Accurate solar radiation data are crucial for solar energy applications, yet ground-based measurements are limited in many regions. Satellite-derived and reanalysis products offer an alternative, but their accuracy varies across spatial and temporal scales. This study evaluated the performance of four widely used GHI products—CAMS, SARAH-3, ERA5 and MERRA-2—against ground measurements at hourly, daily (summed from hourly) and monthly (averaged from daily) timescales. The analysis also examined how temporal aggregation influenced error characteristics using correlation coefficients, the rMBD, the rRMSD and the combined performance index (CPI). At an hourly scale under clear-sky conditions, satellite products outperformed reanalysis products, with r 1 and R 2 0.9 and the rMBD, rRMSD and CPI ranging from 0.1%, 11.4% and 11.8% to −14.7%, 33.3% and 75.1% for CAMS; 0.2%, 11.4% and 10.9% to 13.5%, 22.4% and 120.7% for SARAH-3; −0.2%, 21.6% and 23.8% to 21.5%, 40.9% and 128.8% for MERRA-2; and 0.8%, 14.6% and 16.3% to 22%, 48.2% and 88.3% for ERA5. Under cloudy conditions, all products overestimated GHI, with the rMBD reaching up to 39.7% (SARAH-3), 35.9% (CAMS), 22.9% (MERRA-2) and 28% (ERA5), while the rRMSD exceeded 40% for all. Overcast conditions yielded the poorest performance, with the rMBD ranging from 45.8% to 124.6% and the CPI exceeding 800% in some cases. From the hourly to daily and monthly datasets, aggregation reduced errors for reanalysis products by 5.5% and up to 12.4%, respectively, in clear-sky conditions, but for satellite-based products, deviations slightly increased up to 3.1% for the monthly dataset. Under all-sky conditions, all products showed reductions up to 23%. These results highlight the significant challenges in estimating GHI due to limited knowledge of aerosol and cloud dynamics in the region. They emphasize the need for improved parameterization in models and dedicated measurement campaigns to enhance satellite and reanalysis product accuracy in West Africa.

Graphical Abstract

1. Introduction

Solar energy has emerged as one of the most promising renewable energy sources for mitigating climate change and addressing global energy demand. In sub-Saharan Africa, the growing interest in solar energy is particularly vital, as the region experiences high solar insolation levels but remains heavily dependent on traditional energy sources [1]. Côte d’Ivoire, in West Africa, has set ambitious goals to increase its renewable energy capacity, with solar energy playing a key role in its energy diversification strategies [2]. This is demonstrated by the construction of a 47 MW solar power plant in Boundiali.
Reliable and accurate global horizontal irradiance (GHI) data are essential for the successful development, deployment and management of solar energy systems in the country. GHI refers to the hemispherical solar radiation received by a horizontal planar surface [3]. It is the primary input for solar photovoltaic (PV) systems, determining the potential energy output. For large-scale solar energy projects, precise GHI data are necessary for feasibility studies, system design and performance evaluation. However, GHI measurements from ground-based stations are often sparse due to the high cost and maintenance of solar radiation sensors. In Côte d’Ivoire, the national meteorological agency (SODEXAM) remains the only reliable entity possessing solar radiation and meteorological data on a national scale. This limitation has led to an increasing reliance on satellite-derived data, which offer extensive spatial and temporal coverage. These satellite-based measurements of GHI rely on radiative transfer models applied to data collected by sensors aboard satellites. These sensors measure reflected and emitted radiation from the Earth’s surface and atmosphere, primarily in the visible and infrared spectral bands. The process involves several steps: detecting incoming solar radiation, analyzing cloud cover and atmospheric effects, modeling the radiative transfer of solar energy through the atmosphere and estimating GHI by combining direct and diffuse solar radiation. However, the accuracy of satellite products can vary across regions and timescales due to factors such as cloud cover, aerosol concentrations, local atmospheric conditions [4,5] and the data sources used for tuning radiation retrieval algorithms. For instance, tropical regions often experience reduced accuracy due to high cloud variability and dense vegetation. In arid areas, dust and high aerosol concentrations can introduce substantial biases. Similarly, high-latitude regions can present challenges due to low Sun angles and prolonged periods of cloud cover. To address these issues, satellite-derived GHI data are often validated against ground-based measurements. This validation helps improve the accuracy of satellite products and ensures better applicability. Several satellite-based and reanalysis GHI datasets, such as the Copernicus Atmosphere Monitoring Service (CAMS), Surface Solar Radiation Data Set—Heliosat (SARAH) and Modern-Era Retrospective analysis for Research and Applications (MERRA), have been widely used in solar energy assessments [6,7,8]. These datasets provide GHI estimates at different temporal resolutions (e.g., hourly, daily, monthly) and offer a valuable resource for regions with limited ground-based measurements. The validation of these satellite products is of paramount importance in regions with high humidity and frequent cloud cover, such as Côte d’Ivoire, as these factors can introduce significant uncertainties in satellite and reanalysis estimations.
Previous studies have demonstrated varying degrees of agreement between satellite-derived and ground-measured GHI across different regions of the world, with discrepancies often attributed to the complexity of local weather patterns. Sawadogo et al. [9] evaluated the performance of hourly GHI from state-of-the-art reanalysis and satellite products (ERA5, MERRA-2, CAMS and SARAH-2) with 37 quality-controlled in situ measurements from novel meteorological networks established in Burkina Faso and Ghana under different weather conditions for the year 2020. Palmer et al. [8] highlighted how accurate solar data could support the feasibility of photovoltaic (PV) cooking systems in meeting local needs. Their paper specifically focuses on the selection of the most accurate satellite-derived solar irradiance database for application in Africa, given the scarcity of ground measurements in the region. To achieve this, the authors validated four readily available GHI satellite databases against ground measurements using various statistical tests. In [10], SOLCAST satellite-based dataset estimates were validated against the McClear clear-sky model [11]. The study spanned from 2014 to 2021 and encompassed various climatic regions within Morocco. The authors utilized the PVLIB Python library [12] to configure the models and incorporated ERA5 hourly fractional cloud cover data to identify clear-sky days. They concluded that the SOLCAST satellite-based dataset and ERA5 cloud fraction information could serve as reliable alternatives in regions lacking access to inputs required for complex clear-sky models. The results in [9] demonstrate that satellite-derived data perform better than reanalysis products under various atmospheric conditions. Additionally, Kenny et al. [13] identified SARAH-2 as delivering the best performance overall, while Psiloglou et al. [7] highlighted the strong performance of CAMS and CMSAF-SARAH at lower temporal resolutions. Notably, their study also underscored a progressive reduction in biases from hourly to daily and monthly datasets, though large uncertainties persisted under overcast and partially cloudy-sky conditions. Satellite products leverage direct observations and advanced radiative transfer algorithms, giving them an advantage in conditions with minimal atmospheric interference. In contrast, reanalysis datasets often exhibit GHI misestimations, with studies reporting both underestimations and overestimations depending on atmospheric conditions. For instance, Mathews et al. [14] observed a significant global overestimation bias in MERRA-2 data, which contrasts with studies reporting localized underestimation in specific regions. Their findings suggest that overestimation bias tends to be more pronounced in cloudier climates with reanalysis products. Similarly, Khan et al. [15] conducted a comparative analysis of seven global GHI reanalysis datasets and found that all models underestimated GHI during rainy and cloudy-sky months. Additionally, Potisomporn et al. [16] highlighted that reanalysis products often underestimate generation variability over short timescales, potentially leading to the misrepresentation of critical ramp events in energy production studies. Furthermore, Frank et al. [17] emphasized systematic shortcomings in reanalysis datasets by comparing them with high-quality GHI measurements obtained through the Baseline Surface Radiation Network. Their results revealed an underestimation of GHI in clear-sky conditions and overestimation in cloudy-sky conditions, underscoring the need for improvement in how these models handle varying atmospheric scenarios.
Most of the studies mentioned spanned a single timescale, either hourly, daily or monthly. The performance of satellite-derived GHI estimates can vary significantly depending on the selected timescale. For instance, evaluating datasets only at an hourly scale may overlook trends or biases that emerge over longer periods, such as daily or monthly averages. Conversely, monthly or daily evaluations mask short-term fluctuations caused by transient cloud cover, aerosols or atmospheric conditions, leading to incomplete conclusions about a model’s accuracy in different weather scenarios. Liu et al. [18] highlighted the importance of evaluating downward shortwave radiation (DSR) products across various timescales to understand their performance differences. The accuracy of satellite-derived and reanalysis DSR products, such as GLASS, BESS, CLARA A2, MCD18A1, ERA5 and MERRA-2, was assessed using ground measurements from the Chinese Ecosystem Research Network (CERN) and land–atmosphere observation sites. Significant variations were found in their performance depending on the timescale.
The extensive body of research on accurate satellite-based measurement and the validation of solar parameters confirms their importance for optimizing solar energy applications and integrating renewable energy into national energy strategies. Our previous research focused on evaluating satellite-derived sunshine duration (SDU) data, which serve as a key indicator for solar energy availability. The authors of the present study conducted a detailed validation of the Surface Radiation Dataset—Heliosat (SARAH) Edition 3 against ground-based SDU measurements across eight stations in Côte d’Ivoire [19]. The study provided valuable insights into the accuracy and regional variability of satellite-derived SDU data, revealing strong correlations in certain areas (e.g., San Pédro and Korhogo) and highlighting discrepancies in others, such as Odienné. These findings underscored the importance of localized validation for improving satellite data reliability in diverse climatic conditions. Building on this foundation, the present study shifts focus to global horizontal irradiance, the primary parameter for solar energy applications, particularly in the prediction, design and efficiency optimization of photovoltaic systems. Unlike SDUs, which primarily reflect sunlight duration, GHI quantifies the total solar energy received on a horizontal surface, integrating both direct and diffuse radiation. This study expands the scope by conducting a multi-timescale validation of satellite-derived and reanalysis GHI data, leveraging ground-based measurements from various locations across Côte d’Ivoire. Furthermore, it employs multiple satellite-derived and reanalysis products, such as CAMS, SARAH, MERRA and ERA5, and evaluates their performance under varying sky conditions using standard and advanced statistical metrics, including relative mean bias difference (rMBD), relative root mean square difference (rRMSD) and combined performance index (CPI). While the first study laid the groundwork for understanding the accuracy of satellite-derived SDU data, this work addresses the broader and more complex challenge of GHI validation. By exploring GHI variability across regions and timescales, this study aims to provide deeper insights into improving satellite-based and reanalysis solar radiation products and enhancing their applicability to West Africa’s growing renewable energy sector.

2. Materials and Methods
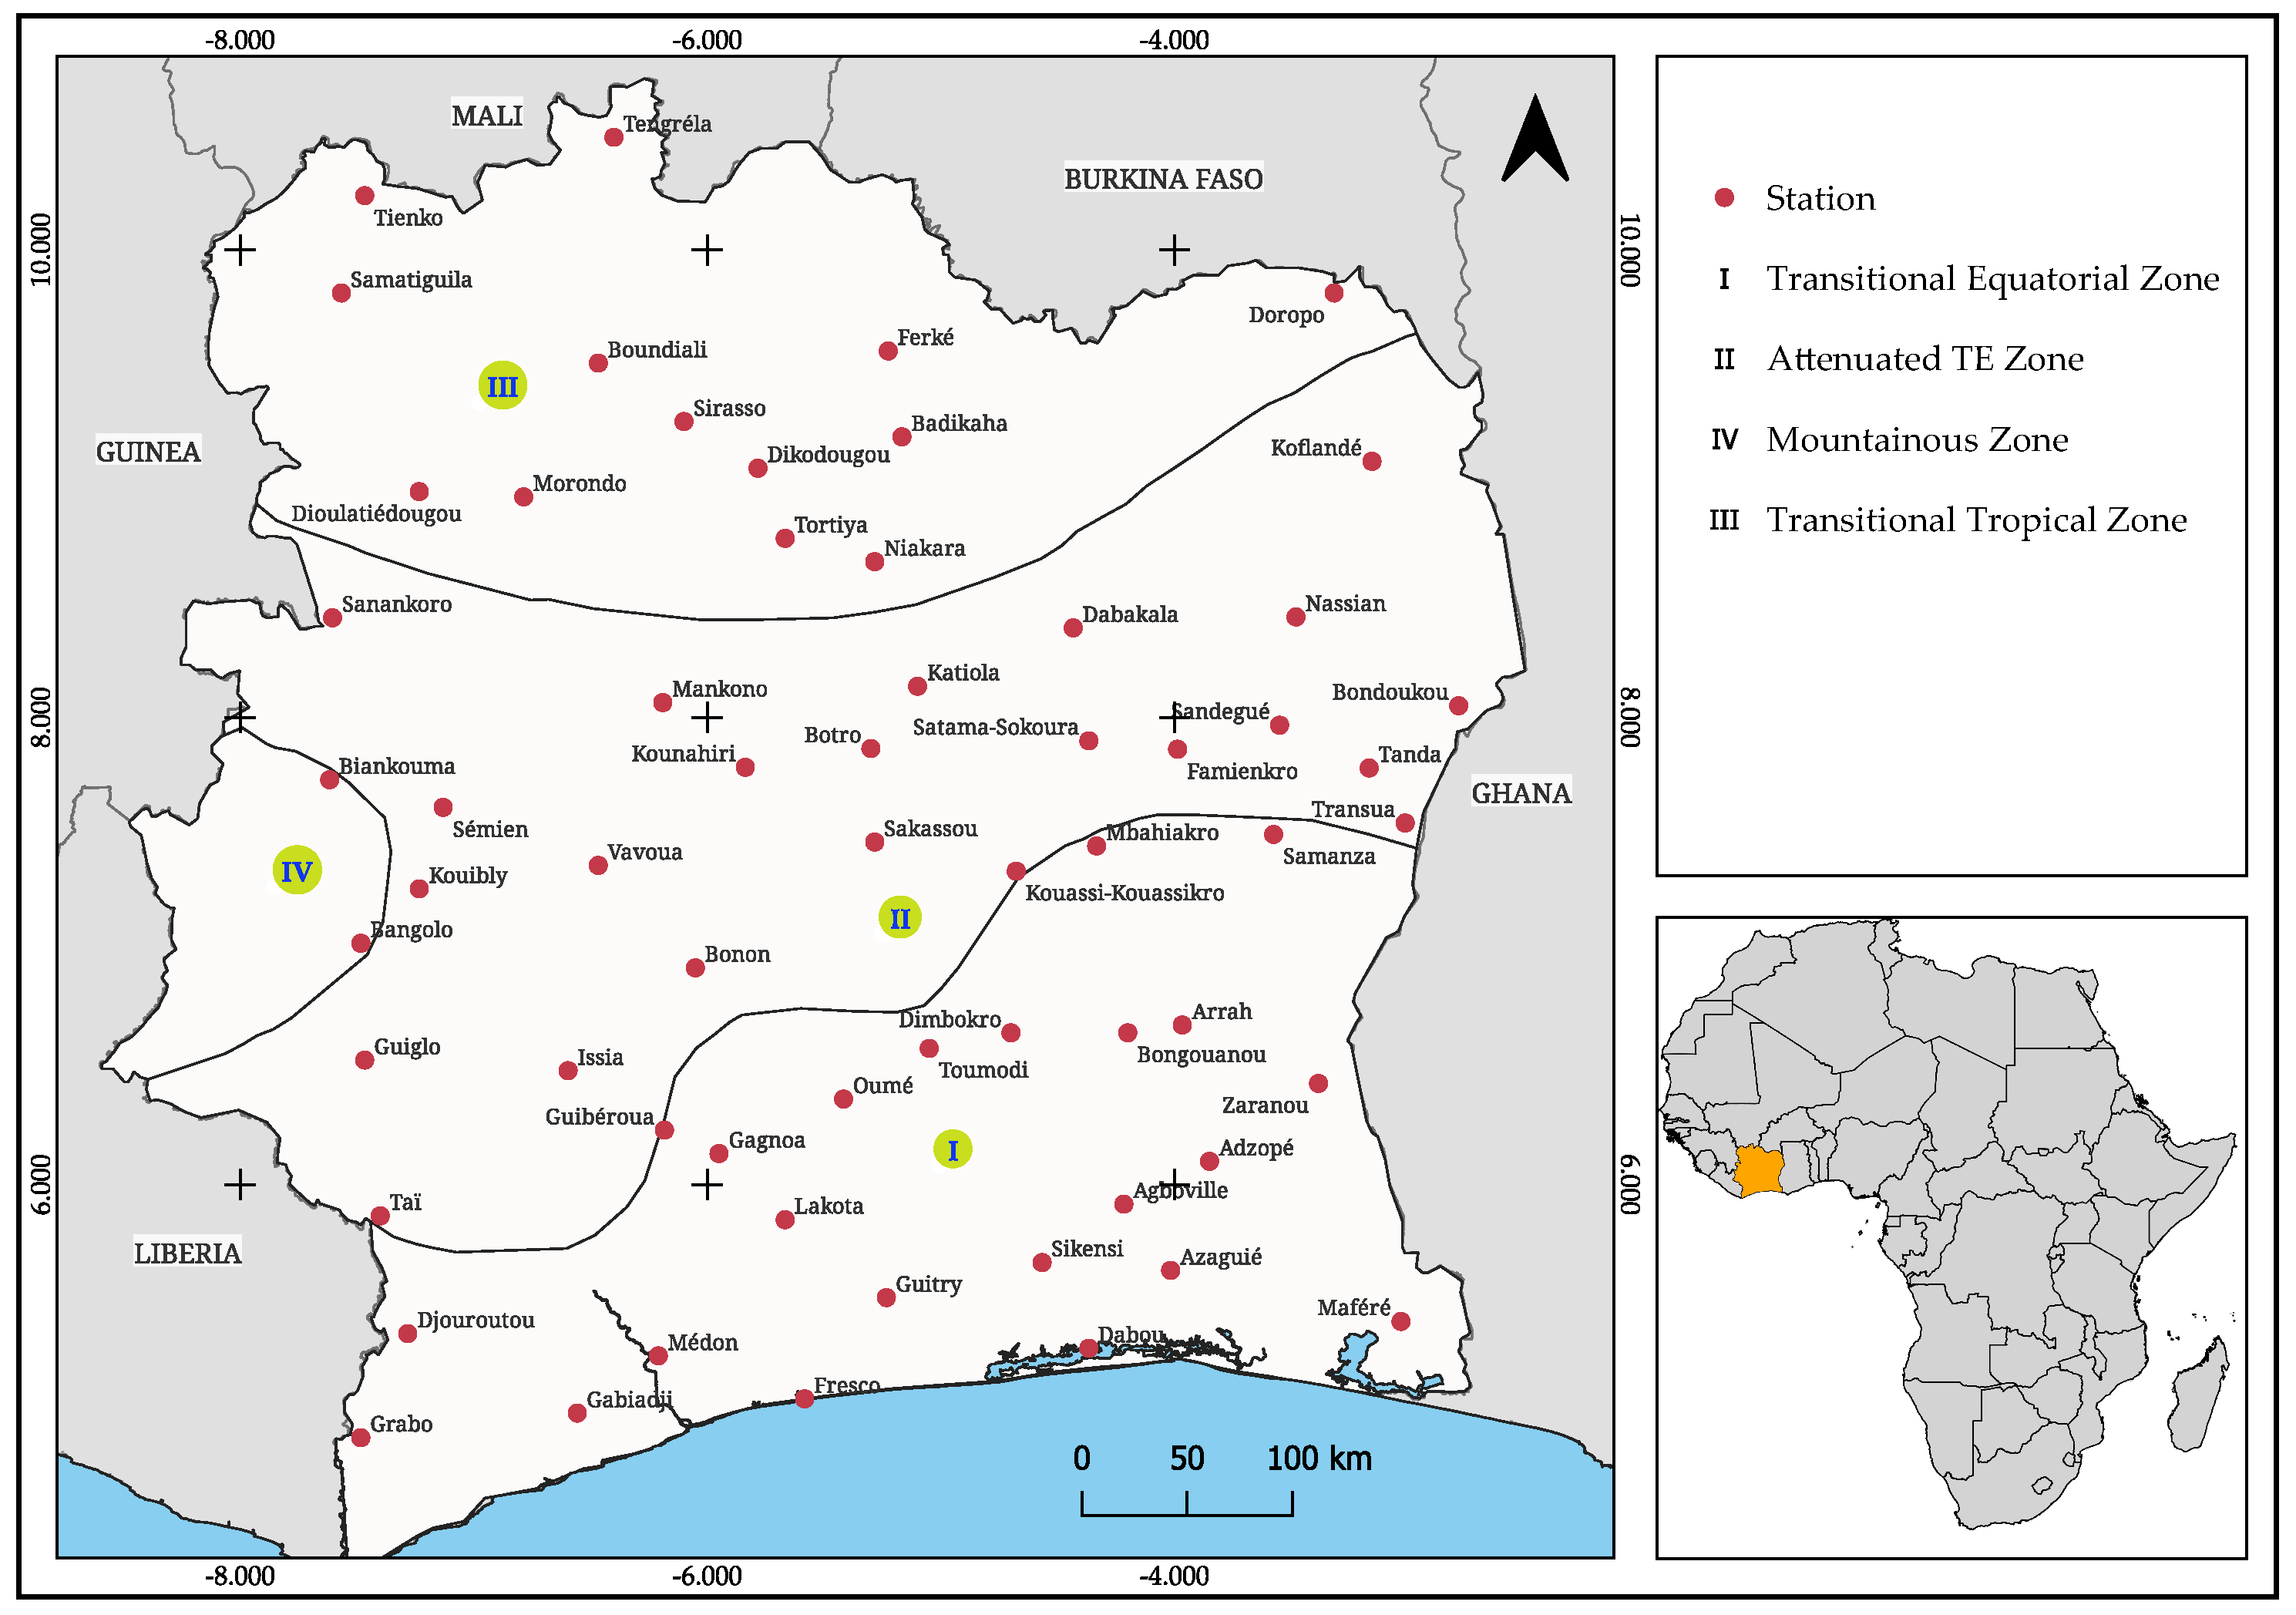
2.1. Study Area

This paper focuses on Côte d’Ivoire, a West African country located within the intertropical zone, between the latitudes 4°30′ and 10°30′ north and longitudes 8°30′ and 2°30′ west. It covers an area of 322,462 km2 (approximately 1% of the African continent) and borders the Gulf of Guinea to the South, Ghana to the East, Liberia and Guinea to the West and Mali and Burkina Faso to the North [20]. Côte d’Ivoire is a transitional zone between a humid equatorial climate and a semi-arid tropical climate. Different classifications of climatic zones have been provided by authors, depending on whether they take into account the number of rainy and dry seasons, the distribution of rainfall, temperature or wind motions [21,22]. According to rainfall patterns, four climatic zones are distinguished, namely the transitional equatorial zone (Attié climate), the attenuated transitional equatorial zone (Baoulé climate), the transitional tropical zone (Sudanese climate) and the mountainous zone [23,24,25], as shown in Figure 1.
These zones can be grouped into two major climate types: (i) A humid equatorial climate is in the southern part, characterized by four seasons with a mean temperature of about 28 °C. A long rainy season spans from April to July and a short one spans from September to November, while a short dry season occurs in August and a long dry season spans from December to March. (ii) The tropical climate in central and northern Côte d’Ivoire is characterized by a single rainy season from June to September and a long dry season from October to May, with temperatures varying between 14 °C and 36 °C [22].
Situated just above the equator, Côte d’Ivoire is among the regions where solar resources are most abundant. Regarding these resources, the daily sum of global horizontal irradiance (GHI) ranges from 4.4 kWh/m2 in the southern part of the country to 5.6 kWh/m2 in the northern part, with the highest values recorded in Odienné and its surroundings. The annual sum of GHI ranges from 1607 kWh/m2 to 2045 kWh/m2 in the same direction [26].

2.2. Satellite and Reanalysis Datasets

Four satellite-based and reanalysis datasets, including the Copernicus Atmosphere Monitoring Service (CAMS), the ECMWF Reanalysis 5th Generation (ERA5), the Modern-Era Retrospective Analysis for Research and Applications, Version 2 (MERRA-2) and the Surface Radiation Data Set—Heliosat Version 3 (SARAH-3), were validated in this study.
The hourly solar radiation data retrieved from CAMS are available through the Heliosat-4 method, which provides estimates under both clear-sky and all-sky conditions. This dataset consists of gridded time-series data with global geographical coverage, including Europe, Africa, the Middle East, the Atlantic Ocean, Brazil, East Asia and Oceania, based on the Meteosat Second Generation and Himawari satellite fields of view [27,28,29]. The dataset has a horizontal resolution of 0.1° and is provided at a single atmospheric level. The original values of global horizontal irradiation (GHI), given in watt-hours per square meter (Wh/m2), were converted to watts per square meter (W/m2) to ensure consistency with ground-based measurements. Additionally, CAMS provides estimates of extraterrestrial GHI, represented by the Top-of-the-Atmosphere (TOA) radiation and clear-sky GHI estimated by the McClear model.
In the ERA5 reanalysis dataset, solar radiation is represented by the Surface Solar Radiation Downwards (SSRD) parameter, which quantifies the total solar radiation incidence on a horizontal surface at the Earth’s surface. This gridded dataset has global coverage with a horizontal resolution of 0.25° × 0.25° [30]. It accounts for atmospheric interactions such as cloud and aerosol reflection, absorption and transmission. ERA5 provides SSRD as accumulated energy in joules per square meter (J/m2) over a 1-hour period. These values were converted to W/m2.
In the MERRA-2 dataset, GHI corresponds to the Surface Incoming Shortwave Flux (SWGDN). This dataset provides values at an hourly temporal resolution, with each value representing the average flux over the preceding hour. The timestamp is assigned to the center of the hour, meaning a value at 00:30 UTC corresponds to the period from 00:00 to 01:00 UTC. The spatial resolution is approximately 69.375 km in longitude and 55 km in latitude (0.5° × 0.625°), with irradiance values directly expressed in W/m2 [31]. To ensure consistency with ground measurement data, each value was assigned to the end of its respective recording period.
Finally, the Surface Incoming Shortwave Radiation (SIS) data from SARAH-3 were utilized. This dataset covers the full disk of METEOSAT, including Europe, Africa and the Atlantic Ocean. Derived from MVIRI/SEVIRI sensors onboard METEOSAT satellites, the data are provided at an instantaneous temporal resolution, recorded at 30-minute intervals. The spatial resolution is 0.05° × 0.05° in latitude and longitude [32]. To obtain hourly SIS values ( SIS calc ), the mean of three consecutive 30-minute records ( SIS rec ) was calculated as shown in Equation (1). This choice was made not only to align with the WMO definition, which states that the timestamp assigned to hourly data corresponds to the end of the measurement period [33], but also because using these three consecutive values provided better agreement with ground-based data.
SIS calc ( hh : 00 ) = SIS rec ( hh - 1 : 00 ) + SIS rec ( hh - 1 : 30 ) + SIS rec ( hh : 00 ) 3
where hh:00 is the timestamp of the hourly data point, hh−1:00 is the record 1 h before hh:00 and hh−1:30 is the record 30 min before hh:00.

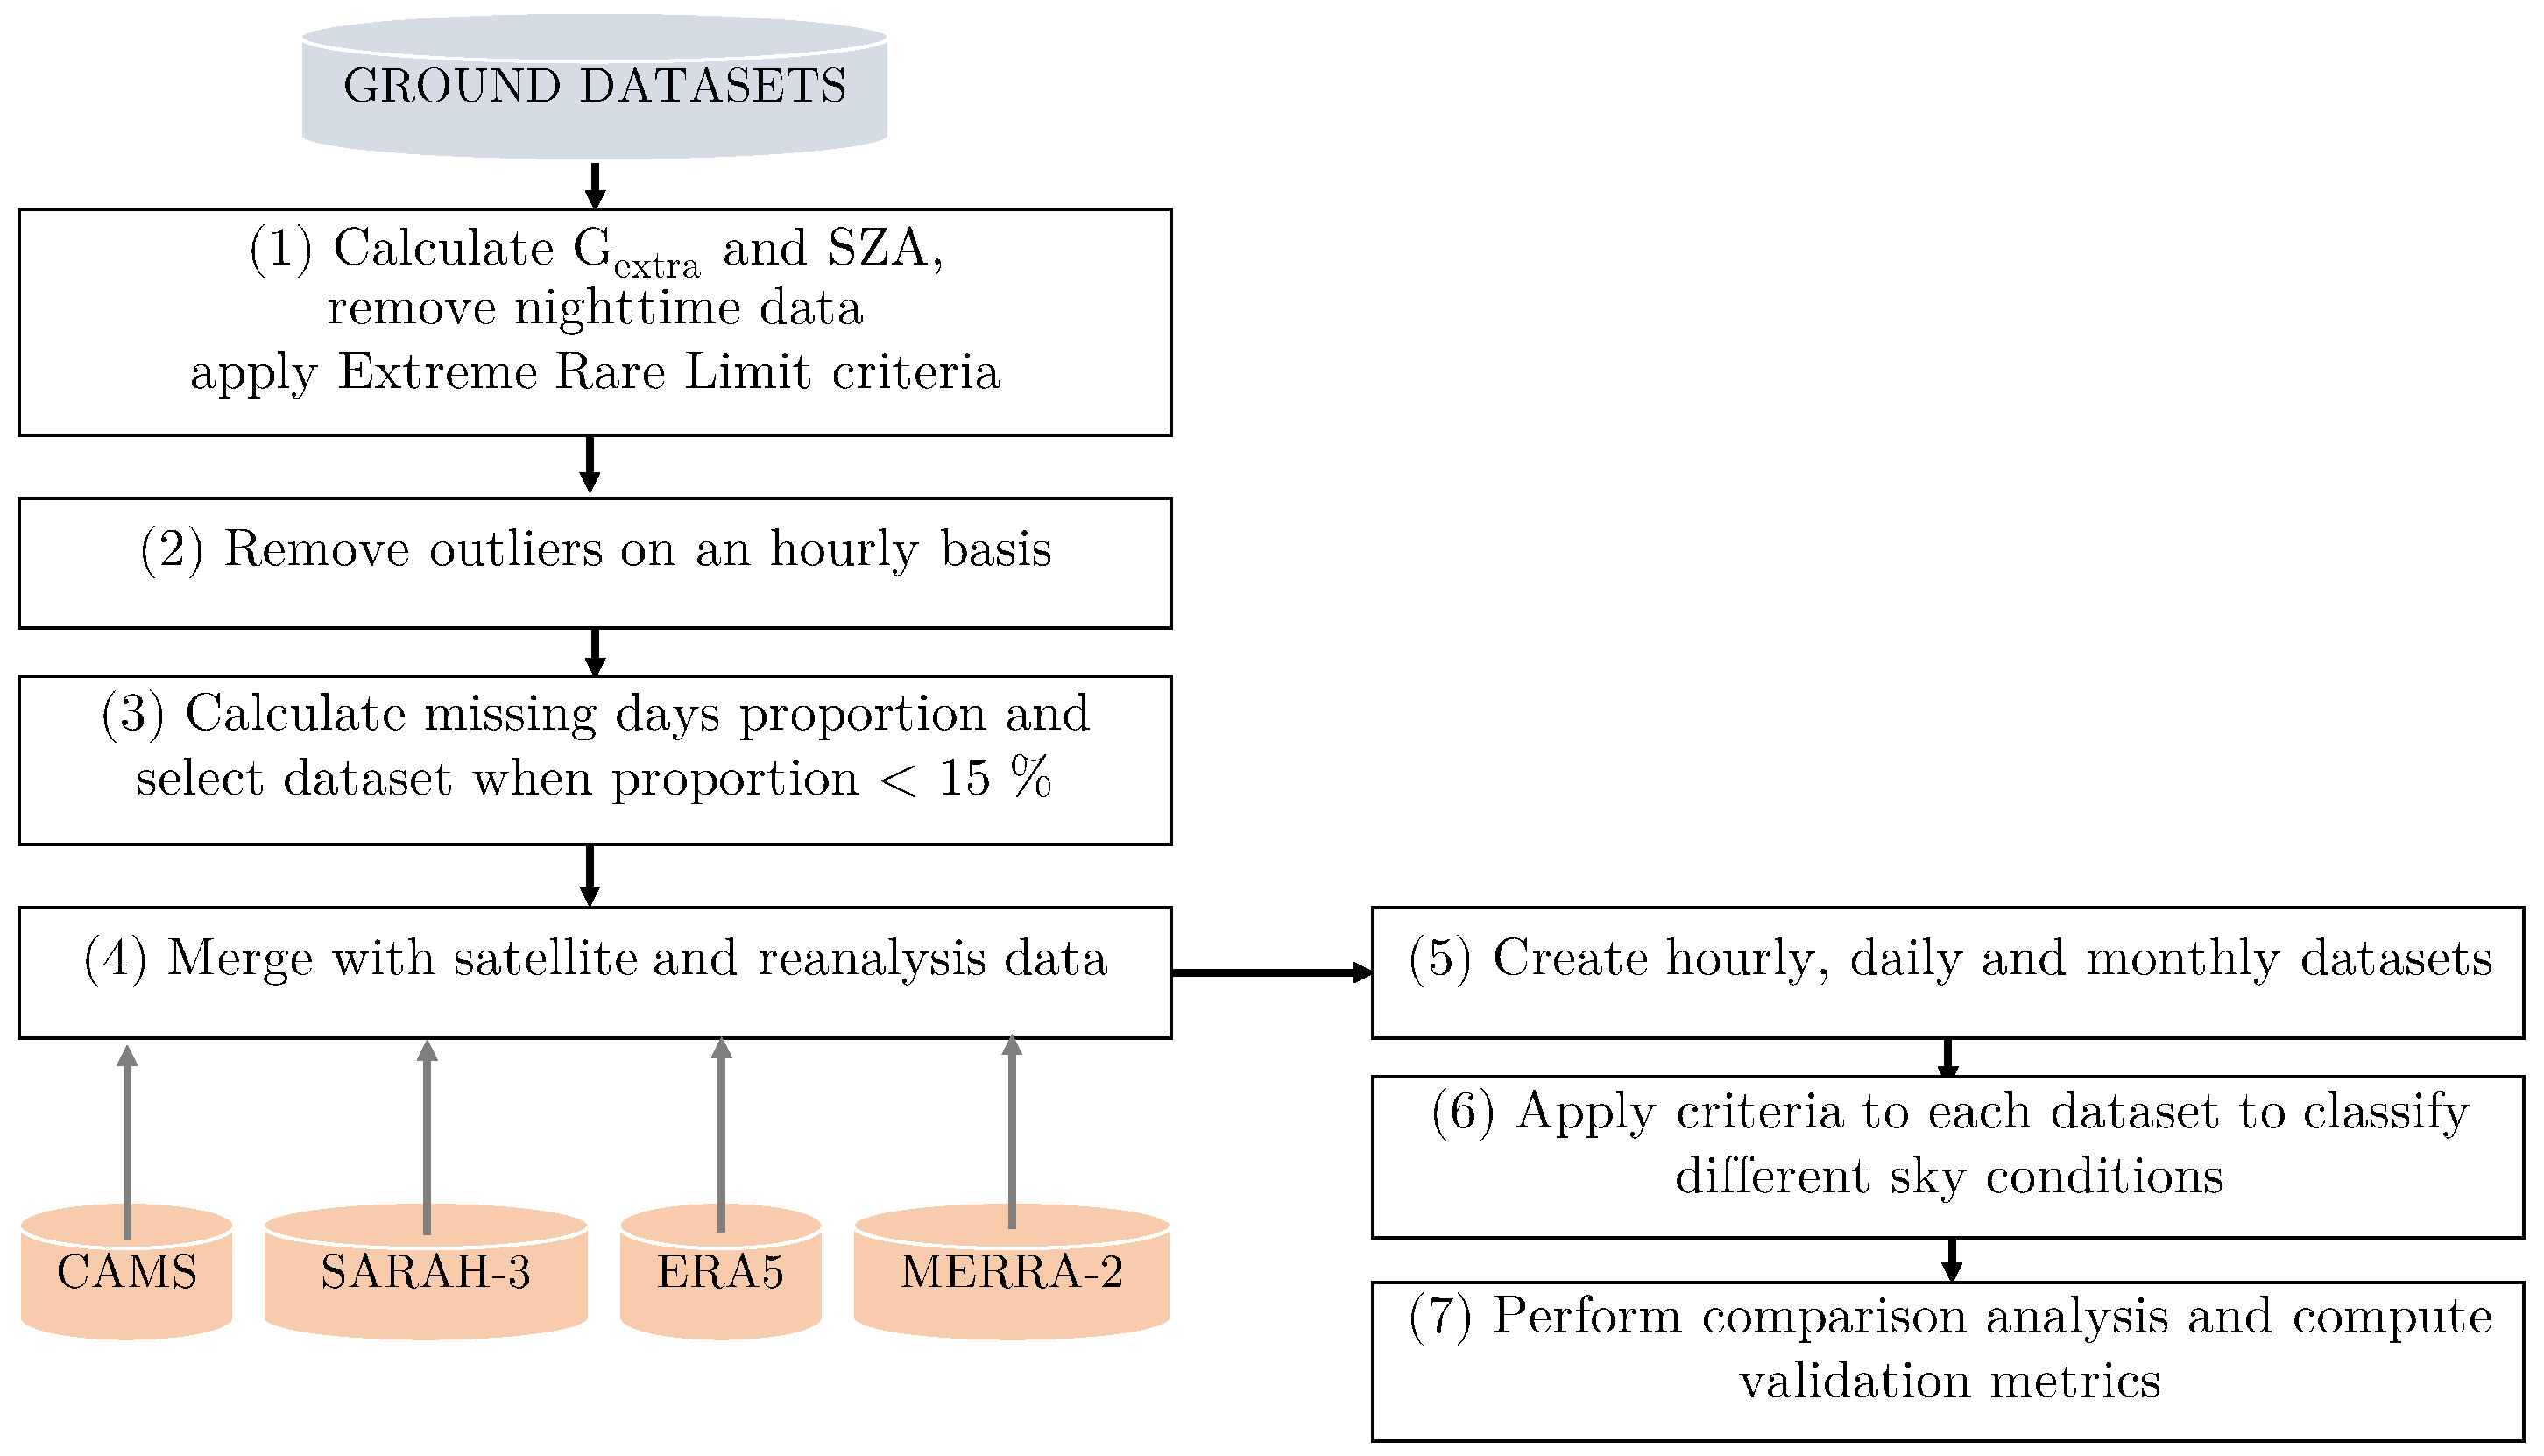
2.3. Quality Control of Ground Measurements Database

The in situ data used in this study were provided by the Société d’Exploitation et de Développement Aéroportuaire, Aéronautique et Météorologique en Côte d’Ivoire (SODEXAM). These hourly data originated from 84 monitoring stations located in different climatic zones and initially covered the period from 2016 to 2024, before any filters were applied. SODEXAM manages data from more than 561 agrometeorological and climatological stations. These synoptic and automatic weather stations, located throughout Côte d’Ivoire and compliant with the standards of the World Meteorological Organization (WMO), include many key operators such as the Centre International de Recherche en Agroforesterie (ICRAF) and the West African Science service center on Climate change and Adapted Land use (WASCAL) [34,35]. The WASCAL automatic weather stations are part of a mesoscale research observation network developed in collaboration with WASCAL and partner institutions. These stations record measurements at a temporal resolution of five-minute averages, with regular maintenance, including sensor cleaning, conducted approximately twice a month [9]. Data collection was guided by availability, with the goal of covering multiple locations across the country to ensure a representative sample of GHI conditions. To ensure the reliability of the validation results, these datasets underwent several quality checks, as shown in the flowchart of Figure 2.
The initial step involved removing nighttime data based on sunrise and sunset times at each station. Then, the data were subjected to a quality control process based on the framework specified by [36]. The Extreme Rare Limit (ERL) was applied as follows, with the upper limit set to 50 when α < 0° [36,37].
ERL : 0.03 × G extra < G grd < 1.2 × 1367 × cos 90 α 1.2 + 50
where α is the solar altitude angle, G grd is the GHI measured on the ground and G extra is the extraterrestrial GHI (at the top of the atmosphere), given by Equation (2):
G extra = G sc × ε × sin ( ϕ s )
where ϕ s is the solar elevation and ε is the correction to the actual solar distance at any specific time in the year [38]. Next, outliers were removed using the far-outlier limit criteria, mathematically defined by Equations (3) and (4) [39]:
L lower = Q 1 3 × ( Q 3 Q 1 )
L upper = Q 3 + 3 × ( Q 3 Q 1 )
where L lower is the lower outlier limit, L upper is the upper outlier limit, Q 1 is the first quartile and Q 3 is the third quartile. As GHI varies significantly between hours and months, this method was applied at each station, separately for each month–hour combination. For instance, January-07:00 data, January-08:00 data and so on were used. Data that fell outside these limits were flagged as outliers and removed. This method reduced the dataset from 1,326,940 data points to 849,169 data points, meaning that 36% of the data were classified as outliers. Then, we ensured that the datasets contained at least 1 year of data with fewer than 15% missing days. A missing day was defined as a day with at least two (18%) missing hours between 7 AM and 5 PM [40]. This filtering resulted in a dataset of 52 remaining stations, with data spanning different periods depending on the station, ranging from 11 August 2016 to 25 June 2024. The distribution of missing day proportions is shown in Table 1.

2.4. Classification of Sky Conditions

The data were classified into three categories: clear-sky, cloudy-sky and overcast conditions. Sky conditions can be determined by several parameters, including sky brightness (Δ), the cloudiness index ( K d ) and the clearness index ( K t ), with K t being the most widely used [41]. The clearness index, defined by Equation (5), has been extensively studied in the literature.
K t = G grd G extra
To differentiate between sky conditions, various thresholds have been adopted, depending on the region, the study’s focus and even the season [42,43]. Reindl et al. [44] considered K t values above 0.6 as clear sky and below 0.2 as cloudy. Other studies use different thresholds, such as 0 to 0.15 (overcast), 0.15 to 0.7 (intermediate) and greater than 0.7 (clear sky) [45]. Kuye et al. [46] found K t values greater than 0.65 and between 0.12 and 0.35 as very clear and cloudy skies, respectively, in Port Harcourt, Nigeria. Another study in West Africa (Ghana and Burkina Faso) classified skies based on K t values of 0.6 or higher as clear and between 0.12 and 0.35 as cloudy [9]. The method used in the present study to differentiate between sky conditions is described as follows. The root mean square difference (RMSD) and the mean bias difference (MBD) between the ground-measured GHI and the clear-sky GHI obtained from the McClear model were calculated for all stations and plotted as a function of the calculated K t , as shown in Figure 3. The figure reveals three distinct regions: When K t = 0.7 , the RMSD and MBD values reach zero at almost all stations, indicating that the measured GHI values are equal to the clear-sky values. Beyond this value, the metrics remain at zero at most stations, while at some stations, the measured GHI values exceed those predicted by the model, which is possible due to scattering phenomena. Conversely, when K t 0.35 , the average differences range between 200 and 400 W / m 2 , corresponding to more than 60% of the clear-sky GHI value. Between these two limits, the metrics decrease linearly as the value of K t increases.
This analysis allowed the distinction of three sky conditions: clear-sky ( K t 0.65 ), cloudy-sky ( 0.35 K t < 0.65 ) and overcast ( K t < 0.35 ) conditions. Figure 4 presents a comparison between the measured GHI values and those given by the McClear model for these three conditions for the Dimbokro station.

2.5. Validation Metrics

To assess the performance of the retrieved satellite and reanalysis data, several statistical parameters were used, including standard metrics (the coefficient of determination ( R 2 ), the relative mean bias difference (rMBD), the relative root mean square difference (rRMSD) and the Pearson correlation coefficient (r)) and advanced metrics such as the Kolmogorov–Smirnov Integral (KSI), OVER statistic and combined performance index (CPI). The term “Difference” is used in this paper instead of “Error” to highlight the fact that observed data themselves are imperfect and contain errors [47]. The coefficient of determination measures the proportion of the variance in the dependent variable (ground GHI) that is predictable from the independent variables (satellite and reanalysis GHI). It is defined by Equation (6).
R 2 = 1 i = 1 N ( Grd i Sat i ) 2 i = 1 N ( Grd i Grd ¯ ) 2
where Grd i are the observed GHI values, Sat i are the satellite-based GHI values, Grd ¯ is the mean of the observed values and N is the number of data points. Most often, R 2 ranges from 0 to 1, with values closer to 1 indicating a good fit. However, a negative values can be found, indicating a worse fit than the average line [48]. In the context of this paper, such values would indicate that the satellite or reanalysis product is less performant than simply using the mean of the observed GHI. This could arise due to high variability in the data that the model cannot capture.
The rMBD measures in percentage the average bias between the model data and observed data. It is calculated with the formula given by Equation (7). A positive rMBD indicates overestimation, while a negative rMBD indicates underestimation.
rMBD = MBD Grd ¯ × 100 % , where MBD = 1 N i = 1 N ( Sat i Grd i )
The rRMSD measures in percentage the average magnitude of the differences. The rRMSD provides a sense of the model’s overall accuracy, with lower values indicating better performance. It is defined by Equation (8):
rRMSD = RMSD Grd ¯ × 100 % , where RMSD = 1 N i = 1 N ( Sat i Grd i ) 2
The Pearson correlation coefficient (r) measures the linear correlation between observed and predicted values (Equation (9)). r ranges from 1 (perfect negative correlation) to 1 (perfect positive correlation), with 0 indicating no linear correlation.
r = i = 1 N ( Grd i Grd ¯ ) ( Sat i Sat ¯ ) i = 1 N ( Grd i Grd ¯ ) 2 i = 1 N ( Sat i Sat ¯ ) 2
The rMBD and rRMSD, referred to as Class A metrics in [47], are useful for assessing the dispersion of individual points in performance evaluation studies. Along with standard deviation and the coefficient of determination, they are among the most commonly used metrics for evaluating model performance. However, these parameters alone are often insufficient for establishing a comprehensive and coherent benchmarking comparison [49], highlighting the need for more advanced similarity indicators. Several metrics have been introduced, including the Kolmogorov–Smirnov Integral (KSI), the OVER statistic and the combined performance index (CPI) (Equations (10)–(12)) [47,49]. Unlike Class A metrics, these so-called Class C indicators provide insights into the similarity between different distributions, offering a deeper understanding of how well a model replicates the statistical properties of reference data. The usefulness of such indicators is justified by the fact that, for instance, a model that better matches the distribution of observed data tends to be more reliable for downstream applications.
KSI [ % ] = 100 A c × x min x max D n ( x ) dx
OVER [ % ] = 100 A c × x min x max max D n ( x ) D c , 0 dx
CPI [ % ] = 1 4 × ( KSI + OVER + 2 × rRMSD )
D c = 1.63 N , A c = D c ( x max x min ) , D n ( x ) = max CDF grd ( x ) CDF sat ( x )
where x min and x max are the minimum and maximum values of the union of satellite-based GHI and observed GHI values and D n ( x ) is the absolute difference between the two empirical cumulative distribution functions CDF grd ( x ) and CDF sat ( x ) for ground data and satellite data, respectively. A c is the critical area, a characteristic quantity of the distribution. The KSI metric quantifies the agreement between the cumulative distribution functions of satellite GHI and observed GHI values. The OVER metric builds on the KSI by measuring differences between the two CDFs but only where they exceed a critical threshold, D c ( N 35 ). The CPI combines the KSI, OVER and the rRMSD to provide a comprehensive assessment of both distribution similarity and overall difference [47,49,50]. In the present study, the KSI and OVER metrics were computed using the kolmogorov_smirnov_integral and over functions from the Solar Forecast Arbiter’s solarforecastarbiter.metrics.deterministic module [50].

2.6. Data Aggregation

The data provided by SODEXAM consist of hourly measurements. To obtain daily GHI, hourly values were summed. This approach was chosen not only to investigate how temporal aggregation affected error characteristics, which was a key objective of this study, but also because daily totals are commonly used for assessing solar resource availability and evaluating photovoltaic system performance. In datasets like ERA5, daily aggregation is performed during the retrieval process and is not part of a permanently archived dataset [51]. Therefore, summation was applied to hourly data for both observed measurements and satellite or reanalysis products. Monthly data were then derived by computing the arithmetic mean of daily values, as this metric is widely recognized as important for evaluating model performance on a monthly basis [52]. During the averaging process, any month with more than ten missing days or five or more consecutive missing days was excluded [53,54]. The outlier removal method was applied to the aggregated data. Although hourly data were cleaned, small remaining anomalies in individual hours could accumulate, leading to an anomalous daily sum. Additionally, missing values in hourly data could abnormally reduce the daily sum. For daily data, outlier removal was performed by grouping data by month to account for seasonal variability. To classify daily and monthly sky conditions, the same method used for differentiating sky conditions in hourly data was applied. The classification for daily data was as follows: clear-sky ( K t 0.6 ), cloudy-sky ( 0.2 K t < 0.6 ) and overcast ( K t < 0.2 ) conditions. For monthly data, the MBD and RMSD graphs as a function of K t did not provide a clear distinction between the three sky conditions, particularly for overcast conditions. Therefore, K t values greater than or equal to 0.55 were assigned to clear-sky conditions, while lower values were classified as cloudy-sky conditions. For comparison across different timescales, only clear-sky and all-sky conditions were considered.
To evaluate the average agreement between models and ground data throughout the day for each sky condition, daily trends were analyzed by comparing satellite and reanalysis products with ground measurements. Days classified under a specific sky condition were first extracted for each station. In the hourly dataset, data points of the corresponding days for each station were selected and the mean GHI values were calculated for each hour for both ground measurements and satellite products. The 95% confidence interval (CI) was then computed using the formula from Equation (14) [55].
CI = 1.96 × σ N
where σ is the standard deviation of the sample, N is the sample size and 1.96 is the critical value for a 95% confidence level.

3. Results

In this section, for readability purposes, most of the results will only include a selection of stations, prioritizing those that exhibit particular singularities. In the absence of singularities, the stations with the best and worst results will be presented, or simply those with the most data.

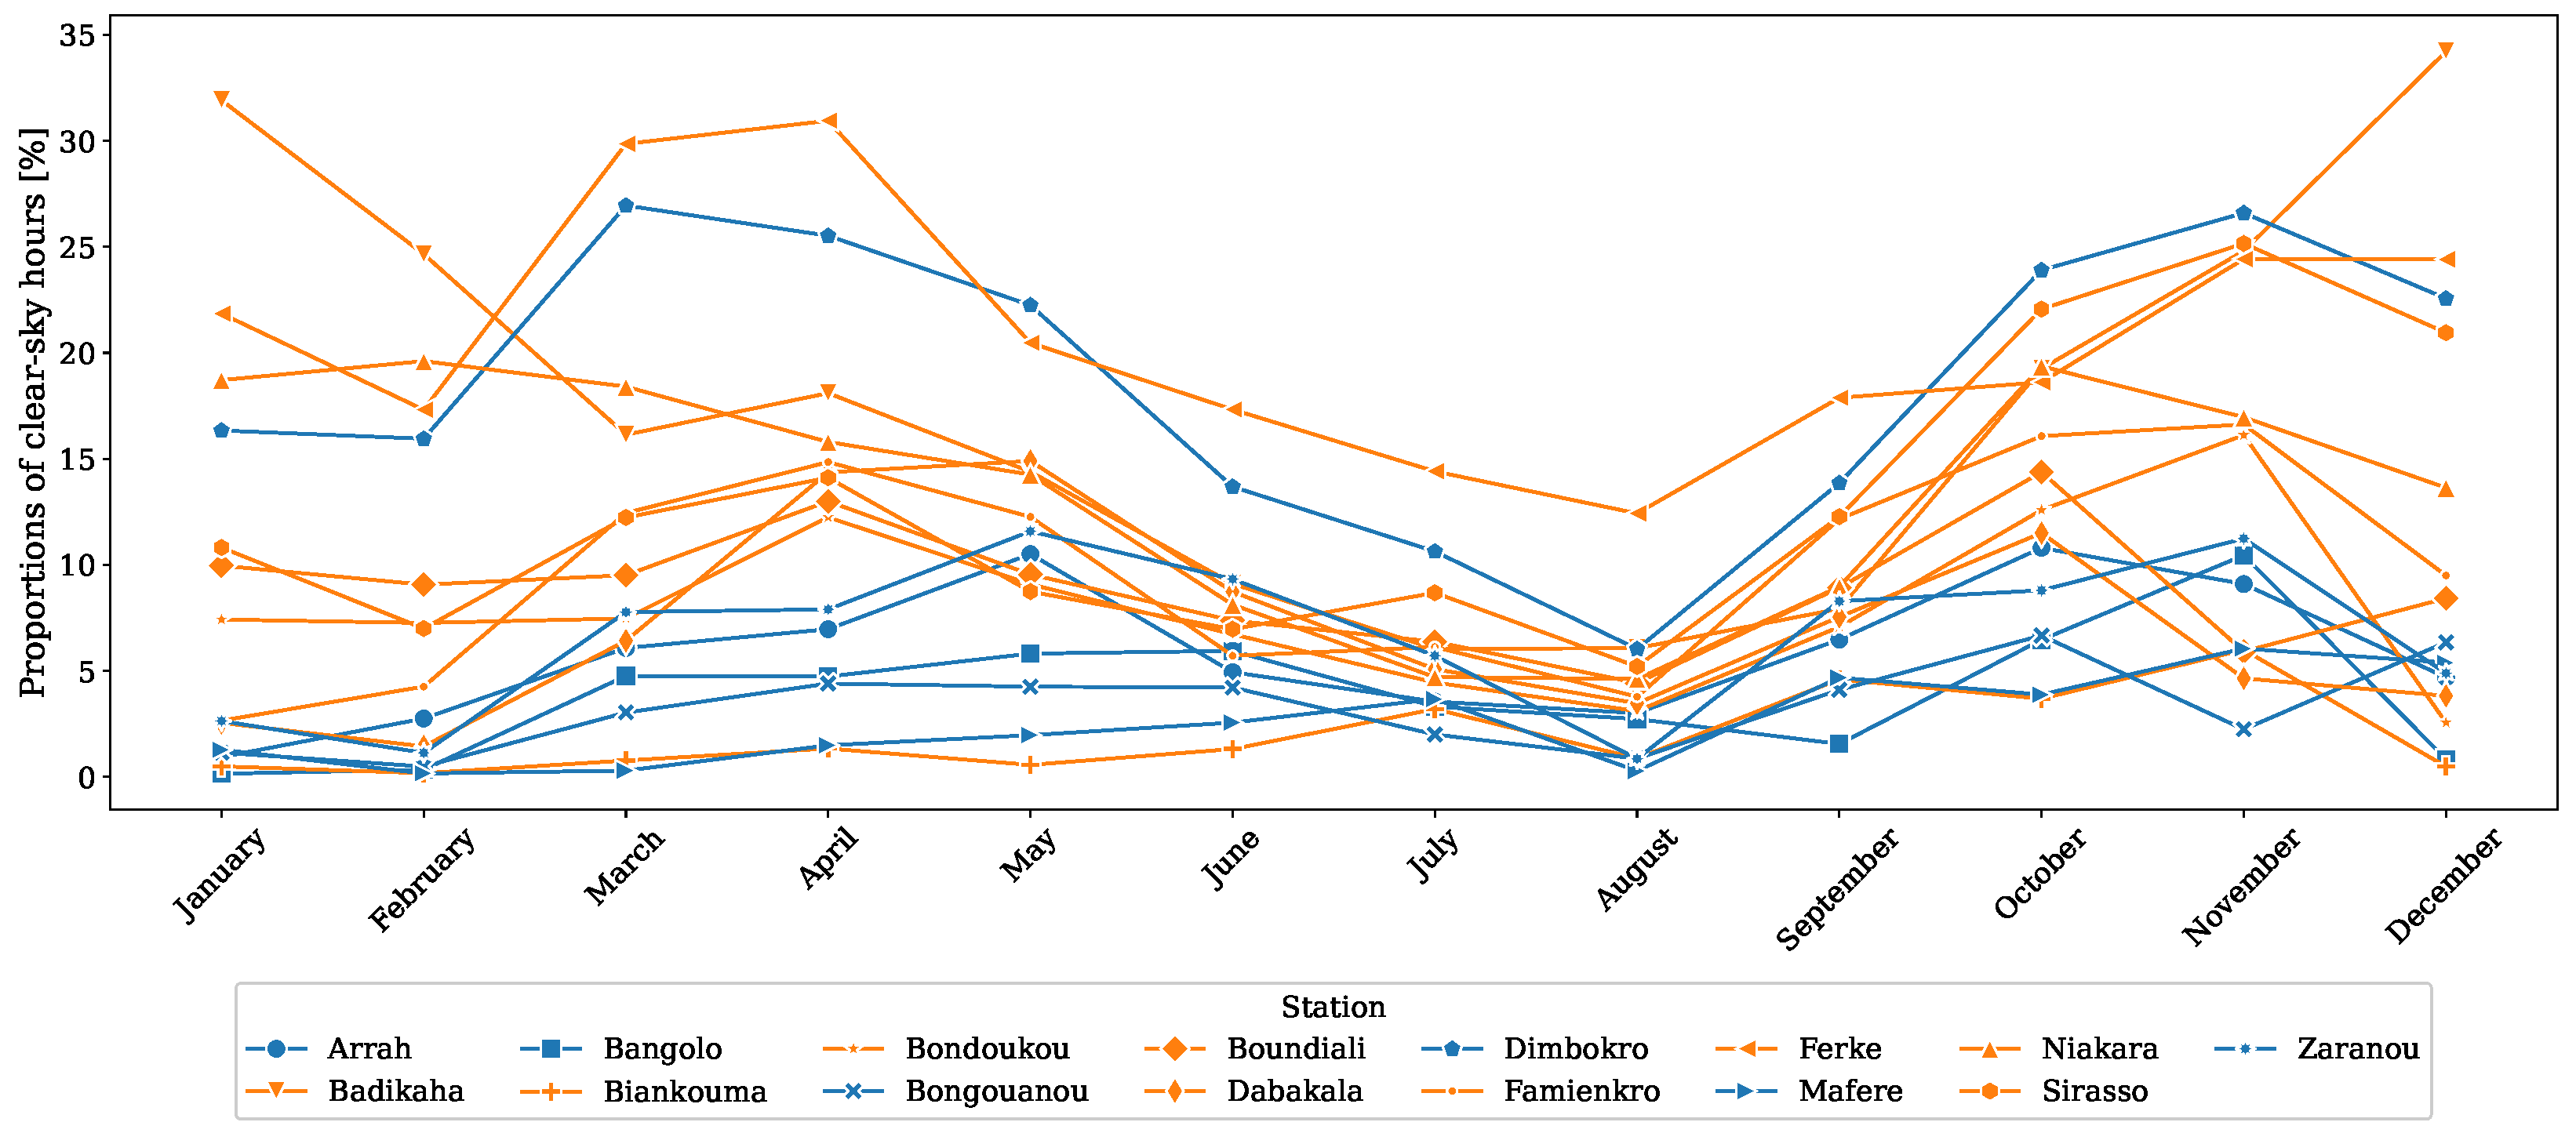
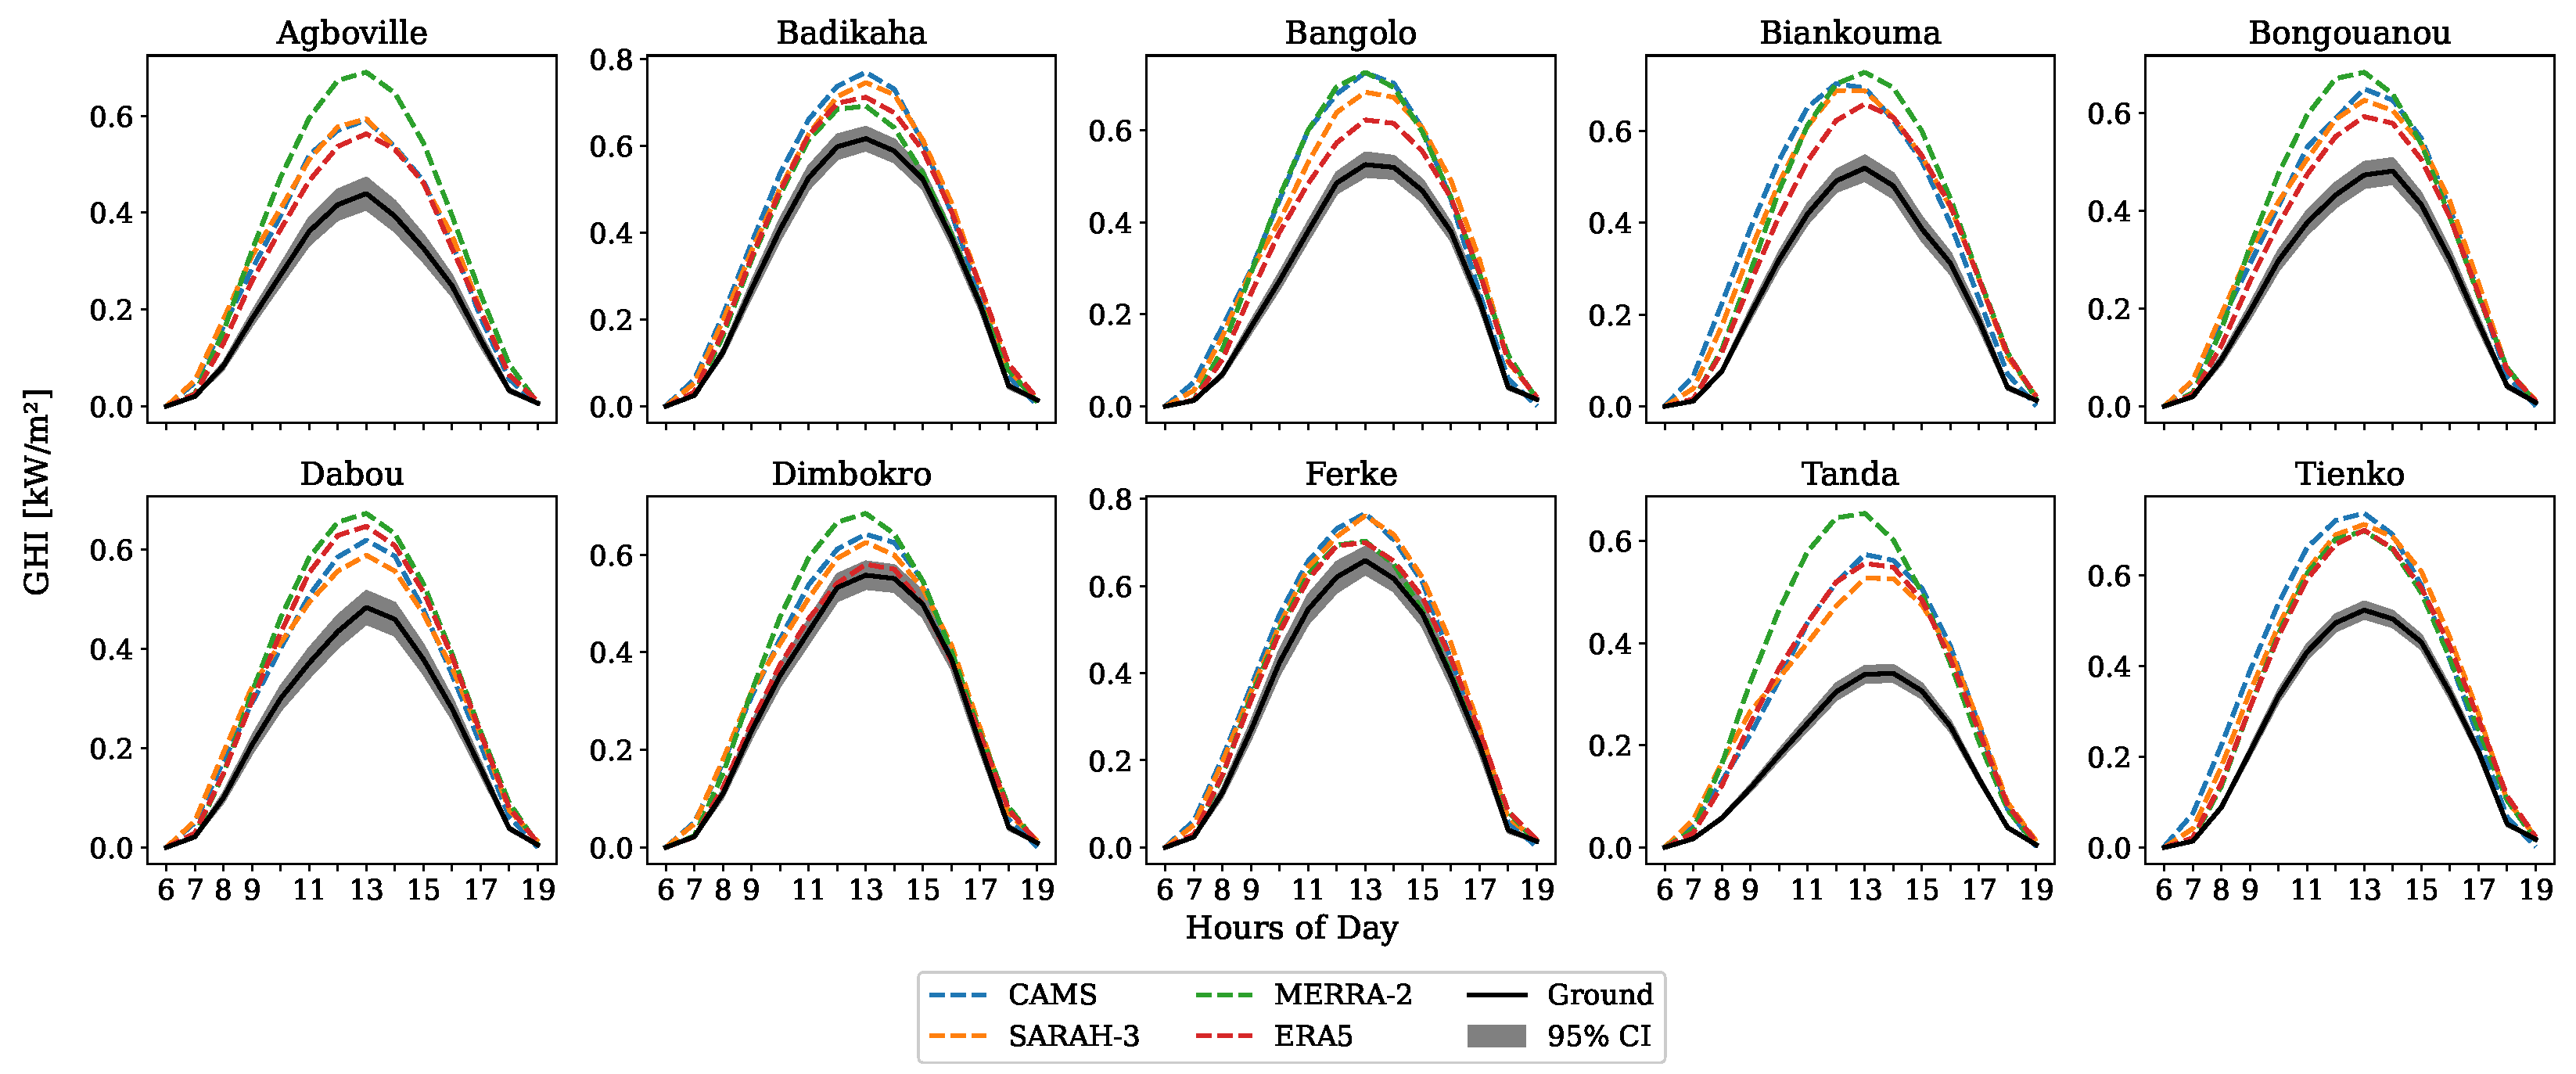
3.1. Clear-Sky Conditions

Figure 5 presents the monthly proportions of clear-sky hours across 15 stations in the dataset of the present study. The proportion of clear-sky hours varies by month and location, with the highest value (Badikaha, December) remaining below 40%. The highest proportions are observed during the dry season (November to April), particularly in the tropical zone. In this region, Badikaha records the highest values, reaching 34.2% in December and 31.9% in January. In contrast, stations in the equatorial zone (Arrah, Bangolo, Bongouanou) exhibit lower clear-sky proportions during this period, often falling below 10%. During the wet season (June to September), clear-sky proportions decrease across all stations. In the equatorial zone, values frequently drop below 5%. Transition months like May and October show transitional patterns, with clear-sky proportions increasing as the dry season approaches (October) or decreasing as the wet season begins (May).
Spatially, stations in the tropical zone show higher clear-sky proportions compared to equatorial stations. Dimbokro is an exception, showing relatively high values (26.9% in March and 26.6% in November) despite being located in the equatorial zone. Similarly, Biankouma deviates from the pattern observed in stations within the tropical zone, recording relatively low proportions of clear-sky hours, particularly from December to May. Although classified within the tropical zone, the Biankouma station (7.73°N, 7.61°W) is situated in the mountainous northwestern region of Côte d’Ivoire, which is characterized by high humidity and annual rainfall exceeding 200 mm [35]. These climatic conditions contribute to persistent cloud cover in the region. While the case of Dimbokro requires further investigation, it is worth noting that this station is located in the southern part of central Côte d’Ivoire, at the boundary between the savanna and forest zones. Dimbokro is known for its relatively flat terrain with very few hills [56], which could reduce the effects of orographic lifting, leading to fewer clouds.

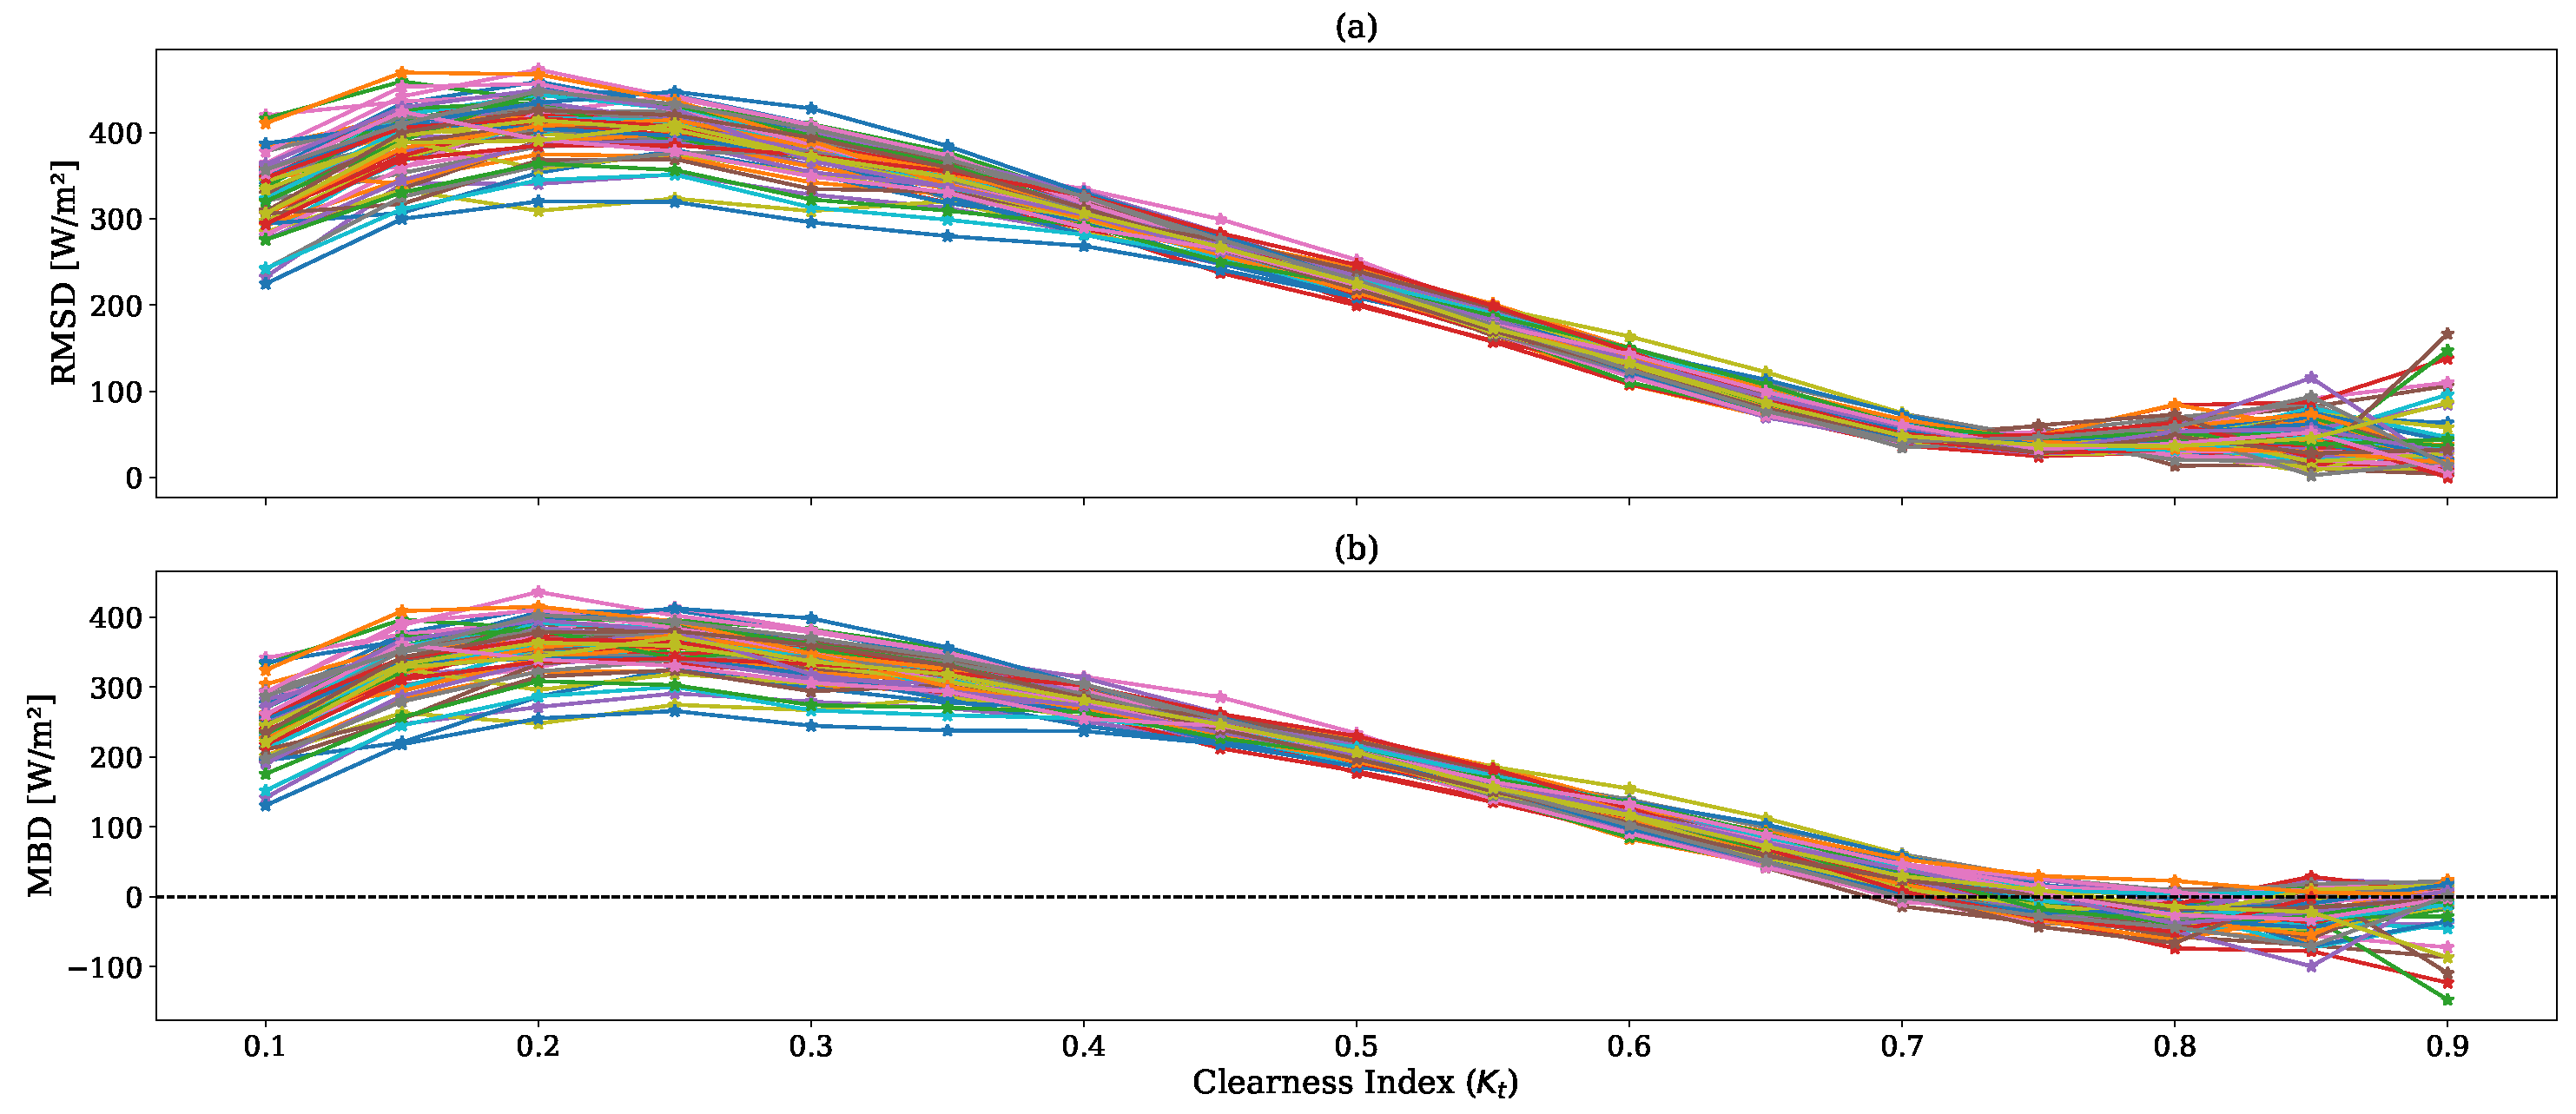
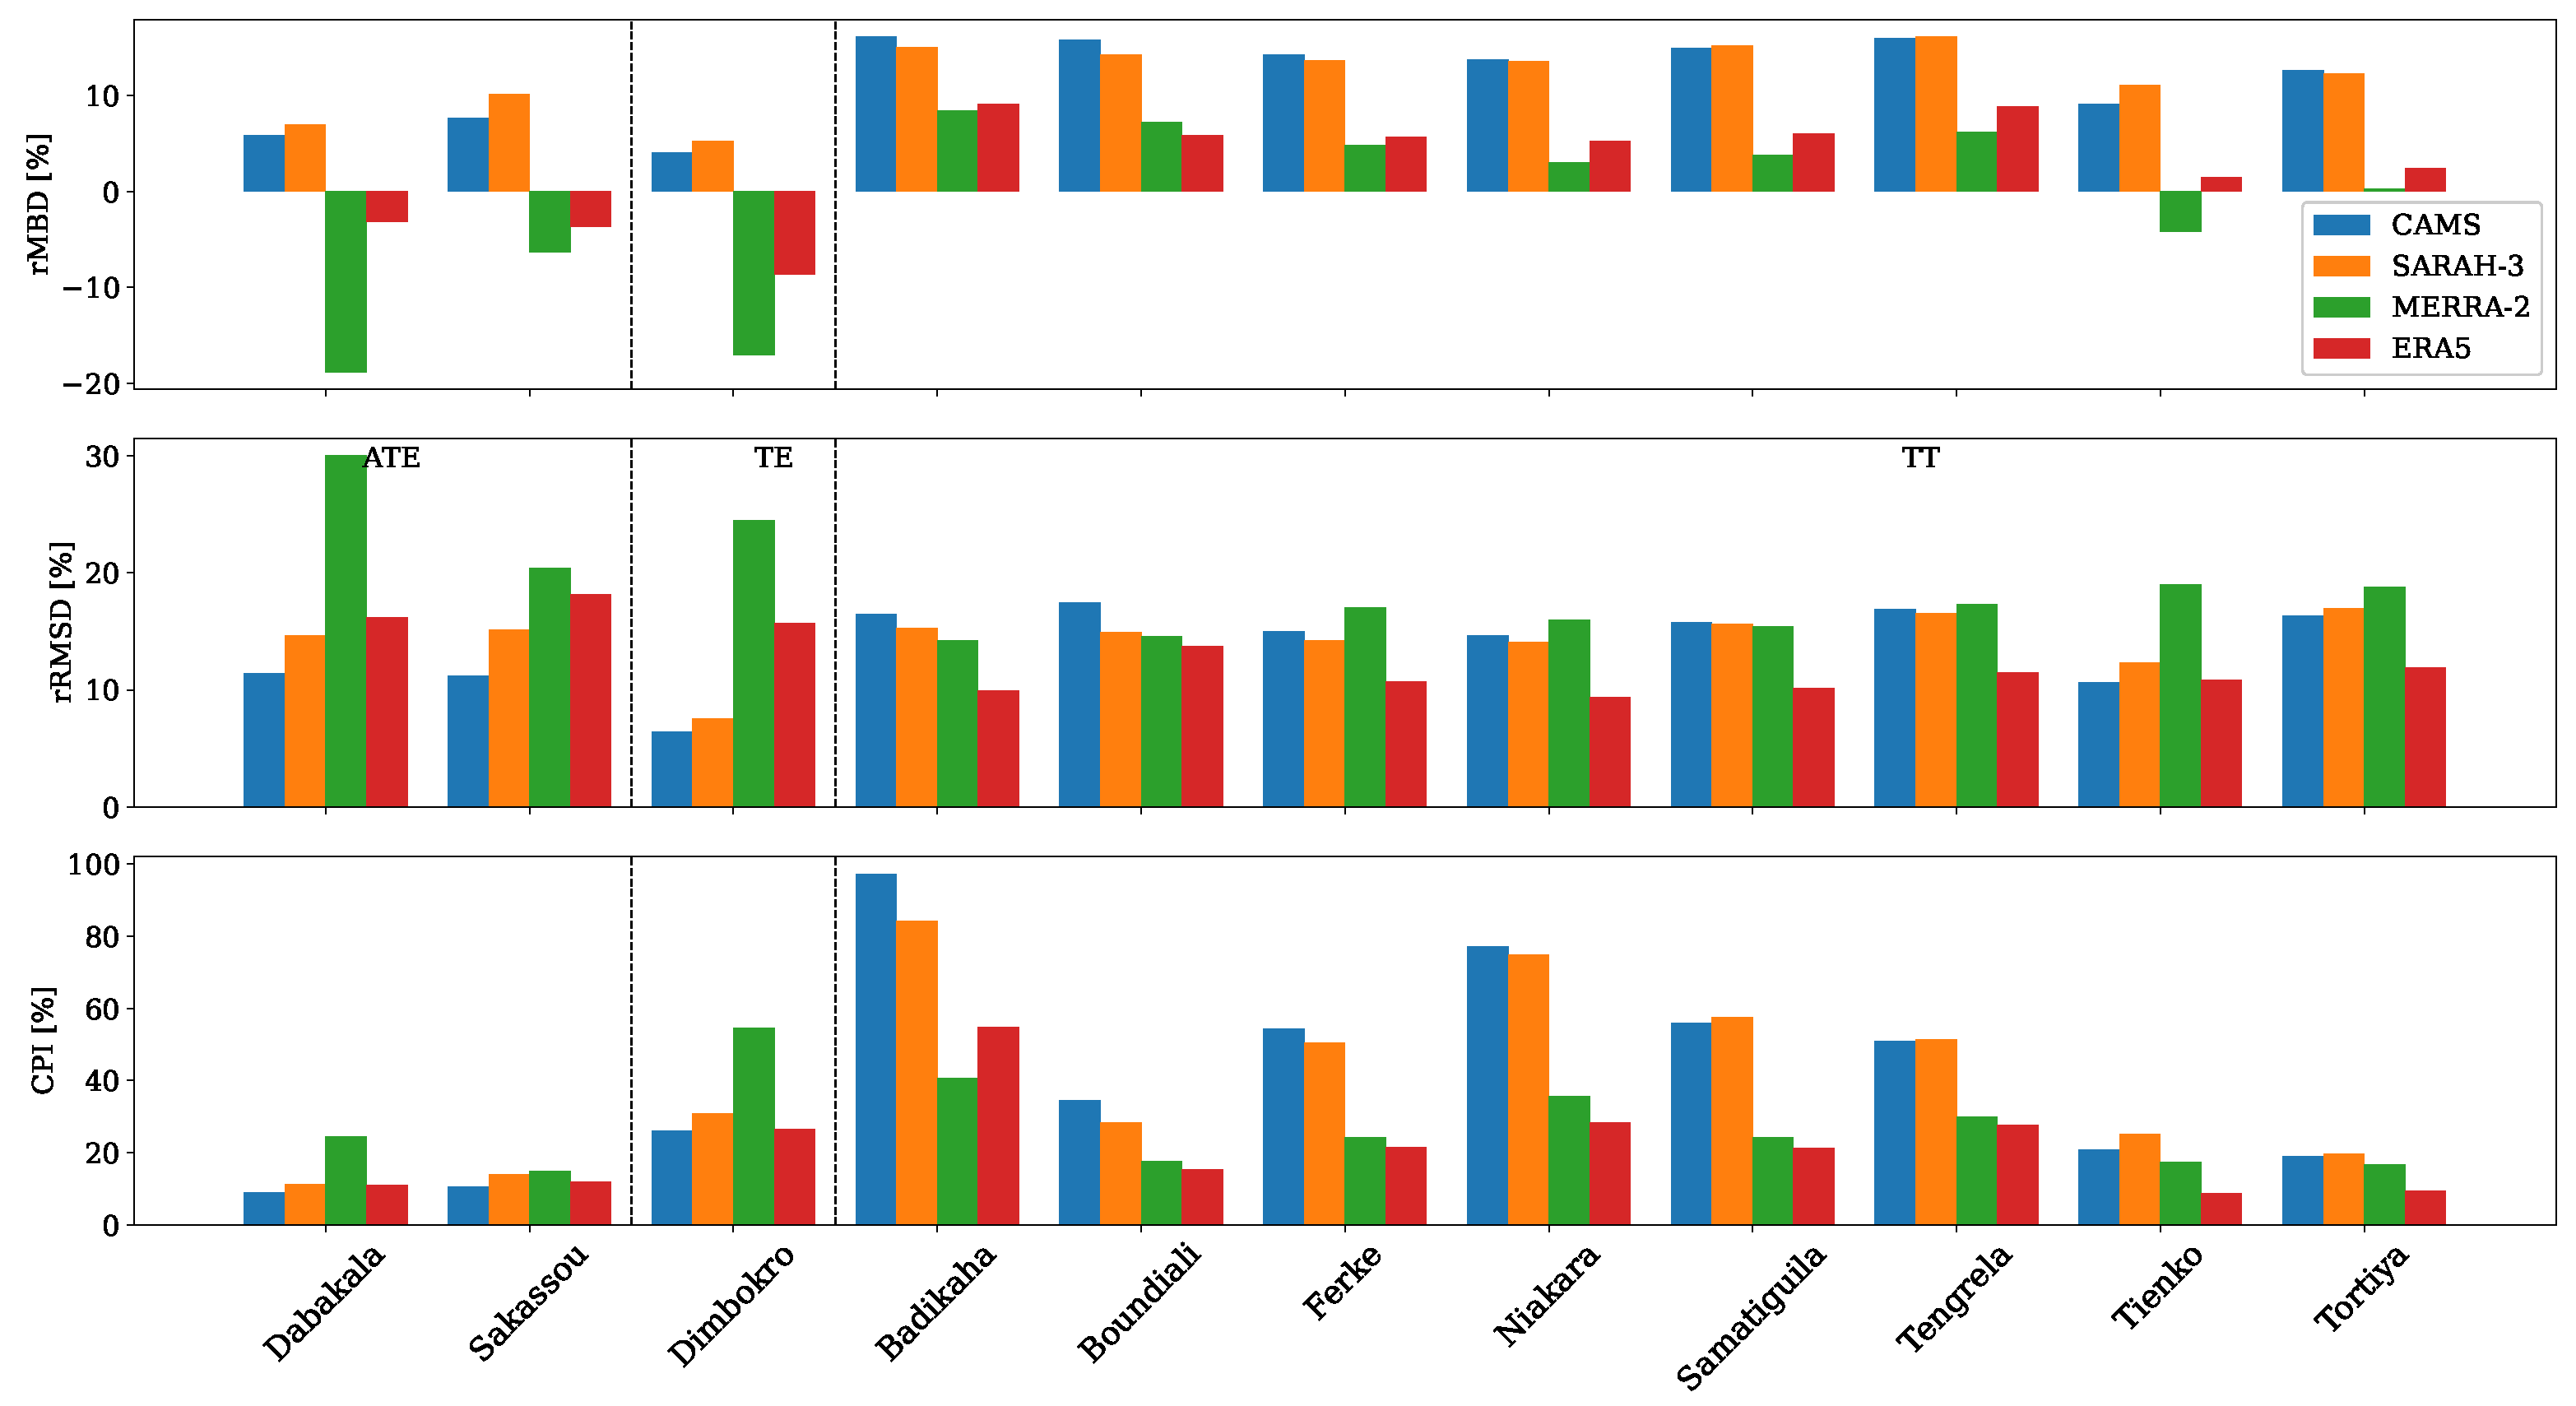
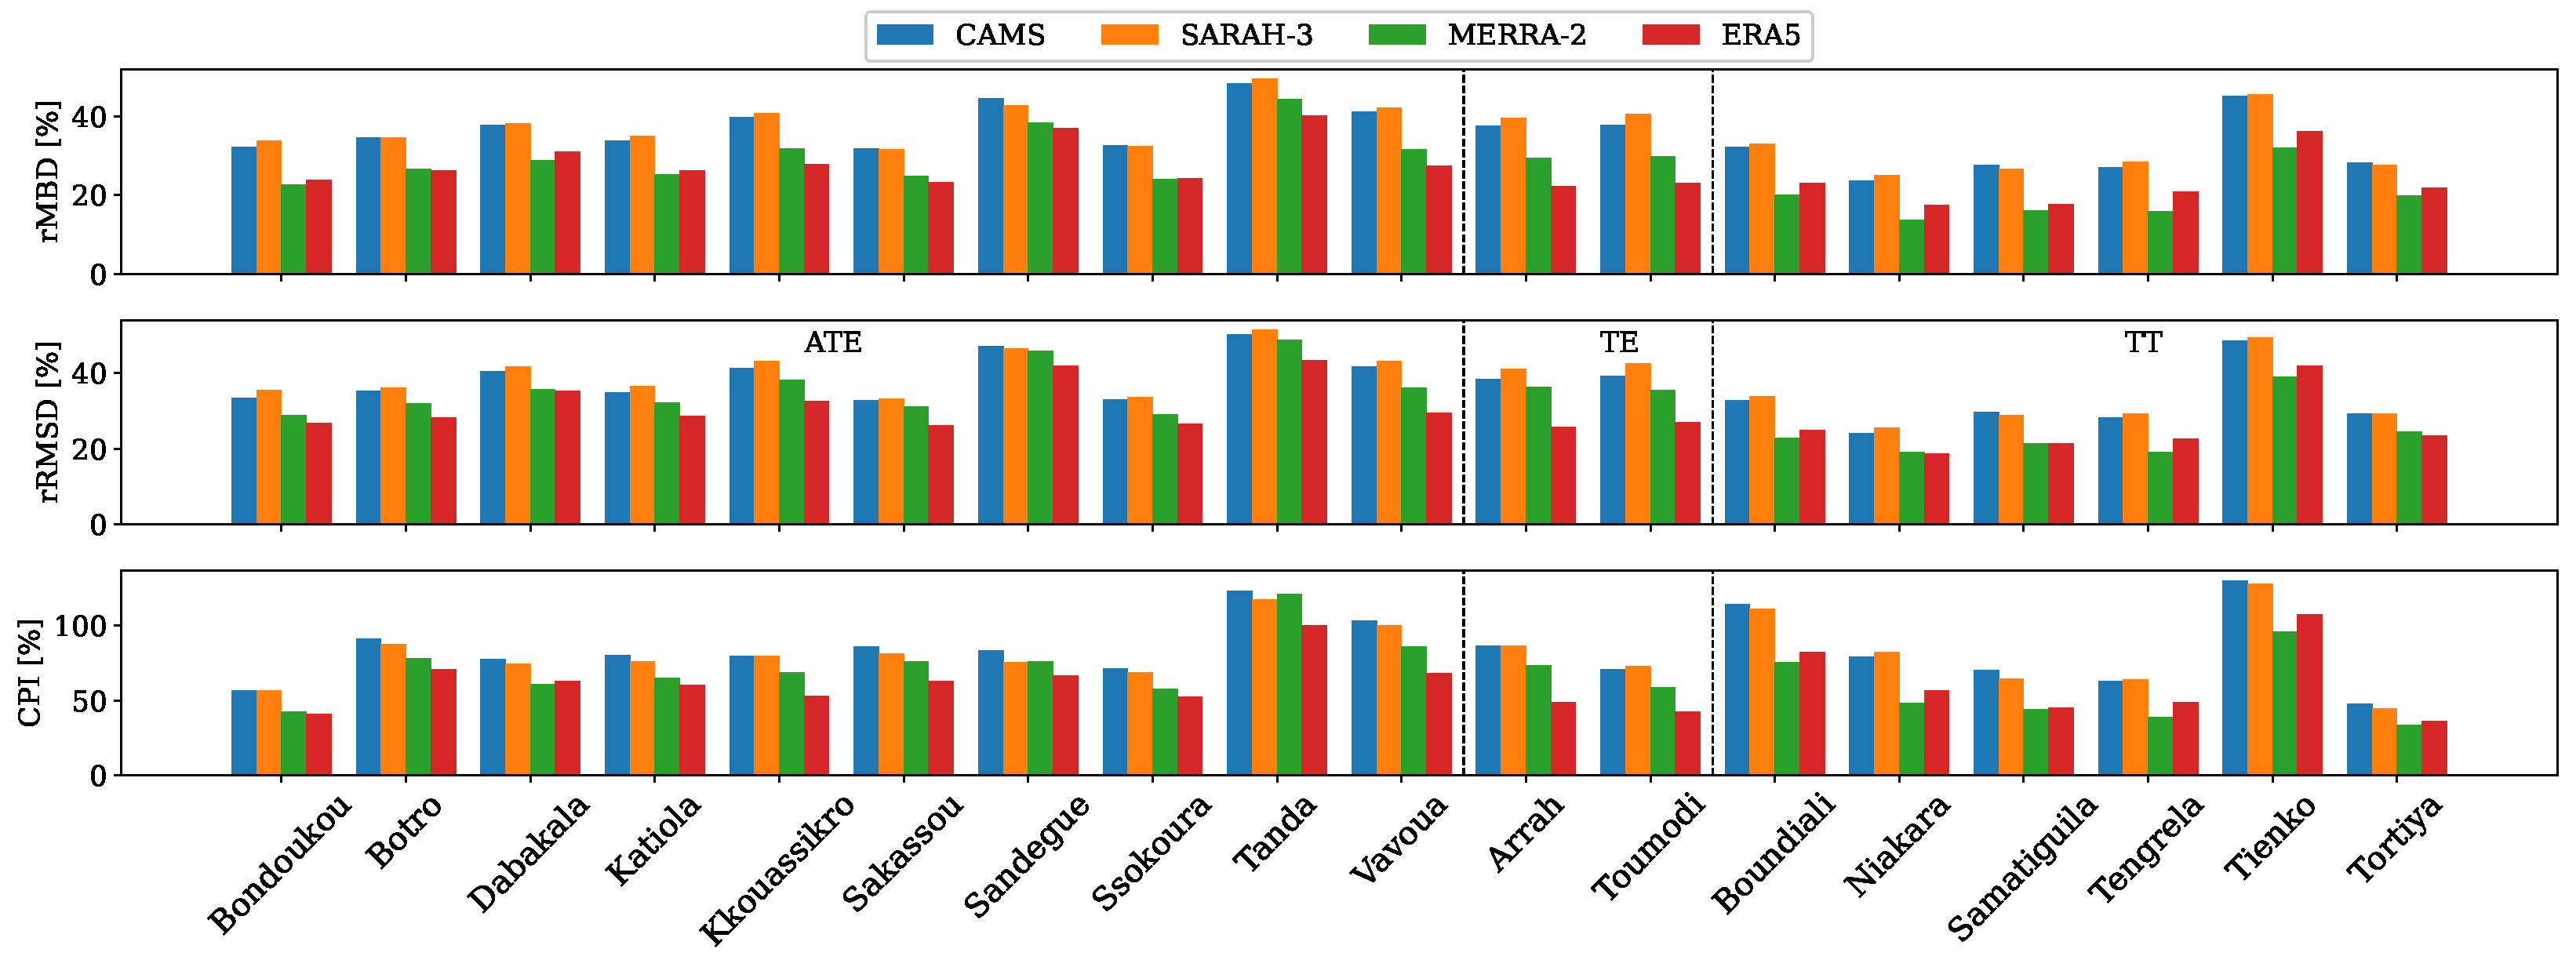
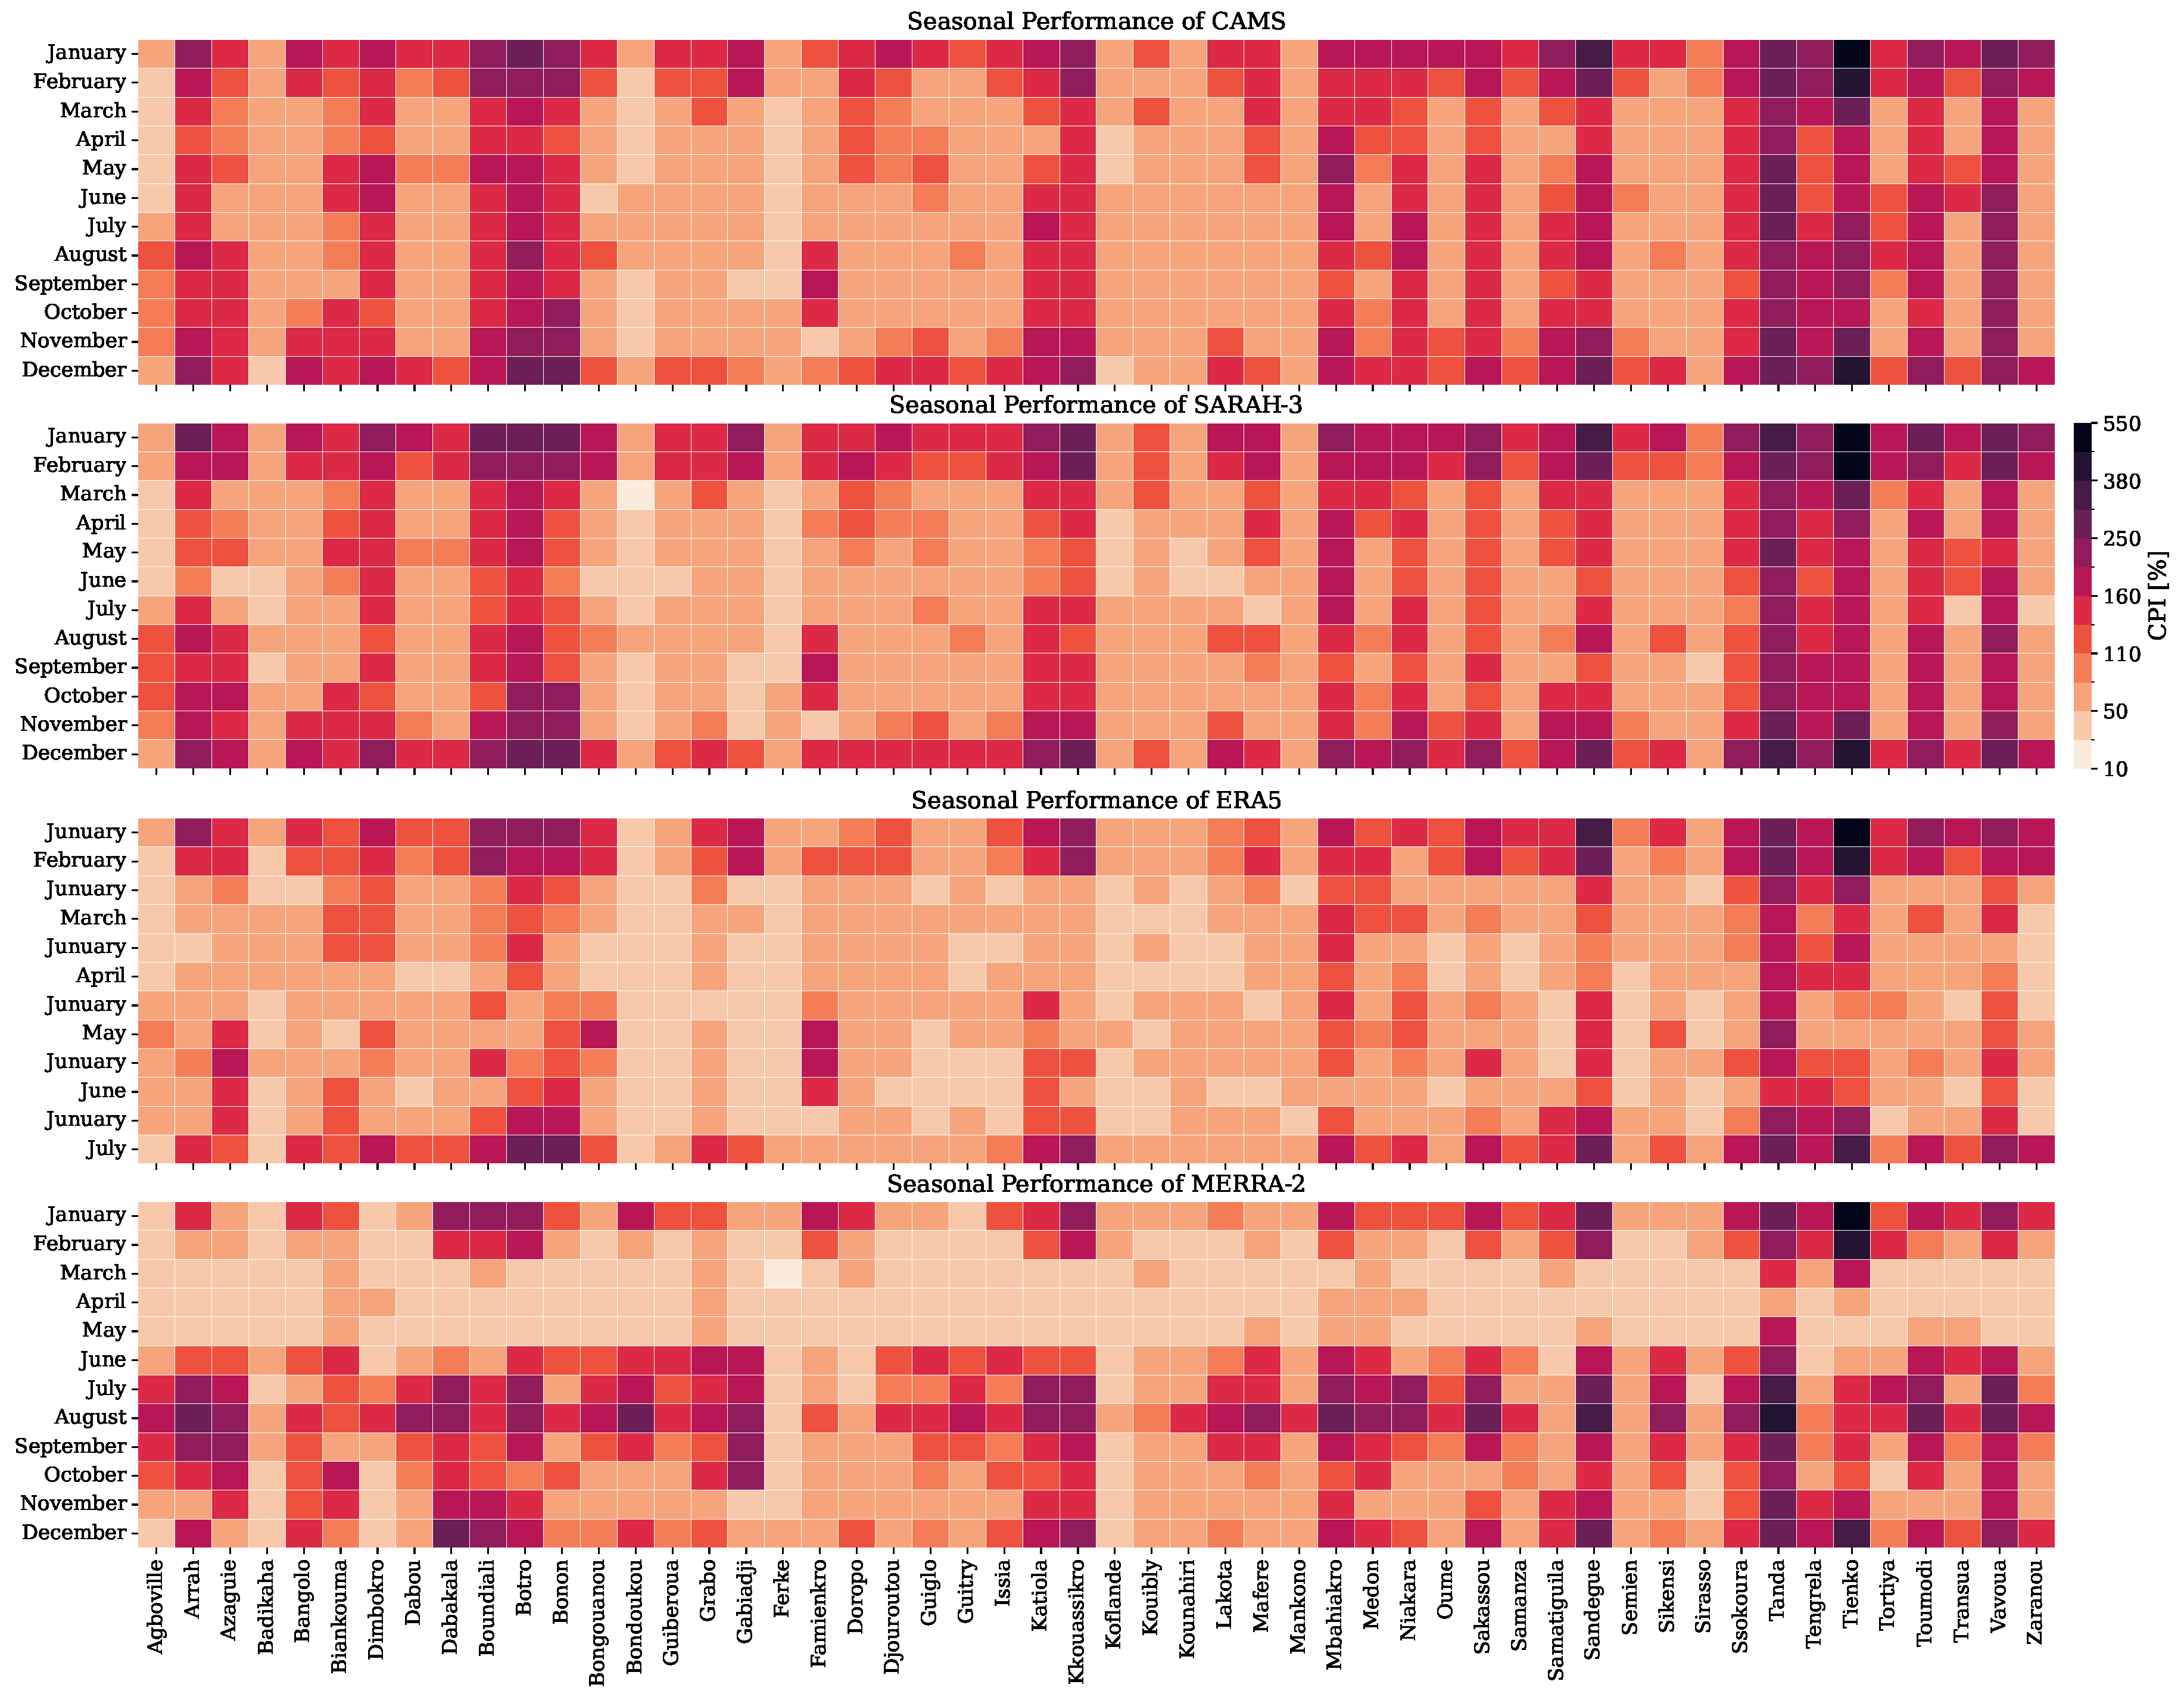
3.2. Performance Evaluation Across Different Timescales

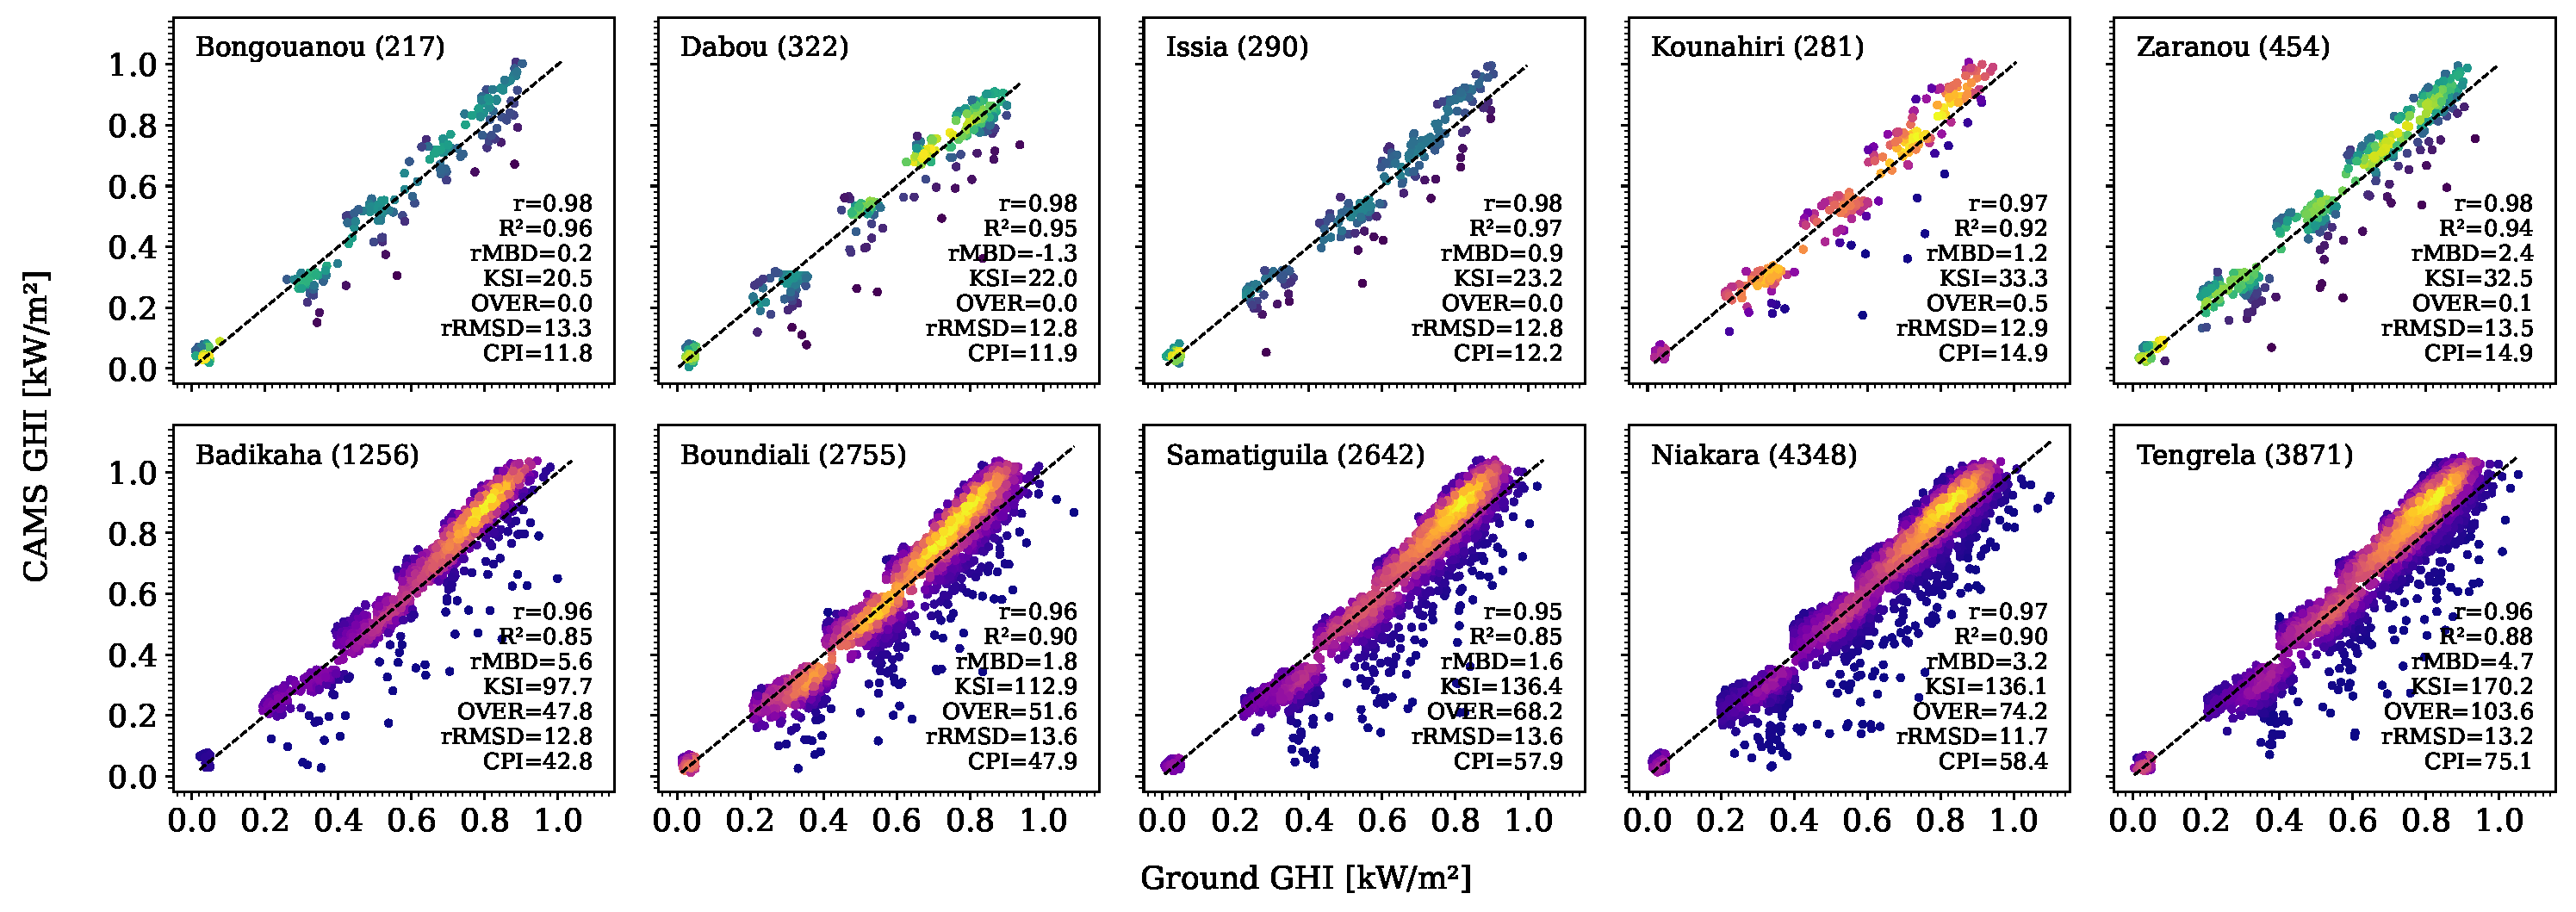
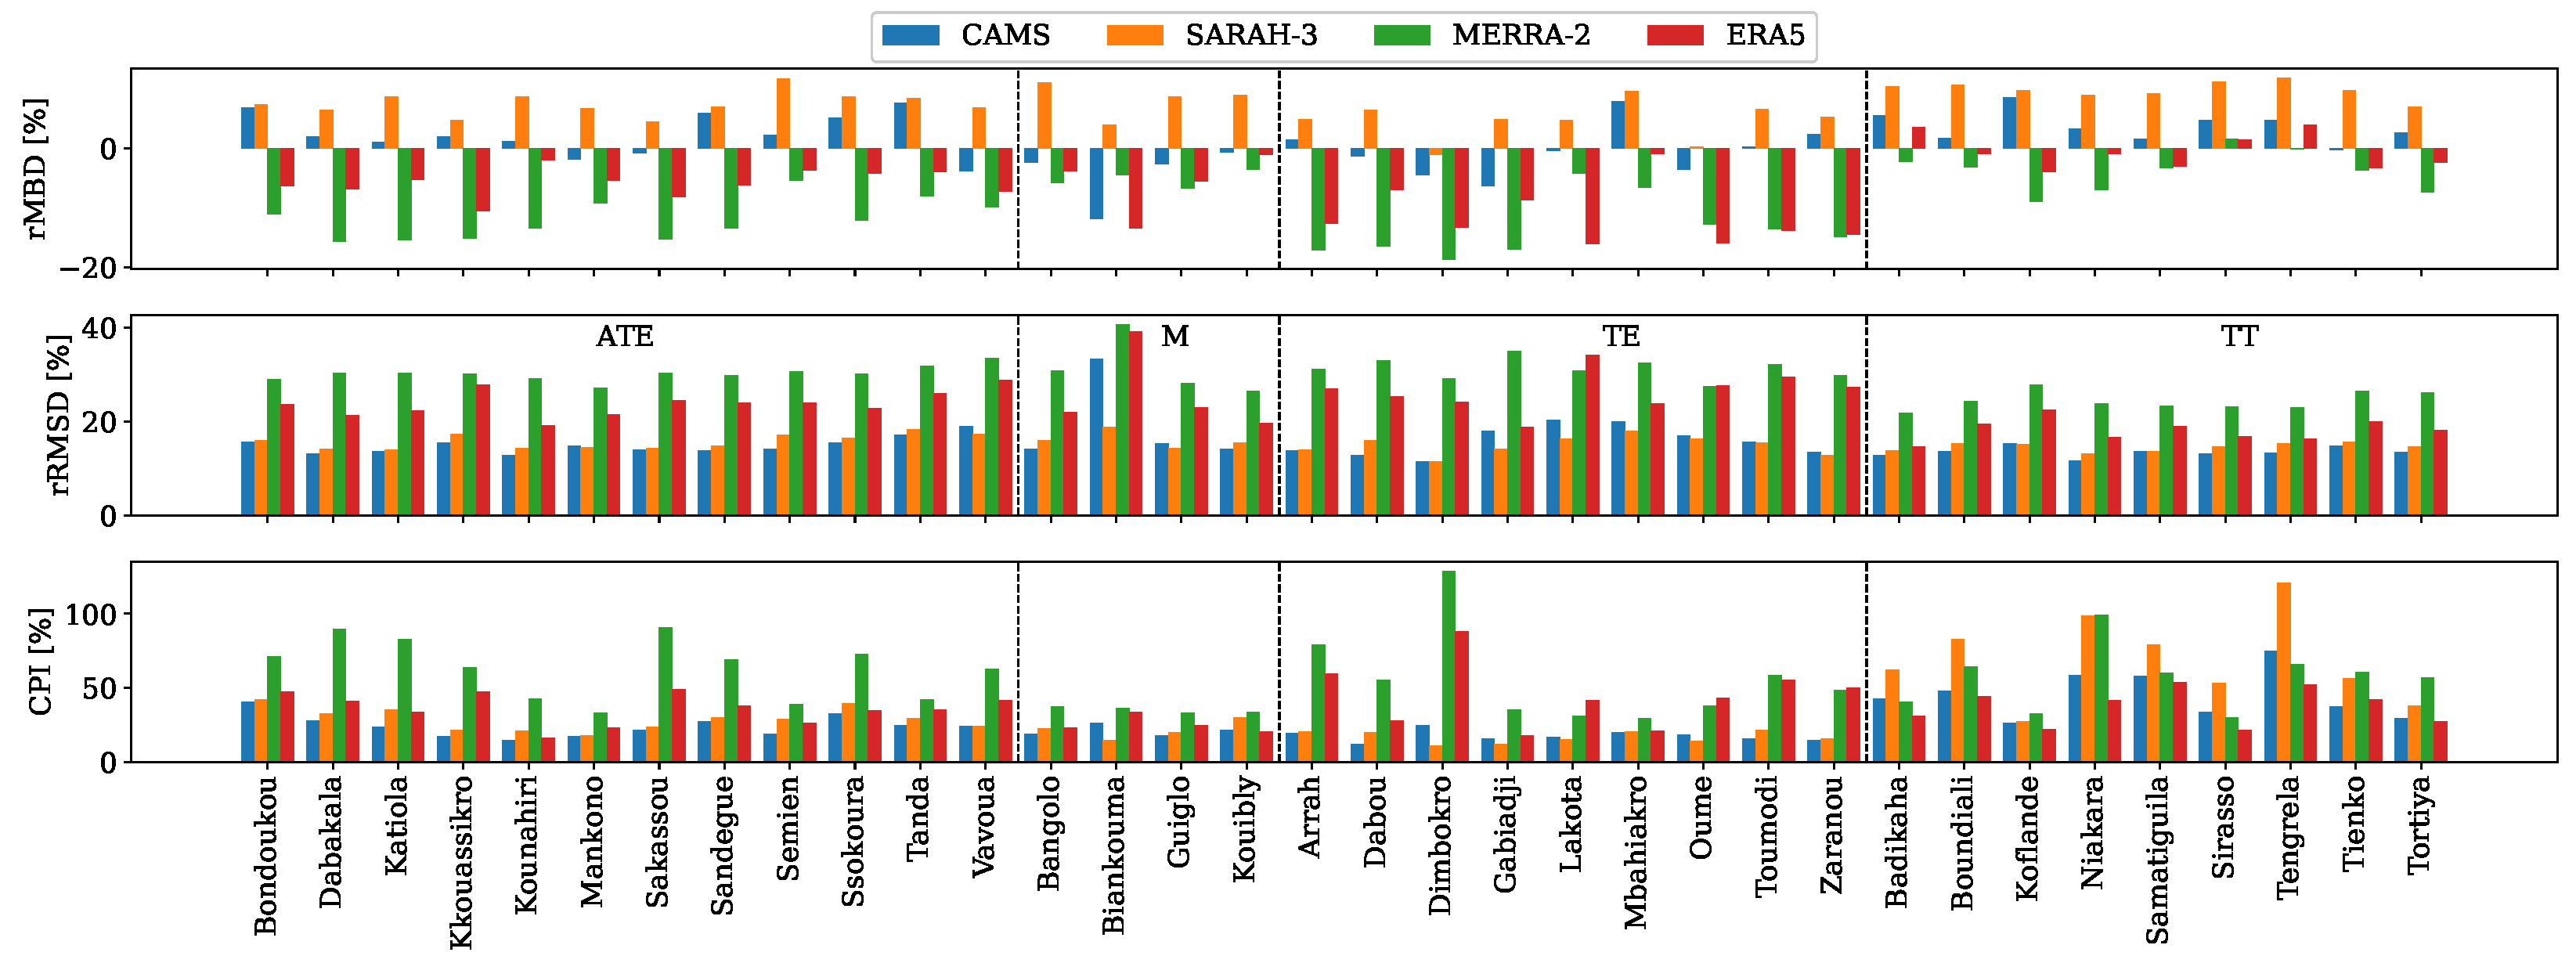
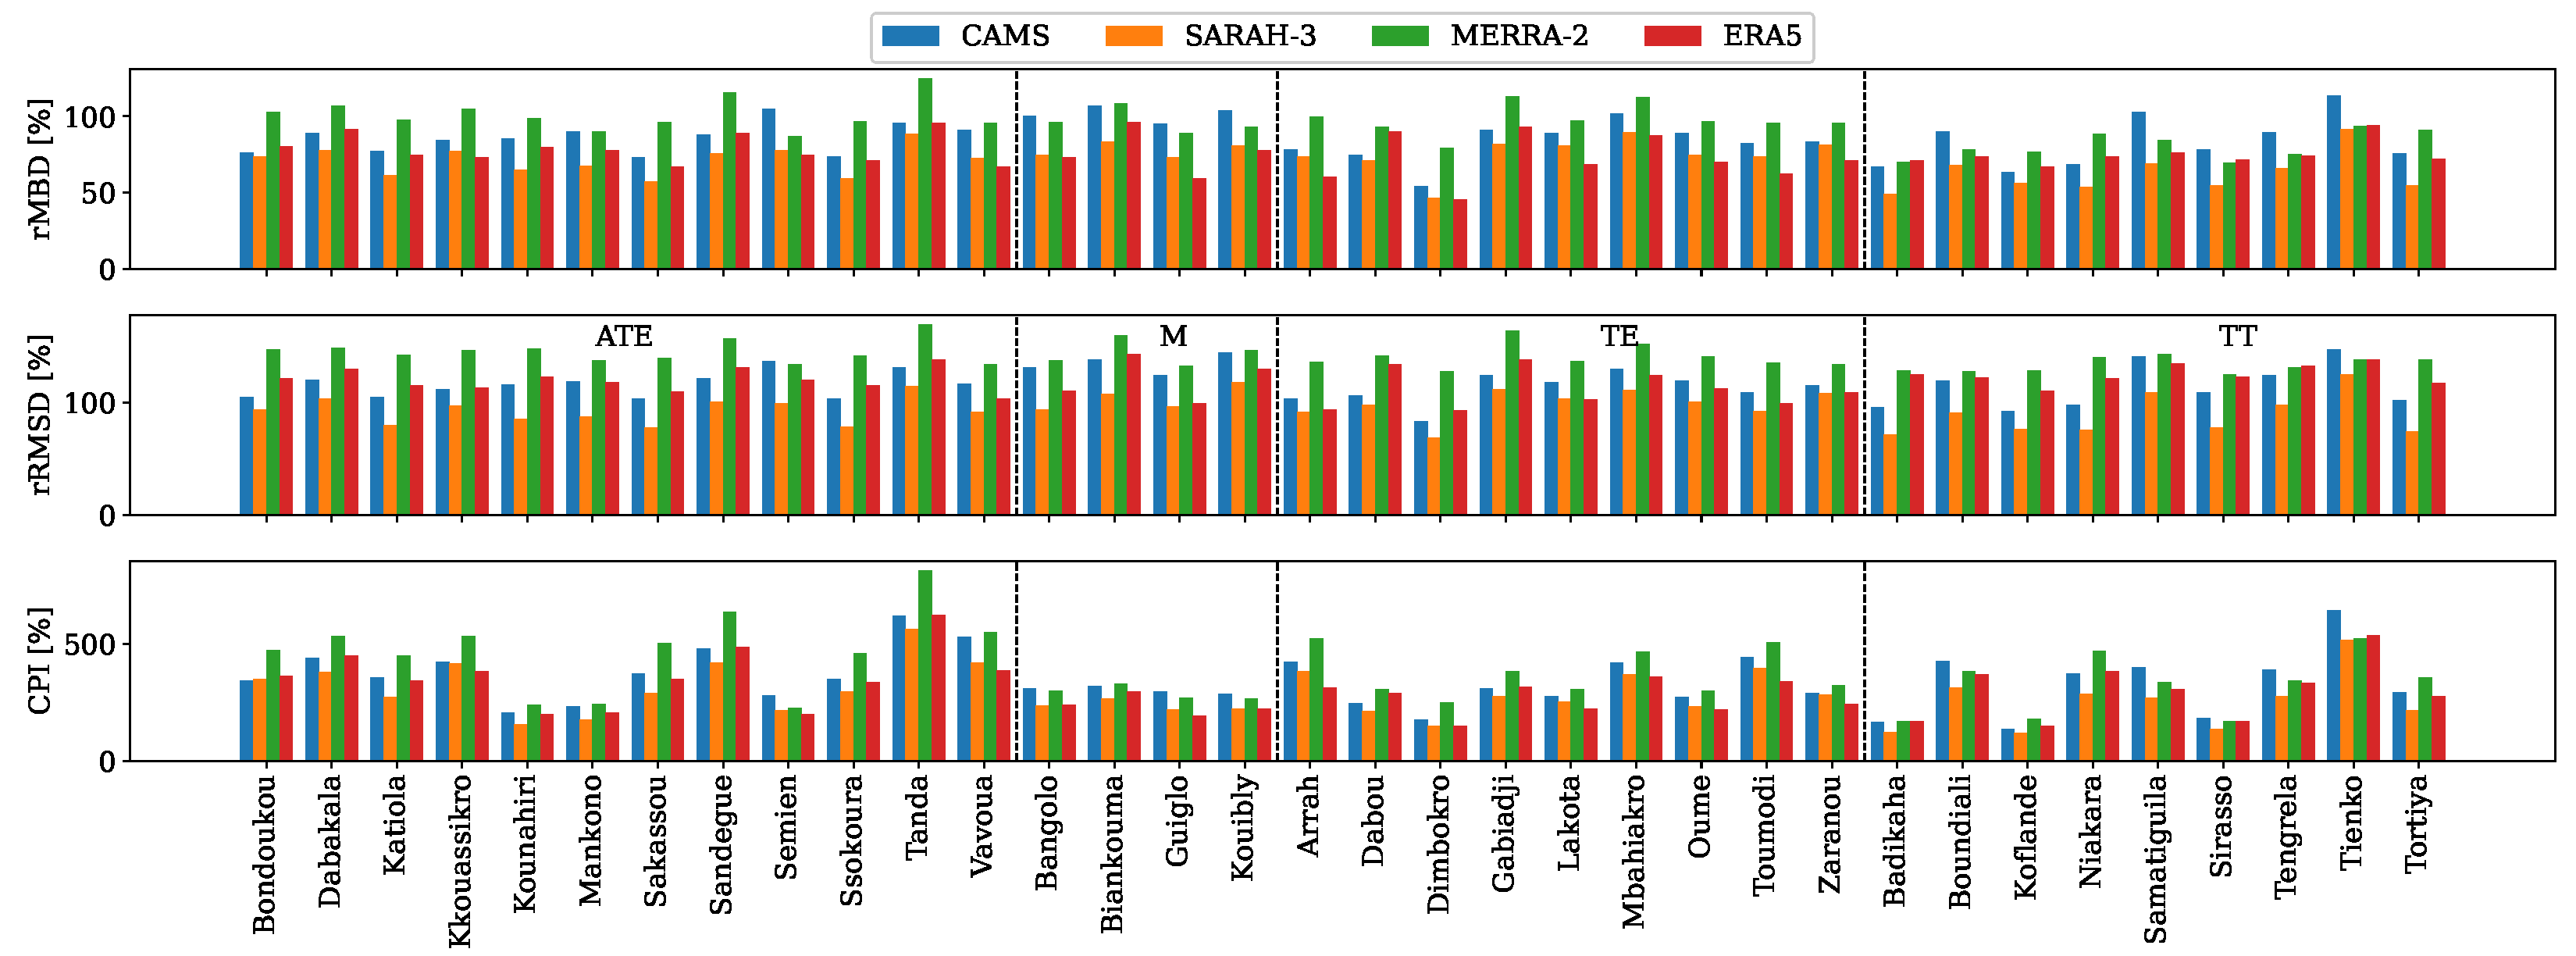
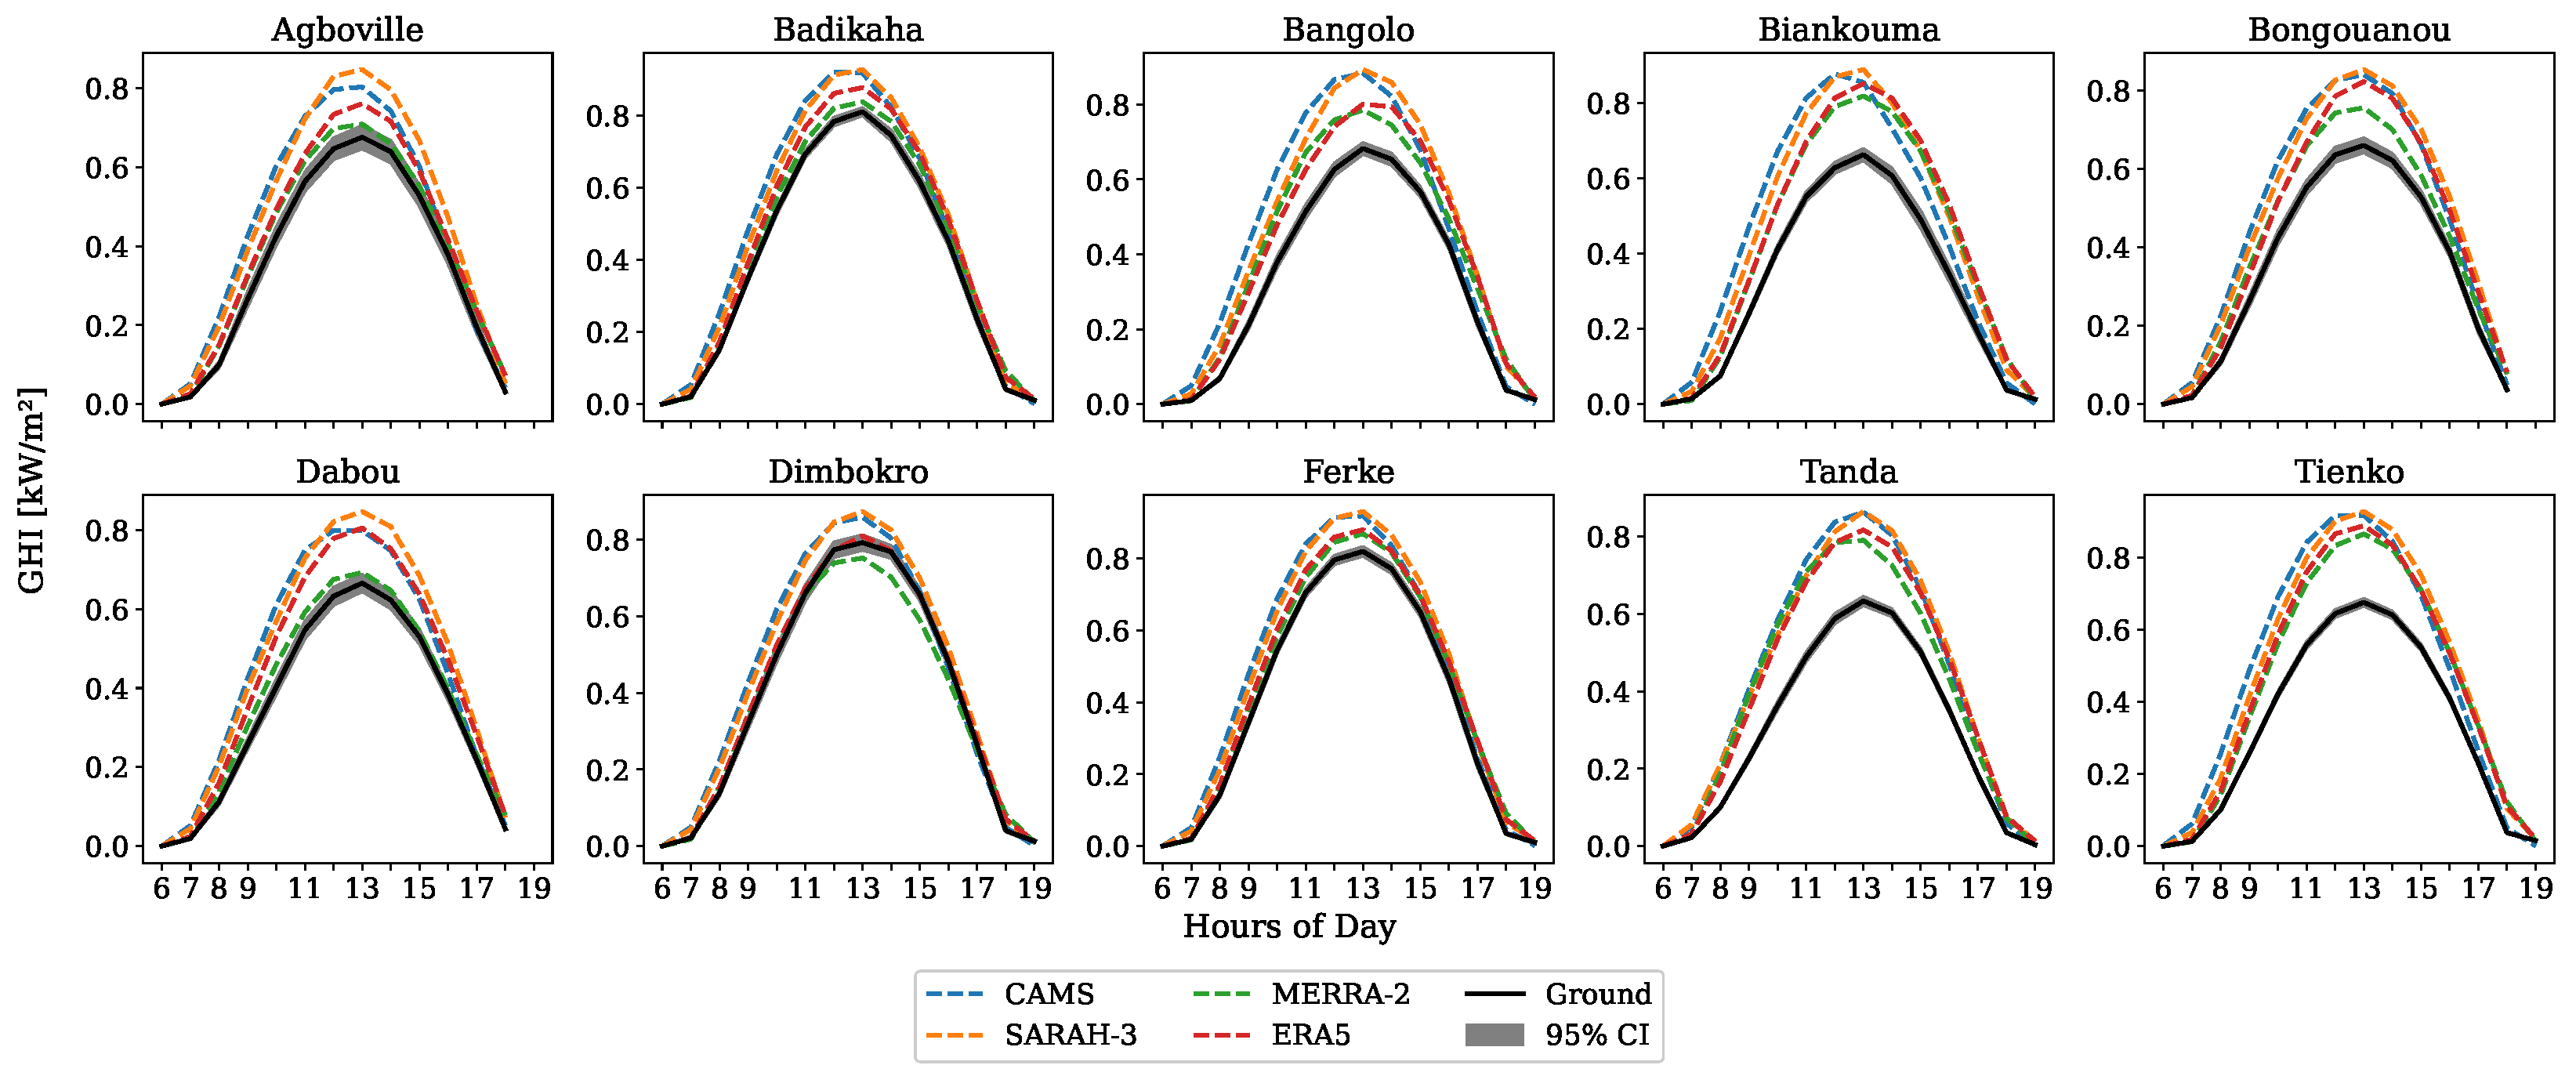
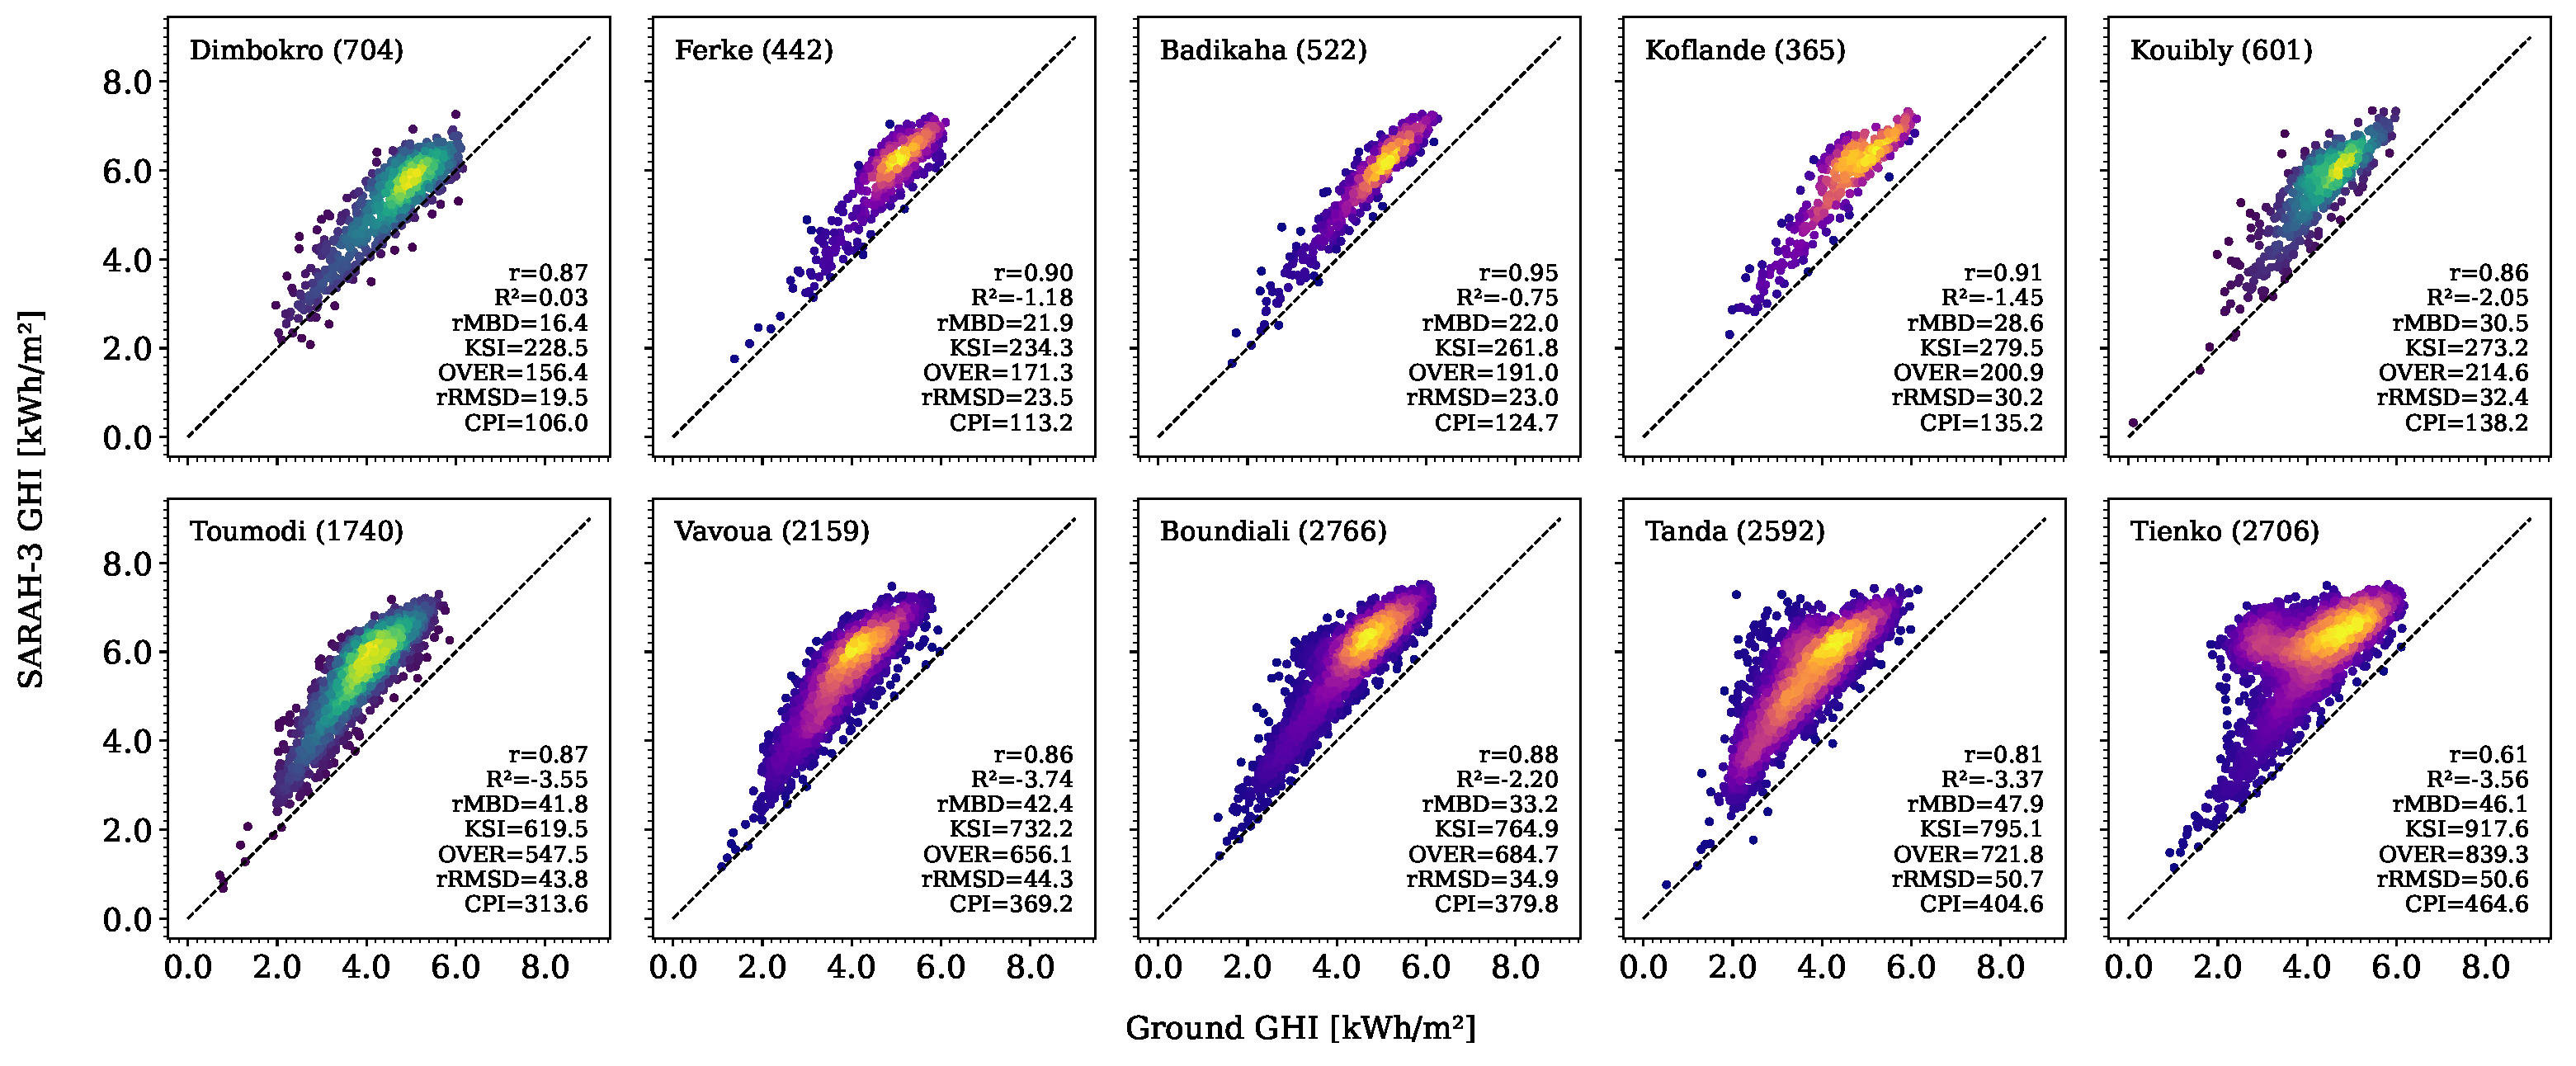
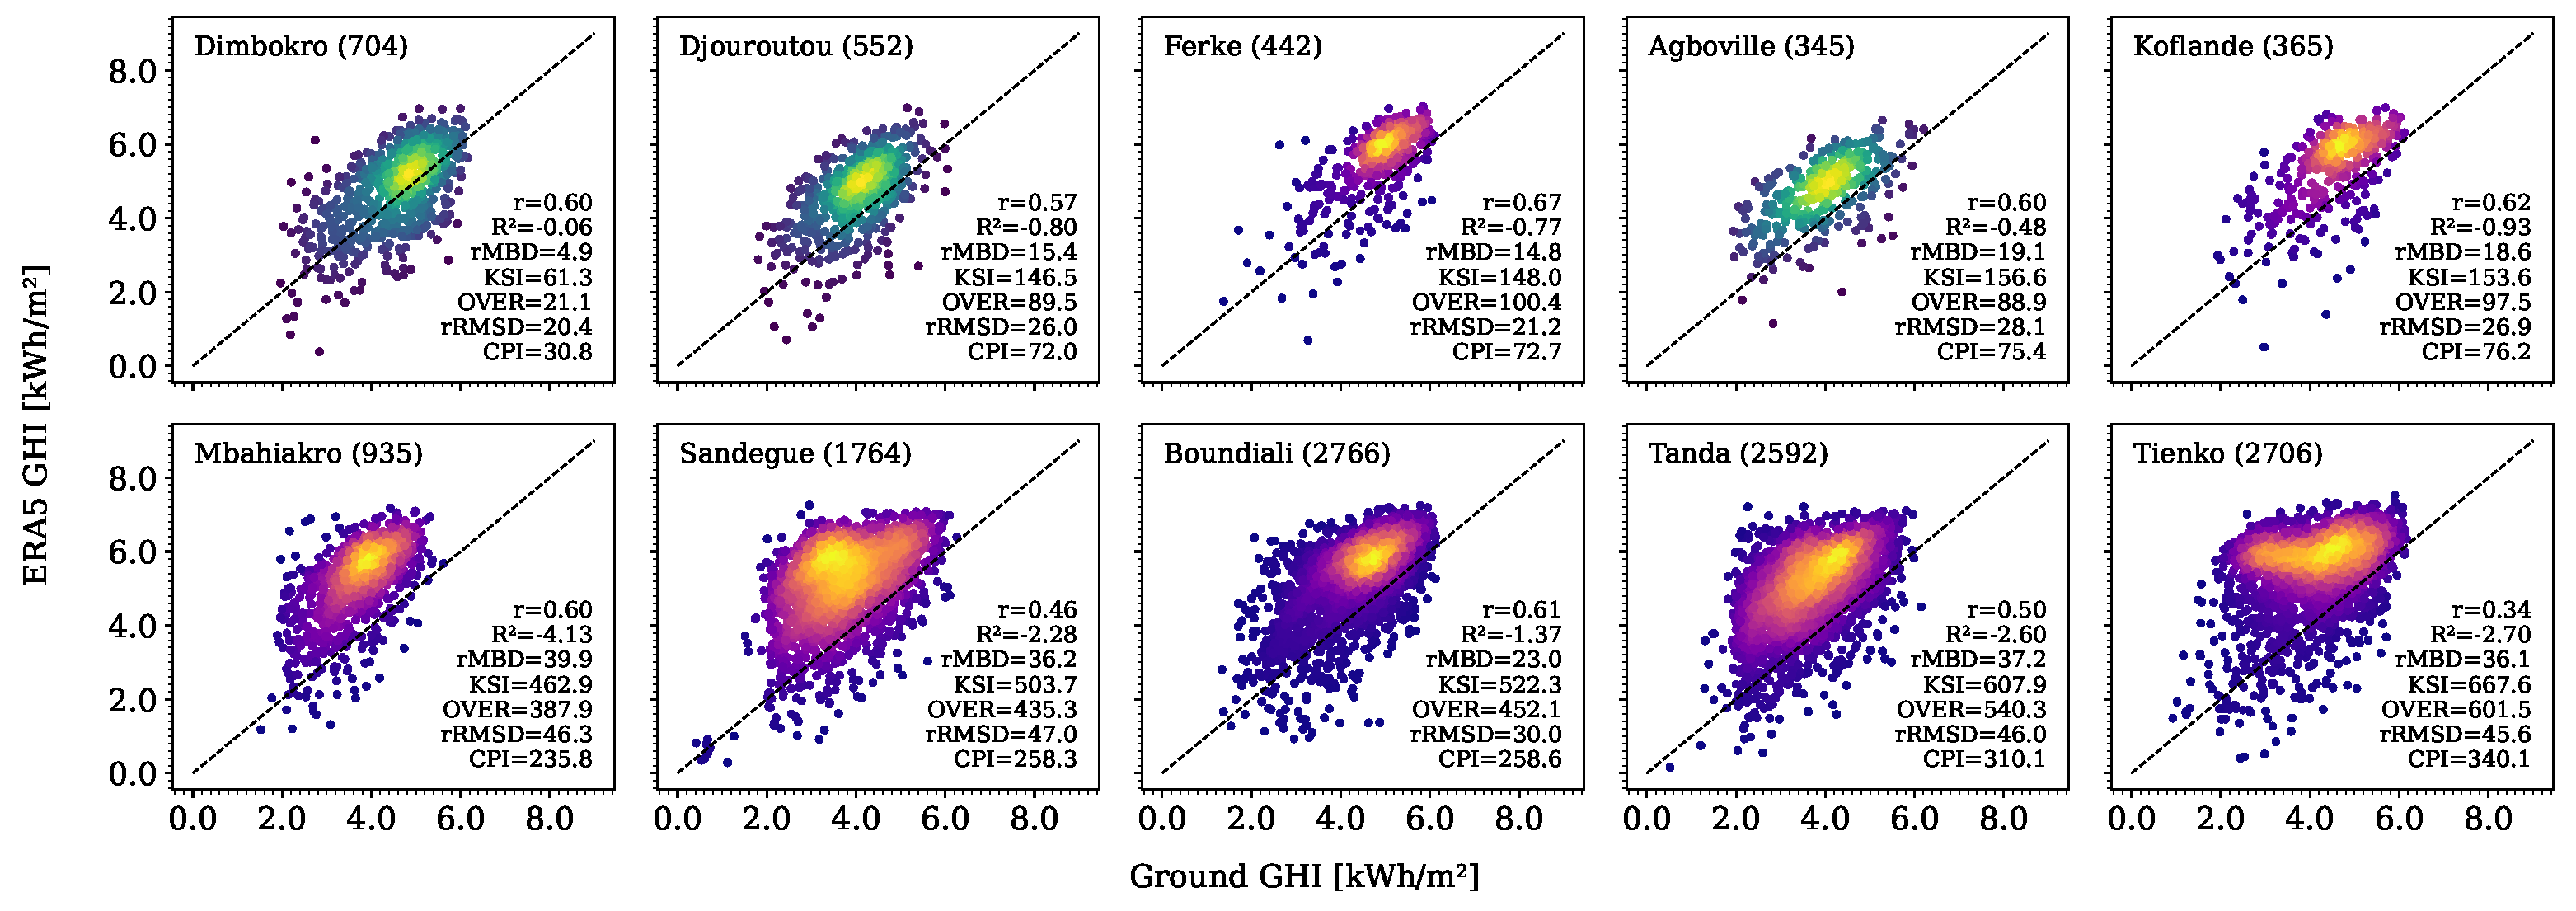
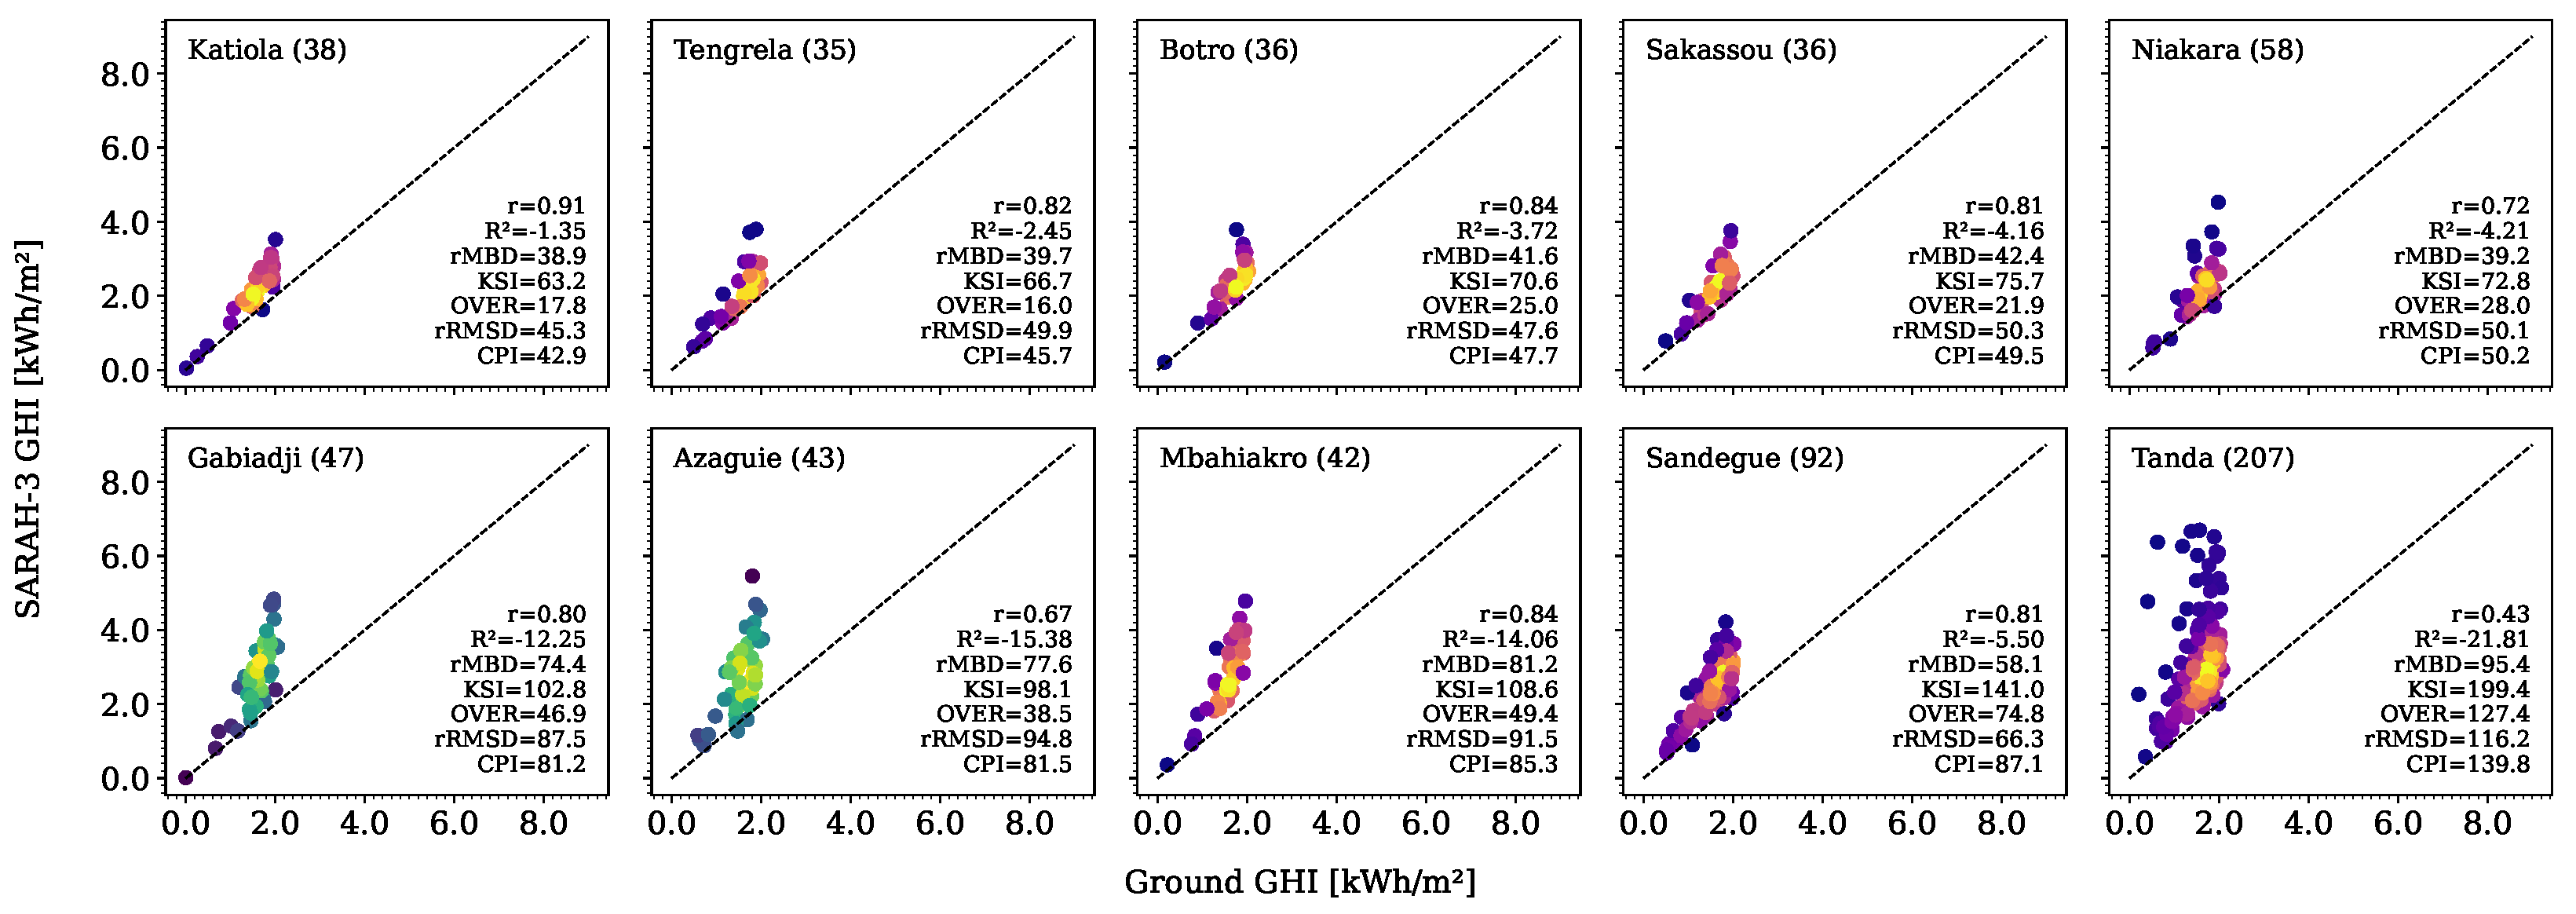
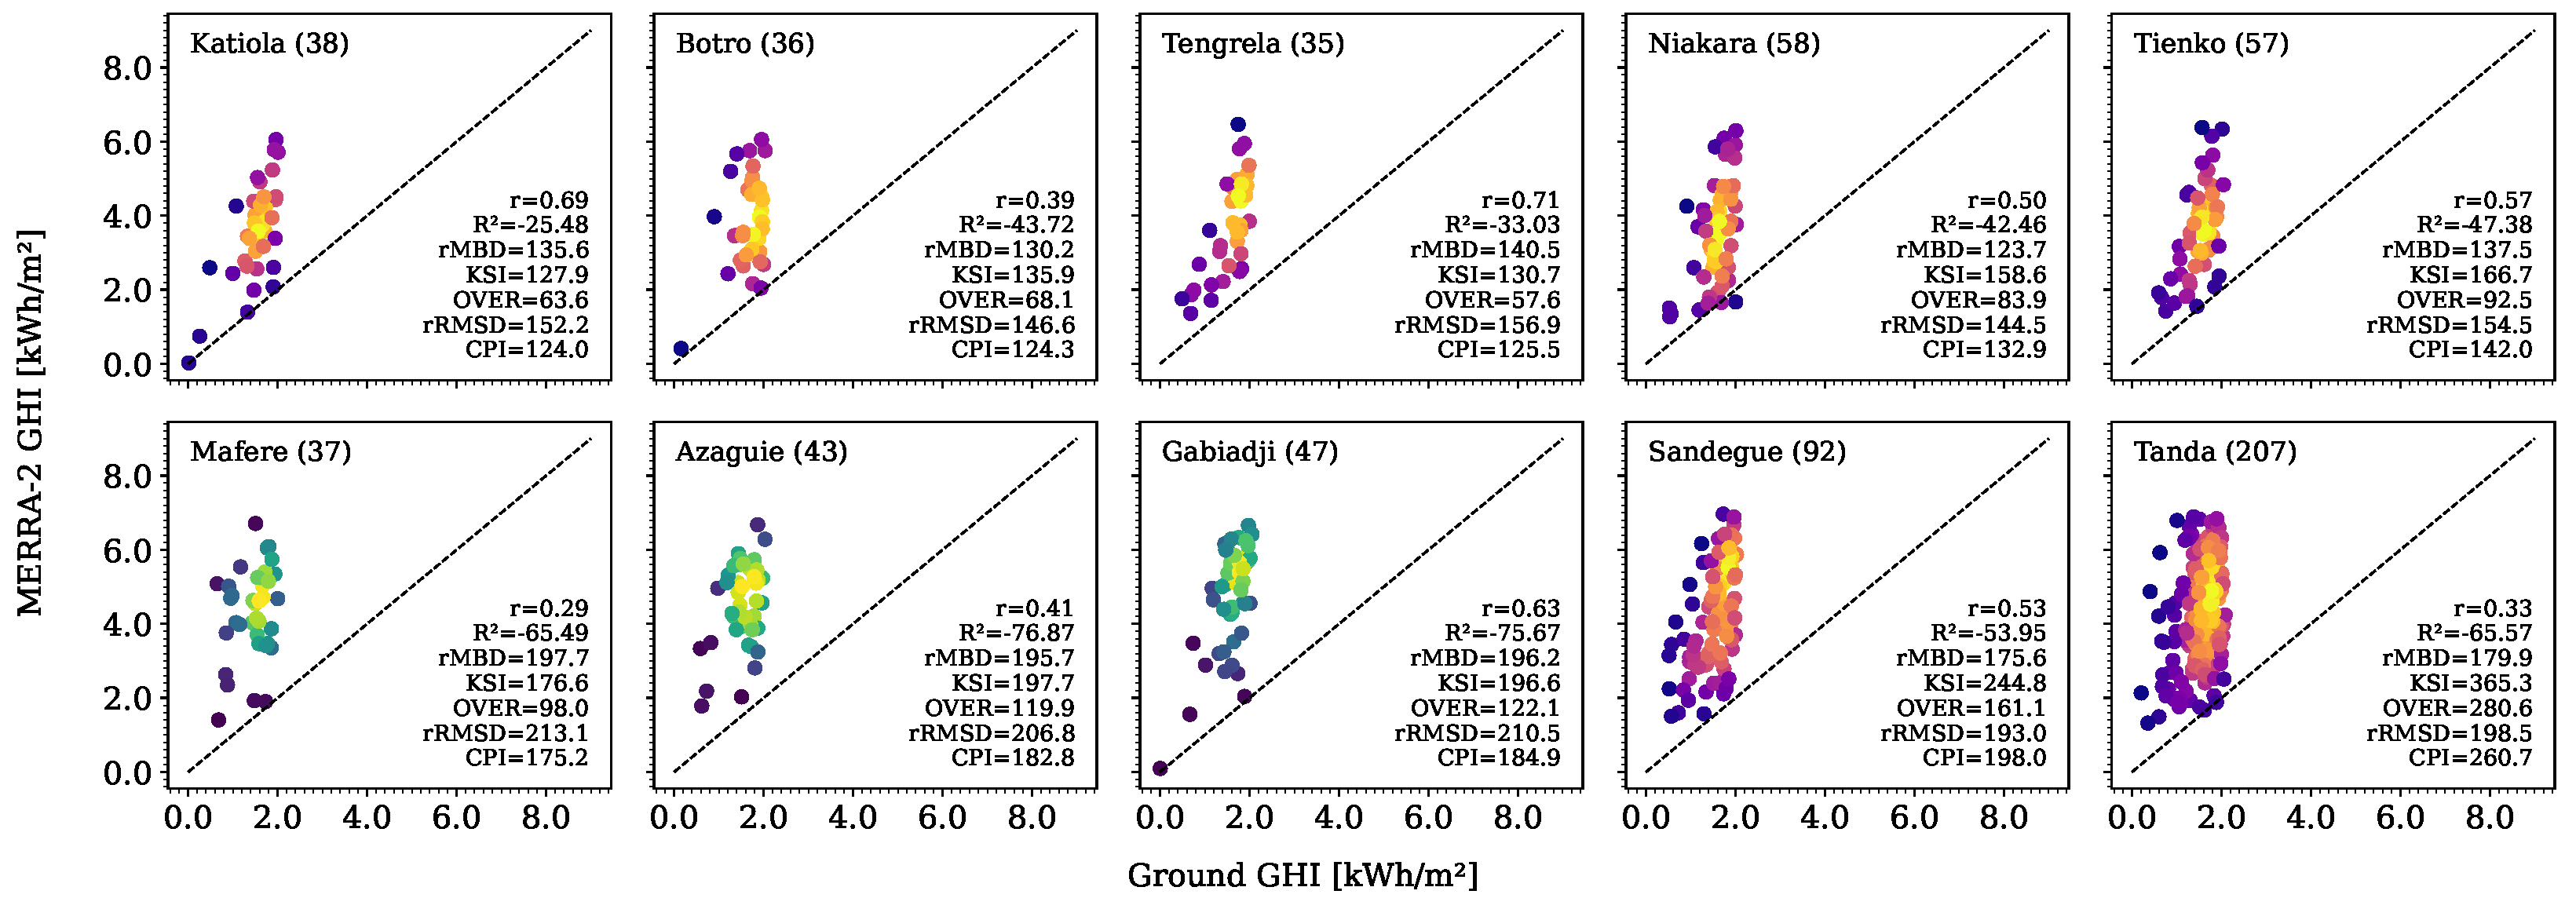
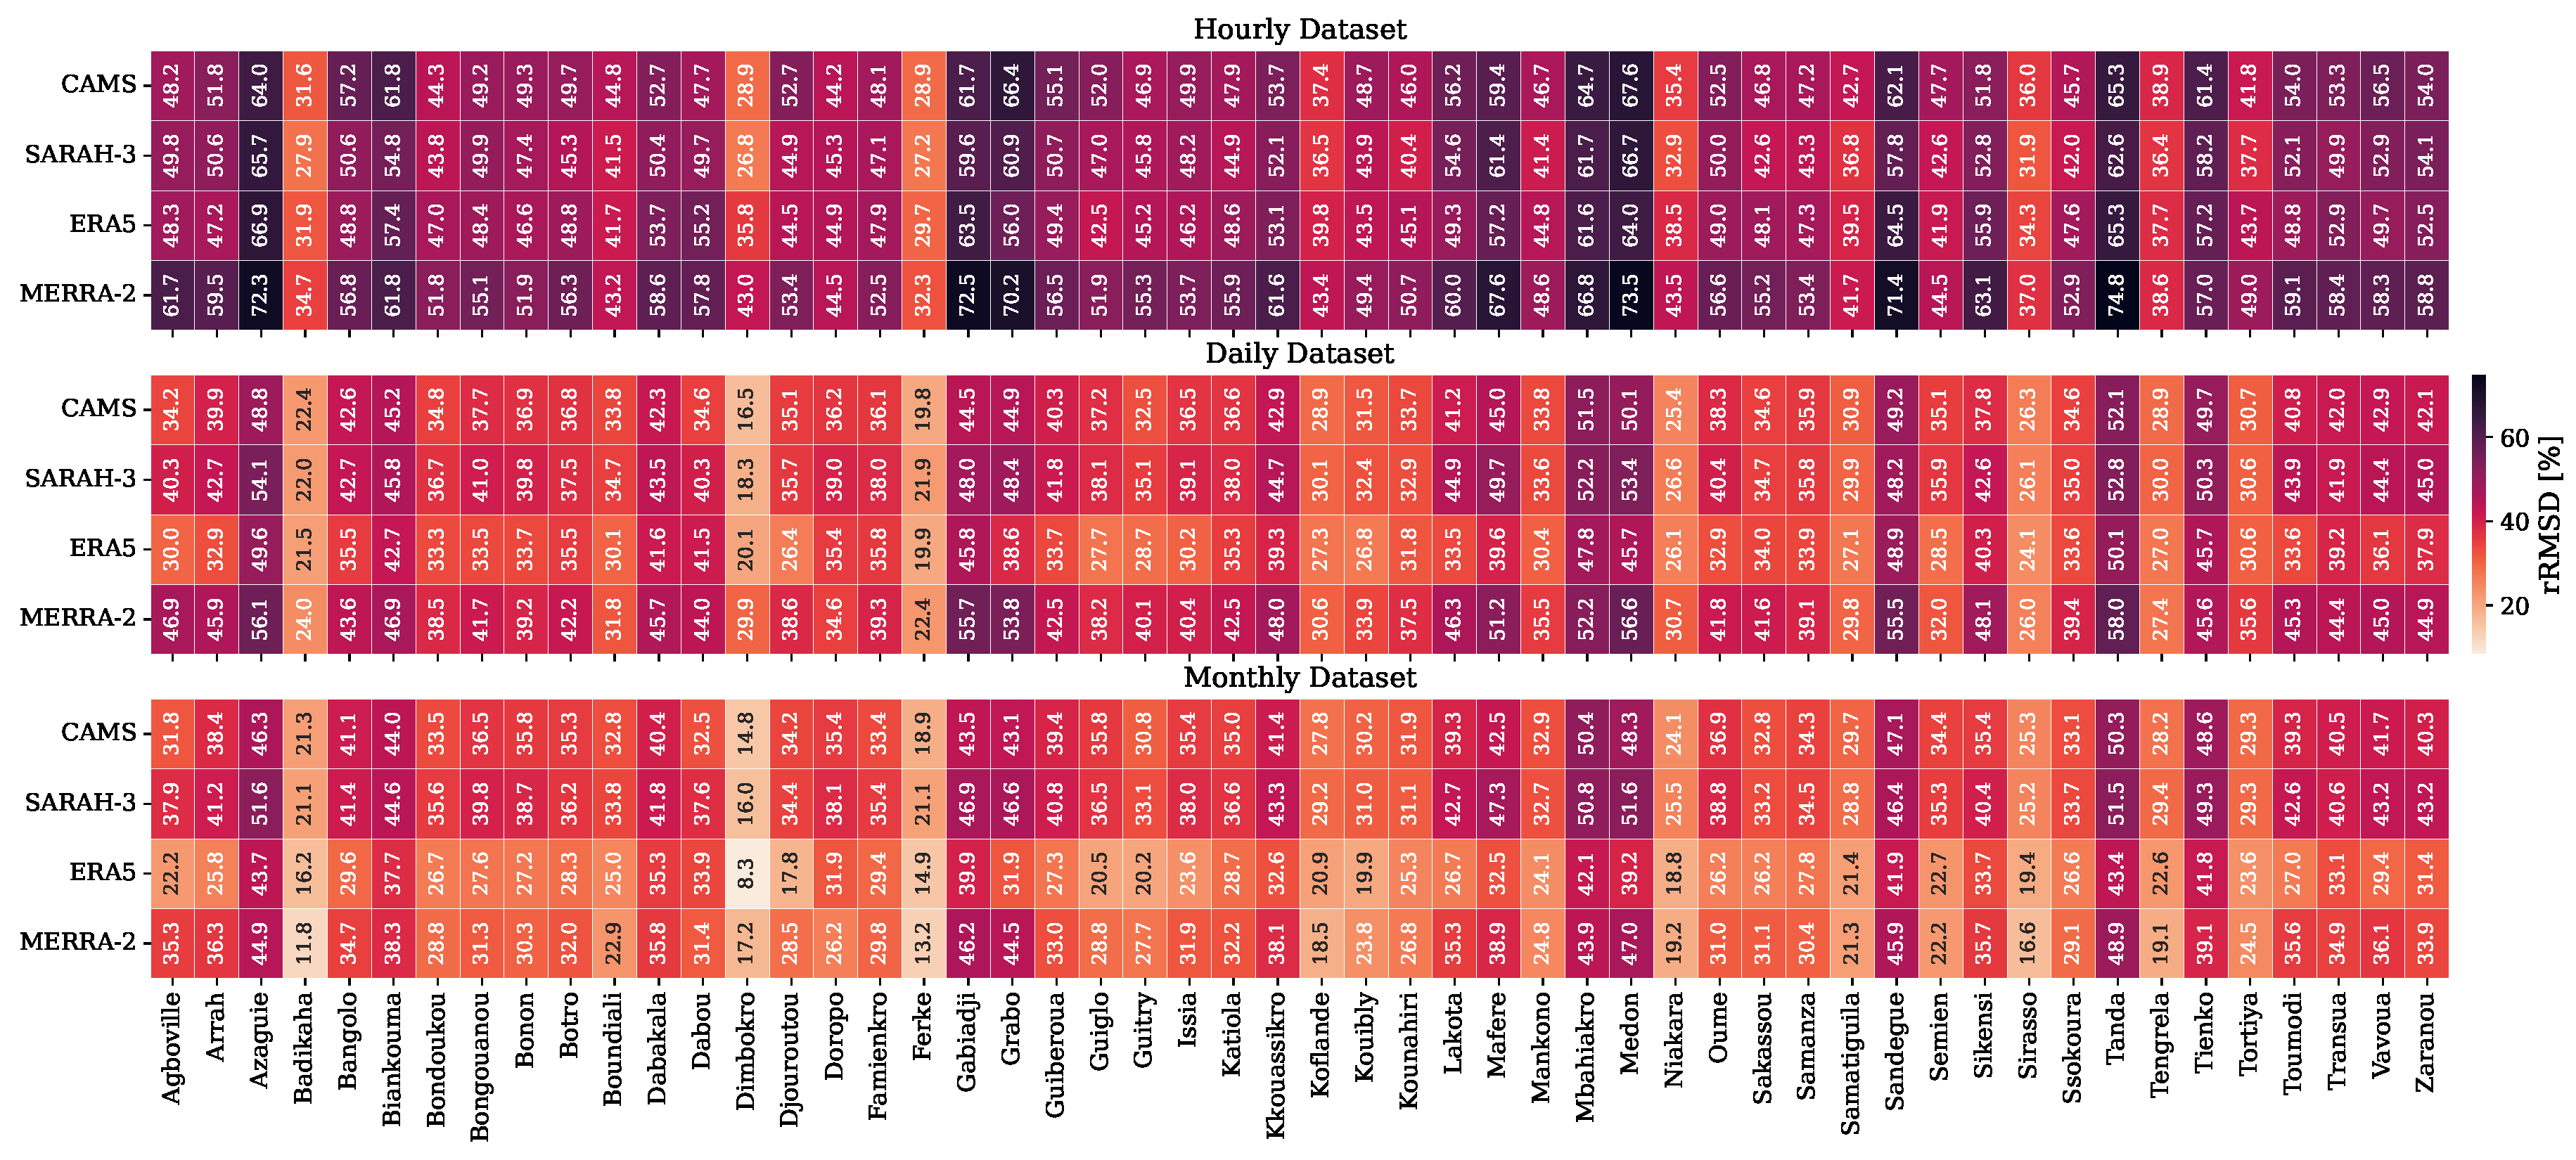
3.2.1. Performance Evaluation of Hourly Datasets

Hourly GHI values vary across climate zones in Côte d’Ivoire, as demonstrated by the statistical summary displayed in Table 2. The CPI, rRMSD and rMBD metrics are presented under different sky conditions, comparing hourly satellite data with observed data, grouped by climate zones. Under clear-sky conditions, all products demonstrate good performance across all climate zones, with a Pearson correlation coefficient of r ≈ 1, an rRMSD ranging from 13.3% to 30.8%, an rMBD ranging from 0.3% to 14.8% in absolute value and CPI values between 34.4% and 236.8%. As for the different products, satellite-based datasets (CAMS and SARAH-3) outperform reanalysis products (MERRA-2 and ERA5). The reanalysis products tend to underestimate GHI, which explains their negative rMBD values. Among the climate zones, TT exhibits the best rRMSD values but has the highest CPI, while M records the best CPI values.
By definition, the CPI incorporates information on dispersion through the rRMSD and distribution similarity through the KSI and OVER. A low rRMSD combined with a high CPI suggests that, while the overall difference between the two datasets is small, there are discrepancies in the shape of the distribution between satellite-based data and ground measurements. These distributional differences can be attributed to the effect of grouping different stations in climatic zones. Under cloudy-sky and all-sky conditions (entire dataset without filtering for specific conditions), the performance of satellite and reanalysis products is moderate. All the values of the combined performance index are above 100%. As for the rRMSD and rMBD metrics, they range between 41.4% and 19.1% and 59.9% and 40.1% for all-sky conditions and between 30.2% and 10.8% and 37.9% and 32.1% for cloudy-sky conditions.
The weakest performance is observed under overcast conditions. While the linear correlation remains relatively strong, the rRMSD and rMBD values increase by 6 and 12 times, respectively, on average, compared to their clear-sky counterparts, and the CPI values remain high. Here, the coefficient of determination ( R 2 ) is consistently negative, meaning that the reanalysis and satellite products perform worse than simply using the mean of the ground data as a predictor [48].
Regarding the observation sites, both satellite and reanalysis products align well with ground-based measurements under clear-sky conditions. The best performance for CAMS is recorded at the Bongouanou station, with a CPI of 11.8%, as shown in Figure 6. The first row display the five stations with the lowest CPI, while the second row corresponds to the five stations with the highest CPI. Stations in the equatorial zone are represented using the Viridis colormap, whereas those in the tropical zone use the Plasma colormap. The Tengrela station records the worst CPI, KSI and OVER values under these sky conditions, even though the other statistical parameters remain good. With a few exceptions (such as Dimbokro station in Figure 7), the KSI and CPI values found in this study seem to favor stations with fewer data points. For instance, for the statistics presented in Table 2, the M zone has a total of 56,717 data points across all sky conditions, whereas the TT zone has 390,974 data points. This becomes noticeable when there is a significant difference in the number of data points, which could be due to the binning of the dataset in the calculation of these metrics.
Comparisons between hourly datasets from models are better presented in Figure 8, Figure 9, Figure 10 and Figure 11, with the rRMSD, rMBD and CPI metrics across 34 stations. Under clear-sky conditions, the rRMSD values range from 11.4% to 48.2%, with a mean of 21.4% and a standard deviation of 7.3%. The absolute values of the rMBD range from 0.1% to 22.0%, while the CPI values vary between 10.9% and 139.4%. For the CPI, stations located in the equatorial zones (M and TE) show the best performance, particularly for CAMS and SARAH-3, indicating stronger agreement between the observed GHI and the GHI estimated by these products. MERRA-2, however, exhibits lower performance, especially in the ATE zone and at Dimbokro station, which is an exception within the TE zone, recording the worst CPI value (139.4%). The rMBD values indicate an underestimation of GHI by the reanalysis products (MERRA-2 and ERA5), particularly in the southern and central regions (TE, ATE and M). This trend is less pronounced in the north (TT), where CAMS and SARAH-3 tend to overestimate GHI instead. The rRMSD values confirm the superior performance of satellite products compared to reanalysis products under clear-sky conditions.
Reanalysis products better capture GHI when weather conditions alternate between cloudy and clear episodes, as seen under all-sky and cloudy-sky conditions (Figure 9 and Figure 10). However, the performance of both product types degrades compared to their performance under clear-sky conditions. All products exhibit an overestimation of GHI. The CPI values indicate an overall performance above 100% for all products at all stations, except for Dimbokro, which records a CPI value of 40.2% for ERA5 and 75.5% for MERRA-2 under all-sky conditions and 66.0% and 75.0%, respectively, for ERA5 and MERRA-2 under cloudy-sky conditions.
Under overcast conditions, all products exhibit their most unfavorable values across all metrics, showing significant discrepancies at all stations, as illustrated in Figure 11. Except for a few stations such as Dimbokro, Badikaha and Ferke, which exhibit relatively favorable rRMSD values for SARAH-3, all other stations record rRMSD and CPI values exceeding 100% for all products, indicating their unsuitability for assessing GHI under overcast conditions. This conclusion is further supported by the consistently negative values of the coefficient of determination ( R 2 ranging from −4.2 to 0.3).
The average agreement between models and ground data on a hourly basis throughout the day for each sky condition was evaluated. Figure 12, Figure 13, Figure 14 and Figure 15 illustrate the daily trends of GHI under the sky conditions differentiated in the present paper.
Under clear-sky conditions (Figure 12), the satellite products generally capture the overall trend of GHI throughout the day. This agreement with ground data is more noticeable from 1 PM onwards. Before this time, all models tend to overestimate solar radiation, with the maximum overestimation occurring around noon when GHI reaches its peak. These results are comparable with those of Sianturi et al. [57]. They found that bias of estimates from the reanalysis dataset peaked when the observed hourly solar irradiance was also the largest, in tropical regions. The tendency to overestimate GHI in the morning could be attributed to several factors, including the high concentration of aerosols and water vapor. In the morning, the atmosphere often contains higher concentrations of aerosols and water vapor near the surface. These particles scatter and absorb sunlight, thereby reducing the actual GHI value, which models may struggle to accurately capture. Overall, the 95% confidence interval indicates relatively low variability in the diurnal trends of GHI in the observed data for this sky condition.
Notably, discrepancies between satellite products and observed data are more pronounced at certain stations, such as Tienko, Tanda and Biankouma. This decline in agreement becomes even more evident under overcast conditions (Figure 15), where differences peak around midday as GHI values reach their maximum. At stations like Tanda, these errors can approach the magnitude of the ground-based GHI values. Under these conditions, GHI variability is significantly higher compared to clear-sky conditions, as reflected by the wider 95% confidence intervals. However, the trends depicted in the graphs may not fully capture hourly variations. For instance, the clear-sky condition does not strictly represent model behavior during clear-sky hours, as days classified as clear-sky conditions may still contain periods of cloud cover (cloudy-sky hours). The most representative case for evaluating model performance is the all-sky condition, where no filtering is applied to the dataset.
In the hourly dataset analyzed in this study, satellite products (CAMS and SARAH-3) outperform reanalysis products (MERRA-2 and ERA5) under clear-sky conditions but are surpassed by the latter under cloudy and all-sky conditions. Overcast conditions yield the poorest results, with significant discrepancies and consistently negative R 2 values. The mountainous (M) zone demonstrates the strongest agreement between satellite and reanalysis products and ground data, in terms of the CPI metric, maybe due to its fewer number of stations, while the tropical transition (TT) zone shows lower rRMSD values but a higher CPI, indicating distribution discrepancies despite relatively low error dispersion. A summary of the metrics is presented in Table 3. The significant biases observed in the reanalysis products are comparable to the results of other studies [58], which have found higher biases in tropical regions than in high-latitude regions [59]. These biases may be due to the high intensity of solar radiation in tropical regions, as well as the high humidity and dense cloud cover in these areas [57] that are known to greatly influence satellite and reanalysis products’ performance.

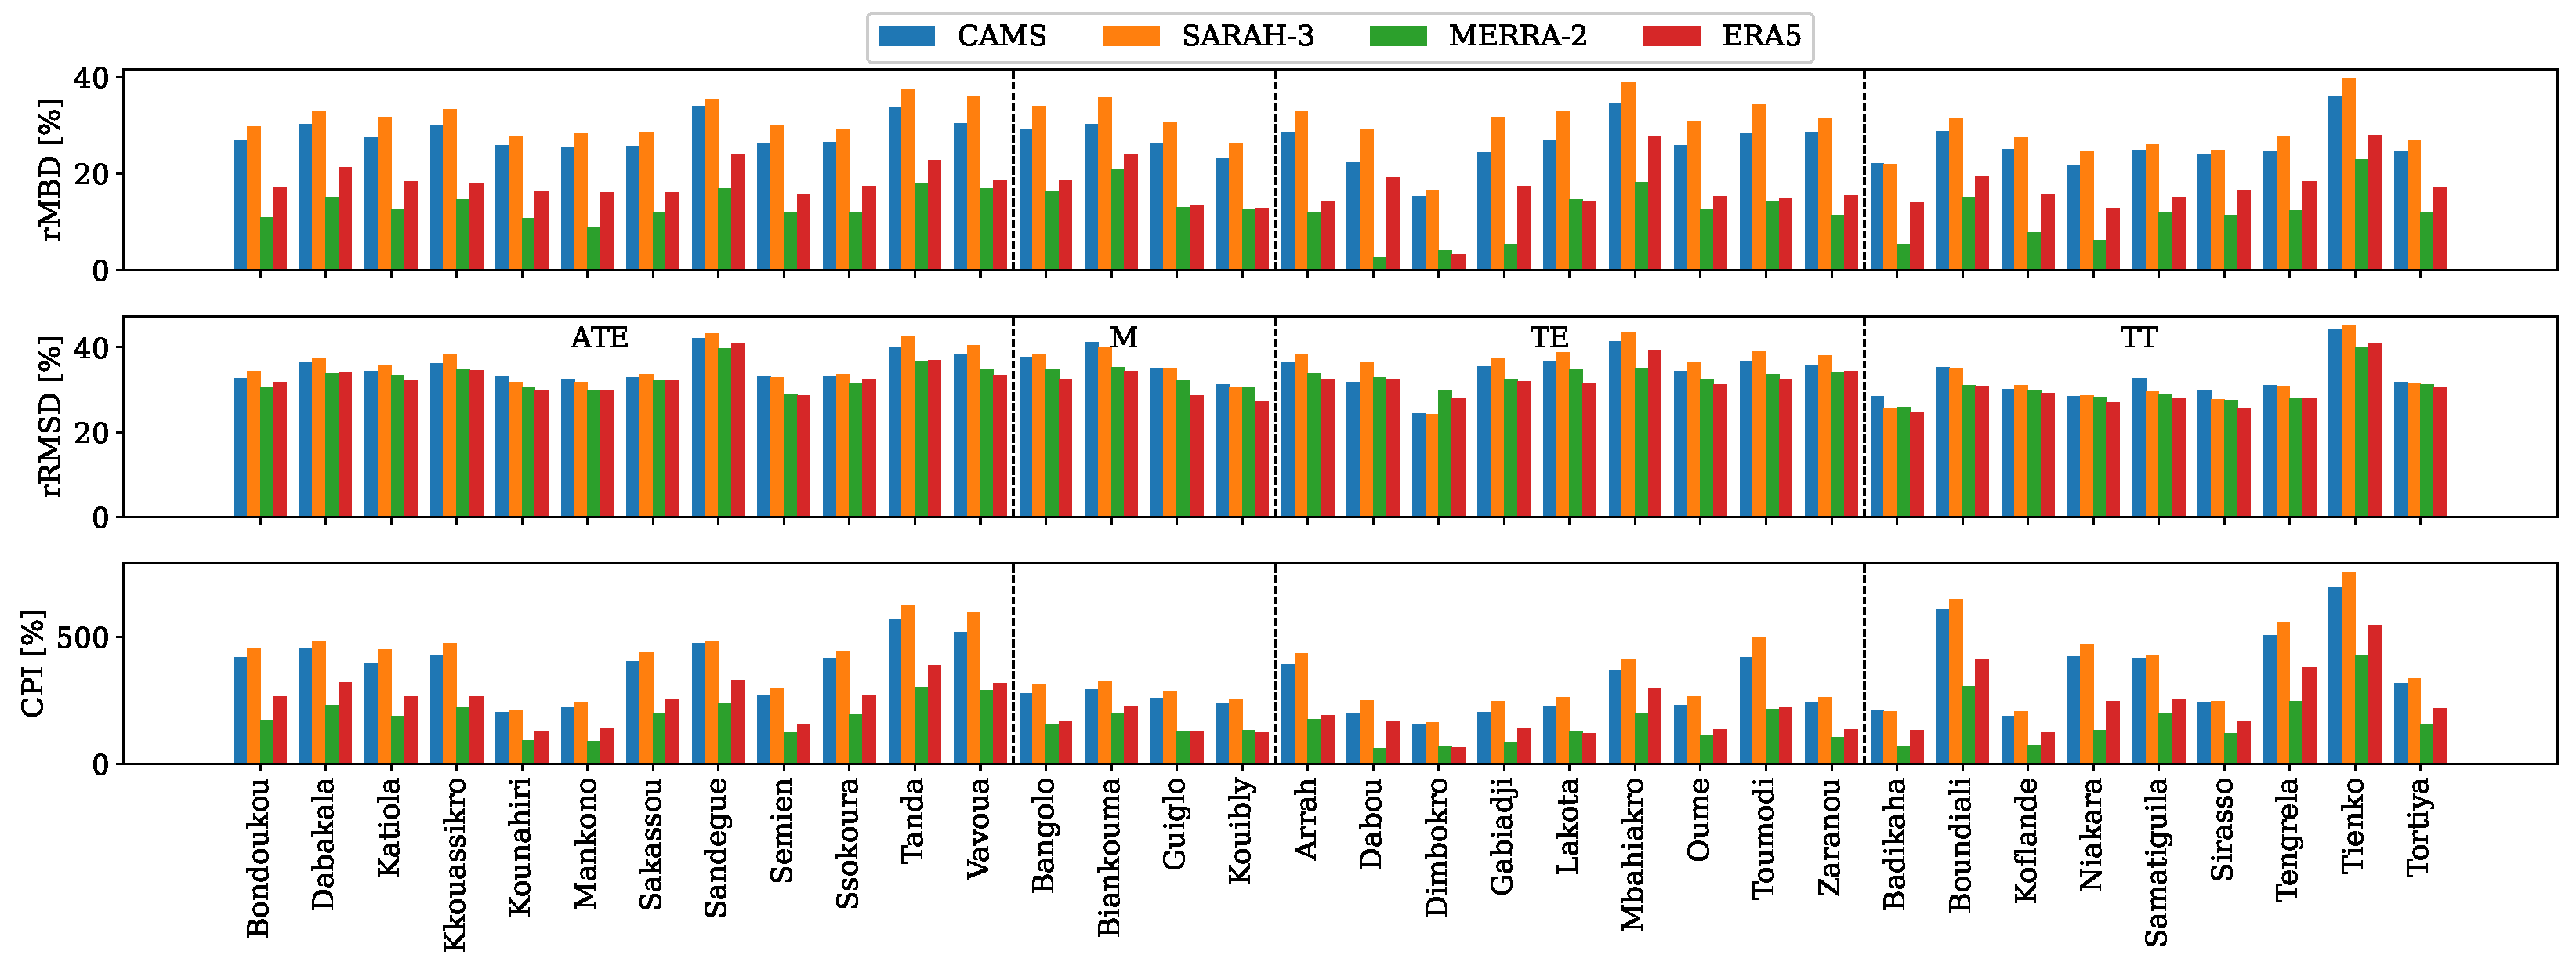
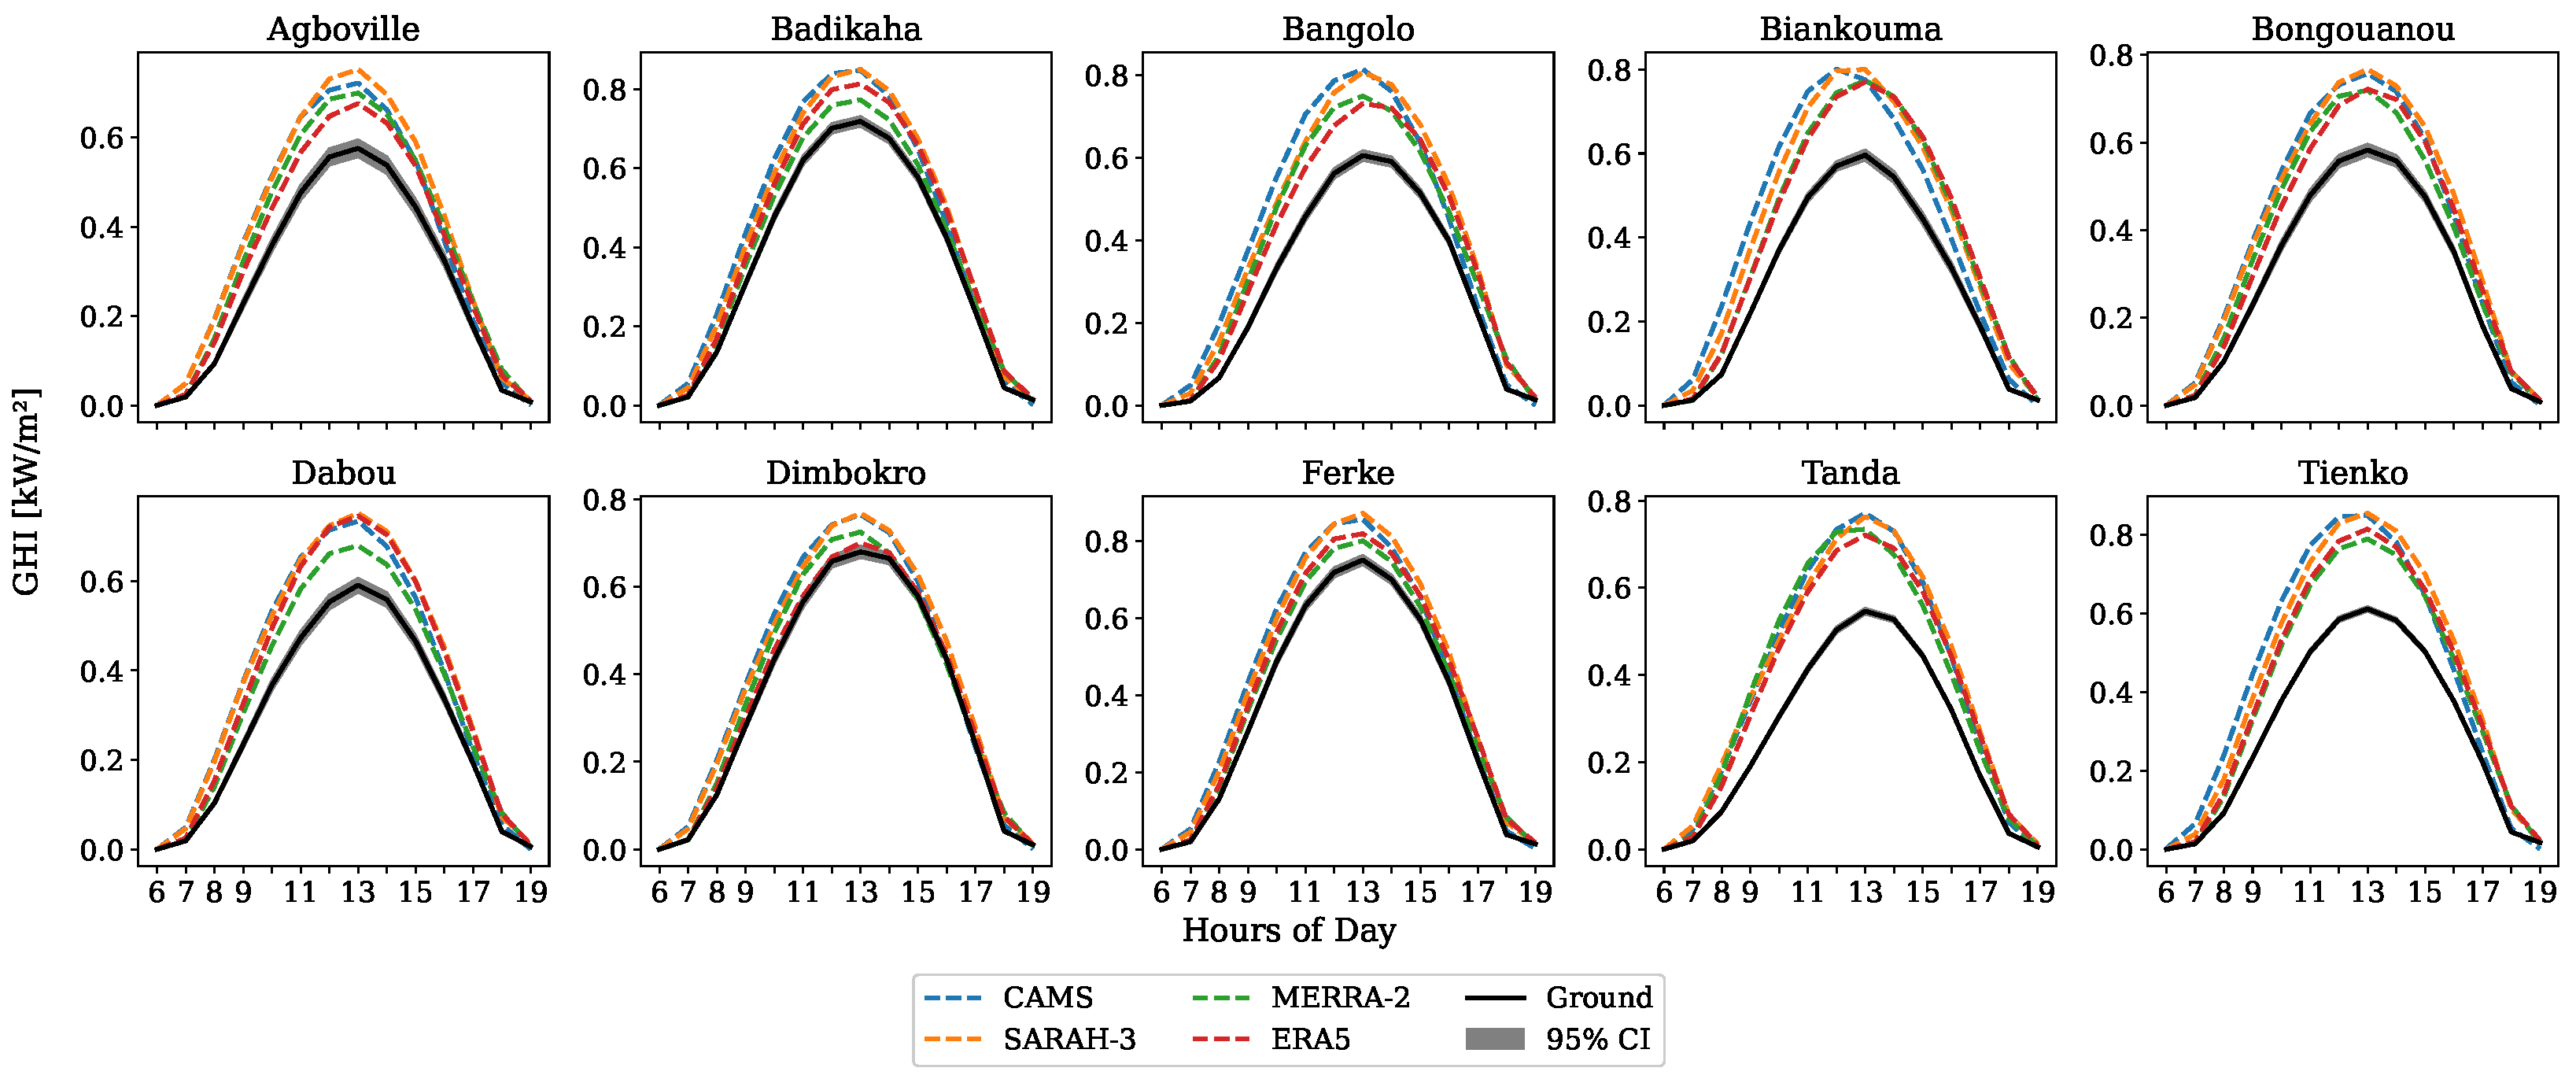
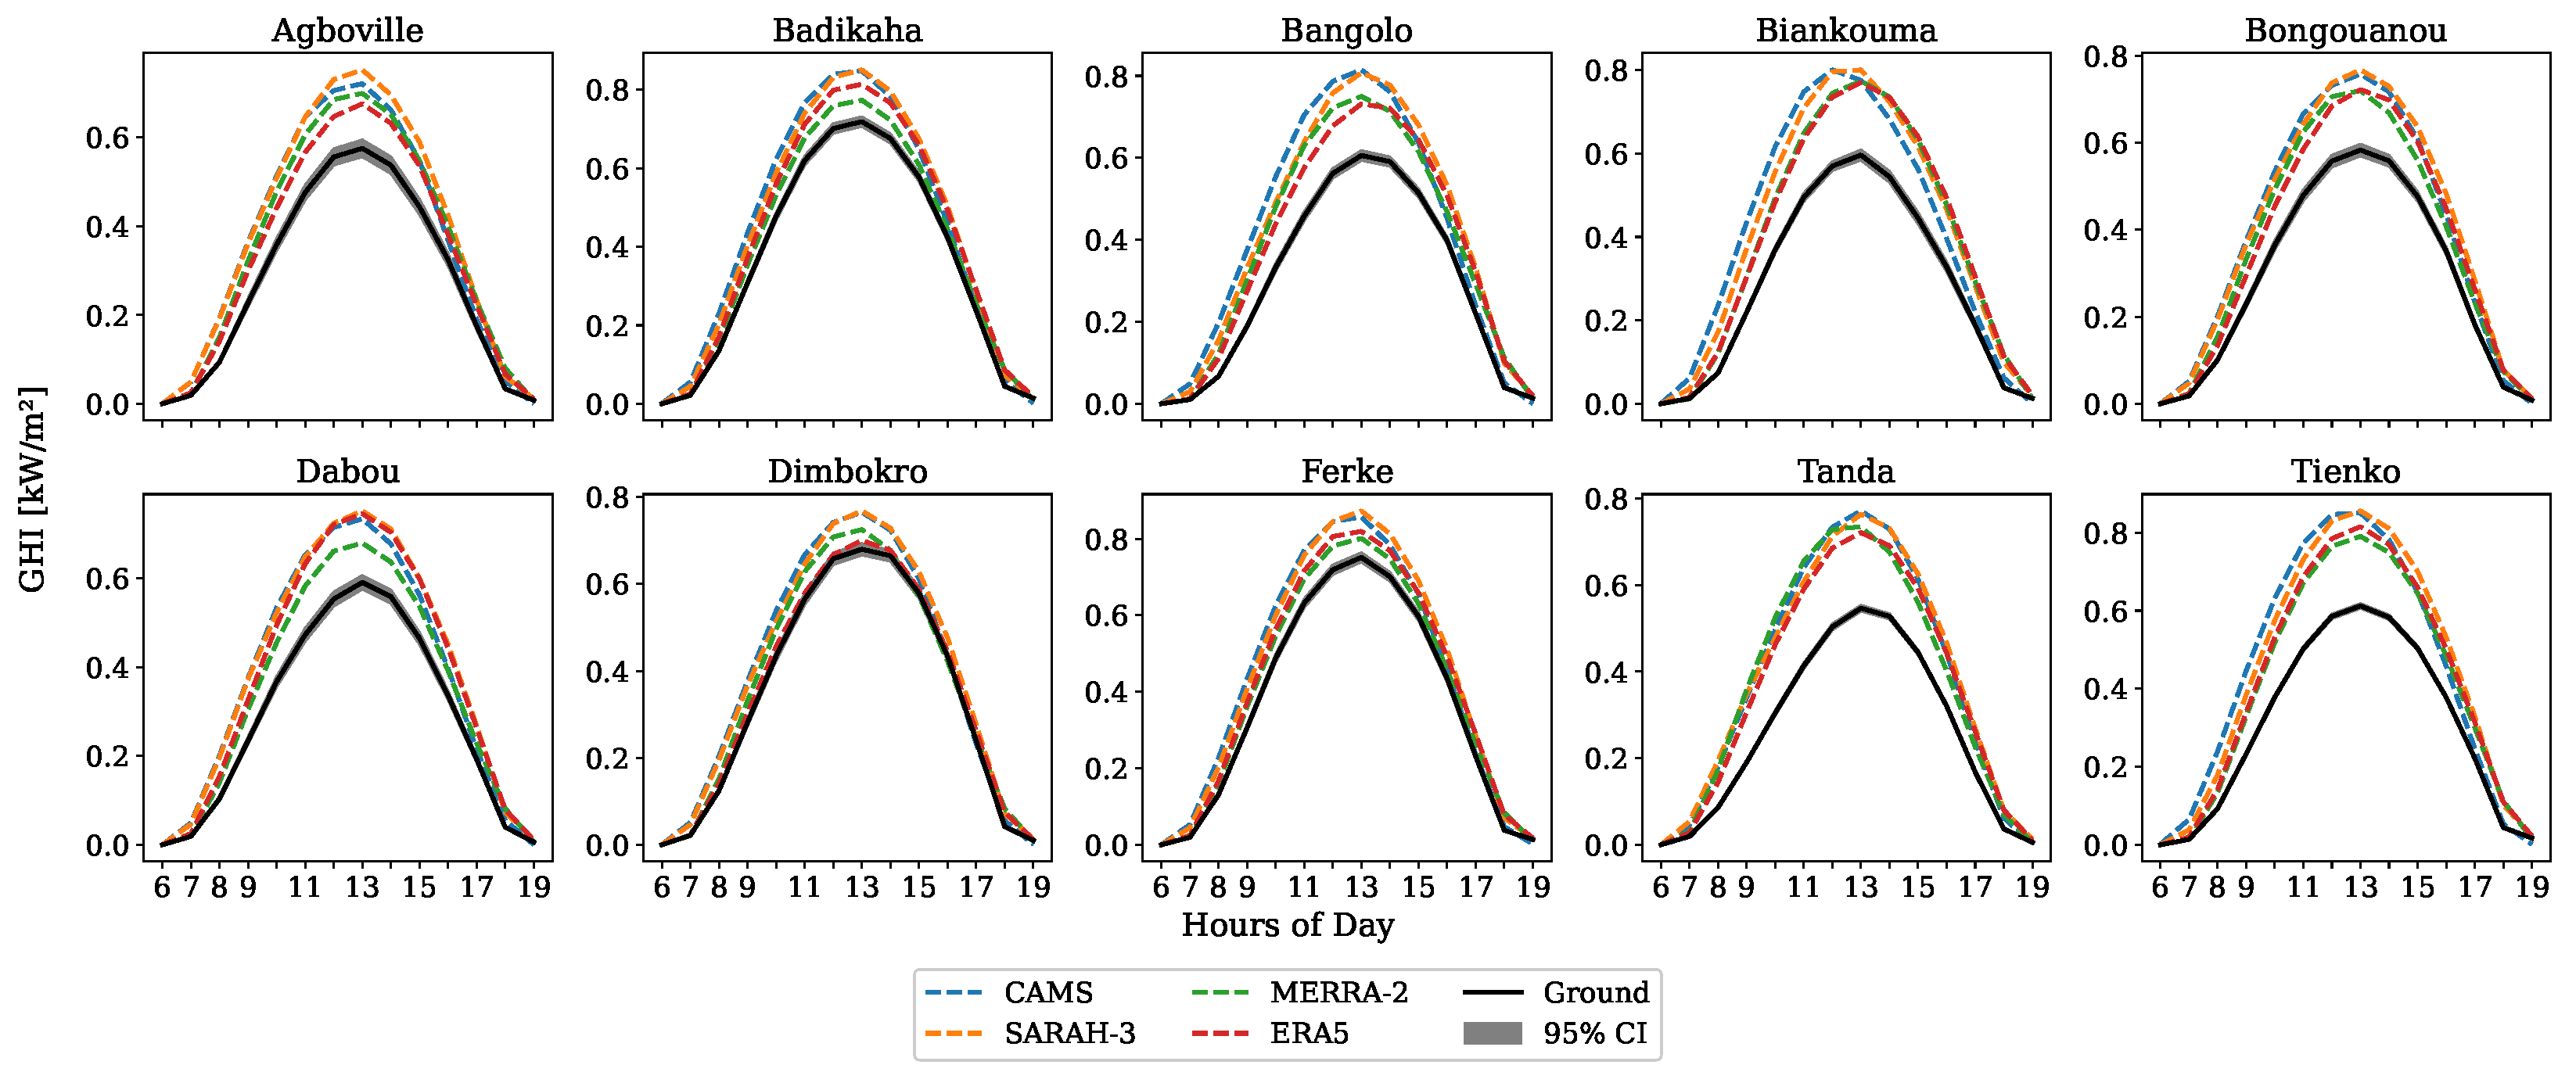
3.2.2. Performance Evaluation of Daily Datasets

The bar charts in Figure 16 display the rMBD, rRMSD and CPI for the daily datasets of satellite-based and reanalysis products at stations with at least 35 clear-sky days, ensuring that CPI calculation is feasible. In the northern region, apart from the Tienko station, where MERRA-2 underestimates GHI, all other stations exhibit an overestimation of their GHI values by both satellite-based and reanalysis products. In this region, the rMBD values range from approximately 0 to nearly 20%, with MERRA-2 and ERA5 outperforming the other products. This is not the case in other climatic zones. The same patterns observed in the hourly data are found, meaning an overestimation by CAMS and SARAH-3 and an underestimation by MERRA-2 and ERA5. Overall, the metrics show better values compared to hourly data, due to error smoothing. Short-term fluctuations in cloud cover, aerosol concentration and atmospheric conditions introduce noise in model estimates. Over longer timescales, these errors average out, leading to better agreement with ground measurements. Random errors in hourly estimates from reanalysis products (for instance, due to short-term cloud cover misrepresentation) can partially cancel out when summed over a day or month. In contrast, satellite-based errors, which are often systematic, persist and do not average out, even after aggregation [60].
The coefficient r varies from 0 to 0.9 under cloudy-sky days, with an average value of 0.6. The R 2 values vary widely, from −5.3 to 0.2, with a mean of −2.3. The rMBD and rRMSD values range from 4.9% to 49.6% and from 17.7% and 52.7%, respectively, with average values of 30.2% and 37.3%, respectively. The CPI shows significant variability, ranging from 33.9% to 497.9%, with an average of 202.5%. Among the models, ERA5 and MERRA-2 exhibit the best CPI performance, though overall differences between models are not substantial. SARAH-3 and CAMS remain closely aligned, with an average rMBD of 8.7% for the two. Tienko (Figure 17) shows the highest distribution disagreement under cloudy-sky days, while Dimbokro (Figure 18) has the best performance overall, with the lowest values of CPI. No clear trends emerge based on climatic zones. Metric values under all-sky conditions are similar to those of cloudy-sky days. Under all-sky conditions, the rMBD ranges from a minimum of 3.5% to a maximum of 50.4%, with an average of 30.7%. The rRMSD varies between 16.5% and 58.0%, with a mean of 38.0%. CPI values range from 24.1% to 477.1%, with an average of 191.0%. CAMS and SARAH-3 are still outperformed by reanalysis products. They remain closely aligned, with an average rMBD of 8.6% for both of them. Tienko (CPI = 477.1% for CAMS) and Dimbokro (CPI = 24.1% for ERA5) remain the stations with lowest and highest performance, respectively. Regarding climatic zones, northern stations (ATE and TT) generally exhibit the poorest model performance.
For overcast days, the Pearson coefficient ranges from −0.2 to 1.0, with an average of 0.7. Most negative values are observed at stations with fewer data points. As analyses are performed at the station level, these stations do not influence the results and are not removed. All R 2 values are negative, ranging from −120.2 to −1.4, with a mean of −28.3. The rMBD reveals that all models tend to overestimate solar radiation under overcast conditions, with values ranging from 38.9% to 197.7% and an average of 97.7%. The rRMSD varies between 45.3% and 213.1%, with a mean of 113%, while the CPI ranges from 42.9% to 260.7%, averaging 107%. Among the models, CAMS and SARAH-3 outperform the reanalysis products, with MERRA-2 showing the poorest performance. In terms of station performance, Katiola (Figure 19) records the best agreement (CPI = 42.9% for SARAH-3), while Tanda (Figure 20) shows the worst CPI value (260.7% for MERRA-2). Dimbokro has fewer than 35 data points under this condition. Regarding climatic zones, no clear trends are observed.
Table 4 presents the minimum, maximum and average values of the metrics for the daily dataset analysis. The results at this temporal scale indicate an overall better performance in products compared to the hourly data. This enhancement is attributed to the fact that, over longer timescales, errors in short-term values tend to average out, resulting in a closer alignment with ground-based measurements. While the linear correlation coefficients remain relatively high for the CAMS and SARAH-3 datasets, more advanced metrics (OVER, KSI and CPI) suggest that reanalysis products generally perform better under all the sky conditions, except for overcast days. However, the limited number of data points available for most stations under clear-sky and overcast conditions may introduce biases in the analysis.

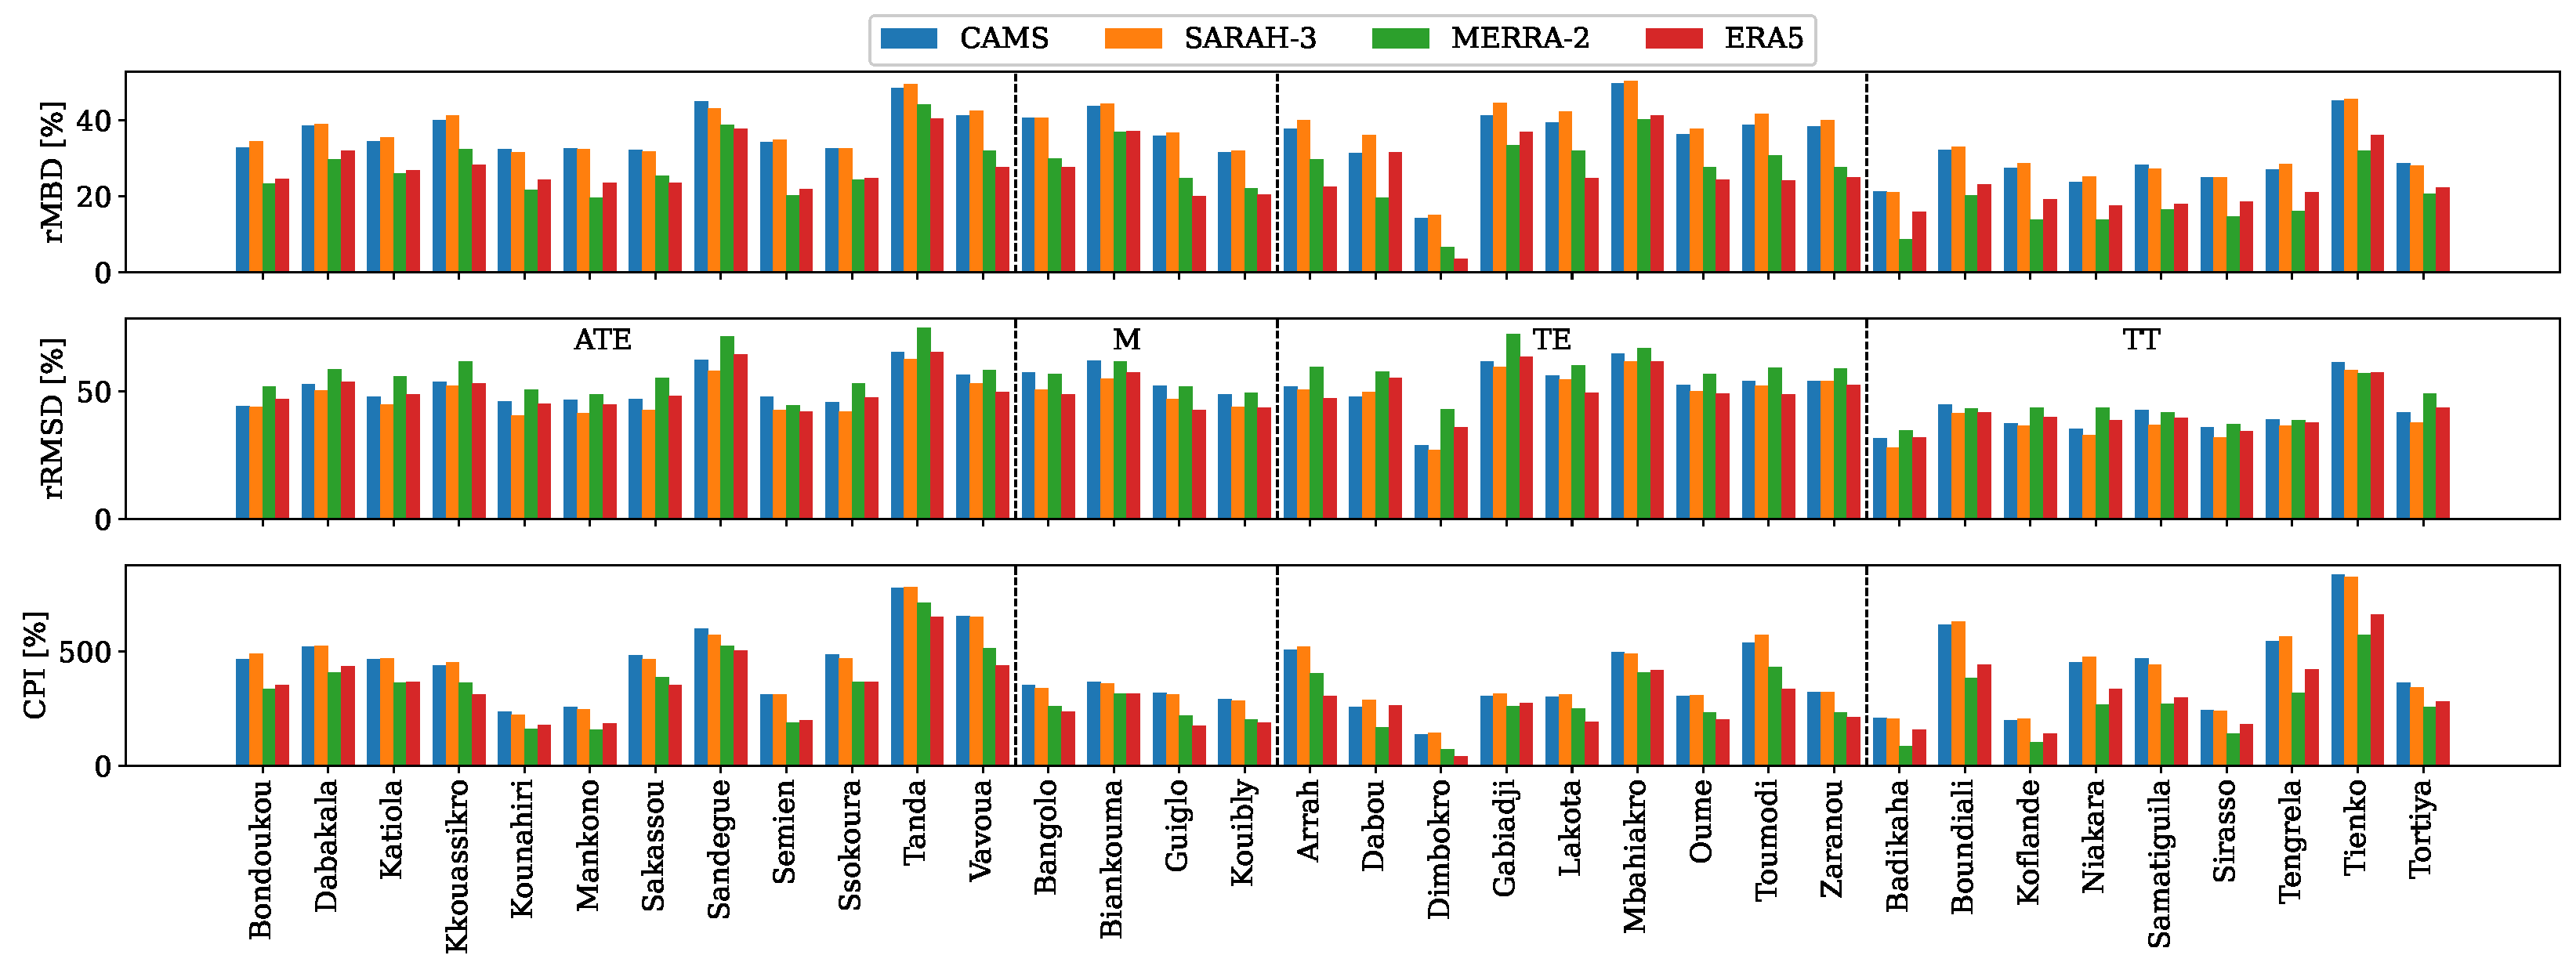
3.2.3. Performance Evaluation of Monthly Datasets

For this dataset, to continue with the analysis using the CPI metric, only stations with at least 35 data points are considered. As a result, most stations have very few data points classified as clear-sky conditions. Therefore, the analysis focuses solely on all-sky conditions. However, in Section 3.2.4, clear-sky conditions are considered when comparing across the different timescales. Figure 21 presents the rMBD, rRMSD and CPI metrics of the four products under all-sky conditions for the monthly dataset.
No station from the mountainous zone has sufficient data. In terms of the rMBD, all products overestimate GHI, with biases ranging from 13.7% (MERRA-2, Niakara) to 49.4% (SARAH-3, Tanda). The rRMSD values range from 18.8% (ERA5, Niakara) to 51.5% (SARAH-3, Tanda). As for the CPI values, they range from 33.7% (MERRA-2, Tortiya) to 130.1% (CAMS, Tienko). ERA5 demonstrates the best metric values, except in the northern region, where SARAH-3 performs better. The two satellite-based products show close values. Geographically, northern stations such as Boundiali and Tienko exhibit higher errors for CAMS and SARAH-3, likely due to challenges in capturing GHI variability influenced by aerosols or cloud cover, whereas ERA5 performs relatively better. In central and southern regions, performance varies across models, but reanalysis products (ERA5 and MERRA-2) generally outperform satellite-based products. Overall, ERA5 consistently achieves the best performance across most metrics, followed by MERRA-2. SARAH-3 exhibits the highest bias and error, making it less reliable for monthly GHI estimation, while CAMS shows more variable performance depending on location.

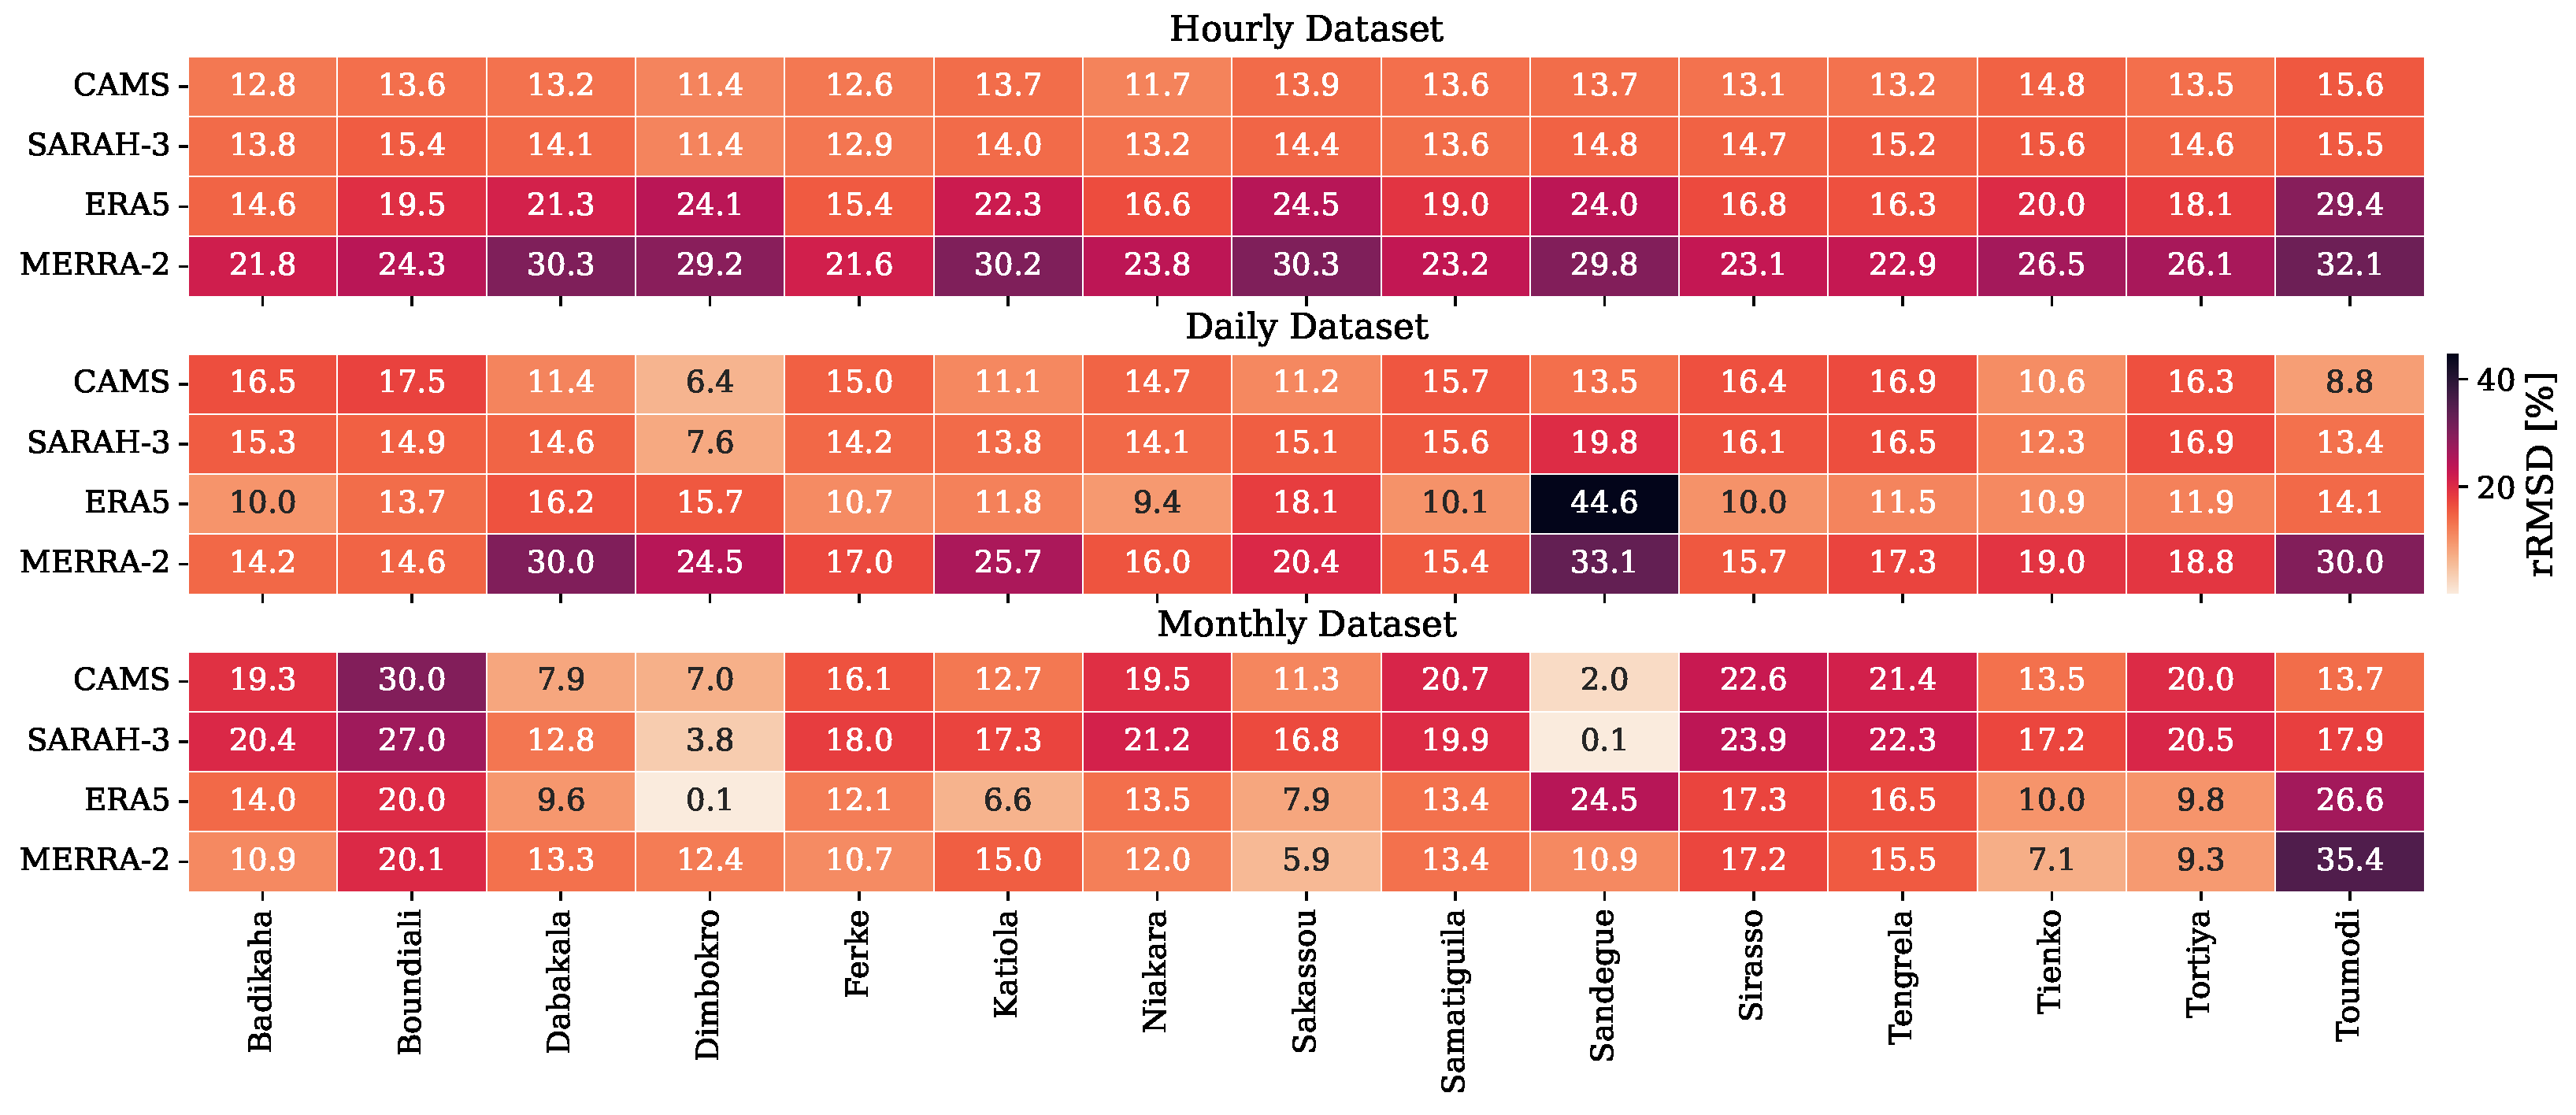
3.2.4. Comparison Across Temporal Scales

The performance of the four products was compared across different temporal scales at various stations. These comparisons are summarized in the heatmaps shown in Figure 22 and Figure 23 for clear-sky and all-sky conditions, respectively. To avoid the constraint of requiring at least 35 data points (N ≥ 35) when calculating the CPI and to enable comparison across multiple stations while considering all timescales (hourly, daily and monthly), the rRMSD was chosen for product comparisons across the three timescales.
Under clear-sky conditions, Figure 22 illustrates a significant reduction in overall deviations between ground-based measurements and the GHI values estimated by reanalysis products. On average, aggregation reduces errors by approximately 5.5% for these two products. However, for satellite-based products, deviations from ground measurements instead increase by an average of 0.1% for CAMS and 0.4% for SARAH-3. This increase in errors for satellite products becomes more pronounced from the hourly dataset to the monthly dataset, with errors rising by 2.5% for CAMS and 3.1% for SARAH-3. In contrast, reanalysis products maintain a reduction in errors, averaging 6.7% for ERA5 and 12.4% for MERRA-2.
Under all-sky conditions, however, both reanalysis and satellite products show reduced deviations when moving from the hourly dataset to the daily dataset through summation. ERA5 and MERRA-2 exhibit a decrease in deviations of 13.5%, while CAMS and SARAH-3 show a more modest reduction of 11.9% and 7.9%, respectively. In these conditions, the presence of clouds, in addition to aerosol and water vapor effects, increases the complexity of GHI estimation. As a result, errors are more pronounced in hourly data and propagate to longer timescales. From the hourly dataset to the monthly dataset, errors decrease by 19.5%, 23%, 13.4% and 9.2% for ERA5, MERRA-2, CAMS and SARAH-3, respectively.
Finally, the performance of the products was analyzed from a seasonal perspective. The combined performance index (CPI) was calculated for each station by grouping the data by month. The results are presented in the heatmaps in Figure 24, with values ranging from 18.0% (MERRA-2, Ferke, March) to 529.3% (SARAH-3, Tienko, January). All products struggle to accurately estimate GHI for the December–January–February period, which corresponds to the Harmattan season in Côte d’Ivoire. For the other months, CAMS, SARAH-3 and ERA5 exhibit relatively stable performance, with ERA5 outperforming the other two. MERRA-2, on the other hand, achieves its best performance for the March–April–May period, even surpassing the other three products. However, during the remaining months, particularly from June to October—the rainy season—MERRA-2 records the worst performance, although some northern stations continue to show good results for this product.

4. Discussion

The findings of this study underscore the infrequent occurrence of clear-sky conditions in Côte d’Ivoire. This rarity of clear-sky events has been extensively documented in previous research [61,62]. The country’s consistently high humidity levels, driven by its proximity to the Atlantic Ocean and moisture-laden winds from the Gulf of Guinea, fosters the development of clouds [63,64]. This persistent cloud cover greatly reduces the occurrence of clear-sky days. Furthermore, Danso et al. [65] reported that southern West Africa exhibits higher cloudiness compared to other parts of the region across all seasons, with mean total cloud cover fractions reaching up to 80% during the monsoon season. Additionally, their analysis indicated a consistently high fractional coverage of low-level clouds for extended periods throughout the year, with ERA5 data showing values of up to 40% during the rainy season.
During clear-sky hours, CAMS and SARAH-3 outperform ERA5 and MERRA-2, with CAMS demonstrating the highest overall accuracy, except in northern Côte d’Ivoire, where ERA5 performs best. The superior performance of satellite-based products can be attributed to their use of real-time satellite observations of the Earth’s surface and atmosphere. Under clear-sky conditions, the absence of clouds minimizes uncertainties related to cloud detection and optical properties, resulting in greater accuracy. In contrast, reanalysis products rely on assimilated data and model physics, often with coarse spatial resolution. Errors in the representation of aerosols, water vapor and surface albedo can negatively impact the accuracy of clear-sky radiation estimates [32]. However, the overestimation of GHI by satellite products—reaching up to 10.4% for CAMS and up to 13.5% for SARAH-3—may be linked to uncertainties in aerosol data used in these models. Both CAMS and SARAH-3 acknowledge this issue [32,66]. In regions like Côte d’Ivoire, where ground-based measurements are scarce, the accuracy of aerosol data is less well constrained. This may lead to an underestimation of aerosol concentrations in satellite products, contributing to the observed overestimation of GHI. Conversely, this significant knowledge gap regarding aerosol and water vapor concentrations may result in their overestimation in reanalysis products, leading to an underestimation of GHI values. The overall better performance of ERA5 in the northern part of Côte d’Ivoire could be explained by the distribution of aerosols across the country. Indeed, the northern region has higher concentrations of strong GHI-reducing aerosols, such as biomass burning and domestic fires (70.7%), road traffic (16%), road dust and sea salt (8.1%) and natural dust (2.6%) [67], which aligns with the tendency of ERA5 to overestimate aerosol concentrations, as stated earlier. However, CAMS and SARAH-3 exhibit lower error dispersion, which is likely due to their reliance on direct satellite observations.
Reanalysis products outperform satellite products during cloudy-sky and all-sky conditions. However, all products tend to overestimate GHI in these conditions. The performance of both satellite and reanalysis products under cloudy and overcast conditions is largely influenced by their ability to accurately represent cloud properties [68,69]. The decline in satellite product performance under these conditions could be linked to the inability of satellite sensors to detect optically thin clouds in the atmosphere [65]. Numerous studies have highlighted the predominance of low-level cloud cover (extending from the Earth’s surface up to 800 hPa [70] or 2 km [63]) in Côte d’Ivoire. Danso et al. [65] also reported that reanalysis products (such as ERA5) tend to accurately account for this high cloud coverage over Côte d’Ivoire. The overestimations observed under these conditions could be attributed to the same reasons mentioned earlier. The presence of clouds may further challenge both satellite and reanalysis products.
At longer timescales (daily and monthly), the errors associated with shorter timescales tend to smooth out. The metric values decrease by 7.2% for the daily dataset and 9.8% for the monthly dataset on average, compared to their values for the hourly dataset. Although satellite products benefit from direct observations, the few systematic errors present in each observation accumulate over time, leading to more biases at longer timescales. In contrast, reanalysis products, despite potential inaccuracies in aerosol and water vapor representation at shorter timescales, tend to perform better over longer periods as these variables are better averaged out. This can explain the greater reduction observed in their rRMSD values, compared to satellite-based products.
In terms of seasonal performance, all products face challenges in accurately estimating GHI during the DJF period (winter in the northern hemisphere). This may be due to the presence of the Harmattan season during this period, when aerosol concentrations reach their peak [71]. The strong performance observed during the MAM period (summer), as clearly demonstrated by MERRA-2 (Figure 24), could be linked to the more frequent occurrence of clear-sky hours during this season (Figure 5).

5. Conclusions

This study evaluated the performance of four satellite-based and reanalysis products in estimating GHI across hourly, daily and monthly timescales, using ground-based measurements as a reference. Among the evaluated datasets, CAMS and SARAH-3 outperformed reanalysis products under clear-sky and overcast conditions, particularly for overcast hours and days. However, in all other conditions, ERA5 and MERRA-2 demonstrated superior performance, with ERA5 emerging as the most reliable overall. This can be attributed to its advanced data assimilation techniques, which enhance cloud representation and reduce biases in irradiance estimation. CAMS and SARAH-3 performed well under clear-sky conditions but tended to overestimate GHI in cloudy conditions due to limitations in their cloud parameterization schemes. While all evaluated products struggled to capture GHI accurately at shorter timescales, they proved to be viable alternatives for estimating daily and monthly total irradiation, particularly in regions with scarce ground-based data. As the timescale increased, deviations between model estimates and ground measurements tended to smooth out. However, under clear-sky conditions, where random errors were minimal, CAMS and SARAH-3 accumulated systematic errors over longer periods, leading to increased biases. This study highlights the importance of improving local cloud microphysics modeling to enhance future GHI estimations. Additionally, ground-based observations of aerosol and water vapor distributions are crucial for refining the accuracy of satellite-based and reanalysis products in West Africa and beyond.

Author Contributions

Conceptualization, P.-C.K.K.; methodology, P.-C.K.K.; software, P.-C.K.K.; validation, P.-C.K.K., N.F.K.E. and J.A.O.; formal analysis, P.-C.K.K.; investigation, P.-C.K.K.; resources, P.-C.K.K. and N.F.K.E.; data curation, P.-C.K.K.; writing—original draft preparation, P.-C.K.K.; writing—review and editing, G.F., J.A.O., D.L., B.A. and N.F.K.E.; visualization, P.-C.K.K.; supervision, D.L, B.A. and G.F.; funding acquisition, G.F. All authors have read and agreed to the published version of the manuscript.

Funding

This research was financially supported by the German Ministry of Education and Research (BMBF) through the West African Science Service Center on Climate Change and Adapted Land Use (WASCAL).

Data Availability Statement

The original contributions presented in this study are included in the article; further inquiries can be directed to the corresponding author.

Acknowledgments

The authors express their sincere gratitude to the West African Science Service Centre on Climate Change and Adapted Land Use and the German Federal Ministry of Education and Research for their financial support, which enabled this research. They also deeply appreciate the National Meteorological and Aeronautical Services of Côte d’Ivoire for supplying the critical data utilized in this study. Finally, they would like to express their sincere gratitude to the editors and the anonymous reviewers for their insightful comments and suggestions, which significantly improved the quality of this manuscript. Their valuable feedback helped refine our analysis and presentation.

Conflicts of Interest

The authors declare no conflicts of interest.

References

  1. Ackah, I.; Asiama, R.K.; Ohene, A.O.; Essuman, V.A.; Eshun, M.E.; Owusu, C.; Nyarko, P. The Gains and Pains of the Energy Transition: A Perspective on Sub-Saharan Africa. In Energy Regulation in Africa: Dynamics, Challenges, and Opportunities; Ackah, I., Gatete, C., Eds.; Springer Nature: Cham, Switzerland, 2024; pp. 453–472. [Google Scholar] [CrossRef]
  2. Official Website of the Ministry of Petroleum, Energy and Renewable Energies of Côte d’Ivoire. Available online: https://www.energie.gouv.ci/ (accessed on 4 February 2025).
  3. ISO 9060:2018; Solar Energy—Specification and Classification of Instruments for Measuring Hemispherical Solar and Direct Solar Radiation, 2nd ed. International Organization for Standardization: Geneva, Switzerland, 2018. Available online: https://www.iso.org/standard/67464.html (accessed on 10 February 2025).
  4. Iturbide, P.; Alonso-Suarez, R.; Ronchetti, F. An Analysis of Satellite-Based Machine Learning Models to Estimate Global Solar Irradiance at a Horizontal Plane. In Proceedings of the Cloud Computing, Big Data & Emerging Topics; Springer: Cham, Switzerland, 2023; pp. 118–128. [Google Scholar]
  5. Jain, S.; Singh, C.; Tripathi, A.K. A Flexible and Effective Method to Integrate the Satellite-Based AOD Data into WRF-Solar Model for GHI Simulation. J. Indian Soc. Remote Sens. 2021, 49, 2797–2813. [Google Scholar] [CrossRef]
  6. Zhang, H.; Cao, Y.; Zhang, Y.; Terzija, V. Quantitative synergy assessment of regional wind-solar energy resources based on MERRA reanalysis data. Appl. Energy 2018, 216, 172–182. [Google Scholar] [CrossRef]
  7. Psiloglou, B.; Kambezidis, H.; Kaskaoutis, D.; Karagiannis, D.; Polo, J. Comparison between MRM simulations, CAMS and PVGIS databases with measured solar radiation components at the Methoni station, Greece. Renew. Energy 2020, 146, 1372–1391. [Google Scholar] [CrossRef]
  8. Palmer, D.; Blanchard, R. Evaluation of High-Resolution Satellite-Derived Solar Radiation Data for PV Performance Simulation in East Africa. Sustainability 2021, 13, 1852. [Google Scholar] [CrossRef]
  9. Sawadogo, W.; Bliefernicht, J.; Fersch, B.; Salack, S.; Guug, S.; Diallo, B.; Ogunjobi, K.; Nakoulma, G.; Tanu, M.; Meilinger, S.; et al. Hourly global horizontal irradiance over West Africa: A case study of one-year satellite- and reanalysis-derived estimates vs. in situ measurements. Renew. Energy 2023, 216, 119066. [Google Scholar] [CrossRef]
  10. Mendyl, A.; Mabasa, B.; Bouzghiba, H.; Weidinger, T. Calibration and Validation of Global Horizontal Irradiance Clear Sky Models against McClear Clear Sky Model in Morocco. Appl. Sci. 2023, 13, 320. [Google Scholar] [CrossRef]
  11. Lefèvre, M.; Oumbe, A.; Blanc, P.; Espinar, B.; Gschwind, B.; Qu, Z.; Wald, L.; Schroedter-Homscheidt, M.; Hoyer-Klick, C.; Arola, A.; et al. McClear: A new model estimating downwelling solar radiation at ground level in clear-sky conditions. Atmos. Meas. Tech. 2013, 6, 2403–2418. [Google Scholar] [CrossRef]
  12. Anderson, K.; Hansen, C.; Holmgren, W.; Jensen, A.; Mikofski, M.; Driesse, A. pvlib python: 2023 project update. J. Open Source Softw. 2023, 8, 5994. [Google Scholar] [CrossRef]
  13. Kenny, D.; Fiedler, S. Which gridded irradiance data is best for modelling photovoltaic power production in Germany? Sol. Energy 2022, 232, 444–458. [Google Scholar] [CrossRef]
  14. Mathews, D.; Ó Gallachóir, B.; Deane, P. Systematic bias in reanalysis-derived solar power profiles & the potential for error propagation in long duration energy storage studies. Appl. Energy 2023, 336, 120819. [Google Scholar] [CrossRef]
  15. Khan, M.U.; Jama, M.A. Evaluation and correction of solar irradiance in Somaliland using ground measurements and global reanalysis products. Heliyon 2024, 10, e35256. [Google Scholar] [CrossRef] [PubMed]
  16. Potisomporn, P.; Adcock, T.A.; Vogel, C.R. Evaluating ERA5 reanalysis predictions of low wind speed events around the UK. Energy Rep. 2023, 10, 4781–4790. [Google Scholar] [CrossRef]
  17. Frank, C.W.; Wahl, S.; Keller, J.D.; Pospichal, B.; Hense, A.; Crewell, S. Bias correction of a novel European reanalysis data set for solar energy applications. Sol. Energy 2018, 164, 12–24. [Google Scholar] [CrossRef]
  18. Tong, L.; He, T.; Ma, Y.; Zhang, X. Evaluation and intercomparison of multiple satellite-derived and reanalysis downward shortwave radiation products in China. Int. J. Digit. Earth 2023, 16, 1853–1884. [Google Scholar] [CrossRef]
  19. Claver Kakou, K.P.; Laouali, D.; Aka, B.; Osei, J.A.; Franck Kassi Ette, N.; Frey, G. Validation of Satellite-derived Daily Sunshine Duration Estimates Against Campbell-Stokes Sensor Measurements in Côte d’Ivoire. In Proceedings of the 2024 IEEE International Humanitarian Technologies Conference (IHTC), Bari, Italy, 27–30 November 2024; pp. 1–7. [Google Scholar] [CrossRef]
  20. Kouassi, A.M.; Kouao, J.M.; Kouakou, K. Intra-annual characterization of climate variability in Ivory Coast. Bull. de l’Association de Géographes Français 2022, 99, 289–306. [Google Scholar] [CrossRef]
  21. Dajuma, A.; Yahaya, S.; Touré, S.; Diedhiou, A.; Adamou, R.; Konaré, A.; Sido, M.; Golba, M. Sensitivity of Solar Photovoltaic Panel Efficiency to Weather and Dust over West Africa: Comparative Experimental Study between Niamey (Niger) and Abidjan (Côte d’Ivoire). Comput. Water Energy Environ. Eng. 2016, 5, 123–147. [Google Scholar] [CrossRef]
  22. Soro, T.D.; Koné, M.; N’Dri, A.B.; N’Datchoh, E.T. Identified Main Fire Hotspots and Seasons in Côte d’Ivoire (West Africa) Using MODIS Fire Data. S. Afr. J. Sci. 2021, 117, 1–13. [Google Scholar] [CrossRef]
  23. Nassa, R.; Kouassi, A.; Toure, M. Sensitivity of Statistical Models for Extremes Rainfall Adjustment Regarding Data Size: Case of Ivory Coast. J. Water Resour. Prot. 2021, 13, 654–674. [Google Scholar] [CrossRef]
  24. Tie, A.G.B.; Konan, B.; Brou, Y.T.; Issiaka, S.; Fadika, V.; Srohourou, B. Estimation des pluies exceptionnelles journalières en zone tropicale: Cas de la Côte d’Ivoire par comparaison des lois lognormale et de Gumbel. Hydrol. Sci. J. 2007, 52, 49–67. [Google Scholar] [CrossRef]
  25. Santé, N.; N’Go, Y.A.; Soro, G.E.; Meledje, N.H.; Goula, B.T.A. Characterization of Meteorological Droughts Occurrences in Côte d’Ivoire: Case of the Sassandra Watershed. Climate 2019, 7, 60. [Google Scholar] [CrossRef]
  26. Global Solar Atlas. Côte d’Ivoire Solar Resource Data. 2023. Available online: https://globalsolaratlas.info/download/cote-d-ivoire (accessed on 16 October 2024).
  27. Qu, Z.; Oumbe, A.; Blanc, P.; Espinar, B.; Gesell, G.; Gschwind, B.; Klüser, L.; Lefèvre, M.; Saboret, L.; Schroedter-Homscheidt, M.; et al. Fast radiative transfer parameterisation for assessing the surface solar irradiance: The Heliosat-4 method. Meteorol. Z. 2017, 26, 33–57. [Google Scholar] [CrossRef]
  28. Schroedter-Homscheidt, M.; Azam, F.; Betcke, J.; Hanrieder, N.; Lefèvre, M.; Saboret, L.; Saint-Drenan, Y.M. Surface solar irradiation retrieval from MSG/SEVIRI based on APOLLO Next Generation and HELIOSAT-4 methods. Contrib. Atm. Sci./Meteorol. Z. 2022, 31, 455–476. [Google Scholar] [CrossRef]
  29. CAMS Gridded Solar Radiation. Available online: https://ads.atmosphere.copernicus.eu/datasets/cams-gridded-solar-radiation?tab=overview (accessed on 12 November 2024).
  30. Hersbach, H.; Bell, B.; Berrisford, P.; Biavati, G.; Horányi, A.; Muñoz Sabater, J.; Nicolas, J.; Peubey, C.; Radu, R.; Rozum, I.; et al. ERA5 Hourly Data on Single Levels from 1940 to Present. 2023. Available online: https://cds.climate.copernicus.eu/datasets/reanalysis-era5-single-levels?tab=overview (accessed on 12 November 2024). [CrossRef]
  31. Global Modeling and Assimilation Office (GMAO). MERRA-2 tavg1_2d_rad_Nx: 2d, 1-Hourly, Time-Averaged, Single-Level, Assimilation, Radiation Diagnostics V5.12.4, 2015. Digital Science Data. Available online: https://cmr.earthdata.nasa.gov/search/concepts/C1276812851-GES_DISC.html (accessed on 12 November 2024). [CrossRef]
  32. Pfeifroth, U.; Kothe, S.; Drücke, J.; Trentmann, J.; Schröder, M.; Selbach, N.; Hollmann, R. Surface Radiation Data Set-Heliosat (SARAH)-Edition 3. 2023. Available online: https://navigator.eumetsat.int/product/EO:EUM:DAT:0863 (accessed on 12 November 2024). [CrossRef]
  33. World Meteorological Organization. Technical Note N° 172; Technical Report WMO-No. 554; World Meteorological Organization: Geneva, Switzerland, 1981. [Google Scholar]
  34. Agence Française de Développement. Étude des Besoins et Stratégie de Développement des Services Climatiques Dans le Domaine de L’agriculture en Côte d’Ivoire: Cartographie du Réseau National D’observation. 2022. Available online: https://www.prospect-cs.be/extranet/?voir=one-project&projectid=1236 (accessed on 10 February 2025).
  35. Konate, D.; Didi, S.R.; Dje, K.B.; Diedhiou, A.; Kouassi, K.L.; Kamagate, B.; Paturel, J.E.; Coulibaly, H.S.J.P.; Kouadio, C.A.K.; Coulibaly, T.J.H. Observed Changes in Rainfall and Characteristics of Extreme Events in Côte d’Ivoire (West Africa). Hydrology 2023, 10, 104. [Google Scholar] [CrossRef]
  36. Espinar, B.; Blanc, P.; Wald, L.; Hoyer-Lick, C.; Schroedter-Homscheidt, M.; Wanderer, T. Controlling the quality of measurements of meteorological variables and solar radiation. From sub-hourly to monthly average time periods. In Proceedings of the EGU General Assembly 2012, European Geosciences Union, Vienna, Austria, 22–27 April 2012; pp. 22–27. [Google Scholar]
  37. Long, C.N.; Dutton, E.G. BSRN Global Network recommended QC tests, V2.x. 2010. Available online: https://hdl.handle.net/10013/epic.38770.d001 (accessed on 15 November 2024).
  38. Remund, J.; Müller, S.; Schmutz, M.; Barsotti, D.; Graf, P.; Cattin, R. Handbook Part II: Theory; Meteotest AG: Bern, Switzerland, 2017. [Google Scholar]
  39. Younes, S.; Claywell, R.; Muneer, T. Quality control of solar radiation data: Present status and proposed new approaches. Energy 2005, 30, 1533–1549. [Google Scholar] [CrossRef]
  40. Duarte, L.V.; Formiga, K.T.M.; Costa, V.A.F. Comparison of Methods for Filling Daily and Monthly Rainfall Missing Data: Statistical Models or Imputation of Satellite Retrievals? Water 2022, 14, 3144. [Google Scholar] [CrossRef]
  41. Kambezidis, H.D. The solar radiation climate of Athens: Variations and tendencies in the period 1992–2017, the brightening era. Sol. Energy 2018, 173, 328–347. [Google Scholar] [CrossRef]
  42. Younes, S.; Muneer, T. Clear-sky classification procedures and models using a world-wide data-base. Appl. Energy 2007, 84, 623–645. [Google Scholar] [CrossRef]
  43. Ianetz, A.; Lyubansky, V.; Setter, I.; Kriheli, B.; Evseev, E.G.; Kudish, A.I. Inter-comparison of different models for estimating clear sky solar global radiation for the Negev region of Israel. Energy Convers. Manag. 2007, 48, 259–268. [Google Scholar] [CrossRef]
  44. Reindl, D.; Beckman, W.; Duffie, J. Diffuse fraction correlations. Sol. Energy 1990, 45, 1–7. [Google Scholar] [CrossRef]
  45. Li, D.H.; Lam, J.C. An analysis of climatic parameters and sky condition classification. Build. Environ. 2001, 36, 435–445. [Google Scholar] [CrossRef]
  46. Kuye, A.; Jagtap, S. Analysis of solar radiation data for Port Harcourt, Nigeria. Sol. Energy 1992, 49, 139–145. [Google Scholar] [CrossRef]
  47. Gueymard, C.A. A review of validation methodologies and statistical performance indicators for modeled solar radiation data: Towards a better bankability of solar projects. Renew. Sustain. Energy Rev. 2014, 39, 1024–1034. [Google Scholar] [CrossRef]
  48. Chicco, D.; Warrens, M.J.; Jurman, G. The coefficient of determination R-squared is more informative than SMAPE, MAE, MAPE, MSE and RMSE in regression analysis evaluation. PeerJ Comput. Sci. 2021, 7, e623. [Google Scholar] [CrossRef] [PubMed]
  49. Espinar, B.; Ramírez, L.; Drews, A.; Beyer, H.G.; Zarzalejo, L.F.; Polo, J.; Martín, L. Analysis of different comparison parameters applied to solar radiation data from satellite and German radiometric stations. Sol. Energy 2009, 83, 118–125. [Google Scholar] [CrossRef]
  50. Hansen, C.W.; Holmgren, W.F.; Tuohy, A.; Sharp, J.; Lorenzo, A.T.; Boeman, L.J.; Golnas, A. The Solar Forecast Arbiter: An Open Source Evaluation Framework for Solar Forecasting. In Proceedings of the 2019 IEEE 46th Photovoltaic Specialists Conference (PVSC), Chicago, IL, USA, 16–21 June 2019; pp. 2452–2457. [Google Scholar] [CrossRef]
  51. Copernicus Climate Change Service. ERA5-Land Post-Processed Daily-Statistics from 1950 to Present. 2024. Available online: https://cds.climate.copernicus.eu/datasets/derived-era5-land-daily-statistics?tab=overview (accessed on 12 February 2025). [CrossRef]
  52. Roesch, A.; Wild, M.; Ohmura, A.; Dutton, E.G.; Long, C.N.; Zhang, T. Assessment of BSRN radiation records for the computation of monthly means. Atmos. Meas. Tech. 2011, 4, 339–354. [Google Scholar] [CrossRef]
  53. World Meteorological Organization. Guide to Climatological Practices, 2018 ed.; Number WMO-No. 100; World Meteorological Organization (WMO): Geneva, Switzerland, 2018. [Google Scholar]
  54. Trentmann, J. Algorithm Theoretical Baseline Document: Meteosat Solar Surface Radiation and Effective Cloud Albedo Climate Data Records - Heliosat SARAH-3: The MAGICSOL Method Applied for the Generation of SARAH-3. Atbd, EUMETSAT, CM SAF. 2023. Available online: https://www.cmsaf.eu/SharedDocs/Literatur/document/2023/saf_cm_dwd_atbd_sarah_3_5_pdf.html (accessed on 12 February 2025).
  55. Petty, M.D. Calculating and Using Confidence Intervals for Model Validation. In Proceedings of the Fall Simulation Interoperability Workshop 2012, Orlando, FL, USA, 10–14 September 2012. [Google Scholar]
  56. Biagne, R.; Gnagbo, A.; Kouamé, F. Dynamic of the vegetation and climatic variables in Dimbokro Department, Central Côte d’Ivoire. Sci. Vie Terre Agron. 2021, 9, 81–89. [Google Scholar]
  57. Sianturi, Y.; Marjuki; Sartika, K. Evaluation of ERA5 and MERRA2 reanalyses to estimate solar irradiance using ground observations over Indonesia region. AIP Conf. Proc. 2020, 2223, 020002. [Google Scholar] [CrossRef]
  58. Peng, X.; She, J.; Zhang, S.; Tan, J.; Li, Y. Evaluation of Multi-Reanalysis Solar Radiation Products Using Global Surface Observations. Atmosphere 2019, 10, 42. [Google Scholar] [CrossRef]
  59. Babar, B.; Graversen, R.; Boström, T. Solar radiation estimation at high latitudes: Assessment of the CMSAF databases, ASR and ERA5. Sol. Energy 2019, 182, 397–411. [Google Scholar] [CrossRef]
  60. Habib, E.; Haile, A.T.; Sazib, N.; Zhang, Y.; Rientjes, T. Effect of Bias Correction of Satellite-Rainfall Estimates on Runoff Simulations at the Source of the Upper Blue Nile. Remote Sens. 2014, 6, 6688–6708. [Google Scholar] [CrossRef]
  61. Danso, D.K.; Anquetin, S.; Diedhiou, A.; Adamou, R. Cloudiness Information Services for Solar Energy Management in West Africa. Atmosphere 2020, 11, 857. [Google Scholar] [CrossRef]
  62. Clauzel, L.; Anquetin, S.; Lavaysse, C.; Bergametti, G.; Bouet, C.; Siour, G.; Lapere, R.; Marticorena, B.; Thomas, J. Solar radiation estimation in West Africa: Impact of dust conditions during the 2021 dry season. Atmos. Chem. Phys. 2025, 25, 997–1021. [Google Scholar] [CrossRef]
  63. Danso, D.K.; Anquetin, S.; Diedhiou, A.; Kouadio, K.; Kobea, A.T. Daytime low-level clouds in West Africa–occurrence, associated drivers, and shortwave radiation attenuation. Earth Syst. Dyn. 2020, 11, 1133–1152. [Google Scholar] [CrossRef]
  64. Kniffka, A.; Knippertz, P.; Fink, A.H. The role of low-level clouds in the West African monsoon system. Atmos. Chem. Phys. 2019, 19, 1623–1647. [Google Scholar] [CrossRef]
  65. Danso, D.K.; Anquetin, S.; Diedhiou, A.; Lavaysse, C.; Kobea, A.; Touré, N.E. Spatio-temporal variability of cloud cover types in West Africa with satellite-based and reanalysis data. Q. J. R. Meteorol. Soc. 2019, 145, 3715–3731. [Google Scholar] [CrossRef]
  66. Copernicus Atmosphere Monitoring Service Documentation. Available online: https://atmosphere.copernicus.eu/documentation (accessed on 11 February 2025).
  67. Gnamien, S.; Liousse, C.; Keita, S.; Siélé, S.; Bahino, J.; Gardrat, E.; Kassamba-Diaby, M.; Ochou, A.; Yoboué, V. Chemical characterization of urban aerosols in Abidjan and Korhogo (Côte d’Ivoire) from 2018 to 2020 and the identification of their potential emission sources. Environ. Sci. Atmos. 2023, 3, 1741–1757. [Google Scholar] [CrossRef]
  68. Liu, D.; Lu, Y.; Wang, L.; Zhang, M.; Qin, W.; Feng, L.; Wang, Z. Performance evaluation of different cloud products for estimating surface solar radiation. Atmos. Environ. 2025, 344, 121023. [Google Scholar] [CrossRef]
  69. Wang, P.; Westrhenen, R.; Meirink, J.F.; Veen, S.; Knap, W. Surface solar radiation forecasts by advecting cloud physical properties derived from Meteosat Second Generation observations. Sol. Energy 2018, 177, 47–58. [Google Scholar] [CrossRef]
  70. Goessling, H.F.; Rackow, T.; Jung, T. Recent global temperature surge intensified by record-low planetary albedo. Science 2025, 387, 68–73. [Google Scholar] [CrossRef]
  71. Bahino, J.; Giordano, M.; Beekmann, M.; Yoboué, V.; Ochou, A.; Galy-Lacaux, C.; Liousse, C.; Hughes, A.; Nimo, J.; Lemmouchi, F.; et al. Temporal variability and regional influences of PM2.5 in the West African cities of Abidjan (Côte d’Ivoire) and Accra (Ghana). Environ. Sci. Atmos. 2024, 4, 468–487. [Google Scholar] [CrossRef]
Figure 1. Distribution of study stations across four climatic regimes in Côte d’Ivoire.
Remotesensing 17 00998 g001
Figure 2. A flowchart of the validation process.
Remotesensing 17 00998 g002
Figure 3. A plot of the root mean square difference (a) and mean bias difference (b) between the clear-sky GHI provided by the McClear model and the ground-measured GHI data as a function of K t .
Remotesensing 17 00998 g003
Figure 4. A comparison between ground GHI and clear-sky GHI for the three sky conditions classified in this study for the Dimbokro station. All other stations exhibit similar graphs.
Remotesensing 17 00998 g004
Figure 5. Monthly proportions of clear-sky hours. For readability, only the statistics of 15 stations are displayed in this figure. The orange curves represent stations located in the tropical zone. The blue curves represent stations in the equatorial zone.
Remotesensing 17 00998 g005
Figure 6. Scatter plots of hourly clear-sky CAMS GHI vs. ground GHI. Stations from the equatorial zone are colored using the Viridis colormap (gradient: dark blue → green → yellow), while those from the tropical zone use the Plasma colormap (gradient: dark purple → red → orange → yellow). The gradients indicate an increasing density of data points. The dashed black line represents the 1:1 reference line. Numbers of data ponts are indicated in parentheses for each station. The rMBD, the rRMSD, the KSI, OVER and the CPI are expressed in percentages.
Remotesensing 17 00998 g006
Figure 7. Scatter plots of hourly clear-sky SARAH-3 GHI vs. ground GHI. The rMBD, the rRMSD, the KSI, OVER and the CPI are expressed in percentages (similarly to Figure 6). While there is a tendency for the CPI to favor smaller datasets, the Dimbokro station (1624) achieves a better CPI than stations with fewer data points (e.g., Djouroutou (272)).
Remotesensing 17 00998 g007
Figure 8. Bar charts of performance metrics (rMBD, rRMSD and CPI) under clear-sky conditions for reanalysis and satellite-based GHI across different stations in Côte d’Ivoire.
Remotesensing 17 00998 g008
Figure 9. Bar charts of performance metrics (rMBD, rRMSD and CPI) under cloudy-sky conditions for reanalysis and satellite-based GHI across different stations in Côte d’Ivoire.
Remotesensing 17 00998 g009
Figure 10. Bar charts of performance metrics (rMBD, rRMSD and CPI) under all-sky conditions for reanalysis and satellite-based hourly GHI across different stations in Côte d’Ivoire.
Remotesensing 17 00998 g010
Figure 11. Bar charts of performance metrics (rMBD, rRMSD and CPI) under overcast conditions for reanalysis and satellite-based hourly GHI across different stations in Côte d’Ivoire.
Remotesensing 17 00998 g011
Figure 12. Comparisons of daily trends between observed GHI and satellite-based and reanalysis GHI on an hourly basis for clear-sky days.
Remotesensing 17 00998 g012
Figure 13. Similar to Figure 12, but for cloudy-sky days.
Remotesensing 17 00998 g013
Figure 14. Similar to Figure 12, but for all-sky days.
Remotesensing 17 00998 g014
Figure 15. Similar to Figure 12, but for overcast days.
Remotesensing 17 00998 g015
Figure 16. Bar charts of performance metrics (rMBD, rRMSD and CPI) comparing models for all-sky days.
Remotesensing 17 00998 g016
Figure 17. Scatter plots of daily cloudy-sky ground GHI vs. SARAH-3 GHI. rMBD, rRMSD, KSI, OVER and CPI are expressed in percentages. Stations from the equatorial zone are colored using the Viridis colormap (gradient: dark blue → green → yellow), while those from the tropical zone use the Plasma colormap (gradient: dark purple → red → orange → yellow). (similar to Figure 6).
Remotesensing 17 00998 g017
Figure 18. Scatter plots of daily cloudy-sky ground GHI vs. ERA5 GHI. rMBD, rRMSD, KSI, OVER and CPI are expressed in percentages. Stations from the equatorial zone are colored using the Viridis colormap (gradient: dark blue → green → yellow), while those from the tropical zone use the Plasma colormap (gradient: dark purple → red → orange → yellow). (similar to Figure 6).
Remotesensing 17 00998 g018
Figure 19. Scatter plots of daily overcast ground GHI vs. SARAH-3 GHI (similar to Figure 6).
Remotesensing 17 00998 g019
Figure 20. Scatter plots of daily overcast ground GHI vs. MERRA-2 GHI (similar to Figure 6).
Remotesensing 17 00998 g020
Figure 21. Bar charts of performance metrics (rMBD, rRMSD and CPI) comparing models under all-sky conditions for monthly datasets.
Remotesensing 17 00998 g021
Figure 22. Heatmaps comparing the rRMSD for satellite and reanalysis products across hourly, daily and monthly data under clear-sky conditions, including only stations with clear-sky data points across all three datasets.
Remotesensing 17 00998 g022
Figure 23. Heatmaps comparing the rRMSD for satellite and reanalysis products across hourly, daily and monthly data under all-sky conditions.
Remotesensing 17 00998 g023
Figure 24. Heatmaps illustrating the seasonal performance of satellite-based and reanalysis products under all-sky conditions using the hourly dataset.
Remotesensing 17 00998 g024
Table 1. Attributes of the different stations. Lat stands for latitude, Long stands for longitude and Md [%] refers to proportion of missing days.
StationLatLongPeriodMd [%]StationLatLongPeriodMd [%]
Agboville5.9−4.224 November 2022/27 November 20234.6Koflande9.1−3.112 November 2022/29 November 202310.7
Arrah6.6−3.920 July 2019/29 November 20239.2Kouibly7.3−7.218 October 2022/25 June 20249.4
Azaguie5.6−4.025 November 2022/11 June 20245.7Kounahiri7.8−5.808 March 2023/09 April 202410.3
Badikaha9.2−5.105 October 2022/25 June 202414.1Lakota5.8−5.715 October 2022/09 April 20248.5
Bangolo7.0−7.417 October 2022/25 June 20247.9Mafere5.4−3.026 November 2022/25 June 20243.8
Biankouma7.7−7.605 October 2022/25 June 202412.5Mankono8.0−6.207 March 2023/18 June 202410.4
Bondoukou8.0−2.713 April 2019/17 June 202412.6Mbahiakro7.4−4.304 October 2022/11 June 20246.6
Bongouanou6.6−4.228 November 2022/25 June 20243.8Medon5.3−6.202 December 2022/17 June 20245.1
Bonon6.9−6.016 October 2022/11 June 20246.6Niakara8.7−5.311 August 2016/25 June 20248.2
Botro7.8−5.319 April 2019/17 June 202411.5Oume6.4−5.411 November 2022/25 June 202411.8
Boundiali9.5−6.417 August 2016/25 June 202413.3Sakassou7.5−5.318 April 2019/17 June 202414.8
Dabakala8.3−4.424 April 2019/17 June 202414.3Samanza7.5−3.627 November 2022/25 June 20246.6
Dabou5.3−4.325 November 2022/11 June 20249.4Samatiguila9.8−7.621 May 2019/19 June 202413.5
Dimbokro6.6−4.708 April 2022/19 June 20249.7Sandegue7.9−3.513 April 2019/17 June 20247.3
Djouroutou5.3−7.201 December 2022/11 June 20248.2Semien7.6−7.118 October 2022/25 June 202410.0
Doropo9.8−3.310 November 2022/11 June 20249.0Sikensi5.7−4.623 November 2022/25 June 20245.2
Famienkro7.8−3.927 November 2022/11 June 20245.7Sirasso9.3−6.113 October 2022/25 June 202413.3
Ferke9.5−5.206 October 2022/05 April 202414.1Ssokoura7.9−4.412 July 2019/18 June 202412.7
Gabiadji5.0−6.530 November 2022/25 June 202412.2Tanda7.8−3.228 September 2016/11 June 20245.1
Grabo4.9−7.401 December 2022/25 June 20249.1Tengrela10.5−6.418 August 2016/08 June 202412.3
Guiberoua6.2−6.212 November 2022/25 June 20247.6Tienko10.2−7.505 October 2016/225 June 20248.3
Guiglo6.5−7.422 October 2022/25 June 20249.3Tortiya8.8−5.713 May 2019/11 October 202214.4
Guitry5.5−5.214 October 2022/25 June 20245.5Toumodi6.6−5.027 May 2019/18 June 202410.8
Issia6.5−6.611 October 2022/25 June 20246.9Transua7.5−3.007 November 2022/25 June 20245.4
Katiola8.1−5.123 April 2019/29 July 202312.3Vavoua7.4−6.531 May 2018/25 June 202410.3
Kkouassikro7.3−4.716 July 2019/21 April 202412.0Zaranou6.4−3.405 November 2022/25 June 20246.5
Table 2. Metric comparison between the different satellite and reanalysis data under various sky conditions across various climatic zones: transitional equatorial zone (TE), attenuated TE (ATE), transitional tropical zone (TT) and mountainous zone (M). All the metrics are expressed in percentages.
SkyZoneCAMSERA5MERRA-2SARAH-3
CPIrRMSDrMBDCPIrRMSDrMBDCPIrRMSDrMBDCPIrRMSDrMBD
AllTE1414.453.937.61003.951.025.41092.459.928.51473.852.940.1
TT1435.844.830.71075.342.822.6884.545.019.11455.841.431.1
M676.254.837.7466.848.126.1508.454.928.1671.249.038.1
ATE1683.452.837.71294.951.427.91331.558.629.51682.349.238.0
ClearTE42.715.4 1.7 173.427.3 13.0 211.430.8 14.8 43.914.53.1
TT153.313.32.9108.118.0 0.3 176.824.0 3.3 236.814.69.8
M34.415.9 2.2 36.422.3 3.5 57.328.7 4.8 41.315.68.9
ATE72.715.02.1122.323.3 6.0 220.829.6 11.4 97.215.57.3
CloudyTE1227.535.627.0715.831.714.3557.332.910.81422.337.932.1
TT1389.733.626.4975.530.217.8670.430.712.71508.632.928.7
M554.436.327.1343.630.717.1321.033.115.6623.236.031.6
ATE1479.335.928.6974.733.118.0728.533.613.91634.237.132.1
OvercastTE1563.9113.283.91363.7110.372.71740.1140.698.51458.5101.777.5
TT1359.6132.195.11146.7132.681.41200.1139.887.61056.0109.574.0
M713.9134.1101.4537.9121.176.8641.9144.296.9566.2103.578.0
ATE1700.4117.286.01557.6118.477.91944.0146.0103.21499.495.072.3
Table 3. Summary of statistical metrics for hourly datasets. For minimum and maximum values, the corresponding sky conditions are specified in parentheses (Al = all-sky; Cd = cloudy-sky; Cl = clear-sky; and Ov = overcast).
Model rMBD [%]rRMSD [%]KSI [%]OVER [%]CPI [%]r R 2
CAMSMin0.1 (Cl)11.4 (Cl)11.5 (Cl)0 (Cl)11.8 (Cl)0.8 (Cd)−2.7 (Ov)
Max113.3 (Ov)147.0 (Ov)1661.9 (Al)1566.3 (Al)837.8 (Al)1.0 (Cl)1.0 (Cl)
Mean36.753.9498.7424.7257.80.90
SARAH-3Min0.2 (Cl)11.4 (Cl)18.6 (Cl)0 (Cl)10.9 (Cl)0.8 (Ov)−1.7 (Ov)
Max91.7 (Ov)124.7 (Ov)1644.4 (Al)1549.5 (Al)827.6 (Al)1.0 (Cl)1.0 (Cl)
Mean36.348.5500.9426.2256.00.90.2
ERA5Min0.8 (Cl)14.6 (Cl)26.9 (Cl)0 (cl)16.3 (Cl)0.7 (Cd)−2.5 (Ov)
Max96.2 (Ov)143.0 (Ov)1315.4 (Al)1222.3 (Al)663.0 (Al)1.0 (Cl)0.9 (Cl)
Mean27.655.4384.2306.5200.40.80
MERRA-2Min0.2 (Cl)21.6 (Cl)39.5 (Cl)0.1 (Cl)23.8 (Cl)0.6 (Cd)−4.2 (Ov)
Max124.6 (Ov)168.9 (Ov)1505.9 (Ov)1414.5 (Ov)814.6 (Ov)0.9 (Cl)0.9 (Cl)
Mean30.764.2397.7320.1211.50.8−0.3
Table 4. Summary of statistical metrics for daily datasets. For minimum and maximum values, corresponding sky conditions are specified in parentheses (Al = all-sky; Cd = cloudy-sky; Cl = clear-sky; and Ov = overcast).
Model rMBD [%]rRMSD [%]KSI [%]OVER [%]CPI [%]r R 2
CAMSMin4.1 (Cl)6.4 (Cl)12.9 (Cl)0 (Cl)8.9 (Cl)0.5 (Ov)−25.8 (Ov)
Max106.7 (Ov)126.0 (Ov)907.8 (Cd)829.3 (Cd)459.3 (Cd)1.0 (Cl)1.0 (Cl)
Mean37.340.4344.6275.8175.30.9−3.1
SARAH-3Min5.2 (Cl)7.6 (Cl)15.7 (Cl)0 (Cl)11.2 (Cl)0.4 (Ov)−21.8 (Cl)
Max95.4 (Ov)116.2 (Ov)917.6 (Cd)839.3 (Cd)464.6 (Cd)1.0 (Cl)1.0 (Cl)
Mean37.341.1349.3281.2178.20.8−3.1
ERA5Min1.4 (Cl)9.4 (Cl)11.5 (Cl)0 (cl)8.7 (Cl)−0.2 (Ov)−62.6 (Ov)
Max139.3 (Ov)162.1 (Ov)667.6 (Al)601.5 (Cd)340.1 (Cd)1.0 (Cl)0.9 (Cl)
Mean34.345.0256.5193.8135.10.6−5.4
MERRA-2Min0.3 (Cl)14.2 (Cl)18.4 (Cl)0 (Cl)14.8 (Cl)0 (Cd)−120.2 (Ov)
Max197.7 (Ov)213.1 (Ov)687.5 (Al)610.0 (Al)353.4 (Al)0.9 (Cl)0.9 (Cl)
Mean41.557.4261.5195.2142.80.3−10.6
Disclaimer/Publisher’s Note: The statements, opinions and data contained in all publications are solely those of the individual author(s) and contributor(s) and not of MDPI and/or the editor(s). MDPI and/or the editor(s) disclaim responsibility for any injury to people or property resulting from any ideas, methods, instructions or products referred to in the content.

