Article

Groundwater Storage Response to Extreme Hydrological Events in Poyang Lake, China’s Largest Fresh-Water Lake

1
College of Hydrology and Water Resources, Hohai University, Nanjing 210098, China
2
National Key Laboratory of Water Disaster Prevention, Hohai University, Nanjing 210098, China
3
National Institute of Education (NIE), Earth Observatory of Singapore (EOS), Asian School of the Environment (ASE), Nanyang Technological University (NTU), Singapore 639798, Singapore
4
Department of Geological Sciences, University of Alabama, Tuscaloosa, AL 35487, USA
5
Hydrology Bureau of Jiangxi Province, Nanchang 330038, China
*
Author to whom correspondence should be addressed.
Remote Sens. 2025, 17(6), 988; https://doi.org/10.3390/rs17060988
Submission received: 26 February 2025 / Revised: 10 March 2025 / Accepted: 10 March 2025 / Published: 12 March 2025

Abstract

:
Groundwater systems are important for maintaining ecological balance and ensuring water supplies. However, under the combined pressures of shifting climate patterns and human activities, their responses to extreme events have become increasingly complex. As China’s largest freshwater lake, Poyang Lake supports critical water resources, ecological health, and climate adaptation efforts. Yet, the relationship between groundwater storage (GWS) and extreme hydrological events in this region remains insufficiently studied, hindering effective water management. This study investigates the GWS response to extreme events by downscaling Gravity Recovery and Climate Experiment (GRACE) data and validating it with five years of observed daily groundwater levels. Using GRACE, the Global Land Data Assimilation System (GLDAS), and ERA5 data, a convolutional neural network (CNN)–attention mechanism (A)–long short-term memory (LSTM) model was selected to downscale with high resolution (0.1° × 0.1°) and estimate recovery times for GWS to return to baseline. Our analysis revealed seasonal GWS fluctuations that are in phase with precipitation, evapotranspiration, and groundwater runoff. Recovery durations for extreme flood (2020) and drought (2022) events ranged from 0.8 to 3.1 months and 0.2 to 4.8 months, respectively. A strong correlation was observed between groundwater and meteorological droughts, while the correlation with agricultural drought was significantly weaker. These results indicate that precipitation and groundwater runoff are more sensitive to extreme events than evapotranspiration in influencing GWS changes. These findings highlight the significant sensitivity of precipitation and runoff to GWS, despite improved management efforts.

Graphical Abstract

1. Introduction

Groundwater, a vital component of the natural water cycle, is distinguished by its large reserves, high quality, and resistance to pollution, unlike surface water sources such as rivers and lakes [1,2]. Extreme hydrological events—such as heavy rainfall, severe droughts, and floods—are infrequent but highly impactful, posing significant threats to ecosystems, human life, and economies [3]. During such events, groundwater serves as a crucial reservoir for lakes and wetlands, providing a reliable water source and buffering against surface water shortages and quality degradation [4,5]. This buffering capacity helps stabilize ecosystems and mitigates the impacts of extreme events on both humans and the environment [6]. However, with the intensification of global warming and human activities, extreme hydrological events are occurring more frequently and with greater intensity, placing increasing pressure on groundwater systems and threatening their quality and sustainability [7].
The dynamic changes in groundwater systems are complex and multidimensional. Current research highlights key aspects such as recharge and flow mechanisms, surface water–groundwater (SW-GW) interactions, water quality changes, and storage variations. Recharge and flow mechanisms, the foundation of groundwater dynamics, determine replenishment rates and the spatial distribution of groundwater resources [8,9]. Recharge occurs through precipitation, artificial recharge, and other pathways, which are shaped by geological conditions, climatic factors, and human activities [9]. Groundwater flow paths and velocities are mapped using methods like numerical simulations [10], isotope tracing [11], and geophysical surveys [12], advancing research into SW-GW interactions. Groundwater quality, influenced by surface water contamination and industrial emissions, has also undergone significant changes over time [13]. Studies on water quality have evolved from focusing on pollutant migration and concentration [14] to tackling more complex issues such as pollutant source identification [15], pollutant-media interactions [16], and long-term water quality trends [17]. Changes in water storage, a core component of groundwater research, are shaped by recharge mechanisms and SW-GW interactions, which significantly influence water quality dynamics.
The Gravity Recovery and Climate Experiment (GRACE) mission has transformed groundwater monitoring by enabling the quantification of groundwater storage (GWS) changes at global and regional scales [18,19]. To overcome GRACE’s low spatial resolution, researchers have employed downscaling techniques, including artificial neural networks, random forests, and support vector machines [20,21,22]. However, machine learning relies on manual feature engineering, making it difficult to handle complex nonlinear relationships and large-scale data [23]. In recent years, the development of deep learning techniques, such as convolutional neural networks (CNN) and long short-term memory (LSTM) networks, which rely on data representation learning, has addressed this issue faced by traditional machine learning models. CNN is renowned for its ability to effectively capture spatial features in data, leading to its widespread application in areas such as image classification, edge detection, and facial recognition [24,25]. Meanwhile, LSTM networks are adept at effectively capturing long-term dependencies when handling time series data [26]. However, many real-world problems involve complex spatiotemporal dependencies, making it challenging for a single model to comprehensively capture the multidimensional features. The CNN-LSTM model offers higher accuracy and stability compared to individual machine learning models [27,28]. As a result, the combination of CNN and LSTM has gradually become a research focus. However, the CNN-LSTM model faces the risk of overfitting when dealing with time series data that have complex nonlinear features, which can result in the loss of key characteristics [29,30]. To address this issue, attention mechanisms have emerged as a powerful tool, adaptively weighting relevant temporal states while preserving long-term dependencies [31]. Building on these innovations, the convolutional neural network–attention mechanism–long short-term memory (CNN-A-LSTM) model synergizes CNN’s spatial representation, LSTM’s temporal memory, and attention-driven feature selection to enhance downscaling precision. With intensifying climatic variations and human activities, the frequency of extreme hydrological events has been increasing, affecting groundwater systems through water level fluctuations, altered recharge patterns, and changes in water quality [32,33]. Despite their critical importance, the dynamic responses of groundwater to extreme events remain underexplored, limiting the ability to assess groundwater stability and sustainability in the context of climatic variations.
Poyang Lake, China’s largest freshwater lake, exemplifies a system where extreme hydrological events increasingly threaten groundwater sustainability. Between 2020 and 2022, the region experienced unprecedented flooding and drought cycles, driven by intensified monsoons and anthropogenic stressors [34,35,36]. These extremes disrupted surface water–groundwater (SW-GW) interactions, altering recharge rates and amplifying water quality risks [37]. Despite the importance of groundwater in mitigating such extremes, the response of groundwater systems in the Poyang Lake region to these events remains unclear.
This study aims to understand the response mechanisms of GWS to extreme hydrological events in Poyang Lake. By integrating multisource remote sensing data, this research investigates the spatiotemporal evolution of GWS, estimates recovery times following extreme events, and examines the interactions among meteorological, agricultural, and groundwater droughts using advanced modeling techniques, such as the CNN-A-LSTM model. While rooted in the specific context of Poyang Lake, the findings hold broader implications for advancing the scientific understanding of groundwater dynamics under extreme conditions and for informing sustainable water resource management strategies. The insights gained from this study not only enhance the resilience of Poyang Lake but also provide a framework applicable to other regions facing similar hydrological challenges.

2. Materials and Methods
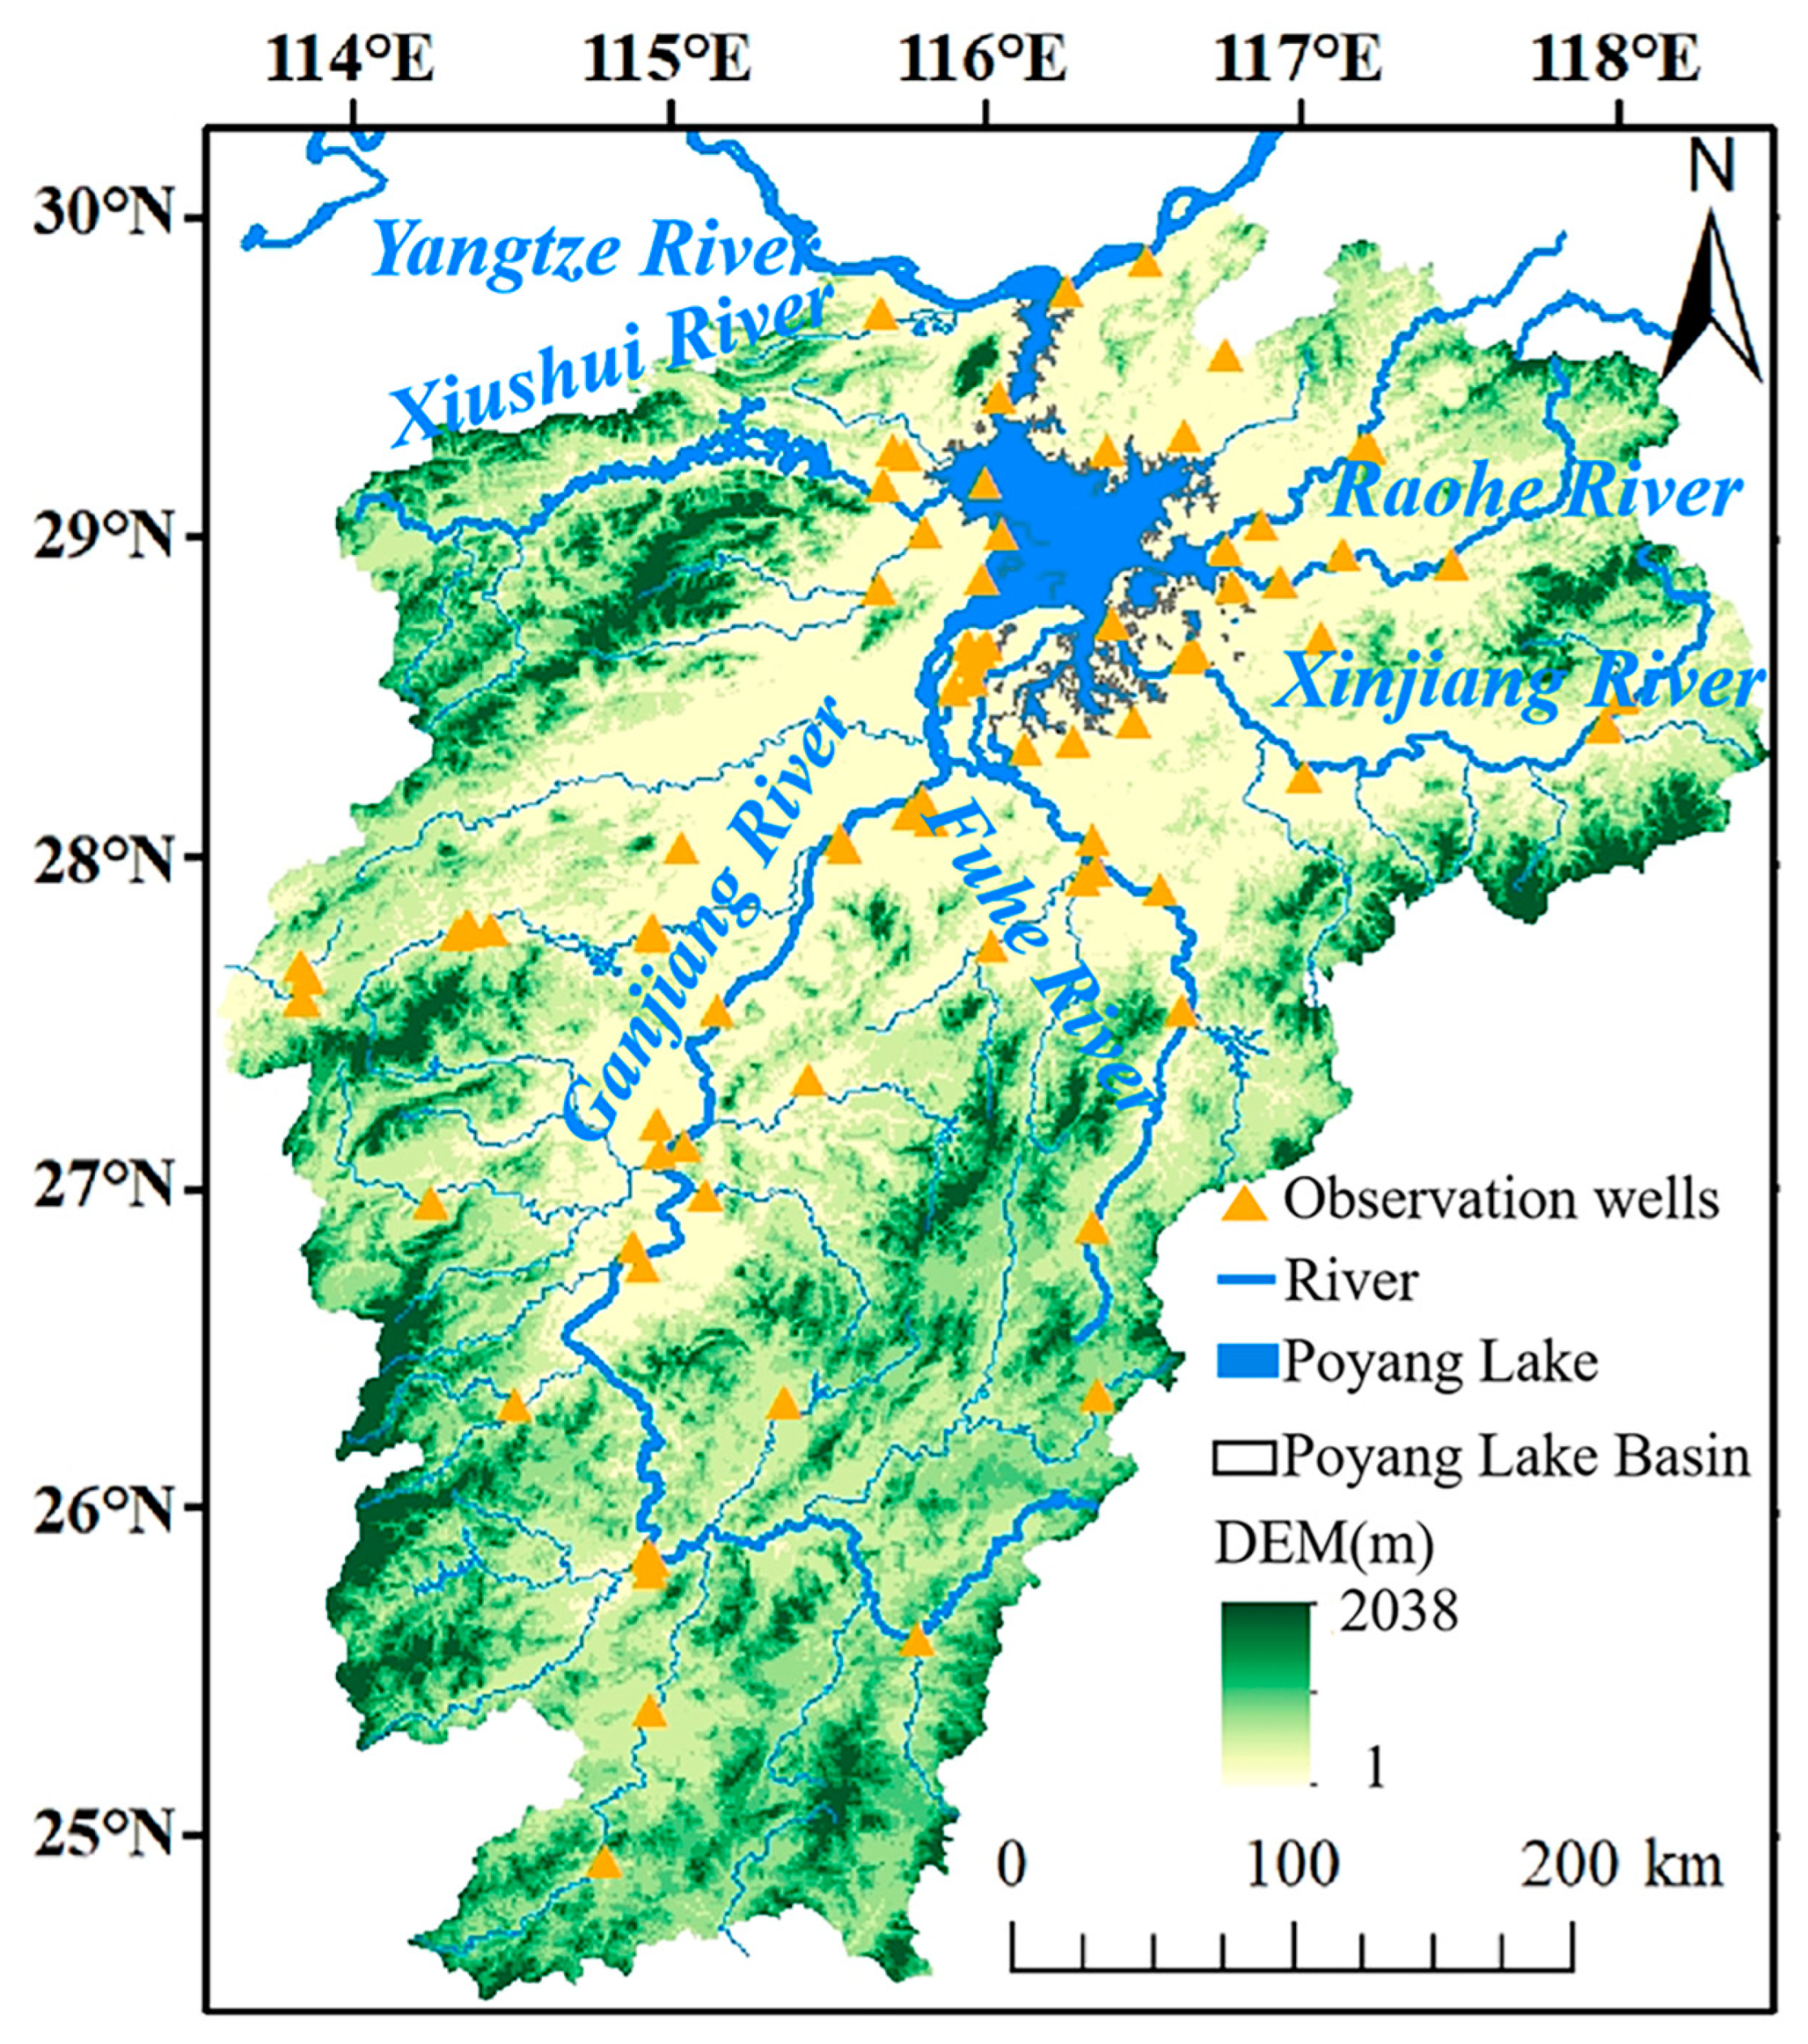
2.1. Study Area

The Poyang Lake area, situated on the southern bank of the Yangtze River in central China, lies within northern Jiangxi Province (Figure 1). It spans 28°22′–29°45′N latitude and 115°47′–116°45′E longitude, covering an area of 162,200 km2 [38]. Five major tributaries—the Fu, Gan, Rao, Xiushui, and Xin Rivers—flow into Poyang Lake and discharge into the Yangtze River, forming an interconnected water system. The region experiences a subtropical humid climate driven by the East and South Asian monsoons, with annual precipitation ranging from 1400 to 1900 mm and averaging 1675 mm [39]. However, precipitation is unevenly distributed, with only 25% occurring between October and February [40] and 55% concentrated from March to June, often leading to floods due to heavy rainfall [41]. From July to September, the area is prone to droughts caused by subtropical high-pressure systems and heat originating from the Gulf of Guinea [42]. The lake’s surface area fluctuates significantly throughout the year [43]. During the flood season, rainfall expands the lake to approximately 4000 km2, with frequent backflow from the Yangtze River [34]. In the dry season, however, the lake contracts to less than 1000 km2, exposing large portions of its bed [44].
The Poyang Lake area exhibits pronounced seasonal and interannual variations in precipitation and groundwater levels, with groundwater trends closely following precipitation patterns. Between 2018 and 2021, floods occurring in June were accompanied by sharp increases in both precipitation and groundwater levels. The most prolonged flood occurred in 2020, driven by heavy rainfall in the upper and middle reaches of the Yangtze River and sustained high water levels influenced by the regulatory capacity of the Three Gorges Reservoir [45]. Flood events are typically associated with short, intense rainfall, leading to rapid rises in the lake’s water levels. Conversely, droughts are prolonged and widespread, resulting in significant declines in water levels. The lowest rainfall month was recorded in 2022, with only 3.16 mm—386 mm less than the wettest month—marking the longest-lasting drought. This drought severely impacted the aquatic ecosystem, intensified pressure on agriculture and fisheries, and increased pollutant concentrations in the lake [46,47]. The year 2021 exemplified “rapid transitions between drought and flood”, featuring two major droughts (January–April and July–October) interrupted by a brief flood in June. These frequent hydrological fluctuations disrupt the Poyang Lake ecosystem and complicate water resource management [47].

2.2. GRACE and Hydrological Data

2.2.1. GRACE/Gravity Recovery and Climate Experiment—Follow-On (GRACE-FO) Data

The GRACE gravity field solutions include spherical harmonic and mascon approaches, with mascon solutions effectively reducing leakage errors at ocean–land boundaries and addressing the limitations of traditional spherical harmonic coefficients [48]. This study uses monthly GRACE mascon products from 2003 to 2023, sourced from the Center for Space Research at the University of Texas (CSR), the Jet Propulsion Laboratory (JPL), and the Goddard Space Flight Center (GSFC), with resolutions of 0.25°, 0.5°, and 0.5°, respectively. These datasets are available on NASA’s website (https://download.csr.utexas.edu/outgoing/gracefo/RL06.1LRI/ (accessed on 6 June 2024)). The uncertainty of these products is quantified using the generalized three-cornered hat (GTCH) method [49,50]. Data gaps in the GRACE products are filled using the singular spectrum analysis (SSA) method [51,52].

2.2.2. Global Land Data Assimilation System (GLDAS) Data

GLDAS combines satellite and ground measurements with advanced land surface modeling and data assimilation to generate optimal land surface states and flux estimates [44]. It simulates water storage changes with minimal bias, providing monthly data for snow water equivalent (SWE), canopy water storage (CWS), and soil moisture (SMS) at a 0.25° × 0.25° spatial resolution (https://disc.gsfc.nasa.gov/datasets/GLDAS_NOAH025_M_2.1 (accessed on 6 June 2024)).
Groundwater storage anomalies (GWSA) are calculated by subtracting snow water storage anomalies (SWEA), canopy water storage anomalies (CWSA), and soil moisture storage anomalies (SMSA) from GRACE terrestrial water storage anomalies (TWSA), as shown below:
G W S A = T W S A G R A C E ( S W E A + C W S A + S M S A )
Significantly, many studies have shown that the impact of surface water storage anomalies (SWSA) on groundwater storage is relatively small and can generally be ignored in most cases. For instance, research conducted in regions such as the Tibetan Plateau [53], the Beijing Plain [54], and parts of Africa [55] has indicated that SWSA has minimal influence on groundwater storage anomalies. Additionally, a study focused on GWSA in China further emphasized that the effect of SWSA on groundwater storage calculations is negligible [56]. Therefore, in this study, excluding SWSA from the GWSA calculation does not significantly affect the results.

2.2.3. Driving Variables for Spatial Downscaling of GRACE Data

In this study, climate variables include monthly hydrological data from ERA5-Land and the normalized difference vegetation index (NDVI). ERA5-Land, developed by the European Centre for Medium-Range Weather Forecasts (ECMWF), offers high-resolution land variable data (0.1° × 0.1°) compared to ERA5 (https://cds.climate.copernicus.eu/cdsapp#!/dataset/reanalysis-era5-land-monthly-means?tab=overview (accessed on 6 June 2024)). The hydrological variables used from ERA5-Land include surface temperature, evaporation from bare soil, evaporation from the top of the canopy, evaporation from vegetation transpiration, lake bottom temperature, runoff, total evaporation, and a total of 35 variables. NDVI data, obtained from MOD13C2 Version 6, is at a monthly scale and has a resolution of 0.05°. The digital elevation model (DEM), providing high-accuracy data at a resolution of 12.5 m, is available from NASA’s Alaska Satellite Facility (https://vertex.daac.asf.alaska.edu/# (accessed on 6 June 2024)). To minimize overfitting and reduce model complexity, partial least squares regression (PLSR) is used to assess predictors’ contributions to TWSA, identifying ten main influencing factors: surface temperature, evaporation from vegetation transpiration, NDVI, total precipitation, runoff, total evaporation, lake mixed-layer depth, lake mixed-layer temperature, surface net thermal radiation, and DEM.

2.2.4. Meteorological and Agricultural Drought Indices
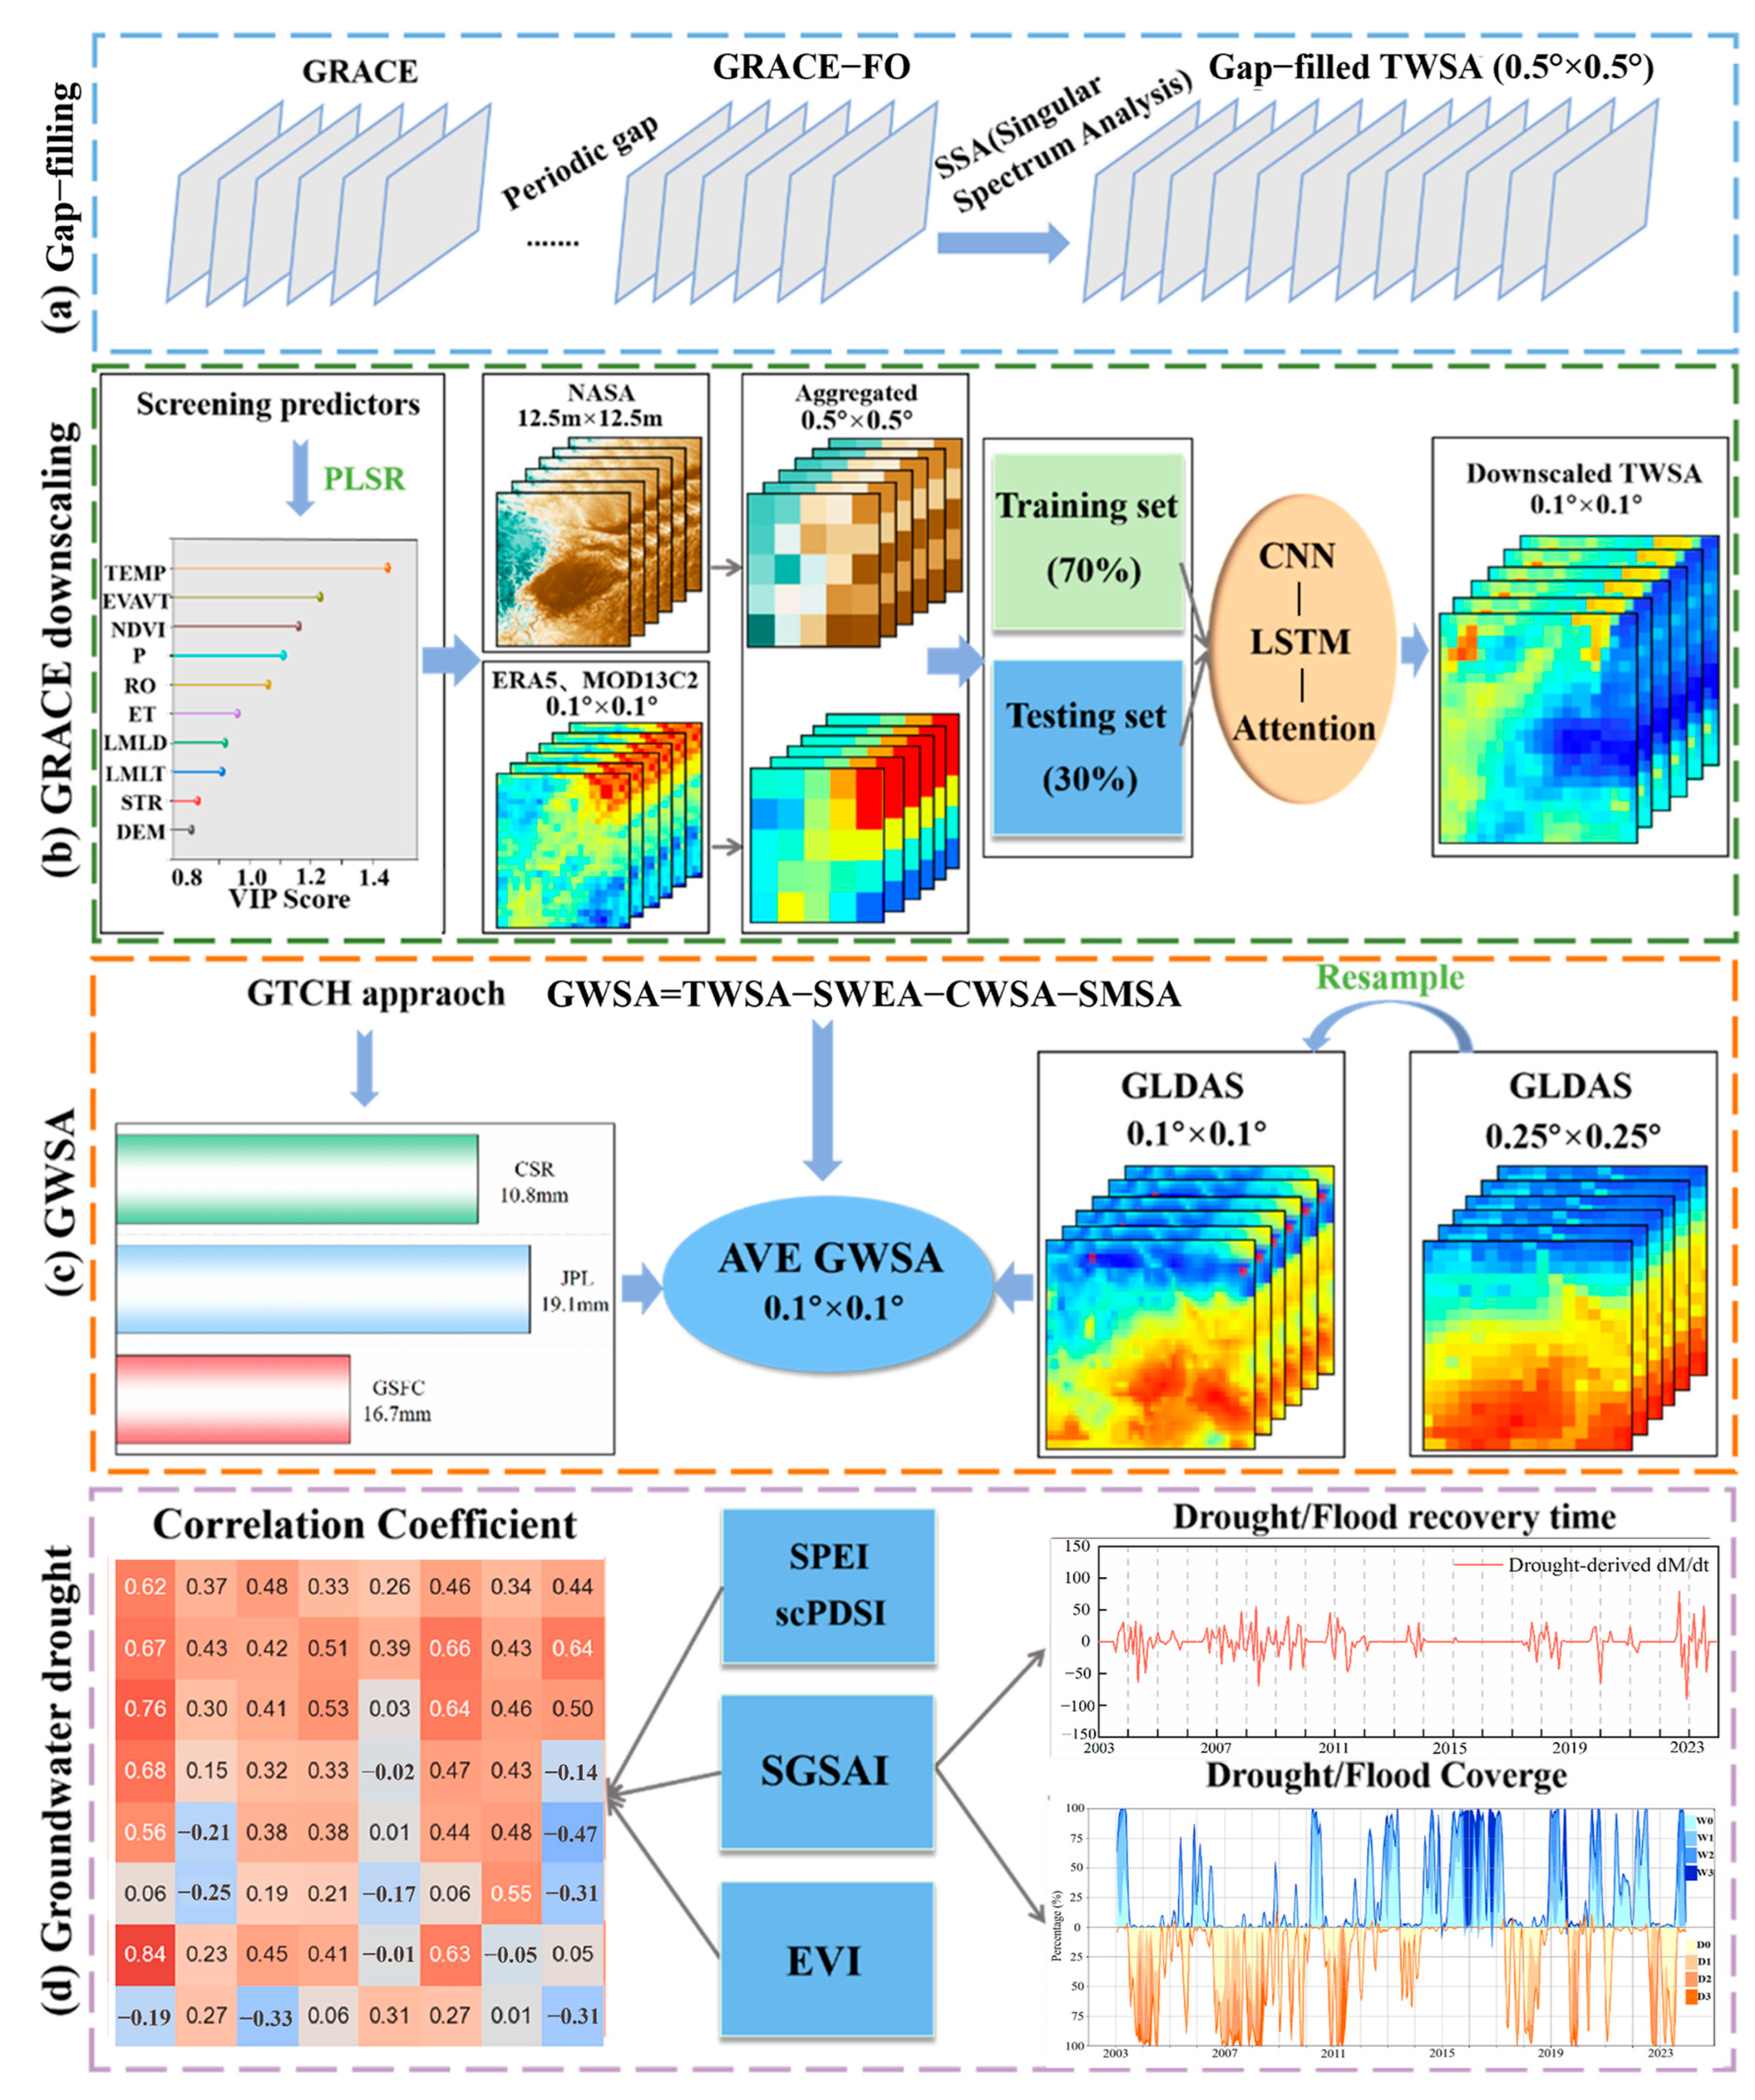
The study examines the impact of meteorological drought on groundwater drought processes using the self-calibrated Palmer drought severity index (scPDSI) and the standardized precipitation–evapotranspiration index (SPEI) from January 2003 to December 2021. The scPDSI (https://crudata.uea.ac.uk/cru/data/drought/ (accessed on 6 June 2024)) and SPEI (https://spei.csic.es/map/maps.html (accessed on 6 June 2024)) datasets have a resolution of 0.5° × 0.5° and a monthly time scale, with input variables derived from the Climate Research Unit (CRU) Time Series (TS) 4.07 dataset. SPEI is evaluated at time scales of 1, 3, 6, 9, 12, and 24 months, providing robust drought analysis through consistent and homogeneous data. The enhanced vegetation index (EVI), derived from the MOD13C2 Version 6 product (https://lpdaac.usgs.gov/ (accessed on 6 June 2024)), addresses the saturation limitations of NDVI in mid- to low-latitude regions and offers a better assessment of vegetation growth conditions. It has been widely used to analyze the response of agricultural drought to meteorological drought [57,58]. The monthly EVI dataset has a spatial resolution of 0.05° × 0.05°. To align the spatial scale of scPDSI, SPEI, and EVI with the downscaled TWSA from GRACE, bilinear interpolation is used for resampling. This ensures consistency across datasets and enhances the analysis of drought impacts.

2.3. Methods

High-resolution GRACE-derived GWSA were utilized to analyze the relations and responses between meteorological and groundwater droughts. The methodology, outlined in Figure 2, involves four key steps: (a) addressing observation gaps in TWSA between the GRACE and GRACE-FO missions using the SSA method; (b) selecting predictor variables via PLSR and spatially downscaling GRACE TWSA data using the CNN-A-LSTM model; (c) estimating GWSA from the downscaled TWSA using the water balance equation; and (d) calculating correlations among the SPEI, the scPDSI, and the standardized groundwater storage anomaly index (SGSAI), while also analyzing drought- and flood-affected areas and recovery times in the Poyang Lake region.

2.3.1. Convolutional Neural Network (CNN)—Attention Mechanism (A)—Long Short-Term Memory (LSTM)

The downscaling model used in this study comprises three main components (listed in Figure S2). (1) Feature extraction via CNN: Input predictor data is processed through two convolutional layers and two pooling layers of the CNN. Specifically, the first convolutional layer uses 1024 filters with a kernel size of 5, followed by a MaxPooling layer with a pool size of 2. The second convolutional layer uses 2048 filters and a kernel size of 5, with a similar MaxPooling operation. These layers are chosen to capture both local patterns and more complex feature representations in the input data, with the increased number of filters (from 1024 to 2048) aimed at capturing increasingly abstract features in the deeper layers. The kernel size of 5 was selected after experimentation to balance receptive field size and model complexity. To prevent overfitting, a dropout layer with a 0.5 dropout rate is applied after each convolutional block. (2) Sequence modeling with LSTM: The LSTM layer uses 512 units and is configured with return_sequences = True to allow the attention mechanism to focus on each time step. The LSTM model is used here to capture long-term dependencies in the temporal data, which is crucial for the downscaling task. The number of LSTM units was selected based on experiments with different configurations, aiming to find a balance between model complexity and performance. (3) Prediction through the attention mechanism: Final predictions are generated using the Bahdanau attention mechanism [55] and a Dense layer. The attention mechanism allows the model to focus on the most relevant time steps when making predictions, improving accuracy by emphasizing important features. A Dense layer is used at the output to provide the final scalar value. To mitigate overfitting, a Dropout layer with a 0.5 dropout rate is applied after each step. The Bahdanau attention mechanism enhances the LSTM output by focusing on specific parts of the feature sequence. The Attention layer assigns weights to each hidden state at every time step, emphasizing the most informative content for predictions. Alignment between the input x t at each time step and all prior hidden states h i is calculated using a feedforward neural network, with the hyperbolic tangent function as the activation function:
t = v t t a n h ( w a x t ; h i )
where t i denotes the attention weight, v t is the weight vector, w a is the weight matrix, and x t ; h i represents the concatenation of x t and h i .
The attention scores are normalized using the softmax function, ensuring the weights sum to 1, which allows the model to effectively distribute attention across hidden states:
t i = e x p s c o r e x t , h i i 1 t e x p s c o r e x t , h i
where s c o r e x t , h i represents the matching score between x t and h i .
The normalized attention weights are used to calculate the context vector c t , representing the weighted average of all time steps in the input sequence:
c t = i = 1 t t i h i
Here, the context vector c t represents a compressed summary of the input sequence. It is passed to a fully connected layer, where the softmax activation function generates the final output y :
y = s o f t m a x   ( W y · c t + b y )
where W y is the weight matrix that transforms the context vector into the output space, and b y is the bias term that adjusts the final predictions.

2.3.2. Estimating Drought and Flood Recovery Time

The monthly gap (M) quantifies the water required to return to normal water storage conditions. To monitor changes over time, the monthly gap change rate was calculated using backward differences, indicating the rate of water storage recovery or degradation each month [59], as shown below:
d M d t t i = M t i M t i 1 t i t i 1 , f o r   i = 1,2 ,     N
where M represents the GWS deficit or surplus, t i is the time point for the i -th month, and N denotes the length of the GWS time series. The empirical cumulative distribution function (eCDF) of the gap change rate was constructed from GWS data to analyze the distribution of change rates. The 95th percentile of the eCDF indicates the maximum positive change rate, representing the fastest recovery speed, while the 68th percentile reflects the average recovery rate, representing the normal recovery speed. The recovery time ( t ) is the duration required for water storage to return from a deficit or surplus to normal levels. It is calculated as the ratio of the monthly deficit ( M ) to the rate of change ( d M d t ). The shortest recovery time for each month is obtained by dividing the monthly deficit by the maximum positive change rate, and the average recovery time is determined using the average recovery rate. These calculations are expressed as follows:
t = M d M d t

2.3.3. GRACE-SGSAI

The groundwater drought index based on GWSA, known as GRACE-SGSAI, is used to characterize groundwater drought. The standardized groundwater storage anomaly index, or SGSAI, reduces the spatial heterogeneity of GWSA, improving the identification and classification of groundwater drought. It is calculated using the formula proposed by Liu et al. [60] (Equations (8) and (9)) and categorizes groundwater conditions into four drought categories and four wet categories (Table S1):
Φ S G S A I = S G S A I 1 2 π exp x 2 2 d x = F r G W S A , μ ^ , α ^ ,
where F r G W S A , μ ^ , α ^ , represents the cumulative distribution function (CDF), and r G W S A is the rank of the GWSA time series. The rank sequence for each grid cell is determined by evaluating multiple probability distribution models (such as the normal distribution, Pearson III distribution, generalized log-logistic distribution, and generalized Pareto distribution) and selecting the best-fit model. Φ S G S A I represents the cumulative probability corresponding to the GWSA time series.
Finally, SGSAI is calculated by applying the inverse function of Φ S G S A I , as shown below:
S G S A I = Φ 1 r G W S A

3. Results

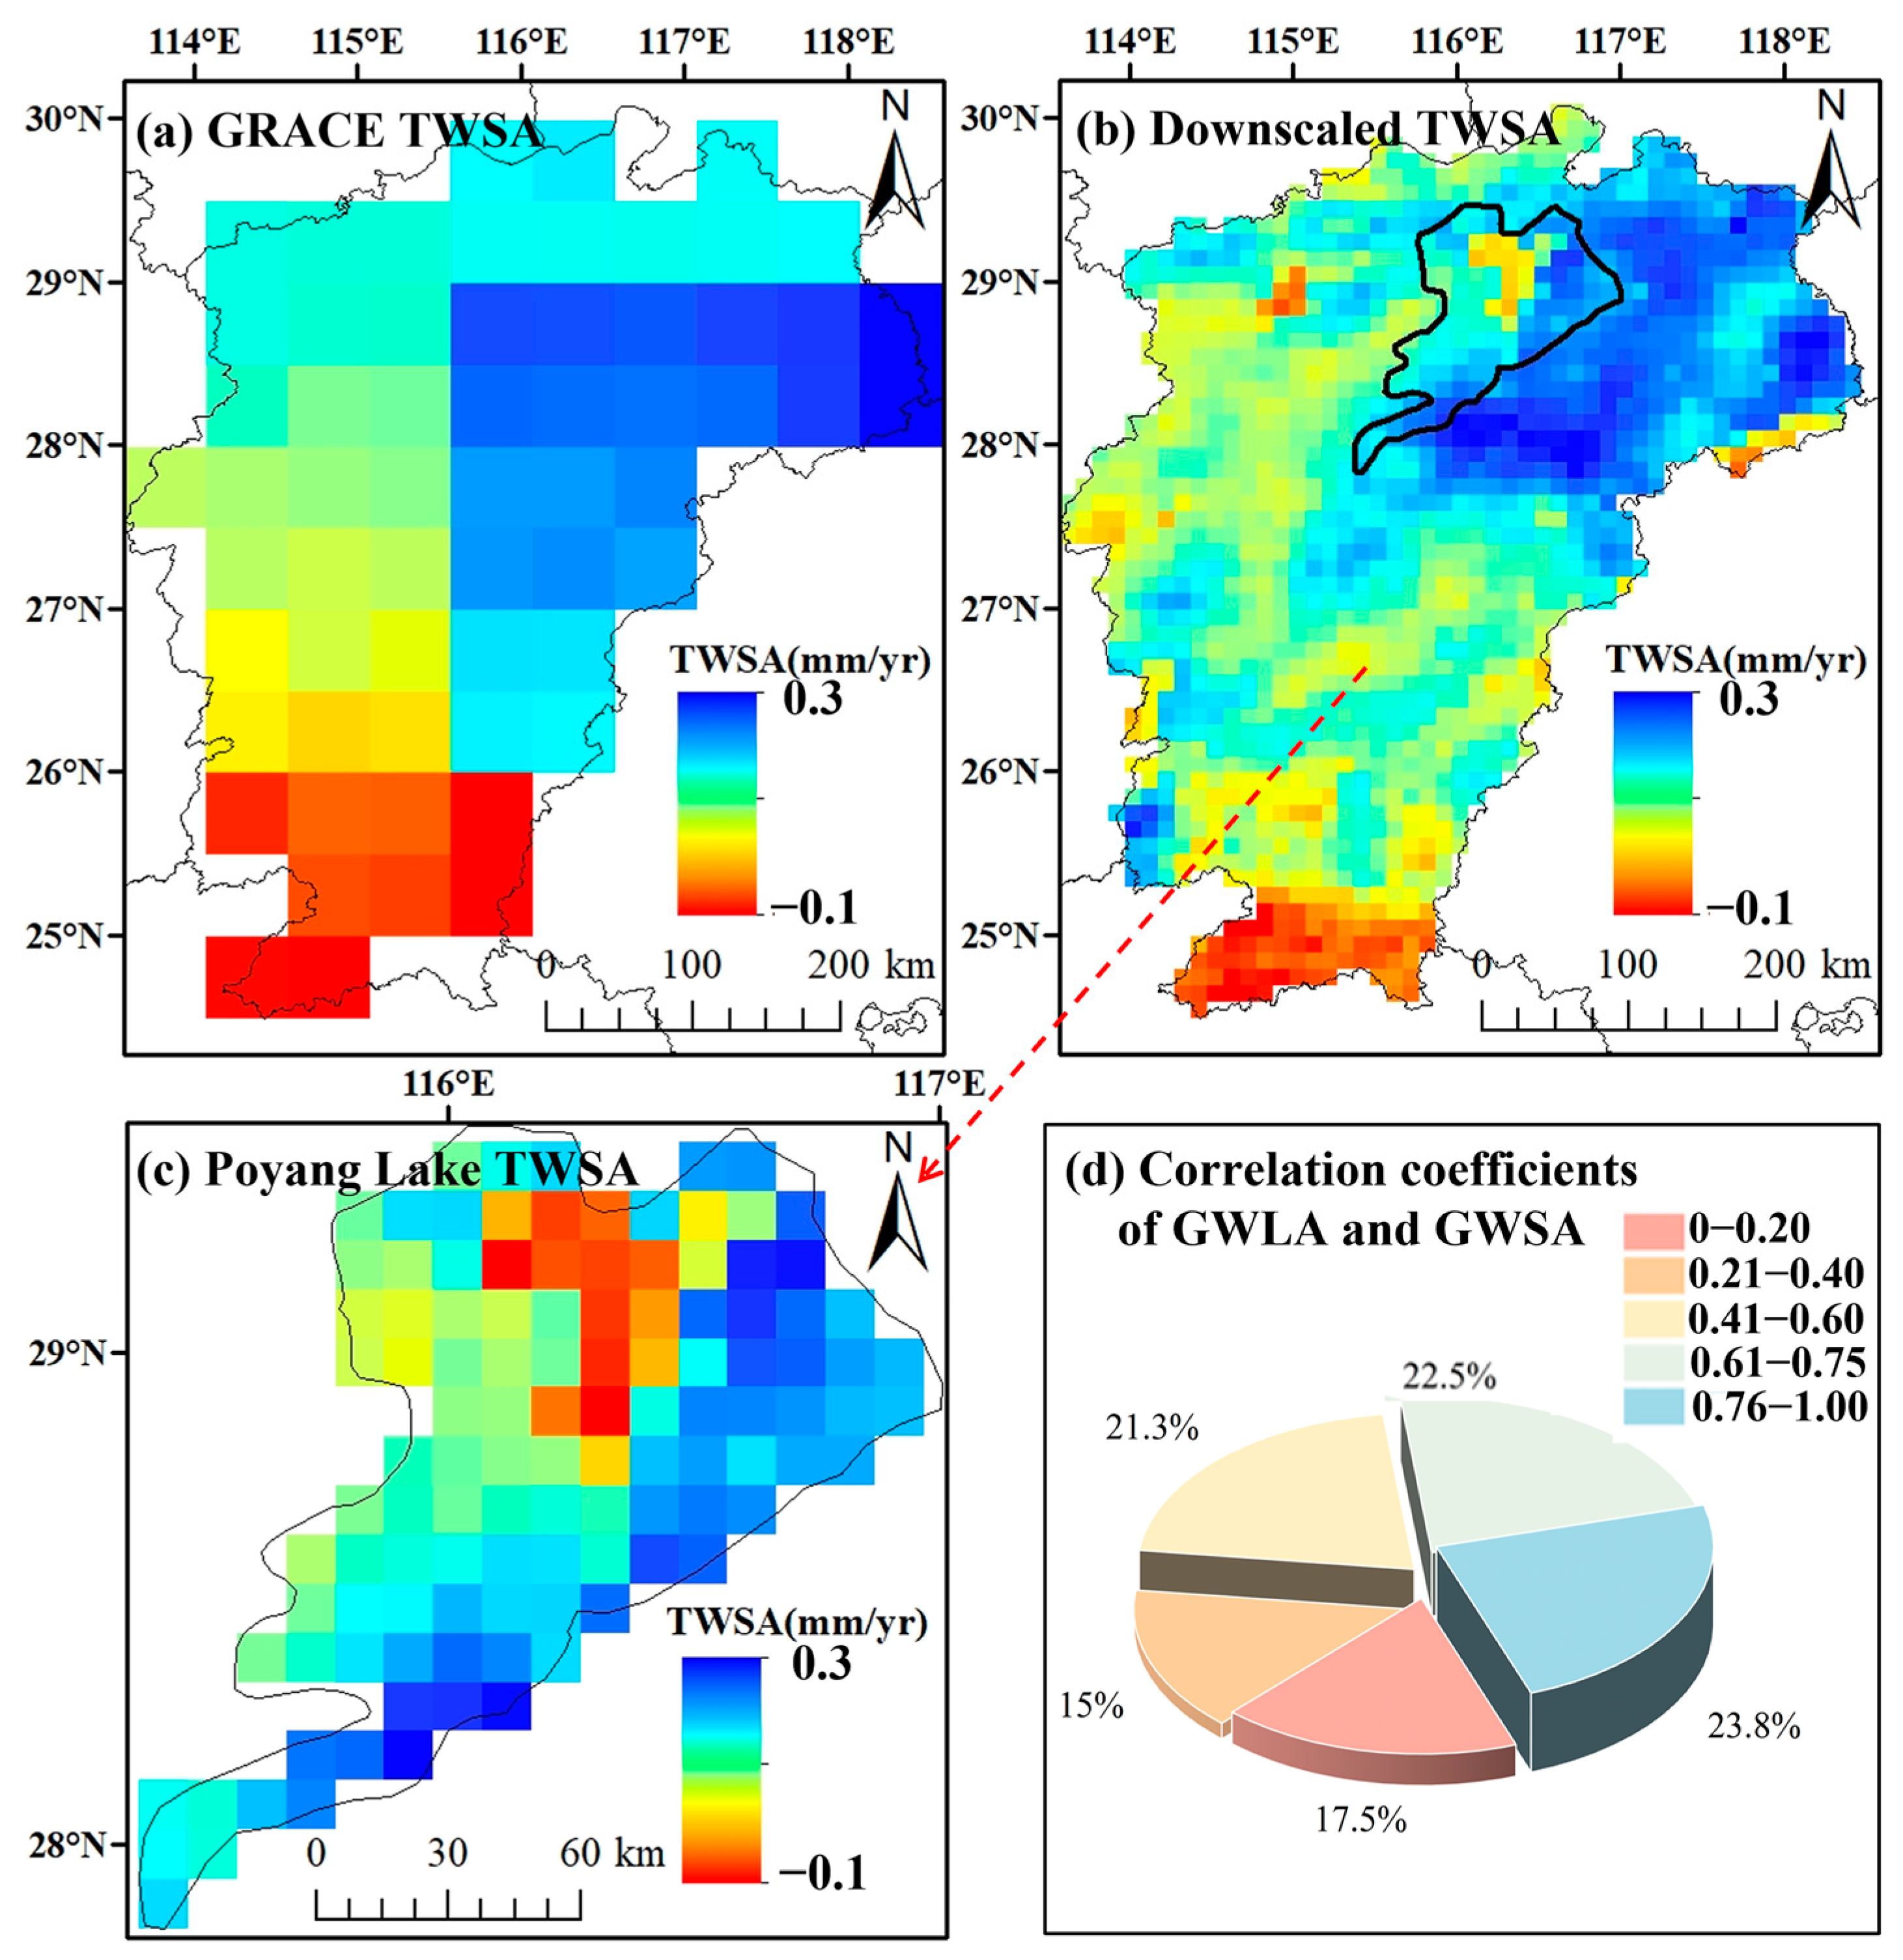
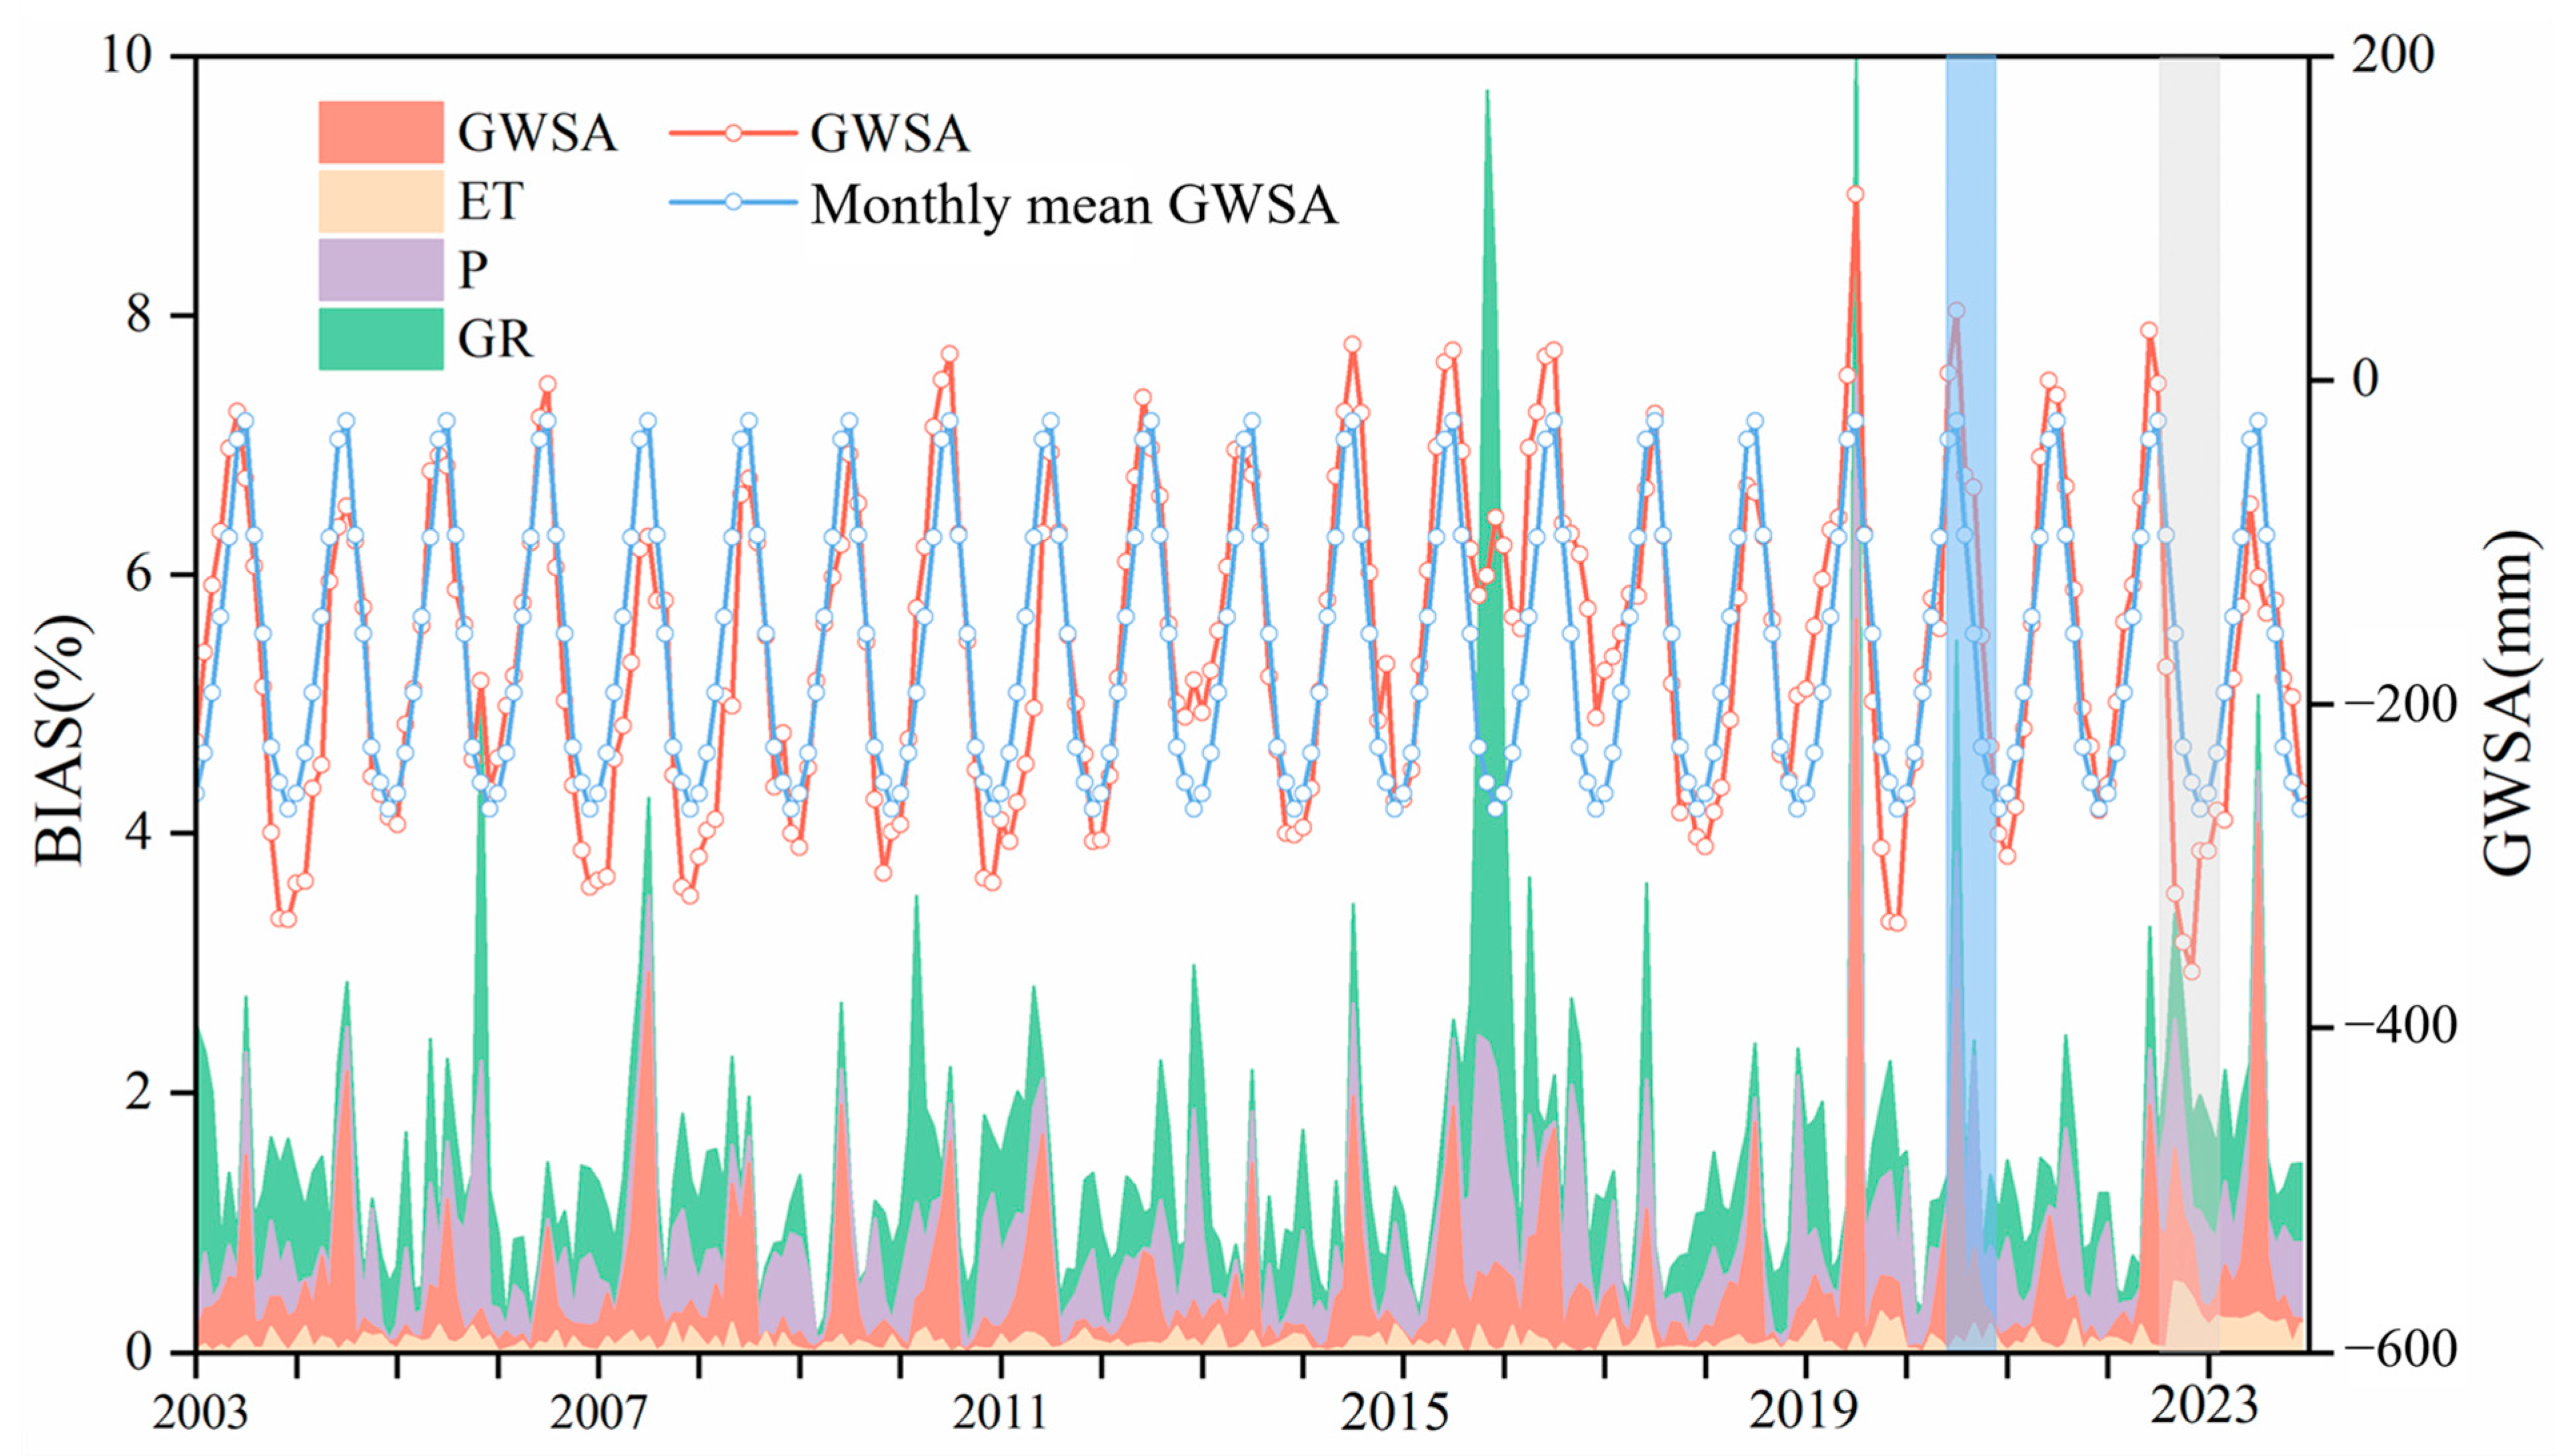
3.1. Validation and Assessment of Downscaled TWS Anomalies

The comparative performance of the proposed CNN-A-LSTM model against six alternative approaches, such as CNN, LSTM, random forest (RF), support vector machine (SVM), extreme gradient boosting (XGBoost), and artificial neural network (ANN), is systematically evaluated in Table 1, based on R-square (R2), CC, and root mean square error (RMSE) metrics. The CNN-A-LSTM model demonstrates superior performance, achieving the highest R2 (0.85) and CC (0.94) values and the lowest RMSE (41.3 mm), thereby confirming its effectiveness in GRACE downscaling tasks. Among the benchmark models, RF exhibits the closest performance to CNN-A-LSTM. This marginal gap suggests that ensemble tree-based methods can partially capture spatiotemporal dependencies in downscaling tasks but remain constrained by their inherent limitations in modeling sequential data and fine-grained spatial patterns [61]. Notably, SVM and ANN perform poorly due to the linear kernel assumption of SVM and the insufficient depth of ANN in capturing the complex, nonlinear relationships in geospatial datasets [62,63].
The standalone CNN and LSTM outperform traditional machine learning methods but underperform relative to their hybrid counterpart, CNN-A-LSTM. This disparity underscores the synergistic effect of integrating CNN’s localized spatial feature extraction with LSTM’s temporal dependency modeling, further enhanced by the attention mechanism’s ability to prioritize salient spatiotemporal features. XGBoost demonstrates intermediate performance, aligning with its capacity to handle nonlinear interactions but lacking explicit mechanisms for sequential data processing [64].
By comparing the spatial distribution of TWSA before and after downscaling (Figure 3a,b), the CNN-A-LSTM model demonstrates strong consistency in spatial patterns. The downscaled results effectively capture finer spatial features while maintaining alignment with the original data. In the Poyang Lake area, TWSA shows a spatial trend of decreasing from east to west, with a notable decline in the northern region. Field groundwater level monitoring further validated the downscaled GWSA, with approximately 67% of monitoring stations achieving a CC of 0.40 or higher. Overall, the CNN-A-LSTM model effectively downscales GRACE data, accurately capturing the spatial and temporal patterns of TWSA and providing reliable predictions consistent with original observations.
The GTCH method was used to quantify the uncertainty of three official GRACE satellite-derived TWSA products. The uncertainties for the CSR, JPL, and GSFC datasets were 10.8 mm, 19.1 mm, and 16.7 mm, respectively. Relative uncertainty, calculated as the ratio of uncertainty in each grid cell to its absolute mean value, serves as an important indicator of data quality and stability, highlighting the influence of noise and uncertainty. Spatial distribution results (Figure 4a–d for uncertainty and Figure 4e–h for relative uncertainty) show that the JPL product has significantly higher uncertainty and relative uncertainty compared to the CSR and GSFC products. All products display high relative uncertainty in the central area of Poyang Lake. To reduce noise in gravity field solutions, the arithmetic mean (AVE) of the CSR, JPL, and GSFC datasets was used to assess TWSA, as suggested by Sakumura et al. [50]. The AVE dataset exhibited significantly lower uncertainty and relative uncertainty than any individual product. Additionally, relative uncertainty was found to be lower in areas of low overall uncertainty, demonstrating a consistent spatial pattern.
The spatial distribution trends of GRACE mascon grid data from CSR, JPL, GSFC, and their average (2003–2023) are shown in Figure 4i–l. Trends, calculated from monthly TWSA series using least squares linear fitting (Figure 4m), reveal that most of the Poyang Lake area experienced an increasing TWSA trend, particularly in the eastern region. This rise is attributed to frequent surface water–groundwater interactions facilitated by connections to the Rao, Xinjiang, and Fu Rivers, which have contributed to increased terrestrial water storage [65]. In contrast, the northern area showed a decline at a rate of −0.1 to 0 mm/year. This region, significantly affected by the Three Gorges Water Diversion Project, is flat and directly connected to the Yangtze River [66]. Riverbed erosion in the middle and lower reaches of the Yangtze, combined with the Three Gorges Dam’s water storage operations, has increased outflow from Poyang Lake to the Yangtze River, reducing the lake’s water volume [67]. Rapid climatic variations, illegal sand mining, and seasonal precipitation patterns under the subtropical monsoon climate exacerbate this issue [68]. The TWSA time series from CSR, GSFC, and JPL are consistent, showing small fluctuation rates of 0.0030, 0.0044, and 0.0073 mm/yr, respectively. However, fluctuations intensified after 2019, likely due to extreme climatic events. The operation of the Three Gorges Reservoir further complicates hydrological dynamics in the Poyang Lake area, potentially impacting groundwater storage stability [69].

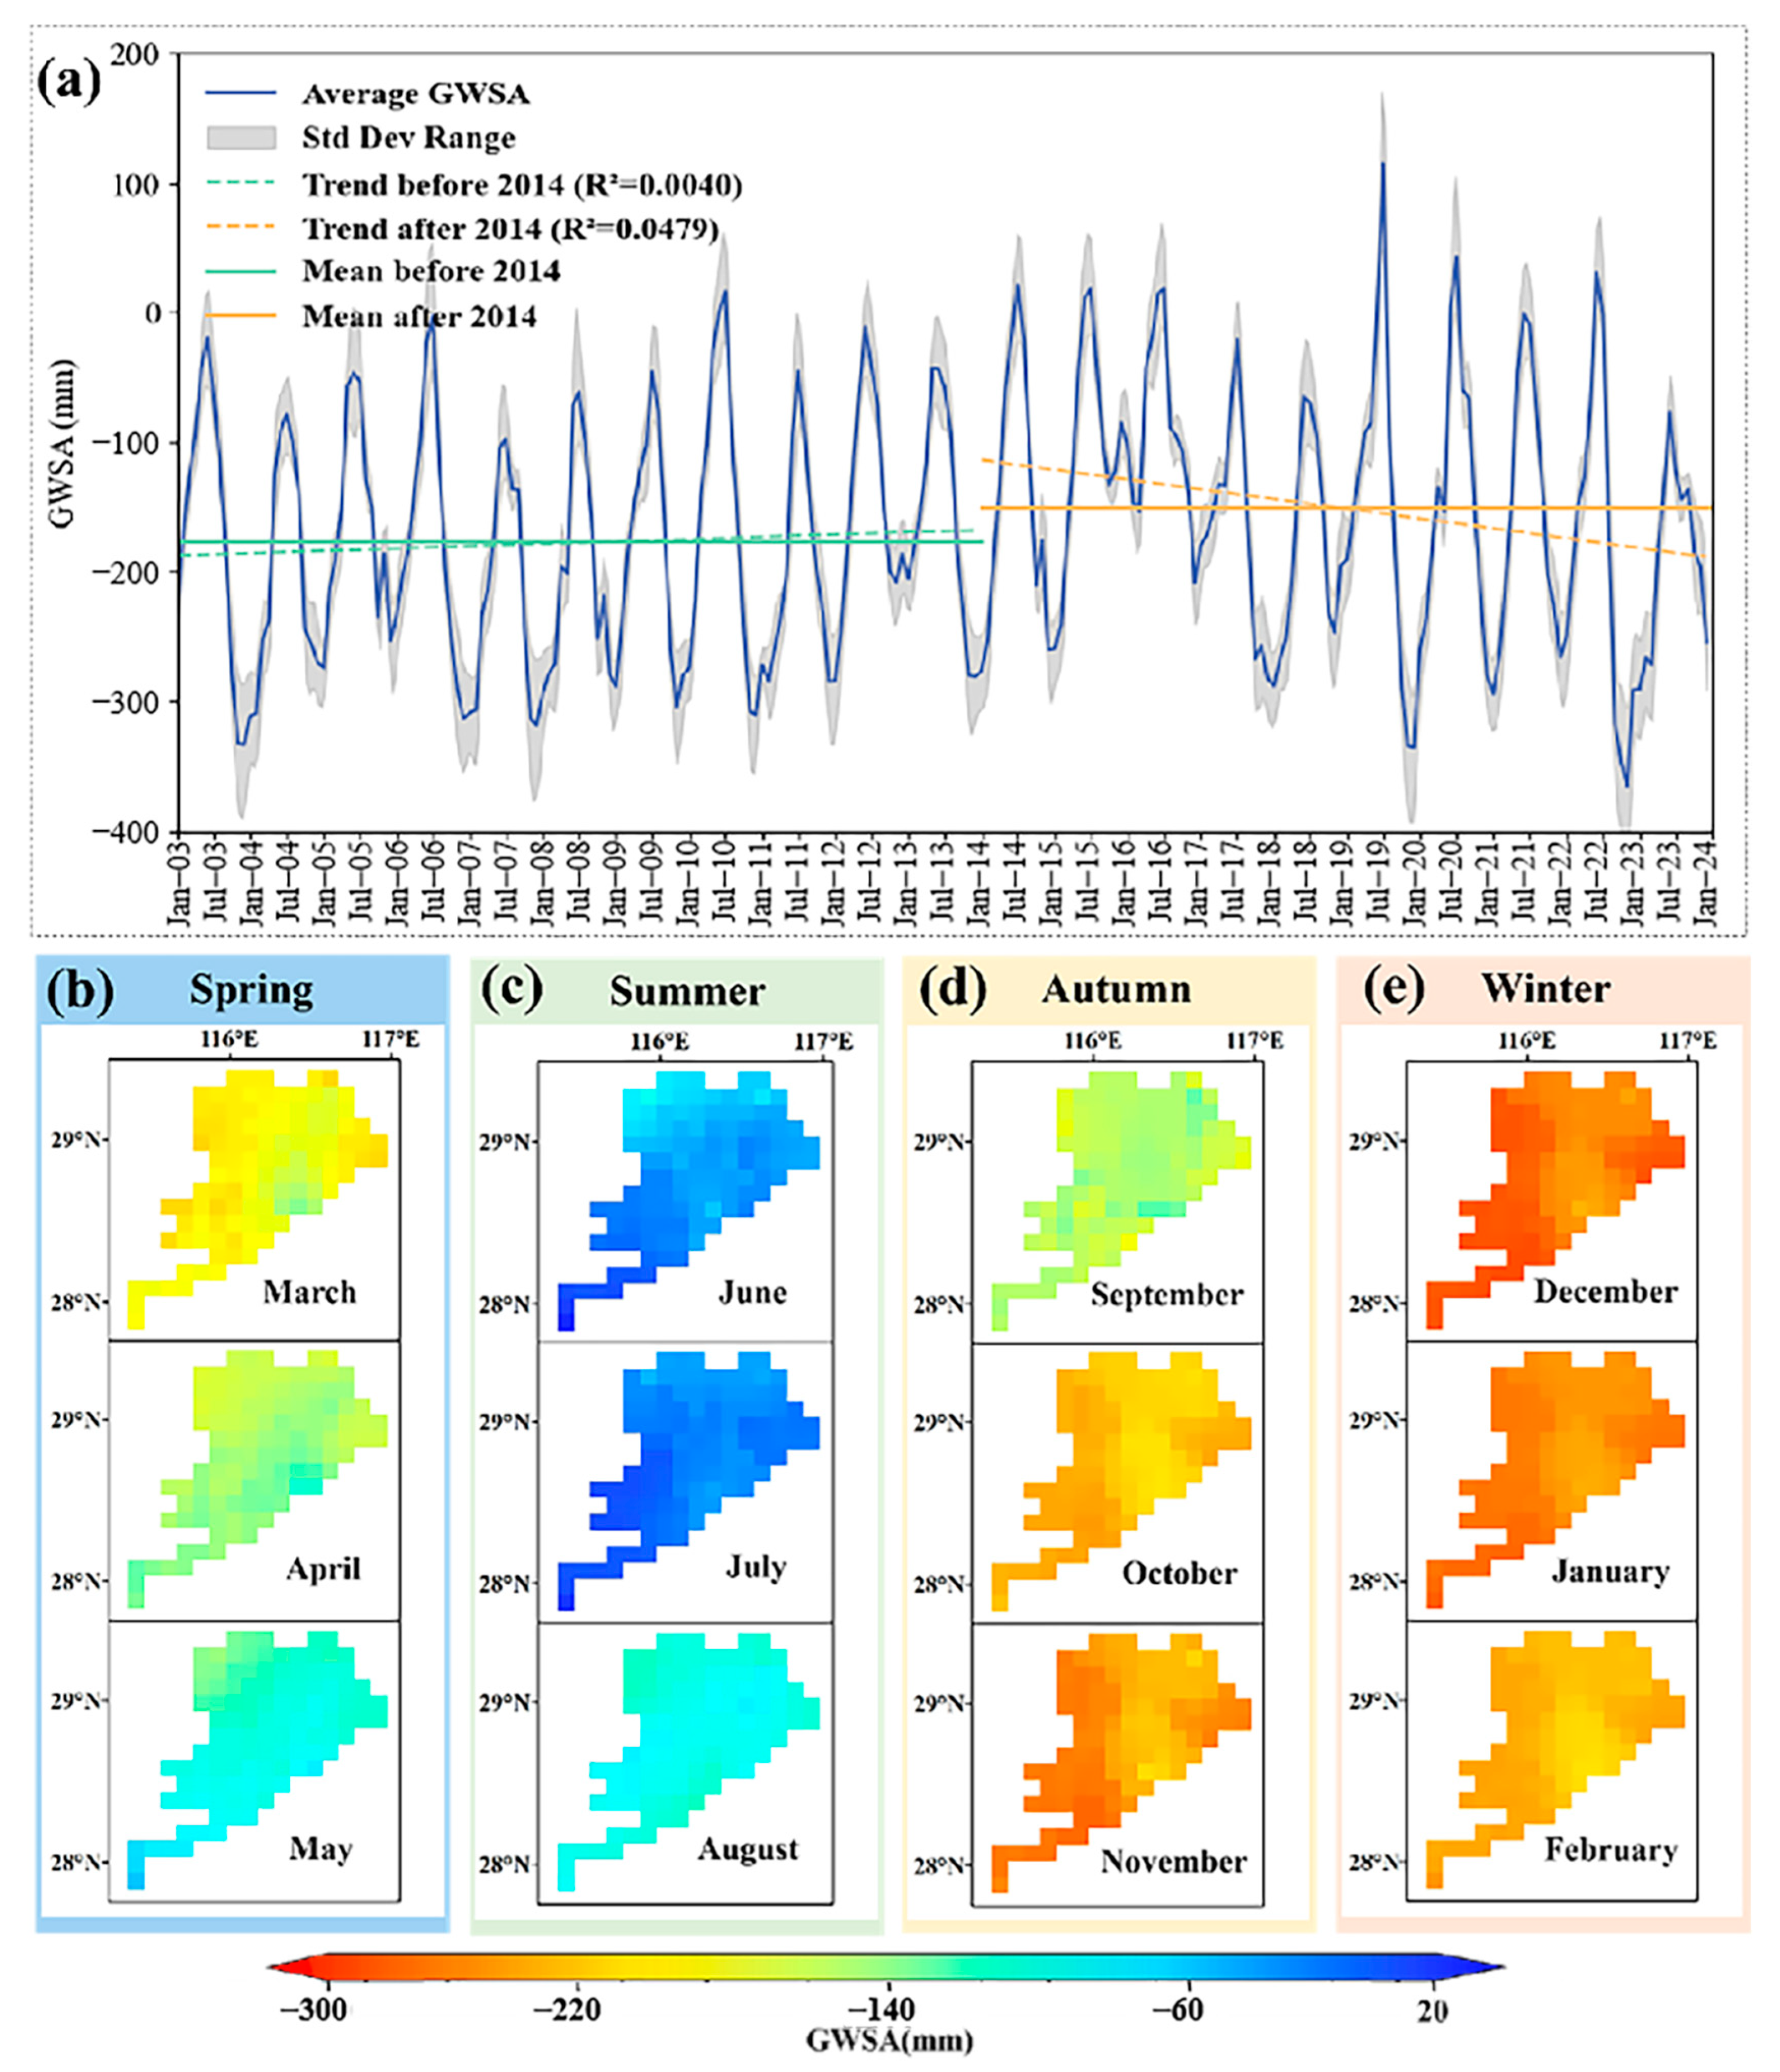
3.2. Spatiotemporal Variation of GWS Anomalies

In the Poyang Lake area, GWSA typically peaks in June and reaches its lowest point in December (Figure 5), exhibiting significant seasonal fluctuations. A t-test revealed that the average GWSA during the first half of the study period (January 2003–December 2013) (p > 0.05) was significantly lower than in the second half (January 2014–December 2023) (p < 0.05), with the p-value from the t-test confirming a statistically significant difference between these two periods. Before 2014, the arithmetic mean GWSA was −177.5 mm, with a slight but insignificant upward trend (R2 = 0.004). After 2014, the mean increased to −151 mm; however, the trend turned steeper and downward (R2 = 0.048), indicating fluctuating yet declining groundwater storage since 2014. The declining trend of GWSA from 2014 to 2023 indicates that groundwater storage changes are not solely influenced by precipitation but are also strongly affected by evapotranspiration, infiltration dynamics, and surface water–groundwater interactions. According to evapotranspiration data, evapotranspiration during 2014–2023 increased by 6.8% compared to 2003–2013, signifying intensified water loss from the groundwater system. This effect is particularly pronounced in dry years, where increased evapotranspiration accelerates groundwater depletion. Even in wet years, despite increased precipitation, the rise in evapotranspiration offsets part of the available water, preventing effective groundwater recharge. Additionally, changes in surface water–groundwater exchange and infiltration efficiency may have contributed to the observed trend, as alterations in soil moisture conditions and runoff patterns influence groundwater replenishment [70]. These findings highlight the complex interplay of atmospheric and hydrological factors in shaping groundwater storage trends in the region.
To analyze variability, the spatial standard deviation of monthly GWSA across the region was calculated. Notable fluctuations were observed in 2011, 2019, 2020, and 2022, reflecting the influence of extreme events. The highest variability occurred in 2022, with a peak standard deviation of 131.5 mm. Although groundwater storage showed a slight rebound in 2023, the recovery remained limited. The multi-year monthly GWSA patterns in the Poyang Lake area exhibit significant seasonal variations: groundwater recovers and increases in spring, peaks in summer, and declines from autumn to winter. On average, GWSA shows a surplus only in June and July, coinciding with increased precipitation and runoff after spring. In contrast, deficits are most pronounced from October to February, reaching a low of −265.1 mm in December, highlighting the region’s vulnerability to groundwater depletion during winter. Spatially, the central area consistently has lower GWSA compared to surrounding regions. During wet periods, surface water recharges groundwater when Poyang Lake’s water levels are high. Conversely, during dry periods, groundwater replenishes the lake [71]. This seasonal water exchange likely contributes to the lower groundwater levels in the lower-lying central area.

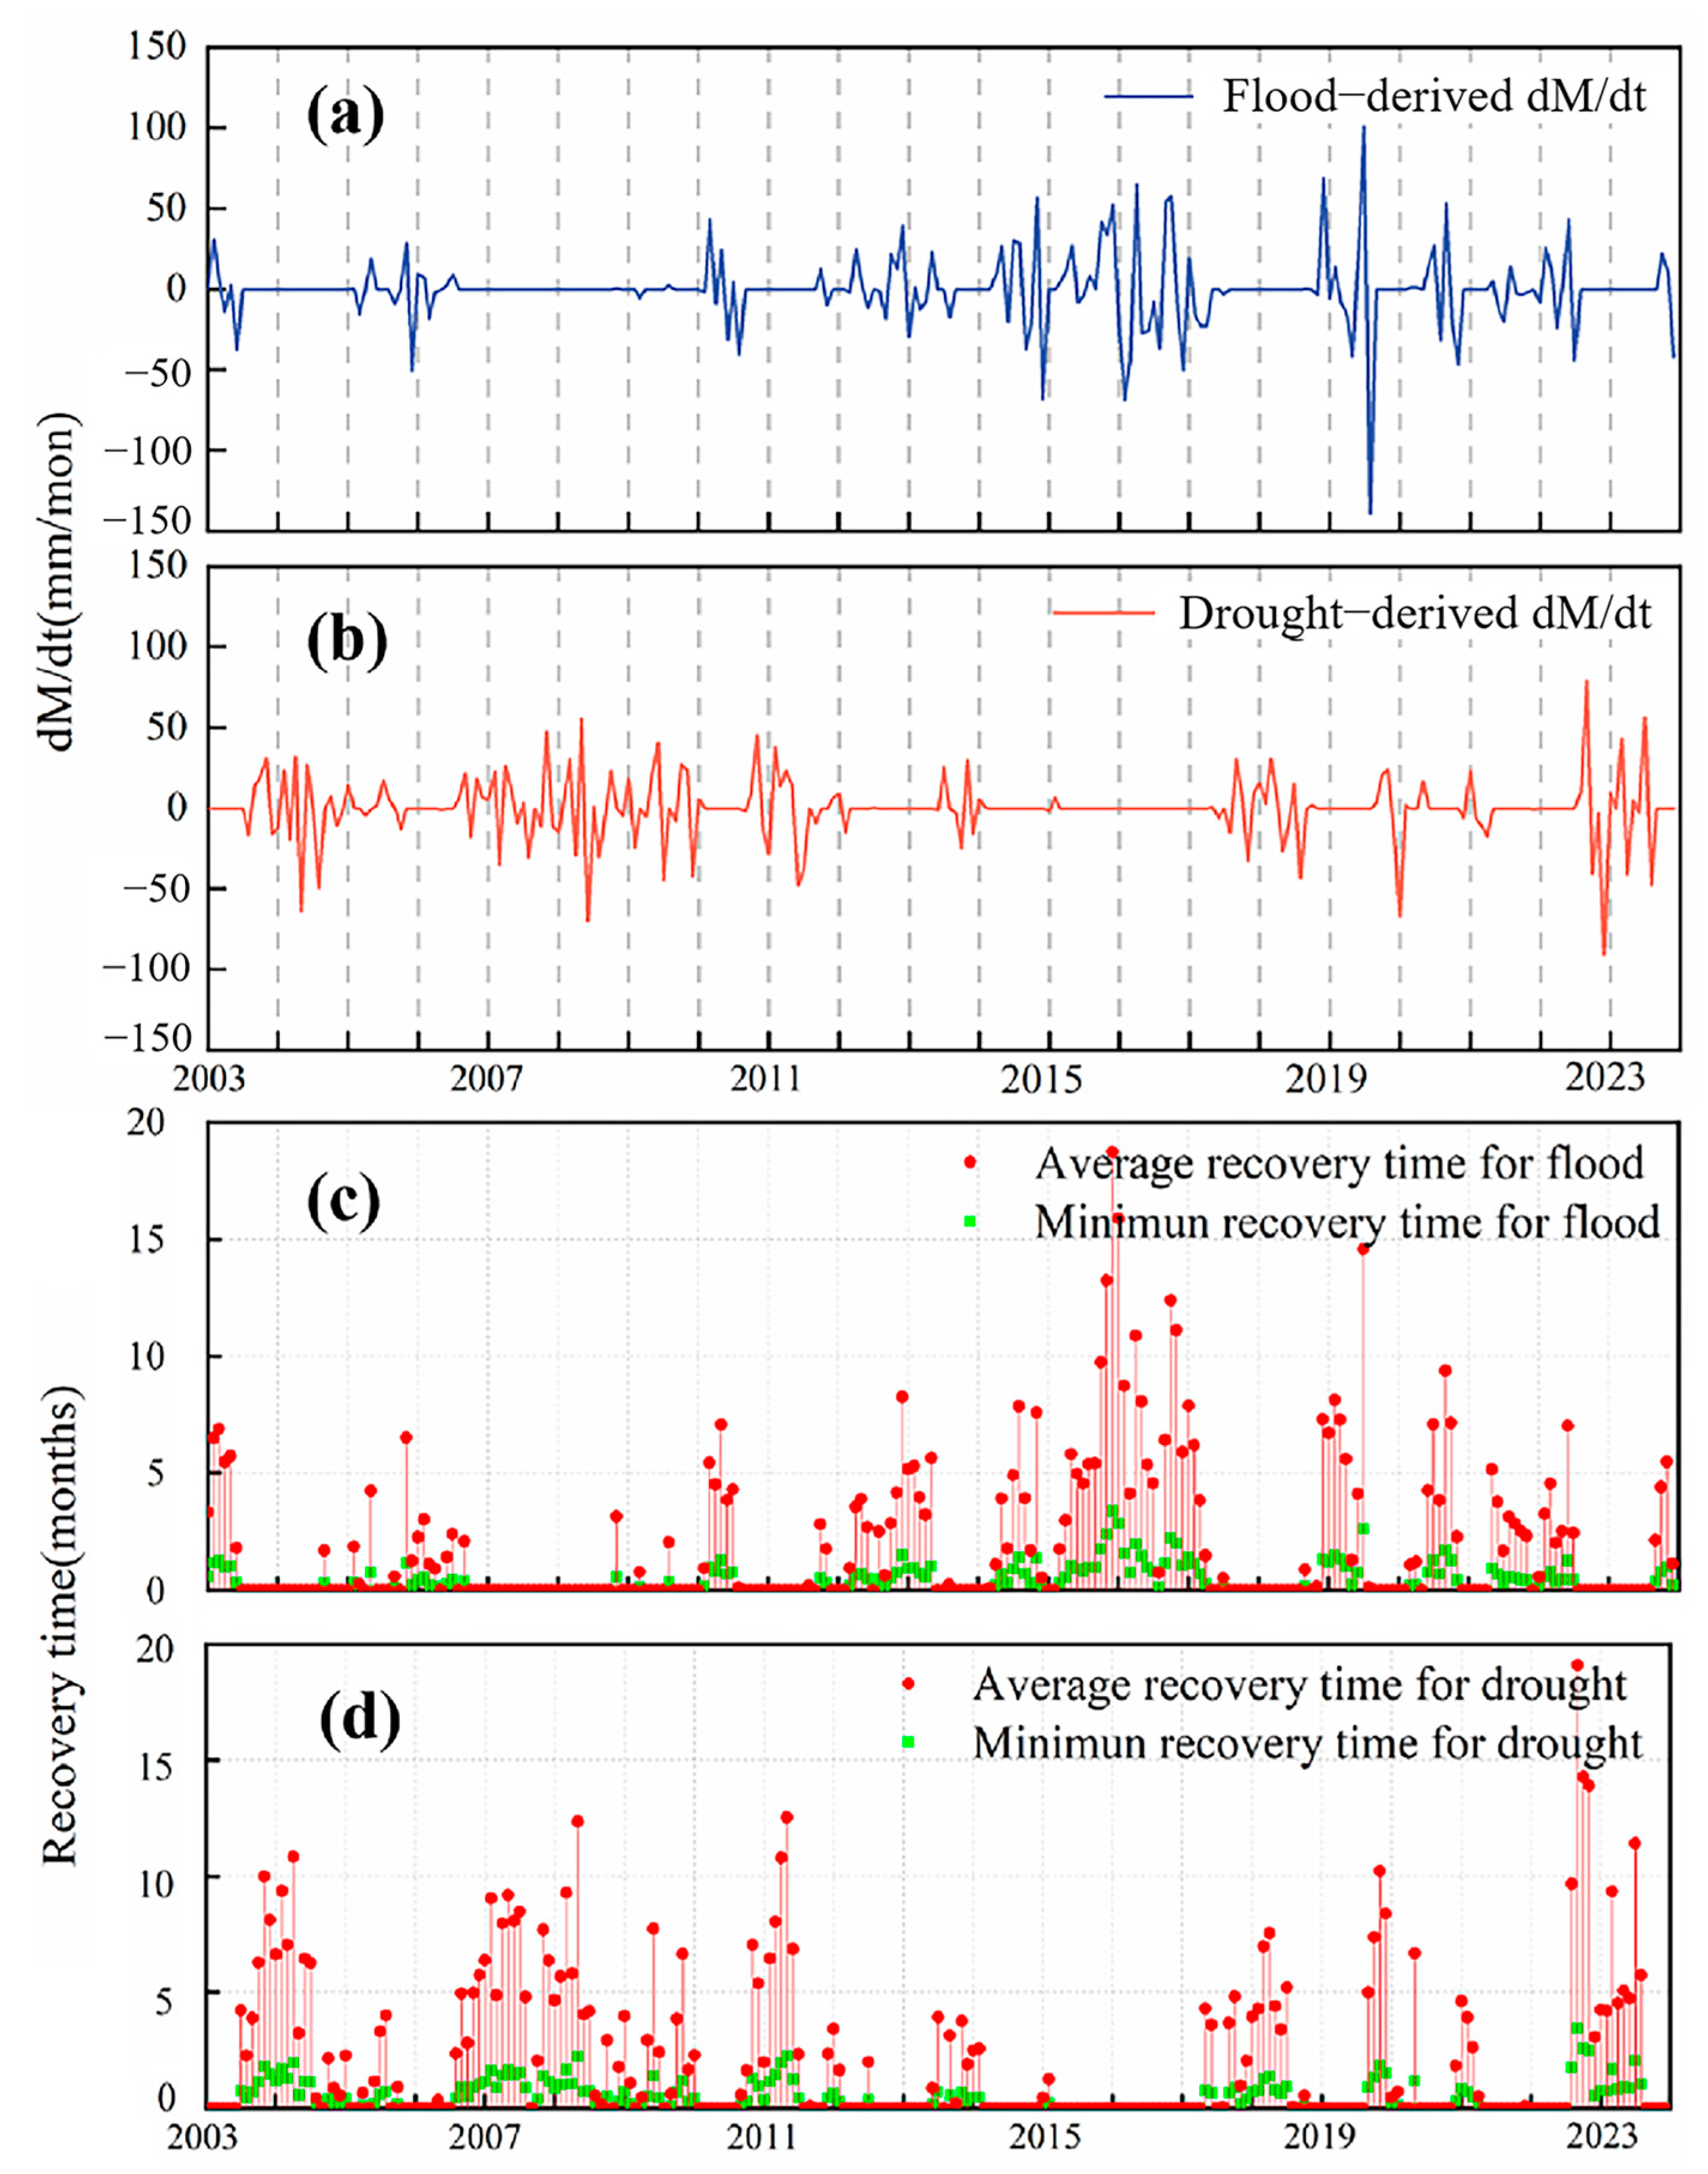
3.3. Estimating Hydrological Drought and Flood Recovery Time

In the eCDF d M / d t time series, the maximum and average rates for floods are 53.49 mm/month and 9.62 mm/month, respectively, while for droughts, they are 39.34 mm/month and 9.88 mm/month (Figure S3). The monthly water storage deficit/surplus rates from 2003 to 2023 (Figure 6a,b) show the recovery (or deterioration) rate of water storage. Positive values indicate worsening conditions, negative values reflect recovery periods, and zero values represent equilibrium between drought intensification and recovery rates. The average and shortest recovery times for droughts and floods in the Poyang Lake area (2003 to 2023) are displayed in Figure 6c,d. Before 2014, during the prolonged drought from August 2006 to October 2008, extreme drought (D3) lasted 8 months, with deficit rates ranging from −69.8 mm/month to 55.2 mm/month. Recovery times ranged from 0.03 to 2.23 months (shortest) and 0.15 to 12.38 months (average). After 2014, during the extended flood from March 2015 to April 2017, extreme wet conditions (W3) lasted 7 months, with surplus rates between −68.8 mm/month and 64.92 mm/month. Recovery times ranged from 0.13 to 3.36 months (shortest) and 0.75 to 18.72 months (average). In the extreme flood event of 2020, a severe flood had surplus rates ranging from −30.7 mm/month to 34.4 mm/month, with recovery times of 0.21–0.8 months (shortest) and 0.8–3.1 months (average). In 2022, a 6-month drought had deficit rates ranging from −65.8 mm/month to 67.8 mm/month. Recovery times were 0.08–2.06 months (shortest) and 0.19–4.78 months (average). Hydrological events after 2014 exhibited slower recovery speeds compared to earlier events. Additionally, the drought in 2022 had a more severe impact on ecosystems and water resources than the extreme flood of 2020, highlighting the long-lasting effects of the 2022 drought.

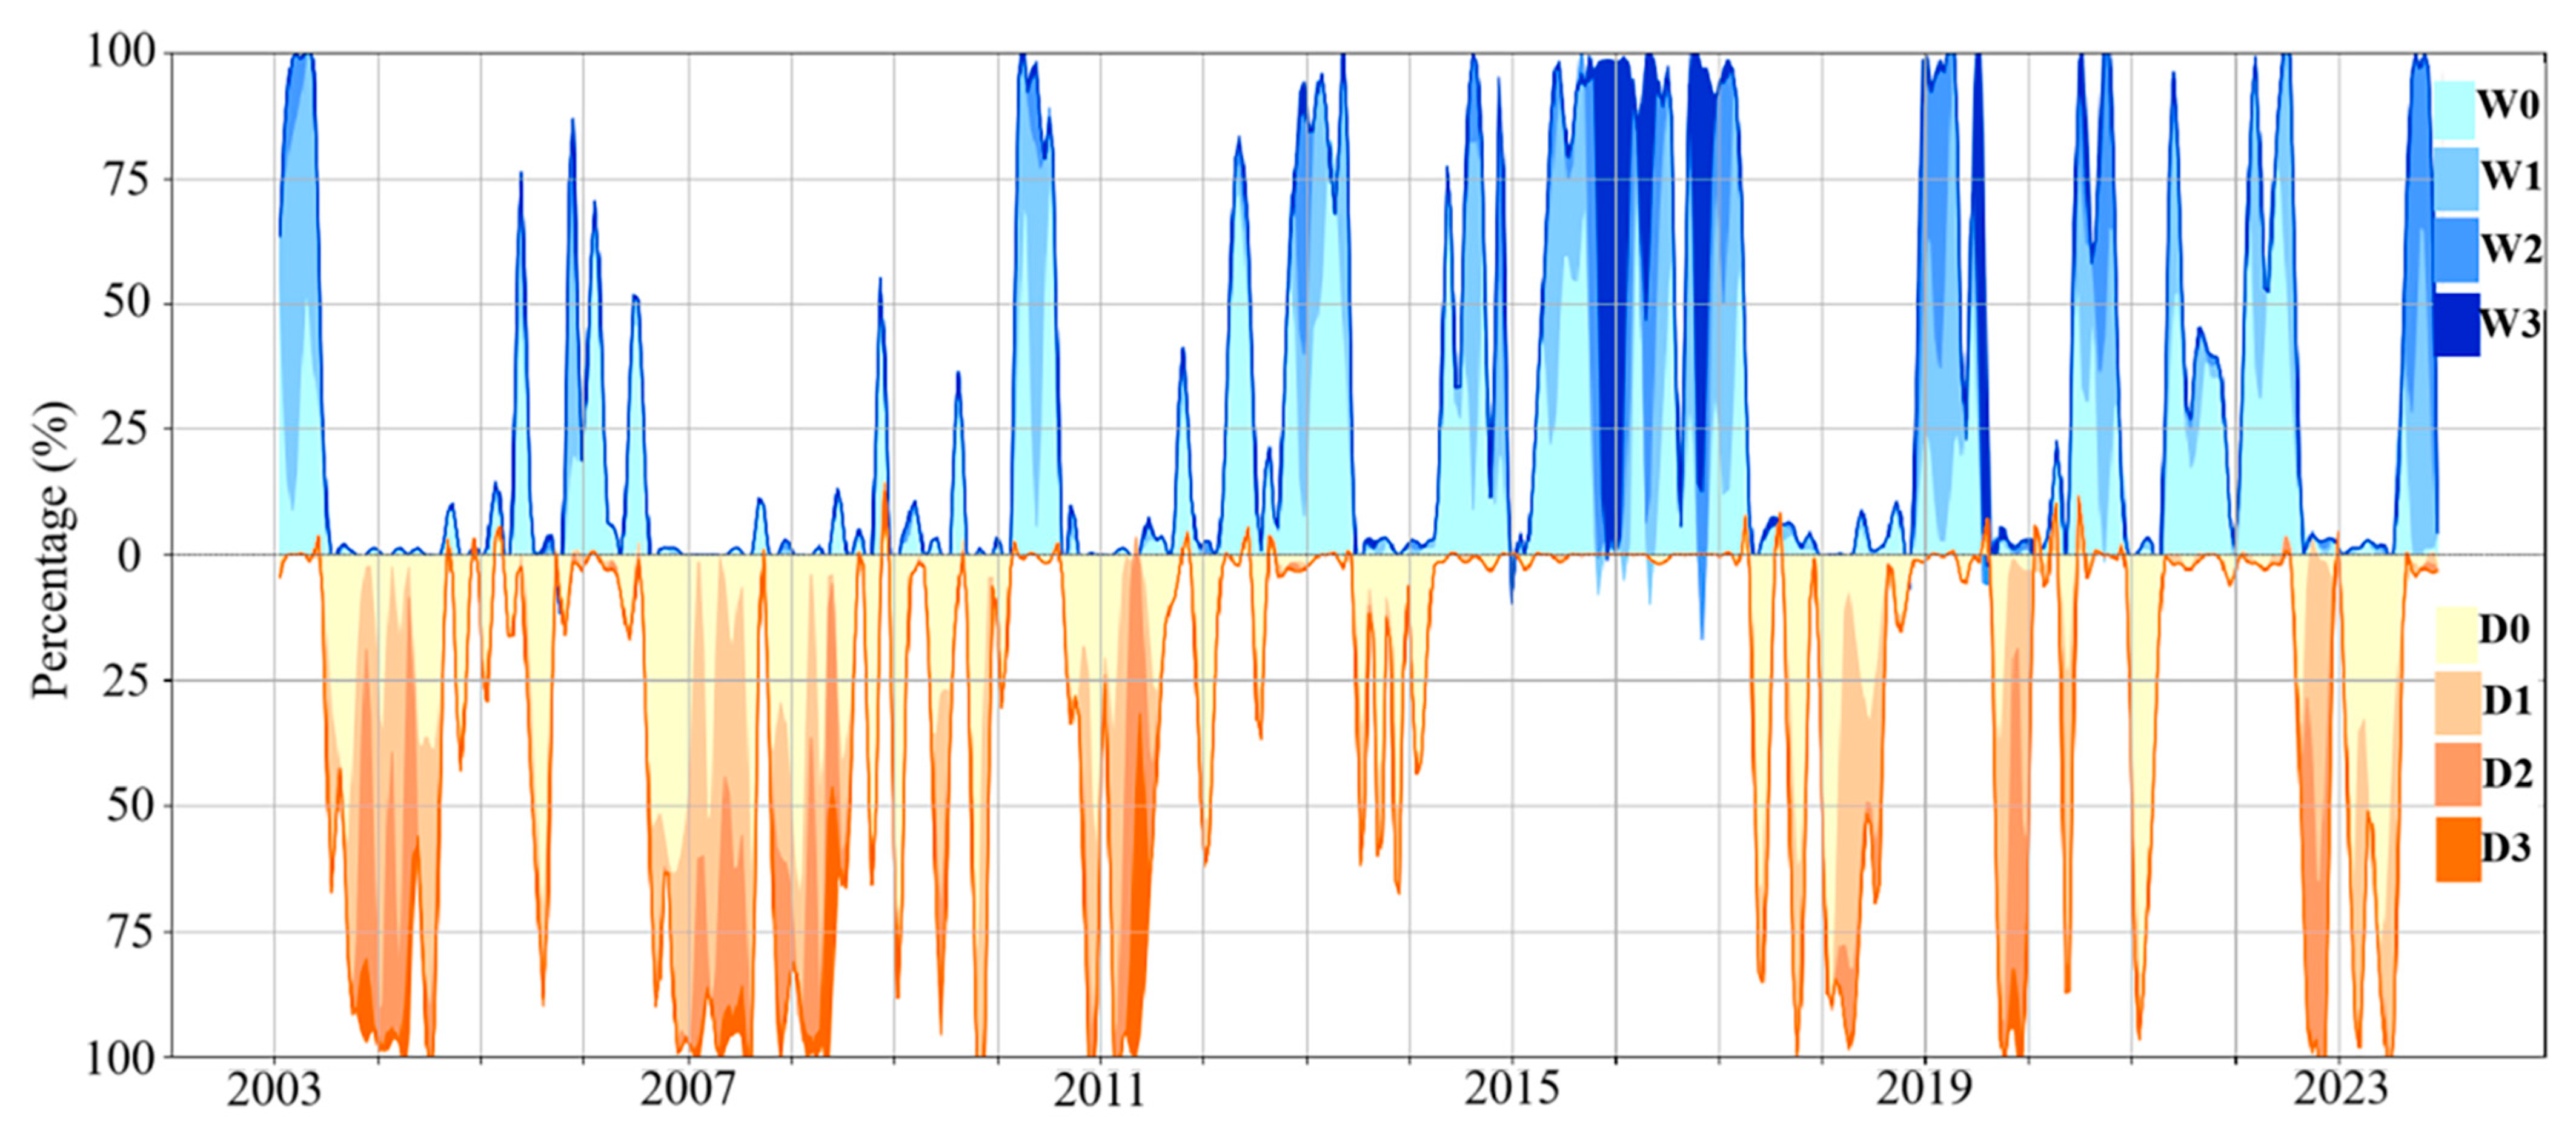
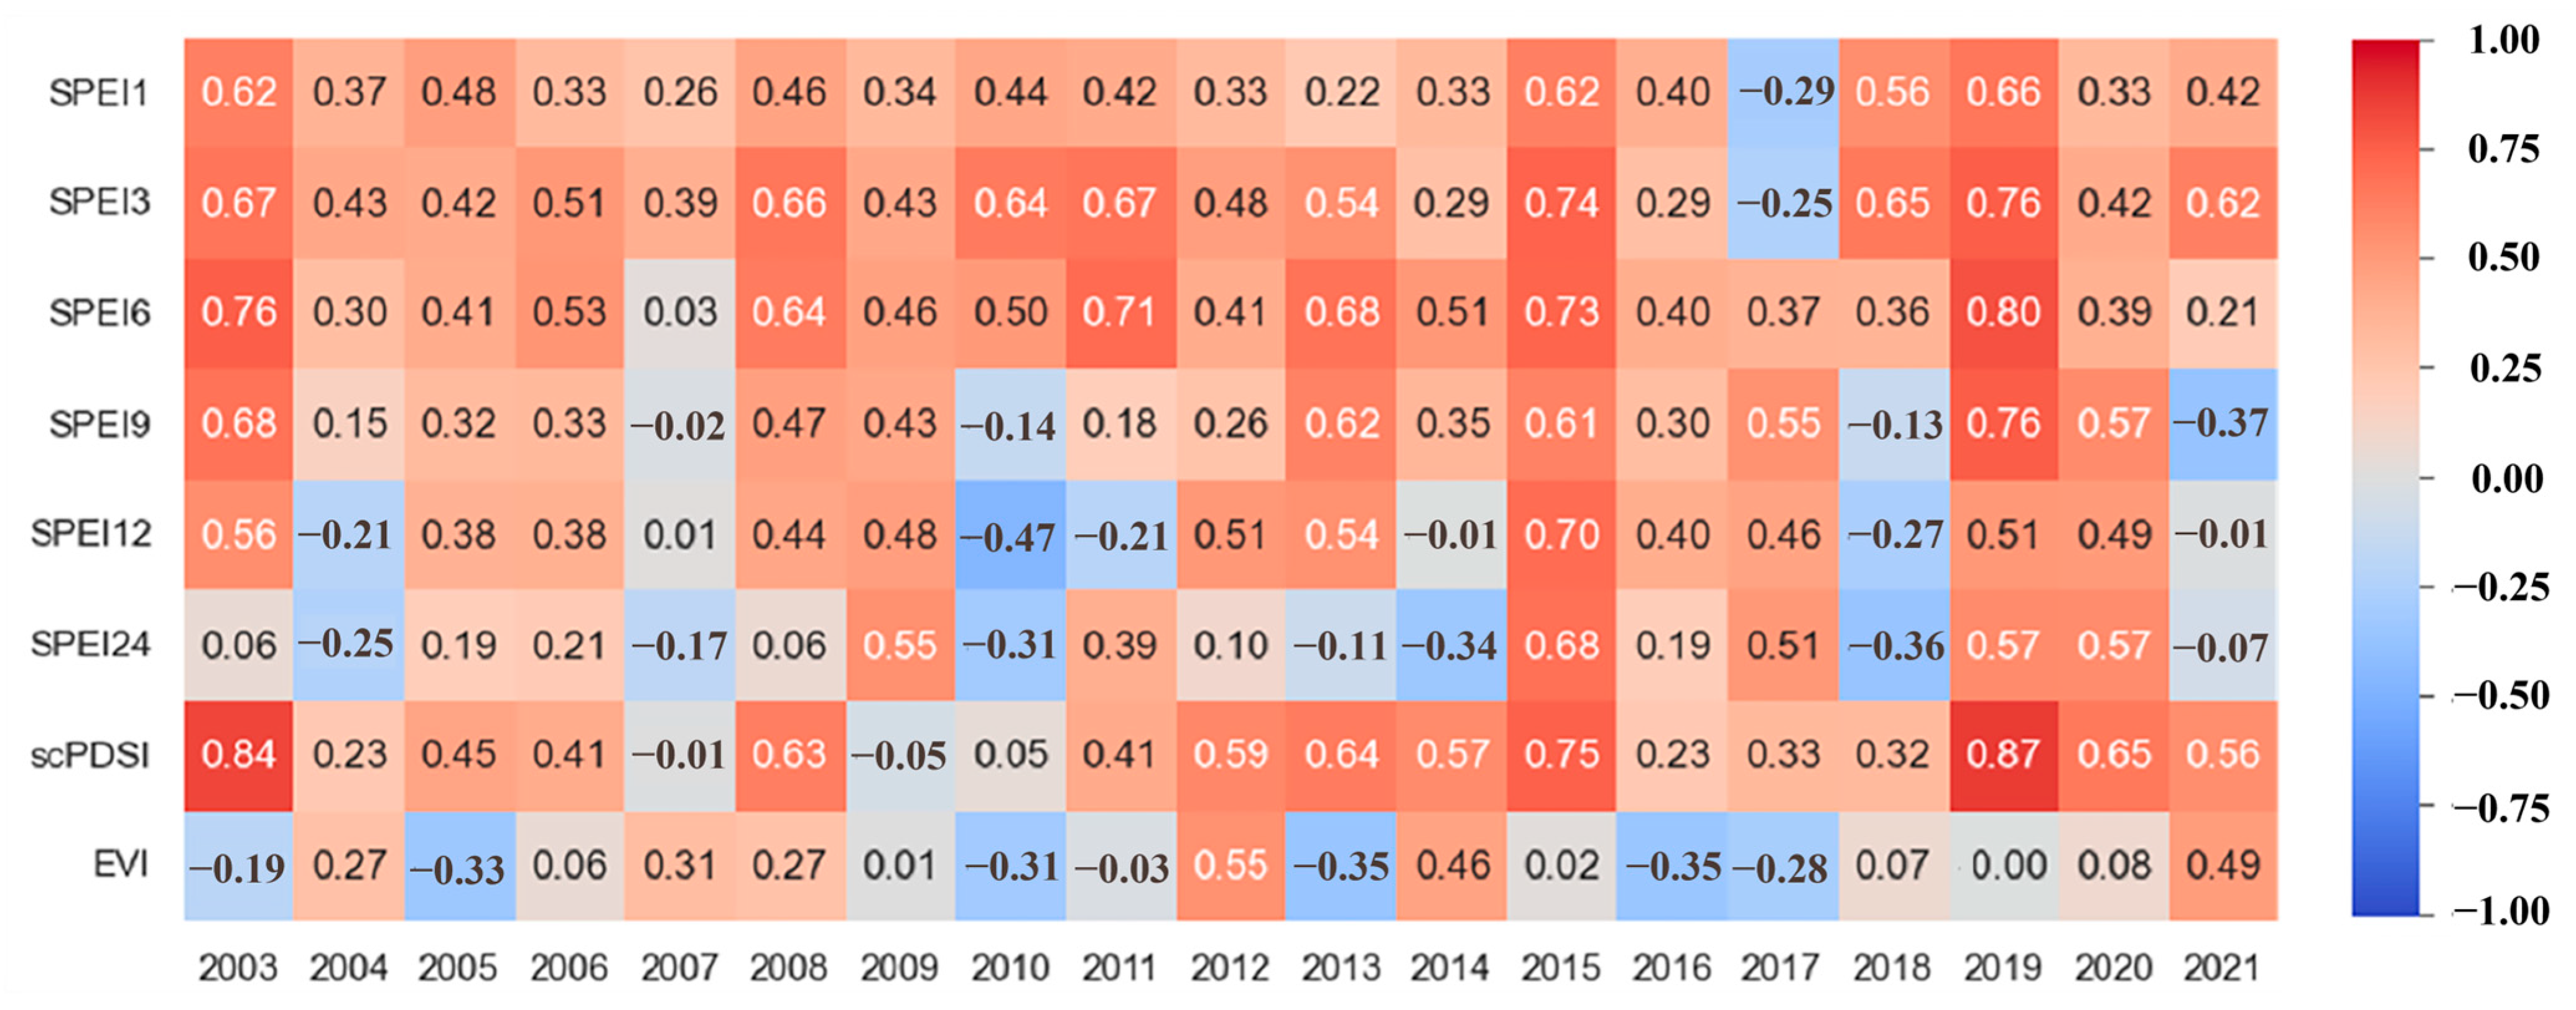
3.4. Groundwater Drought: Correlation with Meteorological, Agricultural, and Groundwater Droughts

In 2020, flooding in the Yangtze River Basin caused a significant rise in Poyang Lake’s water levels, expanding the affected area to 4206 km2. Conversely, in 2022, extreme meteorological drought in Jiangxi Province caused the lake’s water area to shrink dramatically to just 813 km2 [72]. These frequent extreme droughts and floods pose severe threats to the ecological safety and socioeconomic stability of the Poyang Lake area. As shown in Figure 7, from 2003 to 2010, droughts were relatively frequent, particularly between 2003 and 2006, when conditions often fell within the D1 (mild drought) and D2 (moderate drought) categories. The occurrence of D3 (extreme drought) events during this time highlights the severity of drought conditions. From 2014 to 2023, the August–December 2022 drought was the most severe, with over 50.1% of the lake area experiencing severe drought (D2) and 15.1% facing extreme drought (D3). During the same period, extreme wet conditions (W3) also increased significantly. The 2020 floods saw severe wet conditions (W2) affecting 26.5% of the lake area, while extreme wet conditions (W3) accounted for 21.2%. However, the spatial extent of the 2022 drought surpassed that of the 2020 floods, highlighting the profound and far-reaching impacts of recent drought conditions on the region.
Due to the availability of data from 2003 to 2021, meteorological drought was represented by scPDSI and SPEI. Agricultural drought was characterized using EVI, while groundwater drought was represented by the GRACE-SGSAI index based on GWSA. Figure 8 presents the correlations among SPEI (1, 3, 6, 9, 12, and 24 months), scPDSI, EVI, and SGSAI for the Poyang Lake area during various years. The results show that meteorological drought and groundwater drought have moderate to strong correlations, with coefficients of 0.5 (SPEI1), 0.67 (SPEI3), 0.73 (SPEI6), 0.63 (SPEI9), 0.54 (SPEI12), 0.39 (SPEI24), and 0.7 (scPDSI). In contrast, the correlation between agricultural drought and groundwater drought is much weaker, with a coefficient of only 0.26.

4. Discussion

4.1. Factors Influencing GWS Anomalies Variations

In the Poyang Lake region, both TWSA and GWSA exhibit pronounced seasonal fluctuations, increasing during summer and decreasing in winter. These variations are primarily driven by precipitation patterns and hydrological dynamics. During the wet season, concentrated rainfall raises lake water levels, replenishes groundwater, and results in peak TWSA and GWSA values. Conversely, in the dry winter months, declining groundwater storage causes GWSA to reach its lowest levels, influencing TWSA variation. The interaction between GWSA and TWSA becomes particularly pronounced during extreme climatic events, amplifying TWSA fluctuations, as observed in 2019, 2020, and 2022. In the Yangtze River Basin, GWSA contributes approximately 30% of the total TWSA variation [73], highlighting its important role in both seasonal and interannual water storage dynamics.
Since 2014, wet conditions in the Poyang Lake area have intensified, yet GWSA trends reveal a steady decline. Similar patterns have been observed in other basins, such as the Haihe River Basin [74], the Xiliao River Basin [75], and the Indus River Basin [76]. These trends are shaped by regional precipitation patterns and global climatic events, particularly extreme phenomena like El Niño. The 2015/16 El Niño, one of the strongest in recent decades, disrupted global atmospheric circulation, altered tropical Pacific sea surface temperatures, and triggered extreme weather worldwide. In Southeast Asia and parts of China, El Niño events typically reduce precipitation and intensify droughts, while other regions experience excessive rainfall and flooding [77]. Additionally, increasing human activity in water resource utilization has further modified the spatiotemporal characteristics of GWSA in the Poyang Lake region.
Following El Niño events, Poyang Lake becomes increasingly susceptible to drought. The extreme drought of 2022, linked to the century’s first “triple” La Niña phenomenon (spanning summer 2020 to winter 2022/23), resulted in historic droughts and heatwaves across southern China [78,79]. In addition to extreme weather, other factors exacerbate the region’s vulnerability. The operation of the Three Gorges Dam has reduced Poyang Lake’s water retention capacity by weakening its blocking effect and enhancing drainage [67]. Large-scale sand mining has further altered the lake’s topography, compounding these challenges. Meanwhile, growing global food demand has led to the rapid expansion of arable land and intensified groundwater extraction. As a major agricultural region, Poyang Lake’s reliance on high-intensity irrigation has heightened its dependence on groundwater resources, further stressing the region’s hydrological balance [41].
In recent years, water resource allocation and management in the Poyang Lake area have faced increasing challenges. While water resource development has supported social and economic growth during urbanization, local governments have often prioritized constructing additional reservoirs for financial gain [40]. Over-extraction of groundwater has led to declining water levels and land degradation, threatening the ecological balance and agricultural sustainability of the region. Without effective and sustainable management strategies, this unsustainable utilization of water resources is likely to exacerbate existing crises, particularly under the combined impacts of climatic variations and extreme weather events such as El Niño.

4.2. GWS Anomalies in Response to Hydrological Changes

Under the influence of global climatic variations, the Poyang Lake region has experienced increasingly frequent floods and droughts, with extreme hydrological events in 2020 and 2022 causing significant ecological and economic impacts. Notably, the 2020 floods and 2022 droughts were among the most severe on record. This study highlights these two events as focal points. During the prolonged flooding from June to November 2020, the average GWSA was 54.5 mm, with a peak value of 90.3 mm. Although brief, the 2020 floods were exceptionally intense due to the heaviest rainfall recorded since 1961 [80]. In contrast, the extreme drought from July 2022 to January 2023 resulted in an average GWSA deficit of −90.1 mm and a maximum deficit of −160.5 mm. This drought severely impacted local ecosystems, agriculture, and water supplies, underscoring the intensifying severity and unpredictability of extreme weather events driven by global climatic variations.
To quantify the impacts of climatic variations on hydrological indicators and GWSA variations, this study introduces the concept of “monthly climate characteristics” as a benchmark. These characteristics represent the long-term average of climate variables for a specific region and month, allowing for the identification of surpluses or deficits in observed values. By comparing GWSA, precipitation (P), evapotranspiration (ET), and groundwater runoff (GR) from ERA5 data with their monthly climate characteristics, deviation rates were calculated. As shown in Figure 9, the most significant GWSA fluctuation occurred in July 2019, with a deviation of 5.5%, accompanied by deviations in P (1.9%) and GR (2.7%). This coincided with the first flood event in Poyang Lake in 2019. In the Poyang Lake region, P and GR show pronounced fluctuations during dry periods (December–February) and flood periods (June–August) [81]. In contrast, ET remains relatively stable, suggesting that P and GR are more sensitive to extreme events. The stability of ET can be attributed to the subtropical humid monsoon climate, characterized by distinct seasonality and vegetation regulation [82]. Similar patterns have been observed in other regions, such as the Beijing–Tianjin–Hebei region [83], Sichuan Province [84], and the Pearl River Basin [85], where P and GR exhibit greater variability than ET during extreme climatic events. These areas share common features, including monsoon climates, seasonal precipitation patterns, and summer rainfall dominance.
Certain periods, such as 2005, 2006, and 2014, show extreme variations in GR and P without significant changes in GWSA. This can be explained by several factors. First, groundwater storage responds to precipitation and runoff with a delay, as recharge processes take time. In some years, increased GR may indicate short-term hydrological fluctuations rather than long-term groundwater replenishment, especially if much of the runoff is discharged into rivers or lakes instead of infiltrating into aquifers [86]. Second, antecedent soil moisture conditions play a key role. When groundwater levels are already low before a flood event, precipitation first replenishes soil moisture before contributing to groundwater storage [87]. Third, water control structures, such as reservoirs and dams, regulate water flow and can alter the natural recharge process, limiting the direct impact of extreme precipitation on GWSA [88]. These factors collectively highlight the complex interactions between precipitation, runoff, and groundwater storage.
As a critical part of the Yangtze River Basin, the hydrological cycle of Poyang Lake is heavily influenced by the basin’s broader climatic conditions. Precipitation serves as the primary driver of GWSA in the Yangtze River Basin [73], aligning with the findings of this study. GR often responds directly to precipitation, with Figure 9 showing that GR fluctuations frequently surpass those of P, particularly during extreme flood events. This amplified response is linked to rapid increases in groundwater levels and elevated runoff under saturated soil conditions. Once the soil reaches saturation, additional precipitation is almost entirely converted into runoff, intensifying GR fluctuations beyond those of P. Furthermore, human activities, such as land use changes and water conservancy projects, have significantly impacted the water balance of Poyang Lake. The operation of the Three Gorges Dam, in particular, has altered hydrological conditions in the middle and lower reaches of the Yangtze River, affecting water levels and water volume in Poyang Lake [37].

4.3. The Impact of Drought and Flood Events on Water Resource Recovery

During flood periods, fluctuations in the rate of change of water mass (dM/dt) are particularly pronounced, with significant peaks recorded in 2015 and 2020. In 2015, the deterioration rate peaked at 52.75 mm/month, resulting in an average recovery time of 18.73 months during the prolonged hydrological events from 2015 to 2017. Despite efforts such as comprehensive watershed management [66], targeted Poyang Lake interventions [89], and selective levee flood discharges [90], the recovery period was longer compared to the 2006–2008 events. This extended recovery time is attributed to the abruptness and intensity of rainfall in 2015, marked by six heavy rainfall events in November and December that had severe impacts on the Poyang Lake area [91]. The extreme flood event of 2020 demonstrated an even greater deterioration rate, peaking at 100.74 mm/month, underscoring the severity of flooding that year. In contrast, during the 2006–2008 hydrological events, positive dM/dt values remained below 50 mm/month, reflecting relatively milder conditions.
Unlike floods, drought periods generally show a slower but more persistent decline in water resources, leading to long-term cumulative water loss. This gradual depletion can severely impact vegetation, soil, and groundwater systems [92]. Prolonged moisture deficiency dries out soils, weakens vegetation, and destabilizes ecosystems. While ecosystems can often adapt to short-term droughts, sustained water scarcity erodes their resilience, making them increasingly vulnerable to future extreme weather events [93]. The 2022 extreme drought event, characterized by extremely high temperatures and abnormal atmospheric circulation, resulted in a sudden acceleration of water loss rates. This event highlighted critical gaps in existing policies and infrastructure for managing extreme hydrological events, underscoring the urgent need for enhanced strategies to mitigate the impacts of both droughts and floods.

4.4. Connections Between Groundwater Drought and Other Drought Types

The SGSAI exhibits stronger correlations with meteorological droughts, as represented by the SPEI, particularly at the 3-month (SPEI3) and 6-month (SPEI6) timescales. Among these, the highest correlation is observed between SGSAI and SPEI6. Correlations with the scPDSI are slightly lower than those with SPEI6, indicating that short- and medium-term meteorological droughts, represented by SPEI3 and SPEI6, have a stronger influence on groundwater drought in the Poyang Lake region. SPEI6 maintains a consistently high correlation with SGSAI over time, peaking at 0.80 in 2019. In contrast, long-term meteorological drought indices (SPEI9, SPEI12, and SPEI24) show weaker correlations with SGSAI, particularly in years such as 2010, 2018, and 2021, when correlations drop below 0. Previous studies have emphasized the utility of SPEI, particularly SPEI6, as a robust meteorological drought index for understanding groundwater drought responses [94,95,96]. This highlights that, in regions like Poyang Lake, short- to medium-term meteorological droughts significantly influence groundwater drought, reflecting the sensitivity of groundwater systems to rapid shifts between drought and flood conditions. Conversely, groundwater systems respond less strongly to long-term meteorological droughts due to delayed recharge and slower adjustment mechanisms. Moreover, scPDSI appears to be more sensitive to drought events than SPEI across most timescales, as supported by Saemian et al. [97]. This may stem from SPEI’s limitations in capturing seasonality [98], whereas scPDSI aligns well with site-specific drought indices in humid regions [99].
In contrast, the correlation between agricultural drought and groundwater drought is relatively weak. This is primarily because the EVI, which reflects vegetation health and greenness, is more directly influenced by surface water dynamics than by groundwater systems, which respond with a lag to surface water fluctuations [100]. Additionally, agricultural water use in the Poyang Lake area relies on a combination of surface water and precipitation, rather than being predominantly dependent on groundwater [60]. These factors contribute to the weaker direct relationship between EVI and groundwater drought. Furthermore, human activities, including irrigation practices and water management policies, play a crucial role in shaping this relationship. For instance, the implementation of efficient irrigation systems or the reliance on surface water reservoirs for agricultural needs can reduce dependence on groundwater, thereby minimizing the direct impact of groundwater drought on vegetation [101,102]. However, an exception was observed in 2021, when the correlation between agricultural and groundwater droughts showed a notable increase compared to previous years, likely due to the delayed response of groundwater systems to hydrological deficits.

5. Conclusions

This study analyzed the response mechanisms of GWS to extreme hydrological events in the Poyang Lake region by leveraging advanced spatial downscaling of GRACE data using the CNN-A-LSTM model. The findings highlight that precipitation and groundwater runoff are more sensitive to drought and flood events than evapotranspiration, emphasizing their critical role in driving GWS variations. This highlights the need to prioritize infiltration management in floodplains where runoff amplifies climatic shocks.
While recent management efforts, including coordinated water infrastructure projects and selective levee breaches, have improved recovery rates, extreme rainfall and prolonged droughts continue to pose severe challenges. Notably, droughts exert more prolonged and destructive impacts on groundwater systems than floods. The severe drought in 2022, influenced by years of La Niña conditions, led to a groundwater deficit nearly twice the surplus recorded during the 2020 floods. Its recovery took three times longer than after the floods, highlighting the shortcomings of passive drought response policies.
The study also reveals that groundwater in the Poyang Lake area strongly correlates with short- and medium-term meteorological droughts but exhibits weaker connections with long-term meteorological and agricultural droughts due to delayed recharge and complex water usage dynamics. The surge in EVI-SGSAI correlation in 2021 warns of a growing disconnect between agricultural and groundwater droughts. This suggests that future farming systems may face a sudden reliance on groundwater, making institutional reforms urgent.
Overall, this study reshapes our understanding of groundwater dynamics in large lake–floodplain systems under climate stress and human influence. By quantifying recovery thresholds, it provides practical indicators for managing extreme hydrological events. Future research should integrate groundwater response models with socio-hydrological frameworks, recognizing that technical solutions alone are insufficient to address governance challenges in an increasingly unstable hydrological climate.

Supplementary Materials

The following supporting information can be downloaded at: https://www.mdpi.com/article/10.3390/rs17060988/s1. Refs. [103,104,105,106,107,108] are cited in the Supplementary Materials file.

Author Contributions

Conceptualization, Z.L. and B.L.; formal analysis, Z.L.; investigation, Z.L.; resources, C.W.; data curation, J.C.; writing—original draft preparation, X.Y.; writing—review and editing, E.P., Y.Z., and L.S.; visualization, C.L. and M.H.; supervision, C.L.; project administration, C.W. All authors have read and agreed to the published version of the manuscript.

Funding

This research (except for Y.Z.) was funded by the National Key R&D Program of China (2024YFC3211600, 2021YFC3200502) and the National Natural Science Foundation of China (41971027, 524032711).

Data Availability Statement

The data that support the findings of this study are openly available. These include the GRACE/GRACE-FO data, which can be accessed from the NASA website (https://download.csr.utexas.edu/outgoing/gracefo/RL06.1LRI/) (accessed on 6 June 2024). The GLDAS data are available at https://disc.gsfc.nasa.gov/datasets/GLDAS_NOAH025_M_2.1 (accessed on 6 June 2024), while the ERA5 data can be downloaded from https://cds.climate.copernicus.eu/cdsapp#!/dataset/reanalysis-era5-land-monthly-means?tab=overview (accessed on 6 June 2024). The DEM data can be retrieved from https://vertex.daac.asf.alaska.edu/# (accessed on 6 June 2024). NDVI data (MOD13C2 Version 6) are available from https://lpdaac.usgs.gov/products/mod13c2v006/ (accessed on 6 June 2024). Additionally, scPDSI data are available at https://crudata.uea.ac.uk/cru/data/drought/ (accessed on 6 June 2024), and SPEI data can be accessed at https://spei.csic.es/map/maps.html (accessed on 6 June 2024). EVI data can be downloaded from https://lpdaac.usgs.gov/ (accessed on 6 June 2024). The datasets generated during the current study are available from the corresponding author upon reasonable request.

Conflicts of Interest

The authors declare no conflicts of interest.

References

  1. Zheng, C.; Guo, Z. Plans to Protect China’s Depleted Groundwater. Science 2022, 375, 827. [Google Scholar] [CrossRef] [PubMed]
  2. Li, X.; Zhong, B.; Chen, J.; Li, J.; Wang, H. Investigation of 2020–2022 Extreme Floods and Droughts in Sichuan Province of China Based on Joint Inversion of GNSS and GRACE/GFO Data. J. Hydrol. 2024, 632, 130868. [Google Scholar] [CrossRef]
  3. Sun, A.; Scanlon, B.; AghaKouchak, A.; Zhang, Z. Using GRACE Satellite Gravimetry for Assessing Large-Scale Hydrologic Extremes. Remote Sens. 2017, 9, 1287. [Google Scholar] [CrossRef]
  4. Wu, W.-Y.; Lo, M.-H.; Wada, Y.; Famiglietti, J.S.; Reager, J.T.; Yeh, P.J.-F.; Ducharne, A.; Yang, Z.-L. Divergent Effects of Climate Change on Future Groundwater Availability in Key Mid-Latitude Aquifers. Nat. Commun. 2020, 11, 3710. [Google Scholar] [CrossRef] [PubMed]
  5. Roy, P.; Pal, S.C.; Chakrabortty, R.; Chowdhuri, I.; Saha, A.; Shit, M. Climate Change and Groundwater Overdraft Impacts on Agricultural Drought in India: Vulnerability Assessment, Food Security Measures and Policy Recommendation. Sci. Total Environ. 2022, 849, 157850. [Google Scholar] [CrossRef]
  6. Amanambu, A.C.; Obarein, O.A.; Mossa, J.; Li, L.; Ayeni, S.S.; Balogun, O.; Oyebamiji, A.; Ochege, F.U. Groundwater System and Climate Change: Present Status and Future Considerations. J. Hydrol. 2020, 589, 125163. [Google Scholar] [CrossRef]
  7. Wang, D.; Chen, Y.; Jarin, M.; Xie, X. Increasingly Frequent Extreme Weather Events Urge the Development of Point-of-Use Water Treatment Systems. npj Clean Water 2022, 5, 36. [Google Scholar] [CrossRef]
  8. Li, X.; Zhang, Q.; Hu, Q.; Zhang, D.; Ye, X. Lake Flooding Sensitivity to the Relative Timing of Peak Flows between Upstream and Downstream Waterways: A Case Study of Poyang Lake, China. Hydrol. Process. 2017, 31, 4217–4228. [Google Scholar] [CrossRef]
  9. Cuthbert, M.O.; Gleeson, T.; Moosdorf, N.; Befus, K.M.; Schneider, A.; Hartmann, J.; Lehner, B. Global Patterns and Dynamics of Climate–Groundwater Interactions. Nat. Clim. Chang. 2019, 9, 137–141. [Google Scholar] [CrossRef]
  10. Jiang, Z.; Xu, T.; Mallants, D.; Tian, H.; Owen, D.D.R. Numerical Modelling of Stable Isotope (2H and 18O) Transport in a Hydro-Geothermal System: Model Development and Implementation to the Guide Basin, China. J. Hydrol. 2019, 569, 93–105. [Google Scholar] [CrossRef]
  11. Ide, K.; Hosono, T.; Kagabu, M.; Fukamizu, K.; Tokunaga, T.; Shimada, J. Changes of Groundwater Flow Systems after the 2016 Mw 7.0 Kumamoto Earthquake Deduced by Stable Isotopic and CFC-12 Compositions of Natural Springs. J. Hydrol. 2020, 583, 124551. [Google Scholar] [CrossRef]
  12. Tóth, Á.; Havril, T.; Simon, S.; Galsa, A.; Monteiro Santos, F.A.; Müller, I.; Mádl-Szőnyi, J. Groundwater Flow Pattern and Related Environmental Phenomena in Complex Geologic Setting Based on Integrated Model Construction. J. Hydrol. 2016, 539, 330–344. [Google Scholar] [CrossRef]
  13. Wang, R.; Li, X.; Zhang, Q.; Cheng, J.; Li, J.; Zhang, D.; Liu, Y. Projection of Drought-Flood Abrupt Alternation in a Humid Subtropical Region under Changing Climate. J. Hydrol. 2023, 624, 129875. [Google Scholar] [CrossRef]
  14. Schmidt, F.; Wainwright, H.M.; Faybishenko, B.; Denham, M.; Eddy-Dilek, C. In Situ Monitoring of Groundwater Contamination Using the Kalman Filter. Environ. Sci. Technol. 2018, 52, 7418–7425. [Google Scholar] [CrossRef] [PubMed]
  15. Secci, D.; Molino, L.; Zanini, A. Contaminant Source Identification in Groundwater by Means of Artificial Neural Network. J. Hydrol. 2022, 611, 128003. [Google Scholar] [CrossRef]
  16. Banaei, S.M.A.; Javid, A.H.; Hassani, A.H. Numerical Simulation of Groundwater Contaminant Transport in Porous Media. Int. J. Environ. Sci. Technol. 2021, 18, 151–162. [Google Scholar] [CrossRef]
  17. Sang, C.; Tan, L.; Cai, Q.; Ye, L. Long-Term (2003−2021) Evolution Trend of Water Quality in the Three Gorges Reservoir: An Evaluation Based on an Enhanced Water Quality Index. Sci. Total Environ. 2024, 915, 169819. [Google Scholar] [CrossRef]
  18. Foroumandi, E.; Nourani, V.; Jeanne Huang, J.; Moradkhani, H. Drought Monitoring by Downscaling GRACE-Derived Terrestrial Water Storage Anomalies: A Deep Learning Approach. J. Hydrol. 2023, 616, 128838. [Google Scholar] [CrossRef]
  19. Song, X.; Chen, H.; Chen, T.; Qin, Z.; Chen, S.; Yang, N.; Deng, S. GRACE-Based Groundwater Drought in the Indochina Peninsula during 1979–2020: Changing Properties and Possible Teleconnection Mechanisms. Sci. Total Environ. 2024, 908, 168423. [Google Scholar] [CrossRef]
  20. Ali, S.; Liu, D.; Fu, Q.; Cheema, M.J.M.; Pham, Q.B.; Rahaman, M.M.; Dang, T.D.; Anh, D.T. Improving the Resolution of GRACE Data for Spatio-Temporal Groundwater Storage Assessment. Remote Sens. 2021, 13, 3513. [Google Scholar] [CrossRef]
  21. Wang, F.; Zhou, Q.; Gao, H.; Wen, Y.; Zhou, S. Dynamic Monitoring of Poyang Lake Water Area and Storage Changes from 2002 to 2022 via Remote Sens. and Satellite Gravimetry Techniques. Remote Sens. 2024, 16, 2408. [Google Scholar] [CrossRef]
  22. Yazdian, H.; Salmani-Dehaghi, N.; Alijanian, M. A Spatially Promoted SVM Model for GRACE Downscaling: Using Ground and Satellite-Based Datasets. J. Hydrol. 2023, 626, 130214. [Google Scholar] [CrossRef]
  23. Cai, J.; Luo, J.; Wang, S.; Yang, S. Feature Selection in Machine Learning: A New Perspective. Neurocomputing 2018, 300, 70–79. [Google Scholar] [CrossRef]
  24. Krizhevsky, A.; Sutskever, I.; Hinton, G.E. ImageNet Classification with Deep Convolutional Neural Networks. Adv. Neural Inf. Process. Syst. 2012, 25, 84–90. [Google Scholar] [CrossRef]
  25. AlBdairi, A.J.A.; Xiao, Z.; Alkhayyat, A.; Humaidi, A.J.; Fadhel, M.A.; Taher, B.H.; Alzubaidi, L.; Santamaría, J.; Al-Shamma, O. Face Recognition Based on Deep Learning and FPGA for Ethnicity Identification. Appl. Sci. 2022, 12, 2605. [Google Scholar] [CrossRef]
  26. Chen, S.; Xu, X.; Zhang, Y.; Shao, D.; Zhang, S.; Zeng, M. Two-Stream Convolutional LSTM for Precipitation Nowcasting. Neural Comput. Appl. 2022, 34, 13281–13290. [Google Scholar] [CrossRef]
  27. Agga, A.; Abbou, A.; Labbadi, M.; Houm, Y.E.; Ou Ali, I.H. CNN-LSTM: An Efficient Hybrid Deep Learning Architecture for Predicting Short-Term Photovoltaic Power Production. Electr. Power Syst. Res. 2022, 208, 107908. [Google Scholar] [CrossRef]
  28. Huang, M.; Tian, D.; Liu, H.; Zhang, C.; Yi, X.; Cai, J.; Ruan, J.; Zhang, T.; Kong, S.; Ying, G. A Hybrid Fuzzy Wavelet Neural Network Model with Self-Adapted Fuzzy c -Means Clustering and Genetic Algorithm for Water Quality Prediction in Rivers. Complexity 2018, 2018, 8241342. [Google Scholar] [CrossRef]
  29. Vidya, B.; Sasikumar, P. Parkinson’s Disease Diagnosis and Stage Prediction Based on Gait Signal Analysis Using EMD and CNN–LSTM Network. Eng. Appl. Artif. Intell. 2022, 114, 105099. [Google Scholar] [CrossRef]
  30. Ghimire, S.; Yaseen, Z.M.; Farooque, A.A.; Deo, R.C.; Zhang, J.; Tao, X. Streamflow Prediction Using an Integrated Methodology Based on Convolutional Neural Network and Long Short-Term Memory Networks. Sci. Rep. 2021, 11, 17497. [Google Scholar] [CrossRef]
  31. Liang, Y.; Ke, S.; Zhang, J.; Yi, X.; Zheng, Y. GeoMAN: Multi-Level Attention Networks for Geo-Sensory Time Series Prediction. In Proceedings of the Twenty-Seventh International Joint Conference on Artificial Intelligence, Stockholm, Sweden, 13–19 July 2018; International Joint Conferences on Artificial Intelligence Organization: Stockholm, Sweden, 2018; pp. 3428–3434. [Google Scholar]
  32. O’Dwyer, J.; Chique, C.; Weatherill, J.; Hynds, P. Impact of the 2018 European Drought on Microbial Groundwater Quality in Private Domestic Wells: A Case Study from a Temperate Maritime Climate. J. Hydrol. 2021, 601, 126669. [Google Scholar] [CrossRef]
  33. Mathivha, F.I.; Nkosi, M.; Mutoti, M.I. Evaluating the Relationship between Hydrological Extremes and Groundwater in Luvuvhu River Catchment, South Africa. J. Hydrol. Reg. Stud. 2021, 37, 100897. [Google Scholar] [CrossRef]
  34. Dong, Z.; Wang, G.; Amankwah, S.O.Y.; Wei, X.; Hu, Y.; Feng, A. Monitoring the Summer Flooding in the Poyang Lake Area of China in 2020 Based on Sentinel-1 Data and Multiple Convolutional Neural Networks. Int. J. Appl. Earth Obs. Geoinf. 2021, 102, 102400. [Google Scholar] [CrossRef]
  35. Zhang, L.; Yuan, L.; Xiang, J.; Liao, Q.; Zhang, D.; Liu, J. Response of the Microbial Community Structure to the Environmental Factors during the Extreme Flood Season in Poyang Lake, the Largest Freshwater Lake in China. Front. Microbiol. 2024, 15, 1362968. [Google Scholar] [CrossRef] [PubMed]
  36. Han, H.; Jian, H.; Liu, M.; Lei, S.; Yao, S.; Yan, F. Impacts of Drought and Heat Events on Vegetative Growth in a Typical Humid Zone of the Middle and Lower Reaches of the Yangtze River, China. J. Hydrol. 2023, 620, 129452. [Google Scholar] [CrossRef]
  37. Zhang, Z.; Huang, Y.; Xu, C.-Y.; Chen, X.; Moss, E.M.; Jin, Q.; Bailey, A.M. Analysis of Poyang Lake Water Balance and Its Indication of River–Lake Interaction. SpringerPlus 2016, 5, 1555. [Google Scholar] [CrossRef]
  38. Li, X.; Ye, X.; Yao, J.; Lin, Y.; Xu, C.; Yuan, C. Influences of Increasing Water Release of the Three Gorges Reservoir during Dry Season on Water Regimes of Downstream Lake. Hydrol. Process. 2023, 37, e14895. [Google Scholar] [CrossRef]
  39. Zhang, Q.; Werner, A.D. Hysteretic Relationships in Inundation Dynamics for a Large Lake–Floodplain System. J. Hydrol. 2015, 527, 160–171. [Google Scholar] [CrossRef]
  40. Li, Z.; Chen, X.; Liu, W.; Si, B. Determination of Groundwater Recharge Mechanism in the Deep Loessial Unsaturated Zone by Environmental Tracers. Sci. Total Environ. 2017, 586, 827–835. [Google Scholar] [CrossRef]
  41. Wang, T.; Wu, Z.; Wang, P.; Wu, T.; Zhang, Y.; Yin, J.; Yu, J.; Wang, H.; Guan, X.; Xu, H.; et al. Plant-Groundwater Interactions in Drylands: A Review of Current Research and Future Perspectives. Agric. For. Meteorol. 2023, 341, 109636. [Google Scholar] [CrossRef]
  42. Liu, W.; Zhu, S.; Huang, Y.; Wan, Y.; Wu, B.; Liu, L. Spatiotemporal Variations of Drought and Their Teleconnections with Large-Scale Climate Indices over the Poyang Lake Basin, China. Sustainability 2020, 12, 3526. [Google Scholar] [CrossRef]
  43. Huang, F.; Chunyu, X.; Wang, Y.; Zhang, X.; Qian, B.; Zhao, D.; Xia, Z. Impacts of Streamflow and Topographic Changes on Water Level during the Dry Season of Poyang Lake, China. J. Hydrol. Eng. 2020, 25, 05020001. [Google Scholar] [CrossRef]
  44. Zhou, H.; Luo, Z.; Tangdamrongsub, N.; Zhou, Z.; He, L.; Xu, C.; Li, Q.; Wu, Y. Identifying Flood Events over the Poyang Lake Basin Using Multiple Satellite Remote Sens. Observations, Hydrological Models and In Situ Data. Remote Sens. 2018, 10, 713. [Google Scholar] [CrossRef]
  45. Tan, Z.; Wang, X.; Li, Y.; Zhang, Z.; Xue, C.; Yao, J.; You, H. The Impact of Three Gorges Dam on the Hydrological Connectivity of “off-Stream” Floodplains. J. Hydrol. 2024, 629, 130619. [Google Scholar] [CrossRef]
  46. Liu, S.; Wu, Y.; Xu, G.; Cheng, S.; Zhong, Y.; Zhang, Y. Characterizing the 2022 Extreme Drought Event over the Poyang Lake Basin Using Multiple Satellite Remote Sens. Observations and In Situ Data. Remote Sens. 2023, 15, 5125. [Google Scholar] [CrossRef]
  47. Tian, M.; Mao, J.; Wang, K.; Xu, D. Spatio-Temporal Heterogeneity of Ecological Water Level in Poyang Lake, China. Ecol. Inform. 2024, 82, 102694. [Google Scholar] [CrossRef]
  48. Lan, Z.; Wenke, S. Progress and prospect of GRACE Mascon product and its application. Rev. Geophys. Planet. Phys. 2022, 53, 35–52. [Google Scholar]
  49. Tavella, P.; Premoli, A. Estimating the Instabilities of N Clocks by Measuring Differences of Their Readings. Metrologia 1994, 30, 479–486. [Google Scholar] [CrossRef]
  50. Ferreira, V.G.; Montecino, H.D.C.; Yakubu, C.I.; Heck, B. Uncertainties of the Gravity Recovery and Climate Experiment Time-Variable Gravity-Field Solutions Based on Three-Cornered Hat Method. J. Appl. Remote Sens. 2016, 10, 015015. [Google Scholar] [CrossRef]
  51. Yi, S.; Sneeuw, N. Filling the Data Gaps Within GRACE Missions Using Singular Spectrum Analysis. J. Geophys. Res. Solid Earth 2021, 126, e2020JB021227. [Google Scholar] [CrossRef]
  52. Rodell, M.; Houser, P.R.; Jambor, U.; Gottschalck, J.; Mitchell, K.; Meng, C.-J.; Arsenault, K.; Cosgrove, B.; Radakovich, J.; Bosilovich, M.; et al. The Global Land Data Assimilation System. Bull. Am. Meteorol. Soc. 2004, 85, 381–394. [Google Scholar] [CrossRef]
  53. Wang, L.; Jia, B.; Yuan, X.; Xie, Z.; Yang, K.; Shi, J. The Slowdown of Increasing Groundwater Storage in Response to Climate Warming in the Tibetan Plateau. npj Clim. Atmos. Sci. 2024, 7, 286. [Google Scholar] [CrossRef]
  54. Wang, Q.; Zheng, W.; Yin, W.; Kang, G.; Huang, Q.; Shen, Y. Improving the Resolution of GRACE/InSAR Groundwater Storage Estimations Using a New Subsidence Feature Weighted Combination Scheme. Water 2023, 15, 1017. [Google Scholar] [CrossRef]
  55. Ding, K.; Zhao, X.; Cheng, J.; Yu, Y.; Luo, Y.; Couchot, J.; Zheng, K.; Lin, Y.; Wang, Y. GRACE/ML-Based Analysis of the Spatiotemporal Variations of Groundwater Storage in Africa. J. Hydrol. 2025, 647, 132336. [Google Scholar] [CrossRef]
  56. Zhao, K.; Fang, Z.; Li, J.; He, C. Spatial-Temporal Variations of Groundwater Storage in China: A Multiscale Analysis Based on GRACE Data. Resour. Conserv. Recycl. 2023, 197, 107088. [Google Scholar] [CrossRef]
  57. Duo, A.; Zhao, W.; Qu, X.; Jing, R.; Xiong, K. Spatio-Temporal Variation of Vegetation Coverage and Its Response to Climate Change in North China Plain in the Last 33 Years. Int. J. Appl. Earth Obs. Geoinf. 2016, 53, 103–117. [Google Scholar]
  58. Nanzad, L.; Zhang, J.; Tuvdendorj, B.; Nabil, M.; Zhang, S.; Bai, Y. NDVI Anomaly for Drought Monitoring and Its Correlation with Climate Factors over Mongolia from 2000 to 2016. J. Arid Environ. 2019, 164, 69–77. [Google Scholar] [CrossRef]
  59. Thomas, A.C.; Reager, J.T.; Famiglietti, J.S.; Rodell, M. A GRACE-based Water Storage Deficit Approach for Hydrological Drought Characterization. Geophys. Res. Lett. 2014, 41, 1537–1545. [Google Scholar] [CrossRef]
  60. Liu, Y.; Lu, C.; Qiu, B.; Wang, J.; Chen, J.; Zhang, Y.; Wu, C.; Liu, B.; Shu, L. Spatiotemporally Non-Stationary Evolution of Groundwater Levels in Poyang Lake Basin Driven by Meteorological and Hydrological Factors. Sci. Total Environ. 2024, 950, 175244. [Google Scholar] [CrossRef]
  61. Danesh, M.; Gharehbaghi, A.; Mehdizadeh, S.; Danesh, A. A Comparative Assessment of Machine Learning and Deep Learning Models for the Daily River Streamflow Forecasting. Water Resour. Manag. 2024. [Google Scholar] [CrossRef]
  62. Sharma, A.; Bansal, P.; Chandel, A.; Shankar, V. Modelling Stage–Discharge Relationship of Himalayan River Using ANN, SVM and ANFIS. Sustain. Water Resour. Manag. 2024, 10, 88. [Google Scholar] [CrossRef]
  63. Mohsen, S.; Abdel-Rehim, W.M.F.; Abdel-Aziz, M. Water Quality Classification Using an Artificial Neural Network. In Intelligent Systems, Blockchain, and Communication Technologies; Abdelgawad, A., Jamil, A., Hameed, A.A., Eds.; Lecture Notes in Networks and Systems; Springer Nature Switzerland: Cham, Switzerland, 2025; Volume 1268, pp. 262–273. ISBN 978-3-031-82376-3. [Google Scholar]
  64. Niazkar, M.; Menapace, A.; Brentan, B.; Piraei, R.; Jimenez, D.; Dhawan, P.; Righetti, M. Applications of XGBoost in Water Resources Engineering: A Systematic Literature Review (Dec 2018–May 2023). Environ. Model. Softw. 2024, 174, 105971. [Google Scholar] [CrossRef]
  65. Zhou, P.; Wang, G.; Mao, H.; Liao, F.; Shi, Z.; Huang, H. Numerical Modeling for the Temporal Variations of the Water Interchange between Groundwater and Surface Water in a Regional Great Lake (Poyang Lake, China). J. Hydrol. 2022, 610, 127827. [Google Scholar] [CrossRef]
  66. Li, X.; Ye, X.; Yuan, C.; Xu, C. Can Water Release from Local Reservoirs Cope with the Droughts of Downstream Lake in a Large River-Lake System? J. Hydrol. 2023, 625, 130172. [Google Scholar] [CrossRef]
  67. Li, Q.; Lai, G.; Devlin, A.T. A Review on the Driving Forces of Water Decline and Its Impacts on the Environment in Poyang Lake, China. J. Water Clim. Change 2021, 12, 1370–1391. [Google Scholar] [CrossRef]
  68. Ren, L.; He, Y.; Zhu, J.; Liu, Y.; Cai, W.; Yang, W.; Zhao, J.; Wu, C. Analysis on Driving Factors and Prediction of Dynamic Change of Poyang Lake Area. Energy Rep. 2024, 12, 495–503. [Google Scholar] [CrossRef]
  69. Wang, Z.; Yang, Y.; Chen, G.; Wu, J.; Wu, J. Variation of Lake-River-Aquifer Interactions Induced by Human Activity and Climatic Condition in Poyang Lake Basin, China. J. Hydrol. 2021, 595, 126058. [Google Scholar] [CrossRef]
  70. Yin, Y.; Xia, R.; Liu, X.; Chen, Y.; Song, J.; Dou, J. Spatial Response of Water Level and Quality Shows More Significant Heterogeneity during Dry Seasons in Large River-Connected Lakes. Sci. Rep. 2024, 14, 8373. [Google Scholar] [CrossRef]
  71. Jiang, W.; Liu, B.; Deng, Y.; Li, Y.; Shu, L.; Wang, W. Simulation of Surface Water—Groundwater Interaction in the Plain Area of the Poyang Lake Considering the Change of Water Body Area. Hydrogeol. Eng. Geol. 2023, 50, 95–104. [Google Scholar]
  72. Wang, Y.; Li, C.; Cui, Y.; Cui, Y.; Xu, Y.; Hora, T.; Zaveri, E.; Rodella, A.-S.; Bai, L.; Long, D. Spatial Downscaling of GRACE-Derived Groundwater Storage Changes across Diverse Climates and Human Interventions with Random Forests. J. Hydrol. 2024, 640, 131708. [Google Scholar] [CrossRef]
  73. Chao, N.; Li, F.; Yu, N.; Chen, G.; Wang, Z.; Ouyang, G.; Yeh, P.J.-F. Divergent Spatiotemporal Variability of Terrestrial Water Storage and Eight Hydroclimatic Components over Three Different Scales of the Yangtze River Basin. Sci. Total Environ. 2023, 879, 162886. [Google Scholar] [CrossRef] [PubMed]
  74. Guo, Y.; Gan, F.; Yan, B.; Bai, J.; Wang, F.; Jiang, R.; Xing, N.; Liu, Q. Evaluation of Groundwater Storage Depletion Using GRACE/GRACE Follow-On Data with Land Surface Models and Its Driving Factors in Haihe River Basin, China. Sustainability 2022, 14, 1108. [Google Scholar] [CrossRef]
  75. Zhong, Y.; Zhong, M.; Feng, W.; Zhang, Z.; Shen, Y.; Wu, D. Groundwater Depletion in the West Liaohe River Basin, China and Its Implications Revealed by GRACE and In Situ Measurements. Remote Sens. 2018, 10, 493. [Google Scholar] [CrossRef]
  76. Arshad, A.; Mirchi, A.; Taghvaeian, S.; AghaKouchak, A. Downscaled-GRACE Data Reveal Anthropogenic and Climate-Induced Water Storage Decline Across the Indus Basin. Water Resour. Res. 2024, 60, e2023WR035882. [Google Scholar] [CrossRef]
  77. Zhai, P.; Yu, R.; Guo, Y.; Li, Q.; Ren, X.; Wang, Y.; Xu, W.; Liu, Y.; Ding, Y. The Strong El Niño of 2015/16 and Its Dominant Impacts on Global and China’s Climate. J. Meteorol. Res. 2016, 30, 283–297. [Google Scholar] [CrossRef]
  78. Bian, Y.; Sun, P.; Zhang, Q.; Luo, M.; Liu, R. Amplification of Non-Stationary Drought to Heatwave Duration and Intensity in Eastern China: Spatiotemporal Pattern and Causes. J. Hydrol. 2022, 612, 128154. [Google Scholar] [CrossRef]
  79. Feng, W.; Leung, M.Y.-T.; Wang, D.; Zhou, W.; Zhang, O.Y.W. An Extreme Drought over South China in 2020/21 Concurrent with an Unprecedented Warm Northwest Pacific and La Niña. Adv. Atmos. Sci. 2022, 39, 1637–1649. [Google Scholar] [CrossRef]
  80. Tao, K.; Fang, J.; Yang, W.; Fang, J.; Liu, B. Characterizing Compound Floods from Heavy Rainfall and Upstream–Downstream Extreme Flow in Middle Yangtze River from 1980 to 2020. Nat. Hazards 2023, 115, 1097–1114. [Google Scholar] [CrossRef]
  81. Li, Y.; Zhang, Q.; Liu, X.; Tan, Z.; Yao, J. The Role of a Seasonal Lake Groups in the Complex Poyang Lake-Floodplain System (China): Insights into Hydrological Behaviors. J. Hydrol. 2019, 578, 124055. [Google Scholar] [CrossRef]
  82. Zhao, G.; Hörmann, G.; Fohrer, N.; Zhang, Z.; Zhai, J. Streamflow Trends and Climate Variability Impacts in Poyang Lake Basin, China. Water Resour. Manag. 2010, 24, 689–706. [Google Scholar] [CrossRef]
  83. Han, Y.; Ma, Z.; Li, M. Change Characteristics and Influencing Factors of Terrestrial Water Storage in the Beijing–Tianjin–Hebei Region in the Past 20 Years. Clim. Environ. Res. 2024, 5, 519–533. [Google Scholar]
  84. Li, Z.; Lu, C.; Zhang, Y.; Wu, C.; Liu, B.; Shu, L. Mechanisms of Evolution and Pollution Source Identification in Groundwater Quality of the Fen River Basin Driven by Precipitation. Sci. Total Environ. 2024, 952, 175893. [Google Scholar] [CrossRef]
  85. Huang, H.; Feng, G.; Cao, Y.; Feng, G.; Dai, Z.; Tian, P.; Wei, J.; Cai, X. Simulation and Driving Factor Analysis of Satellite-Observed Terrestrial Water Storage Anomaly in the Pearl River Basin Using Deep Learning. Remote Sens. 2023, 15, 3983. [Google Scholar] [CrossRef]
  86. Ferreira, V.G.; Yang, H.; Ndehedehe, C.; Wang, H.; Ge, Y.; Xu, J.; Xia, M.; Kalu, I.; Jing, M.; Agutu, N. Estimating Groundwater Recharge across Africa during 2003–2023 Using GRACE-Derived Groundwater Storage Changes. J. Hydrol. Reg. Stud. 2024, 56, 102046. [Google Scholar] [CrossRef]
  87. Wang, Y.; Gao, L.; Li, J.; Peng, X. Responses of Deep Soil Moisture to Direct Rainfall and Groundwater in the Red Soil Critical Zone: A Four-Stage Pattern. J. Hydrol. 2024, 632, 130864. [Google Scholar] [CrossRef]
  88. Jiang, W.; Liu, B.; Li, Y.; Lu, C.; Shu, L. The Effects of Damming and Dam Regulation on a River–Lake-Aquifer System: 3D Groundwater Flow Modeling of Poyang Lake (China). J. Hydrol. 2024, 636, 131311. [Google Scholar] [CrossRef]
  89. Wang, Y.; Molinos, J.G.; Shi, L.; Zhang, M.; Wu, Z.; Zhang, H.; Xu, J. Drivers and Changes of the Poyang Lake Wetland Ecosystem. Wetlands 2019, 39, 35–44. [Google Scholar] [CrossRef]
  90. Deng, S.; Wu, Q.; Wang, Z.; Wu, L.; Huang, Z.; Zhang, G. Investigating Flood Characteristics and Mitigation Measures in Plain-Type River-Connected Lakes: A Case Study of Poyang Lake. Water 2024, 16, 281. [Google Scholar] [CrossRef]
  91. Bai, H.; Wang, B.; Li, B.; Liu, Z.; Wen, Z.; Zhang, Y.; Xiao, F.; Xu, X.; Huang, Y. Multi-Period Early-Warning Precipitation Identification Method for the Easily Waterlogged Districts in Jiangxi Province, China. Theor. Appl. Climatol. 2024, 155, 2705–2718. [Google Scholar] [CrossRef]
  92. Qiu, J.; Shen, Z.; Xie, H. Drought Impacts on Hydrology and Water Quality under Climate Change. Sci. Total Environ. 2023, 858, 159854. [Google Scholar] [CrossRef]
  93. Shao, X.; Zhang, Y.; Ma, N.; Zhang, X.; Tian, J.; Xu, Z.; Liu, C. Drought-Induced Ecosystem Resistance and Recovery Observed at 118 Flux Tower Stations across the Globe. Agric. For. Meteorol. 2024, 356, 110170. [Google Scholar] [CrossRef]
  94. Mokhtar, A.; Jalali, M.; He, H.; Al-Ansari, N.; Elbeltagi, A.; Alsafadi, K.; Abdo, H.G.; Sammen, S.S.; Gyasi-Agyei, Y.; Rodrigo-Comino, J. Estimation of SPEI Meteorological Drought Using Machine Learning Algorithms. IEEE Access 2021, 9, 65503–65523. [Google Scholar] [CrossRef]
  95. Wang, Q.; Liu, X.; Wang, Z.; Zhao, L.; Zhang, Q. Time Scale Selection and Periodicity Analysis of Grassland Drought Monitoring Index in Inner Mongolia. Glob. Ecol. Conserv. 2022, 36, e02138. [Google Scholar] [CrossRef]
  96. Parsons, D.J.; Rey, D.; Tanguy, M.; Holman, I.P. Regional Variations in the Link between Drought Indices and Reported Agricultural Impacts of Drought. Agric. Syst. 2019, 173, 119–129. [Google Scholar] [CrossRef]
  97. Saemian, P.; Tourian, M.J.; Elmi, O.; Sneeuw, N.; AghaKouchak, A. A Probabilistic Approach to Characterizing Drought Using Satellite Gravimetry. Water Resour. Res. 2024, 60, e2023WR036873. [Google Scholar] [CrossRef]
  98. Rehana, S.; Monish, N.T. Characterization of Regional Drought Over Water and Energy Limited Zones of India Using Potential and Actual Evapotranspiration. Earth Space Sci. 2020, 7, e2020EA001264. [Google Scholar] [CrossRef]
  99. Xu, H.; Wang, X.; Zhao, C.; Shan, S.; Guo, J. Seasonal and Aridity Influences on the Relationships between Drought Indices and Hydrological Variables over China. Weather. Clim. Extrem. 2021, 34, 100393. [Google Scholar] [CrossRef]
  100. Lu, M.; Zhao, Q.; Ding, S.; Lu, X.; Jing, Y.; Wang, S.; Hong, Z.; Wang, A. Lag Response of Groundwater to Changes in Water and Sediment Characteristics in the Lower Yellow River, China. J. Hydrol. 2022, 612, 128048. [Google Scholar] [CrossRef]
  101. Ye, X.; Zhang, Q.; Liu, J.; Li, X.; Xu, C. Distinguishing the Relative Impacts of Climate Change and Human Activities on Variation of Streamflow in the Poyang Lake Catchment, China. J. Hydrol. 2013, 494, 83–95. [Google Scholar] [CrossRef]
  102. Hu, Z.; Zhang, Z.; Sang, Y.-F.; Qian, J.; Feng, W.; Chen, X.; Zhou, Q. Temporal and Spatial Variations in the Terrestrial Water Storage across Central Asia Based on Multiple Satellite Datasets and Global Hydrological Models. J. Hydrol 2021, 596, 126013. [Google Scholar] [CrossRef]
  103. Shi, Z.; Zheng, W.; Yin, W. Improving the Reliability of the Prediction of Terrestrial Water Storage in Yunnan Using the Artificial Neural Network Selective Joint Prediction Model. IEEE Access 2021, 9, 31865–31879. [Google Scholar] [CrossRef]
  104. Wold, S.; Sjöström, M.; Eriksson, L. PLS-Regression: A Basic Tool of Chemometrics. Chemom. Intell. Lab. Syst. 2001, 58, 109–130. [Google Scholar] [CrossRef]
  105. Woldesenbet, T.A.; Elagib, N.A.; Ribbe, L.; Heinrich, J. Hydrological Responses to Land Use/Cover Changes in the Source Region of the Upper Blue Nile Basin, Ethiopia. Sci. Total Environ. 2017, 575, 724–741. [Google Scholar] [CrossRef] [PubMed]
  106. Yin, W.; Zhang, G.; Han, S.-C.; Yeo, I.-Y.; Zhang, M. Improving the Resolution of GRACE-Based Water Storage Estimates Based on Machine Learning Downscaling Schemes. J. Hydrol 2022, 613, 128447. [Google Scholar] [CrossRef]
  107. Shi, Z.H.; Ai, L.; Li, X.; Huang, X.D.; Wu, G.L.; Liao, W. Partial Least-Squares Regression for Linking Land-Cover Patterns to Soil Erosion and Sediment Yield in Watersheds. J. Hydrol 2013, 498, 165–176. [Google Scholar] [CrossRef]
  108. Ma, R.; Cai, C.; Wang, J.; Wang, T.; Li, Z.; Xiao, T.; Peng, G. Partial Least Squares Regression for Linking Aggregate Pore Characteristics to the Detachment of Undisturbed Soil by Simulating Concentrated Flow in Ultisols (Subtropical China). J. Hydrol 2015, 524, 44–52. [Google Scholar] [CrossRef]
Figure 1. Study area with groundwater level monitoring stations.
Remotesensing 17 00988 g001
Figure 2. The research methodology consists of four main parts. (a) Filling missing observations in GRACE data using SSA. (b) Spatial downscaling of GRACE data using the CNN-A-LSTM model. (c) Calculating GWSA using the water balance equation. (d) Analyzing drought and flood impacts by calculating correlation coefficients (CC) among different drought types based on various indices, determining recovery times to normal water storage after extreme events, and computing the area proportions for each drought and flood classification using the groundwater drought index.
Remotesensing 17 00988 g002
Figure 3. Comparison of trends before and after downscaling. The GRACE mascon data used in this figure is the average of three mascon solutions: CSR, JPL, and GSFC. (a) TWSA in Jiangxi Province at a spatial resolution of 0.5° × 0.5° before downscaling (2003–2023). (b) TWSA in Jiangxi Province at a spatial resolution of 0.1° × 0.1° after downscaling (2003–2023). (c) TWSA in Poyang Lake at a spatial resolution of 0.1° × 0.1° after downscaling (2003–2023). (d) Correlation coefficient between measured groundwater level anomalies (GWLA) and downscaled GWSA.
Remotesensing 17 00988 g003
Figure 4. (ah) Spatial distribution of uncertainty (ad) and relative uncertainty (eh) of TWSA products calculated using the GTCH method for CSR, JPL, GSFC, and their average value (AVE). Spatial trends of TWSA for (i) CSR, (j) GSFC, (k) JPL, and (l) AVE. (m) presents the time series of TWSA in the Poyang Lake area, with CSR, GSFC, JPL, and AVE represented in blue, orange, green, and red, respectively. The slope (k) from least squares linear fitting indicates the rate of interannual TWSA change relative to time.
Remotesensing 17 00988 g004
Figure 5. (a) Monthly time series of GWSA in the Poyang Lake area, showing the spatial average GWSA over time (unit: mm). The shaded area represents the standard deviation of the average GWSA changes. Solid green and orange lines indicate arithmetic averages before and after 2014 (−177.5 mm and −151 mm, respectively), while dashed green and orange lines show linear fits for the same periods. (be) Spatial distribution of GWSA in spring, summer, fall, and winter, respectively.
Remotesensing 17 00988 g005
Figure 6. (a,b) GWS surplus and deficit rates during extreme hydrological drought and flood events in the Poyang Lake area. (c,d) Recovery times for floods and droughts, with red points indicating average recovery times and green points showing the shortest recovery times.
Remotesensing 17 00988 g006
Figure 7. Drought and flood phenomena in the Poyang Lake area are classified into four levels based on the SGSAI. The percentage of each level’s area relative to the total area is calculated by rasterizing the study area and counting the grid cells corresponding to each level. Orange shades represent drought, and blue shades represent flooding, with darker colors indicating greater severity.
Remotesensing 17 00988 g007
Figure 8. Correlation coefficients between meteorological drought (SPEI1, SPEI3, SPEI6, SPEI9, SPEI12, SPEI24, scPDSI), agricultural drought (EVI), and groundwater drought (SGSAI) in the Poyang Lake area from 2003 to 2021.
Remotesensing 17 00988 g008
Figure 9. Deviation rates of precipitation (P), evapotranspiration (ET), groundwater storage anomaly (GWSA), and groundwater runoff (GR) in the Poyang Lake area (2003–2023) relative to monthly climate characteristics, shown in green, yellow, blue, and red, respectively. The red curve represents the GWSA time series, while the blue curve indicates the monthly mean GWSA. Shaded blue and gray areas denote extreme flooding and drought periods, respectively.
Remotesensing 17 00988 g009
Table 1. Comparison of GRACE downscaling methods.
MethodR2CCRMSE (mm)
CNN-A-LSTM0.850.9441.3
CNN0.770.8851.7
LSTM0.750.8753.8
RF0.810.8941.6
SVM0.720.8656.3
XGBoost0.760.8749.7
ANN0.710.8758.1
Disclaimer/Publisher’s Note: The statements, opinions and data contained in all publications are solely those of the individual author(s) and contributor(s) and not of MDPI and/or the editor(s). MDPI and/or the editor(s) disclaim responsibility for any injury to people or property resulting from any ideas, methods, instructions or products referred to in the content.

