Article

CM-UNet++: A Multi-Level Information Optimized Network for Urban Water Body Extraction from High-Resolution Remote Sensing Imagery

1
National Engineering Research Center of Geographic Information System, China University of Geosciences, Wuhan 430074, China
2
School of Computer Science, China University of Geosciences, Wuhan 430074, China
3
Key Laboratory of Urban Land Resources Monitoring and Simulation, Ministry of Natural Resource, Shenzhen 518000, China
4
Engineering Research Center of Natural Resource Information Management and Digital Twin Engineering Software, Ministry of Education, Wuhan 430074, China
5
School of Geophysics and Geomatics, China University of Geosciences, Wuhan 430074, China
6
Anhui Urban & Rural Planning and Design Institute Co., Ltd., Hefei 230022, China
*
Author to whom correspondence should be addressed.
Remote Sens. 2025, 17(6), 980; https://doi.org/10.3390/rs17060980
Submission received: 9 January 2025 / Revised: 3 March 2025 / Accepted: 5 March 2025 / Published: 11 March 2025

Abstract

:
Urban water bodies are crucial in urban planning and flood detection, and they are susceptible to changes due to climate change and rapid urbanization. With the development of high-resolution remote sensing technology and the success of semantic segmentation using deep learning in computer vision, it is possible to extract urban water bodies from high-resolution remote sensing images. However, many urban water bodies are small, oddly shaped, silted, or spectrally similar to other objects, making their extraction extremely challenging. In this paper, we propose a neural network named CM-UNet++, a combination of the dense-skip module based on UNet++ and the CSMamba module to encode different levels’ information with interactions and then extract global and local information at each level. We use a size-weighted auxiliary loss function to balance feature maps of different levels. Additionally, features beyond RGB are incorporated into the input of the neural network to enhance the distinction between water bodies and other objects. We produced a labeled urban water extraction dataset, and experiments on this dataset show that CM-UNet++ attains 0.8781 on the IOU (intersection over union) metric, which indicates that this method outperforms other recent semantic segmentation methods and achieves better completeness, connectivity, and boundary accuracy. The proposed dense-skip module and CSMamba module significantly improve the extraction of small and spectrally indistinct water bodies. Furthermore, experiments on a public dataset confirm the method’s robustness.

Graphical Abstract

1. Introduction

Urban water body extraction is a task aimed at identifying the parts containing water bodies from remote sensing images of urban and nearby areas. With the development of remote sensing sensors, water bodies extracted from high-resolution remote sensing imagery (HRSI) have been widely used in urban planning [1] and flood detection [2]. Acquiring urban water body areas is essential in today’s climate change and urbanization process [3]. Meanwhile, accurate urban water body boundaries constitute a critical component of urban geographical information systems [4].
In the 20th century, water bodies were traditionally annotated manually [5], requiring substantial labor and material resources while being prone to errors and omissions. At the beginning of the 21st century, with the development of computer vision algorithms and deep learning, it became possible to successfully extract water bodies from HRSI. Researchers have proposed various water body extraction methods, mainly utilizing geometric, photometric, and textural features of water bodies [6]. Since water body extraction focuses on land cover classification rather than land-use analysis, pixels obscured by non-water surface objects such as boats, bridges, and siltation are excluded from the water body definition, resulting in time-consuming labeling processes. Therefore, developing an urban water body extraction method capable of handling diverse surrounding environments with limited labeled samples is of significant importance.
As 
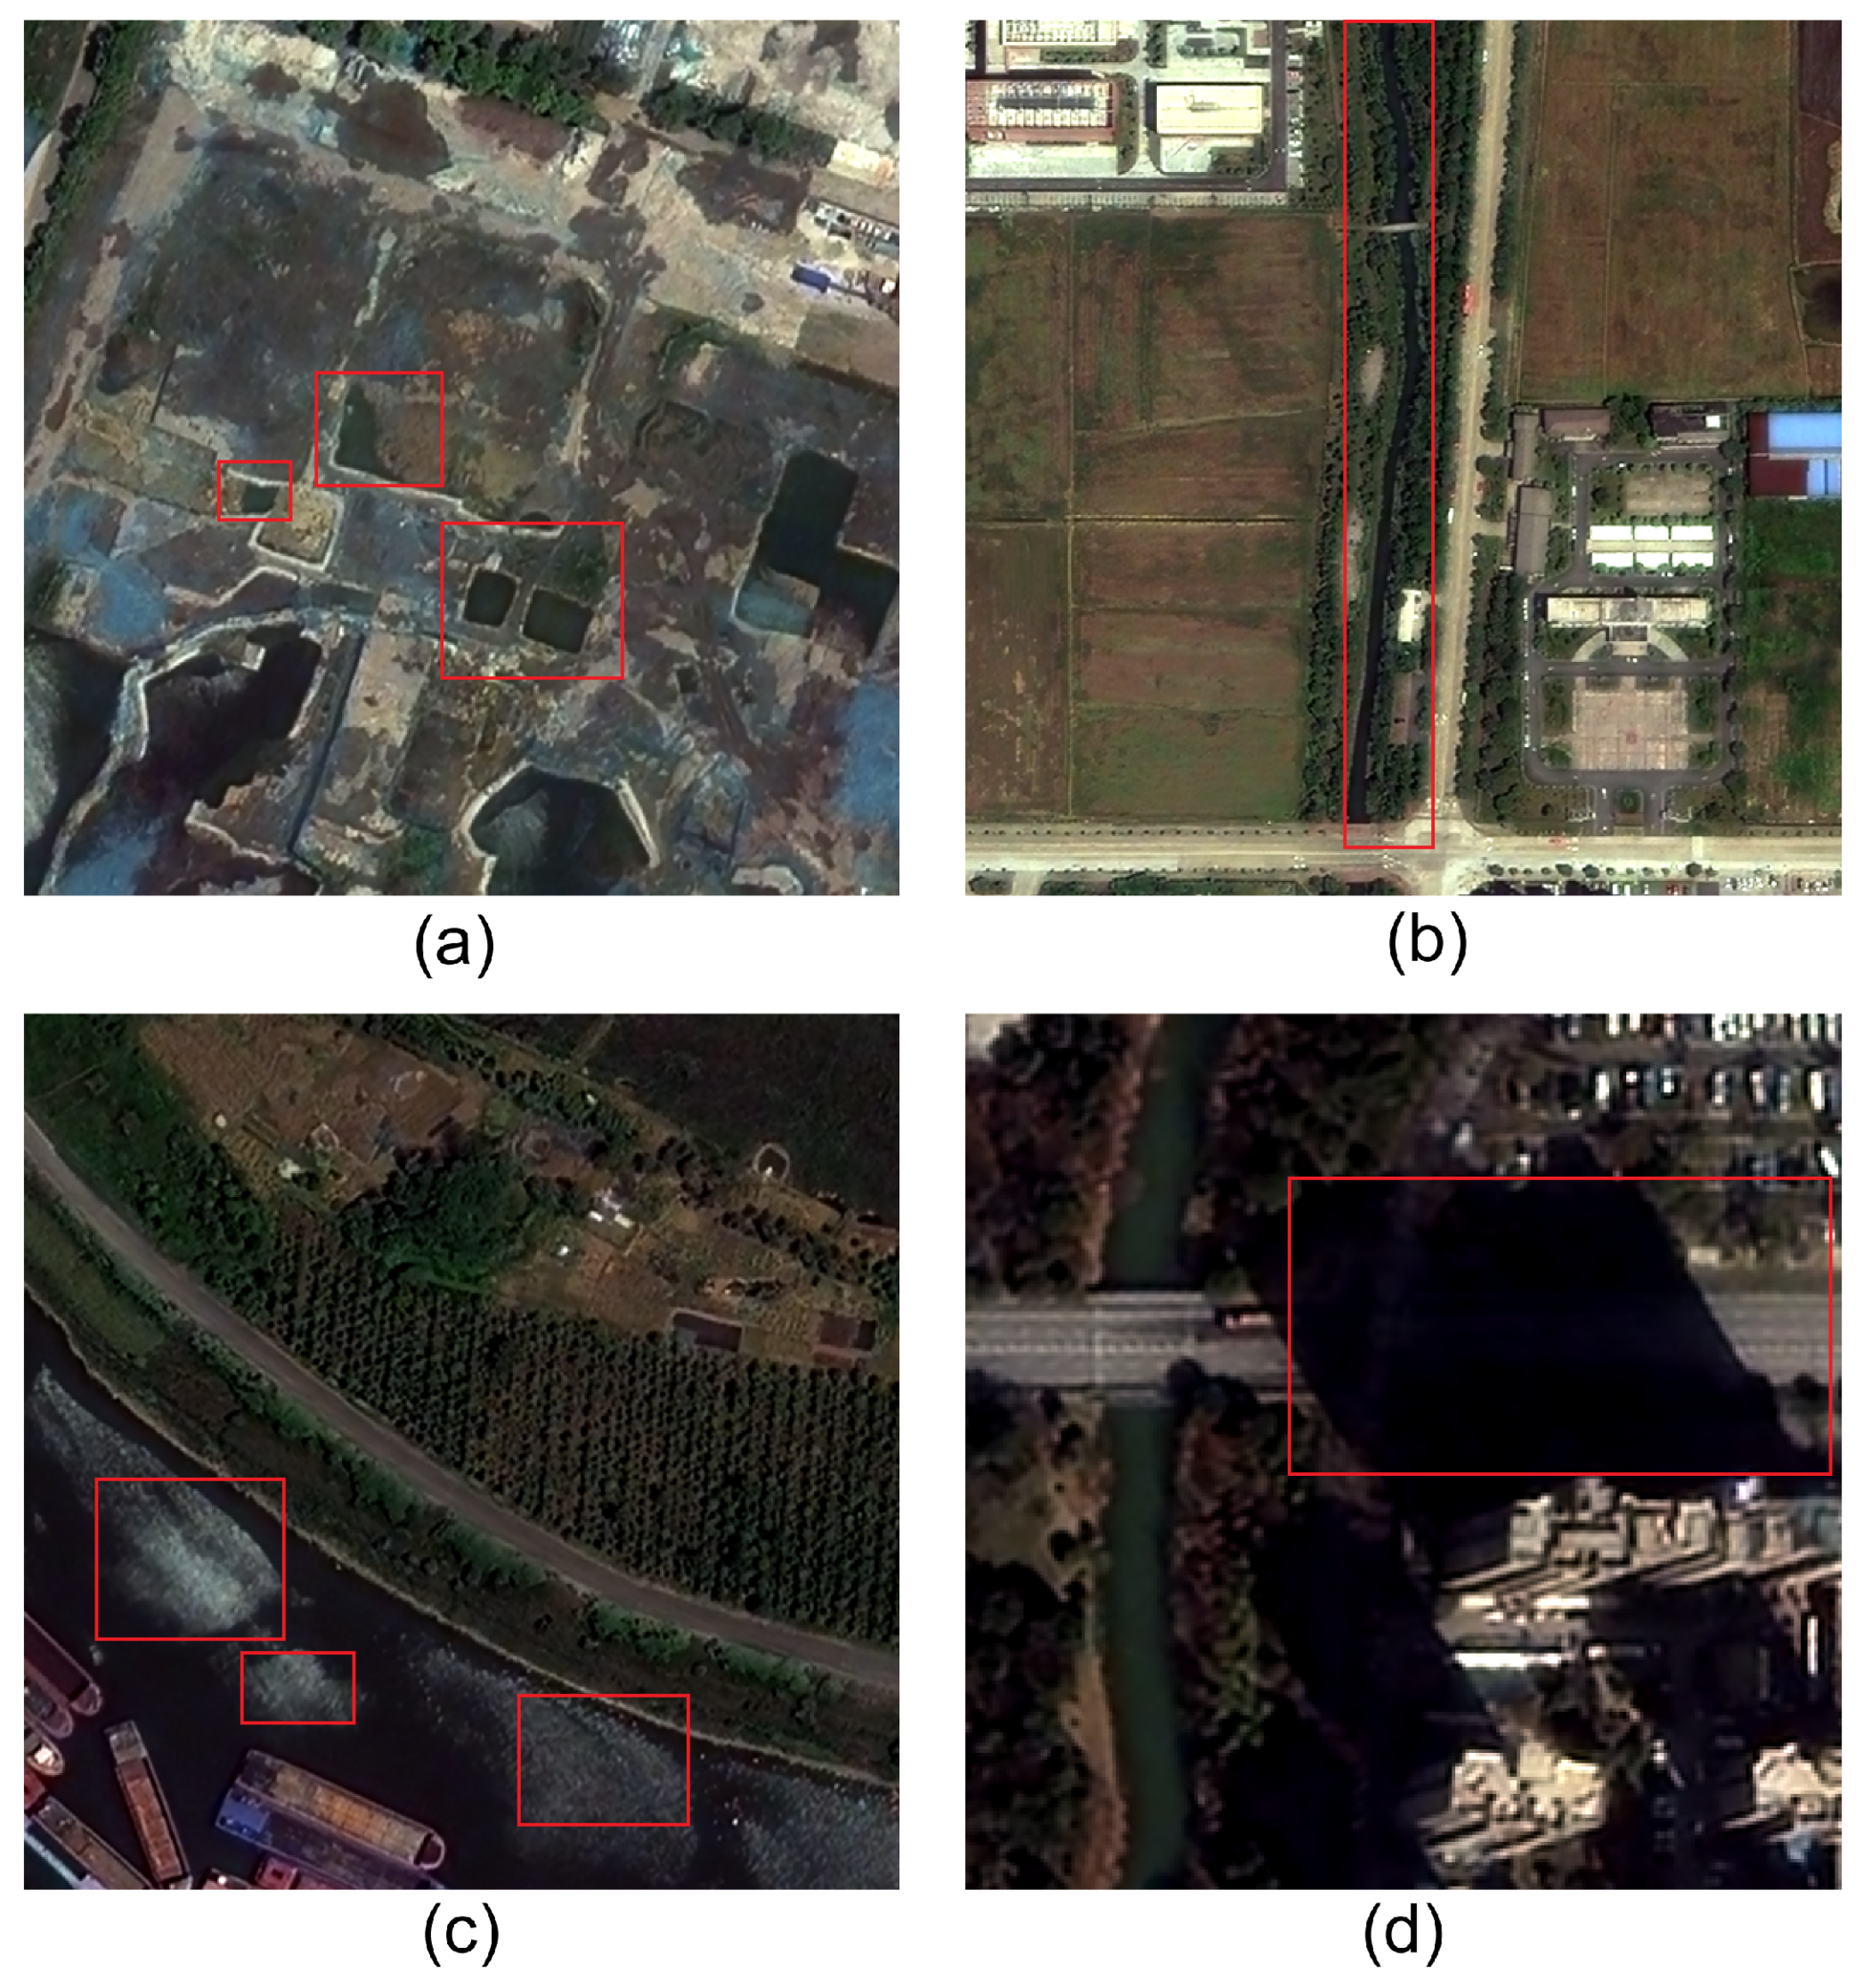
Figure 1 illustrates, urban water bodies possess more complex shapes and distributions than natural water bodies. Consequently, their extraction poses numerous challenges. Figure 1a shows that many small water bodies are on the construction site, which makes the encoding of these objects challenging. As shown in Figure 1b, tiny ditches, a category of specially shaped water bodies that are hard to encode, pass through the vicinity of the built-up area. In Figure 1c, seasonal siltation affects the surface of urban water bodies, further complicating boundary extraction. As depicted in Figure 1d, roads shaded by buildings, which share spectral similarities with certain water bodies, are prone to being misidentified as water. In summary, several urban water body extraction issues need to be addressed. First, urban water bodies are prone to sharing similar spectral characteristics in some bands with other objects, requiring fuller exploitation of spectral information. Then, the diversity of the urban water bodies’ surroundings and the number of small urban water bodies is significantly higher than that of natural water bodies, thus requiring a stronger ability to integrate information of different levels.
To address these challenges, we propose CM-UNet++, a neural network that contains CSMamba blocks and an encoder–decoder structure with a dense-skip module based on UNet++ for HRSI urban water body extraction. CM-UNet++ takes multiple features as input, using the dense-skip module to integrate low-level features into high-level feature maps. The CSMamba block subsequently extracts both global and local information from each layer’s features, while a size-weighted auxiliary (SWA) loss function balances the contributions of hierarchical features. The main contributions of this work are as follows:
(1) To enhance the ability to extract small and spectrally insignificant water bodies, we introduce a dense-skip module to make interactions between different levels’ feature maps, and we introduce the CSMamba module to enhance local–global information integration for each layer’s feature map.
(2) To balance the importance of high-level and low-level feature maps, the size-weighted auxiliary (SWA) loss function, a novel loss function modified by UNet-Former loss, is proposed. It considers the different sizes of each layer’s feature map and is proven to leverage the competence of our network.
(3) To verify the method’s validity, we created a labeled dataset of urban water bodies named the Anhui Urban Water Extraction Dataset (AUWED) encompassing parts of Hefei City, Lu’an City, and Yingshang County in Anhui, China, which represent large, medium, and small cities, respectively.
The remainder of this paper is organized as follows: Section 2 reviews related works, including the progress of water extraction methods and semantic segmentation methods. Section 3 presents the proposed method in this study, including the neural network structure, input features, and loss function. Section 4 describes the datasets, experimental details, evaluation metrics, experimental results, ablation study, and comparative study. In the subsection on the ablation study, three aspects are included: input features, network structure, and loss functions. The comparative study comprises comparisons of results on two datasets and computational complexity. Section 5 analyses results demonstrated in Section 4 from the perspective of principle. Section 6 summarizes the proposed method and analyses of experiments in this paper, then discusses the limitations of the study as well as prospects for future research.

2. Relevant Works

2.1. Traditional Water Extraction Methods

Traditional water extraction methods can be categorized into threshold-based methods and shallow classifier-based methods [7]. Threshold-based methods distinguish water bodies from non-water bodies based on their spectral features in remote sensing images and are usually applied to work on specific remote sensing sensors and tasks. They are usually obtained by band math with digital number values of different bands. For satellite remote sensors with RGB and NIR (near-infrared) bands, Mcfeeters (1996) proposed the NDWI (normalized difference water index) calculated by the green and NIR band features for remote sensing images containing visible and near-infrared bands [8]. Many other novel water indexes were modified from NDWI. To utilize the short-wave infrared band, Xu (2006) proposed the MNDWI (modified normalized difference water index) that replaced the near-infrared band with the short-wave infrared band [9]. To extract water from Landsat imagery, Guo et al. proposed a weighted normalized difference water index (WNDWI) based on indexes including NDWI and MNDWI [10]. Wu et al. (2022) utilized multi-spectral data by calculating several water indexes from sentinel-2 images to extract small water bodies [11].
With advances in computer vision, numerous remote sensing classification methods employing shallow classifiers emerged. These methods focus on the shape, edge, and texture features of remote sensing images. Friedl and Brodley (1997) proposed hybrid decision trees to solve land cover mapping problems [12]. To locate a specified threshold of water regions and extract them, Lv et al. used GLCM (gray-level co-occurrence matrix)-based features combined with SVM (supported vector machine) [13]. Mateo and Sudhir (2023) used an automatic k-means-based approach to mapping urban surface water bodies [14]. Bangira et al. (2019) compared the water extraction results using shallow classifiers and machine learning, stating that suspended siltations (turbidity), dissolved particles, and aquatic plants were important factors [15]. Shallow classifier-based methods enhance the classification process by quantifying pixel features, thereby offering advancement over data-specific threshold-based approaches. However, shallow classifiers are still limited in their capacity to autonomously learn input features when confronted with extensive and diverse datasets, which hinders the acquisition of deep-level feature representations.

2.2. Deep-Learning-Based Water Extraction Methods

Since deep neural networks can autonomously learn the deep-level features of images, deep-learning-based water extraction methods have gradually become the mainstream method for extracting water bodies from HRSI. Among all water body extraction methods based on neural networks so far, most of them focused on multiscale information integration. Duan and Hu (2019) proposed a novel multiscale refinement network (MSR-Net) containing a multiscale refinement scheme to extract water bodies from the Gaofen-Image dataset and the DeepGlobe dataset [16]. Wang et al. designed a multiscale convolutional neural network (MSCNN) based on convolutional neural networks (CNN) to extract urban water from Landsat images [17]. Guo et al. proposed a multi-scale water extraction convolutional neural network (MWEN) to extract water bodies from GaoFen-1 remote sensing images, which can handle water bodies of varying sizes [18]. Cheng et al. (2024) proposed the Ad-SegFormer network, which integrates the densely connected atrous spatial pyramid pooling module (DenseASPP) with Transformer [19,20] to precisely extract urban water bodies [21]. Some methods focus on the accuracy of the boundaries. Feng et al. combined U-Net and a conditional random field model to extract water bodies from HRSI, reducing salt-and-pepper noise and retaining the edge structures [22]. Miao et al. (2018) proposed a loss function with boundary constraint since the accuracy of the water body boundary is essential to the water body extraction task [23]. To achieve more precise segmentation of lake boundaries, Zhong et al. (2022) introduced a multilevel Transformer module to capture the contextual associations of boundary information through the self-attention mechanism [24]. A small portion of water body extraction methods focus on the refinement of pixels. Chen et al. (2018) proposed self-adaptive pooling convolutional neural networks that consider superpixels to extract urban water bodies from ZY-3 and GF-2 satellite imagery [25]. Chen et al. (2021) proposed the DT-1 network that used pixel pair matching to enhance segmentation precision [26]. These deep-learning-based water extraction methods have improved the accuracy of water body extraction compared to traditional approaches; however, they have not adequately addressed the extraction of small water bodies, rendering them less suitable for urban water body extraction. Kang et al. (2023) [27] comprehensively considered the aforementioned issues and proposed the WaterFormer network, which includes a dual-stream CNN, a cross-level Vision Transformer, a light-weight attention module, and a sub-pixel up-sampling module and leverages the effectiveness of extracting small, shadowed water bodies. Nevertheless, the task of water body extraction in urban areas retains several unique challenges. As illustrated in Figure 1a,d, scenarios involving small water bodies with insignificant spectral features in construction sites, as well as complex environments where roads, building shadows, and water bodies coexist, require more effective multi-level information fusion. Therefore, it is necessary to review the advancements in the field of semantic segmentation to explore a more appropriate approach.

2.3. Semantic Segmentation Methods

Deep-learning based water body extraction is an application of semantic segmentation. In the late 2010s, convolutional neural network (CNN)-based methods became the most popular methods in semantic segmentation tasks [28]. To realize medical image segmentation, Ronneberger et al. (2015) designed U-Net, a classical neural network with an encoder–decoder structure, where the input image is down-sampled using max-pooling in the decoder, and then the high-level and low-level semantic information is integrated into the decoder so that the boundaries can be recovered [29]. Zhou et al. (2018) proposed D-LinkNet, which contains a dilated convolution (atrous convolution) module to extract the roads from remote sensing images and enhance their connectivity [30]. Chen et al. (2018) proposed a Deeplabv3+ network with atrous spatial pyramid pooling (ASPP) that contains dilated convolution modules of different dilation rates to extract features of different sizes [31]. In summary, traditional CNN-based methods focus on integrating high-level and low-level features by artificially designed convolution kernels [32].
In recent years, neural networks with Transformer or Mamba [33,34] modules have gradually been introduced into semantic segmentation methods. Chen et al. (2021) proposed Trans-UNet to add a Vision Transformer block to the model, which learns the autocorrelation within the feature map through a self-attention mechanism and automatically assigns each pixel a different weight to learn the features of the input data [35]. The original Mamba model was designed to use sequential selective scanning to process 1-D data like NLP (natural language processing) tasks [33]. To make Mamba suitable for 2D imagery, Liu et al. (2024) [36] introduced the 2D selective scan module (2D-SSM) for image semantic segmentation, the image feature experiences flattening and four-direction scanning: from top-left to bottom-right, from bottom-right to top-left, from top-right to bottom-left, and from bottom-left to top-right. This approach captures long-range dependencies in each direction via the selective state-space model. Then, the direction sequences are merged to recover the 2D structure. Zhao et al. (2024) proposed RS-Mamba, a neural network designed for semantic segmentation and change detection tasks for remote sensing images, which includes the Mamba architecture to realize the global sensing field and improve the model’s linear complexity [37]. Liu et al. (2024) proposed CM-UNet, which combines the ResNet encoder with the CSMamba module to enhance the ability to integrate global and local information [38]. These methods broaden the receptive field relative to traditional CNN-based neural networks but do not sufficiently account for objects with unique sizes and shapes. Consequently, a hybrid approach integrating both types of methods should be contemplated. In Transformer architectures, the self-attention mechanism scans the entire encoded feature map [19]. In contrast, Mamba employs a selective scanning mechanism that compresses homogeneous features to reduce redundancy while focusing more on detailed features [33]. For urban water extraction tasks, which involve diverse target shapes and the high computational demands of remote sensing imagery, Mamba emerges as a more suitable choice compared to Transformer.

3. Methodology

In this section, we present the CM-UNet++ network structure depicted in Figure 2. The codes will be available at https://github.com/Cai-Jiangchen/CM-UNetPlusPlus, accessed on 1 March 2025.
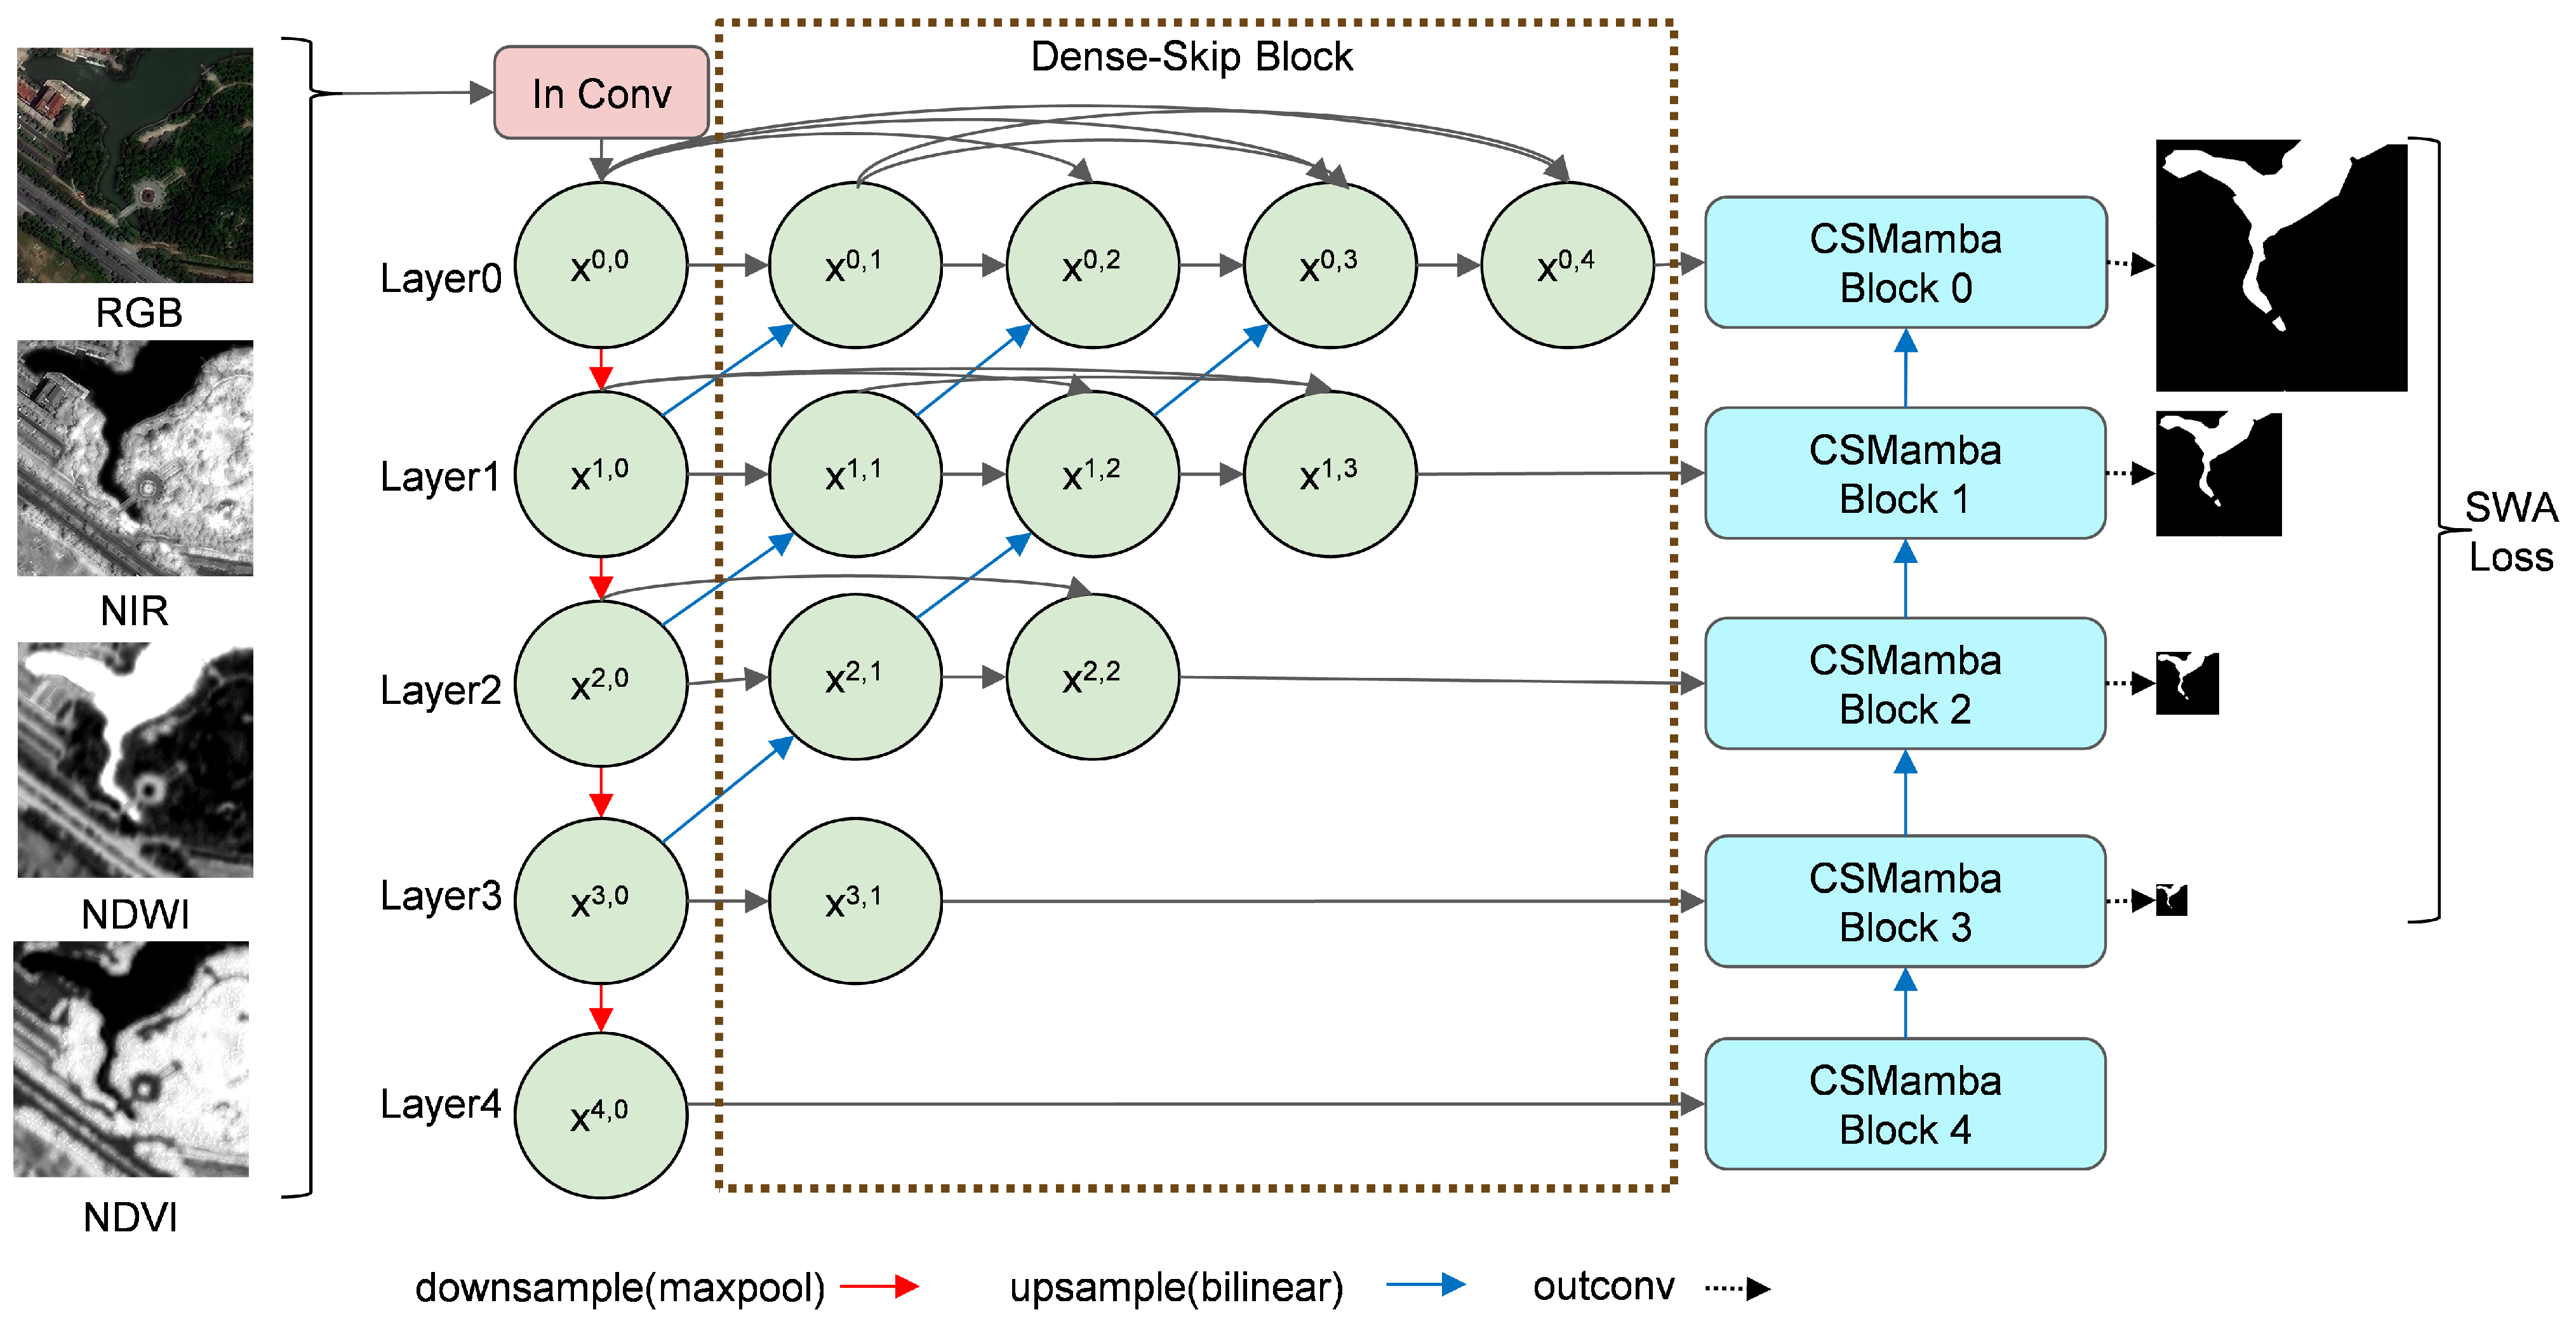
The network uses an encoder–decoder structure to build the model. In the encoder, the input multi-features are first subjected to channel expansion, and then semantic information is obtained at five different scales by max-pooling. The channels of the feature map after channel expansion and max-pooling are 32, 64, 128, 256, and 256, respectively. Then, the interactions between each level of semantics are realized through the dense-skip part and then through the CSMamba module. Each layer feature map output from the CSMamba module enters into the decoder, which realizes up-sampling through bilinear interpolation, concatenates with the previous layer features, and finally realizes the task of extracting water bodies integrating semantic information at different levels. Additionally, we introduce a novel loss function designed to optimize the semantic segmentation performance of the proposed method, and we discuss its mechanism and impact in detail.

3.1. Multi-Feature Input

Figure 3 shows visualization examples of NIR, NDWI, and NDVI (normalized difference vegetation index) [8] by linearly stretching their values to 0–255. As shown in Figure 3a, the building shadows have a comparatively higher NIR value than water bodies. As shown in Figure 3b, the siltation has a relatively lower NDWI value than the water body. As shown in Figure 3c, The NDVI values are higher for water bodies than agricultural land.
To fully utilize the HRSI data that include both the RGB and near-infrared bands, inspired by feature engineering [39], we utilize NDWI to enhance the network’s capability of distinguishing water from siltation, and we utilize NDVI [40] to enhance the network’s ability to distinguish water from vegetation.
N D W I = X g r e e n X n i r X g r e e n + X n i r
N D V I = X r e d X n i r X r e d + X n i r
In the equations above, X r e d , X g r e e n , and X n i r represent the digital number (DN) of the red band, green band, and near-infrared band recorded by satellite sensor, respectively.

3.2. Dense-Skip Block

To realize the interaction between different layers of feature maps obtained by max-pooling, we remodel the skip pathways module in UNet++ [41] to adjust it to our network’s structure. In U-Net [29], each layer of feature maps after max-pooling is directly connected to the decoder by skip, which makes the features extracted from each layer of feature maps more limited. We introduce a feature map with a dense convolution operation to the feature maps obtained after max-pooling in order to overcome this weakness by integrating low-level information into high-level feature maps.
Specifically, the dense-skip block is designed as follows: As shown in Figure 2, for the l-th layer (l = 0, 1, 2, 3, 4), each layer has 4 l feature-map nodes. Each layer’s first node is a feature map after the encoding convolution module operation, and the last node is followed by a CSMamba module. For the non-last node of each layer, each node will be connected to the next node of the previous layer through the convolution operation of up-sampling, and a copy of it is concatenated to all the nodes after this layer. In the following equation, X i n p u t represents the input image of the network, X l , m ( l = 0 , 1 , 2 , 3 , 4 ; m = 1 , 2 , 3 , 4 ) means the l-th layer’s m-th feature map node, and C o n c a t denotes concatenate operation.
X l , m = C o n c a t ( x l , m 1 , x l , m 2 , , x l , 0 , u p s a m p l e ( x l + 1 , m 1 ) ) , l + m < 4 C o n c a t ( x l , m 1 , x l , m 2 , , x l , 0 ) , l + m = 4

3.3. CSMamba Block

To extract complex and variable urban water bodies, both global and local information from each layer’s feature map should be integrated. With self-attention mechanisms, Transformer has demonstrated significant efficacy in various visual tasks [20]. However, Transformer-based approaches encounter the limitation of squared time complexity, which reduces the efficiency of processing large-scale HRSI data. To address this issue, it is necessary to introduce an approach that preserves the strengths of the Transformer architecture while minimizing the model’s explicit requirement for GPU memory. We introduced the CSMamba block (Figure 4) [38], which combines the feature-enhance module and the Mamba module, into our methods, where one branch is responsible for the implementation of the channel attention and spatial attention mechanisms, and the other branch is responsible for the integration of the feature maps of that level inside the global and local information.
X 1 = L N ( 2 D S S M ( S i L U ( D W C o n v ( L i n e a r ( X ) ) ) ) )
X 2 = ( S i L U ( ( C S ( X ) )
X o u t = L i n e a r ( X 1 X 2 )
In the equations above, DWConv is depth-wise convolution; CS represents the channel and spatial attention module, 2D-SSM means the 2D selective scan module, and ⊙ denotes the Hadamard product.

3.4. Size-Weighted Auxiliary Loss

A novel loss function, the size-weighted auxiliary loss (SWA loss), is proposed to leverage the feature extraction component of non-final feature maps, which takes the size of each layer’s feature map into consideration.
For neural networks with encoder–decoder structures with different layers of feature maps, some semantic segmentation neural networks, such as UNet-Former [42] and CM-UNet [38], have introduced multi-output supervision modules and proved that their methods’ effectiveness can be improved.
Specifically, convolution and softmax operations are performed on each intermediate layer feature map that enters the decoder. Then, the combination L l a y e r i of the dice loss L d i c e i and the standard cross-entropy loss L c e i is taken as the loss of the feature maps of that layer.
L l a y e r i = L d i c e i + L c e i
Finally, the layer loss function of the highest layer L l a y e r 0 and other layers L l a y e r i (i = 1, 2, 3) are linearly weighted according to a certain ratio as the final loss function.
L = L l a y e r 0 + i = 1 3 α i L l a y e r i
In UNet-Former, the weight α i for each layer is set to 0.4. However, only by linearly interpolating the non-final feature maps can we reach the same size as the data labels to calculate the loss function. A simple hypothesis is that the smaller the scale of the feature map, the greater the information loss in the linear interpolation process, so different weights α i of each layer’s feature map should be given. α i is set to the ratio of the layer’s feature map size S i to the feature map size of the highest layer S 0 .
α i = S i S 0 , i = 1 , 2 , 3

4. Experiments

4.1. Datasets

4.1.1. Anhui Urban Water Extraction Dataset (AUWED)

In order to verify the validity of our method and analyze the effectiveness of its modules, we produced the Anhui Urban Water Extraction Dataset (AUWED) from Jilin-1 remote sensing satellite data, with a resolution of 0.75 m. It contains data in four bands: blue, green, red, and near-infrared. We calculated NDVI and NDWI, and we labeled water bodies using ArcGIS 10.8. As shown in Figure 5, the AUWED dataset covers parts of Hefei City, Lu’an City, and Yingshang County in Anhui Province in China, which represent large, medium, and small cities, respectively.
To enhance the recognition ability of the band information, we linearly stretched each band’s data (including DN value of RGB, NIR along with NDWI and NDVI calculated by band-math) according to a threshold of 2%. Specifically, for each band, the highest 2% and the lowest 2% values of the pixels were assigned with the highest and lowest value, respectively. The pixels with the remaining 96% of the values were linearly stretched to generate the input features. Finally, we cut the above data according to a resolution of 512 × 512 and kept all the samples containing water body labels. For the three study regions, the dataset was randomly split into training and test sets at an 80:20 ratio, resulting in 1416 training samples and 351 test samples.

4.1.2. Kaggle Water Segmentation Dataset 2 (KWSD2)

To validate the robustness of our method for urban water body extraction, Kaggle Water Segmentation Dataset 2 (KWSD2), a water body dataset with labels available on Kaggle (https://www.kaggle.com/datasets/kaoyuu/kaoyuuu/data, accessed on 3 January 2025) was selected. As shown in Figure 6, this dataset contains some urban scenes.
This dataset contains a total of 1000 images of RGB channels and corresponding ground-truth labels. We divided this dataset into 800 training sets and 200 test sets. The original size of each image was 492 × 492, and we padded four edges with 10 pixels, making it 512 × 512 to input into the neural network. We binarized the labels as follows: Pixels with gray values above 127 were categorized as water, while other pixels were categorized as non-water.

4.2. Details and Evaluation Metrics

Experiments were conducted on a single NVIDIA 4090 GPU (Manufacturer: NVIDIA Corporation, Santa Clara, CA, USA) with the PyTorch 2.1 framework using the Windows 10 operating system. The AdamW optimizer was employed with an initial learning rate of 2 × 10 5 , and exponential decay was adopted to reduce the learning rate at each step. Data augmentation methods, including random flip and random rotation, were used in training. The batch size was 4 in the training process, and the maximum epoch was 150.
In these experiments, we introduced p r e c i s i o n , r e c a l l , F 1 , and I O U (intersection over union) to evaluate the method’s effectiveness.
p r e c i s i o n = T P T P + F P
r e c a l l = T P T P + F N
F 1 = 2 × p r e c i s i o n × r e c a l l p r e c i s i o n + r e c a l l
I O U = 2 × T P T P + F P + F N
In the equations above, for pixels of the water body, T P , F P , and F N denote true positive, false positive, and false negative pixels, respectively. Among all the metrics mentioned above, I O U is the most important evaluation metric in this study, as it incorporates both false positives ( F P ) and false negatives ( F N ), which are the two categories that were not accurately classified.

4.3. Experimental Results

The performance of our proposed CM-UNet++ network on the AUWED dataset and the KWSD2 dataset is shown in Table 1. The IOU on the AUWED dataset reached 0.8781, while on the KWSD2 dataset, it achieved 0.8956. Additionally, both precision and recall metrics are balanced on these two datasets, with differences less than 0.01.
As shown in Figure 7, CM-UNet++ achieved satisfactory results on the AUWED dataset even when dealing with objects that were spectrally insignificant to their surroundings or those that were small in size or had unique shapes. In Figure 7a, the water bodies and shadows of buildings were successfully distinguished. As shown in Figure 7b, the boundaries between water bodies and siltation or bridges were extracted with relatively high accuracy. Figure 7c demonstrates the successful extraction of water bodies that have similar spectral features to their surroundings. As depicted in Figure 7d, the narrow ditches and their boundaries were accurately extracted.
Figure 8 shows that CM-UNet++ achieved reasonable results on the KWSD2 dataset in the absence of NIR, NDVI, and NDWI. As shown in Figure 8a, the boundaries of a river and several small ponds were accurately extracted. Figure 8b,c demonstrate the successful extraction of slender water body branches. As depicted in Figure 8d, slender water bodies with less-distinct color contrast to their surroundings have been relatively successfully extracted.

4.4. Ablation Study

In this subsection, we verified the performance of the proposed CM-UNet++ from three perspectives. First, we investigated the impact of adding three input features: NIR band, NDWI, and NDVI. Subsequently, we focused on network structure and illustrated the effectiveness of the dense-skip module and CSMamba module. Finally, we conducted ablation experiments on loss functions to demonstrate the effects of auxiliary loss and size-weighted strategy.

4.4.1. Ablation Study on Input Features

To verify the effectiveness of NIR, NDWI, and NDVI, the ablation experiments on these features were carried out. As shown in Table 2, the inclusion of NIR, NDWI, and NDVI features improved the IOU metric by 0.83%, 0.47%, and 0.20%, respectively. Figure 9 shows that the increasing number of input features improved the results of water body extraction. First, with the introduction of the NIR band, water bodies and building shadows in Figure 9a were successfully distinguished, and building shadows were no longer misclassified as water bodies. Then, adding the NDWI index to the input features, the boundary between water bodies and siltation in Figure 9b was extracted more accurately, with some pixels of siltation not being misclassified as water. Finally, with the NDVI index added as an input feature, in Figure 9c, despite a pond with similar colors to the surrounding farmland, more pixels were classified correctly for water bodies.

4.4.2. Ablation Study on Network Structure

Ablation experiments on the dense-skip and CSMamba modules were carried out to verify their effectiveness. As shown in Table 3 and Table 4, the introduction of only the dense-skip module or CSMamba module slightly improved the IOU metric, while the combination of these modules improved it by 0.56% on the AUWED dataset and 0.81% on the KWSD2 dataset. Specifically, as illustrated in Figure 10, the introduction of the dense-skip module and CSMamba module made the network perform better on small water bodies and boundaries. In Figure 10a, U-Net fails to extract the pond located at the full image’s northern edge and the pond’s western half at the eastern edge of the image. The problem was not solved when only the dense-skip module (i.e., UNet++) was introduced. When the CSMamba module was introduced, parts of these two ponds were classified as water bodies. With the introduction of both modules (i.e., our proposed CM-UNet++), the boundaries of the ponds were closer to the ground-truth compared to the introduction of the CSMamba module only. As shown in Figure 10b, the boundary of the water body close to the bridge and the bank was accurately extracted only when both modules were introduced simultaneously. Figure 10c shows that the water bodies adjacent to brightly colored buildings and intersections were successfully extracted only when both modules were introduced simultaneously. As depicted in Figure 10d, U-Net partially failed to extract successfully for both ditches and was not improved by introducing the CSMamba module. More portions of the ditches were extracted when only the dense-skip module was introduced. When we introduced both modules, most parts of the ditches were extracted. Overall, the simultaneous use of dense-skip and CSMamba was superior to the use of a single module, and the improvement in water body boundaries was significant. In terms of improving the extraction of small water bodies, CSMamba more greatly improved the parts located at the edges of the image, while dense-skip more greatly improved the parts located in the center of the image.

4.4.3. Ablation Study on Loss Functions

To validate the effectiveness of SWA loss proposed in this paper, we compared this loss function with non-auxiliary loss and UNet-former loss as the ablation study. As shown in Table 5, compared to non-auxiliary loss and UNet-former loss, SWA loss improved the IOU metric by 0.22% and 0.33% on the AUWED dataset, respectively. Additionally, the SWA loss achieved a better balance between precision and recall, with a difference of only 0.12%, while the UNet-Former loss and non-auxiliary loss were 0.70% and 0.66%, respectively. As illustrated in Table 6, similar results were also observed on the KWSD2 dataset. The recall–precision difference of SWA loss was 0.77%, while those of both the non-auxiliary loss and UNet-former loss were greater than 1%. 
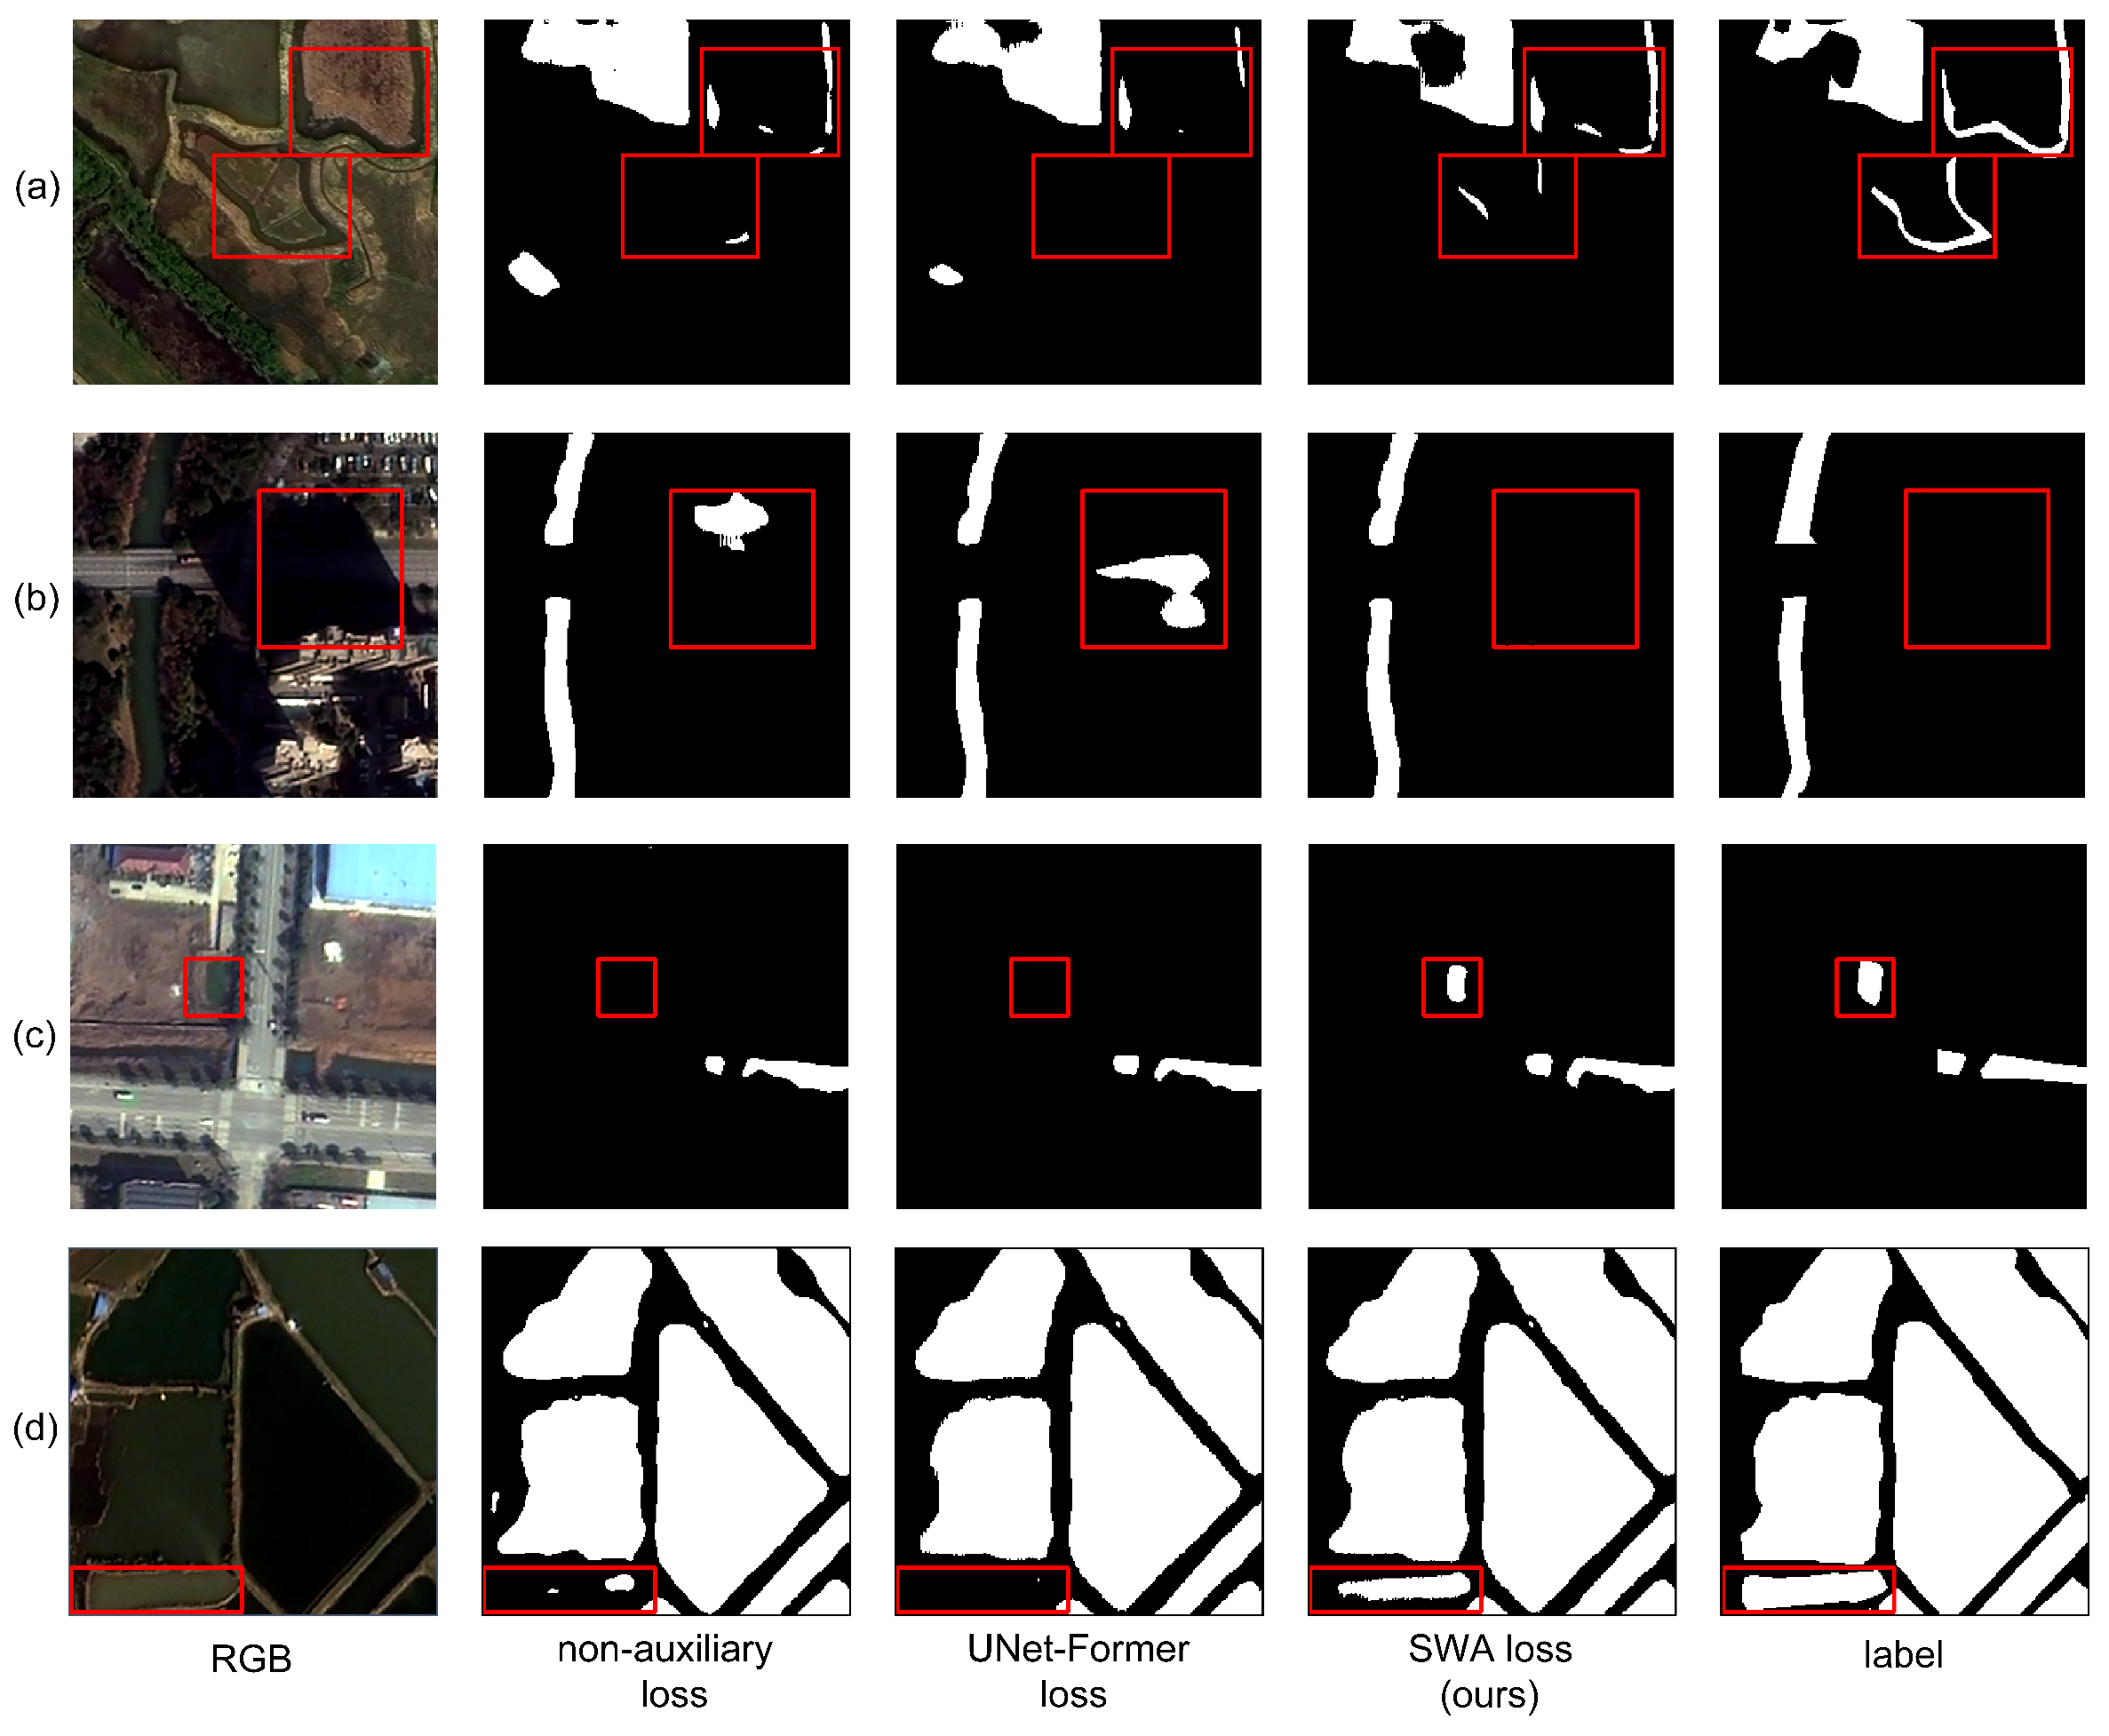
Figure 11 shows that the introduction of the SWA loss function successfully extracted some small or spectrally insignificant water bodies that non-auxiliary loss and UNet-former loss failed to. In Figure 11a, it performed better in siltations and ditches. As shown in Figure 11b, it did not misclassify the road as a water body, which was obscured by the shadow of the building. In Figure 11c, it successfully extracted a small water body near the center of the figure. As depicted in Figure 11d, a pond in the southwest corner that had a different color than other nearby water bodies was successfully extracted.

4.5. Comparative Study with Other Methods

In this subsection, we compared the performance of our proposed method with other semantic segmentation neural networks on the AUWED dataset and KWSD2 dataset in order to demonstrate the effectiveness of the proposed method.

4.5.1. Comparative Study with Other Methods on AUWED

To verify the effectiveness of our proposed method on this task, other methods that perform well in semantic segmentation tasks, including D-LinkNet [30], DeeplabV3+ [31], Trans-UNet [35], RS-Mamba [37], and CM-UNET [38], were compared. As demonstrated in Table 7, our proposed CM-UNet++ performed best in the recall, F1, and IOU metrics among these methods, with advantages of over 1% compared to other methods in IOU. CM-UNet++ ranked second in precision, lower than DeepLabv3+ by a margin of only 0.06%. Figure 12 shows the advantages of our proposed CM-UNet++ network over other semantic segmentation methods on the AUWED dataset, including completeness, connectivity, and boundary accuracy. As shown in Figure 12a,b, only CM-UNet++ extracted a water body whose narrow portion had no interruptions. DeeplabV3+, which contained atrous convolutions with multiple receptive field sizes, had the second best results, while the other models had more interruptions. As depicted in Figure 12c, for the water body that had insignificant color contrast with the nearby farmland, only CM-UNet++ successfully extracted most of it. In Figure 12d, CM-UNet++ successfully extracted the small water bodies, and their boundaries were closest to the ground-truth. In contrast, the CM-UNet, which also contained the CS-Mamba module, did not successfully extract some of the small water bodies. For the extraction of narrow parts of the water body, the second best performer after CM-UNet++ was DeeplabV3+.

4.5.2. Comparative Study with Other Methods on the KWSD2 Dataset

To validate the robustness of our method for urban water body extraction, experiments on the KWSD2 dataset that followed the same methods as Section 4.5.1 were conducted. The hyperparameters other than the input features were set to the same as AUWED. For all methods mentioned in Section 4.5.1, Table 8 shows similar results to Table 7. CM-UNet++ performed best in the recall, F1, and IOU metrics, and DeepLabv3+ ranked second in IOU. The KWSD2 dataset was also utilized in the study of Ad-SegFormer [21] without an open-source code, and we present these results together in Table 8. As illustrated in Figure 13, the CM-UNet++ network achieved better results than other methods on the KWSD2 dataset. CM-UNet++ and DeeplabV3+ performed well in terms of completeness, and CM-UNet++ was better for boundaries and special scenarios. As shown in Figure 13a, a small water body with insignificant contrast with its surroundings was successfully extracted only by CM-UNet++ with the closest boundary to the ground-truth. In Figure 13b, only CM-UNet++ and DeeplabV3+ successfully extracted the ditch on the north side of the image, while TransUNet and CM-UNet failed to extract the boundary of the light-colored pond on the south side of the image. As depicted in Figure 13c, for the end of the water body and the part blocked by artificial targets, CM-UNet++ performed significantly better than the other networks. Figure 13d shows that only CM-UNet++ and DeeplabV3+ successfully extracted the two narrow ditches on the west side of the image, and only CM-UNet++ successfully extracted the narrow water body at the southeast edge of the image. Ad-SegFormer achieved a slightly higher precision than CM-UNet++ on the KWSD2 dataset, indicating that fewer non-water pixels were misclassified as water. However, Ad-SegFormer underperformed compared to CM-UNet++ in other metrics, including IOU, notably with a significantly lower recall, meaning that a considerable number of water pixels failed to be correctly classified as water.

4.5.3. Computational Complexity Comparison

Table 9 and Figure 14 demonstrates the comparison of model complexities using two metrics: floating-point operation per second (FLOPs) and model parameters. Among the six methods, the FLOPs of our proposed CM-UNet++ rank second highest, while it has the lowest number of parameters and highest IOU. By learning a limited number of parameters, CM-UNet++ manages to perform relatively complex computations and achieves the best results in the task of urban water body extraction.

5. Discussion

Section 4.4.1 shows that NIR, NDWI, and NDVI enhance the network’s performance in different aspects. The introduction of NIR can distinguish between water bodies and building shadows because water bodies are sensitive to the NIR band. The introduction of NDWI can improve the impact of the experimental results because the values of NDWI in the siltations are different from those of water and can thus be used as important additional information to optimize the boundary between water and siltation. The introduction of NDVI can lead to better recognition of water bodies with vegetation nearby because water bodies that are less spectrally distinguishable from vegetation also have a lower value, so different representations of water and vegetation can be learned through the neural network. With the absence of NDVI, water pixels with more spectral features close to vegetation fail to be successfully extracted. This results in a slightly higher precision but lower recall and IOU. When both NDVI and NDWI are absent, the network’s learning of water features from the original bands becomes relatively more unstable. It tends to misclassify more non-water pixels as water, leading to a slightly higher recall but significantly lower precision and IOU.
As shown in Section 4.4.2, the introduction of the dense-skip module and CSMamba module resulted in a marginal increase in IOU but improved the networks’ performance on small water bodies and boundaries. Both the dense-skip module and the CSMamba module integrate features from different levels, but the former performs better in enhancing feature extraction near the center of the image, while the latter excels in improving feature extraction near the edges. This is because the dense-skip module enhances the interaction of different levels of feature maps. In contrast, the CSMamba module integrates global and local information for the interior of different levels of feature maps. The combined use of these two is equivalent to encoding more levels of feature maps with interaction capabilities and thus recovering a more complete set of features in the decoding process. The introduction of the dense-skip module is better for the extraction of small objects in the center of the image since the interaction of the different levels of the feature maps in the module contains a large number of convolutions, which can capture the association of each pixel with the different levels of features of its neighboring pixels, than without the module. CSMamba is better for the extraction of objects at the edges of the image because it is difficult for the pixels at the edges of the image to integrate their neighboring pixels through convolution directly and requires more global information as a reference, which is the strength of CSMamba. In addition, although U-Net and UNet++ achieved slightly higher values in precision or recall than CM-UNet++, they performed significantly worse in other metrics. This is because U-Net and UNet++, with only up-sampling, down-sampling, and connection operations, fail to obtain more robust feature maps compared to those obtained with CSMamba blocks. As a result, during network training, they are more prone to oscillation, and it is thus more difficult to achieve a balance between precision and recall.
As demonstrated in Section 4.4.3 the network exhibits enhanced capability in extracting detailed features when utilizing the SWA loss as the loss function, outperforming the cases without size-weighting and without auxiliary loss. The successful extraction of small water bodies and water bodies with insignificant spectral features relies on the integration of different levels of feature maps. Our proposed CM-UNet++ focuses on the integration of features at different levels, but it requires appropriate weights for the parameters in the network to be optimized. When the auxiliary loss is not used, low-level feature maps cannot be directly involved in supervision during training. In that case, global information is not fully utilized, and water bodies with insignificant spectral features are difficult to extract. If auxiliary loss is used, but the same weight is given to the non-final feature maps as in UNet-Former loss, it is equivalent to lowering the weight of the high-level feature maps considering the loss of information of the low-level feature maps in the up-sampling, which causes the small bodies of water to be ignored. Therefore, it is necessary to give different weights to different levels of feature maps.
As illustrated in Section 4.5, our proposed CM-UNet++ outperforms several other semantic segmentation methods commonly used in recent years on IOU. Nonetheless, a more detailed analysis of the results is still valuable. The results of DeeplabV3+ follow closely behind CM-UNet++. This is because DeeplabV3+ contains atrous convolutions with multi-scale receptive fields, and the essence of atrous convolution is to extend the receptive field in multiple directions, thus acquiring information from more distant pixels, which makes it suitable for the extraction of strip objects. It also achieves fusion of information at different scales to some extent. However, compared to DeeplabV3+, CM-UNet++ handles the edges of the image better because the higher layers of its encoder retain larger-sized feature maps and integrate the information of lower layers to them using the dense-skip module, finally optimizing the combination of global and local information within each layer of the feature maps through the CS-Mamba module. Thus, a more accurate representation of the image edge pixels can be learned. TransUNet and CM-UNet, which employ ResNet as their encoder, are incapable of generating feature maps of larger sizes, thereby hindering their ability to process more detailed information effectively and causing them to ignore some small water bodies. The cause for RS-Mamba’s failure to extract water bodies that are not distinctly different in spectral features from the surroundings is that, after the image is input into the model, it is directly subjected to patch-embedding and then fed into the Mamba module. Consequently, this neural network lacks the same degree of integration between high-level and low-level information as that in CM-UNet++. Ad-SegFormer, a water segmentation network based on Transformer, achieves a slightly higher precision but a markedly lower recall. The reason for the difference in results is that the Transformer module in Ad-SegFormer, with its self-attention mechanism, scans the entire encoded feature map, thereby more readily focusing on the more common features within each category. In contrast, the Mamba modules in CM-UNet++ employ a selective scanning mechanism to compress homogeneous features, reducing redundancy while paying more attention to detailed features. This enables the network to learn a more diverse set of water body features, leading to a larger number of water pixels being successfully classified. Similarly, in experiments on the KWSD2 dataset, the Trans-UNet, which also includes a Transformer module, exhibits a marked superiority in precision over recall.

6. Conclusions

In this study, we proposed CM-UNet++, a novel deep neural network that significantly improved urban water body extraction from high-resolution remote sensing images through the following innovations, especially in terms of the completeness, connectivity, and boundary accuracy of small and oddly shaped water bodies: First, a hierarchical fusion architecture was designed integrating dense-skip modules for multi-level feature interaction and CSMamba modules for global–local context encoding. Then, a size-weighted auxiliary (SWA) loss function was employed to balance feature maps’ importance of layers. Additionally, a multi-input strategy combining NIR, NDWI, and NDVI was adopted to enhance the network’s feature extraction abilities. Experiments on the newly labeled AUWED dataset demonstrated that CM-UNet++ outperforms existing methods. Validation on the KWSD2 dataset and computational complexity analysis further confirmed its robustness and practical efficiency.
Although we have improved the results of extracting urban water bodies using deep learning through the above aspects, some limitations remain. However, these limitations offer insights into potential avenues for future research. First of all, the distribution of urban water bodies is very fragmented and complicated in shape compared to natural water bodies, and it takes a long time for researchers to label water bodies. To address the data labeling bottleneck, developing semi-supervised and weakly supervised learning frameworks will become a trend. Subsequently, the significant variations in spatial resolution and spectral bands across different remote sensing platforms, as well as atmospheric conditions, affect the model’s generalizability. Therefore, multi-source datasets including LiDAR and crowdsourced data will be a point of future research on urban water extraction. Moreover, while the current framework demonstrates strong performance in static water body mapping, it lacks the capability to monitor dynamic seasonal variations for practical applications. This study has also only accomplished pixel-level water body extraction and has not advanced to the level of vector mapping. Future research will focus on water body vector mapping to better align with the practical requirements of urban mapping.

Author Contributions

Conceptualization, J.C. and Y.L.; methodology, J.C. and L.T.; software, J.C.; validation, J.C.; formal analysis, J.C.; investigation, J.C. and L.T.; resources, Y.L.; data curation, Y.L.; writing—original draft preparation, J.C.; visualization, J.C.; supervision, L.T.; project administration, L.T.; funding acquisition, L.T. All authors have read and agreed to the published version of the manuscript.

Funding

This research was supported by the Open Fund of the Key Laboratory of Urban Land Resources Monitoring and Simulation, Ministry of Natural Resources (No. KF-2023-08-18).

Data Availability Statement

The raw data presented in this study will be available on request from the corresponding author.

Conflicts of Interest

Author Yang Li was in Anhui Urban & Rural Planning and Design Institute Co., Ltd. The remaining authors declare that the research was conducted in the absence of any commercial or financial relationships that could be construed as a potential conflict of interest.

References

  1. Huang, X.; Xie, C.; Fang, X.; Zhang, L. Combining Pixel- and Object-Based Machine Learning for Identification of Water-Body Types From Urban High-Resolution Remote-Sensing Imagery. IEEE J. Sel. Top. Appl. Earth Obs. Remote Sens. 2015, 8, 2097–2110. [Google Scholar] [CrossRef]
  2. Albertini, C.; Gioia, A.; Iacobellis, V.; Manfreda, S. Detection of Surface Water and Floods with Multispectral Satellites. Remote Sens. 2022, 14, 6005. [Google Scholar] [CrossRef]
  3. Salerno, F.; Gaetano, V.; Gianni, T. Urbanization and climate change impacts on surface water quality: Enhancing the resilience by reducing impervious surfaces. Water Res. 2018, 144, 491–502. [Google Scholar] [CrossRef]
  4. Wang, X.; Xie, H. A Review on Applications of Remote Sensing and Geographic Information Systems (GIS) in Water Resources and Flood Risk Management. Water 2018, 10, 608. [Google Scholar] [CrossRef]
  5. Frazier, P.S.; Page, K.J. Water body detection and delineation with Landsat TM data. Photogramm. Eng. Remote Sens. 2000, 66, 1461–1468. [Google Scholar]
  6. Jawak, S.D.; Kulkarni, K.; Luis, A.J. A review on extraction of lakes from remotely sensed optical satellite data with a special focus on cryospheric lakes. Adv. Remote Sens. 2015, 4, 196–213. [Google Scholar] [CrossRef]
  7. Li, Y.; Dang, B.; Zhang, Y.; Du, Z. Water body classification from high-resolution optical remote sensing imagery: Achievements and perspectives. ISPRS J. Photogramm. Remote Sens. 2022, 187, 306–327. [Google Scholar] [CrossRef]
  8. McFeeters, S.K. The use of the Normalized Difference Water Index (NDWI) in the delineation of open water features. Int. J. Remote Sens. 1996, 17, 1425–1432. [Google Scholar] [CrossRef]
  9. Xu, H. Modification of normalised difference water index (NDWI) to enhance open water features in remotely sensed imagery. Int. J. Remote Sens. 2006, 27, 3025–3033. [Google Scholar] [CrossRef]
  10. Guo, Q.; Pu, R.; Li, J.; Cheng, J. A weighted normalized difference water index for water extraction using Landsat imagery. Int. J. Remote Sens. 2017, 38, 5430–5445. [Google Scholar] [CrossRef]
  11. Wu, Q.S.; Wang, M.X.; Shen, Q.; Yao, Y.; Li, J.S.; Zhang, F.F.; Zhou, Y.M. Small water body extraction method based on Sentinel-2 satellite multi-spectral remote sensing image. Natl. Remote Sens. Bull. 2022, 26, 781–794. [Google Scholar] [CrossRef]
  12. Friedl, M.A.; Brodley, C.E. Decision tree classification of land cover from remotely sensed data. Remote Sens. Environ. 1997, 61, 399–409. [Google Scholar] [CrossRef]
  13. Lv, W.; Yu, Q.; Yu, W. Water extraction in SAR images using GLCM and support vector machine. In Proceedings of the IEEE 10th International Conference on Signal Processing Proceedings, Beijing, China, 24–28 October 2010; pp. 740–743. [Google Scholar] [CrossRef]
  14. Gašparović, M.; Singh, S.K. Urban surface water bodies mapping using the automatic k-means based approach and sentinel-2 imagery. Geocarto Int. 2023, 38, 2148757. [Google Scholar] [CrossRef]
  15. Bangira, T.; Alfieri, S.M.; Menenti, M.; Van Niekerk, A. Comparing Thresholding with Machine Learning Classifiers for Mapping Complex Water. Remote Sens. 2019, 11, 1351. [Google Scholar] [CrossRef]
  16. Duan, L.; Hu, X. Multiscale Refinement Network for Water-Body Segmentation in High-Resolution Satellite Imagery. IEEE Geosci. Remote Sens. Lett. 2019, 17, 686–690. [Google Scholar] [CrossRef]
  17. Wang, Y.; Li, Z.; Zeng, C.; Xia, G.S.; Shen, H. An urban water extraction method combining deep learning and Google Earth engine. IEEE J. Sel. Top. Appl. Earth Obs. Remote Sens. 2020, 13, 769–782. [Google Scholar] [CrossRef]
  18. Guo, H.; He, G.; Jiang, W.; Yin, R.; Yan, L.; Leng, W. A Multi-Scale Water Extraction Convolutional Neural Network (MWEN) Method for GaoFen-1 Remote Sensing Images. ISPRS Int. J. Geo-Inf. 2020, 9, 189. [Google Scholar] [CrossRef]
  19. Vaswani, A.; Shazeer, N.; Parmar, N.; Uszkoreit, J.; Jones, L.; Gomez, A.N.; Kaiser, L.; Polosukhin, I. Attention is all you need. Proc. Adv. Neural Inf. Process. Syst. 2017, 30, 5998–6008. [Google Scholar]
  20. Han, K.; Wang, Y.; Chen, H.; Chen, X.; Guo, J.; Liu, Z.; Tang, Y.; Xiao, A.; Xu, C.; Xu, Y.; et al. A Survey on Vision Transformer. IEEE Trans. Pattern Anal. Mach. Intell. 2022, 45, 87–110. [Google Scholar] [CrossRef]
  21. Cheng, X.; Zhu, Q.; Song, Y.; Yang, J.; Wang, T.; Zhao, B.; Shen, Z. Precise City-Scale Urban Water Body Semantic Segmentation and Open-Source Sampleset Construction Based on Very High-Resolution Remote Sensing: A Case Study in Chengdu. Remote Sens. 2024, 16, 3873. [Google Scholar] [CrossRef]
  22. Feng, W.; Sui, H.; Huang, W.; Xu, C.; An, K. Water Body Extraction From Very High-Resolution Remote Sensing Imagery Using Deep U-Net and a Superpixel-Based Conditional Random Field Model. IEEE Geosci. Remote Sens. Lett. 2018, 16, 618–622. [Google Scholar] [CrossRef]
  23. Miao, Z.; Fu, K.; Sun, H.; Sun, X.; Yan, M. Automatic water-body segmentation from high-resolution satellite images via deep networks. IEEE Geosci. Remote Sens. Lett. 2018, 15, 602–606. [Google Scholar] [CrossRef]
  24. Zhong, H.F.; Sun, Q.; Sun, H.M.; Jia, R.S. NT-Net: A semantic segmentation network for extracting lake water bodies from optical remote sensing images based on transformer. IEEE Trans. Geosci. Remote Sens. 2022, 60, 1–13. [Google Scholar] [CrossRef]
  25. Chen, Y.; Fan, R.; Yang, X.; Wang, J.; Latif, A. Extraction of Urban Water Bodies from High-Resolution Remote-Sensing Imagery Using Deep Learning. Water 2018, 10, 585. [Google Scholar] [CrossRef]
  26. Chen, S.; Liu, Y.; Zhang, C. Water-body segmentation for multi-spectral remote sensing images by feature pyramid enhancement and pixel pair matching. Int. J. Remote Sens. 2021, 42, 5025–5043. [Google Scholar] [CrossRef]
  27. Kang, J.; Guan, H.; Ma, L.; Wang, L.; Xu, Z.; Li, J. WaterFormer: A coupled transformer and CNN network for waterbody detection in optical remotely-sensed imagery. ISPRS J. Photogramm. Remote Sens. 2023, 206, 222–241. [Google Scholar] [CrossRef]
  28. Ulku, I.; Akagündüz, E. A Survey on Deep Learning-based Architectures for Semantic Segmentation on 2D Images. Appl. Artif. Intell. 2022, 36, 2032924. [Google Scholar] [CrossRef]
  29. Ronneberger, O.; Fischer, P.; Brox, T. U-net: Convolutional networks for biomedical image segmentation. In Proceedings of the International Conference on Medical Image Computing and Computer-Assisted Intervention, Munich, Germany, 5–9 October 2015; Springer: Berlin/Heidelberg, Germany, 2015; pp. 234–241. [Google Scholar] [CrossRef]
  30. Zhou, L.; Zhang, C.; Wu, M. D-LinkNet: LinkNet With Pretrained Encoder and Dilated Convolution for High Resolution Satellite Imagery Road Extraction. In Proceedings of the 2018 IEEE/CVF Conference on Computer Vision and Pattern Recognition Workshops (CVPRW), Salt Lake City, UT, USA, 18–22 June 2018; pp. 182–186. [Google Scholar]
  31. Chen, L.C.; Zhu, Y.; Papandreou, G.; Schroff, F.; Adam, H. Encoder-Decoder with Atrous Separable Convolution for Semantic Image Segmentation. In Proceedings of the European Conference on Computer Vision, Munich, Germany, 8–14 September 2018; pp. 801–818. [Google Scholar]
  32. Zhao, X.; Wang, L.; Zhang, Y.; Han, X.; Deveci, M.; Parmar, M. A review of convolutional neural networks in computer vision. Artif. Intell. Rev. 2024, 57, 99. [Google Scholar] [CrossRef]
  33. Gu, A.; Dao, T. Mamba: Linear-time sequence modeling with selective state spaces. arXiv 2023, arXiv:2312.00752. [Google Scholar] [CrossRef]
  34. Xu, R.; Yang, S.; Wang, Y.; Du, B.; Chen, H. Visual Mamba: A Survey and New Outlooks. arXiv 2024, arXiv:2404.18861. [Google Scholar] [CrossRef]
  35. Chen, J.; Lu, Y.; Yu, Q.; Luo, X.; Adeli, E.; Wang, Y.; Lu, L.; Yuille, A.L.; Zhou, Y. Transunet: Transformers make strong encoders for medical image segmentation. arXiv 2021, arXiv:2102.04306. [Google Scholar] [CrossRef]
  36. Liu, Y.; Tian, Y.; Zhao, Y.; Yu, H.; Xie, L.; Wang, Y.; Ye, Q.; Liu, Y. Vmamba: Visual state space model 2024. arXiv 2024, arXiv:2401.10166. [Google Scholar] [CrossRef]
  37. Zhao, S.; Chen, H.; Zhang, X.; Xiao, P.; Bai, L.; Ouyang, W. Rs-mamba for large remote sensing image dense prediction. arXiv 2024, arXiv:2404.02668. [Google Scholar] [CrossRef]
  38. Liu, M.; Dan, J.; Lu, Z.; Yu, Y.; Li, Y.; Li, X. CM-UNet: Hybrid CNN-Mamba UNet for Remote Sensing Image Semantic Segmentation. arXiv 2024, arXiv:2405.10530. [Google Scholar] [CrossRef]
  39. Nargesian, F.; Samulowitz, H.; Khurana, U.; Khalil, E.B.; Turaga, D.S. Learning Feature Engineering for Classification. In Proceedings of the Twenty-Sixth International Joint Conference on Artificial Intelligence (IJCAI 2017), Melbourne, Australia, 19–25 August 2017; Volume 17, pp. 2529–2535. [Google Scholar] [CrossRef]
  40. Kriegler, F.J.; Malila, W.A.; Nalepka, R.F.; Richardson, W. Preprocessing Transformations and Their Effects on Multispectral Recognition. In Proceedings of the Sixth International Symposium on Remote Sensing of Environment, Ann Arbor, MI, USA, 13–16 October 1969; pp. 97–131. [Google Scholar]
  41. Zhou, Z.; Siddiquee, M.M.R.; Tajbakhsh, N.; Liang, J. Unet++: Redesigning skip connections to exploit multiscale features in image segmentation. IEEE Trans. Med Imaging 2019, 39, 1856–1867. [Google Scholar] [CrossRef]
  42. Wang, L.; Li, R.; Zhang, C.; Fang, S.; Duan, C.; Meng, X.; Atkinson, P.M. UNetFormer: A UNet-like Transformer for Efficient Semantic Segmentation of Remote Sensing Urban Scene Imagery. ISPRS J. Photogramm. Remote Sens. 2022, 190, 196–214. [Google Scholar] [CrossRef]
Figure 1. Examples of urban water bodies. (a): Small water bodies on the construction site; (b): Tiny ditches; (c): Seasonal siltation (d): Roads shaded by buildings that spectral similar to water. Corresponding areas are marked with red boxes.
Remotesensing 17 00980 g001
Figure 2. The structure of the proposed CM-UNet++ network.
Remotesensing 17 00980 g002
Figure 3. Visualization examples of NIR, NDWI, and NDVI. (a): NIR for water and shadows; (b): NDWI for water and siltation; (c): NDVI for water and agricultural land.
Remotesensing 17 00980 g003
Figure 4. CSMamba Block.
Remotesensing 17 00980 g004
Figure 5. Visualization examples of the AUWED dataset. (a): Hefei City; (b): Lu’an City; (c): Yingshang County.
Remotesensing 17 00980 g005
Figure 6. Visualization examples of the KWSD2 dataset. (a): Water bodies near residential areas; (b): Water bodies near roads; (c): Small ponds in urban areas.
Remotesensing 17 00980 g006
Figure 7. Examples of results from CM-UNet++ on the AUWED dataset. (a): Water bodies near building shadows; (b): Water bodies near siltation and bridges; (c): Water bodies with spectrally similar surroundings; (d): Narrow ditches.
Remotesensing 17 00980 g007
Figure 8. Examples of results from CM-UNet++ on the KWSD2 dataset. (a): River and small ponds; (b,c): Water body with slender branches; (d): Slender water bodies with spectrally insignificant surroundings.
Remotesensing 17 00980 g008
Figure 9. Examples of results from the ablation study on input features. (a): NIR distinguished water from shadows; (b): NDWI significantly reduced the portion of siltation misclassified as water; (c): NDVI improved discrimination between farmland and water bodies. Corresponding areas are marked with red boxes.
Remotesensing 17 00980 g009
Figure 10. Examples of results from the ablation study on network structure. (a): Network without CSMamba block failed to extract water bodies near the edge; (b): Only when both modules introduced, boundary of the water body near the bank and bridge was accurately extracted; (c): The small water body adjacent to a bright building was successfully extracted only when both modules included; (d): Dense-skip module enhanced the network’s competence of extracting ditches. Corresponding areas are marked with red boxes.
Remotesensing 17 00980 g010
Figure 11. Examples of results from the ablation study on loss functions. (a): SWA loss improved the completeness of ditches and precludes siltation; (b): SWA loss successfully distinguished water from roads and shadows; (c): SWA loss enhanced the ability of extracting small water bodies; (d): SWA loss improved the recognition capability of water bodies spectrally different to others. Corresponding areas are marked with red boxes.
Remotesensing 17 00980 g011
Figure 12. Examples of comparative results with other semantic segmentation methods on the AUWED dataset. (a,b): CM-UNet++ and DeeplabV3+ are more effective for extracting narrow water bodies than other methods; (c): Only CM-UNet++ successfully extracted most part of the spectrally insignificant pond; (d): CM-UNet++ performs well for boundaries than other methods. Corresponding areas are marked with red boxes.
Remotesensing 17 00980 g012
Figure 13. Examples of comparative results with other semantic segmentation methods on the KWSD2 dataset. (a): CM-UNet++ performed well in boundaries with spectrally insignificant surroundings than other methods; (b): CM-UNet++ and DeeplabV3+ successfully extracted the ditch; (c): CM-UNet++ performed significantly better than other methods for the end of water body and the part blocked by artificial targets; (d): CM-UNet++ successfully extracted narrow water bodies at the corner and center. Corresponding areas are marked with red boxes.
Remotesensing 17 00980 g013
Figure 14. Visualization of comparisons of FLOPs, model parameters, and IOU.
Remotesensing 17 00980 g014
Table 1. Results of CM-UNet++ on the AUWED dataset and KWSD2 dataset.
DatasetPrecisionRecallF1IOU
AUWED0.93570.93450.93510.8781
KWSD20.94110.94880.94490.8956
Table 2. Results from the ablation study on input features using the AUWED dataset.
FeaturesNIRNDWINDVIPrecisionRecallF1IOU
3(RGB)×××0.92940.92370.92650.8631
4××0.92280.93990.93130.8714
5×0.93780.93010.93390.8761
60.93570.93450.93510.8781
Bolded items are the highest values for each metric.
Table 3. Results from the ablation study on network structure using the AUWED dataset.
MethodDense-SkipCSMambaPrecisionRecallF1IOU
U-Net××0.93580.92810.93190.8725
UNet++×0.92410.94140.93270.8738
U-Net+CSMamba×0.93210.93310.93260.8737
CM-UNet++(ours)0.93570.93450.93510.8781
Bolded items are the highest values for each metric.
Table 4. Results from the ablation study on network structure using the KWSD2 dataset.
MethodDense-SkipCSMambaPrecisionRecallF1IOU
U-Net××0.93430.94660.94040.8875
UNet++×0.93510.94850.94180.8899
U-Net+CSMamba×0.94840.93690.94260.8914
CM-UNet++(ours)0.94110.94880.94490.8956
Bolded items are the highest values for each metric.
Table 5. Results from the ablation study on loss functions using the AUWED dataset.
Loss FunctionAuxiliarySize-WeightedPrecisionRecallF1IOU
non-auxiliary××0.92990.93650.93320.8748
UNet-Former×0.93740.93040.93390.8759
SWA(ours)0.93570.93450.93510.8781
Bolded items are the highest values for each metric.
Table 6. Results from the ablation study on loss functions using the KWSD2 dataset.
Loss FunctionAuxiliarySize-WeightedPrecisionRecallF1IOU
non-auxiliary××0.95030.93140.94070.8881
UNet-Former×0.94790.93810.94300.8921
SWA(ours)0.94110.94880.94490.8956
Bolded items are the highest values for each metric.
Table 7. Comparative results with other semantic segmentation methods on the AUWED dataset.
MethodPrecisionRecallF1IOU
D-LinkNet0.92530.92630.92580.8619
DeepLabv3+0.93630.91740.92670.8635
TransUNet0.91350.93110.92220.8557
RS-Mamba0.93190.92180.92680.8636
CM-UNet0.91920.92750.92340.8576
CM-UNet++(ours)0.93570.93450.93510.8781
Bolded items are the highest values for each metric.
Table 8. Comparative results with other semantic segmentation methods on the KWSD2 dataset.
MethodPrecisionRecallF1IOU
D-LinkNet0.93490.92110.92800.8656
DeepLabv3+0.94300.93930.94110.8888
TransUNet0.94350.92860.93600.8796
RS-Mamba0.93500.91980.92730.8645
CM-UNet0.92840.92320.92580.8619
Ad-SegFormer0.95220.93420.94290.8941
CM-UNet++(ours)0.94110.94880.94490.8956
Bolded items are the highest values for each metric.
Table 9. Computational complexity analysis measured on four, six-channel 512 × 512 images on a single NVIDIA 4090 GPU with IOU evaluated on the AUWED dataset.
MethodFLOPs(G)Param. (M)IOU
D-LinkNet136.8131.110.8619
DeepLabv3+1008.1058.760.8635
TransUNet517.1793.230.8557
RS-Mamba149.8640.730.8636
CM-UNet53.1213.550.8576
CM-UNet++(ours)571.816.710.8781
Bolded items are the highest values for FLOPs and IOU, and lowest values for parameters.
Disclaimer/Publisher’s Note: The statements, opinions and data contained in all publications are solely those of the individual author(s) and contributor(s) and not of MDPI and/or the editor(s). MDPI and/or the editor(s) disclaim responsibility for any injury to people or property resulting from any ideas, methods, instructions or products referred to in the content.

