Abstract
Hops are an essential raw material for beer production and the Czech Republic is not only a traditional hop grower but also participates in the breeding of varieties that are important on a global scale, mainly in terms of quality. The presented study deals with the evaluation of selected varieties grown in conventional and organic management over 4 years (2020–2023). The main contribution of this paper lies in the fact that remote sensing data of hop gardens were obtained by UAV during the growing seasons for four consecutive years and were subsequently used to explain the development of hop stands with respect to their yield and production quality. Hop fields were scanned using a UAV with a multispectral camera and the vegetation indices NDVI, GNDVI, NDRE, CIR and SAVI were derived. These indices were used as indirect indicators for determining vitality, health and structure for predicting yield and quality parameters (alpha acid content in hop cones). Based on statistical analysis it was concluded that in terms of yield assessment, spectral indices can explain hop yields up to 61%, with better results being achieved in the later stages of growth development. However, spectral indices are only able to explain a maximum of 18% of qualitative parameters. On the contrary, the maximum was reached in the early stages of stand development. UAV scanning monitors the canopies of hop stands with high resolution, similar to vineyards. Indices evaluating chlorophyll content appeared to be more suitable for affecting differences between hop stands.
1. Introduction
Hop (Humulus lupulus L.) is an indispensable raw material for the brewing industry, as hop cones are essential for imparting bitterness, flavour and sensory stability to beer [1,2]. According to data from the International Hop Growers’ Convention (2024) [3], in 2023, hops were grown on an area of 60,371 ha worldwide, while in the Czech Republic, hops were grown on an area of 4860 ha of hop gardens in production. According to the same source, the total production of hops in 2023 reached 118,457 tons, while 6997 tons were harvested in the Czech Republic. Therefore, the Czech Republic has long been in third place in the world in terms of the acreage of hop gardens and in terms of total annual production.
However, based on these and other data [3,4] in the Czech Republic, the average yield of hop cones from one hectare of hop gardens is lower than the European average and also the average yield per hectare for the two largest growers (e.g., in 2023: CR—1.44 t/ha, the USA—2.07 t/ha and Germany—2 t/ha). The lower yield of hops in the Czech Republic is mainly due to the different varietal composition. In CR, most areas (82%) grow aromatic varieties, especially Saaz, which have a lower yield. In Germany, on the other hand, bitter varieties are grown on most areas (56.9%), which are characterized by a higher yield [4].
An important trend in contemporary agriculture, which prioritizes the quality of production over its quantity, is undoubtedly organic farming [5], which is also used in the cultivation of hops [6]. Although the total volume of organic hop cultivation is not yet large, its production and the demand for it is constantly increasing [7,8]. A similar situation exists in the Czech Republic, where organic hops have been harvested since 2012. According to data from the Hop Growers Union of the Czech Republic (2024) [3], organic hops are currently grown on an area of 10.52 ha, and another 6.35 ha are in the transition period. Organic hop cultivation has its own specifics, which are connected, for example, with fertilizing and protecting plants against weeds and diseases, and also with irrigation [6,9].
For these reasons, ways to increase the yield of both aromatic hop varieties and organic hops are being sought in the conditions of the Czech Republic. Monitoring the state of health and growth vitality of hop plants is necessary for ensuring both the quality and quantity of hops, directly impacting the brewing process. Traditional methods of hop plant assessment, reliant on visual inspection and manual data collection, exhibit inherent limitations in terms of efficiency and precision [10].
In recent years, Unmanned Aerial Vehicles (UAVs) have emerged as a promising and innovative tool for assessing crops, including hop fields [11]. The use of UAVs and remote sensing technology offers several advantages over traditional methods [12,13]. It enables data collection on a larger scale, covering extensive fields more efficiently [14]. The high-resolution imaging sensors onboard UAVs allow for detailed and accurate assessments of plant health and vigour, which can be challenging to achieve through manual inspections. Additionally, the non-invasive nature of UAV-based monitoring reduces the disruption to plants, minimizing potential stressors [15].
Equipped with various imaging sensors, such as multispectral and thermal cameras, UAVs offer the potential to provide high-resolution and timely data for evaluating the health and stress levels of plants [16]. Among the crucial spectral indices utilized in this context is the Normalized Difference Vegetation Index (NDVI), which quantifies vegetation health and vigour by analysing the contrast between near-infrared and red reflectance [17].
Moreover, the inclusion of meteorological data in the analysis of spectral indices provides a comprehensive understanding of the factors influencing hop cultivation. This information can be invaluable for farmers, enabling them to make informed decisions regarding planting, irrigation and pest control [18]. By linking meteorological data with the health and vitality of hop plants, this study contributes to the development of precision agriculture techniques, enhancing overall crop yield and quality [19].
In addition to NDVI, several other spectral indices, such as the Chlorophyll Red Edge Index (CIR), Green Normalized Difference Vegetation Index (GNDVI), Normalized Difference Red Edge (NDRE) and Soil-Adjusted Vegetation Index (SAVI), play significant roles in assessing plant health and stress levels [20]. These indices offer complementary information regarding various physiological and biochemical properties of plants, enhancing the accuracy and depth of analysis in remote sensing applications.
This study’s objective is to investigate hop field dynamics, varietal development (vitality, health and structure) and agricultural practices over four years spanning from 2020 to 2023. Another objective was to investigate which of the used indices would be most useful for assessing the difference in the dynamics of hop development. The partial objectives therefore consisted of investigating spectral differences between conventional and organic hops annually and over the growing season and statistically investigating how abiotic factors and spectral indices were able to predict yield and quality (alpha acid content) of hops at different stages of plant development. The integration of real-world data from remote sensing for the specified timeframe holds the potential to provide valuable insights into the evolution of hop cultivation practices [21]. The utilization of UAVs, combined with NDVI and other spectral indices, allows for efficient and non-invasive monitoring of hop fields, enabling timely interventions to enhance crop health and productivity [22,23]. The contribution of this paper lies primarily in the fact that the remote sensing data of hop gardens were obtained by UAV during the growing seasons for four consecutive years and were subsequently used to explain the development of hop stands with respect to their yield and production quality. Based on a thorough literature search, we are convinced that this has not been investigated before.
2. Materials and Methods
2.1. Study Area
All our experiments were conducted at the field evaluation level. The study area encompassed two hop gardens, each subjected to different agrotechnical practices: one following organic practice and the other following conventional methods. These hop gardens were located near Stekník, Czech Republic, on a production and experimental farm of the Hop Research Institute Co., Ltd. (HRI), Saaz, Czech Republic. The conventional hop garden (coordinates: 50°19′37.32″N, 13°37′43.05″E) featured three hop varieties, namely Agnus (covering an area of 1.5 ha), Premiant (2.4 ha) and Sládek (1.7 ha). Conversely, the organic hop garden (coordinates: 50°19′16.43″N, 13°37′50.63″E) comprised the Saaz (1.1 ha) and Premiant (1.1 ha) cultivars (see Figure 1). Hops in both conventional and organic farming systems are grown in classic high hop gardens. The area of a typical hop garden is arranged as follows. The spacing of wooden poles is 9 × 8 m; only the first and the last poles in the rows are about 5.7 m from the next or previous pole. The rows are 3 m apart. There are 7–8 plants between the two standard poles and the spacing of the plants is 1 m. Usually 3–5 stems (bines) grow from one plant.
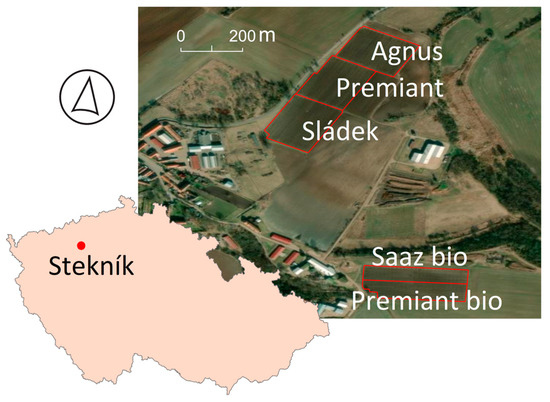
Figure 1.
Study area with individual varieties in conventional management: Agnus, Premiant, Sládek, and organic management: Saaz and Premiant.
2.2. Field Data Collection and Analysis
Characteristic interventions in the organic hop garden were the application of selected fertilizers and plant protection products approved for organic farming. In the case of fertilizers, it was primarily manure from organic farms and green manure, plant extracts and bioagents were used in plant protection. The agrotechnical measures in the conventional hop garden were in accordance with the common cultivation technologies of this type. Both hop gardens were equipped with a drip irrigation system located on top of the trellis to provide consistent soil moisture. However, local climatic and weather conditions also played a significant role in the development and vitality of plants. Experimental hop gardens belong to the climatic region, which is described according to the Czech Hydrometeorological Institute as “very warm with poor precipitation”, where the average annual temperature is 9–10 °C and the average annual precipitation is 500–600 mm [24,25]. The average precipitation and temperatures for the months of the main growing season of hops (i.e., May to August) are given in Figure 2.
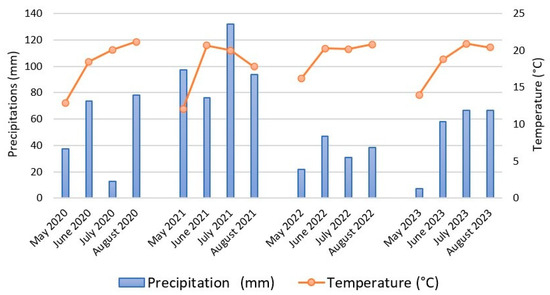
Figure 2.
Monthly temperatures and precipitation measured at experimental hop gardens for 2020–2023.
The soil of experimental hop gardens belongs to cambium soils with podzols on terrace deposits [26]. Agrotechnical operations are similar in conventional and organic hop production. In the spring, the key operation is the preparation of the plot for hop cutting. After training young shoots, spring ploughing is carried out at a time when the plants have reached a height of about 200 cm (BBCH 33). The purpose is to cover growing weeds and redundant hop shoots. Inter-row loosening is carried out later in the growing season to suppress weed growth and eliminate soil compaction after tractor passes.
The Saaz aroma variety is a traditional Czech variety that has been cultivated for centuries in the Bohemia region. As a regional landrace, it was developed by long-term breeding using the method of positive mass selection. The varieties Sládek, Premiant and Agnus belong to the first generation of Czech hybrid cultivars, which were registered in 1994 (Sládek), 1996 (Premiant) and 2001 (Agnus). The Sládek variety was obtained by selection from the hybrid progenies of the Northern Brewer and Saaz cultivars, and Agnus from the hybrid progenies of the Sládek, Bor, Northern Brewer and Fuggle cultivars. Premiant was created by crossing the inbred line of the Saaz cultivar and other breeding material.
The Saaz is categorized as a semi-early variety, with maturation occurring in the second half of August. In contrast, Premiant and Agnus usually ripen at the turn of August and September. Sládek is a late variety, typically ripening in the first half of September. In comparison to Saaz, the hybrid varieties exhibit a more robust growth pattern, necessitating increased fertilization and the application of plant protection products. The resulting yield and content of alpha acids as a measure of the quality of cones are given in Table 1.

Table 1.
Yield and content of alpha acids for individual varieties and years.
Yield parameters were obtained after the picking of the whole hop garden from the amount of dry hops and the area of the plot. During the harvest of each hop garden, green cones weighing about 100 g were continuously sampled at regular time intervals. Approximately 9–10 partial samples were taken in this way. The alpha acid content was determined from a mixed sample after drying the hops to a moisture content of 8–10%. The alpha acid content was determined by conductometric titration according to EBC method 7.4 [27].
2.3. UAV Data Collection and Analysis
To monitor experimental plots, we utilized an unmanned fixed-wing aerial system eBeeX (senseFly, SA, Cheseaux-Lausanne, Switzerland), equipped with a MicaSense RedEdge MX camera. The spectral properties of the MicaSense Red Edge MX spectral bands are given in Table 2. Flight campaigns for each vegetation season started during the early spring hop growth (end of April or beginning of May) and finished during the harvest period (end of August). During May and June, UAV scanning was more frequent (approximately weekly) as the vegetation developed rapidly. After reaching the height of the hop garden construction (8 m) and therefore the later phenological phases, it became possible to scan every 14 days (see Table 3). Growth stages of hop plants during the individual UAV campaigns are given in Figure 3.
Table 2.
Spectral bands of MicaSense Red Edge MX camera used in this study.
Table 3.
Time schedule of season-long monitoring of hop stands for the entire research period.
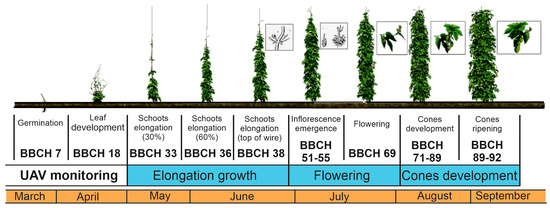
Figure 3.
Growth stages of hop plants during the individual UAV campaigns (elongation growth, flowering and cone development); nine detailed categories of BBCH according to Vostřel et al. [28].
Each flight campaign required constant conditions, ideally cloudy (in the best case, full cloud cover, but in real conditions 50% to 100% cloud cover was enough) days to ensure sufficient image contrast with shadow elimination, especially with very low wind speeds to ensure platform stability during flight and minimize plant movement in the hop gardens. Flight missions were conducted during midday hours, typically between 11:00 AM and 2:00 PM, to maintain optimal lighting.
The flight plan was prepared using the eMotion software (senseFly, SA, Cheseaux-Lausanne, Switzerland), which also serves as the control and operational software for the individual flights. Flightlines were set perpendicular to the wind direction with 75% longitudinal image overlap and lateral overlap in the case of the MicaSense Red Edge MX camera according to producer recommendations. The height of each flight ranged from 73 m for the conventional hop garden to 80 m above elevation data for the organic hop garden, depending on the surrounding terrain heterogeneity, to accommodate the functionality of the LiDAR sensor that monitors the platform’s height above the surface. The minimum platform height above the surface was 50 m. Due to terrain irregularities and the presence of significantly tall objects in the surroundings of the hop gardens, a higher flight altitude was chosen to ensure the safe operation of the unmanned aircraft in compliance with EU legislative standards. This altitude also determined the spatial resolution of the images captured by the selected cameras: 5.0 cm/px for the conventional hop garden and 5.5 cm/px for the organic hop garden.
Ground control points (GCPs) were not used during the campaign because the employed system allowed for the configuration of Virtual Reference Station VRS–RTK correction signals provided by the CZEPOS ČÚZK service (https://czepos.cuzk.cz/), specifically VRS.MAX-CZEPOS RTCM 3.1, which guarantees the accuracy of the resulting images to within a few centimetres. The actual accuracy achieved was approximately 4.8 cm relative to the Earth’s surface.
2.4. Image and Statistical Analysis
The image processing workflow encompasses multiple stages to ensure precise and accurate results. Initially, raw image data were subjected to preprocessing and enhancement using the post-flight analysis tool available in the eMotion suite. After this refinement phase, the data were imported into Pix4D for photogrammetric procedures to derive orthophotos (see Figure 4) and spectral indices such as CIR, GNDVI, NDRE, NDVI and SAVI (see Table 4).
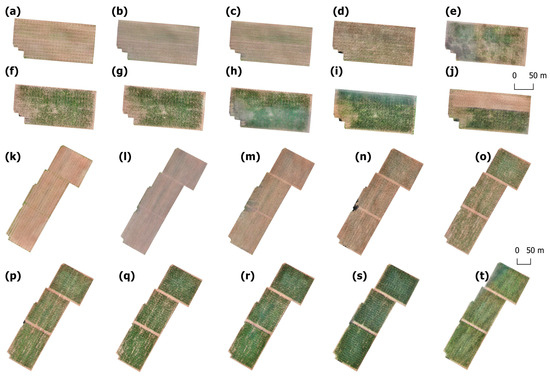
Figure 4.
Orthophotos of individual varieties and terms scanned in 2023, where (a–j) are the organic hop garden and (k–t) are the conventional hop garden.
Table 4.
Selected spectral indices used in this study.
Once the spectral indices were generated, they were further processed in ArcGIS Pro 3.2. The spectral indices were clipped to display only the green vegetation, identified using the NDVI index. In further analyses, the green parts of the hop stand were used, which corresponded to NDVI values of 0.3 and above. Figure 5 shows an example of thresholding in the Sládek variety in conventional management, as an ideal example of hop stand development. We chose this approach based on our previous experience with UAV and satellite hop garden imaging [33]. All information and explanatory details on this issue can be found in this article. This selective clipping facilitated a more precise delineation of vegetated areas. Following this spatial refinement, zonal statistics were calculated to provide a comprehensive quantitative assessment of the vegetation indices.
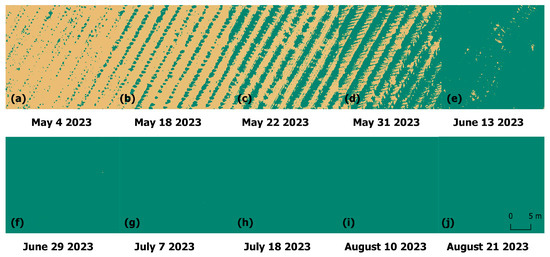
Figure 5.
Example of thresholding in Sládek variety based on NDVI (green = NDVI values of 0.3 and above; brown = NDVI values 0.3 and below) for detecting green vegetation. (a–j) Individual dates of UAV scanning.
The final phase of the workflow involved statistical analysis of the compiled data using Forward Stepwise Linear Regression (FSLR). This was carried out using the R programming language (version 4. 4. 1; R Core Team, 2024, R Foundation for Statistical Computing, Vienna, Austria) and Statistica (Cloud Software Group, Inc., Santa Clara, CA, USA, 2023, version 14, http://tibco.com), which facilitated rigorous statistical testing and validation of the results, ensuring the robustness and reliability of the findings.
To analyse spectral indices, generalized linear models (GLMs) were applied using the MASS package [34] for R. Separate models were performed for all indices, namely CIR, GNDVI, NDRE, NDVI and SAVI. The fixed effects in all models included management practices (conventional or organic), hop varieties and their potential interaction. To analyse the effects of GNDVI, a GLM with a gamma distribution of errors was employed. Other indices were analysed using quasi-Poisson distributions. All basic information that entered the analysis is presented in Table 2, Table 3 and Table 4. Data visualization was performed using the ggplot2 package in R [35].
For the purposes of this study, the following explanatory variables were used from the above measured data-year, phenophasis, variety, management (organic and conventional), weather conditions, yield and production quality (alpha acid content), while the average of CIR, GNDVI, NDRE, NDVI and SAVI values were used as response variables.
3. Results and Discussion
3.1. Comparison of Conventional and Organic Hop Gardens
The results were obtained over a four-year period (2020–2023) from the study area. Data were collected from an organic hop garden with the varieties Saaz and Premiant, and from a conventional hop garden with the varieties Agnus, Premiant and Sládek. A generalized linear model [36,37] was used in R, with the response variable being the average of CIR, GNDVI, NDRE, NDVI and SAVI values and the explanatory variables being year, variety and management (organic and conventional). The visualized boxplots displayed the average values. The results of this statistical analysis are given in Figure 6, which displays the plots of the mean selected spectral index values in relation to year and management type.
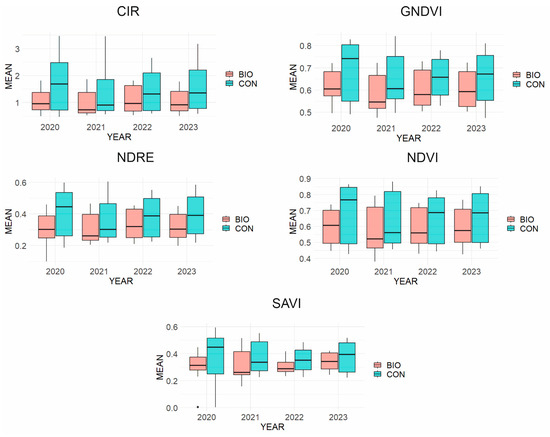
Figure 6.
Plot of mean selected spectral index values: CIR, GNDVI, NDRE, NDVI and SAVI, in relation to year and management type. CON—conventionally grown hops; BIO—organically grown hops.
From the boxplots in Figure 6, it is clear at first glance that all used indices visually show better vitality of conventional hops (CON) compared to organic ones (BIO). However, due to the relatively large and overlapping dispersions of the measured values, the question remains as to what extent these differences are statistically significant. The results of the analysis of variance in R showed that statistically significant differences can be found mainly when using the CIR and GNDVI indices (in both cases in 2020 at a significance level of 0.001, in 2021 at a significance level of 0.05 and in 2022 and 2023 at significance levels of 0.05 or 0.1). The NDRE index performs a little worse, as it was unable to detect a statistically significant difference in 2022, while the NDVI and SAVI indices appear to be unsuitable in terms of detecting differences between the vitality of conventional and organic hop gardens, because they were unable to statistically demonstrate a difference in the development of hop plants in two or more out of the four monitored years, and the maximum achieved significance level was 0.05 (in 2020).
This finding confirms the results obtained by Costa et al. [38], who compared the suitability of NDRE and NDVI indices for monitoring grapevine growth and concluded that NDRE is more sensitive than NDVI to detect grapevine vigour variability. Our measurements showed that indices focused on chlorophyll detection (CIR, GNDVI and NDRE) are more suitable for monitoring differences in hop plant vitality.
In 2020, statistically significant differences were found between conventional and organic hops using all indices except SAVI, and all chlorophyll indices showed differences at the highest significance level (0.001). In 2021, statistically significant differences were found at lower significance levels (CIR, GNDVI, SAVI—0.05; NDRE—0.1), with the NDVI index failing, similarly to the following two years, 2022 and 2023. The most complicated year to detect differences between conventionally and organically grown hop areas was 2022. At a significance level of 0.05, differences were detected only by the GNDVI index; the CIR and SAVI indices reached a significance level of 0.1 and the NDRE and NDVI indices both failed. The year 2023 was a little more favourable (CIR and NDRE reached a significance level of 0.05; GNDVI then reached 0.1), but two indices (NDVI and SAVI) failed again.
3.2. Evaluation of the Yield and Alpha Acid Content Using Spectral Indices and Other Independent Variables
Forward Stepwise Linear Regression (FSLR) was calculated, where the dependent variables were “Yield” and “content of Alpha Acids”. Independent variables were divided into two groups as “All independent variables”, which meant management (organic, conventional), variety, phenophasis and NDVI, GNDVI, CIR, SAVI and NDRE spectral indices as indirect indicators of stand condition, temperature, relative humidity and sun radiation, and only “Spectral indices” (NDVI, GNDVI, CIR, SAVI and NDRE) as indirect indicators of stand. Spectral indices were supposed to provide indications as to which spectral index is appropriate to use for predicting hop yield or alpha bitter acid content as a qualitative indicator during individual growth phases (see Table 5 and Table 6).
Table 5.
Multiple R (Mul R) and multiple R-squared (Mul R2) calculated by Forward Stepwise Linear Regression (FSLR) for yield as dependent variable and independent variables (significant * p ≤ 0.05).
Table 6.
Multiple R (Mul R) and multiple R-squared (Mul R2) calculated by Forward Stepwise Linear Regression (FSLR) for alpha acids as dependent variable and independent variables (significant * p ≤ 0.05).
As is often discussed in the literature (e.g., [39]), the yield or quality of production can be predicted quite reliably in selected growth stages by UAV remote sensing. The main growth stages are most often used for this purpose. For instance, for small cereals, [40] describes a basic division into “tillering, stem elongation, flowering and spikes forming”, or ref. [41] describes a more detailed division into “tillering, stem elongation, booting, heading, flowering, fruit development, ripening and senescence”. For hop growth, ref. [1] used eight vegetation periods to express the whole development of hop plants. According to methodology of [28], the classification scale of hop growth and development phases are divided into nine main growing stages. Although currently, the hop growth stages are commonly divided into nine stages, in our study, three basic growth stages for hop plant evaluation were used (elongation growth, flowering and cone development) so that they were sufficiently covered using UAV images for analysis. Vostřel et al. [28] used the division into following growth phases: germination, leaf development, formation of lateral shoots, shoot elongation, inflorescence emergence, flowering, cone development, cone ripening and senescence (the onset of dormancy). The first two phases (germination and leaf development) cannot be observed when using remote sensing equipment. The first phase monitored by UAV “elongation growth” thus includes all levels of shoot elongation, the second phase “flowering” includes inflorescence emergence and flowering and the third phase, “cone development”, includes cone development and ripening. Senescence is irrelevant from the point of view of our evaluation because the plant is harvested as soon as possible after the cones reach ripening.
During elongation growth, large differences were found between individual varieties and management, which can be seen in Figure 7, especially during later growth phases (June). The combination of abiotic and biotic conditions of the habitat and their distribution in individual years also played a major role. It is generally known for other crops, e.g., [42], that different varieties may have different spectral responses. On the other hand, the same varieties in different abiotic conditions, mostly due to limited water availability, can have different spectral responses in all growth stages. In the initial phases, the significant development of hop growth occurred. The plants not only grew quickly in height but the individual shoots also lengthened laterally. Solar radiation, which enables photosynthesis and thus provides the necessary energy for growth, undoubtedly had a significant influence on the development of these lateral branches. However, as can be seen from Table 5, each of the evaluated varieties was able to thrive differently in the given abiotic conditions from the energy provided by solar radiation. The complex of these parameters was able to predict the yield by up to 61% (details in Table 5).
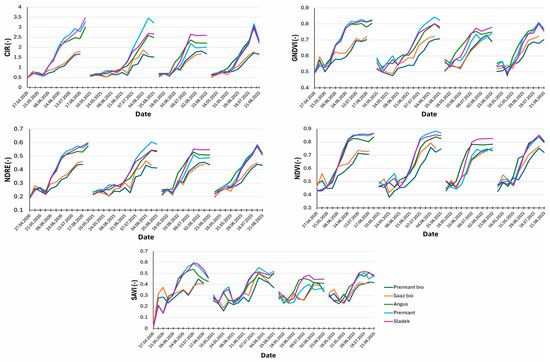
Figure 7.
Development of individual hop varieties expressed using NDVI, GNDVI, CIR, SAVI and NDRE spectral indices. Organic varieties: Premiant bio and Saaz bio; Conventional varieties: Agnus, Premiant and Sládek.
In terms of quality, the content of alpha acids in the cones is primarily evaluated. As can be seen from Table 6, cultivation management had the greatest influence on the quality of the harvest in the initial stages of growth. In organic hop gardens, it was therefore necessary to suppress the development of fungal diseases as much as possible. Furthermore, the choice of variety and the influence of site conditions each year, such as the combination of relative humidity and air temperature, and the chlorophyll content in the leaves to enable photosynthesis (here indirectly expressed by the spectral indices CIR, GNDVI and NDRE), played a major role. It was also necessary to choose the right phenophase for prediction. All these parameters then predicted the content of alpha acids, and therefore the quality of production in the initial stages of growth by up to 87%. The most suitable spectral indices for estimating yield or alpha acids in this initial phenological phase were GNDVI and CIR as indicators of chlorophyll and NDVI as the indicator of hop stand structure, which were necessary to ensure effective photosynthesis. These indices were able to predict the content of alpha acids in the elongation phase by up to 18% (details in Table 6).
During the flowering growth phase in July, it was possible to predict yield mainly based on the variety, as can be seen in Table 5. However, structural parameters of the hop stand expressed by spectral indices SAVI and NDVI (prediction of up to 56%) and the site conditions of the studied year also played a major role. The complex of these parameters was able to predict yield by up to 71% in later phenological phases. Alpha acids could be predicted within the flowering phase by up to 92% using a combination of parameters: cultivation management, variety, relative humidity, chlorophyll content and stand structure expressed by the GNDVI and SAVI indices and the site conditions of the given year. The most suitable index for predicting alpha acids in the flowering growth phase was NDRE; however, only by 11% (see Table 6).
In the cone development growth phase, yield was possible to predict by a complex of parameters, where the structural and health parameters of the hop stand expressed by the NDVI index played the most important role (prediction of up to 61%—see Table 5). Other important parameters were the air temperature, site conditions of the given year, relative humidity, suitable phenophase for evaluation (usually later) and chlorophyll content expressed by the CIR and GNDVI indices. This complex of variables was able to predict yield by up to 80%. In the prediction of alpha acids (according to Table 6), the most important parameters were cultivation management, variety, relative humidity, solar radiation and the structural index SAVI. This complex of variables was able to predict production quality by up to 90%. In terms of using spectral indices for quality prediction, NDRE and CIR appeared to be the most suitable as indicators of chlorophyll content and plant health. However, again, only by 13%.
Since there are not many research studies that evaluate hop growth using UAV scanning, similar crops, mainly vineyards, were chosen for comparison. Although vineyards have a different vegetation cycle expressed as BBCH, and the structure of the plants resulting from a different family, they are closest to hops in terms of shape and growth pattern. Therefore, we decided to discuss our results with studies that address either general agronomic knowledge or findings applied to vineyards. Matese et al. [43] used NDVI to estimate vineyard yield and sugar content in berries. In their research, they concluded that in some years, NDVI was more related to sugar content, i.e., production quality, than to yield, which is the opposite behaviour at a given location than in other years. Likewise, our results confirmed that it is necessary to assess a complex of variables, including indirect ones. The authors of the study also concluded that the relationship between NDVI and sugar content can be considered an indirect consequence of the dependence of sugar content on yield.
Opposite results, where high NDVI is associated with high yield in vineyards, were found by Carrillo et al. [44] and Urretavizcaya et al. [45]. Ferro et al. [46] used NDVI, GNDVI, NDRE and MSAVI for their assessment of vineyard vigour, yield and the quality of grapes, and scanned the vineyards in three terms: BBCH 75 (pea size berries), 81 (beginning of ripening) and 89 (full ripening). They found that grape quality in the sense of measuring total soluble solids correlated best with the GNDVI index, with the highest negative Pearson correlation coefficients at the first scan date and then decreasing (from −0.760 to −0.662). In our study, where we calculated FSLR for the main growth phases and determined the significance of spectral indices for detecting quality and yield, we concluded that for estimating quality (in terms of alpha acid content) in the first phase, it is appropriate to use GNDVI. In later growth phases, the most important spectral indices are NDRE and CIR. These results are partly consistent with those of Ferro et al. [46]. Although the quality of hop and grapevine production was compared, and the FSLR values for hops are relatively low (multiple R from 0.18 for GNDVI to 0.33 for NDRE). As can be seen from Table 4, while GNDVI is based on the ratios of the Green and NIR bands, both the NDRE and CIR indices work with the Red Edge spectral band. As stated by Xu et al. [47], the Red Edge band in the wavelength range of 670–760 nm is characterized by a greater sensitivity to changes in plant tissue and indicates various physical and chemical parameters of vegetation, such as chlorophyll a and b content, leaf cell structure and hydric status. The variability of the hop stand in later stages can be more and longer influenced by biotic and abiotic factors and, therefore, the Red Edge indices appear to be more sensitive to capturing these changes. For yield estimation, the influence of GNDVI is significant in the early stages as an index capable of capturing the chlorophyll content in the leaf tissue and corresponds to the ability of photosynthesis quality and viability of the hop stand. In later stages, structural indices are important because they can better reflect plant vitality expressed by plant volume.
The chemical nature of the quality parameters of grapevines and hops is completely different. In the case of grapevines, the content of water-soluble carbohydrates, phenolic substances, organic acids and their esters is decisive for the taste and sensory profile of the final product. In contrast, the content of alpha acids is mainly evaluated in hops. These accumulate in the granular trichomes of the hop cone during a relatively short period of July–August (September). Alpha acids are very slightly soluble in water. In the beer production process, alpha acids are isomerized to iso-alpha acids, which have a distinctly bitter taste. Iso-alpha acids are much more soluble in water than their precursors [48].
Even though the chemical nature of the qualitative parameters of both types of plants is different, common elements that can be used to support the results of our study can be found. The crucial point is that for both types of vegetation, the canopy was scanned using a UAV. The derived indices consider the overall condition of the vegetation in terms of chlorophyll content, health, vitality and structure. There may therefore be a direct or indirect correlation between the quality and, for example, the chlorophyll content in the leaves. The ability of plants to adequately convert solar energy into chemical energy during photosynthesis is often assessed. The main photosynthetic organ of plants is the leaves, which means that more than 90% of the dry matter yield of plants comes from photosynthesis in the leaves, as Makino [49] and Wang et al. [50] state in their studies.
Another important point for discussion is the interpretation of the indices used. For example, Caruso et al. [51] related LAI (Leaf Area Index) and chlorophyll concentration in leaves to NDVI obtained from the vine canopy. They found that the spatial resolution of the pixels used to assess the canopy is important. While satellite-derived NDVI is more influenced by LAI, where geometric canopy characteristics were considered, NDVI derived from UAV measurements takes into account leaf pigment content. Therefore, it makes sense to use spectral indices directly focused on the chlorophyll content in leaves (e.g., GNDVI, CIR and NDRE) in UAV images, as we addressed in our study.
In the study of Ferro et al. [46], it was also considered which of the selected indices derived from UAV images are the most useful for predicting yield. Each of these indices was significant in a different growth phase; however, the highest Pearson correlation coefficient was achieved by GNDVI in the last measurement date. In terms of measurement in all growth phases, it appeared to be the best predictor of NDVI (correlation values from 0.786 to 0.806). In our study, NDVI also appeared to be the best predictor of yield, being able to best predict yield in all growth phases examined.
3.3. Evaluation of the Development of Hop Varieties and Spectral Indices in Connection with the Meteorological Conditions
As the FSLR analysis shows, the meteorological and microclimatic conditions of the site undoubtedly played a significant role in the resulting quality or volume of production. Each of the four years evaluated (2020 to 2023) had specific conditions. This statement for hop gardens agrees with Costa et al. [38] in the vineyard research. They concluded that although all management practices were implemented before fruit development, it was found that each cultivar had its own genetic predisposition for vigour level.
In the case of the varieties we monitored, the Saaz aroma variety was obtained by clonal selection in the original hop stands in the Žatec hop-growing region. It is currently grown in three clones, 31, 72 and 114. It is most often used as hops in premium Czech lagers. It contains 2.5–3.5% alpha acids and its yield potential is 1–2 t/ha. The Sládek variety is of hybrid origin, with the Northern Brewer and Saaz varieties in its pedigree. It contains 5–9% alpha acids. The yield potential is 2.0–2.5 t/ha. Premiant was bred by selection from hybrid progeny after crossing the Saaz variety inbred line. It contains 5–9% alpha acids. The yield potential is 2.0–2.5 t/ha. Northern Brewer, Fuggle, Sládek and Bor hops are in the genetic base of Agnus. It is a bitter variety with a 10–13% alpha acid content and a yield potential of 2.0–2.5 t/ha.
The year 2020, with the second highest sum of precipitation and the second coldest year in the monitored period, showed a relatively high oscillation of values at the beginning of growth. In the initial stages of growth, the NDVI index showed a relatively rapid onset of varieties in the organic hop garden. The large development of plants was relatively quickly replaced by a decrease in values at the turn of May and June. Further development was very noticeably influenced by a relatively significant sum of precipitation in June (73.6 mm) at the end of the elongation growth, and conversely by very low natural precipitation (12.6 mm) with relatively low temperatures in July (20.1 °C), during flowering, replaced by relatively high temperatures (21.2 °C) and higher rainfall (78.4 mm) in August, during ripening. The development of the weather was significantly reflected in the values of both structural indices (NDVI, SAVI) and indices detecting chlorophyll content (GNDVI, CIR and NDRE). Differences between hop gardens in organic and conventional management were found. While all varieties prospered well in the conventional regime, organic varieties were significantly damaged by the development of fungal diseases from the beginning of June.
As mentioned by Dušek et al. [52], downy mildew (Pseudoperonospora humuli) threatens the health of hops throughout the entire vegetation period, especially during periods of frequent rains. While in a conventional system its infection pressure is eliminated by the application of fungicides, in organic farming, the options are limited. Significant year-to-year differences in the yields of hops grown in organic farming are mainly caused by the varying intensity of the pathogen’s infection pressure.
Varieties in conventional management showed different, rather average yields and alpha bitter acid content this year (Sládek: 2.45 t/ha, 5.8% of weight; Premiant: 2.61 t/ha, 7.0%; Agnus: 1.82 t/ha, 10.7%). The Agnus variety had the highest yield and the highest quality production in comparison with other years. Organic varieties showed a rather below-average yield with average alpha bitter acid values (Saaz: 0.27 t/ha, 3.3%, Premiant: 0.74 t/ha, 7.0%), which ultimately agrees with the curves in Figure 7.
The year 2021 was the year with the highest rainfall in all main growth phases of all evaluated years. On average, temperatures for the studied period were the lowest (17.65 °C); however, this was no longer the case when individual main growth phases were evaluated. In June, during the late elongation phase, the average air temperature was the highest (20.7 °C) with high rainfall (sum for June: 76 mm). Although the experimental hop gardens were irrigated with drip irrigation, natural rainfall created specific conditions, both in terms of reduced radiation due to clouds, and by reducing air temperatures or increasing relative humidity in the vicinity of the hop gardens. In the initial phases of growth (elongation), the values of all indices fluctuated until mid-June. Then, apparently due to the heavy rainfall (76 mm) and high temperatures (20.7 °C) at the end of the elongation phase, there was a significant increase in the index values of all varieties. However, the same trend as the previous year was observed: organic varieties had significantly lower values for all indices compared to varieties in conventional management. In terms of yield, these conditions were most suitable for the Sládek variety (2.88 t/ha). The Premiant and Agnus varieties had average yields (2.51 and 1.43 t/ha). However, in terms of alpha bitter acid content, the values were significantly above average (Premiant: 7.6%, Sládek: 7.4%), with the exception of the Agnus variety (10.4%). Organic varieties achieved the highest yield and also the highest quality in the monitored years (Saaz: 1.09 t/ha, 3.7%; Premiant: 0.93 t/ha, 8.7%). The development of values for individual indices and varieties may not directly correlate with the resulting yield and quality of cones; however, according to the FSLR analysis, there was a relatively high probability of a relative estimate according to the phenological phases, the property of the variety and the type of index.
The year 2022 was the driest year, generally with the highest air temperatures (138.6 mm sum, 19.4 °C in average). However, the distribution of precipitation was relatively even during the individual growth phases. This led to relatively low values of all monitored indices. This year, the organic variant Saaz had the lowest values of all indices and at the same time achieved the lowest yield and alpha bitter acid content (0.18 t/ha, 2.2%). There was also a clear trend of values and production results for the conventional variety, Premiant, which also showed the lowest values this dry year, both in spectral indices and in terms of yield and quality (0.99 t/ha, 6.3%).
The year 2023 was average for both precipitation and temperature (66.7 mm, 20.4 °C). However, May, i.e., the initial growth phase, was very poor in precipitation (7.2 mm). The trend of spectral indices also showed the evenness of all curves. The organic variety Premiant (1.81 t/ha) and the conventional Agnus and Premiant (1.94 and 3.83 t/ha) achieved a high yield this year, which corresponded in the later growth phases with the SAVI and NDVI index. However, the alpha bitter acid content was average to low (see Table 1).
In terms of the prosperity of individual varieties, Agnus is one of the varieties that can tolerate weather fluctuations very well in individual years, which is documented by a balanced content of alpha acids throughout all monitored years. Its yield potential is at the level of 2.0–2.5 t/ha. In terms of average daily temperatures and rainfall distribution, the least favourable year for hops was 2022 (a dry and warm year). This had a negative impact on the Saaz organic variety with a low yield and low alpha acid content this year. On the other hand, the course of weather conditions in 2021 was exceptionally favourable for hops. The effects of the tropical periods in June were eliminated by sufficient rainfall until harvest. This year, a record 8,306 tons of hops were harvested in the Czech Republic with an average yield of 1.67 t/ha [53]. Favourable conditions were reflected in all varieties in terms of a high content of alpha acids, as also documented in our study.
We are convinced that our research has once again confirmed the importance of UAV imaging for assessing the development of agricultural crops, this time in hop stands. This method is also sufficiently accurate, detailed and flexible in this case.
The literature often addresses the relationship between yield, stand quality and spectral indices, e.g., [54]. As in our study, the vegetation indices NDVI, GNDVI, modifications of SAVI (OSAVI, MSAVI) and NDRE are often used with good accuracy. Each of these indices has its own role in prediction, which results from the spectral bands used in its calculation equation. For example, NDVI is often used for yield prediction [46,55]. GNDVI is usually used for prediction of sugar content, total soluble solids or general quality parameters, e.g., [56]. As mentioned above, there is not much knowledge about the use of spectral indices for hop evaluation, so we were inspired by already-proven solutions in vineyards, where this group of indices is very often used.
Due to the lack of remote sensing information from hop cultivation, we compared the results obtained by us with the results obtained from the evaluation of vineyards, which are probably most similar to hop plantations (similar stand architecture, cultivated in rows, mainly only the upper part of a large volume of plants is scanned). The results obtained from our evaluation of spectral indices regarding the structure (architecture) of hop stands and their vitality, health and chlorophyll content have been shown to be very similar to those of vineyards and are discussed in detail in individual subsections. This could indicate a certain universality of data obtained from UAV imaging for assessing different types of vegetation. However, further research will be needed to confirm this assumption.
4. Conclusions
Based on four years of monitoring different hop varieties using UAV scanning, the following statements can be concluded. In terms of yield assessment, it was found that the combination of abiotic factors and spectral indices was able to predict yield by 61% at elongation growth, 71% at flowering and 80% at cone development. For the evaluation of elongation growth, the most significant indices were CIR, NDVI and GNDVI; however, these indices explained yield by only 10%. Nevertheless, in the flowering phase, the SAVI and NDVI indices were able to predict yield by up to 56% and during cone development, the NDVI index explained yield by up to 61%. The combination of abiotic factors and spectral indices predicted quality (alpha acid content) of around 90% in all growth phases, while the indices used were only able to capture this fact to within 18%. When UAV scanning hop stands, it is possible to monitor only the canopies at high spatial resolution, similar to vineyards. Indices evaluating chlorophyll content (in our case CIR, GNDVI and NDRE) appeared to be more suitable for affecting differences between hop stands.
Hop is a marginal special agricultural crop; however, for Germany, the USA, Czech Republic, China, Poland, etc., it is a very important commercial commodity. Even though our contribution deals with varieties typically grown in the Czech Republic, the methods used are transferable to other geographical areas because cultivation methods abroad do not differ significantly from those in the Czech Republic.
Author Contributions
Conceptualization, J.K., K.K. and F.K.; methodology, J.K. and K.K.; software, J.Ř., M.K. and V.V.; validation, J.K., J.Ř., K.K., V.V., M.K. and F.K.; formal analysis, J.K., F.K. and K.K.; resources, J.Ř., J.K., F.K. and K.K.; data curation, J.Ř., V.V., M.K. and J.K.; writing—original draft preparation, J.Ř., J.K. and F.K.; writing—review and editing, J.Ř., J.K., F.K. and M.K.; visualization, J.Ř., V.V. and J.K.; supervision, J.K., F.K. and K.K.; project administration, F.K. and J.K.; All authors have read and agreed to the published version of the manuscript.
Funding
This research was supported by the Ministry of Education, Youth and Sports of the Czech Republic, grant No. CZ.02.01.01/00/22_012/0006225 and by Czech Ministry of Agriculture within Institutional supports No. MZE-RO1325.
Data Availability Statement
The data presented in this study are openly available in https://data.narodni-repozitar.cz/general/datasets/draft/mwd02-msm38, accessed on 1 March 2025.
Acknowledgments
We thank the manager of the Stekník farm of the Hop Research Institute Co., Ltd. Jaroslav Pokorný, for allowing us to scan hop stands and providing valuable information about the process of their cultivation. We would also like to thank Iñigo Molina Sanchez from Universidad Politécnica de Madrid for his valuable advice during the preparation of the manuscript.
Conflicts of Interest
The authors declare no conflicts of interest. The funders had no role in the design of the study; in the collection, analyses, or interpretation of data; in the writing of the manuscript; or in the decision to publish the results.
Abbreviations
The following abbreviations are used in this manuscript:
| UAV | Unmanned Aerial Vehicles |
| NDVI | Normalized Difference Vegetation Index |
| GNDVI | Green Normalized Difference Vegetation Index |
| NDRE | Normalized Difference Red Edge Index |
| CIR | Chlorophyll Red Edge Index |
| SAVI | Soil-Adjusted Vegetation Index |
| CR | Czech Republic |
| HRI | Hop Research Institute Co., Ltd. |
| BBCH | Biologische Bundesanstalt, Bundessortenamt and Chemical Industry (German scale used to identify the phenological development stages of a plant) |
| VRS | Vertical Reference Station |
| RTK | Real-Time Kinematic |
| CZEPOS | Czech Positioning System |
| FSLR | Forward Stepwise Linear Regression |
| GLM | Generalized Linear Model |
| MASS | Modern Applied Statistics with S |
| ČÚZK | Czech State Administration of Land Surveying and Cadastre |
| CON | Hops grown using conventional methods |
| BIO | Hops grown using organic farming |
| MSAVI | Modified Soil-Adjusted Vegetation Index |
| LAI | Leaf Area Index |
References
- Rybáček, V. Hop Production; Elsevier: Amsterdam, The Netherlands, 1991; ISBN 0444987703. [Google Scholar]
- Štěrba, K.; Kyselová, L. Effect of Production and Storage of Beer on Its Sensory Stability. Kvas. Prum. 2022, 68, 553–563. [Google Scholar] [CrossRef]
- BarthHaas Report 2023/2024. Available online: https://www.barthhaas.com/company/news/news-article/bh/barthhaas-report-2023-2024 (accessed on 6 November 2024).
- Hopsteiner. Crop & Market Update 08/2022. Available online: https://www.hopsteiner.com/wp-content/uploads/2022 (accessed on 6 November 2024).
- Eurostat EU Organic Farming: 16.9 Million Hectares in 2022. Available online: https://ec.europa.eu/eurostat/web/products-eurostat-news/w/ddn-20240619-3 (accessed on 21 January 2025).
- Ježek, J.; Vostřel, J.; Krofta, K.; Klapal, I. Organic Hop Farming in Czech Republic and Worldwide. Kvas. Prum. 2012, 58, 294–302. [Google Scholar] [CrossRef]
- Institut für Pflanzenbau und Pflanzenzüchtung Ökologischer Hopfenbau. Available online: https://www.lfl.bayern.de/ipz/hopfen/029820/index.php (accessed on 8 November 2024).
- Comptoir Agricole Le Comptoir Agricole Propose Du Houblon Issu de l’Agriculture Biologique. Available online: https://www.comptoir-houblon.fr/44-online-sales (accessed on 8 November 2024).
- Turner, S.F.; Benedict, C.A.; Darby, H.; Hoagland, L.A.; Simonson, P.; Robert Sirrine, J.; Murphy, K.M. Challenges and Opportunities for Organic Hop Production in the United States. Agron. J. 2011, 103, 1645–1654. [Google Scholar] [CrossRef]
- Andújar, D.; Moreno, H.; Bengochea-Guevara, J.M.; de Castro, A.; Ribeiro, A. Aerial Imagery or On-Ground Detection? An Economic Analysis for Vineyard Crops. Comput. Electron. Agric. 2019, 157, 351–358. [Google Scholar] [CrossRef]
- Pang, Y.; Shi, Y.; Gao, S.; Jiang, F.; Veeranampalayam-Sivakumar, A.N.; Thompson, L.; Luck, J.; Liu, C. Improved Crop Row Detection with Deep Neural Network for Early-Season Maize Stand Count in UAV Imagery. Comput. Electron. Agric. 2020, 178, 105766. [Google Scholar] [CrossRef]
- Guijarro, M.; Pajares, G.; Riomoros, I.; Herrera, P.J.; Burgos-Artizzu, X.P.; Ribeiro, A. Automatic Segmentation of Relevant Textures in Agricultural Images. Comput. Electron. Agric. 2011, 75, 75–83. [Google Scholar] [CrossRef]
- Zou, X.; Liang, A.; Wu, B.; Su, J.; Zheng, R.; Li, J. UAV-Based High-Throughput Approach for Fast Growing Cunninghamia lanceolata (Lamb.) Cultivar Screening by Machine Learning. Forests 2019, 10, 815. [Google Scholar] [CrossRef]
- Comba, L.; Gay, P.; Primicerio, J.; Ricauda Aimonino, D. Vineyard Detection from Unmanned Aerial Systems Images. Comput. Electron. Agric. 2015, 114, 78–87. [Google Scholar] [CrossRef]
- Velusamy, P.; Rajendran, S.; Mahendran, R.K.; Naseer, S.; Shafiq, M.; Choi, J.-G. Unmanned Aerial Vehicles (UAV) in Precision Agriculture: Applications and Challenges. Energies 2021, 15, 217. [Google Scholar] [CrossRef]
- Candiago, S.; Remondino, F.; De Giglio, M.; Dubbini, M.; Gattelli, M. Evaluating Multispectral Images and Vegetation Indices for Precision Farming Applications from UAV Images. Remote Sens. 2015, 7, 4026–4047. [Google Scholar] [CrossRef]
- Rouse, J.W., Jr.; Haas, R.H.; Schell, J.A.; Deering, D.W. Monitoring Vegetation Systems in the Great Plains with Erts. In Proceedings of the Third Earth Resources Technology Satellite-1 Symposium. Vol. 1: Technical Presentations. NASA SP-351; Freden, S.C., Mercanti, E.P., Becker, M.A., Eds.; National Aeronautics and Space Administration: Washington, DC, USA, 1974; Volume 1, p. 317. [Google Scholar]
- Aslan, M.F.; Durdu, A.; Sabanci, K.; Ropelewska, E.; Gültekin, S.S. A Comprehensive Survey of the Recent Studies with UAV for Precision Agriculture in Open Fields and Greenhouses. Appl. Sci. 2022, 12, 1047. [Google Scholar] [CrossRef]
- Pádua, L.; Marques, P.; Adão, T.; Guimarães, N.; Sousa, A.; Peres, E.; Sousa, J.J. Vineyard Variability Analysis through UAV-Based Vigour Maps to Assess Climate Change Impacts. Agronomy 2019, 9, 581. [Google Scholar] [CrossRef]
- Meivel, S.; Maheswari, S. Monitoring of Potato Crops Based on Multispectral Image Feature Extraction with Vegetation Indices. Multidimens. Syst. Signal Process. 2022, 33, 683–709. [Google Scholar] [CrossRef]
- Kumhálová, J.; Matějková, Š. Yield Variability Prediction by Remote Sensing Sensors with Different Spatial Resolution. Int. Agrophys. 2017, 31, 195–202. [Google Scholar] [CrossRef]
- Khan, Z.; Rahimi-Eichi, V.; Haefele, S.; Garnett, T.; Miklavcic, S.J. Estimation of Vegetation Indices for High-Throughput Phenotyping of Wheat Using Aerial Imaging. Plant Methods 2018, 14, 20. [Google Scholar] [CrossRef] [PubMed]
- Šiljeg, A.; Marinović, R.; Domazetović, F.; Jurišić, M.; Marić, I.; Panđa, L.; Radočaj, D.; Milošević, R. GEOBIA and Vegetation Indices in Extracting Olive Tree Canopies Based on Very High-Resolution UAV Multispectral Imagery. Appl. Sci. 2023, 13, 739. [Google Scholar] [CrossRef]
- Klimatické Regiony. Available online: https://zranitelnost.vumop.cz/popis/kr.php (accessed on 22 January 2025).
- Micka: Klimatické Oblasti ČR 1901-2000 (WMS). Available online: https://micka.cenia.cz/record/basic/4e64bc59-65b0-4475-aae2-06a8c0a80138 (accessed on 22 January 2025).
- Česká Geologická Služba—Půdní Mapa 1:50000. Available online: https://mapy.geology.cz/pudy/# (accessed on 22 January 2025).
- European Brewery Convention. Analytica-EBC, Method 7.4; Fachverlag Hans Carl: Nürnberg, Germany, 2009. [Google Scholar]
- Vostřel, J.; Klapal, I.; Trefilová, M.; Chmelařský Institut s.r.o., Žatec. Metodika Ochrany Chmele; Svoboda Petr: Žatec, Czech Republic, 2021; ISBN 978-80-86836-45-4. [Google Scholar]
- Gitelson, A.A.; Kaufman, Y.J.; Merzlyak, M.N. Use of a Green Channel in Remote Sensing of Global Vegetation from EOS-MODIS. Remote Sens. Environ. 1996, 58, 289–298. [Google Scholar] [CrossRef]
- Barnes, E.M.; Clarke, T.; Richards, S.E.; Colaizzi, P.D.; Haberland, J.; Kostrzewski, M.; Waller, P.M.; Choi, C.Y.; Riley, E.; Thompson, T.L.; et al. Coincident Detection of Crop Water Stress, Nitrogen Status and Canopy Density Using Ground-Based Multispectral Data. Available online: https://www.researchgate.net/publication/43256762_Coincident_detection_of_crop_water_stress_nitrogen_status_and_canopy_density_using_ground_based_multispectral_data (accessed on 15 November 2024).
- Gitelson, A.A.; Viña, A.; Ciganda, V.; Rundquist, D.C.; Arkebauer, T.J. Remote Estimation of Canopy Chlorophyll Content in Crops. Geophys. Res. Lett. 2005, 32, L08403. [Google Scholar] [CrossRef]
- Huete, A.R. A Soil-Adjusted Vegetation Index (SAVI). Remote Sens. Environ. 1988, 25, 295–309. [Google Scholar] [CrossRef]
- Kumhálová, J.; Chyba, J.; Krofta, K.; Starý, K.; Brant, V. Evaluation of UAV and Sentinel 2 Images to Estimate Condition of Hop (Humulus lupulus L.) Plants. Acta Hortic. 2021, 1328, 95–102. [Google Scholar] [CrossRef]
- Venables, W.N.; Ripley, B.D. Modern Applied Statistics with S; Statistics and Computing; Springer: New York, NY, USA, 2002; ISBN 978-1-4419-3008-8. [Google Scholar]
- Wickham, H. Ggplot2: Elegant Graphics for Data Analysis; Springer: New York, NY, USA, 2016; ISBN 978-3-319-24277-4. [Google Scholar]
- OpenGL Mathematics (GLM). Available online: https://www.opengl.org/sdk/libs/GLM/ (accessed on 22 January 2025).
- Nelder, J.A.; Wedderburn, R.W.M. Generalized Linear Models. J. R. Stat. Soc. Ser. A Stat. Soc. 1972, 135, 370. [Google Scholar] [CrossRef]
- Costa, S.; Ricardo, B.; Oldoni, H.; da Silva, T.M.M.; Farinassi, L.G.; Bognola, I.A.; Bassoi, L.H. How Similar Is the Zoning of Different Vegetation Indices: Defining the Optimal Framework for Monitoring Grapevines’ Growth within Vigorous Vineyards. Sci. Hortic. 2023, 322, 112404. [Google Scholar] [CrossRef]
- Yue, J.; Yang, H.; Yang, G.; Fu, Y.; Wang, H.; Zhou, C. Estimating Vertically Growing Crop Above-Ground Biomass Based on UAV Remote Sensing. Comput. Electron. Agric. 2023, 205, 107627. [Google Scholar] [CrossRef]
- Balážová, K.; Kumhálová, J.; Chyba, J. Unmanned-Aerial-Vehicle Data as an Effective Tool for the Evaluation of Ancient Khorasan and Modern Kabot Spring Wheat Varieties under Different Tillage Systems. Agronomy 2024, 14, 147. [Google Scholar] [CrossRef]
- Harfenmeister, K.; Spengler, D.; Weltzien, C. Analyzing Temporal and Spatial Characteristics of Crop Parameters Using Sentinel-1 Backscatter Data. Remote Sens. 2019, 11, 1569. [Google Scholar] [CrossRef]
- Jelínek, Z.; Kumhálová, J.; Chyba, J.; Wohlmuthová, M.; Madaras, M.; Kumhála, F. Landsat and Sentinel-2 Images as a Tool for the Effective Estimation of Winter and Spring Cultivar Growth and Yield Prediction in the Czech Republic. Int. Agrophys. 2020, 34, 391–406. [Google Scholar] [CrossRef]
- Matese, A.; Di Gennaro, S.F.; Santesteban, L.G. Methods to Compare the Spatial Variability of UAV-Based Spectral and Geometric Information with Ground Autocorrelated Data. A Case of Study for Precision Viticulture. Comput. Electron. Agric. 2019, 162, 931–940. [Google Scholar] [CrossRef]
- Carrillo, E.; Matese, A.; Rousseau, J.; Tisseyre, B. Use of Multi-Spectral Airborne Imagery to Improve Yield Sampling in Viticulture. Precis. Agric. 2016, 17, 74–92. [Google Scholar] [CrossRef]
- Urretavizcaya, I.; Royo, J.B.; Miranda, C.; Tisseyre, B.; Guillaume, S.; Santesteban, L.G. Relevance of Sink-Size Estimation for within-Field Zone Delineation in Vineyards. Precis. Agric. 2017, 18, 133–144. [Google Scholar] [CrossRef]
- Ferro, M.V.; Catania, P.; Miccichè, D.; Pisciotta, A.; Vallone, M.; Orlando, S. Assessment of Vineyard Vigour and Yield Spatio-Temporal Variability Based on UAV High Resolution Multispectral Images. Biosyst. Eng. 2023, 231, 36–56. [Google Scholar] [CrossRef]
- Xu, N.; Tian, J.; Tian, Q.; Xu, K.; Tang, S. Analysis of Vegetation Red Edge with Different Illuminated/Shaded Canopy Proportions and to Construct Normalized Difference Canopy Shadow Index. Remote Sens. 2019, 11, 1192. [Google Scholar] [CrossRef]
- Jaskula-Goiris, B.; Aerts, G.; De Cooman, L. Hop α-Acids Isomerisation and Utilisation: An Experimental Review. Cerevisia 2010, 35, 57–70. [Google Scholar] [CrossRef]
- Makino, A. Photosynthesis, Grain Yield, and Nitrogen Utilization in Rice and Wheat. Plant Physiol. 2011, 155, 125–129. [Google Scholar] [CrossRef]
- Wang, G.; Zeng, F.; Song, P.; Sun, B.; Wang, Q.; Wang, J. Effects of Reduced Chlorophyll Content on Photosystem Functions and Photosynthetic Electron Transport Rate in Rice Leaves. J. Plant Physiol. 2022, 272, 153669. [Google Scholar] [CrossRef]
- Caruso, G.; Palai, G.; Tozzini, L.; D’Onofrio, C.; Gucci, R. The Role of LAI and Leaf Chlorophyll on NDVI Estimated by UAV in Grapevine Canopies. Sci. Hortic. 2023, 322, 112398. [Google Scholar] [CrossRef]
- Dušek, M.; Vostřel, J.; Jandovská, V.; Mikyška, A. Post-Harvest Recognition of Various Fungicide Treatments for Downy Mildew of Hops Using Comprehensive Pesticide Residue Monitoring. Int. J. Pest Manag. 2020, 69, 164–174. [Google Scholar] [CrossRef]
- Krofta, K.; Pokorný, J. Hop Cultivation vs. Weather—An Eternal Theme. Kvas. Prum. 2023, 69, 822–830. [Google Scholar] [CrossRef]
- Ballesteros, R.; Intrigliolo, D.S.; Ortega, J.F.; Ramírez-Cuesta, J.M.; Buesa, I.; Moreno, M.A. Vineyard Yield Estimation by Combining Remote Sensing, Computer Vision and Artificial Neural Network Techniques. Precis. Agric. 2020, 21, 1242–1262. [Google Scholar] [CrossRef]
- López-García, P.; Ortega, J.F.; Pérez-Álvarez, E.P.; Moreno, M.A.; Ramírez, J.M.; Intrigliolo, D.S.; Ballesteros, R. Yield Estimations in a Vineyard Based on High-Resolution Spatial Imagery Acquired by a UAV Duplicate. Biosyst. Eng. 2022, 224, 227–245. [Google Scholar] [CrossRef]
- Maimaitiyiming, M.; Sagan, V.; Sidike, P.; Kwasniewski, M.T. Dual Activation Function-Based Extreme Learning Machine (ELM) for Estimating Grapevine Berry Yield and Quality. Remote Sens. 2019, 11, 740. [Google Scholar] [CrossRef]


Disclaimer/Publisher’s Note: The statements, opinions and data contained in all publications are solely those of the individual author(s) and contributor(s) and not of MDPI and/or the editor(s). MDPI and/or the editor(s) disclaim responsibility for any injury to people or property resulting from any ideas, methods, instructions or products referred to in the content. |
© 2025 by the authors. Licensee MDPI, Basel, Switzerland. This article is an open access article distributed under the terms and conditions of the Creative Commons Attribution (CC BY) license (https://creativecommons.org/licenses/by/4.0/).