Article

Planform Change and Its Delayed Response to Discharge in an Active Braided River Reach: Majuli Island Reach of the Brahmaputra River

1
Key Laboratory of Water Cycle and Related Land Surface Processes, Institute of Geographic Sciences and Natural Resources Research, Chinese Academy of Sciences, Beijing 100101, China
2
University of Chinese Academy of Sciences, Beijing 100049, China
3
School of Engineering, University of Birmingham, Birmingham B15 2TT, UK
4
Institute of Water and Flood Management, Bangladesh University of Engineering and Technology, Dhaka 1000, Bangladesh
5
Department of Environmental Science, Patan Multiple Campus, Tribhuvan University, Kirtipur 44618, Nepal
6
International Economic and Technical Cooperation and Exchange Center, Ministry of Water Resources, Beijing 100038, China
*
Author to whom correspondence should be addressed.
Remote Sens. 2025, 17(6), 944; https://doi.org/10.3390/rs17060944
Submission received: 2 January 2025 / Revised: 25 February 2025 / Accepted: 5 March 2025 / Published: 7 March 2025

Abstract

:
As the threat of unstable braided river geomorphology to the resilience of local communities grows, a better understanding of the morphological changes in a river subject to climate is essential. However, little research has focused on the long-term planform change of the braided reaches and its response to hydrological changes. The reach around Majuli Island (Majuli Reach), the first and typical braided reach of the Brahmaputra River emerging from the gorge, experiences intense geomorphological change of the channels and loss of riparian area every year due to the seasonal hydrological variability. Therefore, focusing on the Majuli Reach, we quantitatively investigate changes in its planform morphology from 1990 to 2020 using remote sensing images from the Landsat dataset and analyze the influence of discharge in previous years on channel braiding. The study shows that the Majuli Reach is characterized by a high braiding degree with an average Modified Plan Form Index (MPFI) of 4.39, an average reach width of 5.58 km, and the development of densely migrating bars and active braided channels. Analysis shows a control point near Borboka Pathar with little morphological change, and the braided channel shows contrasting morphological changes in the braiding degree, bars, and main channel between the reach upstream and downstream of it. The area of the riparian zone of the Majuli Reach decreased by more than 50 km2 during the study period due to migration of the main channel toward the island. The braiding degree of Majuli Reach is positively correlated with the discharge in previous years, with the delayed response time of the MPFI to discharge being just 3–4 years, indicating the unstable feature of the Majuli Reach with varied hydrology conditions.

Graphical Abstract

1. Introduction

The Brahmaputra River is one of the largest rivers in the world. However, prime inhabited lands along the river are being lost every year due to erosion [1,2]. Land loss related to channel evolution (the shifting and widening of the channels) is mainly observed in braided reaches [3,4]. The planform of braided rivers is prone to be influenced by changing hydrological conditions, as it consists of an unstable multi-channel alluvial system with three or more channels separated by bars of different shapes and sizes [5,6]. During floods, rapid redistributions occur in the bars and channels of braided rivers because of the rise and fall of the water [7,8,9] and non-equilibrium sediment transport [10,11,12]. In addition, hydrological conditions, especially discharge in the Brahmaputra River, are subject to climate change. Runoff from Himalayan snow and glacier melt, accounting for about 36% of the Brahmaputra’s total discharge [13,14,15], is projected to accelerate due to climate change, increasing the flood risk in the short term [13,14,16,17]. Thus, the evolution of braided reaches in the Brahmaputra River under a changing climate is attracting substantial attention because of its importance in geomorphology (i.e., braiding index variation, riverbank line retreat, channel shifts) and engineering (i.e., construction of bank protection and river restoration works). Understanding the evolution of channel morphology in braided rivers is important, particularly with respect to revealing the hydrodynamic mechanisms of water–sand dynamics and assessing the safety risk of riparian zones.
The planform of braided rivers is sensitive to changes in hydrological conditions. Discharge and sediment are the main controlling factors of braided channel morphology, as sediment deposition and discharge inhomogeneity are the primary causes of river braiding [7,8,9,10,11,12], and large fluctuations in discharge and sediment transport during flood seasons are the direct causes of significant changes in the morphology of braided rivers [7,11,18,19,20,21]. The braided channel morphology of the Brahmaputra River is primarily the result of sediment accumulation processes, where water carrying massive sediment loads from the Himalayas to the plains of Assam, India, undergoes abrupt deposition [17,22,23,24]. At the same time, seasonal high flows during snowmelt and flood periods drive intense sediment transport, forming dynamic depositional sandbars that promote flow divergence and subsequent channel regeneration [22,24]. In addition, the planform of a braided river reflects the cumulative effects of the past hydrological dynamics of the river, and its response to changing discharge conditions is delayed in reaching an equilibrium state [25,26]. In the Brahmaputra River, empirical evidence suggests a dynamic equilibrium period of 5–10 years [27]. Investigating the long-term planform change of the braided reach and its response to hydrological dynamics is critical to understanding the self-regulation pattern of the braided reach under a changing climate.
Branches and bars in braided rivers are always in the process of formation and elimination [8,18,28], and the scouring of the riparian zones by the water flow in unstable channels is a serious problem that affects the safety of the people living around them [22,23,29,30]. It is, therefore, necessary to develop appropriate precautionary measures by studying the pattern of morphological changes in braided rivers. In the Brahmaputra River, the river reach flowing through the Vale of Assam is the first and typical braided reach downstream of the plateau. This reach experiences floods and channel deformation every year due to concentrated monsoon rains or the snow and ice melt from the Himalayas [31,32,33]. Floods, planform evolution, and bank erosion have threatened the productive lives of the local inhabitants and economic development [22,23,29,30]. For instance, Majuli Island, the largest inhabited river island in the world with a population of 160,000, is experiencing serious land loss. More than half of the island’s ancient religious buildings named Satra, the center of Indian neo-Vaishnavite culture, were reported to be destroyed due to severe erosion [17,34]. The main reason is that the braided Majuli Island reach of the Brahmaputra River (Majuli Reach) undergoes significant changes in bankline (defined as the active channel boundary demarcating perennial flow areas that persist after the monsoon) and redistribution of bars, channels, and braiding degree [1,3,35].
Studies have verified the intense erosion and land loss of Majuli Island, especially on the southern part of the island [20,23,36,37]. However, little research focuses on long-term planform change of the braided reach and its response to hydrological dynamics, which is critical to understanding the evolution pattern of the reach and preserving Majuli Island under changing hydrology conditions. Thus, Majuli Reach was selected to investigate the planform change and its relation to hydrology conditions. It promotes a deeper understanding of the evolutionary dynamics of the Majuli Reach under the changing climate.
This paper investigates the planform changes of the Majuli Reach and the hydrological driving factors. The planforms of the Majuli Reach are extracted from the Landsat images of the last three decades (1990–2020), and the braiding index (Modified Plan Form Index, MPFI) is adopted to describe the morphological change of the studied reach. After that, we examine the delayed response of discharges to the braiding degree using regression analysis. Furthermore, precipitation and temperature are selected as the key climatic factors in the upper basin of the Majuli Reach, and their correlations with discharge in different seasons are discussed. Finally, conclusions are drawn.

2. Materials and Methods
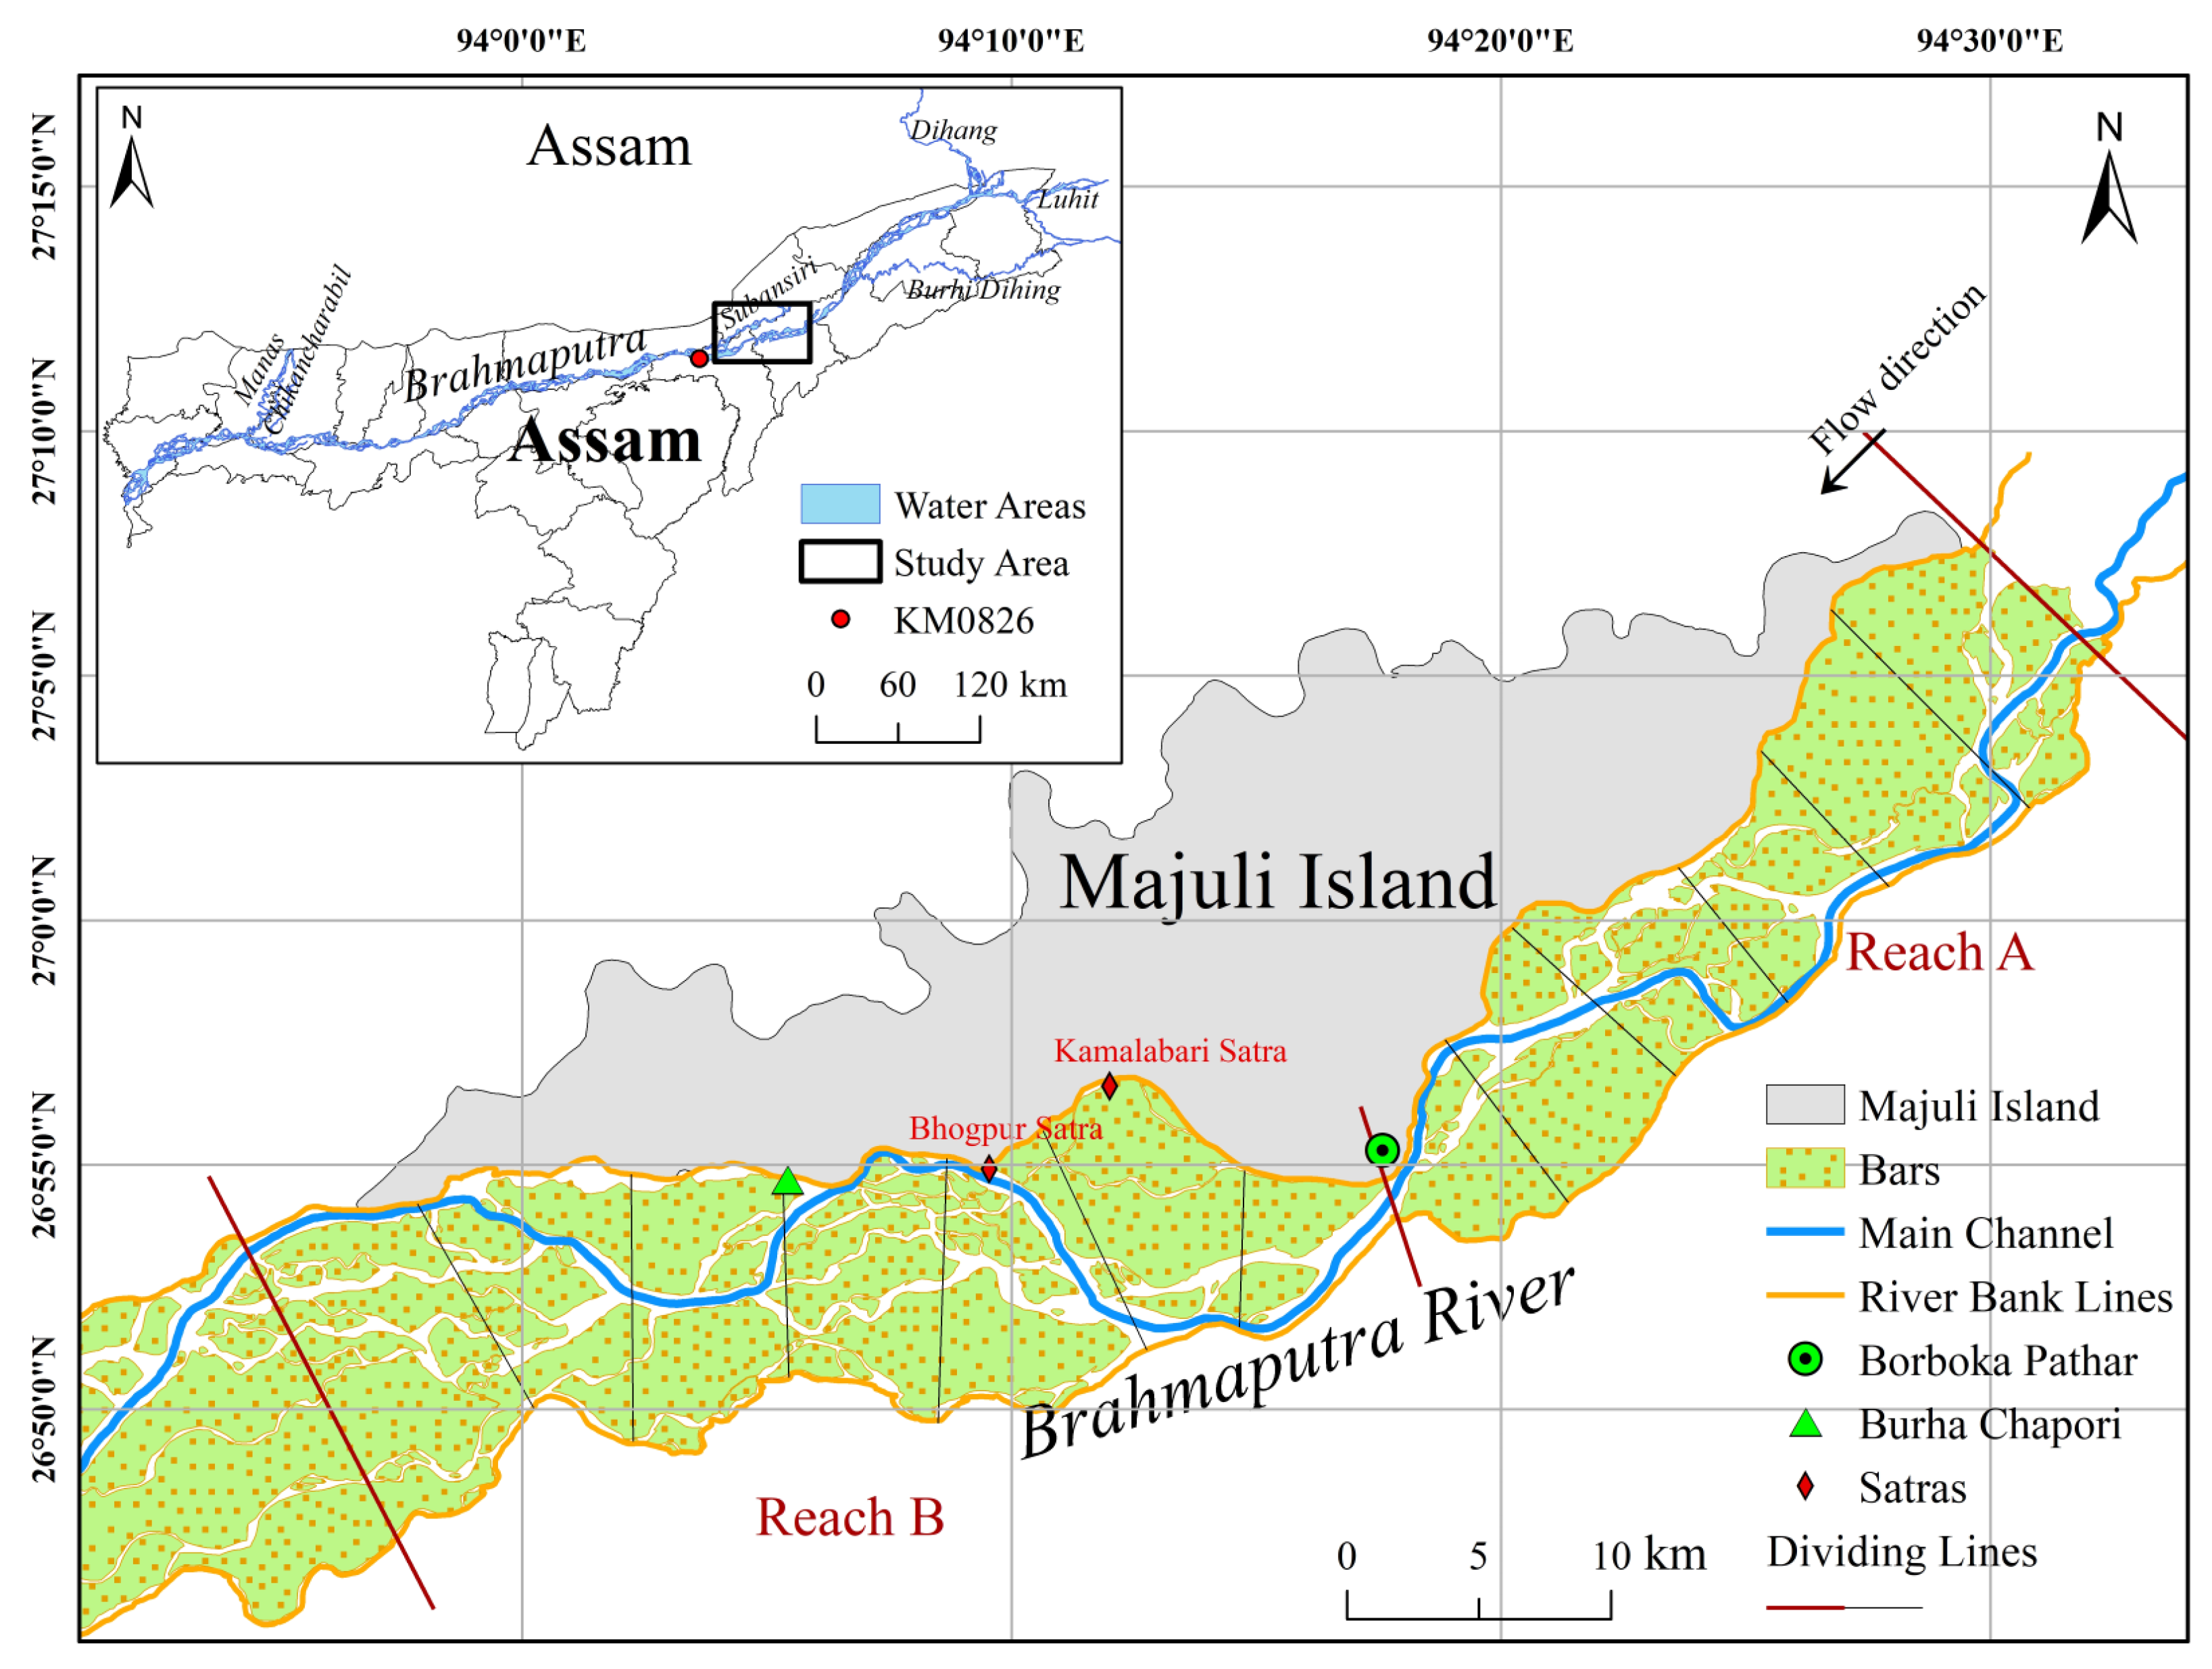
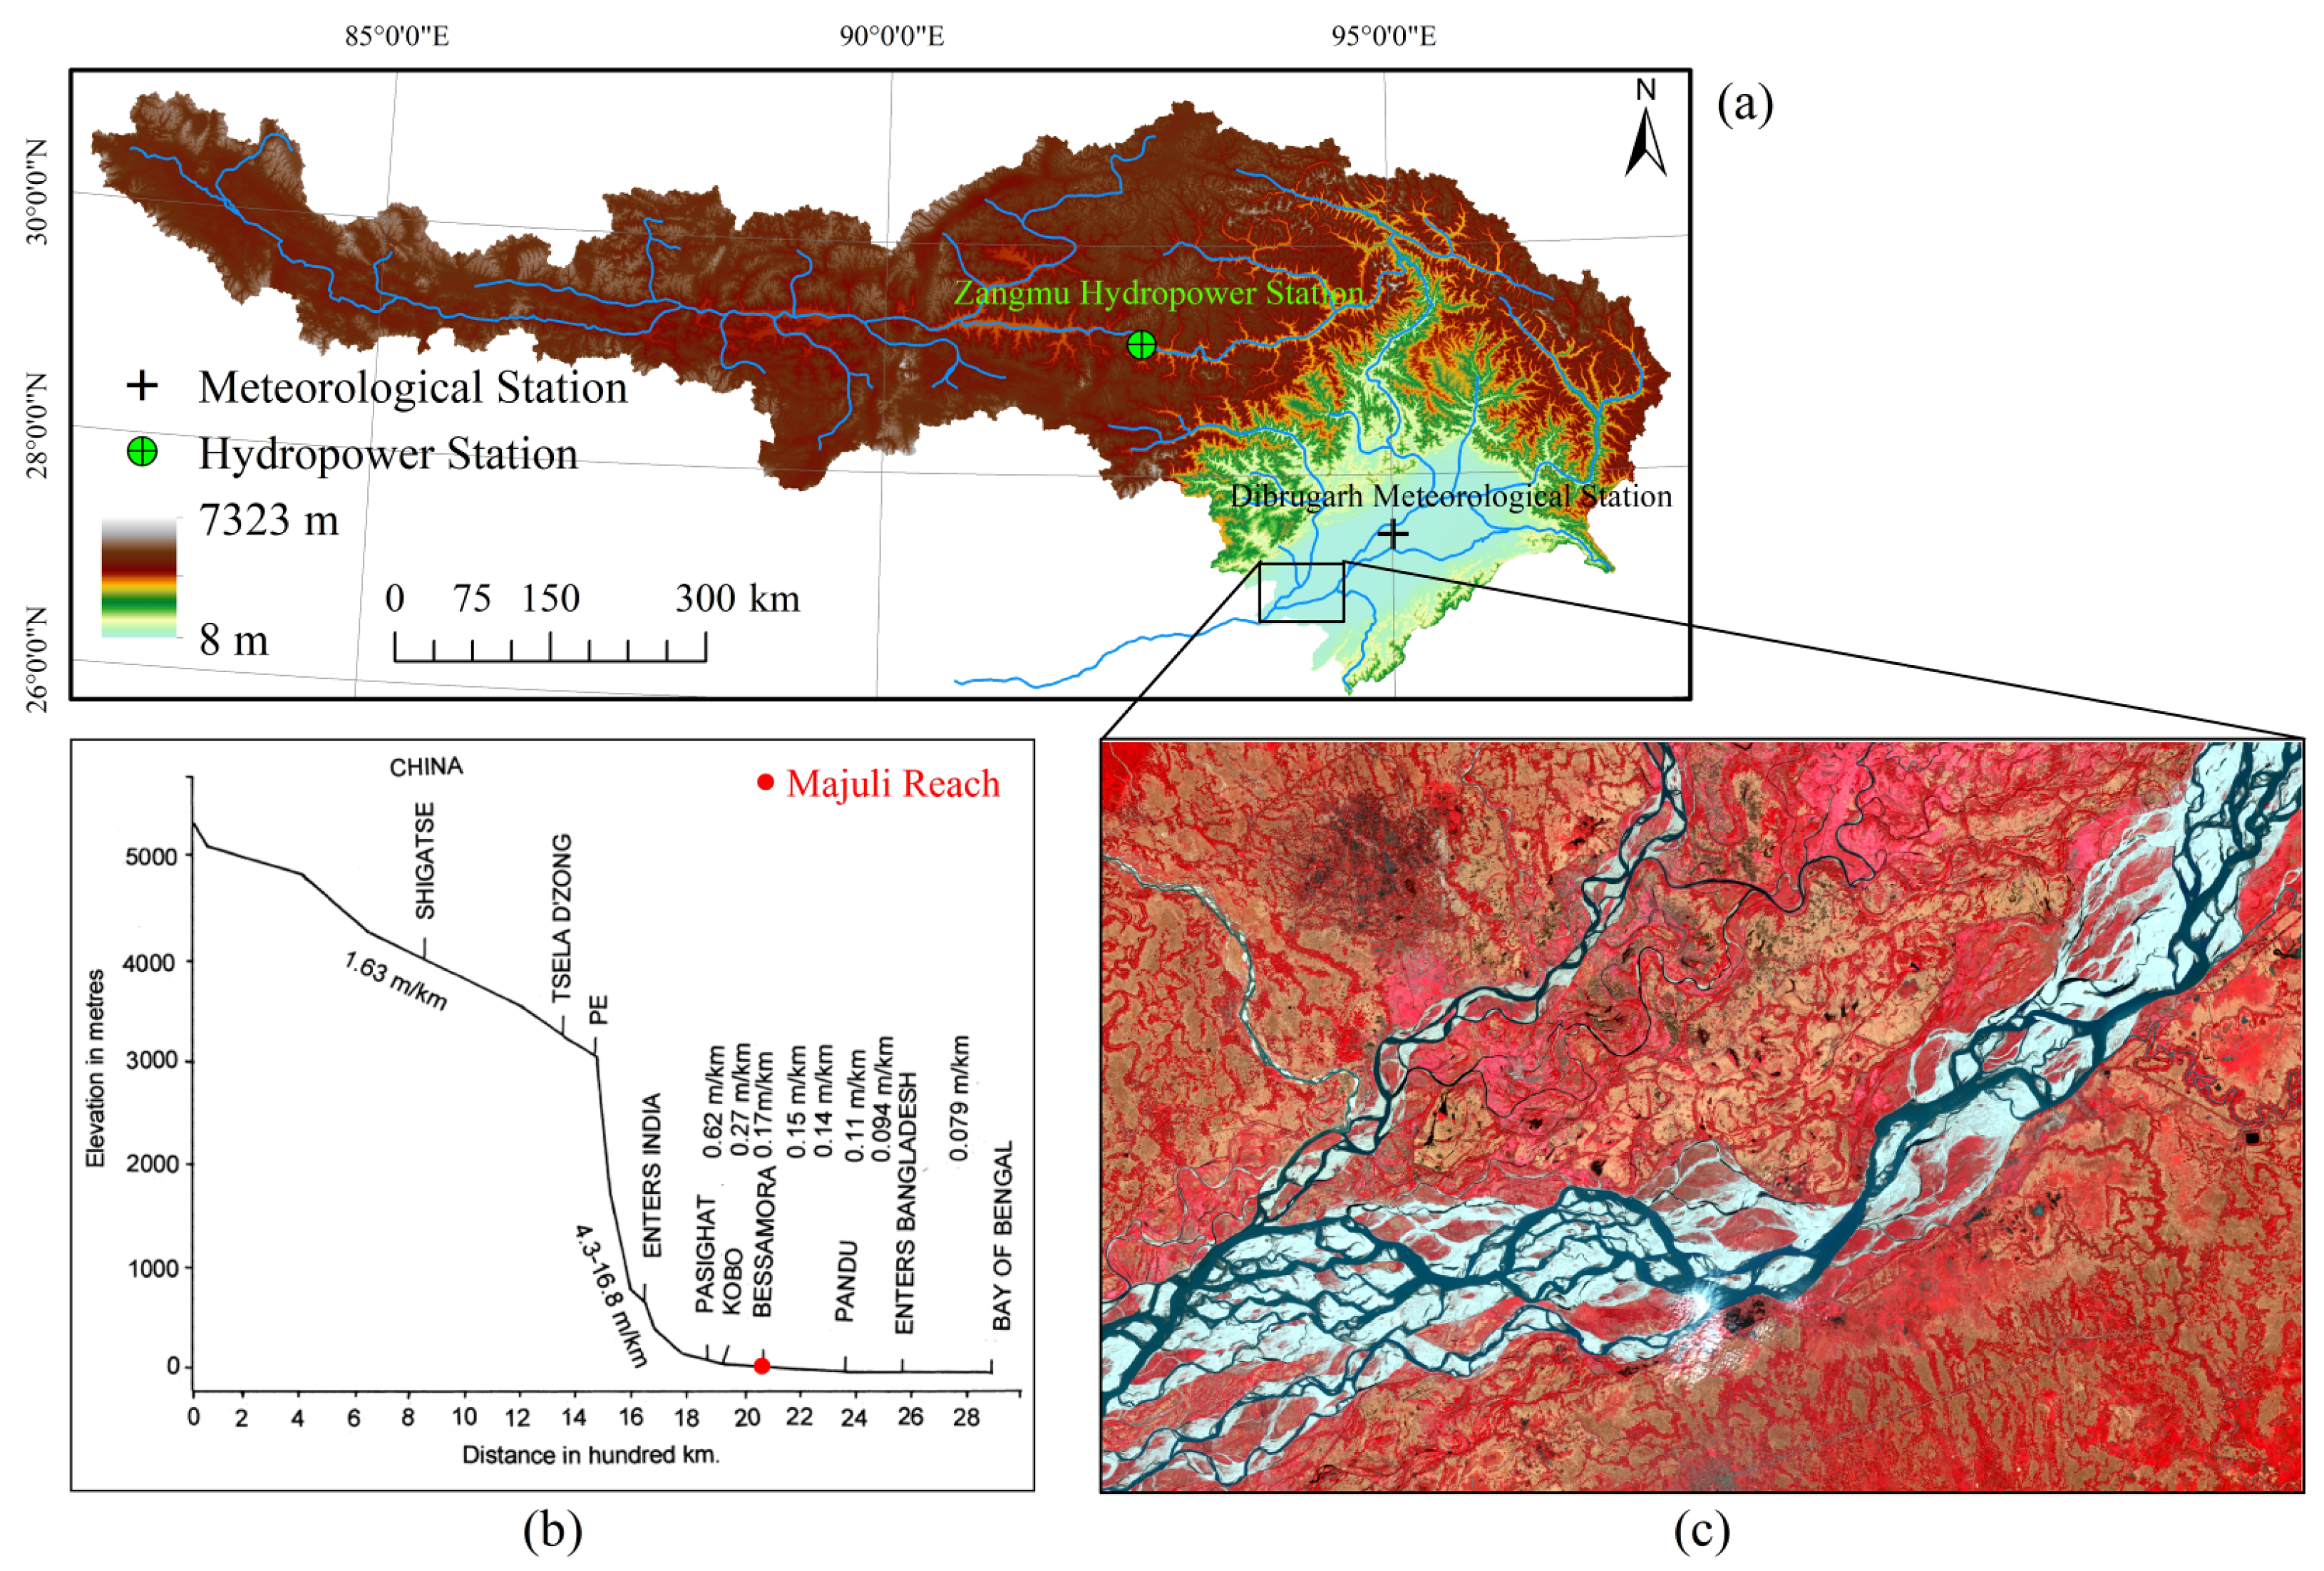
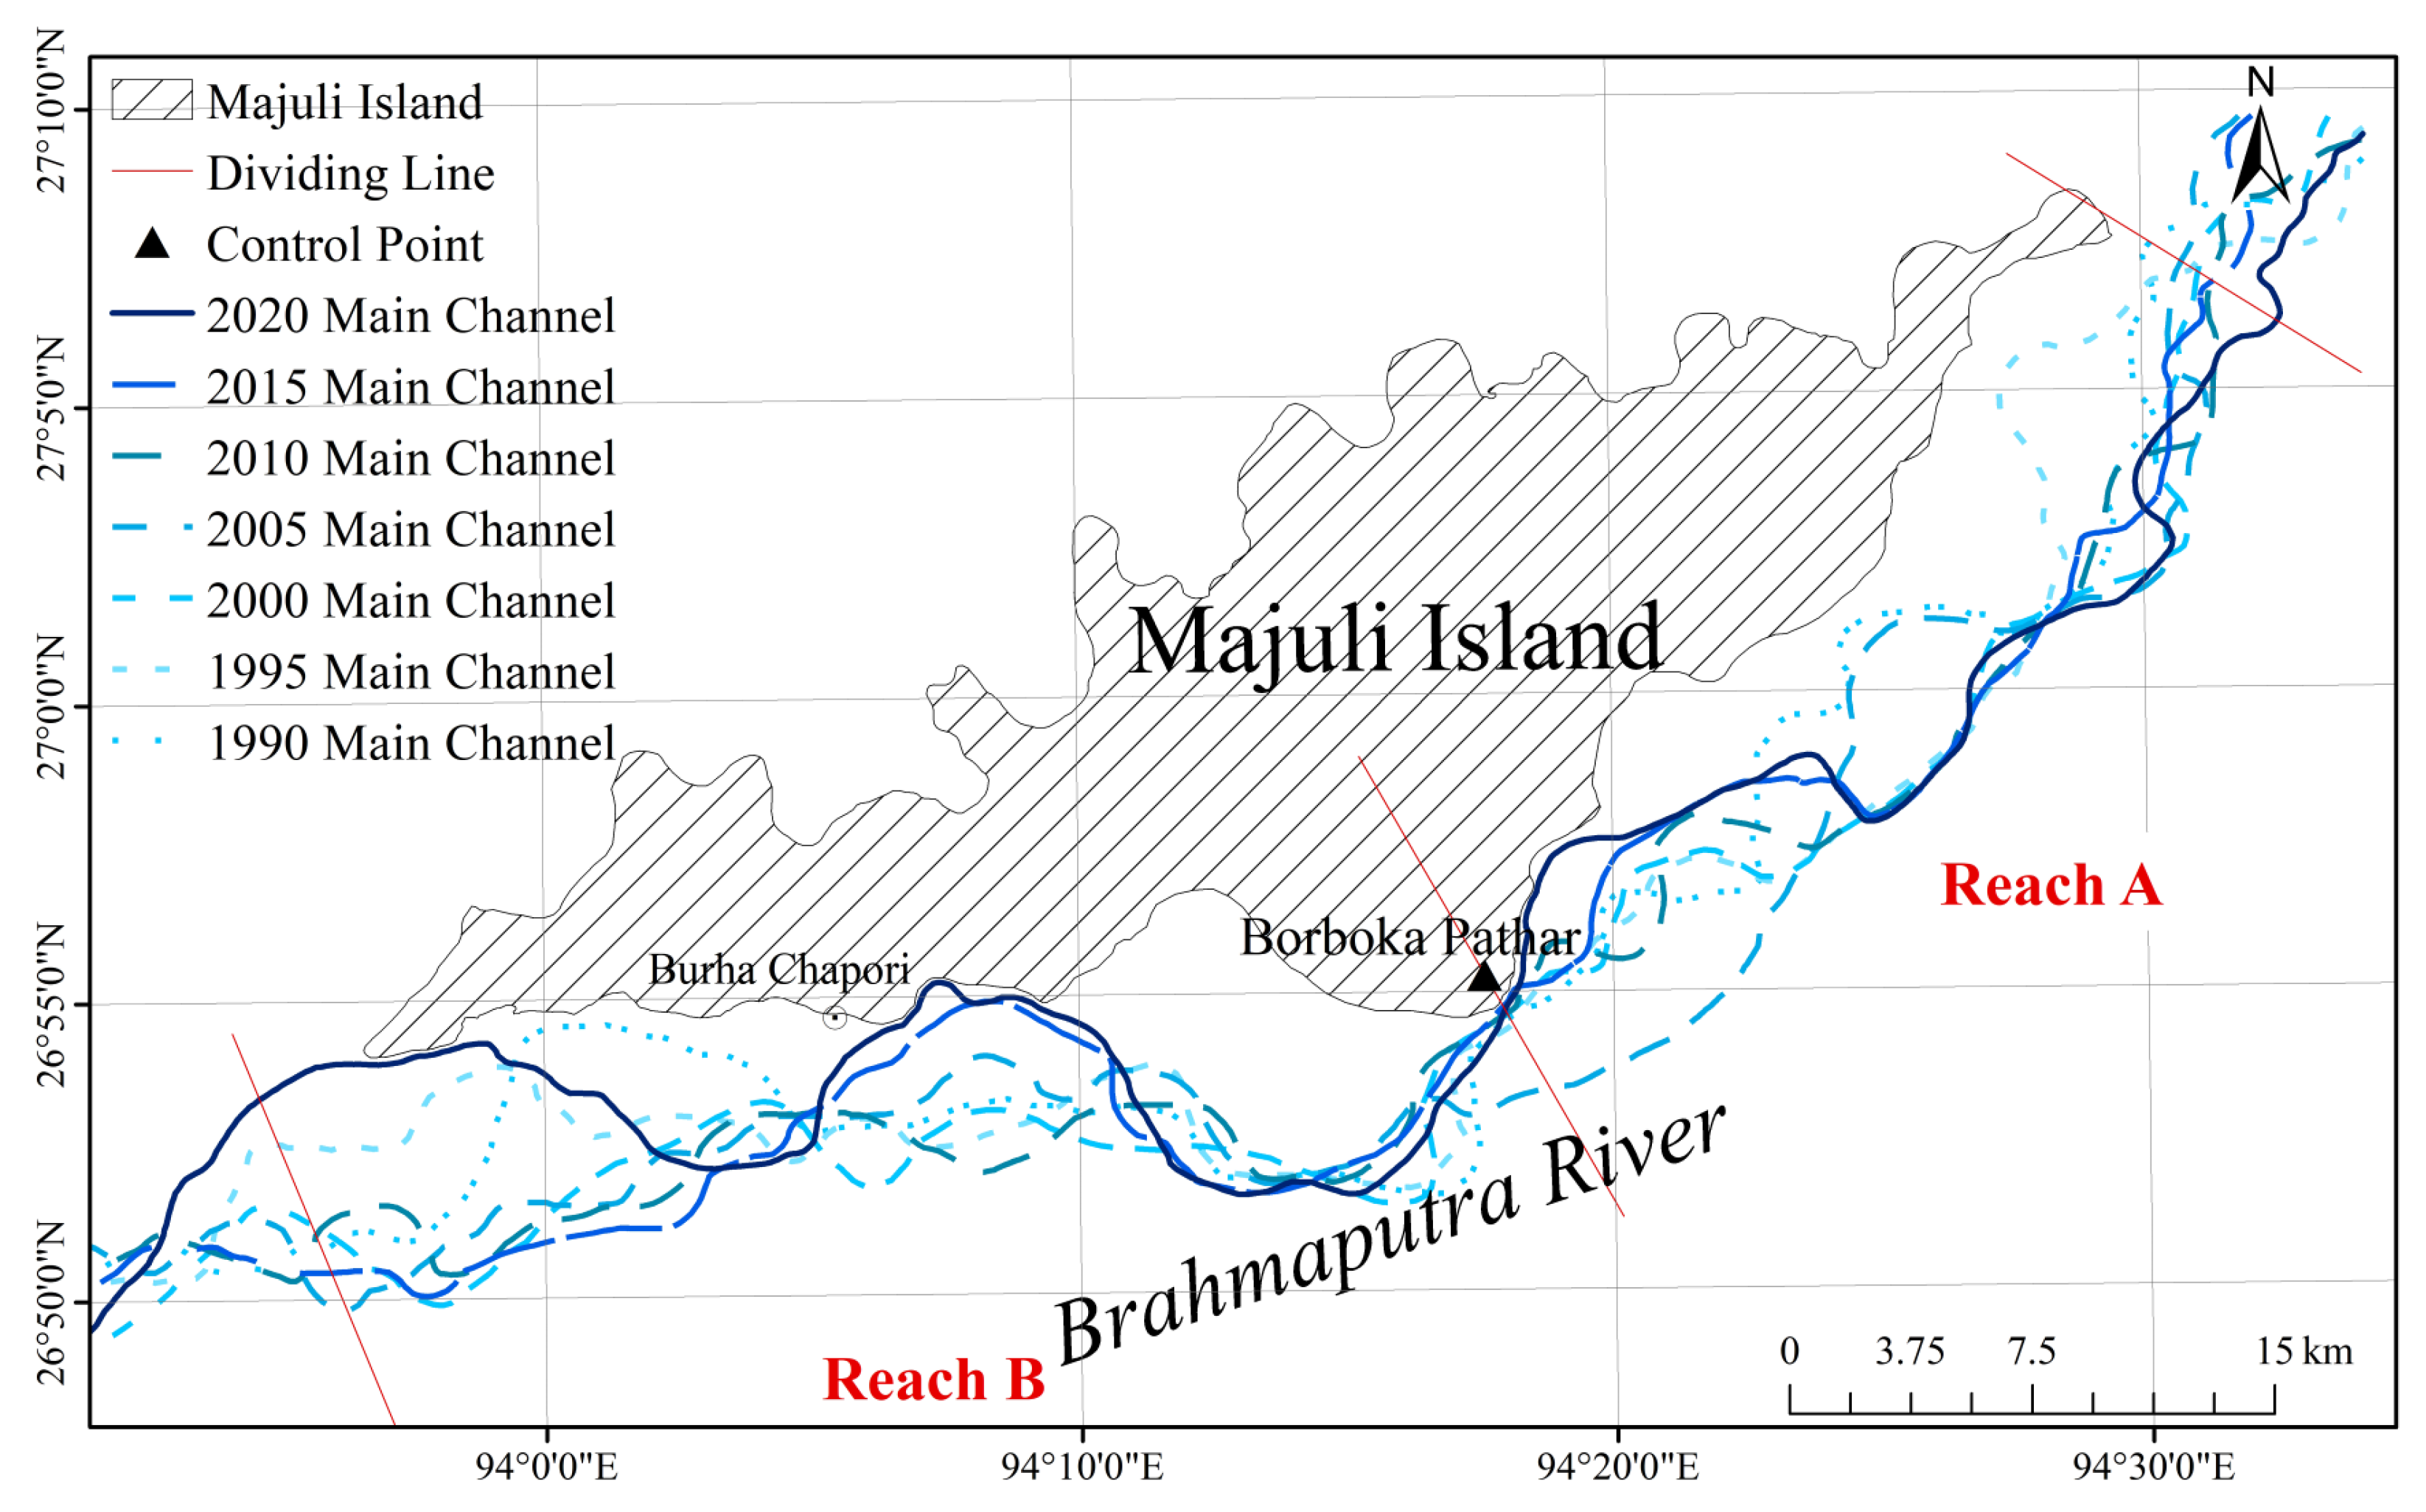
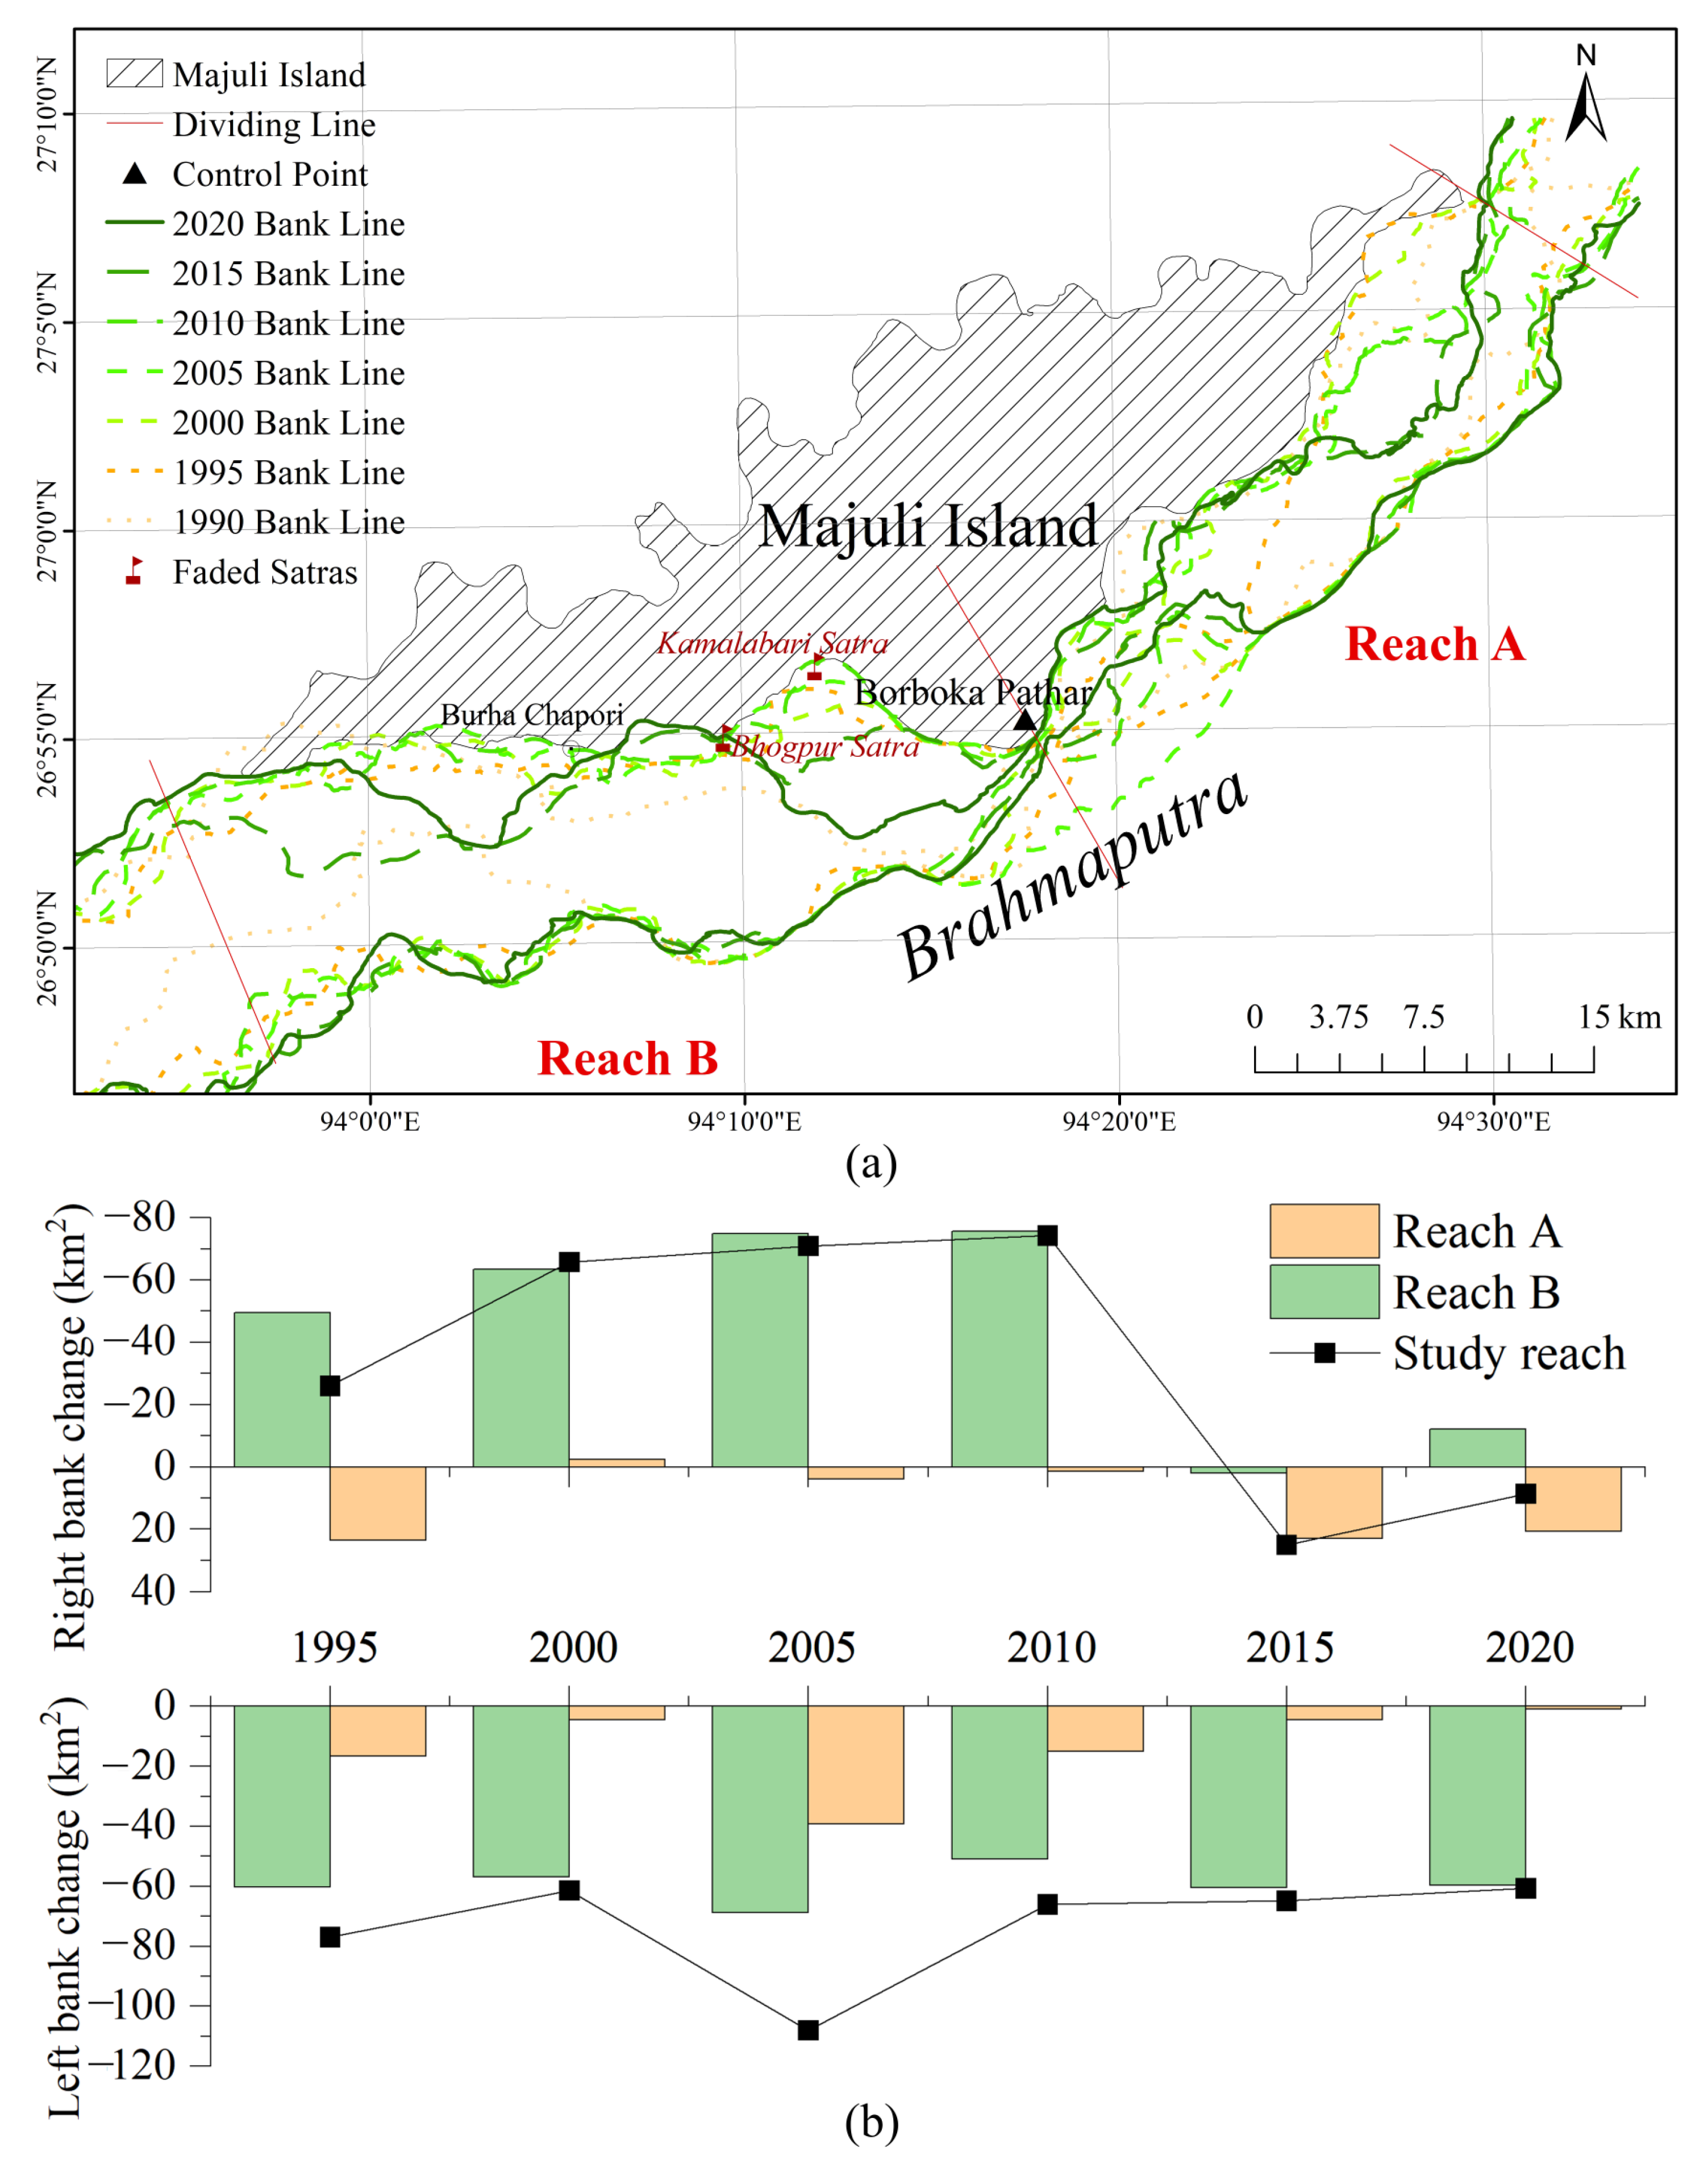
2.1. Study Area

Majuli Reach is a braided river reach of the Brahmaputra River in Assam, India, as shown in Figure 1. It is approximately 130 km downstream of the confluence of several fast-flowing tributaries, the Dihang, Lohit, and Dibang rivers, where the river emerges from the gorge into the flat Indian state of Assam (Figure 2a,b) and develops a braided structure [17,24]. The braided morphology of the Majuli Reach is characterized by the development of densely migrating sandbars and active braided channels, with an over-water width of more than 10 km (Figure 2c). The evolution is governed by seasonal hydrological variability and tectonic forces. Situated in a tropical monsoon climate zone, the study area experiences an average annual temperature of 26.5 °C and receives approximately 2300 mm of rainfall annually, predominantly concentrated during the June–September monsoon season, according to the Dibrugarh meteorological station (as shown in Figure 2a). High flows in the flood season carry large amounts of sediment and form temporary sandbars, while dispersed flows in the dry season lead to the regeneration of new channels. Tectonic activity in the eastern Himalayas drives exceptionally high erosion rates (>5 mm/a) in the upper catchment, resulting in substantial sediment fluxes with an average annual suspended sediment transport of about 499 Mt (gauged at the Bahadurabad station (89.67°E, 25.09°N) in Bangladesh downstream of the study reach). The bed material composition is dominated by medium to coarse sand (D50 = 0.2–1.0 mm), which provides the material basis for the development of braided channels [22,23]. Regional seismicity (e.g., the 1950 Assam earthquake) induces riverbed uplift and local gradient adjustments, accelerating lateral channel migration (with an average annual lateral erosion rate of 20–50 m), leading to the persistent collapse in the southern part of the island [20,23,35,37]. As the lower reaches of the river channel have moved toward the island and the upper reaches have moved away from it, land loss has increased in the southwest of Majuli Island, increasing the area of inter-channel bars in the lower reaches [20,37].
Anthropogenic land use activities and the Zangmu hydropower station (as shown in Figure 2), which started operation in 2015, had limited direct impacts on river morphology during the study period (Figure A1 and Figure A2), while river engineering works along the Majuli Reach seem to have exacerbated river migration to the Majuli Island. Since 2004, the Government of India has initiated flood and embankment protection projects under the “Save Majuli” action. River engineering measures, such as the construction of embankments, flood control dykes, stone spurs, RCC (Reinforced Cement Concrete) porcupines (porcupine-like structures designed to interlock and create a barrier that reduces the flow speed and prevents erosion), and sandbags along the river edges, were implemented to protect the southern bank of Majuli Island and its flood embankments from erosion [17]. However, these measures have focused on quarantining the island from the influence of the Brahmaputra River rather than developing long-term, process-based solutions anchored in a proper understanding of the evolution of the island [37]. Since these measures were implemented, the braiding degree of the river has increased, the channel has widened, and the deepest sub-channel has started to migrate northward, posing a threat of bank erosion [20].

2.2. Data Collection and Processing

Three types of data have been collected and processed: Landsat dataset, meteorological data (temperature and precipitation), and hydrological data (discharge and water stage).
To describe the planform of the Majuli Reach and investigate the response between planform and discharge, seven satellite remote sensing images during the non-monsoon season in the last three decades (1990, 1995, 2000, 2005, 2010, 2015, and 2020) were collected (Table 1). The selection of images was based on the following criteria: a consistent yearly interval, image dates in the post-monsoon season, water levels in the images within a reasonable range of variation, cloudiness in the image data of less than 10%, and the availability of necessary images which could cover the whole study area. According to previous research, the morphological evolution of a river after disturbance is highly variable over short periods [28,39], and the planform takes several years to reach a new quasi-equilibrium state [25,39,40,41]. Quantification of the equilibrium period for the Majuli Reach is scarce, but information is available from the analogous lower Brahmaputra River [27]. Both reaches share high braiding intensity, dynamic width variability, and monsoon-dominated discharge. Empirical evidence from this analogous system suggests a dynamic equilibrium period of 5–10 years. Given these parallels, we adopt a conservative 5-year interval for consistency. Images taken during the post-monsoon season could show the overall layout of bars and channels of the river reach after floods, and are widely adopted to represent channel geometry for a year [2,3]. According to the calculation, the water level was between 71.31 m and 73.85 m on each image acquisition day, which can be considered to reflect the geomorphology of the channel at the same stage for comparison purposes [42]. Moreover, images with less cloud-cover affection could reflect the river features better. The Landsat dataset is provided by the Geospatial Data Cloud site, Computer Network Information Center, Chinese Academy of Sciences (http://www.gscloud.cn, accessed on 30 March 2022). ENVI 5.6 (the Environment for Visualizing Images) was used to restore, correct, merge, and crop the remote sensing images. Standard false-color combinations of the images were applied, and the three primary colors of red, green, and blue were assigned to the near-infrared, red, and green light bands, respectively, so that the synthetic images were easy to read: water in blue–black shades, bars in grey–white, and vegetation in red. ArcGIS 10.8 was used to complete the digitization and data acquisition of the remote sensing images. The attribute information of the bars, channels, and banklines in the geodatabase was exported to obtain data on the length and area of the river reach, the number and area of the bars and channels, and the area of the polygons formed by changes in the banklines. These data were used to calculate the geomorphological parameters and the braiding indexes, namely the MPFI.
The second type of collected data includes monthly discharge and water level. The daily river discharge data for the main river channel and its tributaries in the study area for 1979–2020 were obtained from the Global Reach-level Flood Reanalysis (GRFR) dataset [43]. Monthly averages were then calculated. The water level data at the virtual station named KM0826 (93.63°E, 26.72°N, as shown in Figure 1), located downstream of the Majuli Reach, were obtained from the Hydroweb database produced by the Laboratoire d’Etudes en Géophysique et Océanographie Spatiales (LEGOS) for the period 2009–2022. As a major satellite river water level dataset, the Hydroweb dataset has high overall accuracy [44,45] and performs well when applied to water level analyses of large rivers such as the Yarlung Zangbo River [46,47,48]. The water level data were resampled into a monthly dataset by calculating the average values for each month.
The third type of collected data is the global historical monthly temperature and precipitation data, obtained from NASA’s GLDAS Noah Land Surface Model L4 monthly 0.25 × 0.25-degree V2.0 and V2.1 products [49,50] for the period 1979–2020. Data for the upper basin of the Majuli Reach were extracted, and monthly averages were calculated.

2.3. Braided River Morphology Indexes

The planform changes of braided rivers are usually described quantitatively by parameters related to braiding intensity, inter-channel bars, and branches. In this paper, the inter-channel sandbars and the vegetated islands are included and termed bars, and the main channel is defined as the widest active channel.
Braiding intensity is normally portrayed by the braiding index [18,42,51]. Various braiding indexes have been proposed (i.e., MPFI, BIB*, BIT3), and each has its merits and limitations [8,10,38,52]. Here, the MPFI [20,53] was selected to evaluate the braiding degree of this highly braided river, as its applicability to the Brahmaputra River has been validated. This braiding index evaluates bar and active channel features simultaneously and includes the length and the width of the river as parameters to represent the two-dimensional structure of the braided river, with lower MPFI values indicating a higher degree of braiding. The MPFI threshold values and the corresponding braiding degrees are given below [20].
M P F I = L B i L r × T ¯ W r × 100 N                 M P F I < 6 : V e r y h i g h l y b r a i d i n g 6 < M P F I < 18 : H i g h l y t o m o d e r a t e l y b r a i d i n g M P F I > 18 : M o d e r a t e l y t o l e s s b r a i d i n g
where LB is the length of a single bar, Lr is the length of the reach, T is the mean width of the body of water (the ratio of the total area of the body of water to the length of the reach), Wr is the mean width of the channel (the ratio of the total area of the reach to its length), and N is the number of braided channels.
The geomorphology of the braided channel can be described directly by bars (area and number) and channels (main channel shifts and riverbank line changes) [18,54,55,56,57]. In this paper, bars are described by the number and area of four categorized bars according to their size, as large (bar area > 10 km2), medium (1–10 km2), small (0.1–1 km2), and mini-sized (<0.1 km2) bars. The shifts of the main channel are studied to understand the channels’ displacements since 1990. The riverbank line changes are measured by the changes in the area of the riparian zone, given that the variation of the right riverbank line in Majuli Reach represents the land loss of Majuli Island.
According to the initial analysis, there is a prominent site which has experienced little retreat in the last three decades, located at Borboka Pathar (abbreviated as BP, 26.9199°N, 94.2926°E, as shown in Figure 1). Evolution upstream and downstream of it is different, indicating that this site is a control point of this braided river reach. Thus, the evolution of the Majuli Reach could be described separately by the upstream and downstream of BP, called Reach A and Reach B, respectively (Figure 1). The division into thirteen more detailed segments in the reach facilitates the counting of bars and branches. The segments are evenly spaced over a minimum representative length determined by a criterion that does not exceed the average width of the reach [38].

2.4. Delayed Response and Regression Analysis

The correlations between channel deformation and past hydrological alterations are analyzed using delayed response and regression analysis. The correlations between climatic factors and discharges in different seasons are examined in the discussion using correlation analysis.
The analysis of the delayed response aims to identify the time scale at which previous hydrological conditions have affected a particular state characteristic of the river by modeling the correlation based on the principle that the rate of river adjustment in response to a disturbance is proportional to the difference between the current state and the equilibrium [25,40,58]. The time scale is usually related to the river’s self-regulation activity and the transport of water and sediment. For example, previous hydrological conditions affect the current bankfull discharge of reaches in the Yellow River, with the response time varying from 2 to 14 years in reaches of different patterns [26,41,59], and the response time is variable due to human-induced hydrological alterations [60,61,62].
Regression analysis was used to establish the relationship between MPFI and the n-year (n ranges from 1 to 8) moving average discharge. Previous research has reported that the moving average method is a simplified version of the delayed response model with good results, although the weight of the influence of hydrological factors may vary in different years [59]. The response time of n years is determined by the largest correlation coefficient, including statistical results of Pearson’s r, R2, significance, and MSE. Three kinds of discharge were adopted to investigate the delayed response of the MPFI to hydrology conditions, namely the mean annual discharge, flood season discharge, and flood season peak discharge. The mean annual discharge was taken as the average discharge of a hydrological year, with the hydrological year for this reach defined as June to the following May, and the flood season included July, August, and September [31]. The analysis of flood season discharge and peak discharge aims to display the important effect of high discharge on the braided pattern. One thing that should be pointed out is that both discharge and sediment are the main factors influencing braided channel morphology. However, the study focused on the effect of past discharge conditions on the MPFI in the Majuli Reach due to the lack of sediment information. The limitation of missing sediment data will be discussed.

3. Results

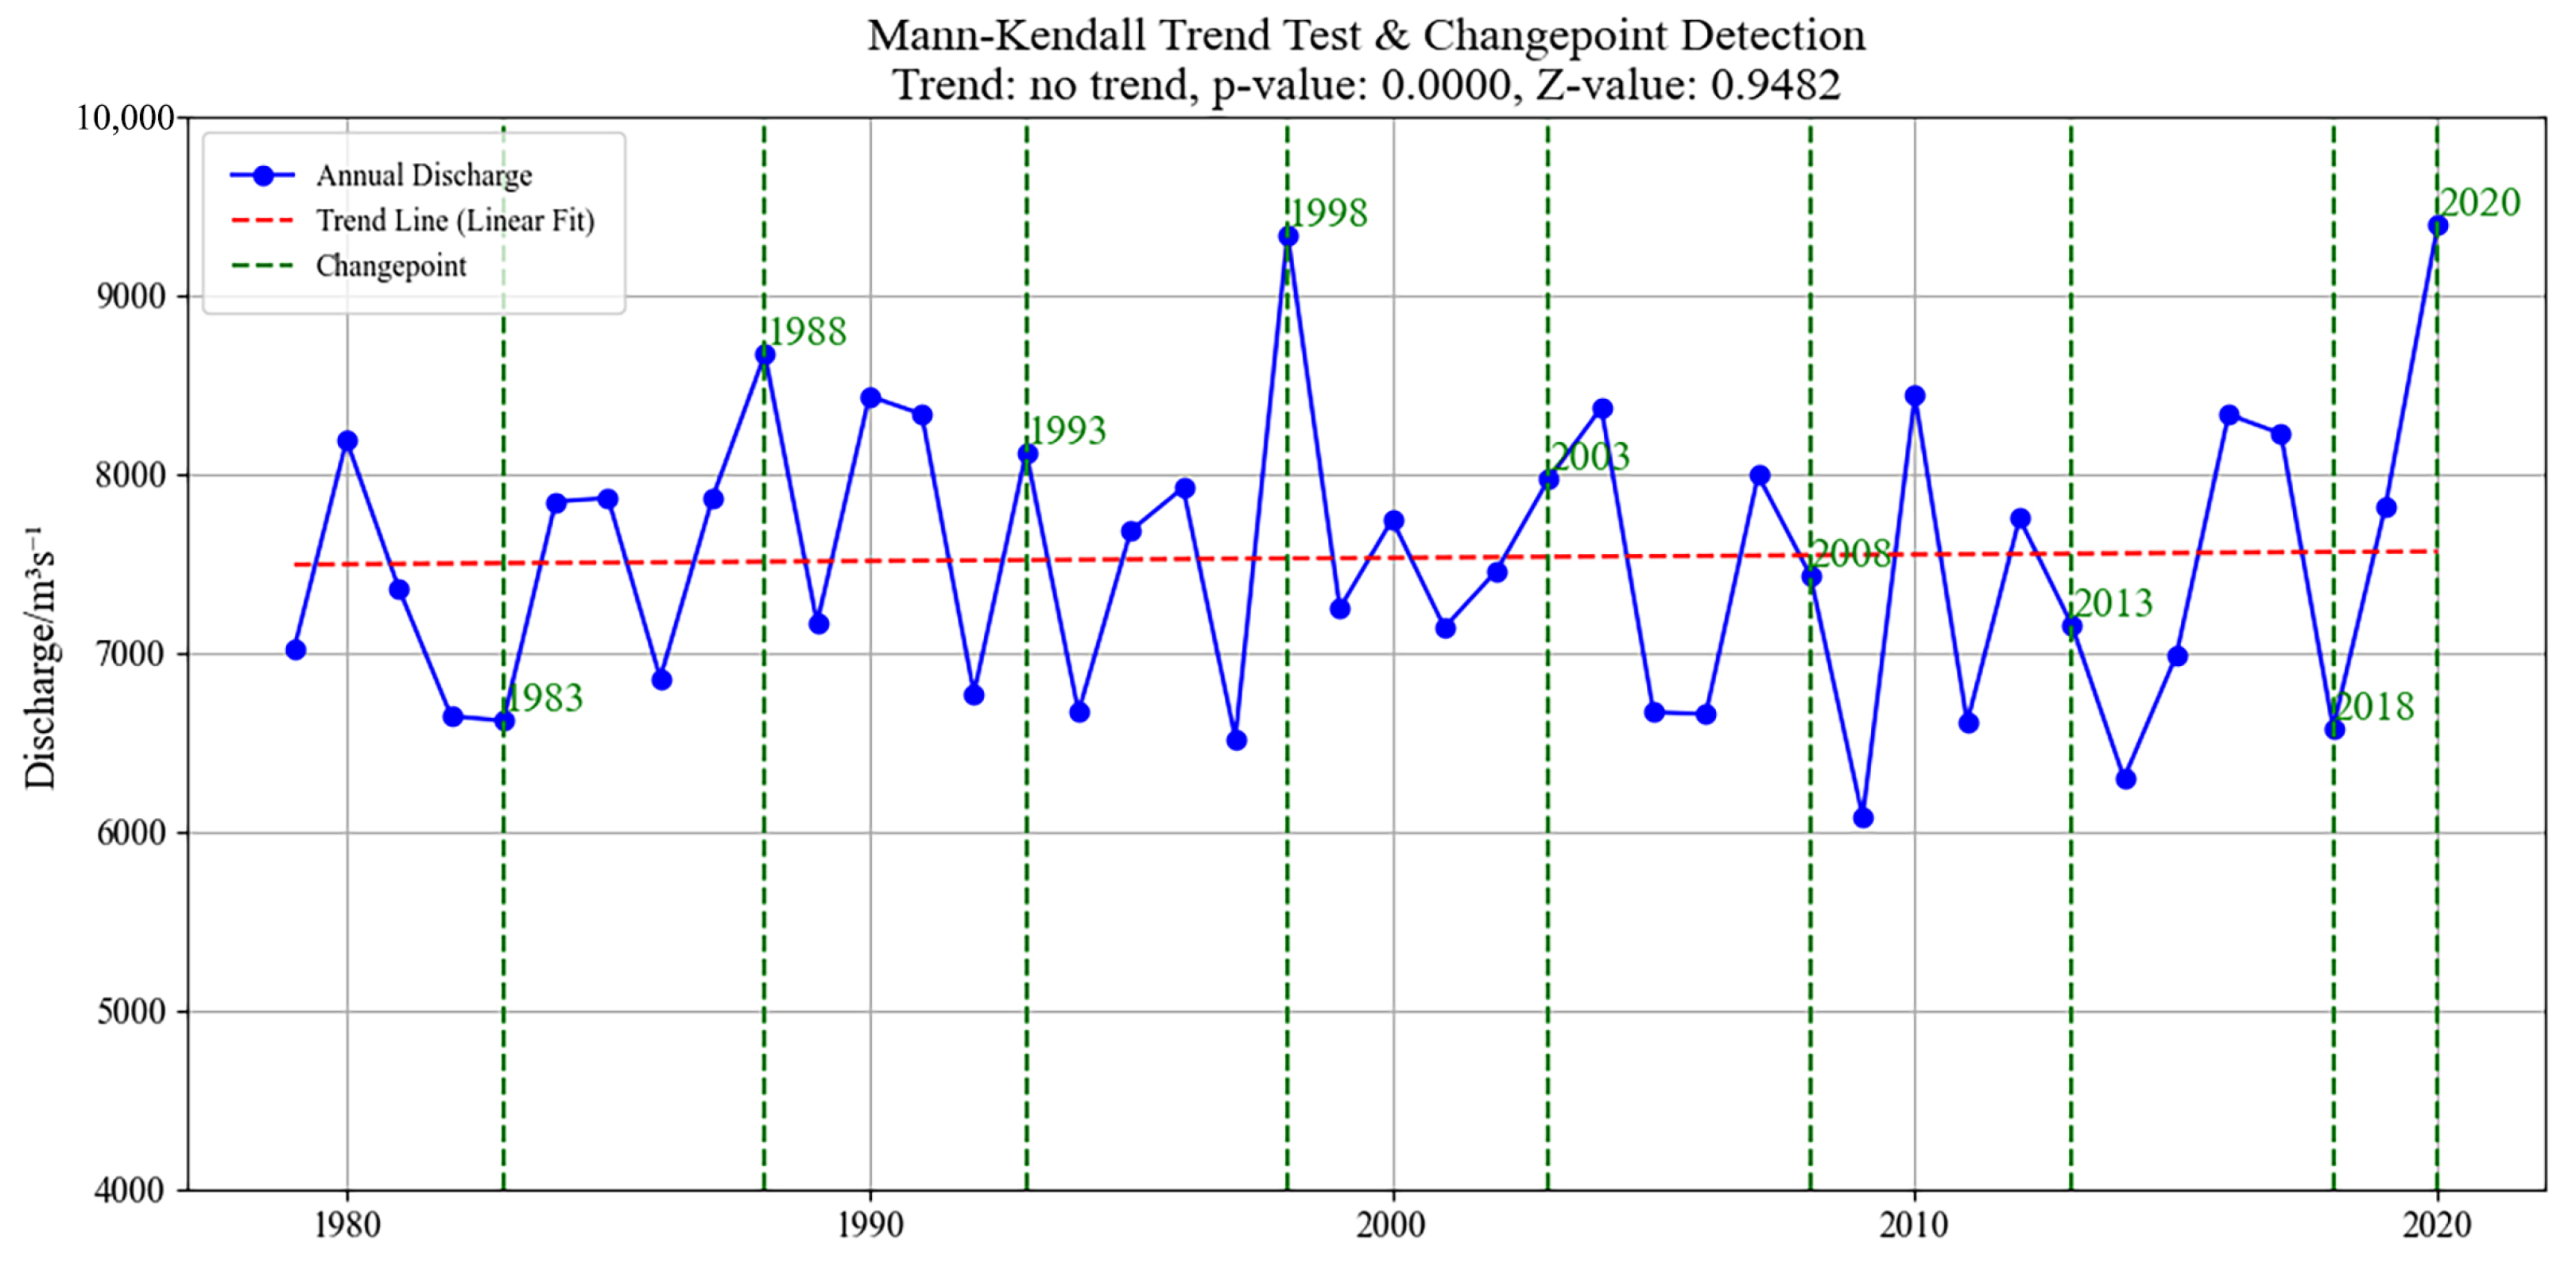
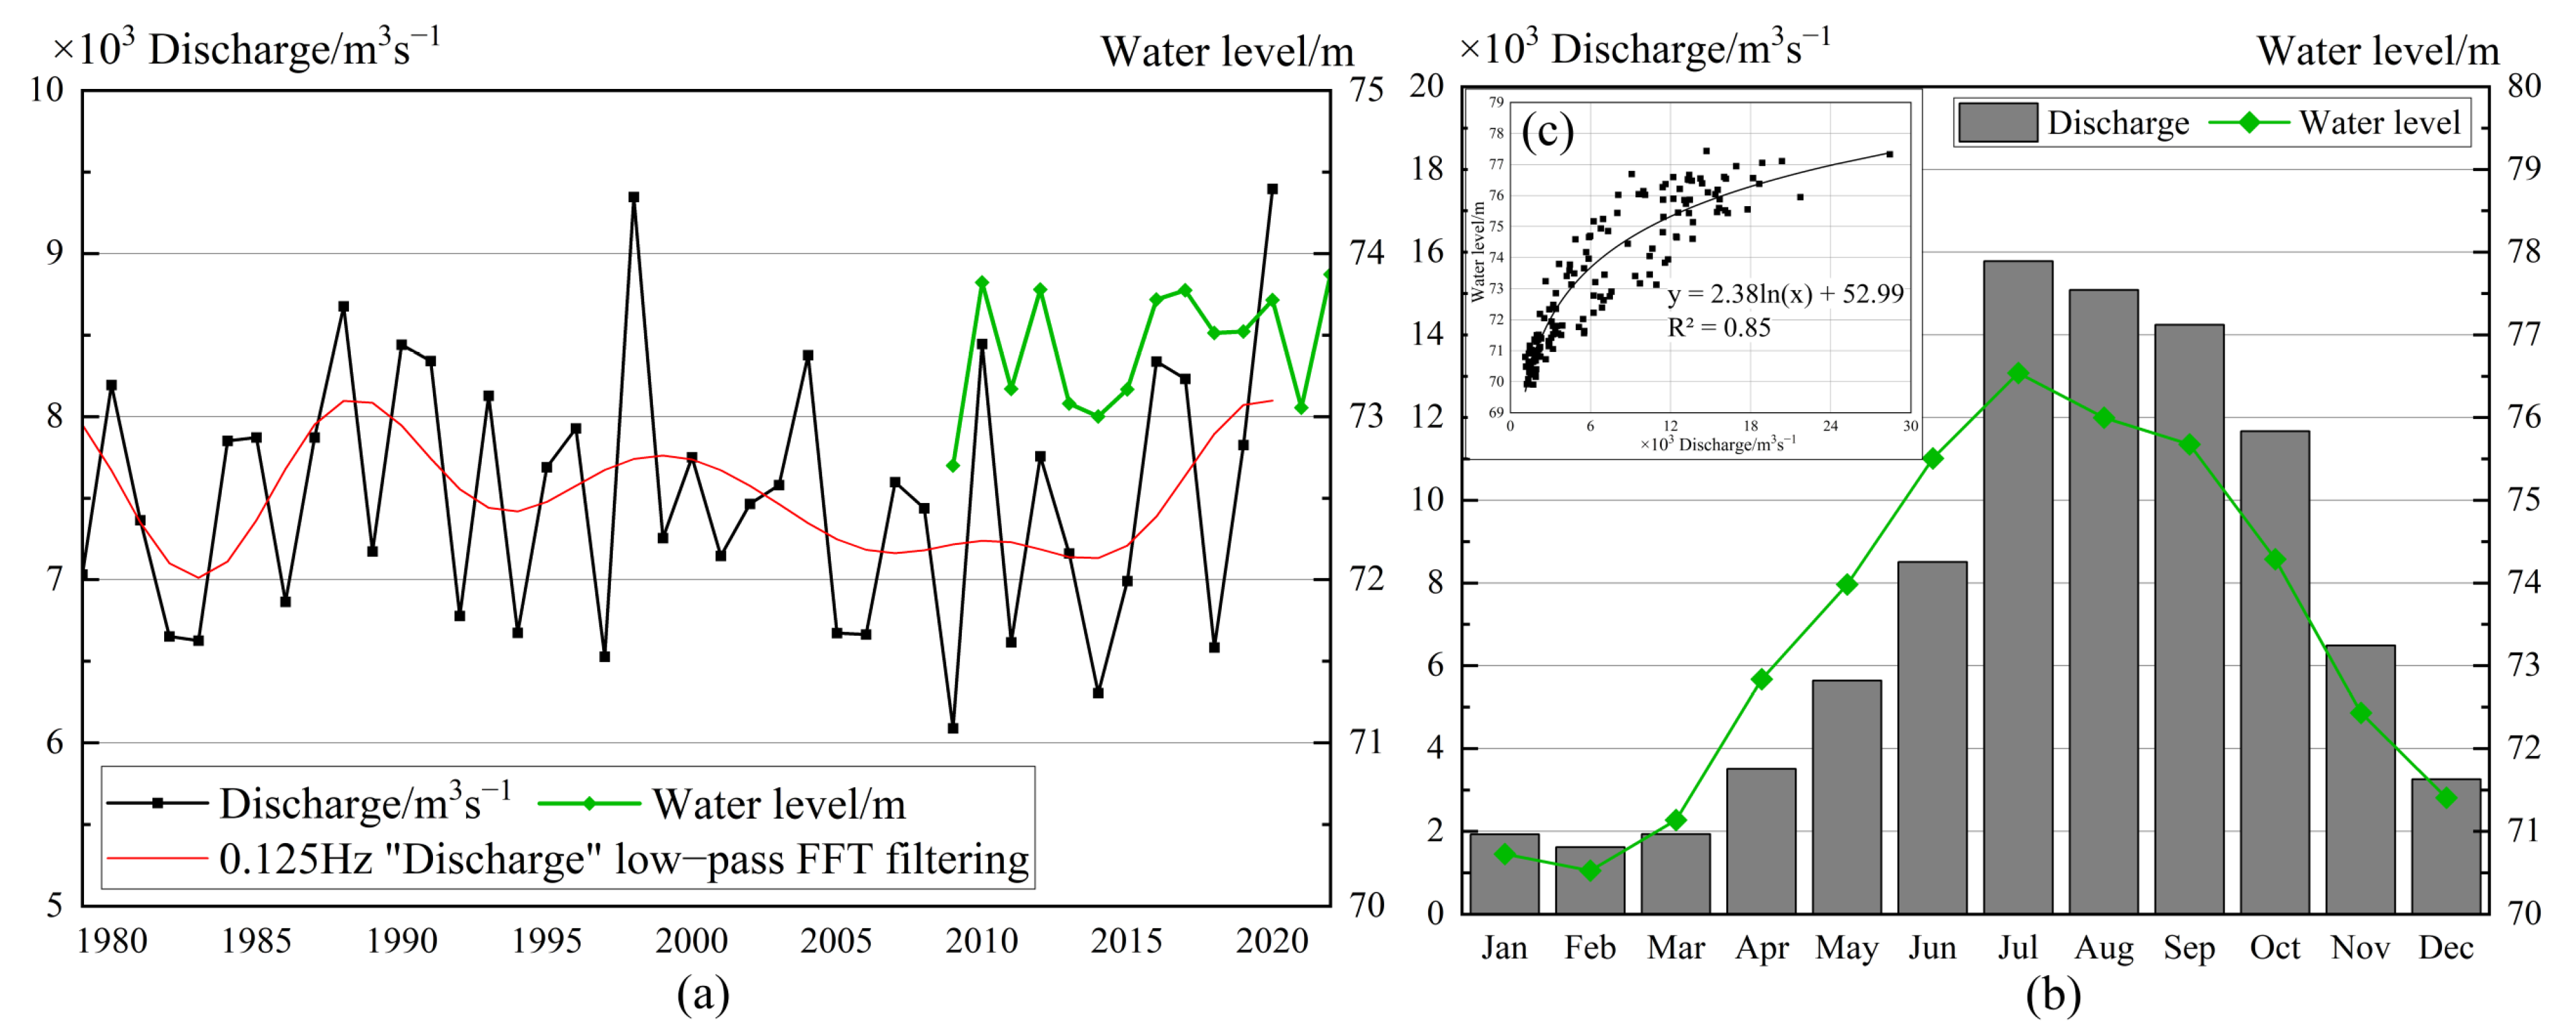
3.1. Hydrological Characteristics

The 1979–2020 sequence of discharge changes and multi-year mean monthly discharges in the Majuli Reach was analyzed. As shown in Figure 3a, the Majuli Reach has a widely fluctuating annual discharge, with an average of about 7516.92 m3s−1. Monthly averages of multi-year hydrology data (Figure 3b) were calculated. The discharge peaks in July within a year, averaging up to 15,779 m3s−1 and exceeding 20,000 m3s−1 in large flood years, while the discharge in February is the lowest at 1616 m3s−1. Discharge increases from April to May due to snowmelt, and then rises sharply from June to July due to monsoon rains. From July onward, there is a steady decrease to less than 12,000 m3s−1 in October, and then the discharge drops dramatically to about 3000 m3s−1 in December, creating conditions for observing the overall channel morphology after monsoon floods. Water levels follow the same changing pattern as the discharge. In addition, to fill in the missing values of the water level data, the stage-discharge curve was constructed from monthly discharge and water level data for the years 2009–2020. The relationship between water level (y) and discharge (x) is y = 2.38ln(x) + 52.99 (R2 = 0.85).

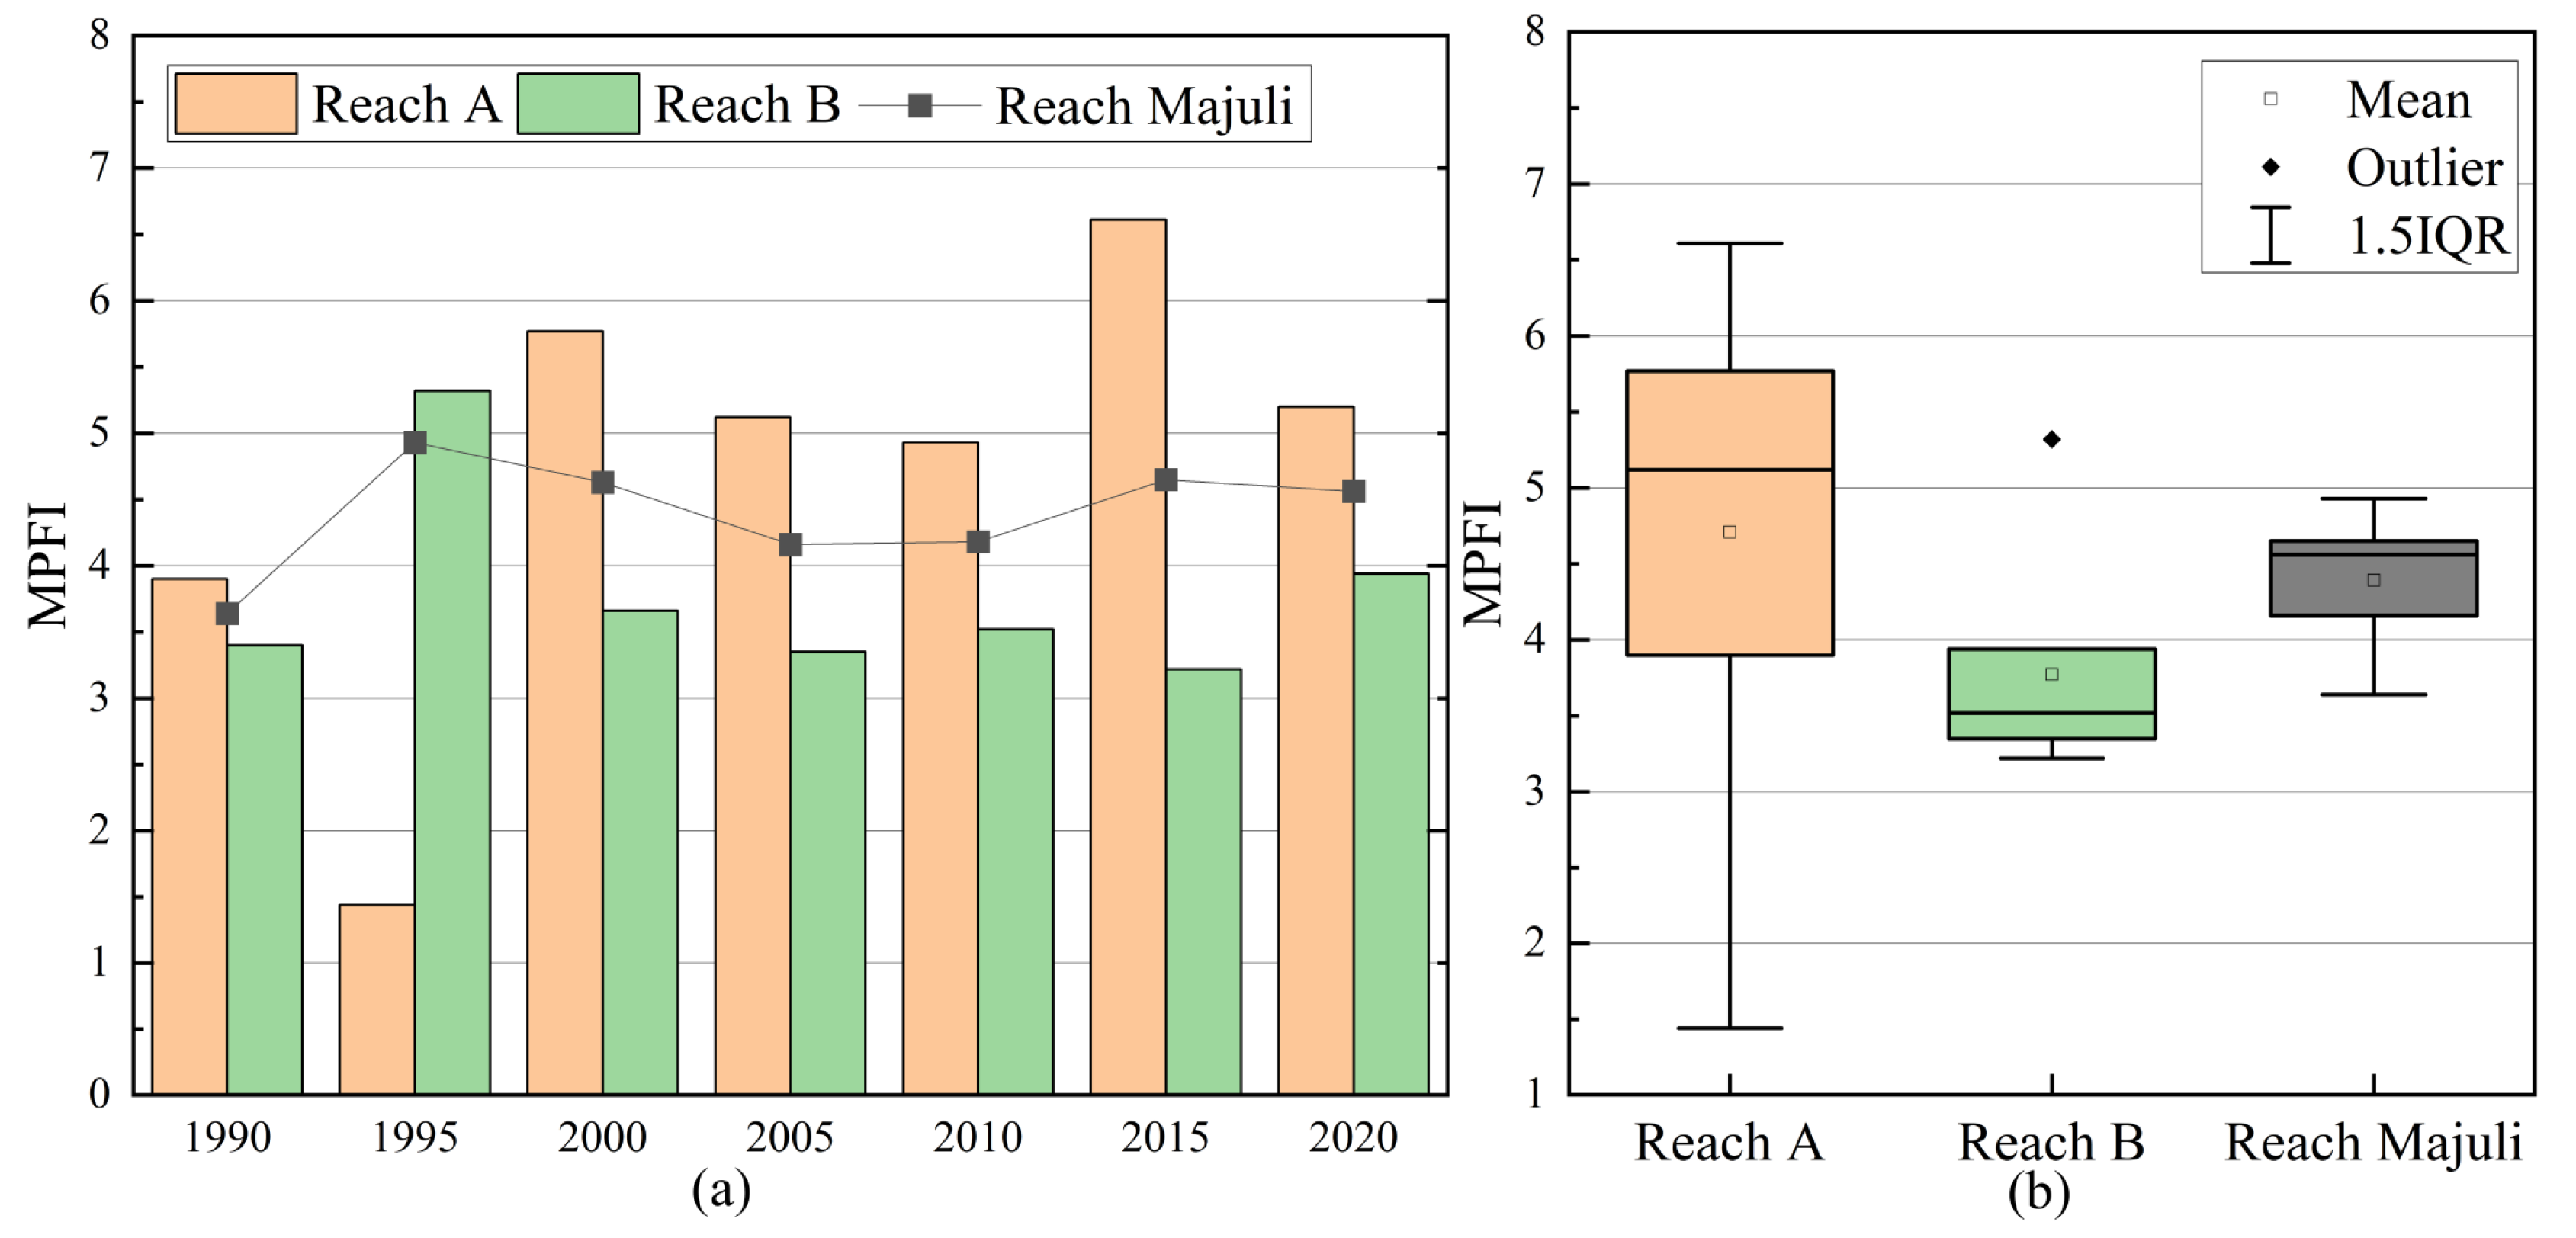
3.2. Changes of Braiding Degree

MPFI is an index that characterizes the braiding degree well in highly braided rivers [20]. Figure 4 shows that the MPFI of the Majuli Reach varied from 3.64 to 4.93, with an average of 4.39 during the study period, indicating a high degree of braiding. The increasing MPFI in Reach A indicates that its braiding degree has decreased from a high to a moderate level, while the decreasing MPFI in Reach B indicates that its braiding degree has increased to a much higher level. In sum, Reach A (mean MPFI of 4.71) has a lower degree of braiding than Reach B (mean MPFI of 3.77) but is more variable in terms of MPFI.
Control points of a river play a role in regulating the channel braiding. The sub-reach near the control point BP has a lower MPFI of 7.20 than the other reaches because there is a thick bed of reddish–brown cohesive silty-clay at a depth of 4–5 m below the upper silt and fine sand layers [23]. The cohesive bank material mitigates flow-induced scour erosion while suppressing sandbar development and lateral channel migration, thereby reducing the main channel shift. To maintain a balance between the sediment load and the sediment transport capacity of the river, bank erosion and the increase in inter-channel bars are more likely to occur downstream of the control points [3]. In addition, the bank at Burha Chapori (as shown in Figure 1) consists mainly of silt and fine sand with layers of laminated clay and loose sand underneath [23,37], increasing the probability of bank erosion and channel widening. As shown in the study, Reach B, downstream of the control point BP, is wider and has more bars and a higher braiding degree than the upstream Reach A. Control points restrict lateral shifts of particular channels and accelerate downstream erosion, creating alternating wide–narrow channel patterns [63,64,65]. Control points can also regulate velocity distribution and alter river curvature [66,67,68]. Thus, it is hypothesized that constructing control points with appropriate locations and materials can help regulate the channel morphology.

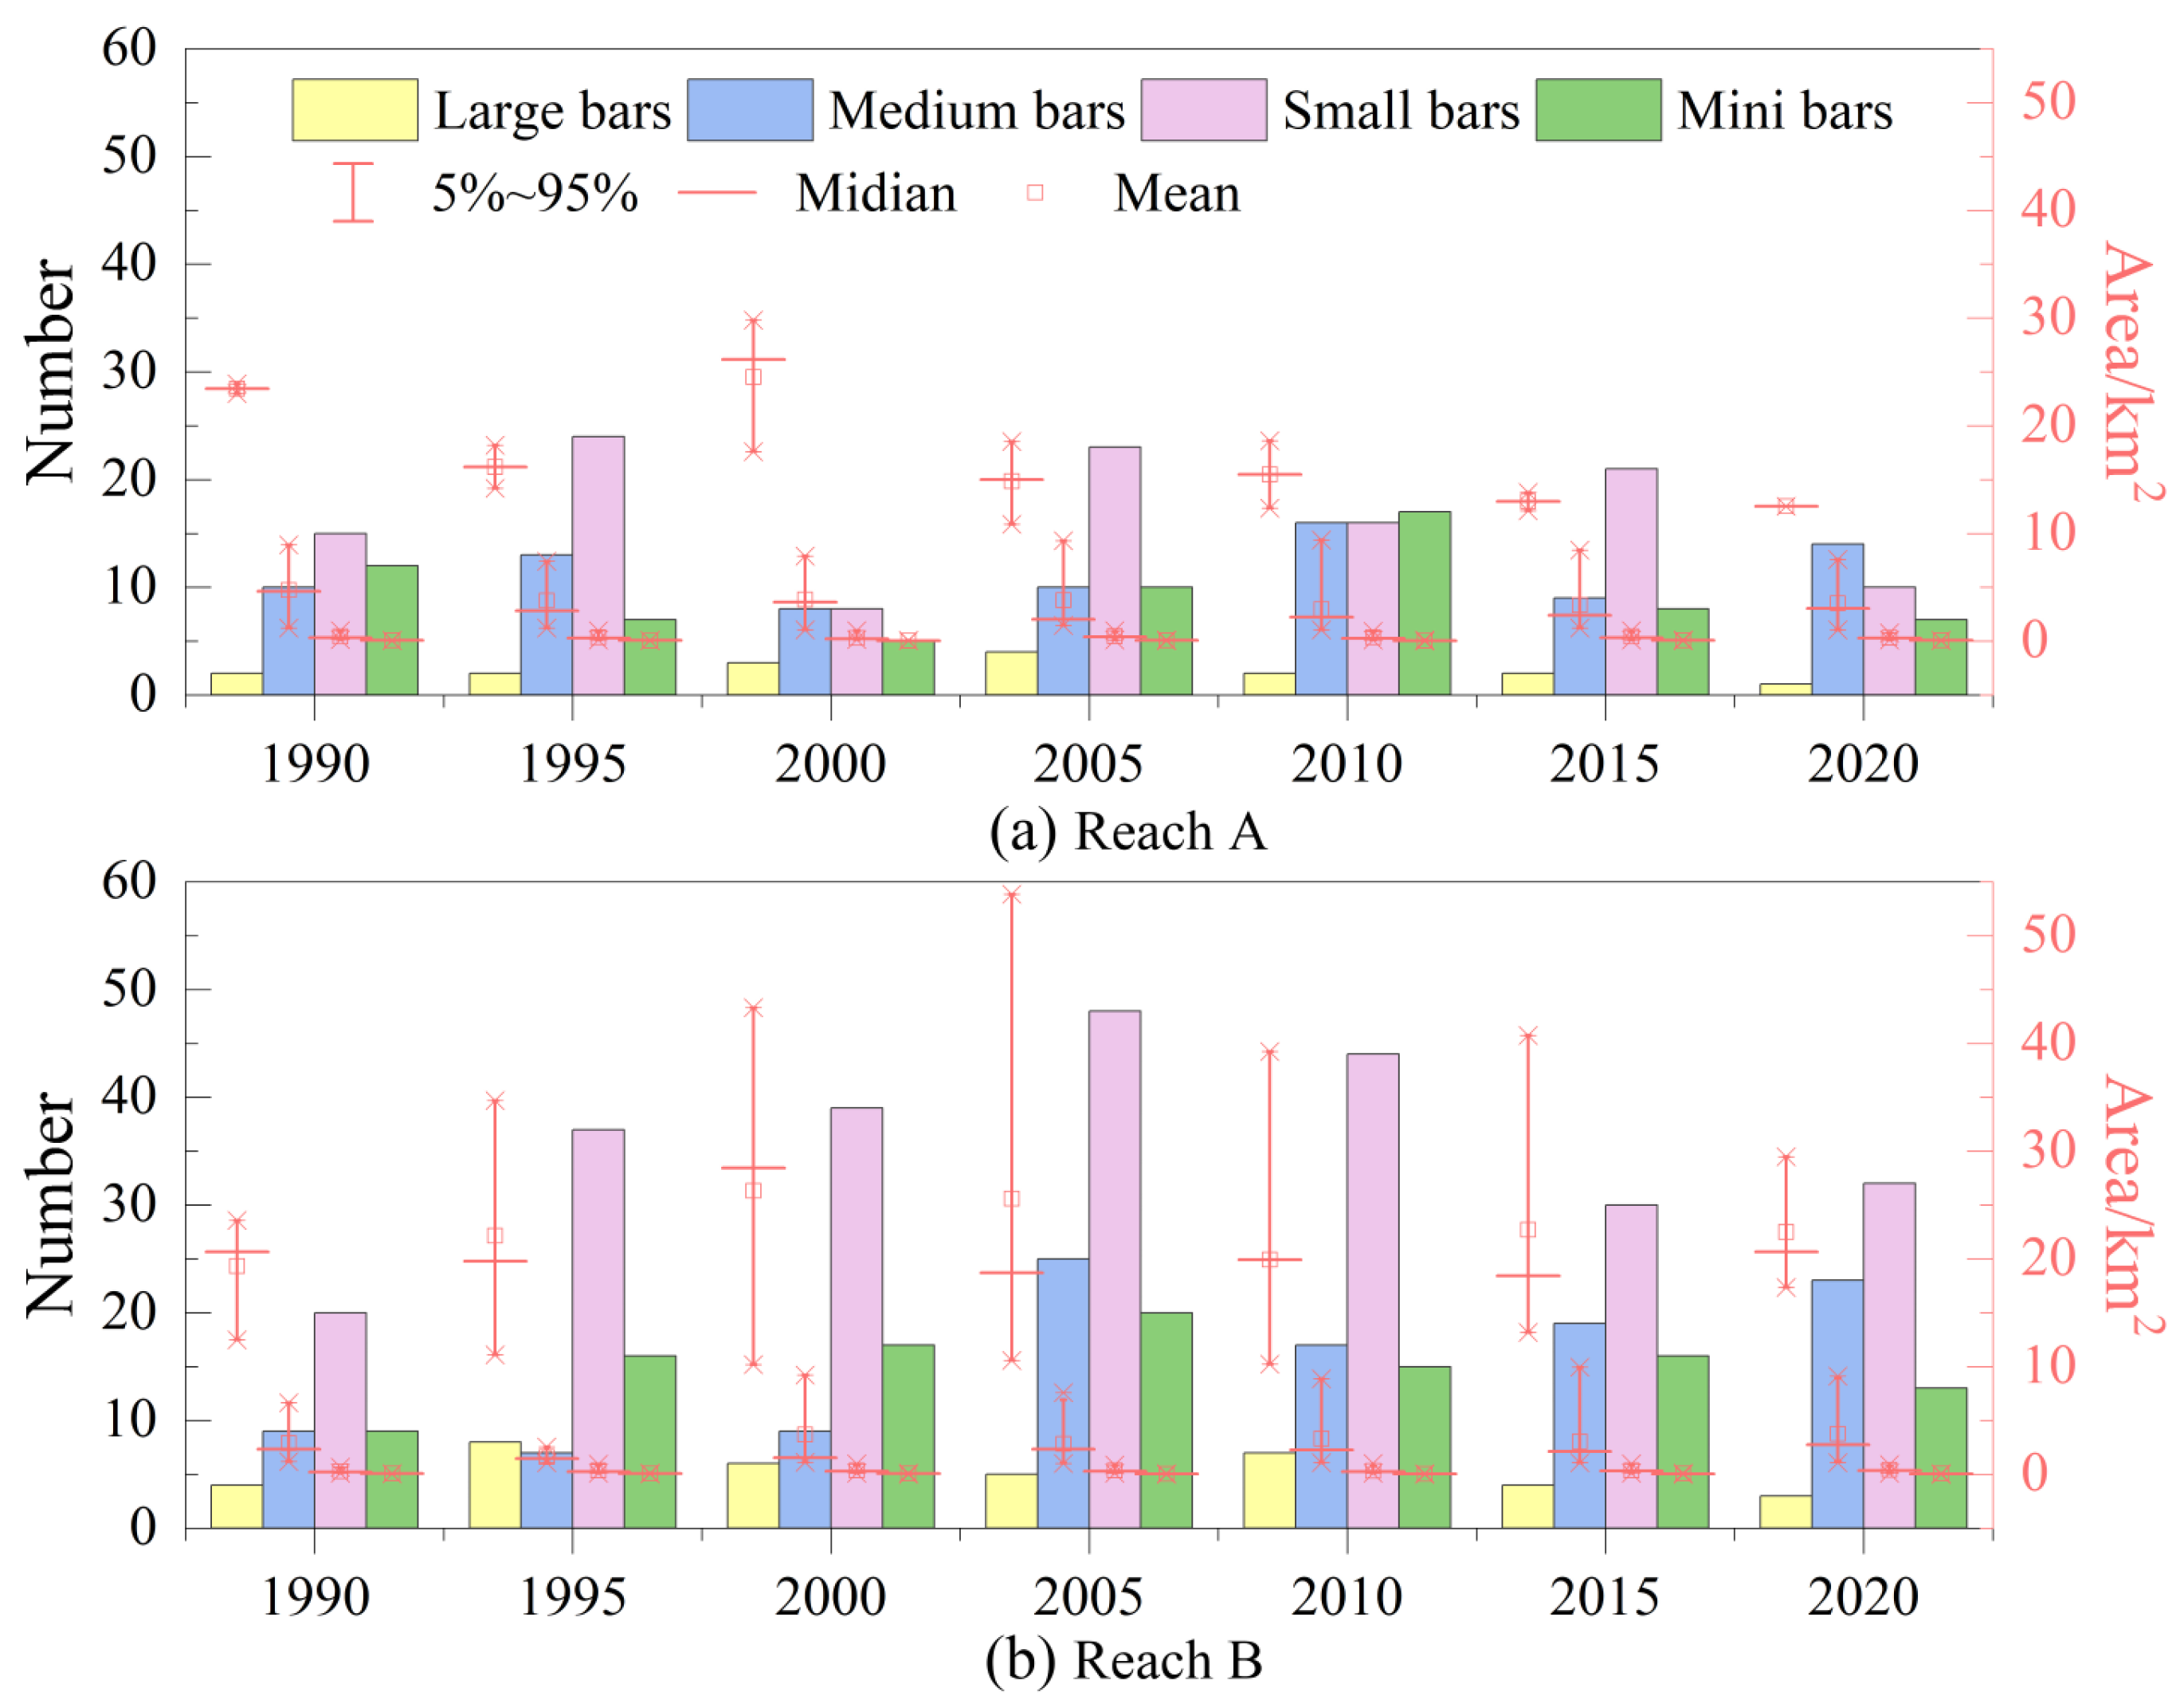
3.3. Spatial and Temporal Variation of Bars and Channels

The spatial and temporal variation of the bars and the main channel from 1990 to 2020 are examined in terms of bar size, which displays the composition of the bars, and main channel shift, which indicates the lateral movement trend of the Majuli Reach.
Bar changes are different between Reach A and Reach B, as shown by the variation in the number and area of four categorized bars from 1990 to 2020 (Figure 5). The number of bars in Reach A decreases steadily from 39 in 1990 to 32 in 2020, while in Reach B it increases from 42 in 1990 to a high of 98 in 2005 and falls slightly to 71 in 2020. The total area of bars in Reach A decreases from 101.15 km2 to 65.65 km2, and, in Reach B, it follows the same pattern as the number, increasing from 109.78 km2 to a peak of 217.13 km2 in 2005 and then decreasing to 167.86 km2. The number and area of bars per unit length are lower in Reach A (1.61 and 2.59 km2 per kilometer) than in Reach B (1.84 and 4.68 km2 per kilometer), suggesting that Reach A has a simpler planform arrangement and a lower degree of braiding. In Reach A, the percentage of the number and area of large and medium bars have increased (from 30.77% to 46.88% and from 93.01% to 94.22%), indicating that the river has become less braided during the study period. In Reach B, the area of large bars decreased significantly from 87.48% in 1995 to 40.19% in 2020, and the average bar area decreased by 9.6%, indicating an increased braiding degree.
Different development trends in the main channel between Reach A and Reach B are observed (Figure 6). From 1990 to 2020, the main channel of Reach A moved south-eastwards (i.e., the left bank of the river), while the main channel of Reach B moved northward (i.e., the right bank of the river). This trend suggests that the lower reaches of the Majuli Reach are moving toward the island, while the upper reaches are moving away from the island. The lateral alterations of the main channel in the Majuli Reach are significant, particularly in Reach A, where the maximum migration distance is 9 km. Further, the main channel at the control point of BP remained virtually unchanged during the years studied. However, it is worth noting that the main channel near the control point shifted significantly in 2005, which was the year with high braiding intensity and the largest number and area of bars in the Majuli Reach. Given that the study controlled for comparable flow stages in the reach on each selected day, this high degree of braiding in the Majuli Reach in 2005, unlike other years, suggests that channel morphology is also influenced by past flow conditions.

3.4. River Bankline Changes

The land loss of the Majuli Island could be detected by focusing on the variation in the position of the right river bankline of the Majuli Reach. The variation of both banklines from 1990 to 2020 is illustrated (Figure 7a), and the area changes of the riparian zone were calculated for each year (Figure 7b).
The alterations of banklines are spatially heterogeneous. In Reach A, the right river bank advanced, and the left river bank retreated during the past three decades, while in Reach B both the left and the right river banks retreated. As a result of the retreat of the river banks, the total area of riparian land loss in the Reach Majuli was about 52.1 km2. The movement of the right river bankline leads to land loss of Majuli Island. More specifically, the area of the Majuli Island decreased significantly by a total area of 12.1 km2 and a rate of 2.4 km2/yr around Reach B, while it increased by 20.7 km2 around Reach A. It indicates that the southwestern part of Majuli Island is the key zone for island conservation.

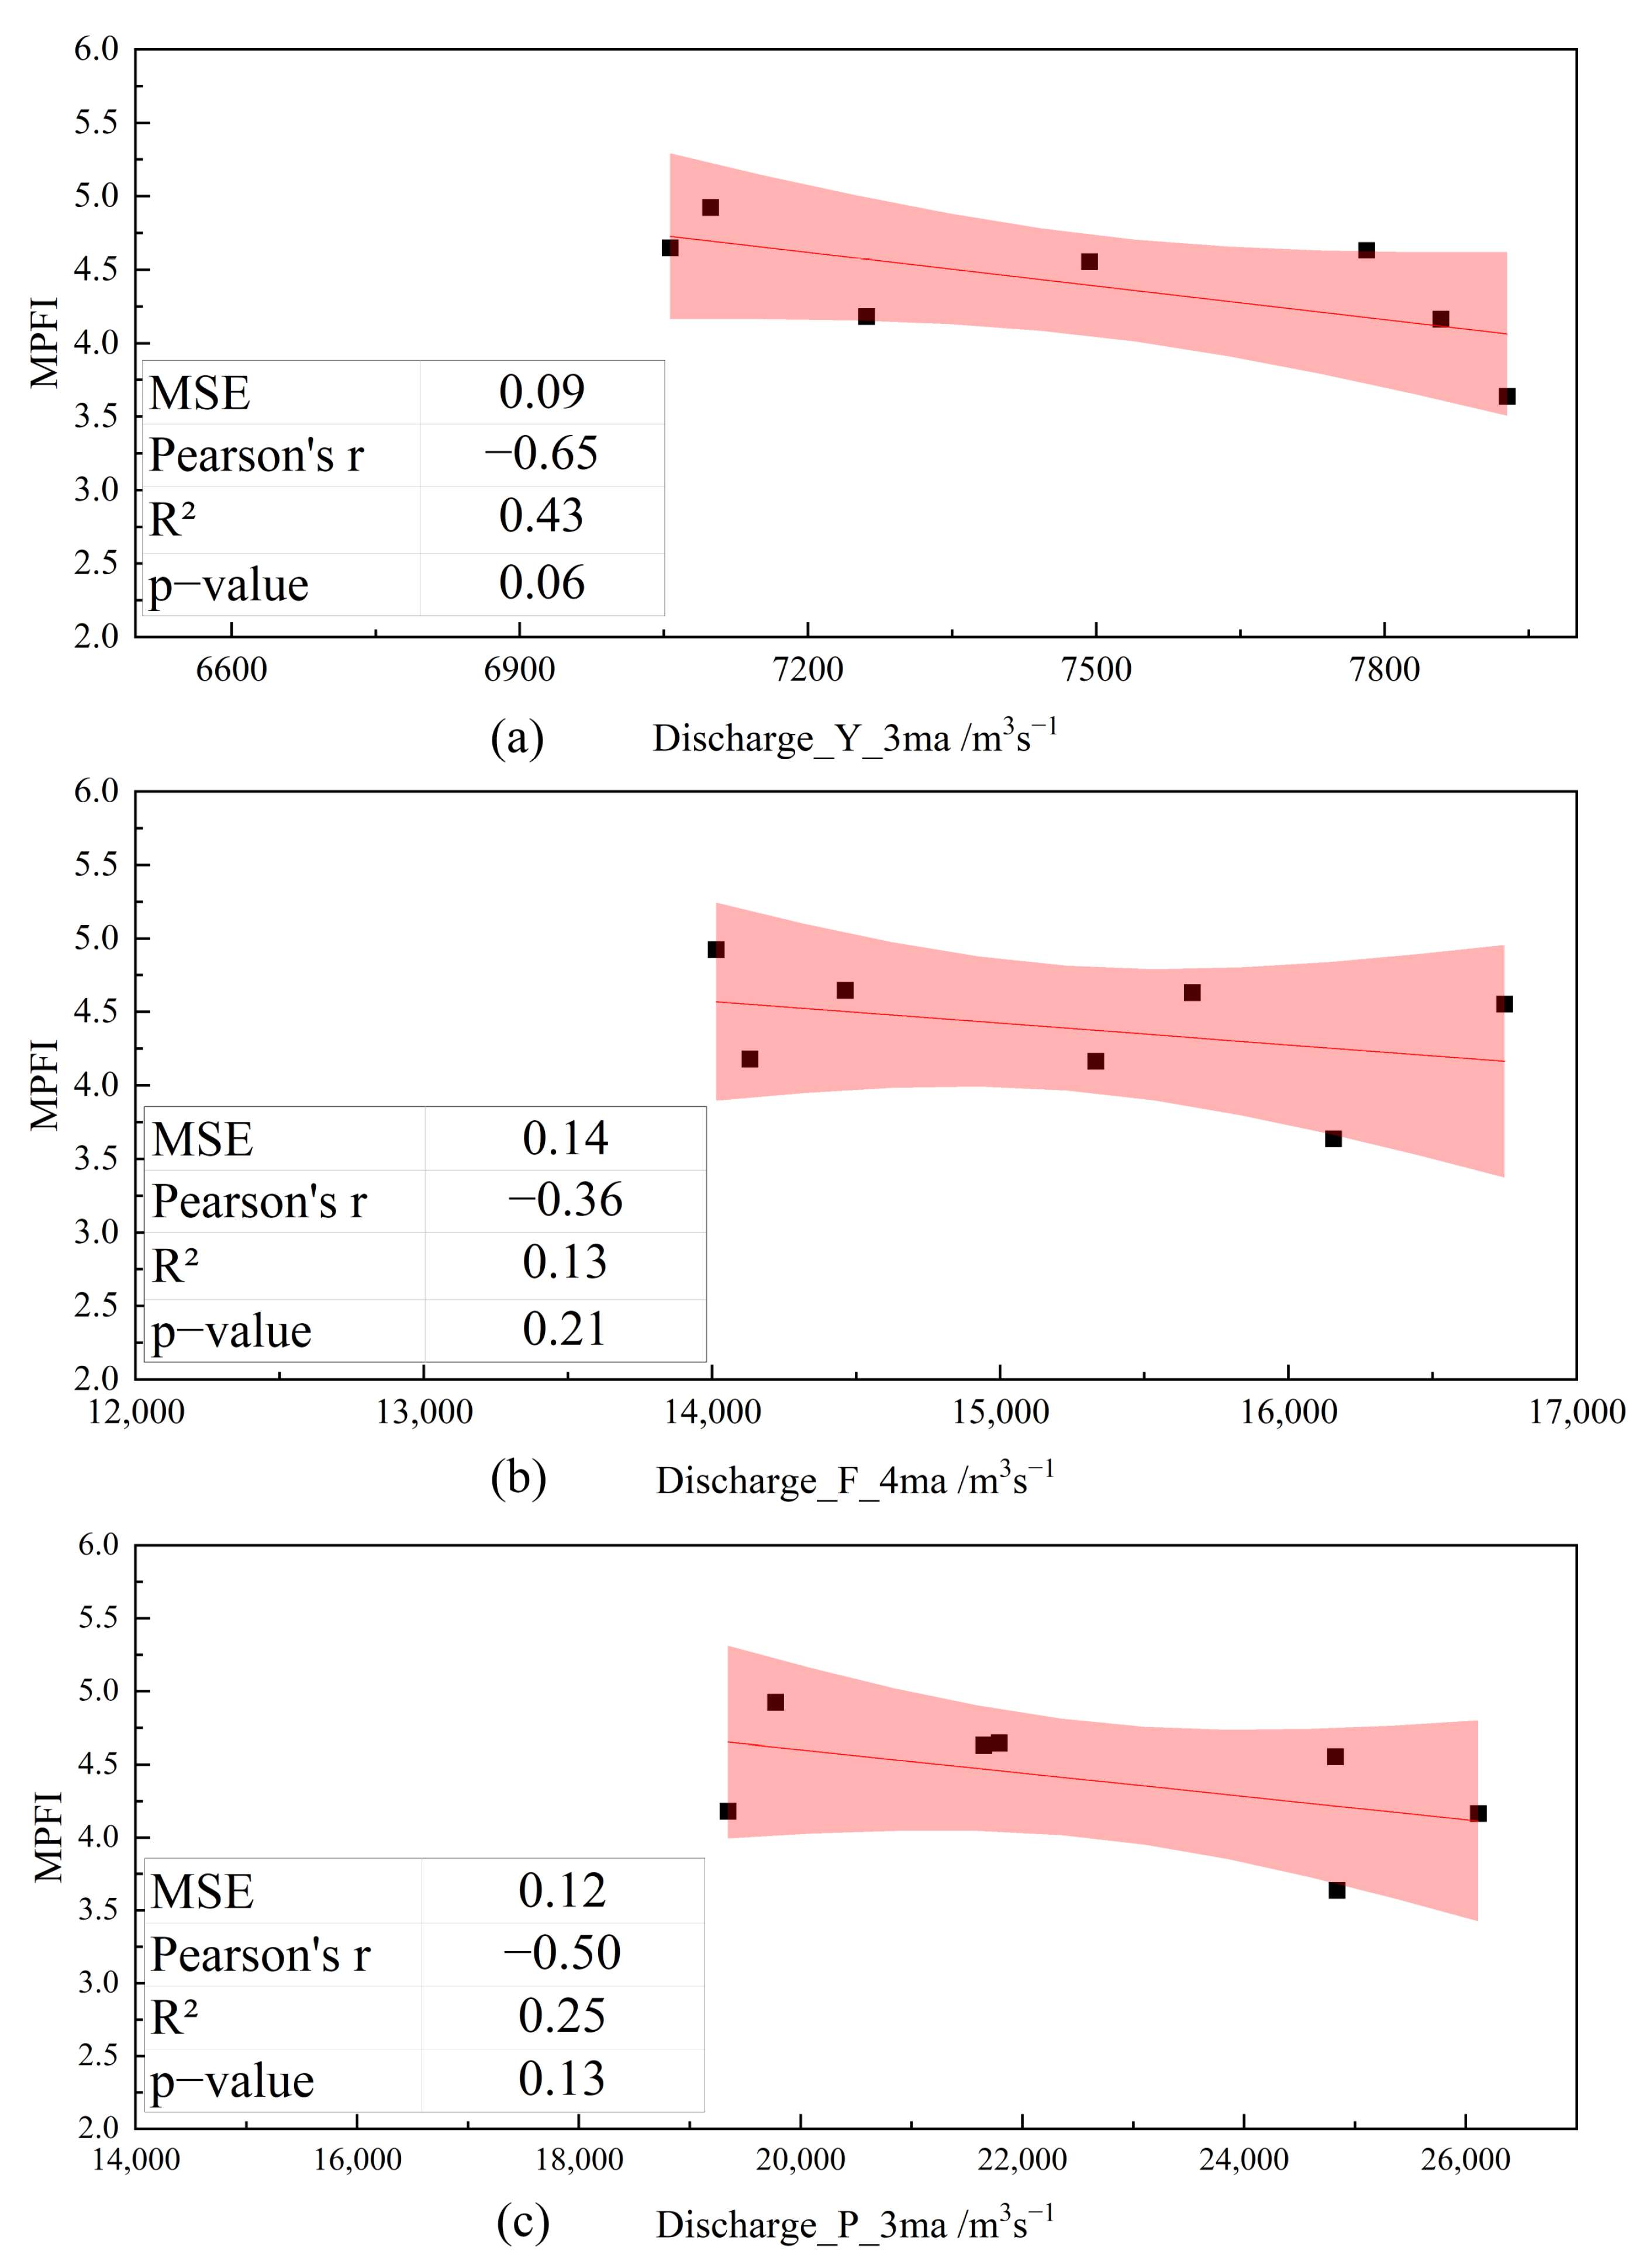
3.5. Response of the MPFI to the River Discharge

Studying the delayed effects of the discharge on the planform of the Majuli Reach helps understand the response time at which past hydrological alterations affect the river morphology. The Pearson’s correlation (r) values between the MPFI and the n-year moving average (n is 1–8) of the three sets of discharges (including the annual discharge of the hydrological year, the flood season discharge, and the peak discharge) are shown in Table 2. The three best-correlated relationships are then displayed in Figure 8 (including the 3-year moving average of the discharge, the 4-year moving average of the flood season discharge, and the 3-year moving average of the peak discharge).
The analysis shows that the MSE was 0.09–0.14, indicating good model accuracy, the Pearson’s r was −0.65, −0.36, and −0.5, indicating strong, weak, and moderate correlation, respectively, and the p-value was 0.06, 0.21, and 0.13, indicating that the correlation of the MPFI with the 3-year moving average of discharge is significant at the 0.1 level, while the other two correlations are not significant. From the results, the delayed response time of the MPFI to discharge is 3–4 years, with a 3-year average discharge having the greatest effect on the MPFI, and, in the flood season, the peak discharge has a greater effect than the average discharge of the flood season. There is a negative correlation between MPFI and past discharge, i.e., the higher the discharge in the past 3–4 years, the higher the degree of braiding of the reach in the post-monsoon season.
From the above analyses, the response time of MPFI to the annual mean discharge of the braided Majuli Reach is three hydrological years, which is shorter compared to the 5–6-year response time of braided reaches in the lower Yellow River [25,41] and the 10–14-year response time of the middle and upper reaches of the Yellow River [59]. A shorter response time emphasizes the unstable feature of the Majuli Reach with varied hydrological conditions. In addition, the correlations between the MPFI and the 4-year flood season discharge and the 3-year flood season peak discharge are higher than those of the others, and the stronger correlation of the MPFI with peak discharge suggests the role of very high discharge in shaping river morphology. It emphasizes the importance of adapting the protection of Majuli Island to the hydrological conditions, especially to peak discharges during the flooding season.

4. Discussion

The results provide a number of insights into the planform changes of a braided river reach and its morphological response to past discharge conditions. In this discussion, we elaborate on the implications of the results and the limitations of this study.
The analysis herein indicates the three to four delayed response times of the braiding index MPFI to river discharge. This means that a higher degree of braiding (i.e., a lower MPFI) corresponds to the larger discharges of the last three to four years. This is valuable for understanding the braided pattern of the river planform and for foreseeing future planform changes in the Majuli Reach. Since the annual and peak discharges play a critical role in shaping the future braided structure, appropriate measures to mitigate disasters such as land loss due to river braiding and widening need to be developed in advance. However, less clear relationships between MPFI and discharge indicate the complexity of coupling in geographical elements and hydrological conditions, and the challenge of identifying key characteristics in channel braiding [39]. The moderate correlation and interpretability of this statistical analysis are not due to any underlying logical fallacy because we have the factual foundation (that is, there must be some relationship between channel braiding and discharge), but rather to the presence of unmeasured factors, especially important ones. For example, the significance of the model may be limited by the lack of sediment data in this study, as high sediment levels are a determining factor in river braiding. The braided pattern will form when the influx of sand exceeds the sand transport capacity of the river, as the river will adjust the bed slope and stream power to suit the hydrodynamics of the river. The degree of braiding can be decreased due to sediment reduction [8]. The response of the river braiding to sediment conditions requires further investigation.
Even with the limitations, analysis of planform changes and the impact of the Majuli Reach control point has practical implications for island conservation. The variation of the right bank of the Majuli Reach is related to the variation of the southern part of Majuli Island. From 1990 to 2010, the southwestern part of the island suffered severe erosion, with a land loss of about 75.76 km2. The shrinking of the southwestern part of Majuli Island has resulted in the displacement of its inhabitants, disruption of agriculture and fisheries, and the destruction of the Satra temples. There were originally 65 temples on Majuli Island, and by 2020 only 23 remained [17,23]. During the studied period (1990–2020), two temples, Kamalabari Satra and Bhogpur Satra (Figure 1), were destroyed because of the riverbank line retreat. To protect Majuli Island, on the one hand, it is necessary to leave enough space for the riverbanks to silt up [17,37], and, on the other, it is necessary to protect the riverbanks through ecological measures such as increasing the vegetation cover. In addition, considering the important influence of the control point on the channel shifts [69], it is helpful to build control points for stabilizing the riverbanks.
Literature reviews suggest an increased risk of flooding in the Brahmaputra River due to rising temperatures and the resulting melting of snow and glaciers in the Himalayas [13,14,16,17]. Our analysis in this paper also suggests the importance of paying attention to climate change for island conservation. The upper basin of the Majuli Reach has effectively become warmer in recent decades, and the temperature increase has accelerated since 2000 (Figure 9). The mean annual temperature in this basin has increased by 1.72 °C between 1979 and 2020. In the period 1979–1999, the average rate of temperature increase was 0.49 °C/10 yr, while in the period 2000–2020 it was 0.77 °C/10 yr. Further, climate change in the basin is likely to lead to a redistribution of discharge within a year. The analysis shows that seasonal changes in precipitation and temperature have obvious effects on discharge (as shown in Table 3). Apart from the high correlation of discharge with precipitation during the snowmelt and the flood seasons (R2 values are 0.66 and 0.68, respectively), the close correlation of discharge with temperature during the snowmelt is remarkable. It emphasizes the critical role of temperature increases on the increase of discharge during the snowmelt season. In the future, snowmelt discharge may increase due to persistent temperature increases, resulting in a redistribution of discharge over the year. As the seasonal timing of hydrological conditions can influence the response of rivers [70], the mechanism by which the changing seasonal distribution of discharge affects the development of river braiding requires further research.
Our analysis assumes quasi-stationary climate conditions during the study period (1990–2020), during which no unprecedented hydrologic extremes (e.g., >100-year floods) were recorded in the Brahmaputra River Basin. While the 2017 monsoon flood event exemplifies a high-impact extreme, the discharge for this event (78,500 m3s−1) was only a 1-in-5-year return period flow [71]. Future work incorporating extreme hydrological scenarios will refine predictions of the variability of braided rivers.

5. Conclusions

A better understanding of the morphological changes in a river is essential to increase the resilience of local communities. This paper considers the Majuli Reach of the Brahmaputra River and examines its planform changes around Majuli Island from 1990 to 2020. By analyzing remote sensing images and the influence of past discharges, we draw the following conclusions:
There is clear evidence from our analysis that due to the behavior of the cohesive sediment, there is a control point near Borboka Pathar with little morphological change. This is apparent from the significantly contrasting morphological change that we see in the planform evolution between the reaches upstream and downstream of the control point. For example, in the upstream reach, both the number and area of bars can be seen to have decreased between 1990 and 2020, and the main channel has moved away from Majuli Island. Meanwhile, in the downstream reach, the number of bars and their area has increased, and the main channel has moved toward Majuli Island. Furthermore, over the study period (1990–2020), our results show that the area of the riparian zone of the reach considered here is drastically reduced by more than 50 km2. In the upstream reach, the left bank has retreated while the right bank has advanced. However, in the downstream reach, both banks have retreated. Our analysis indicates that the southwestern part of Majuli Island is a crucial zone for island conservation. Finally, we can see from the MPFI that Majuli Reach has a high degree of braiding with an average MPFI of 4.39, and further, the downstream reach has a higher braiding degree than the upstream reach with an average MPFI of 3.77 compared to 4.71. The response of the MPFI to changes in the discharge in the river shows a significant time lag. Our analysis shows, with high significance, that the MPFI response time to changes in the annual mean discharge is three hydrological years. Our analysis therefore indicates the critical role of annual discharge in shaping the degree of river braiding and the unstable feature of the Majuli Reach.
Because of the correlation between precipitation/temperature and discharge, and the corresponding bank retreat caused by discharge, it is necessary to provide adequate space to buffer the effects of frequent changes in the riverbank line, while at the same time stabilizing the banks through natural solutions, such as increased vegetation cover, and engineering measures, such as the construction of appropriate control structures. This helps to adapt to channel deformation and increases the resilience of the communities on Majuli Island. Further research is needed on the morphological response of braided rivers to hydrodynamic processes, particularly the response of river morphology to the changing seasonal distribution of the discharge and sediment conditions.

Author Contributions

Conceptualization, Q.X., L.H., Q.T., X.X., and D.C.; data curation, Q.X.; formal analysis, Q.X.; funding acquisition, L.H. and Q.T.; investigation, Q.X. and L.H.; methodology, Q.X., L.H., and D.C.; project administration, L.H. and Q.T.; resources, L.H. and Q.T.; software, Q.X.; supervision, L.H.; validation, L.H., Q.T., X.X., D.C., and N.G.W.; visualization, Q.X.; writing—original draft, Q.X.; writing—review and editing, Q.X., L.H., Q.T., X.X., D.C., N.G.W., G.M.T.I., B.B., A.K.M.S.I., A.I.A.C., and Y.T. All authors have read and agreed to the published version of the manuscript.

Funding

This research was funded by the National Natural Science Foundation of China (Grant No. 51979264), the Key Collaborative Research Program of the Alliance of International Science Organizations (Grant No. ANSO-CR-KP-2021-09), the NSFC-DFG mobility (Grant No. M-0468), and the Chinese Academy of Sciences (Grant No. XDA20060402).

Data Availability Statement

The original data presented in the study are openly available. The remote sensing images (accessed on 30 March 2022) are provided by the Geospatial Data Cloud site, the Computer Network Information Center, and the Chinese Academy of Sciences via http://www.gscloud.cn by registration. The global daily river discharge data (accessed on 7 Marh 2023) are available from the Global Reach-level Flood Reanalysis (GRFR) dataset via https://doi.org/10.11888/Terre.tpdc.272901. The water level data (accessed on 10 May 2023) are available from the Hydroweb database produced by the Laboratoire d′Etudes en Géophysique et Océanographie Spatiales (LEGOS) via https://dahiti.dgfi.tum.de/en/virtual-stations by registration. The global historical monthly temperature and precipitation data (accessed on 20 September 2023) are available from NASA’s GLDAS Noah Land Surface Model L4 monthly 0.25 × 0.25-degree V2.0 and V2.1 products via http://doi.org/10.5067/E7TYRXPJKWOQ. The data presented in this study are available on request from the corresponding author.

Acknowledgments

The authors are grateful to Vimal Mishra of IIT Gandhinagar for his insightful suggestions that improved the rigor of this work.

Conflicts of Interest

The authors declare no conflicts of interest.

Abbreviations

The following abbreviations are used in this manuscript:
MPFIModified Plan Form Index
BIBraiding intensity indices

Appendix A

In this section, we provide some clarifications on the potential anthropogenic influences on river conditions in the study area based on additional analyses.
We investigate the impact of the Zangmu hydropower station (92°31′7.716″E, 29°10′42.02″N, as shown in Figure 2), the only hydropower station on the mainstream of the Yarlung Tsangpo River for which we have information [72], which started operation in 2015, by analyzing the discharge variation in the study reach. We conducted the Mann–Kendall trend test and changepoint detection analysis with the annual mean discharge calculated from the raw data obtained from the Global Reach-level Flood Reanalysis (GRFR) dataset [43]. The results indicate that no significant trend in discharge changes was detected (p > 0.05), and no abrupt changes in discharge patterns were associated with the operation of the hydropower plant (Figure A1). These statistical results suggest that the Zangmu hydropower station has not significantly altered the discharge regime of the Majuli Reach.
Figure A1. The results of the Mann–Kendall trend test and changepoint detection analysis with the annual mean discharge in the Majuli Reach.
Remotesensing 17 00944 g0a1
We compared land-use types (e.g., agriculture, grassland, water) around the study reach for the years 1992, 2000, 2010, and 2020 (see Figure A2). Changes in area proportion for the dominant land type was below 5% across the study period. No levee construction or structural transformations in land cover were observed. This implies that anthropogenic land use activities had limited direct impacts on river morphology during the study period.
Figure A2. The land-use types around the Majuli Reach for the years 1992, 2000, 2010, and 2020. We use the 1992 land-use data rather than the 1990 data because they are the earliest available data provided by the dataset [73].
Remotesensing 17 00944 g0a2
In summary, both hydrological conditions and land-use patterns in the study area remained relatively stable over the long-term timeframe, supporting the reliability of the analysis.

References

  1. Bhuyan, N.; Sharma, Y.; Sajjad, H.; Ahmed, R. Estimating Bank-Line Migration of the Brahmaputra River in the Middle Brahmaputra Floodplains of Assam, India Using Digital Shoreline Analysis System. Environ. Earth Sci. 2023, 82, 385. [Google Scholar] [CrossRef]
  2. Saikia, L.; Mahanta, C.; Mukherjee, A.; Borah, S.B. Erosion-Deposition and Land Use/Land Cover of the Brahmaputra River in Assam, India. J. Earth Syst. Sci. 2019, 128, 211. [Google Scholar] [CrossRef]
  3. Akhtar, M.P.; Sharma, N.; Ojha, C.S.P. Braiding Process and Bank Erosion in the Brahmaputra River. Int. J. Sediment Res. 2011, 26, 431–444. [Google Scholar] [CrossRef]
  4. Pathan, S.A.; Sil, B.S. Prioritization of Soil Erosion Prone Areas in Upper Brahmaputra River Basin up to Majuli River Island. Geocarto Int. 2022, 37, 1999–2017. [Google Scholar] [CrossRef]
  5. Leopold, L.B.; Wolman, M.G. River Channel Patterns: Braided, Meandering, and Straight; U.S. Government Printing Office: Washington, DC, USA, 1957; Volume 9, pp. 39–85. [Google Scholar] [CrossRef]
  6. Parker, G. Cause and Characteristic Scales of Meandering and Braiding in Rivers. J. Fluid Mech. 1976, 76, 457–480. [Google Scholar] [CrossRef]
  7. Hsu, S.-Y.; Hsu, S.M. Morphological Evolution Mechanism of Gravel-Bed Braided River by Numerical Simulation on Da-Jia River. J. Hydrol. 2022, 613, 128222. [Google Scholar] [CrossRef]
  8. Li, Z.; Lu, H.; Chen, B.; You, Y.; Hu, X. A Review on Morphodynamic Processes and Mechanism of Braided Rivers. Adv. Water Sci. 2021, 32, 957–968. [Google Scholar]
  9. Storz-Peretz, Y.; Laronne, J.B.; Surian, N.; Lucia, A. Flow Recession as a Driver of the Morpho-Texture of Braided Streams. Earth Surf. Process. Landf. 2016, 41, 754–770. [Google Scholar] [CrossRef]
  10. Bridge, J.S. The Interaction between Channel Geometry, Water Flow, Sediment Transport and Deposition in Braided Rivers. Geol. Soc. Lond. Spec. Publ. 1993, 75, 13–71. [Google Scholar] [CrossRef]
  11. Limaye, A.B.; Grimaud, J.-L.; Lai, S.Y.J.; Foreman, B.Z.; Komatsu, Y.; Paola, C. Geometry and Dynamics of Braided Channels and Bars under Experimental Density Currents. Sedimentology 2018, 65, 1947–1972. [Google Scholar] [CrossRef]
  12. Redolfi, M. Sediment Transport and Morphology of Braided Rivers: Steady and Unsteady Regime. Doctoral Dissertation, Queen Mary University of London, London, UK, 2015. [Google Scholar]
  13. Nepal, S.; Shrestha, A.B. Impact of Climate Change on the Hydrological Regime of the Indus, Ganges and Brahmaputra River Basins: A Review of the Literature. Int. J. Water Resour. Dev. 2015, 31, 201–218. [Google Scholar] [CrossRef]
  14. Nury, A.H.; Sharma, A.; Marshall, L.; Cordery, I. Modelling Climate Change Impacts on the Brahmaputra Streamflow Resulting from Changes in Snowpack Attributes. J. Hydrol. 2021, 603, 126998. [Google Scholar] [CrossRef]
  15. Zhang, L.; Su, F.; Yang, D.; Hao, Z.; Tong, K. Discharge Regime and Simulation for the Upstream of Major Rivers over Tibetan Plateau. J. Geophys. Res.-Atmos. 2013, 118, 8500–8518. [Google Scholar] [CrossRef]
  16. Lutz, A.F.; Immerzeel, W.W.; Shrestha, A.B.; Bierkens, M.F.P. Consistent Increase in High Asia’s Runoff Due to Increasing Glacier Melt and Precipitation. Nat. Clim. Chang. 2014, 4, 587–592. [Google Scholar] [CrossRef]
  17. Roy, N.; Pandey, B.W.; Rani, U. Protecting the Vanishing Geo-Cultural Heritage of India: Case Study of Majuli Island in Assam. Int. J. Geoheritage Parks 2020, 8, 18–30. [Google Scholar] [CrossRef]
  18. Hooke, J.M.; Yorke, L. Channel Bar Dynamics on Multi-Decadal Timescales in an Active Meandering River. Earth Surf. Process. Landf. 2011, 36, 1910–1928. [Google Scholar] [CrossRef]
  19. Goswami, D.C. Brahmaputra River, Assam, India: Physiography, Basin Denudation, and Channel Aggradation. Water Resour. Res. 1985, 21, 959–978. [Google Scholar] [CrossRef]
  20. Prasujya, G.; Nayan, S. Spatio-Temporal Study of Morpho-Dynamics of the Brahmaputra River along Its Majuli Island Reach—ScienceDirect. Environ. Chall. 2021, 5, 100217. [Google Scholar] [CrossRef]
  21. Liu, J.; Li, W.; Zhao, W.; Yue, D.; Shu, Q.; Wang, W.; Gao, J.; Hou, X.; Wu, S. Evolution of Bars in Braided Rivers Controlled by Discharge Variability. Earth Sci. 2024, 49, 3516–3528. [Google Scholar] [CrossRef]
  22. Basumatary, H.; Sah, R.K.; Das, A.K. Bankline Dynamics and Their Effects on Protected Areas along the Brahmaputra River. Catena 2021, 197, 104947. [Google Scholar] [CrossRef]
  23. Sarma, J.N.; Phukan, M.K. Origin and Some Geomorphological Changes of Majuli Island of the Brahmaputra River in Assam, India. Geomorphology 2004, 60, 1–19. [Google Scholar] [CrossRef]
  24. Coleman, J. Brahmaputra River—Channel Processes and Sedimentation. Sediment. Geol. 1969, 3, 129–239. [Google Scholar] [CrossRef]
  25. Wu, B. Delayed Response Model for Bankfull Discharge of Alluvial Rivers. J. Hydraul. Eng. 2008, 39, 680–687. [Google Scholar] [CrossRef]
  26. Wu, B.; Li, L. Delayed Response Model for Bankfull Discharge Predictions in the Yellow River. Int. J. Sediment Res. 2011, 26, 445–459. [Google Scholar] [CrossRef]
  27. Takagi, T.; Oguchi, T.; Matsumoto, J.; Grossman, M.J.; Sarker, M.H.; Matin, M.A. Channel Braiding and Stability of the Brahmaputra River, Bangladesh, since 1967: GIS and Remote Sensing Analyses. Geomorphology 2007, 85, 294–305. [Google Scholar] [CrossRef]
  28. Lotsari, E.; Vaaja, M.; Flener, C.; Kaartinen, H.; Kukko, A.; Kasvi, E.; Hyyppa, H.; Hyyppa, J.; Alho, P. Annual Bank and Point Bar Morphodynamics of a Meandering River Determined by High-Accuracy Multitemporal Laser Scanning and Flow Data. Water Resour. Res. 2014, 50, 5532–5559. [Google Scholar] [CrossRef]
  29. Ali, A. Brahmaputra River Bank Erosion as a Major Geo-Environmental Problem in Lower Assam, India. J. Geol. Soc. India 2024, 100, 591–600. [Google Scholar] [CrossRef]
  30. Debnath, J.; Sahariah, D.; Lahon, D.; Nath, N.; Chand, K.; Meraj, G.; Kumar, P.; Singh, S.K.; Kanga, S.; Farooq, M. Assessing the Impacts of Current and Future Changes of the Planforms of River Brahmaputra on Its Land Use-Land Cover. Geosci. Front. 2023, 14, 101557. [Google Scholar] [CrossRef]
  31. Rao, M.P.; Cook, E.R.; Cook, B.I.; D’Arrigo, R.D.; Palmer, J.G.; Lall, U.; Woodhouse, C.A.; Buckley, B.M.; Uriarte, M.; Bishop, D.A.; et al. Seven Centuries of Reconstructed Brahmaputra River Discharge Demonstrate Underestimated High Discharge and Flood Hazard Frequency. Nat. Commun. 2020, 11, 6017. [Google Scholar] [CrossRef]
  32. Singh, S.K. Erosion and Weathering in the Brahmaputra River System. In Large Rivers: Geomorphology and Management; Wiley Publishing Company: Hoboken, NJ, USA, 2008; pp. 373–393. [Google Scholar] [CrossRef]
  33. Stewart, R.J.; Hallet, B.; Zeitler, P.K.; Malloy, M.A.; Allen, C.M.; Trippett, D. Brahmaputra Sediment Flux Dominated by Highly Localized Rapid Erosion from the Easternmost Himalaya. Geology 2008, 36, 711–714. [Google Scholar] [CrossRef]
  34. Bharasa, P.; Gayen, A. Safeguarding the Threatened Hydrogeo-Cultural Heritage of Majuli Island in Assam, India: A Case Study. In Proceedings of the National Conference on Challenges in Grounwater Development and Management, Raipur, India, 6–7 March 2020; IoP Publishing Ltd.: Bristol, UK, 2020; Volume 597, p. 012025. [Google Scholar]
  35. Ghosh, S.; Mandal, P.; Bera, B. Dynamics of Channel Bar Morphology on Multi-Decadal Timescales in a Braided River within Himalayan Foreland Basin, India. J. Earth Syst. Sci. 2023, 132, 168. [Google Scholar] [CrossRef]
  36. Devi, D.; Phukan, N.; Sarma, B. A Study of Erosional Depositional Activity and Land Use Mapping of Majuli River Island Using Landsat Data. In Hydrologic Modeling; Singh, V.P., Yadav, S., Yadava, R.N., Eds.; Springer: Singapore, 2018; Volume 81, pp. 187–200. [Google Scholar]
  37. Lahiri, S.K.; Sinha, R. Morphotectonic Evolution of the Majuli Island in the Brahmaputra Valley of Assam, India Inferred from Geomorphic and Geophysical Analysis. Geomorphology 2014, 227, 101–111. [Google Scholar] [CrossRef]
  38. Egozi, R.; Ashmore, P. Defining and Measuring Braiding Intensity. Earth Surf. Process. Landf. 2008, 33, 2121–2138. [Google Scholar] [CrossRef]
  39. Hooke, J. Morphodynamics of Active Meandering Rivers Reviewed in a Hierarchy of Spatial and Temporal Scales. Geomorphology 2023, 439, 108825. [Google Scholar] [CrossRef]
  40. Shen, H.; Wu, H.; Li, L.; Cao, B. Description Method for Variation of Sediment Transport Rate Based on Delayed Response Model-All Databases. J. Basic Sci. Eng. 2020, 28, 1294–1303. [Google Scholar] [CrossRef]
  41. Zhang, Y.; Zhong, D.; Wu, B. Multiple Temporal Scale Relationships of Bankfull Discharge with Streamflow and Sediment Transport in the Yellow River in China. Int. J. Sediment Res. 2013, 28, 496–510. [Google Scholar] [CrossRef]
  42. Wang, D.; Ma, Y.; Liu, X.; Huang, H.Q.; Huang, L.; Deng, C. Meandering-Anabranching River Channel Change in Response to Flow-Sediment Regulation: Data Analysis and Model Validation. J. Hydrol. 2019, 579, 124209. [Google Scholar] [CrossRef]
  43. Yang, Y.; Pan, M.; Lin, P.; Beck, H.E.; Zeng, Z.; Yamazaki, D.; David, C.H.; Lu, H.; Yang, K.; Hong, Y.; et al. Global Reach-Level 3-Hourly River Flood Reanalysis (1980–2019). Bull. Amer. Meteorol. Soc. 2021, 102, E2086–E2105. [Google Scholar] [CrossRef]
  44. Lei, X.; Ke, L.; Yong, B.; Zhang, J.; Cao, Q. Evaluation of River Water Level Monitoring from Satellite Radar Altimetry Datasets over Chinese Rivers. Remote Sens. Technol. Appl. 2022, 37, 61–72. [Google Scholar] [CrossRef]
  45. Wang, S.; Cui, D.; Xu, J. Monitoring and Analysis of Water Surface Slope of the Yarlung Zangbo River Based on Remote Sensing. Water 2022, 14, 3304. [Google Scholar] [CrossRef]
  46. Da Silva, J.S.; Calmant, S.; Seyler, F.; Rotunno Filho, O.C.; Cochonneau, G.; Mansur, W.J. Water Levels in the Amazon Basin Derived from the ERS 2 and ENVISAT Radar Altimetry Missions. Remote Sens. Environ. 2010, 114, 2160–2181. [Google Scholar] [CrossRef]
  47. Normandin, C.; Frappart, F.; Diepkile, A.T.; Marieu, V.; Mougin, E.; Blarel, F.; Lubac, B.; Braquet, N.; Ba, A. Evolution of the Performances of Radar Altimetry Missions from ERS-2 to Sentinel-3A over the Inner Niger Delta. Remote Sens. 2018, 10, 833. [Google Scholar] [CrossRef]
  48. Gehring, J.; Duvvuri, B.; Beighley, E. Deriving River Discharge Using Remotely Sensed Water Surface Characteristics and Satellite Altimetry in the Mississippi River Basin. Remote Sens. 2022, 14, 3541. [Google Scholar] [CrossRef]
  49. Beaudoing, H.; Rodell, M. GES DISC Dataset: GLDAS Noah Land Surface Model L4 Monthly 0.25 x 0.25 Degree; Version 2.1 (GLDAS_NOAH025_M 2.1); NASA Goddard Earth Sciences Data and Information Services Center: Greenbelt, MD, USA, 2020. [Google Scholar]
  50. Rodell, M.; Houser, P.R.; Jambor, U.; Gottschalck, J.; Mitchell, K.; Meng, C.J.; Arsenault, K.; Cosgrove, B.; Radakovich, J.; Bosilovich, M.; et al. The Global Land Data Assimilation System. Bull. Amer. Meteorol. Soc. 2004, 85, 381–394. [Google Scholar] [CrossRef]
  51. Bertoldi, W.; Zanoni, L.; Tubino, M. Planform Dynamics of Braided Streams. Earth Surf. Process. Landf. 2009, 34, 547–557. [Google Scholar] [CrossRef]
  52. Hong, L.B.; Davies, T.R.H. A Study of Stream Braiding: Summary. Geol. Soc. Am. Bull. 1979, 90, 1094. [Google Scholar] [CrossRef]
  53. Sharma, N. Mathematical Modelling and Braid Indicators. In The Brahmaputra Basin Water Resources; Springer: Berlin/Heidelberg, Germany, 2004; Volume 47, pp. 229–260. [Google Scholar] [CrossRef]
  54. Gao, C.; Wang, S. Distribution Rule of Active Channels Under Different Discharge of Anastomosing Reaches in the Tibetan Plateau of the Yellow River. Sci. Geogr. Sin. 2018, 38, 618–627. [Google Scholar] [CrossRef]
  55. Li, Z.; Lu, H.; Gao, P.; You, Y.; Hu, X. Characterizing Braided Rivers in Two Nested Watersheds in the Source Region of the Yangtze River on the Qinghai-Tibet Plateau. Geomorphology 2020, 351, 106945. [Google Scholar] [CrossRef]
  56. Liu, B.; Wang, S. Planform Characteristics and Development of Interchannel Wetlands in a Gravel-Bed Anastomosing River, Maqu Reach of the Upper Yellow River. J. Geogr. Sci. 2017, 27, 1376–1388. [Google Scholar] [CrossRef]
  57. Zanoni, L.; Gurnell, A.; Drake, N.; Surian, N. Island Dynamics in a Braided River from Analysis of Historical Maps and Air Photographs. River Res. Appl. 2008, 24, 1141–1159. [Google Scholar] [CrossRef]
  58. Wu, B.; Zheng, S.; Thorne, C.R. A General Framework for Using the Rate Law to Simulate Morphological Response to Disturbance in the Fluvial System. Prog. Phys. Geogr. 2012, 36, 575–597. [Google Scholar] [CrossRef]
  59. Li, L.; Wu, B.; Hou, S. Application of Delayed Response Model to Bankfull Discharge in the Inner Mongolia Reach of Yellow River. J. Hydroelectr. Eng. 2011, 30, 70–77. [Google Scholar] [CrossRef]
  60. Li, X.; Ren, J.; Xu, Q.; Yuan, J.; Zhang, W. Impact of Cascade Reservoirs on the Delayed Response Behaviour of Sedimentation in the Three Gorges Reservoir. J. Geogr. Sci. 2023, 33, 576–598. [Google Scholar] [CrossRef]
  61. Wang, H.; Lu, Y.; Yao, S.; Zuo, L.; Liu, H. Bank and Point Bar Morphodynamics in the Lower Jingjiang Reach of the Yangtze River in Response to the Three Gorges Project. J. Geogr. Sci. 2022, 32, 1530–1556. [Google Scholar] [CrossRef]
  62. Zheng, S.; Wang, H.; Wu, B. Delayed Morphological Adjustment of the Yellow and Lower Wei Rivers Upstream of the Sanmenxia Dam at Multi-Temporal Scales. Catena 2022, 212, 106035. [Google Scholar] [CrossRef]
  63. Kotoky, P.; Bezbaruah, D.; Borah, G.C.; Sarma, J.N. Do Node Points Play a Role in Flood Proliferation? Curr. Sci. 2009, 96, 1457–1460. [Google Scholar]
  64. Li, Z.; Yuan, X.; Yu, G. Characteristics and Geomorphologic Significance of Channel Longitudinal Profile in the Yarlung Tsangpo River Basin. J. Sediment Res. 2020, 45, 67–73. [Google Scholar]
  65. Li, X.; Zhu, L.; Chen, D.; Liu, M. Experimental Study on the Formation and Evolution of a Braided Channel with “Lotus Roots”. Adv. Water Sci. 2018, 29, 810–819. [Google Scholar] [CrossRef]
  66. Han, K.; Sun, J.; Lin, B.; Huang, Z.; Shi, X. Large-Scale Modelling of Highly Braided and Laterally Confined Reach of a Sand-Bed River. Earth Surf. Process. Landf. 2023, 48, 1557–1572. [Google Scholar] [CrossRef]
  67. Saha, U.D.; Saheb, A.M.; Islam, A.; Barman, S.D.; Dutt, S.; Islam, A.R.M.T. Characterizing the Trend of Channel Braiding of a Tropical Transboundary River Using Spatial Growth Component Analysis and ARIMA Model. Adv. Space Res. 2022, 70, 1773–1794. [Google Scholar] [CrossRef]
  68. Xia, J.; Jiang, Q.; Deng, S.; Zhou, M.; Cheng, Y.; Li, Z.; Wang, Z. Morphological Characteristics and Evolution Processes of Sharp Bends in the Lower Yellow River. Catena 2022, 210, 105936. [Google Scholar] [CrossRef]
  69. Graf, W.L. Channel Instability in a Braided, Sand Bed River. Water Resour. Res. 1981, 17, 1087–1094. [Google Scholar] [CrossRef]
  70. Hooke, J.M. Variations in Flood Magnitude–Effect Relations and the Implications for Flood Risk Assessment and River Management. Geomorphology 2015, 251, 91–107. [Google Scholar] [CrossRef]
  71. Uhe, P.F.; Mitchell, D.M.; Bates, P.D.; Sampson, C.C.; Smith, A.M.; Islam, A.S. Enhanced Flood Risk with 1.5 °C Global Warming in the Ganges–Brahmaputra–Meghna Basin. Environ. Res. Lett. 2019, 14, 074031. [Google Scholar] [CrossRef]
  72. Liu, Y. Ecological and Environmental Impacts of Major Hydropower Projects in the Qinghai–Tibet Plateau. Master’s Thesis, North China Electric Power University, Beijing, China, 2020. [Google Scholar]
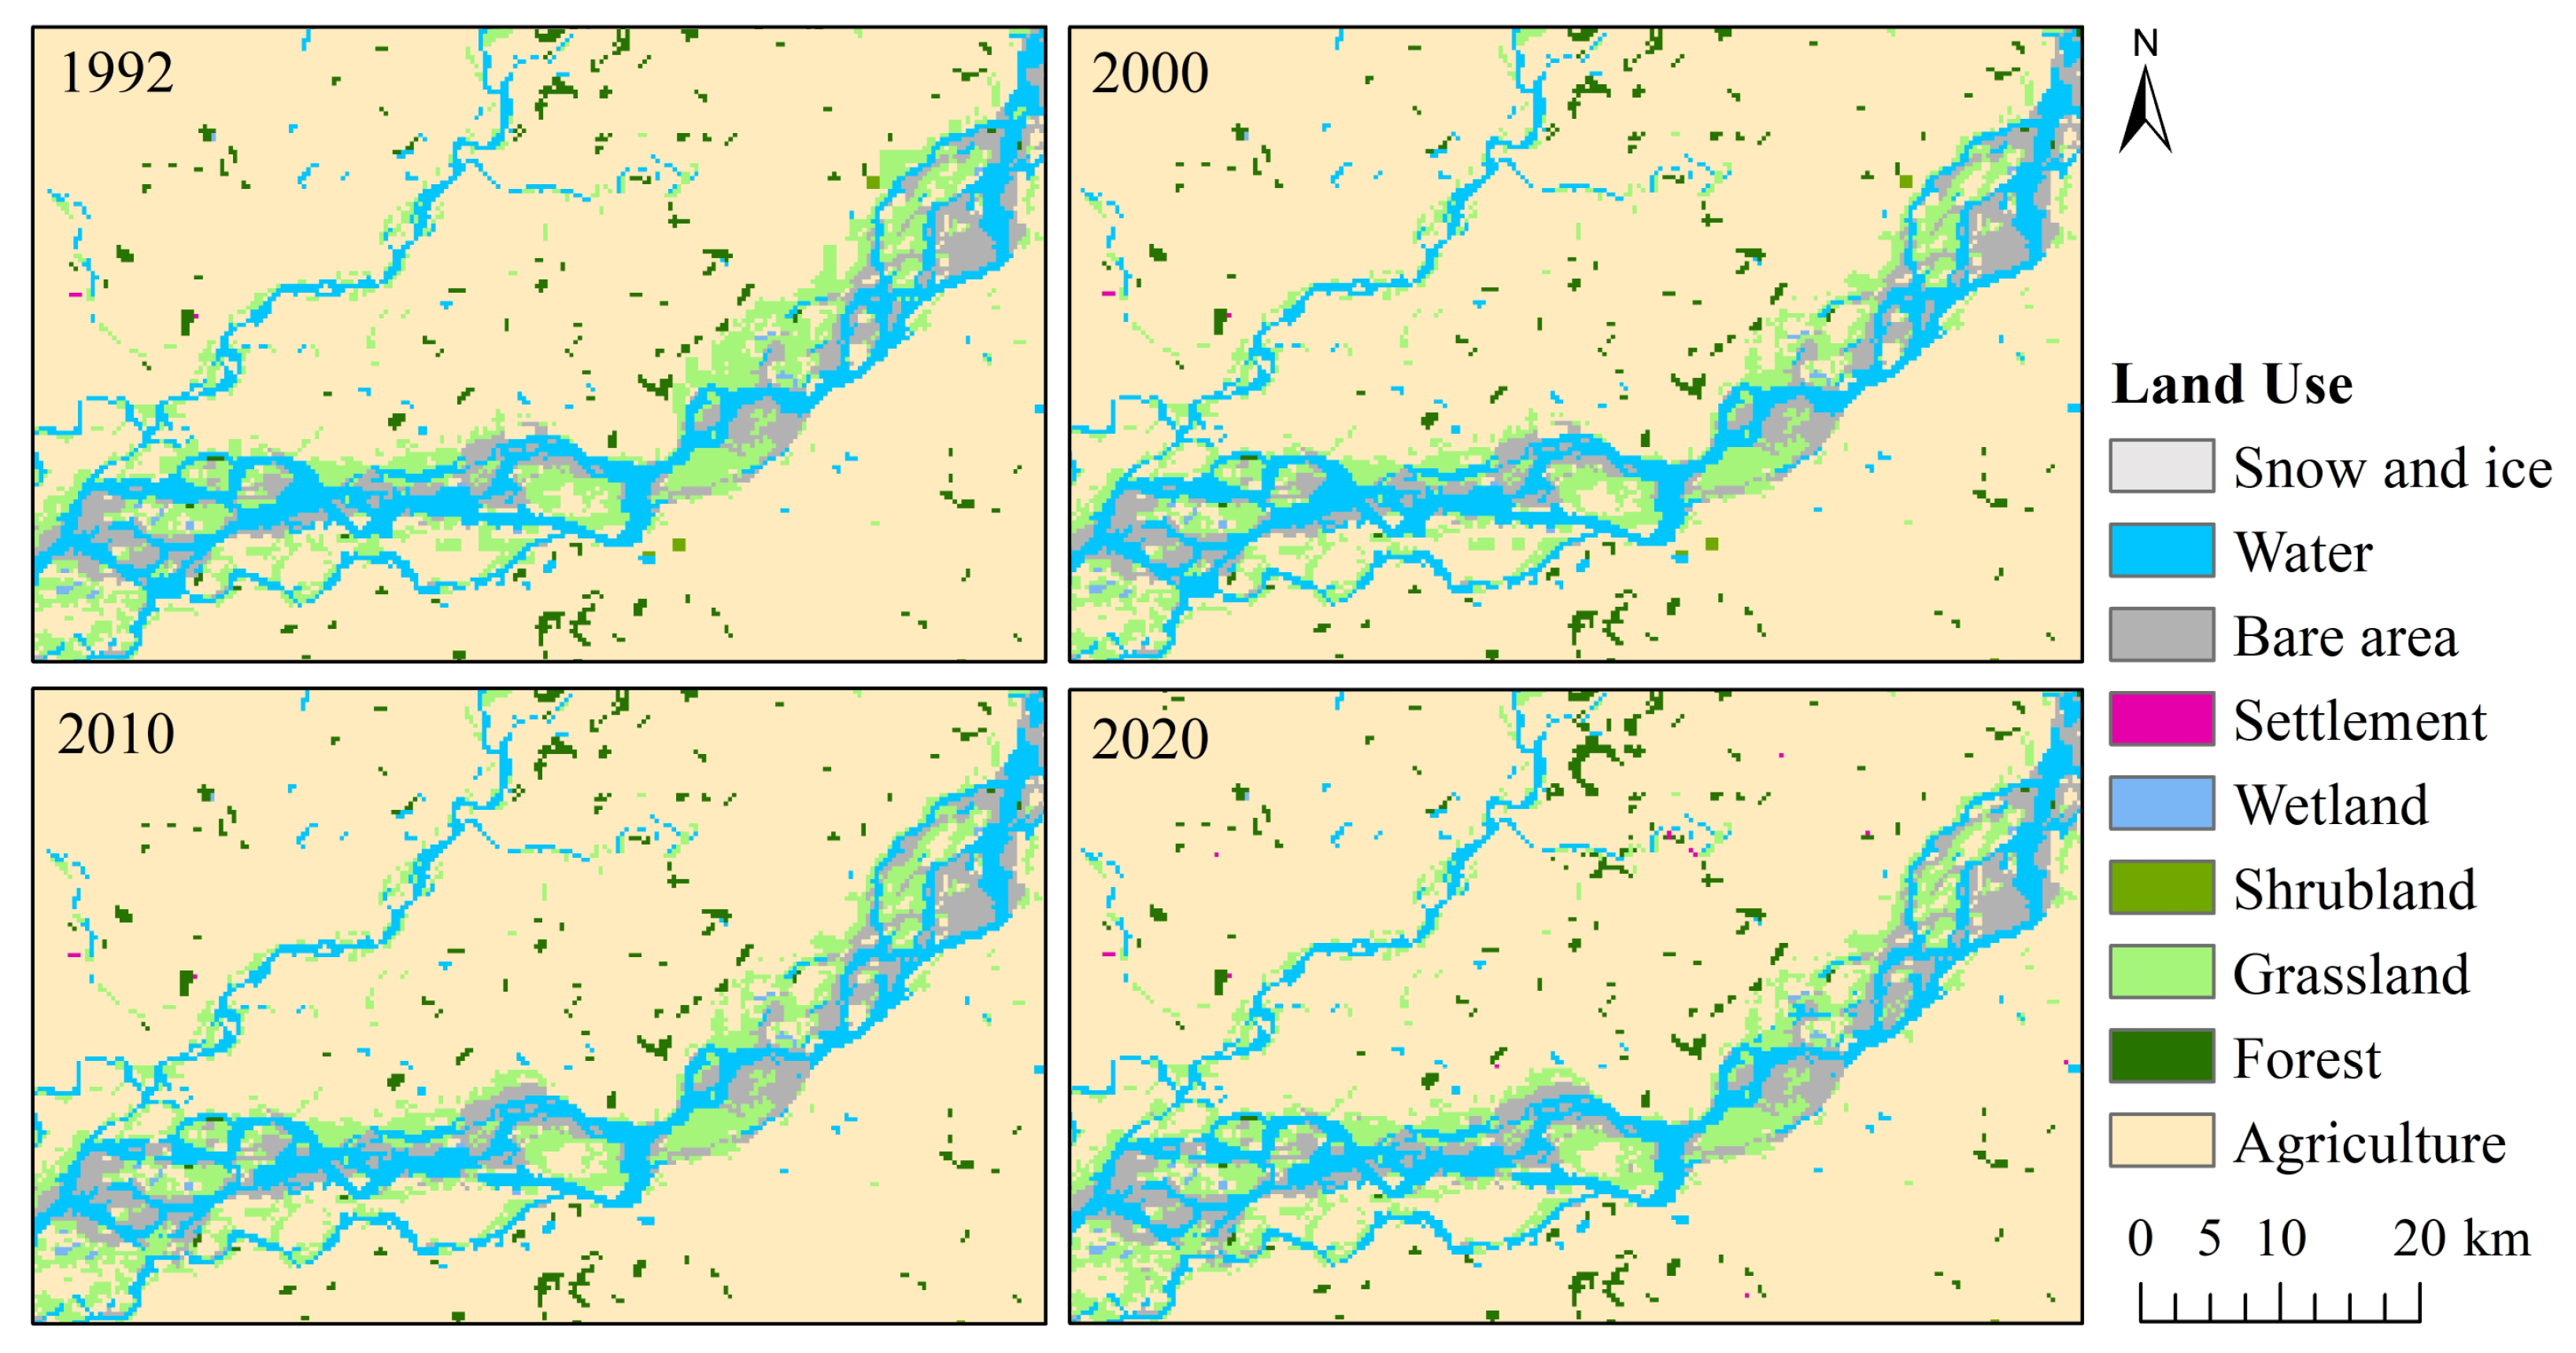
  73. Copernicus Climate Change Service. Land Cover Classification Gridded Maps from 1992 to Present Derived from Satellite Observations; Copernicus Climate Change Service: Reading, UK, 2019. [Google Scholar]
Figure 1. The braided Majuli Island reach of the Brahmaputra River (Majuli Reach). The contours of Majuli Island, the bars, the main channel, and the river banklines in this figure are extracted from a 2020 image. Bars here include all the sandbars and vegetated islands within the channel. The main channel is defined as the widest active channel. The active channel boundary demarcating perennial flow areas that persist after the monsoon is termed here as bankline. This is a concept used to delineate the study area rather than a bank in the strict sense, and the clear identification allows for the measurement of changes in geomorphological units within our study area. The reach has been divided into thirteen segments along the channel to provide a quantified description of channel braiding. The segments are evenly spaced with a minimum representative length based on the experimental results of Egozi and Ashmore (2008) [38]. Because of the contrasting development of the reach upstream and downstream of the control point (Borboka Pathar), the study reach was divided for description into reach A (composed of the first six segments) and reach B (composed of the last seven segments). The point labeled KM0826 marks the location of the virtual station where the water level series for the reach was collected.
Remotesensing 17 00944 g001
Figure 2. A geomorphological sketch and the satellite image of the study area. (a) Terrain of the upper catchment of the Majuli Reach. (b) Longitudinal bank profile of the Brahmaputra River, with the red dot indicating the location of the Majuli Reach, adapted from Goswami [19]. (c) Satellite image taken on 29 December 2020 showing the dense sandbars and braided channels in the Majuli Reach.
Remotesensing 17 00944 g002
Figure 3. Characteristics of the hydrological factors in Majuli Reach. (a) Long-term changes in discharge (1979–2020) and water level (2009–2022). The discharge time series was signaled using a low-pass FFT filter to make the long-term trend in discharge more apparent. (b) Monthly trends in discharge and water level. (c) Stage–discharge curve constructed from monthly discharge and water level data for the years 2009–2020.
Remotesensing 17 00944 g003
Figure 4. Braiding index MPFI (Modified Plan Form Index) of the Majuli Reach and its sub-reaches (Reach A and Reach B) during the past three decades (1990–2020). (a) The variation of MPFI indicates a high degree of braiding of the reach. (b) The box plot shows the variability of MPFI in Majuli Reach and its sub-reaches. Reach A has a lower average but a wider fluctuation in braiding degree than Reach B. Reach A and Reach B are shown in Figure 1.
Remotesensing 17 00944 g004
Figure 5. Variations in the number (shown by the bar) and area (shown by the box) of four categorized bars in (a) Reach A and (b) Reach B from 1990 to 2020. Bars are categorized according to their area: >10 km2 for large bars, 1~10 km2 for medium bars, 0.1~1 km2 for small bars, and <0.1 km2 for mini-sized bars. Reach A and Reach B are shown in Figure 1.
Remotesensing 17 00944 g005
Figure 6. Changes in the main channel from 1990 to 2020. Three of the dividing lines in Figure 1 remain for simplicity.
Remotesensing 17 00944 g006
Figure 7. Changes in the position of banklines and the area of riparian zone: (a) bankline alterations and (b) changes in the riparian land area. By imagining the upper and lower horizontal axes in (b) as the river banklines and the two “y = 0” axes as the 1990 bankline, it can be observed that the bank area changes each year in Reach A, Reach B, and the Majuli Reach (visualized with bars and lines, see the legend) compared to the 1990 bank. A positive number on the vertical axis indicates an increase in the riparian area in that year compared to 1990, while a negative number indicates a loss of riparian land. Three of the dividing lines in Figure 1 remain for simplicity.
Remotesensing 17 00944 g007
Figure 8. Regression analysis results of MPFI and (a) the moving average of the 3-year discharge (Discharge_Y_3ma), (b) the moving average of the 4-year flood season discharge (Discharge_F_4ma), and (c) the moving average of the 3-year flood season peak discharge (Discharge_P_3ma) are shown in the regression line graphs. (Y: hydrological year; F: flood season; P: peak value; ma: moving average).
Remotesensing 17 00944 g008
Figure 9. (a) Long-term changes in precipitation and temperature during 1979–2020. The shaded area around the line plot represents the 95% confidence intervals after polynomial fitting. The goodness of fit was high for both temperature (sig. < 0.01) and precipitation (sig. = 0.06) data. (b) Annual trends in precipitation and temperature in the Majuli Reach.
Remotesensing 17 00944 g009
Table 1. Details of the remote sensing images used in this study.
Satellite/SensorNumberDateSpatial ResolutionTemporal ResolutionMonthly Average Discharge/m3s−1Water Level a/m
Landsat 4–5 TM135/04127 December 199030 m16 days345072.36
Landsat 4–5 TM135/04123 November 199530 m16 days601373.68
Landsat 7 ETM135/04128 November 200030 m16 days644273.85
Landsat 7 ETM135/04110 November 200530 m16 days640173.83
Landsat 7 ETM135/04124 November 201030 m16 days744572.75
Landsat 8 OLI135/04130 November 201530 m16 days513171.76
Landsat 8 OLI135/04129 December 202030 m16 days300671.31
a The data from 1990, 1995, 2000, and 2005 were estimated from the stage–discharge curve constructed from the monthly discharge and water level data for the years 2009–2020, and the relationship between water level (y) and discharge (x) is y = 2.38ln(x) + 52.99 (R2 = 0.85).
Table 2. Correlation coefficients between n-year discharge and MPFI, where n ranges from 1 to 8 a.
Pearson’s r Pearson’s r Pearson’s r
Discharge_Y−0.43Discharge_F0.11Discharge_P0.22
Discharge_Y_2ma−0.28Discharge_F_2ma−0.04Discharge_P_2ma−0.25
Discharge_Y_3ma−0.65 *Discharge_F_3ma−0.13Discharge_P_3ma−0.50
Discharge_Y_4ma−0.28Discharge_F_4ma−0.36Discharge_P_4ma−0.48
Discharge_Y_5ma−0.03Discharge_F_5ma−0.11Discharge_P_5ma−0.24
Discharge_Y_6ma−0.28Discharge_F_6ma−0.07Discharge_P_6ma−0.24
Discharge_Y_7ma−0.14Discharge_F_7ma−0.29Discharge_P_7ma−0.36
Discharge_Y_8ma0.09Discharge_F_8ma−0.15Discharge_P_8ma−0.28
* The correlation is significant at the 0.1 level (one-tailed). a Y represents the hydrological year, F represents the flood season, P represents the peak discharge, and ma represents the moving average. “Discharge_Y_2ma” means the two-year moving average of the hydrological year discharge.
Table 3. Correlation coefficients between discharge and precipitation/temperature a.
AttributeDischarge
WinterSnowmelt PeriodFlood Season
PrecipitationLast winter0.150.060.12
Snowmelt period 0.66 ***0.35 **
Flood season 0.68 ***
TemperatureLast winter−0.030.160.05
Snowmelt period 0.22 *0.11
Flood season −0.07
*** The correlation is significant at the 0.01 level (one-tailed). ** The correlation is significant at the 0.05 level (one-tailed). * The correlation is significant at the 0.1 level (one-tailed). a Here, winter is from November to March, the snowmelt period is from April to May, and the flood season is from June to August.
Disclaimer/Publisher’s Note: The statements, opinions and data contained in all publications are solely those of the individual author(s) and contributor(s) and not of MDPI and/or the editor(s). MDPI and/or the editor(s) disclaim responsibility for any injury to people or property resulting from any ideas, methods, instructions or products referred to in the content.

