Article

The Standardized Spectroscopic Mixture Model

by
Christopher Small
1,* and
Daniel Sousa
2
1
Lamont-Doherty Earth Observatory, Columbia University, Palisades, NY 10964, USA
2
Department of Geography, San Diego State University, San Diego, CA 92182, USA
*
Author to whom correspondence should be addressed.
Remote Sens. 2024, 16(20), 3768; https://doi.org/10.3390/rs16203768
Submission received: 5 September 2024 / Revised: 8 October 2024 / Accepted: 9 October 2024 / Published: 11 October 2024

Abstract

:
The standardized spectral mixture model combines the specificity of a physically based representation of a spectrally mixed pixel with the generality and portability of a spectral index. Earlier studies have used spectrally and geographically diverse collections of broadband and spectroscopic imagery to show that the reflectance of the majority of ice-free landscapes on Earth can be represented as linear mixtures of rock and soil substrates (S), photosynthetic vegetation (V) and dark targets (D) composed of shadow and spectrally absorptive/transmissive materials. However, both broadband and spectroscopic studies of the topology of spectral mixing spaces raise questions about the completeness and generality of the Substrate, Vegetation, Dark (SVD) model for imaging spectrometer data. This study uses a spectrally diverse collection of 40 granules from the EMIT imaging spectrometer to verify the generality and stability of the spectroscopic SVD model and characterize the SVD topology and plane of substrates to assess linearity of spectral mixing. New endmembers for soil and non-photosynthetic vegetation (NPV; N) allow the planar SVD model to be extended to a tetrahedral SVDN model to better accommodate the 3D topology of the mixing space. The SVDN model achieves smaller misfit than the SVD, but does so at the expense of implausible fractions beyond [0, 1]. However, a refined spectroscopic SVD model still achieves small (<0.03) RMS misfit, negligible sensitivity to endmember variability and strongly linear scaling over more than an order of magnitude range of spatial resolution.

1. Introduction

The standardized spectral mixture model (SSMM) combines the specificity of a physically based representation of a spectrally mixed pixel with the generality and portability of a standard spectral index. However, unlike spectral indices, the spectral mixture model provides quantitative estimates of areal abundance of all endmember (EM) reflectances within the pixel Instantaneous Field of View (IFOV). By using a standard set of spectral EMs chosen to span a large, spectrally diverse, feature space, the resulting EM fraction estimates can be compared across space and time. This standardization makes the SSMM a potentially valuable complement to more complex spectral mixture models that may use local EMs or spectral libraries. An additional benefit of spectral mixture models more generally is the ability to easily quantify wavelength-specific model misfit by using the EM fraction estimates obtained from the model inversion to “remix” the endmember spectra for comparison to the mixed spectrum being modeled [1,2,3]. When applied to imaging spectrometer measurements, the SSMM can provide a basis for representing high-dimensional data volumes using a conceptually simple low-dimensional model. Furthermore, once the low-dimensional model has been computed, it can be subtracted from the high-dimensional observations to yield a spectral mixture residual that can reveal subtle spectral features (e.g., absorptions) that may be deemphasized in the full spectra [4]. Standardizing the linear mixture model using a parsimonious set of canonical endmembers allows it to encompass location- and application-specific mixture models by providing a common basis within which all linear models may be represented.
Spectrally and geographically diverse collections of broadband imagery have been used to show that the aggregate reflectance of the vast majority of ice-free landscapes on Earth can be represented as linear mixtures of rock and soil substrates (S), photosynthetic vegetation (V) and dark targets (D) composed of shadow and spectrally absorptive/transmissive materials (e.g., deep clear water, ferromagnesian rock, organic-rich soil). As such, dark fraction estimates can also be used to quantify variations in illumination, geometry (i.e., slope and aspect) and surface roughness [5]. The spectral feature space bounded by these SVD EMs is also referred to as a spectral mixing space in acknowledgement of the spectral mixing that generally occurs at or below the subpixel scale of the IFOV. Compilations of Landsat, Sentinel and MODIS have been used to demonstrate the consistency of the triangular SVD mixing space across landscapes [6,7,8,9,10,11]. In addition, distinct mixing continua are observed for sands and evaporite substrates, shallow marine substrates (e.g., rock, sediments and coral) and the snow/firn/ice continuum [7,10,12]. The widespread applicability of the SVD model and remarkable stability of its inversion for broadband spectra are noteworthy, given its generally small (<~5%) misfit and linear scaling over orders of magnitude in sensor resolution [7,9,13]. This begs the question of whether similar characteristics may extend to spectrally mixed pixels collected by imaging spectrometers. The fact that application-specific linear mixture models have been used to represent hyperspectral data for years suggests that this may be the case (e.g., [2,14,15,16,17,18]).
Pilot studies of spectra collected by the AVIRIS and EMIT spectrometers suggest that the broadband SVD model may be extended to higher spatial and spectral resolution. Sousa and Small (2017) used a diverse collection of 3–9 m AVIRIS imagery from a variety of landscapes in California to demonstrate similarity of mixing space topology and EMs to near-simultaneous acquisitions of 30 m Landsat imagery [13]. More recently, Sousa and Small (2023) used a smaller but diverse set of 20 early-release EMIT granules to verify the SVD mixing space topology and EMs at 40–60 m and 10 nm resolutions [19]. In addition to using the singular value decomposition to quantify spectral dimensionality and mixing space topology, this study also used nonlinear dimensionality reduction [20] to characterize local mixing space topology as well as that of the feature space of the SVD mixture residual [19]. The much greater spectral and geographic diversity of the current EMIT archive allows for this characterization to be extended to a more globally representative diversity of landscapes than was possible with the 20 early release EMIT granules.
Both broadband and spectroscopic studies of the spectral mixing spaces raise questions about the completeness and generality of the SVD model for ice-free land cover, specifically regarding the plane of substrates revealed by the earlier studies referenced above. Variance partition from singular value decomposition of image compilations consistently shows both broadband and spectroscopic mixing spaces to be statistically three-dimensional (3D) for >95% of total variance [21,22,23]. The third dimension generally accounts for only a few percent of total variance of the 3D space, but this thin third dimension consistently corresponds to the plane of substrates and often reveals additional potential substrate EMs. Most notably would be non-photosynthetic vegetation (NPV), which is abundant in many landscapes and often considered a distinct endmember [16,24,25,26]. In addition, previous studies have also shown that the high albedo substrate EM most often corresponds to a sand reflectance which is generally distinct from lower albedo soil reflectances. SVD models using a sand substrate EM can represent reflectances of a diversity of landscapes accurately (<~6% RMS misfit), but the significantly higher amplitude of a sand substrate EM may also underestimate the true fraction of lower albedo soils present in most landscapes with exposed substrate. In addition, the lack of an NPV EM omits an important compositional component of the vegetation–substrate continuum in many landscapes. Extending the SVD model by including an NPV EM would effectively extend the 2D planar triangular model to a 3D tetrahedral model, perhaps better representing the true 3D topology of the spectral mixing space. However, adding another degree of freedom to a stable model may incur costs in terms of model stability.
The objectives of this study are fourfold: (1) Verify the generality and stability of the spectroscopic SVD model in a larger, more spectrally diverse range of landscapes than previous studies have used. (2) Characterize the SVD topology and plane of substrates to assess linearity of spectral mixing. (3) Identify additional potential endmembers for non-sandy soil and NPV to extend the SVD model. (4) Quantify fraction estimate plausibility, EM sensitivity and linearity of spatial scaling for the spectroscopic linear mixture model. The ultimate objective is to develop an effective low-dimensional model to represent a high dimensional mixing space, thereby simplifying the use of spectroscopic imagery for a variety of applications.

2. Materials and Methods

2.1. Data

Data for this study were acquired by the Earth Mineral Dust Source Investigation (EMIT). EMIT is a NASA spaceborne imaging spectroscopy mission with the primary purpose of studying the mineralogy of dust and dust source regions [27]. The EMIT instrument is a Dyson imaging spectrometer with 11° cross-track field of view, a wide-swath (1240 samples) design, and a fast (F/1.8) optical system. EMIT data are collected across a 380–2500 nm spectral range at ~7.4 nm spectral sampling, with a high signal-to-noise ratio (SNR, >500 in most regions of the spectrum) [28,29]. EMIT was launched on 14 July 2022 using a SpaceX Dragon vehicle and autonomously docked to the forward-facing port of the International Space Station (ISS) [30]. EMIT data and algorithms are freely available for public use. All analysis in this manuscript uses the Level-2A surface reflectance product [31,32], downloaded free-of-charge from NASA’s EarthData Search web portal at: https://search.earthdata.nasa.gov (accessed on 4 October 2024).
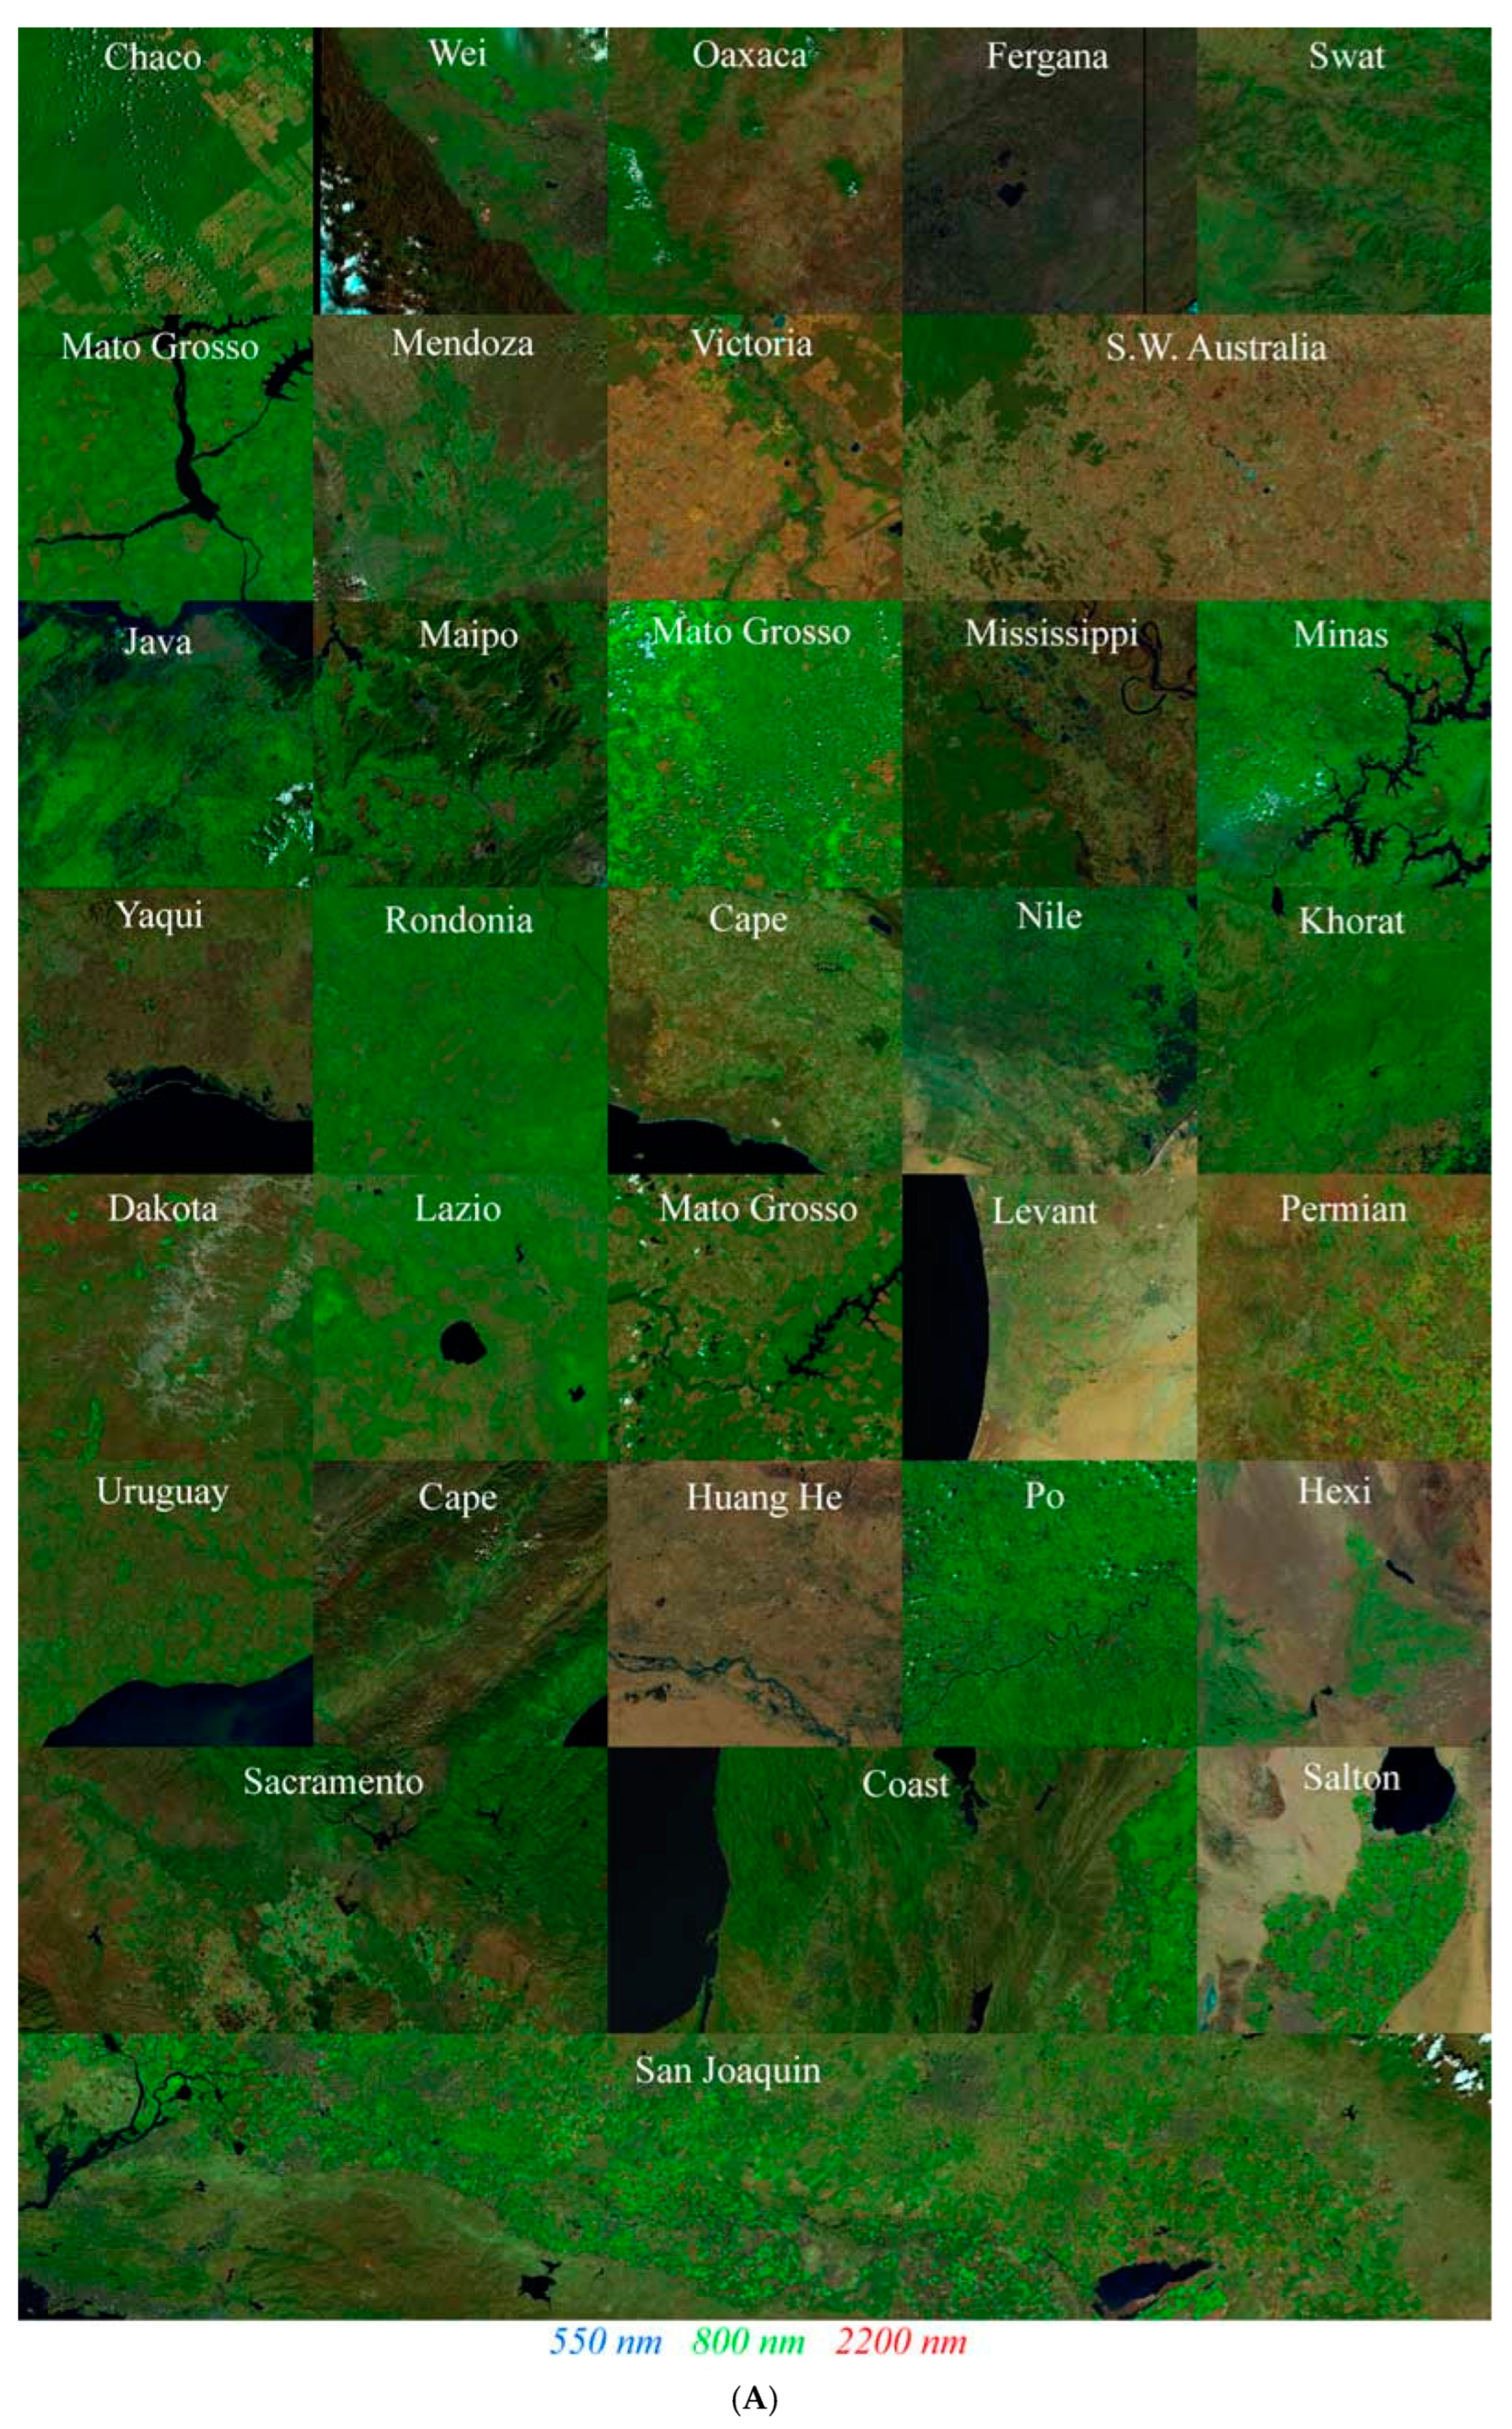
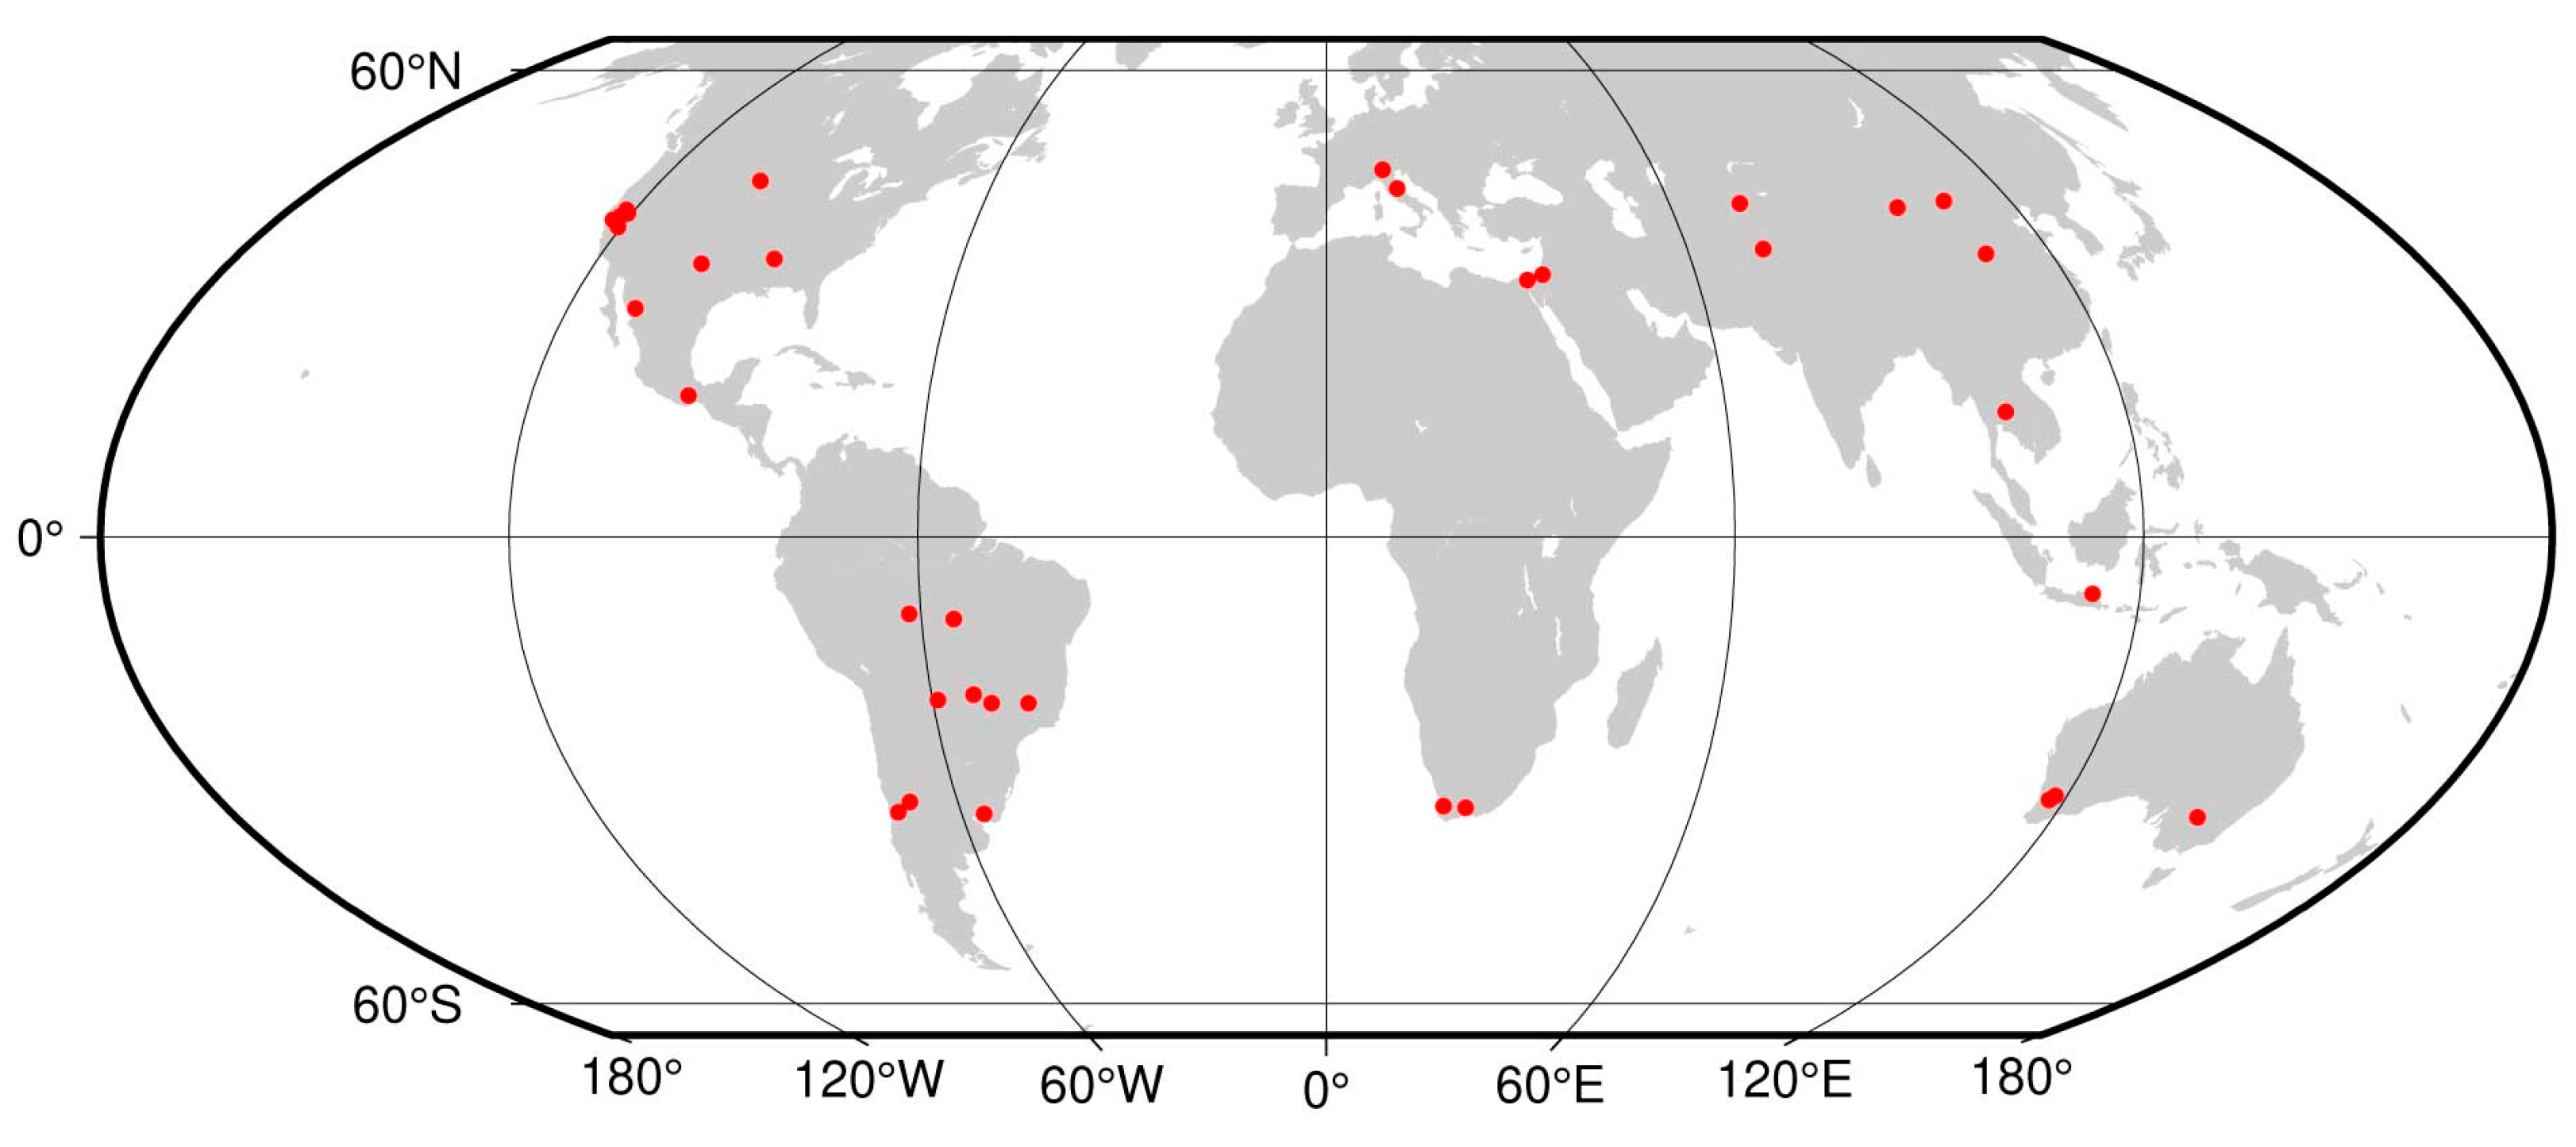
A total of 40 EMIT granules were selected from 33 agricultural basins worldwide, as constrained by the ISS orbit and the available EMIT acquisitions. We focus on agricultural basins because of the diversity of soils and vegetation types that characterize many agricultural basins. Granules were chosen on the basis of climate, biome, geologic substrate and cropping stage in order to maximize spectral diversity with respect to vegetation cover density, soil exposure and tillage and geologic diversity of surrounding substrates. Limitations were imposed by the coverage of available EMIT data and atmospheric conditions. As shown in Figure 1, all continents (except Antarctica) are represented, as are most major agricultural basins worldwide, within the constraints of available EMIT coverage. Figure 2 shows the mosaic of EMIT granules as RGB composites of visible (550 nm), near infrared (800 nm) and shortwave infrared (2200 nm) reflectance. The common linear stretch [0, 0.8] in Figure 2A illustrates the contrast between vegetation (green) and the diversity of substrates (brown) while the individual 2% linear stretches in Figure 2B highlight the spectral diversity of each granule. We believe the selection of granules chosen is sufficiently representative because the topology of the feature space (described below) is virtually identical to that of the above referenced MODIS-based study which was based on land area coverage more than 1000 times greater than that of the 40 granules used in this study.

2.2. Methods

2.2.1. Spectral Dimensionality and Mixing Space Topology

We use linear and nonlinear dimensionality reduction to characterize the statistical dimensionality and topology of the spectral mixing space of the EMIT mosaic described above. The singular value decomposition [33] is used to quantify the variance partition of the orthonormal dimensions (principal components; PCs) of the spectral + spatial matrix of reflectances [34] as given by the normalized singular values. This variance partition allows for separation of the low-order PCs representing the spatial distribution of the spectral eigenvectors that span the space of the spectral continuum defining the most distinctive types of land cover spectra. The topology of this low-dimensional space provides an indication of the linearity of spectral mixing within the space as well as facilitating identification of the spectral endmembers that span the space [2]. The endmembers are located at the apexes of the low-dimensional PC distribution while the linearity (or nonlinearity) of mixing can be inferred from the inward concavity (or convexity) of the orthogonal 2D projections of the PCs.

2.2.2. UMAP and Joint Characterization

The approach to nonlinear dimensionality reduction used in this study is the Uniform Manifold Approximation and Projection (UMAP) algorithm [20]. Briefly, UMAP is a manifold learning algorithm which assumes that the vectors of pixelwise high-dimensional spectroscopic reflectance can be approximated as uniformly distributed on a low-dimensional Riemannian manifold with a locally varying metric. UMAP seeks to learn this manifold by first building a fuzzy simplicial complex comprised of locally connected fuzzy simplicial sets, then finding an embedding with optimal similarity to the fuzzy topological structure through minimization of cross-entropy. Key choices in implementation of the UMAP algorithm include dimensionality of the embedding space and number of nearest neighbors (NNs) considered when constructing the simplicial sets. The decisions used in this study follow lessons learned during previous applications of UMAP to spectroscopic and multispectral image data [11,12,19,35,36,37,38].
We further synthesize linear and nonlinear dimensionality reduction under the framework of joint characterization (JC) [35]. JC explicitly acknowledges that important spectroscopic information can exist at multiple scales of variance. In fact, for spectroscopic applications, high-variance features (e.g., the spectral continuum) can be less useful (and are often reasonably approximated by multispectral sensors), but low-variance features (e.g., subtle spectral absorptions) can be critical for compositional diagnosis. JC combines UMAP and PC dimensions to visualize both high- and low-variance features together, providing a straightforward way of capturing, for instance, spectra with different mineralogical absorption features but similar overall spectral continua. The curious reader is directed towards [11,12,19,35,36,37,38] for further detail.

2.2.3. Linear Spectral Mixture Modeling

We use the unit-sum constrained linear mixture model originally developed by Adams, Smith and Johnson (1986) [39] for Martian spectra, and later applied to terrestrial spectra by Gillespie et al. (1990) [3] and Smith et al. (1990) [40]. For each pixel spectrum in the EMIT mosaic, the linear mixture model is given as
r = Ef + ε
in which r is the observed reflectance spectrum, E is the matrix of endmember spectra, f is the vector of endmember fractions sought and ε is the misfit to be minimized. In addition to a mixing equation for each waveband, the matrix E also contains a unit-sum constraint equation in which the sum of all fractions equals 1.
For the EMIT reflectance spectra in the 40 granule mosaic described above, we invert the constrained linear model using the familiar least squares solution given by Settle and Drake (1993) [1].
f = (ETE)−1 ETr
The validity of the SVD and SVDN models is quantified using the RMS misfit of the modeled to the observed spectra for each pixel in the EMIT mosaic. Bivariate distributions of RMS misfit are used to compare the performance of the models and the validity of the assumptions of dimensionality and linearity of spectral mixing. Analysis of linearity of scaling (described below) using higher spatial and spectral resolution spectra provides an independent vicarious validation of the linear mixing models for the EMIT spectra.

2.2.4. Endmember Selection and Sensitivity Analysis

Endmembers are identified from the apexes of the spectral mixing space given by the low-order PCs. For large, spectrally diverse collections of spectra, we distinguish between interior endmembers residing at the apexes of the dense continuum of the primary PC cluster, and exterior endmembers that sometimes form sparse constellations around the apexes but are more distant from the primary PC cluster [11]. Interior endmembers are generally means of several spectra clustered at the apex while exterior endmembers correspond to individual spectra distinct from the apex cluster. While the vegetation and dark apexes are generally well-defined with few (if any) exterior endmembers, the substrate apex often contains several exterior endmembers as well as nearby subsidiary apexes corresponding to lower amplitude substrate endmembers. We use the Pearson linear correlation coefficient (ρ) to quantify collinearity of spectral endmembers.
Endmember sensitivity analysis uses varying combinations of the exterior endmembers to define a suite of SVD models from all possible permutations of the exterior S, V and D endmembers. Following the methodology given by [7], the degree of collinearity (given by correlation coefficients) and dispersion (given by standard deviations) of all pairs of individual model fraction distributions provide metrics for the sensitivity of the SVD model to the variability among the exterior endmembers. As such, these metrics provide a conservative depiction of the uncertainty of fraction estimates obtained from the more representative interior endmembers.

2.2.5. Scaling Analysis

The potential linearity of spatial scaling of endmember fractions with sensor spatial resolution is an important benefit of the linear mixture model. The assumption of linear mixing by endmember area within the pixel IFOV contrasts with the non-associative property of the normalized difference used in most spectral. In this study, we use the methodology given by [7,41] to simulate the linear mixing of 4.4 m AVIRIS endmember fractions within the ~40 m × 60 m EMIT IFOV by convolving the AVIRIS fractions with a Gaussian point spread function with a full width half max of 50 m. Using the same EMIT-derived SVD endmembers interpolated onto the AVIRIS-3 wavebands to invert the SVD model yields 4.4 m fraction estimates, which are aggregated with the EMIT point spread function then co-registered with corresponding fractions obtained using the same endmembers to estimate SVD fractions for a near-simultaneous (1 day) EMIT acquisition.

3. Results

The spectral mixing space rendered from the low-order PCs reveals the expected triangular topology with clearly defined tapering apexes for vegetation and dark endmembers (Figure 3). The plane of substrates, accounting for ~2% of total variance, is characterized by a high albedo sand apex with multiple lower albedo sand apexes and a distinct mixing continuum extending to a soil endmember. Opposite the dark-to-soil continuum, a clear convex bulge reveals an NPV endmember with amplitude comparable to, but somewhat lower than, the soil endmember. Both sand and NPV endmembers form mixing continua converging to the vegetation and dark endmembers, with the plane of substrates forming the base of the SVDN tetrahedron.
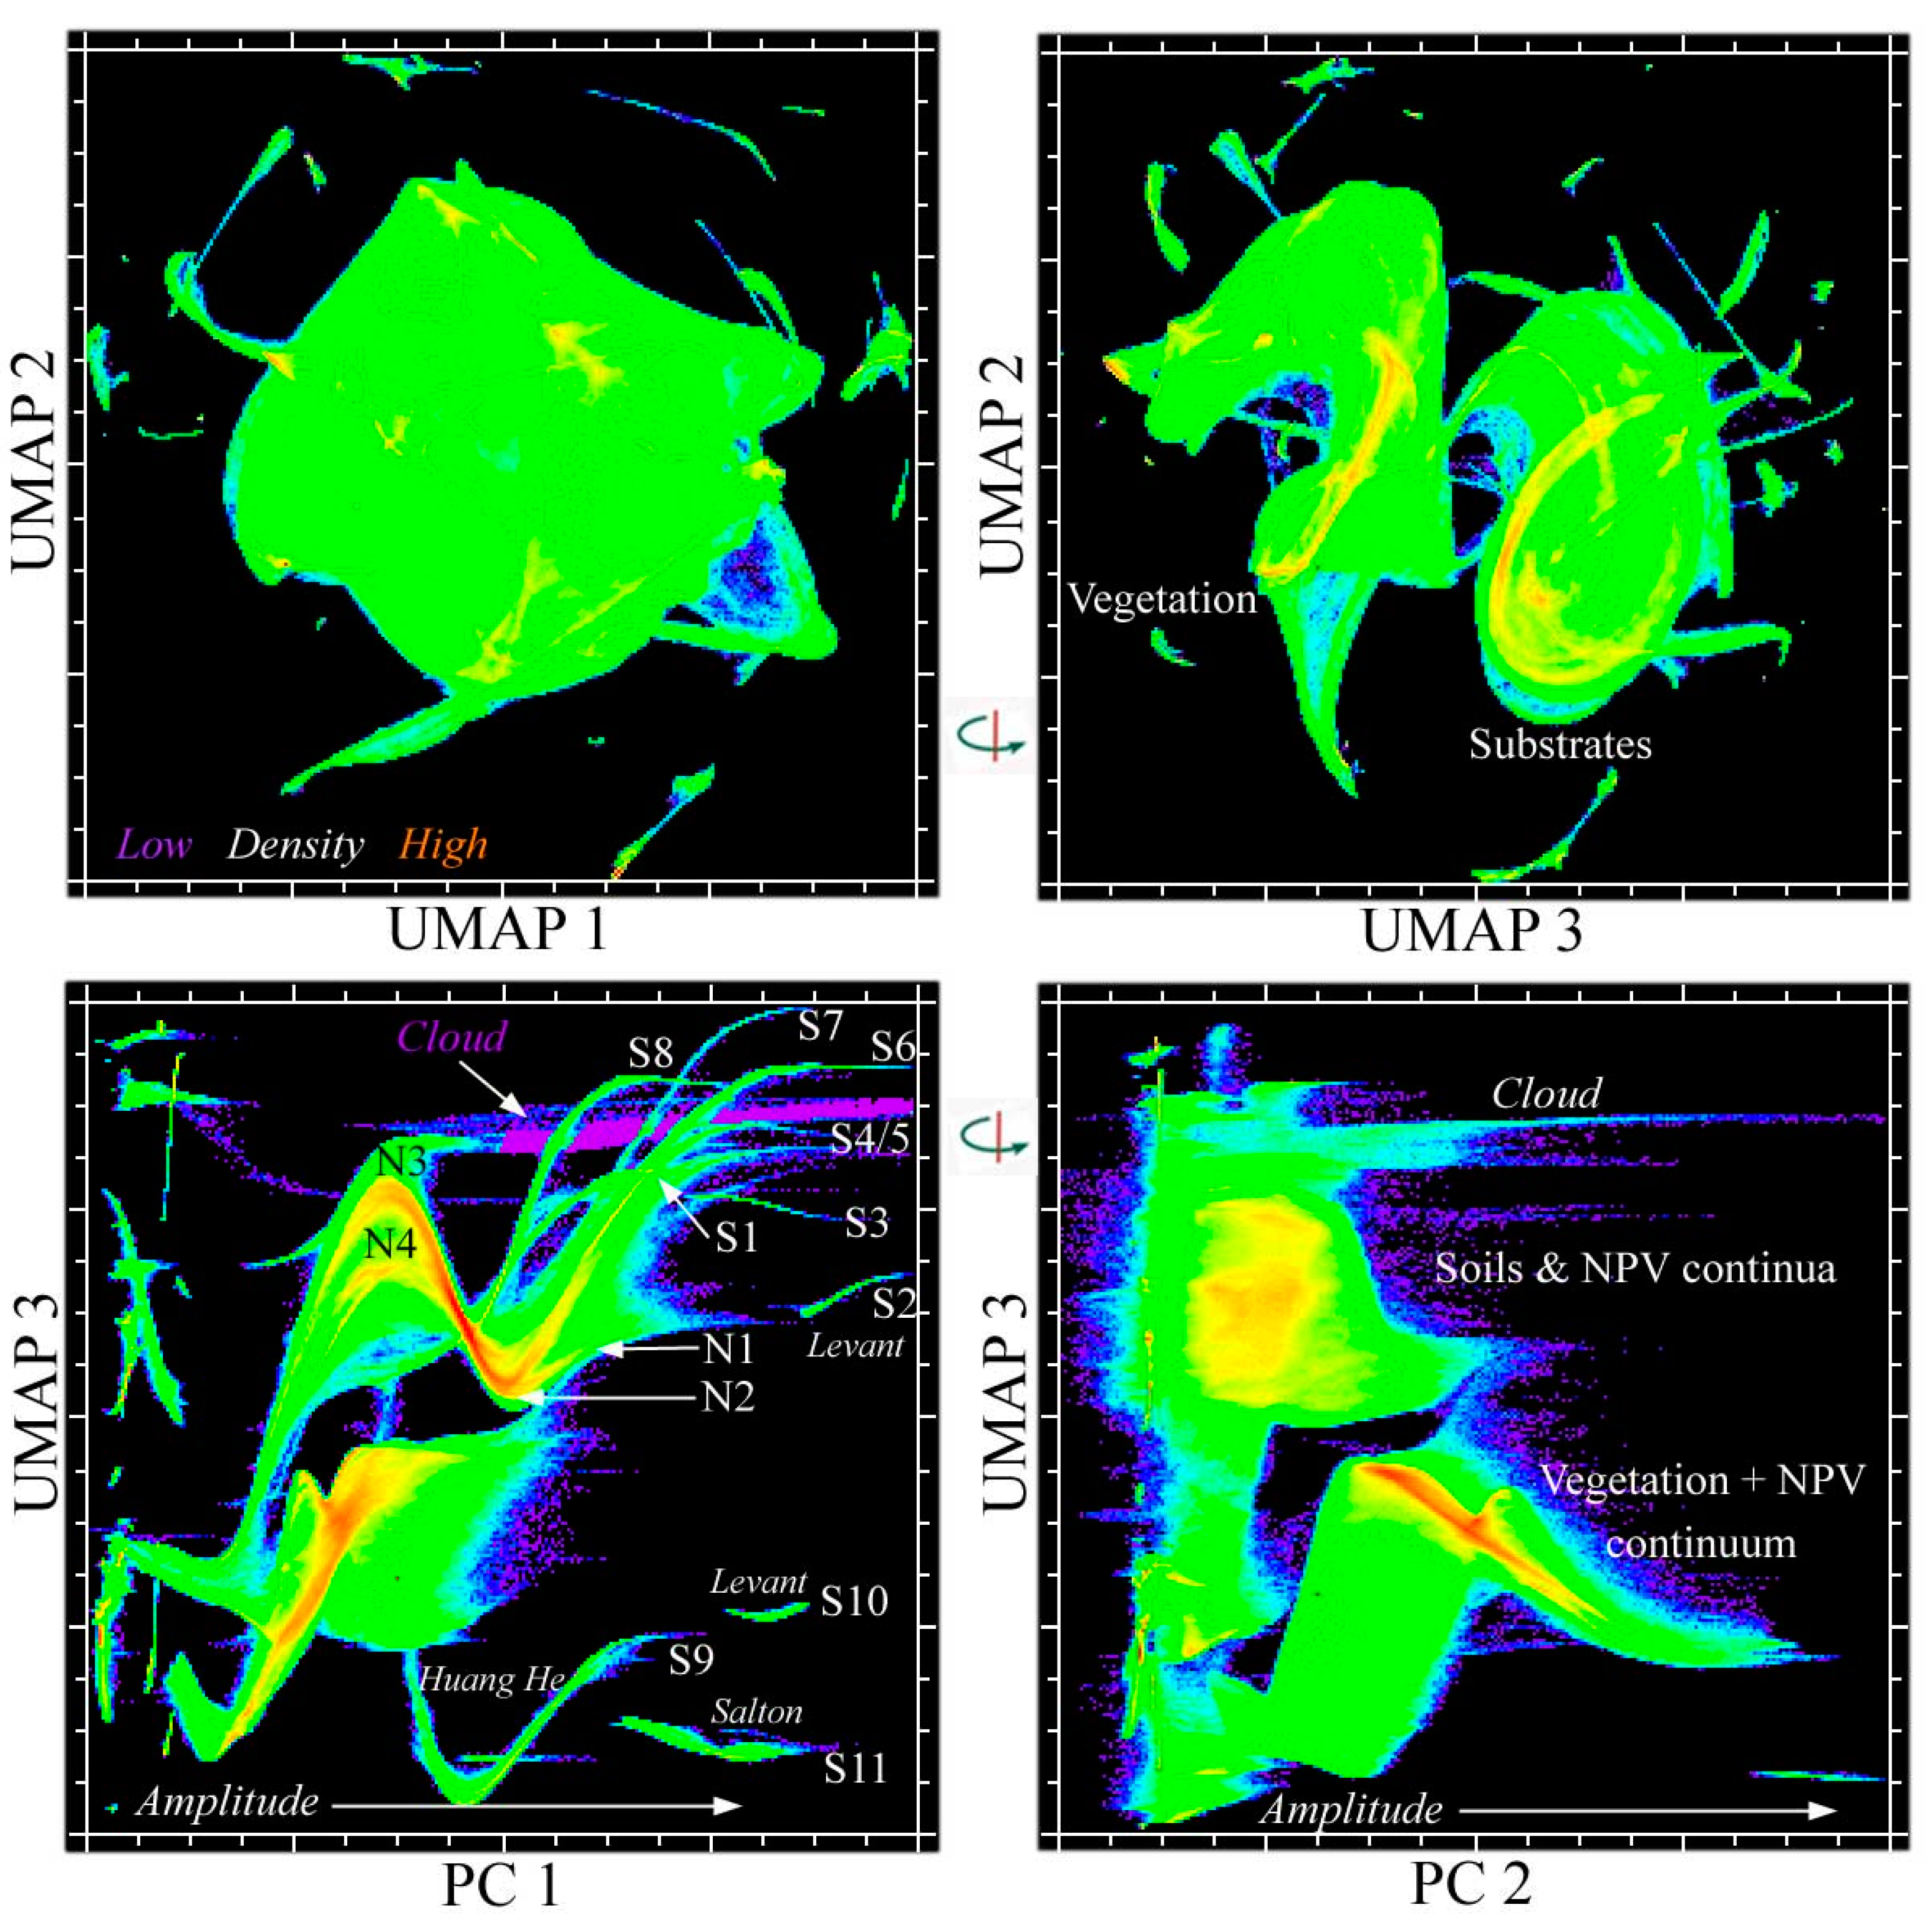
In contrast, the UMAP embeddings show distinct mixing continua for vegetation and substrates, with NPV connecting both. Figure 4 shows the UMAP embedding for a near_neighbor scaling of 30. The 1-2 projection shows a single continuum surrounded by a constellation of distinct clusters, while the 3-2 projection clearly distinguishes the vegetation and substrate continua. Almost all of the isolated clusters correspond to spectrally distinct water bodies, or water masses within the larger coastal water bodies. There are two distinct clusters corresponding to sand bodies in the Levant and Salton granules. However, almost all of the sands present in the several desert granules form continua within or connected to the larger substrate continuum. The joint characterization combining PCs 1 & 2 with UMAP dimension 3 show these continua more clearly as they all span a range of amplitudes extending from the dark endmember to each of the distinct sand reflectances present in the mosaic (Figure 4). At least nine distinct continua can be identified for this UMAP embedding. Higher near_neighbor settings collapse these distinct continua onto the larger substrate continuum.
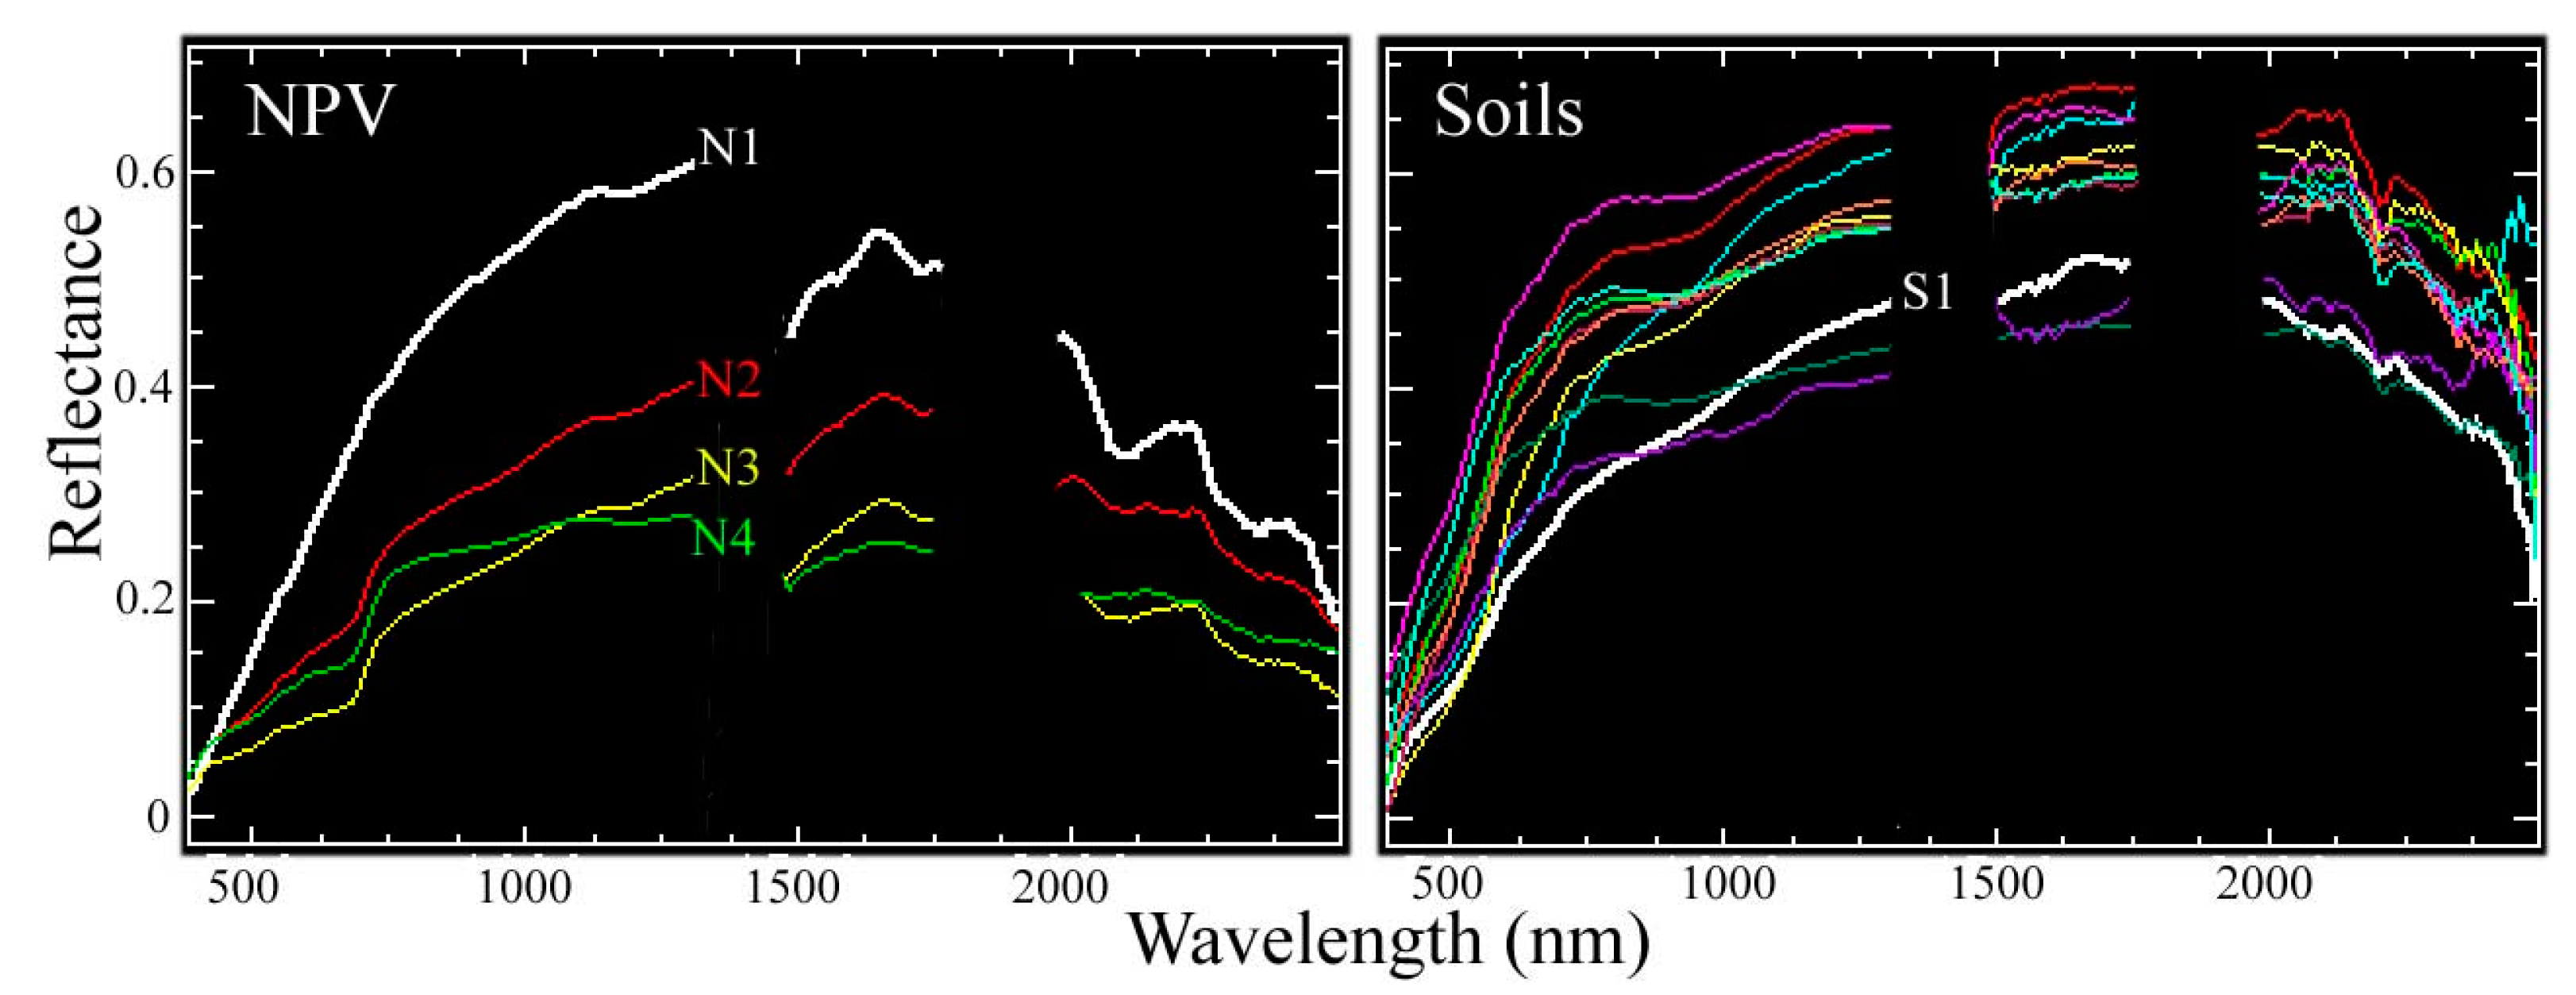
The joint characterization reveals the presence of two distinct limbs of lower amplitude NPV embedded within the substrate continuum. Differences in the VNIR and SWIR2 (2000–2500 nm) suggest that N3 may be more vegetation-dominant with deeper chlorophyll absorptions in the visible and more prominent lignin absorptions in the SWIR2 (Figure 5). In contrast, N4 has more nearly uniform VNIR reflectance reminiscent of sandy soil with no prominent absorptions in the SWIR2. These two limbs merge to form a single continuum that increases in amplitude to a branch point between higher amplitude NPV and a purely soil continuum at N2. The higher amplitude NPV (N1) and soil (S1) endmembers illustrate the NIR peak (~1400 nm) and deep lignin absorptions in SWIR2 of the NPV, in contrast to the more continuous soil spectrum peaking at SWIR1 wavelengths. This soil EM contrasts strongly with the VNIR shoulders and varying SWIR2 absorptions of the high albedo EMs of the sand continua.
Inversion of the SVDN mixture model yields the SVD composites shown in Figure 6A and the NPV and RMS misfit composites in Figure 6B. Aside from varying densities of vegetation canopy, the most prominent differences among the sample sites in the SVD composite is the contrast between higher albedo sandy soils and unmodeled sands (red) and lower albedo soils (blue to magenta). The relatively fine scale spectral diversity of the San Joaquin valley soils is especially apparent in this composite. The prominence of NPV (yellow) in most of the sample sites is apparent from Figure 6B. Because of the generally low misfit of the SVDN model, areas with relatively higher misfit (blue) are actually areas with relatively little exposed NPV. Inversions run without the unit sum constraint produced wildly divergent results for both the SVD and SVDN models, with implausible dark fraction estimates and fraction sums ranging from −2 to 10.
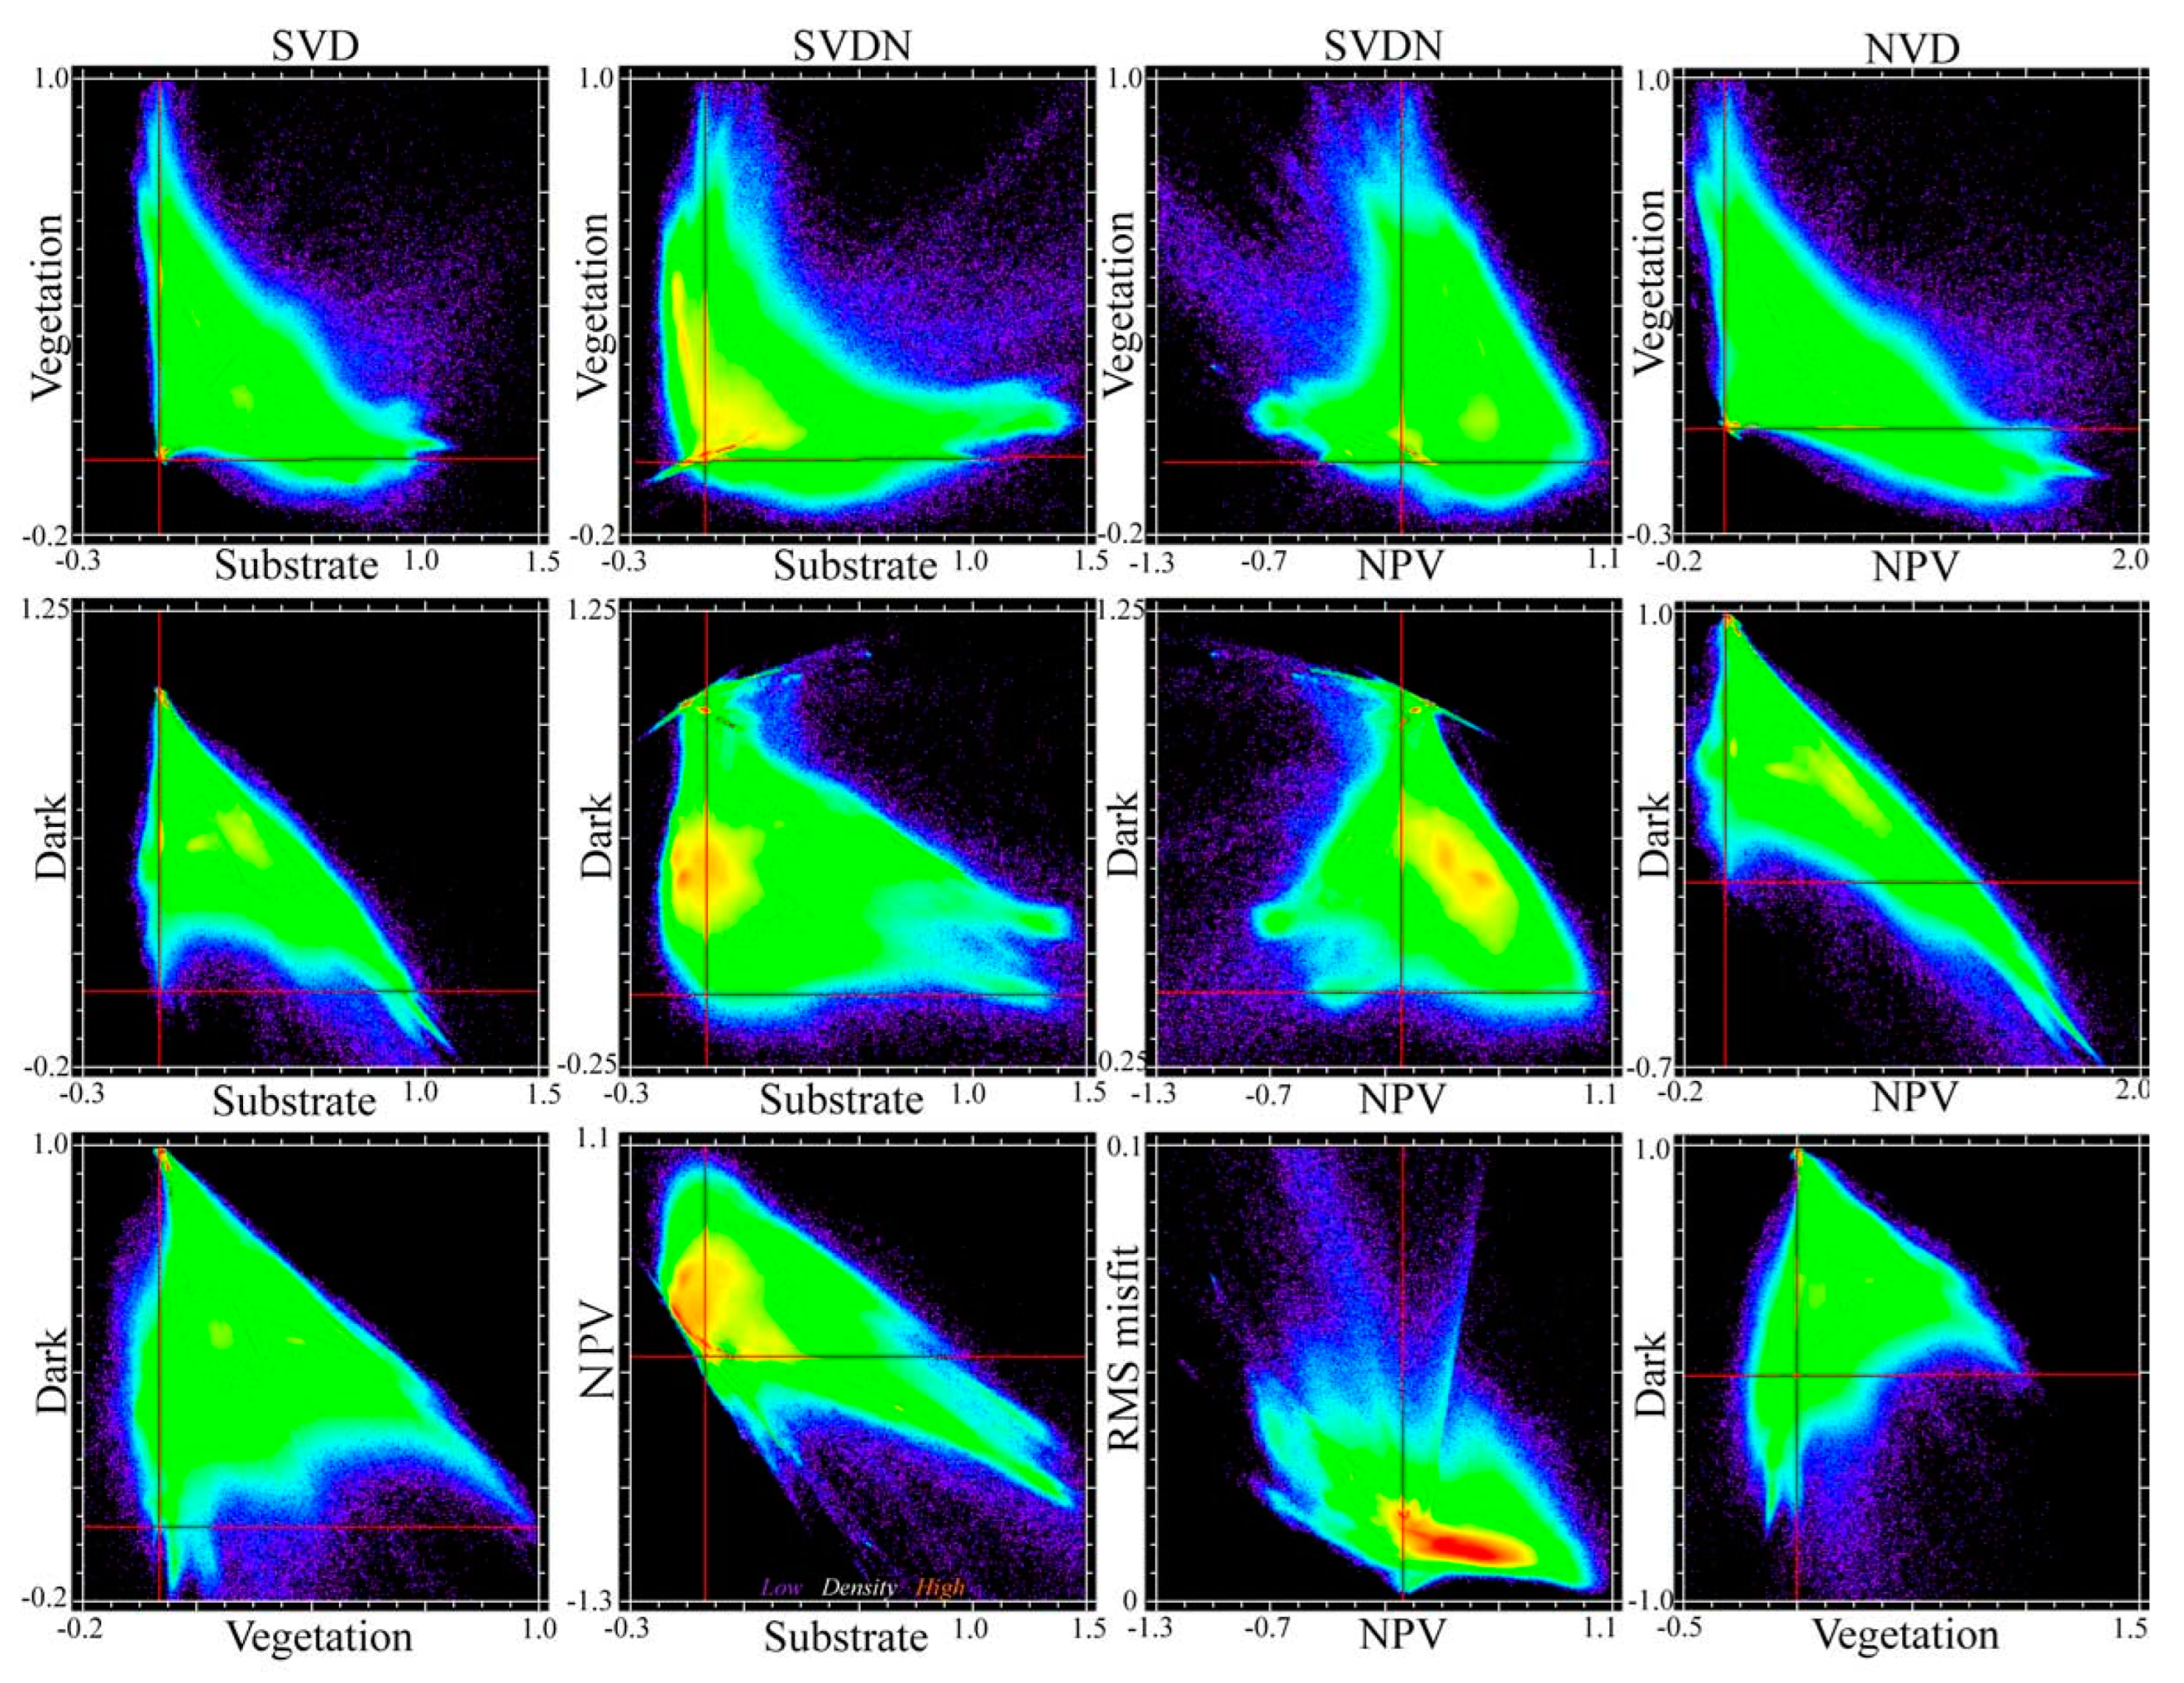
Comparing bivariate fraction distributions highlights the most prominent differences between the SVD, SVDN and NVD models. Figure 7 shows different models by column and corresponding fraction distributions across rows. Most immediately apparent is the difference in fraction distribution ranges among models. The SVD model (left) is well-bounded [0, 1] with all exceedances <0.1, while the SVDN and NVD models have both larger exceedances and much greater numbers of spectra out of range. This is particularly true for both substrate and vegetation in the SVDN model. For the SVDN model, 29% of substrate fractions are <0, while only 3% are <0 for the SVD model. For vegetation fractions, both models perform similarly with <5% of estimates <0—although the magnitude of exceedance is significantly greater for the SVDN model. For the SVDN model, most of the spectra with significantly negative substrate fractions have intermediate vegetation and dark fractions, corresponding to forests and other closed canopy vegetation. Notably, 29% of NPV fractions are <0 with exceedances reaching −1 for the SVDN model. The increasingly negative values of NPV with increasing substrate fractions >1 indicates that these nearly colinear (ρ = 0.9) endmembers together minimize misfit through destructive interference. In contrast, the NVD model shows similar tradeoffs of NPV with both the dark and vegetation fractions. Without a substrate endmember, the moderate collinearity (ρ = 0.53) of the NPV and vegetation endmembers results in similar interference effects. While the NVD model did yield plausible fractions for a significant number of modeled spectra, and may therefore be viable in some landscapes where NPV is more prominent than exposed soil, the large number of implausible fractions make it unsuitable for a general model for landscape reflectance.
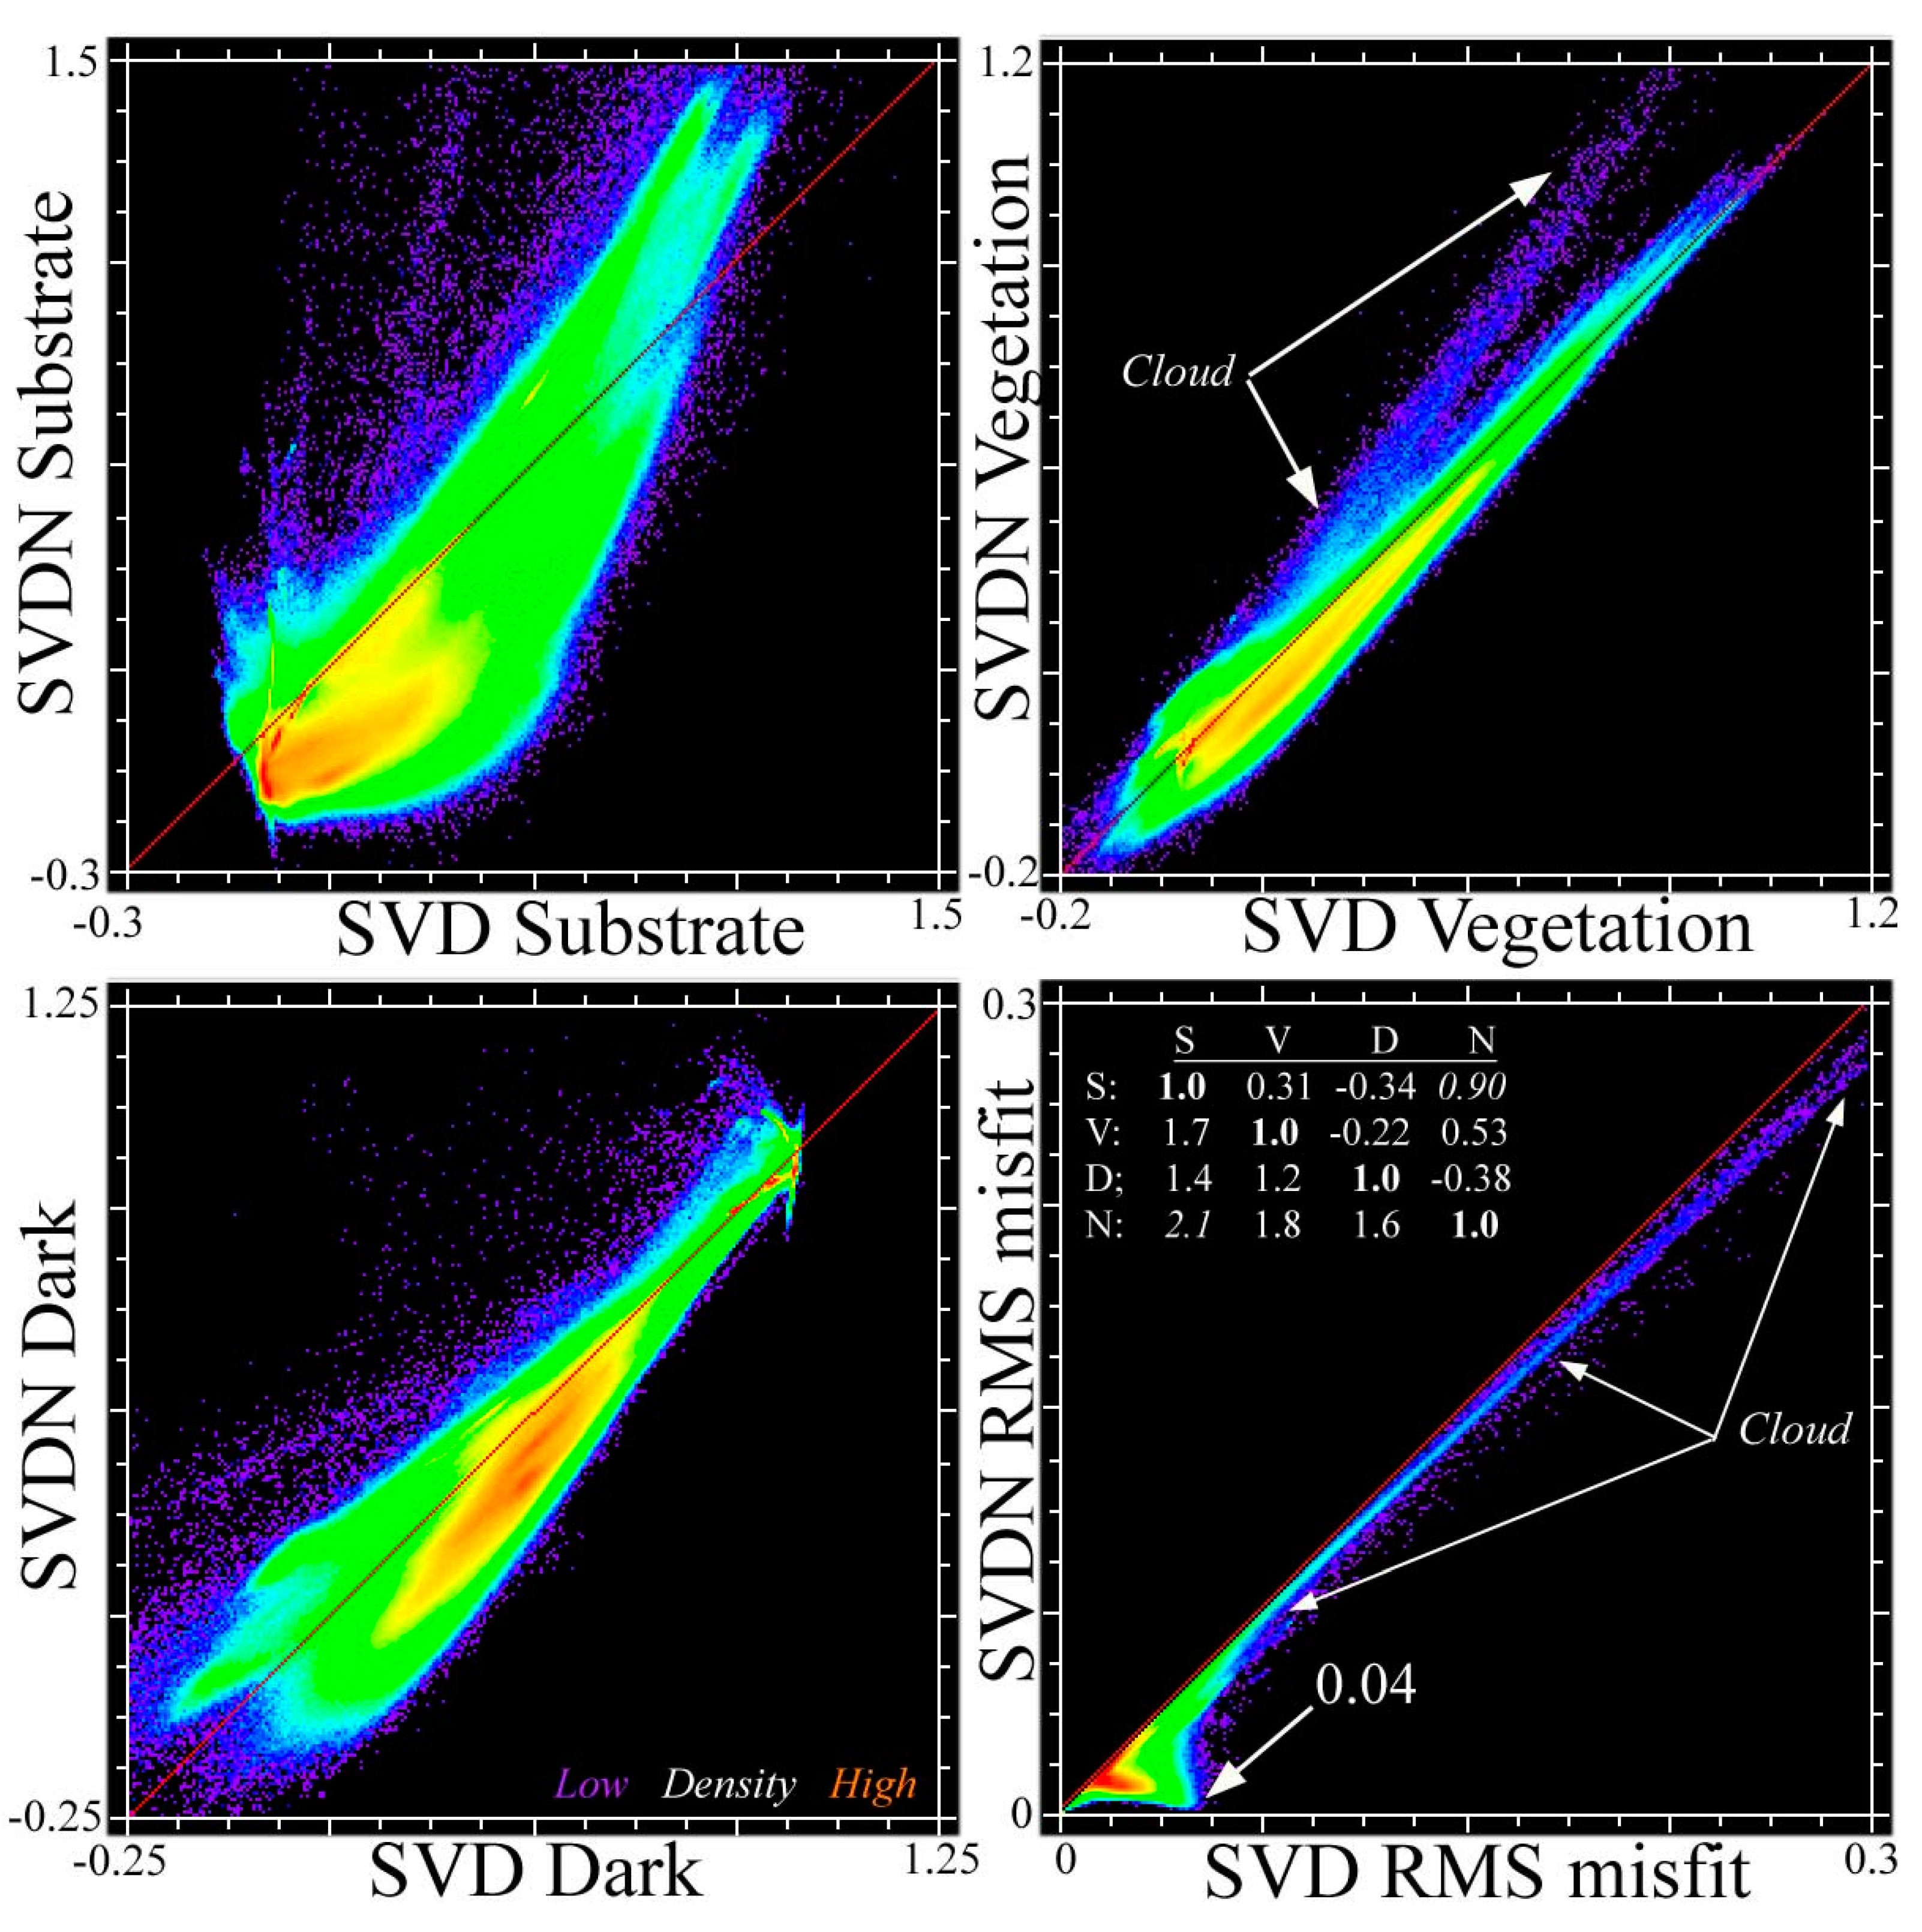
Comparing corresponding fraction distributions for the SVD and SVDN models reveals the effect of model dimensionality on the fraction estimates themselves. Figure 8 shows corresponding S, V and D fractions for both models, along with misfit distributions. As should be expected, the substrate fraction estimates are most strongly impacted by the presence of absence of the NPV endmember with a strong negative bias for all but the highest substrate fractions in the SVDN model. This is also true for the dark fractions, but to a much lesser extent than for substrates. It is noteworthy that vegetation fractions are almost identical for both models, although with a slight positive bias for the lowest vegetation fractions in the SVD model. As expected, the SVD model has higher RMS misfit than the SVDN, although both are quite small (<0.04) for all spectra except clouds. Although misfit is somewhat greater for the SVD model, it is still <0.04 for 98% and <0.02 for 68% of all spectra.
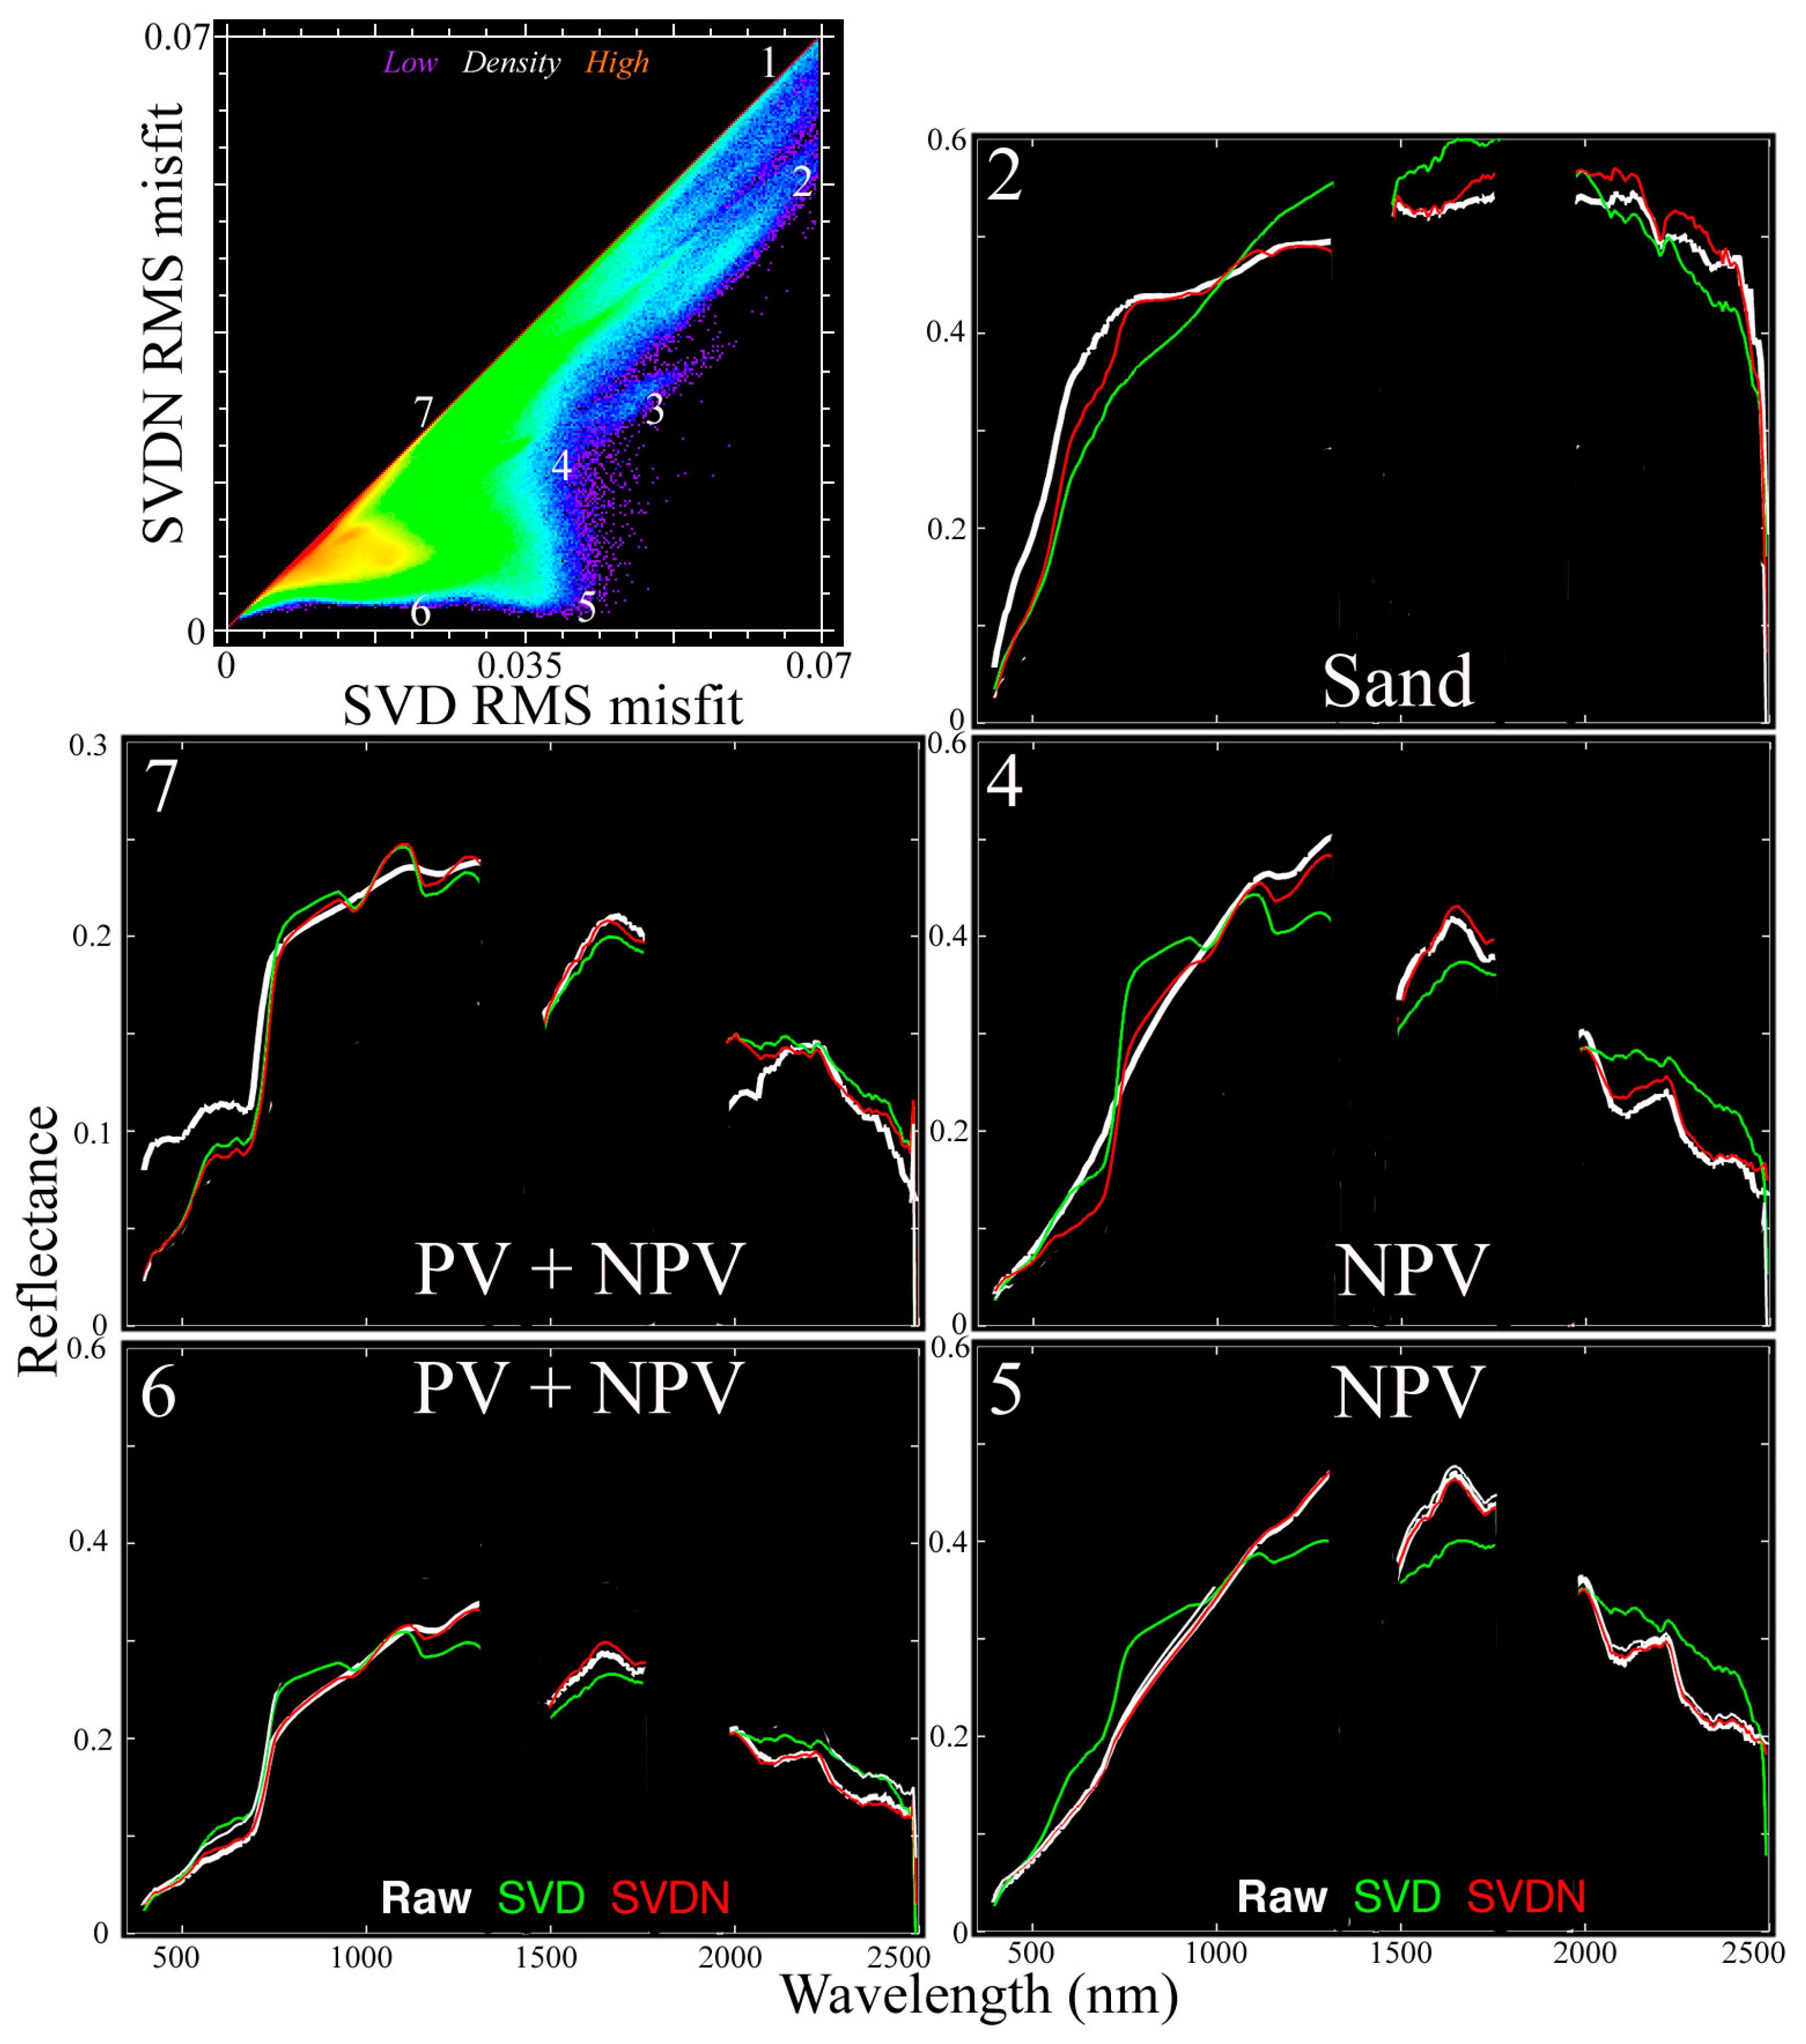
Comparing the observed spectra for both models reveals the nature of the misfits for each. Figure 9 shows the same RMS misfit comparison as Figure 8, but at an enlarged scale. Aside from cloud, both models show the largest misfits for sands (example 2). As expected, the SVDN model achieves much better fits for spectra with high NPV fractions. Both models have comparable misfits for example 7 because none of the EMs can accommodate the anomalously high visible reflectance of this mixture of NPV and vegetation.
The endmember sensitivity analysis confirms that the SVD model is quite robust to variations in all three endmembers. Comparing all permutations of three peripheral (outlier) spectra for each endmember quantifies the worst case scenarios using combinations of anomalous endmember spectra. Pairwise sensitivities between individual endmember spectra are highlighted by correlations between corresponding fractions for each endmember combination as shown in the inset correlation matrices in Figure 10. The consistently high (> 0.98) linear correlations for all endmember combinations highlights the extremely stable nature of the SVD model inversion that results from the near orthogonality of its endmembers. The large numbers of implausible fraction estimates produced by the SVDN and NVD models reveal the relative instability of these models, thereby precluding the utility of sensitivity analysis for either model.
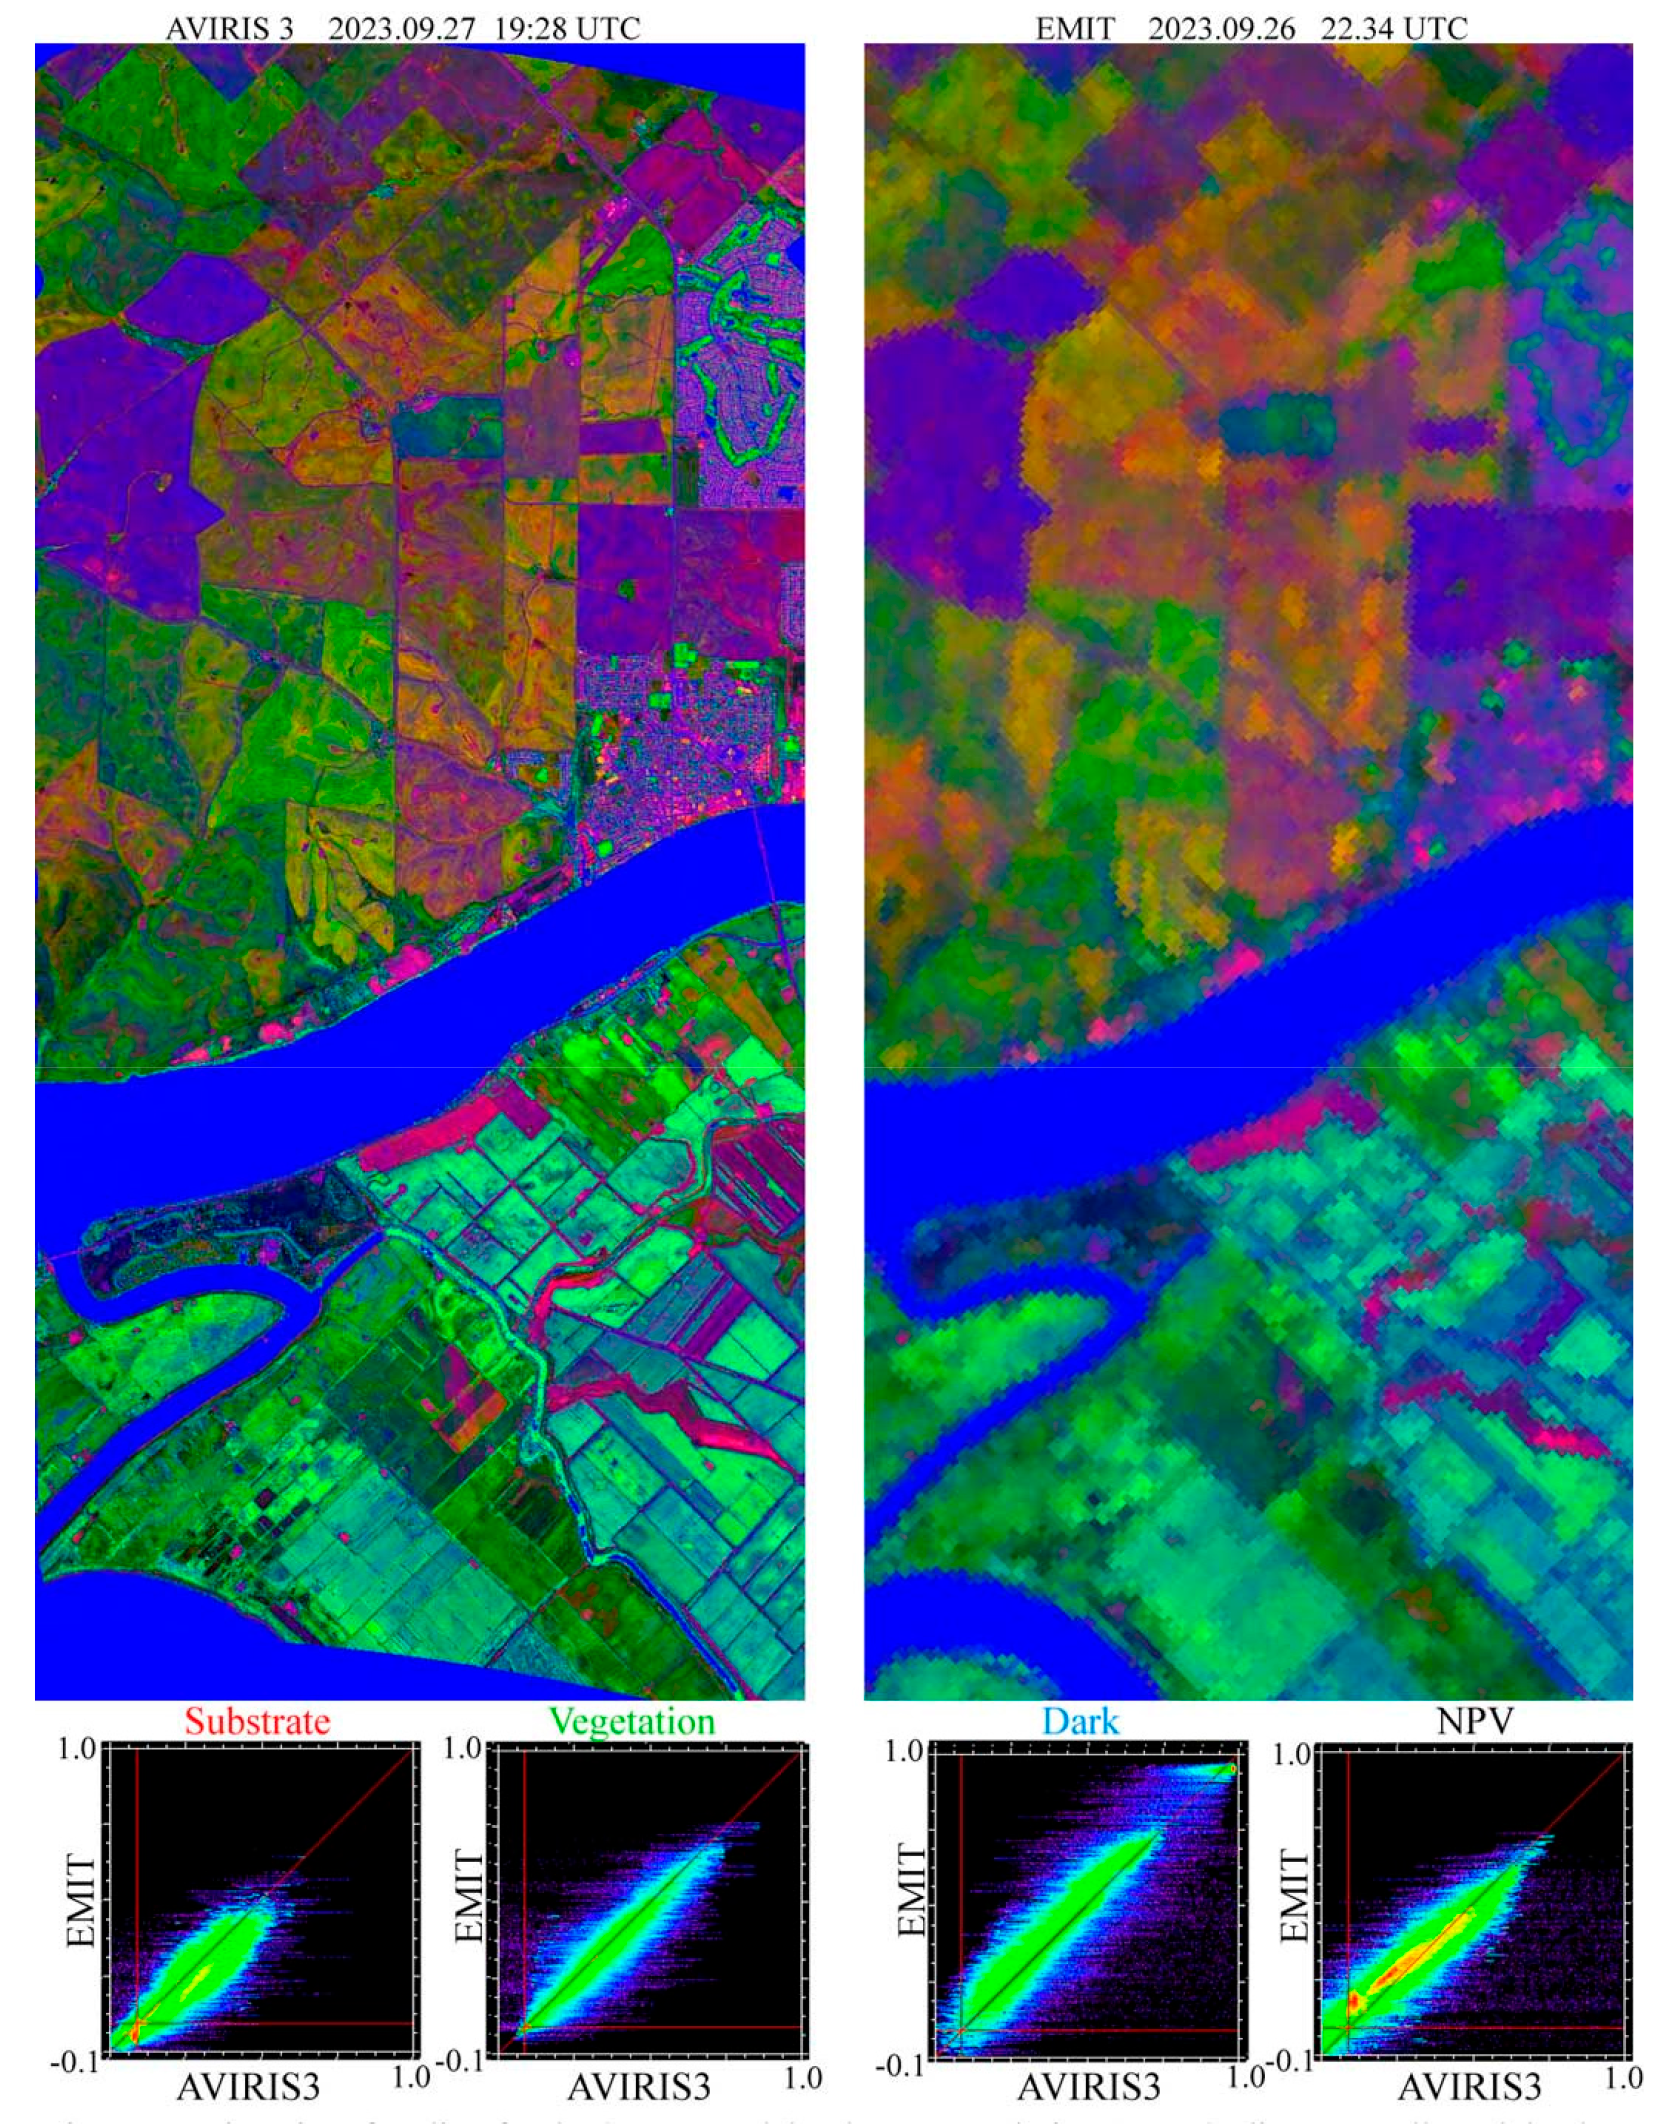
The linearity of mixing for both SVD and SVDN models is confirmed by comparing fraction estimate distributions for a 40 × 60 m resolution EMIT acquisition with near coincident 4.4 m resolution AVIRIS-3 acquisition from an agricultural region on the Sacramento delta in California. Despite the difference in spatial and spectral resolution, the spectral mixing spaces of the EMIT granule and AVIRIS-3 line are virtually identical and both mixture model inversions yield comparable RMS misfit distributions. Figure 11 shows SVD fraction composites for SVDN models using the same EMIT-derived endmember spectra for both instruments. Scaling is strongly linear across an order of magnitude difference in resolution for all fraction estimate distributions. The slight positive biases for the S, V and N fractions and slight negative bias of the D fractions of the AVIRIS spectra are consistent with its collection under higher solar elevation conditions compared to the EMIT acquisition. Much of the dispersion about the 1:1 lines is a result of significant identifiable orthographic displacements between the AVIRIS line and the EMIT granule.

4. Discussion

4.1. The Spectroscopic Mixing Space

The collection of 40 EMIT granules from a diversity of agricultural basins worldwide yields a low-order mixing space topology very similar to that obtained from much larger areas of Landsat, Sentinel 2 and MODIS imagery collections, as well as smaller areas of AVIRIS collections, used in previous studies. The most obvious differences are related to the exclusion of evaporites, submarine substrates (i.e., reefs) and the cryospheric continuum of snow/firn/ice—which all form distinct mixing continua not found in the majority of ice-free landscapes. In comparison to our earlier analysis of 20 early-release EMIT granules, this collection contains a much greater diversity of both soil and vegetation types and exposures. As a result, the structure of the plane of substrates is more clearly resolved. Notably, soil and sand mixing continua are clearly distinguished and an NPV apex emerges. The joint characterization of the mixing space, combining the UMAP and PC embeddings, shows distinct substrate and vegetation continua, topologically connected by NPV. This is physically consistent with NPV being a compositional intermediary between photosynthetic vegetation and soil. The joint characterization also reveals at least seven distinct mixing continua between sands and sandy soils. This is also consistent with the fact that sands are often mineralogically distinct as a result of source rock provenance and the sedimentological processes by which they are segregated from finer-grained sediments. One notable difference to the broadband mixing spaces of earlier studies is the prominent continuum of water body reflectances extending from the dark endmember. This is consistent with EMIT’s high signal-to-noise ratio and thus its ability to resolve more distinct reflectances in the visible spectrum, as well as the importance of spectral curvature for aqueous targets and the absence of evaporite and snow/firn/ice continua in this image compilation, which would otherwise compress the 3rd dimension of the PC space because of the very high reflectance amplitude of dry evaporites and snow.

4.2. The SVD Model—Why It Works

Identification of a pure soil endmember, distinct from sands, allows the new soil-based spectroscopic SVD model to better represent a wider diversity of landscapes. Because the sand mixing continuum forms one edge of the plane of substrates while the NPV continuum forms the opposite, the intermediary soil endmember better accommodates both non-sandy soils as well as more organic-rich soils nearer the NPV continuum. This more representative endmember therefore reduces the misfit for most of the plane of substrates, as well as for unmodeled NPV. In addition, the reduced amplitude of the new soil endmember (relative to sand) reduces the underestimation of soil fraction estimates obtained using a high amplitude sand endmember for all substrates. The slightly negative vegetation fractions are limited to low albedo sands in the Gobi desert (Huang He & Hexi). The slightly negative dark fractions are limited to high albedo sands in the Negev (Levant) and Anza-Borrego (Salton) deserts. Relative to earlier studies, the incorporation of more soil-rich and fewer sand-dominant landscapes in the EMIT mosaic reduces the variance partition of the plane of substrates from 5–6% to 2–3% of total mixing space variance, with a reduction of RMS misfit to < 0.03 for 91% of modeled spectra. A sand-based substrate endmember may sometimes be preferred for modeling some arid landscapes, but the new soil-based substrate endmember may better represent a wider variety of non-arid landscapes worldwide.
The primary reason why the planar triangular SVD model is so effective as a general model of land surface reflectance is related to the nearly planar triangular topology of the low-order PC mixing space itself. Without the high amplitude evaporite, reef and cryospheric continua dominating the 3rd dimension of the space, the plane of substrates itself represents only <3% of total variance. Using a single substrate endmember effectively neglects this off-plane variance. However, the near orthogonality (ρ < ±0.3) of the S, V and D endmembers stabilizes the model inversion without driving the SVD fractions out of [0, 1] plausibility range. This stability comes at the cost of slightly higher RMS misfit (compared to SVDN), but the near planar topology of the mixing space still allows for a remarkably low misfit overall. Particularly given the presence of high amplitude unmodeled sands and clouds in the EMIT mosaic.
The primary limitation of the SVD model remains its requisite projection of a 3D mixing space onto a 2D model plane. The new, more representative soil endmember partially resolves the misfit that results from the orthogonal plane of substrates; however, sandy and NPV-rich soils still lie outside the model. In addition, nonlinear mixing resulting from multiple scattering produces convexities in parts of the mixing space that cannot be accommodated by any linear mixture model. Nonetheless, it is remarkable that nonlinearities associated with soil moisture effects and volume scattering within vegetation canopies are so well represented as varying mixtures of the substrate and vegetation endmembers mixing with the dark endmember. While moisture absorption and partial canopy transmission are certainly not linear effects, modulation by the dark endmember seems to be an effective way to represent them at meter to kilometer scales of spectral mixing.

4.3. The SVDN Model—Why It Does Not Work

Extending the SVD model with an NPV endmember reduces its already small RMS misfit significantly in many landscapes. However, this reduction comes at the cost of a much larger percentage of spectra being represented with implausible fraction estimates outside the [0, 1] range. The primary reason for this destabilization of the model inversion is the combination of the near collinearity (ρ~0.9) of the NPV and substrate endmembers as well as the additional degree of freedom of the SVDN model relative to the SVD. This additional degree of freedom, combined with the near collinearity of the substrate and NPV endmembers, allows the inversion to exploit destructive interference in the form of negative fractions to minimize model misfit. The moderate collinearity (ρ~0.5) of the NPV and vegetation endmembers also likely contributes to the implausible fraction distributions of both SVDN and NVD models. The identification of the NPV mixing continuum certainly better characterizes the spectroscopic mixing space from a physical perspective, and the NPV endmember spectrum may be useful for applications where NPV is a prominent component of the mixing space, but the overall costs clearly outweigh the benefits of the SVDN model as a general, parsimonious representation for landscape reflectance.

4.4. Why Use Standardized Spectral Mixture Models?

By combining the benefits of application-specific spectral mixture models with standardized spectral indices, the SSMM offers consistency, simplicity, inclusivity and diversity. While the benefits of diversity are often overstated, or even taken as axiomatic, the ability of a single model for mixed spectral reflectance to represent a wide range of landscape components is nonetheless potentially valuable for many applications.
The existence of an SSMM for spectroscopic mixture modeling in no way precludes the use of application-specific mixture models with local or otherwise optimized spectral endmembers. Given the stability and negligible computational cost of the SVD model inversion, the SSMM can complement application-specific mixture models by allowing their resulting fraction distributions to be compared across space and time by projecting them onto the SVD basis. Mathematically, the standardized SVD model provides a parsimonious representation of both the global spectral mixing space for a wide range of ice-free landscapes, as well as for spectral libraries. One potential application for the spectroscopic SSMM could therefore be the ability to easily project a given spectral library onto a simple ternary space spanning the three most physically and spectrally distinct components of most terrestrial landscapes. As such, the spectroscopic SSMM could allow for direct comparisons of different spectral libraries in the form of ternary diagrams. Further, an SSMM rooted in high SNR spectroscopic data facilitates straightforward standardization and cross-calibration of models across several multispectral sensors, since sensor-specific EMs can be trivially computed via convolution for any arbitrary multispectral sensor for which a spectral response function is available.
The information captured by a standardized spectroscopic mixture model can also be understood in the context of the wavelength-explicit misfit of the model, the spectral mixture residual [3,4]. The estimation of EM abundances using spectral unmixing involves minimization of a cost function, which is often but not always the root-mean-square misfit between the actual observed reflectance spectrum and the spectrum generated by areas-weighted linear combination of EM reflectances. Important spectroscopic information can exist within this model misfit, for instance, absorption features which are not represented in the EM spectra. Viewed in this way, the mixture residual of a standardized spectroscopic mixture model has conceptual parallels to Continuum Removal (e.g., [26]). Evaluation and refinement of the standardized mixture model are thus important for understanding and improving the utility and generality of the spectral mixture residual in spaceborne imaging spectroscopy data.

4.5. Limitations and Future Work

The scaling analysis included in this study provides an important form of vicarious validation, indicating that the decameter resolution linear mixture model provides a reasonable approximation of spectrally distinct meter scale land cover components. However, it will be important to supplement this vicarious validation with in situ field validation taking into account factors like varying illumination geometry, soil moisture and roughness variations, canopy closure and leaf area index (e.g., [42,43]). The role of NPV spanning the substrate and vegetation mixing continua could also be the focus of a dedicated field validation campaign. Such field validations might be best constrained by collecting multitemporal observations of a seasonally variable validation site, perhaps with in situ monitors to provide more detailed context for spatiotemporal changes in atmospheric opacity, illumination geometry, vegetation phenology and soil moisture content.
The geographic coverage provided by the EMIT mission limits the availability of cloud-free imagery for the tropics. This is particularly true in Africa. It also precludes inclusion of high-latitude boreal environments. Based on earlier studies using more globally representative collections of broadband multispectral data, we do not expect the spectral mixing space to change significantly with extension to higher and lower latitudes, but we do acknowledge the potential for a more globally inclusive data compilation. Future studies will extend this analysis to a wider range of environments when global coverage from the NASA SBG mission becomes available after its anticipated 2028 launch.
5. Conclusions

The spectral dimensionality, topology and spectral endmembers of the spectral mixing space of a diverse mosaic of EMIT spectra all correspond strongly to those previously derived from larger collections of broadband imagery. The standardized spectral mixture model developed for broadband multispectral sensors is therefore applicable to the spectroscopic mixing space of the EMIT spectra. A new soil-based substrate endmember better accommodates the 2D plane of substrates than previous sand-based endmembers did. Extending the planar SVD mixture model to a tetrahedral SVDN model by addition of an NPV endmember reduces model misfit slightly, but does so at the expense of implausible fraction estimates beyond [0, 1]. However, the spectroscopic SVD model, using a more representative soil substrate endmember, achieves very small misfit < 0.03 for 91% of modeled spectra.

Author Contributions

Conceptualization, methodology, validation, formal analysis, investigation, data curation; C.S. and D.S.; writing—original draft preparation, C.S.; writing—review and editing, C.S. and D.S.; funding acquisition, D.S. and C.S. All authors have read and agreed to the published version of the manuscript.

Funding

The authors were funded by the NASA EMIT Science and Applications Team Program (Grant # 80NSSC24K0861). D.S. further gratefully acknowledges funding from the NASA FireSense airborne science program (Grant # 80NSSC24K0145), the NASA FireSense Implementation Team (Grant # 80NSSC24K1320), the USDA NIFA Sustainable Agroecosystems program (Grant #2022-67019-36397), the USDA AFRI Rapid Response to Extreme Weather Events Across Food and Agricultural Systems program (Grant #2023-68016-40683), the NASA Land-Cover/Land Use Change program (Grant #NNH21ZDA001N-LCLUC), the NASA Remote Sensing of Water Quality program (Grant #80NSSC22K0907), the NASA Applications-Oriented Augmentations for Research and Analysis Program (Grant #80NSSC23K1460), the NASA Commercial Smallsat Data Analysis Program (Grant #80NSSC24K0052), the California Climate Action Seed Award Program, and the NSF Signals in the Soil program (Award #2226649).

Data Availability Statement

All EMIT and AVIRIS data used are available from the portals given in the Data section. The standardized S, V, D and N spectral endmembers are available from the authors upon request.

Acknowledgments

We acknowledge the organizers and participants of the NASA JPL AVIRIS workshops for development, curation and dissemination of many of the concepts discussed in this study. We acknowledge Brother Tom for decades of elucidation of the importance of data and reason to the development of mental models of reality.

Conflicts of Interest

The authors declare no conflicts of interest.

Appendix A

Granule IDs for the level 2A reflectance products used in this analysis are given in Table A1. Date and time of acquisition are encoded in each granule ID. All granules and associated metadata are available at no cost from
Table A1. Granule ID list.
Granule NameGranule ID
San JoaquinEMIT_L2A_RFL_001_20230730T214131_2321114_002
San JoaquinEMIT_L2A_RFL_001_20230818T210031_2323014_003
San JoaquinEMIT_L2A_RFL_001_20230818T210043_2323014_004
San JoaquinEMIT_L2A_RFL_001_20230818T210055_2323014_005
San JoaquinEMIT_L2A_RFL_001_20230818T210107_2323014_006
SacramentoEMIT_L2A_RFL_001_20231015T215023_2328814_003
SacramentoEMIT_L2A_RFL_001_20231015T215035_2328814_004
CoastEMIT_L2A_RFL_001_20230730T214119_2321114_001
CoastEMIT_L2A_RFL_001_20230730T214131_2321114_002
SaltonEMIT_L2A_RFL_001_20230406T181545_2309612_004
UruguayEMIT_L2A_RFL_001_20230113T112633_2301307_002
Cape EastEMIT_L2A_RFL_001_20230309T082246_2306805_015
Huang HeEMIT_L2A_RFL_001_20230329T073242_2308805_021
Po PlainEMIT_L2A_RFL_001_20230611T141838_2316209_007
Hexi CorridorEMIT_L2A_RFL_001_20230612T022526_2316302_006
Dakota BadlandsEMIT_L2A_RFL_001_20230815T201231_2322713_002
LazioEMIT_L2A_RFL_001_20230822T100609_2323407_002
Mato GrossoEMIT_L2A_RFL_001_20230822T180914_2323412_015
LevantEMIT_L2A_RFL_001_20230823T092349_2323506_005
PermianEMIT_L2A_RFL_001_20231008T161139_2328111_017
Yaqui EMIT_L2A_RFL_001_20231030T161901_2330311_007
RondoniaEMIT_L2A_RFL_001_20231106T123222_2331008_002
Cape WestEMIT_L2A_RFL_001_20231108T075946_2331205_007
Nile DeltaEMIT_L2A_RFL_001_20231126T114157_2333008_038
Khorat PlateauEMIT_L2A_RFL_001_20231228T035308_2336203_008
JavaEMIT_L2A_RFL_001_20240104T013445_2400401_003
Maipo EMIT_L2A_RFL_001_20240110T203435_2401013_004
Mato GrossoEMIT_L2A_RFL_001_20240126T141740_2402609_047
MississippiEMIT_L2A_RFL_001_20240218T183646_2404912_018
Minas GeraisEMIT_L2A_RFL_001_20240301T140747_2406109_010
Mato GrossoEMIT_L2A_RFL_001_20240304T131943_2406409_014
MendozaEMIT_L2A_RFL_001_20240307T140838_2406709_008
VictoriaEMIT_L2A_RFL_001_20240320T024911_2408001_007
S.W.AustraliaEMIT_L2A_RFL_001_20240327T020129_2408701_003
S.W.AustraliaEMIT_L2A_RFL_001_20240327T020141_2408701_004
Fergana ValleyEMIT_L2A_RFL_001_20230221T063036_2305204_018
Swat ValleyEMIT_L2A_RFL_001_20230609T044704_2316003_020
ChacoEMIT_L2A_RFL_001_20240327T142850_2408709_051
Wei PlainEMIT_L2A_RFL_001_20240328T061551_2408804_005
OaxacaEMIT_L2A_RFL_001_20240401T165645_2409211_004

Appendix B. AVIRIS and EMIT Fraction Spaces

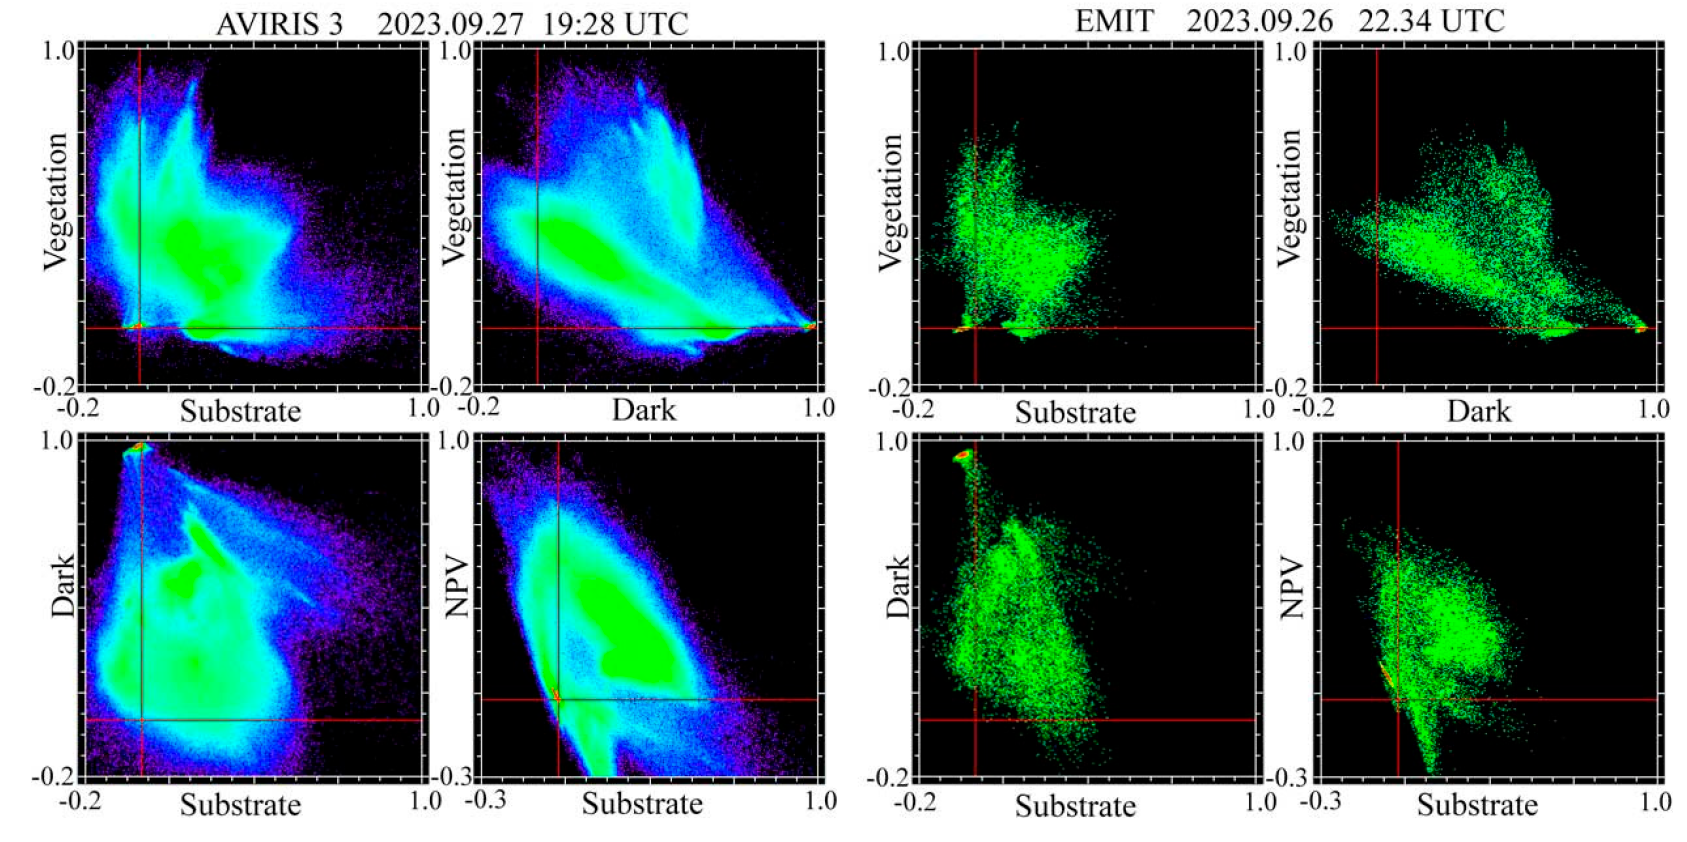
SVDN fraction spaces for the Sacramento Delta AVIRIS-3 and EMIT acquisitions are shown in Figure A1.
Figure A1. SVDN fraction spaces for the AVIRIS-3 and EMIT acquisitions compared in Figure 11. As expected, the 4.4 m AVIRIS pixel fractions span a wider range than the more spectrally mixed EMIT pixels. As with the EMIT mosaic, S, V and D fractions are well-bounded while NPV shows a significant percentage of negative fractions.
Remotesensing 16 03768 g0a1

References

  1. Settle, J.J.; Drake, N.A. Linear Mixing and the Estimation of Ground Cover Proportions. Int. J. Remote Sens. 1993, 14, 1159–1177. [Google Scholar] [CrossRef]
  2. Boardman, J.W. Automating Spectral Unmixing of AVIRIS Data Using Convex Geometry Concepts; JPL: Pasadena, CA, USA, 1993; Volume 1, pp. 11–14. [Google Scholar]
  3. Gillespie, A.; Smith, M.; Adams, J.; Willis, S.; Fischer, A.; Sabol, D. Interpretation of Residual Images: Spectral Mixture Analysis of AVIRIS Images, Owens Valley, California. In Proceedings of the Second Airborne Visible/Infrared Imaging Spectrometer (AVIRIS) Workshop; NASA: Pasadena, CA, USA, 1990; pp. 243–270. [Google Scholar]
  4. Sousa, D.; Brodrick, P.G.; Cawse-Nicholson, K.; Fisher, J.B.; Pavlick, R.; Small, C.; Thompson, D.R. The Spectral Mixture Residual: A Source of Low-Variance Information to Enhance the Explainability and Accuracy of Surface Biology and Geology Retrievals. J. Geophys. Res. Biogeosciences 2022, 127, e2021JG006672. [Google Scholar] [CrossRef]
  5. Adams, J.B.; Gillespie, A.R. Remote Sensing of Landscapes with Spectral Images: A Physical Modeling Approach; Cambridge University Press: Cambridge, UK, 2006. [Google Scholar]
  6. Small, C. The Landsat ETM+ Spectral Mixing Space. Remote Sens. Environ. 2004, 93, 1–17. [Google Scholar] [CrossRef]
  7. Small, C.; Milesi, C. Multi-Scale Standardized Spectral Mixture Models. Remote Sens. Environ. 2013, 136, 442–454. [Google Scholar] [CrossRef]
  8. Sousa, D.; Small, C. Global Cross-Calibration of Landsat Spectral Mixture Models. Remote Sens. Environ. 2017, 192, 139–149. [Google Scholar] [CrossRef]
  9. Sousa, D.; Small, C. Globally Standardized MODIS Spectral Mixture Models. Remote Sens. Lett. 2019, 10, 1018–1027. [Google Scholar] [CrossRef]
  10. Small, C.; Sousa, D. The Sentinel 2 MSI Spectral Mixing Space. Remote Sens. 2022, 14, 5748. [Google Scholar] [CrossRef]
  11. Sousa, D.; Small, C. Joint Characterization of Sentinel-2 Reflectance: Insights from Manifold Learning. Remote Sens. 2022, 14, 5688. [Google Scholar] [CrossRef]
  12. Small, C.; Sousa, D. Joint Characterization of the Cryospheric Spectral Feature Space. Front. Remote Sens. 2021, 2, 793228. [Google Scholar] [CrossRef]
  13. Sousa, D.; Small, C. Which Vegetation Index? Benchmarking Multispectral Metrics to Hyperspectral Mixture Models in Diverse Cropland. Remote Sens. 2023, 15, 971. [Google Scholar] [CrossRef]
  14. Adams, J.B. Imaging Spectroscopy: Interpretation Based on Spectral Mixture Analysis. Remote Geochem. Anal. Elem. Mineral. Compos. 1993, 145–166. [Google Scholar]
  15. Boardman, J.W.; Kruse, F.A. Automated Spectral Analysis: A Geologic Example Using AVIRIS Data, North Grapevine Mountains, Nevada. In Proceedings of the Tenth Thematic Conference on Geologic Remote Sensing, Environmental Research Institute of Michigan, San Antonio, TX, USA, 9–12 May 1994; pp. 1407–1418. [Google Scholar]
  16. Roberts, D.A.; Smith, M.O.; Adams, J.B. Green Vegetation, Nonphotosynthetic Vegetation, and Soils in AVIRIS Data. Remote Sens. Environ. 1993, 44, 255–269. [Google Scholar] [CrossRef]
  17. Roberts, D.A.; Gardner, M.E.; Church, R.; Ustin, S.L.; Green, R.O. Optimum Strategies for Mapping Vegetation Using Multiple-Endmember Spectral Mixture Models; SPIE: Philadelphia, PA, USA, 1997; Volume 3118, pp. 108–119. [Google Scholar]
  18. Roberts, D.; Green, R.; Adams, J. Temporal and Spatial Patterns in Vegetation and Atmospheric Properties from AVIRIS. Remote Sens. Environ. 1997, 62, 223–240. [Google Scholar] [CrossRef]
  19. Sousa, D.; Small, C. Topological Generality and Spectral Dimensionality in the Earth Mineral Dust Source Investigation (EMIT) Using Joint Characterization and the Spectral Mixture Residual. Remote Sens. 2023, 15, 2295. [Google Scholar] [CrossRef]
  20. McInnes, L.; Healy, J.; Melville, J. UMAP: Uniform Manifold Approximation and Projection for Dimension Reduction. arXiv 2020, arXiv:1802.03426. [Google Scholar]
  21. Boardman, J.W. Leveraging the High Dimensionality of AVIRIS Data for Improved Sub-Pixel Target Unmixing and Rejection of False Positives: Mixture Tuned Matched Filtering; NASA Jet Propulsion Laboratory: Greenbelt, MD, USA, 1998; Volume 97, pp. 55–56. [Google Scholar]
  22. Thompson, D.R.; Boardman, J.W.; Eastwood, M.L.; Green, R.O. A Large Airborne Survey of Earth’s Visible-Infrared Spectral Dimensionality. Opt. Express 2017, 25, 9186–9195. [Google Scholar] [CrossRef]
  23. Sousa, D.; Small, C. Multisensor Analysis of Spectral Dimensionality and Soil Diversity in the Great Central Valley of California. Sensors 2018, 18, 583. [Google Scholar] [CrossRef]
  24. Asner, G.P. Biophysical and Biochemical Sources of Variability in Canopy Reflectance. Remote Sens. Environ. 1998, 64, 234–253. [Google Scholar] [CrossRef]
  25. Asner, G.P.; Heidebrecht, K.B. Spectral Unmixing of Vegetation, Soil and Dry Carbon Cover in Arid Regions: Comparing Multispectral and Hyperspectral Observations. Int. J. Remote Sens. 2002, 23, 3939–3958. [Google Scholar] [CrossRef]
  26. Clark, R.N.; King, T.V. Automatic Continuum Analysis of Reflectance Spectra. In Proceedings of the JPL Proceedings of the 3rd Airborne Imaging Spectrometer Data Analysis Workshop; NASA NTRS N88-13770, Document ID 19880004388; NASA: Pasadena, CA, USA, 1987; pp. 138–142. Available online: https://ntrs.nasa.gov/citations/19880004388 (accessed on 6 October 2024).
  27. Green, R.O.; Thompson, D.R. EMIT Team NASA’s Earth Surface Mineral Dust Source Investigation: An Earth Venture Imaging Spectrometer Science Mission. In Proceedings of the 2021 IEEE International Geoscience and Remote Sensing Symposium IGARSS, Brussels, Belgium, 11 July 2021; pp. 119–122. [Google Scholar]
  28. Thompson, D.R.; Green, R.O.; Bradley, C.; Brodrick, P.G.; Mahowald, N.; Dor, E.B.; Bennett, M.; Bernas, M.; Carmon, N.; Chadwick, K.D. On-Orbit Calibration and Performance of the EMIT Imaging Spectrometer. Remote Sens. Environ. 2024, 303, 113986. [Google Scholar] [CrossRef]
  29. Bradley, C.L.; Thingvold, E.; Moore, L.B.; Haag, J.M.; Raouf, N.A.; Mouroulis, P.; Green, R.O. Optical Design of the Earth Surface Mineral Dust Source Investigation (EMIT) Imaging Spectrometer; SPIE: Bellingham, WA, USA, 2020; Volume 11504, p. 1150402. [Google Scholar]
  30. LP DAAC—New NASA Mission EMIT Launched to the International Space Station. Available online: https://lpdaac.usgs.gov/news/new-nasa-mission-emit-launched-to-the-international-space-station/ (accessed on 6 October 2024).
  31. Green, R. EMIT L2A Estimated Surface Reflectance and Uncertainty and Masks 60 m V001 [Data set]. NASA EOSDIS Land Processes Distributed Active Archive Center. 2022. Available online: https://lpdaac.usgs.gov/products/emitl2arflv001/ (accessed on 6 October 2024). [CrossRef]
  32. Thompson, D.R.; Brodrick, P.G.; Green, R.O.; Kalashnikova, O.; Lundeen, S.; Okin, G.; Olson-Duvall, W.; Painter, T. EMIT L2A Algorithm: Surface Reflectance and Scene Content Masks—Theoretical Basis; Earth Mineral dust source InvesTigation (EMIT); Jet Propulsion Laboratory, California Institute of Technology: Pasadena, CA, USA, 2020; p. 23.
  33. Eckart, C.; Young, G. The Approximation of One Matrix by Another of Lower Rank. Psychometrika 1936, 1, 211–218. [Google Scholar] [CrossRef]
  34. Boardman, J.W.; Green, R.O. Exploring the Spectral Variability of the Earth as Measured by AVIRIS in 1999; Jet Propulsion Laboratory: Pasadena, CA, USA, 2000. [Google Scholar]
  35. Sousa, D.; Small, C. Joint Characterization of Multiscale Information in High Dimensional Data. Adv. Artif. Intell. Mach. Learn. 2021, 1, 196–212. [Google Scholar] [CrossRef]
  36. Sousa, F.J.; Sousa, D.J. Hyperspectral Reconnaissance: Joint Characterization of the Spectral Mixture Residual Delineates Geologic Unit Boundaries in the White Mountains, CA. Remote Sens. 2022, 14, 4914. [Google Scholar] [CrossRef]
  37. Sousa, D.; Small, C. Joint Characterization of Spatiotemporal Data Manifolds. Front. Remote Sens. 2022, 3, 760650. [Google Scholar] [CrossRef]
  38. Price, J.; Sousa, D.; Sousa, F.J. Effect of Spatial and Spectral Scaling on Joint Characterization of the Spectral Mixture Residual: Comparative Analysis of AVIRIS and WorldView-3 SWIR for Geologic Mapping in Anza-Borrego Desert State Park. Sensors 2023, 23, 6742. [Google Scholar] [CrossRef]
  39. Adams, J.B.; Smith, M.O.; Johnson, P.E. Spectral Mixture Modeling: A New Analysis of Rock and Soil Types at the Viking Lander 1 Site. J. Geophys. Res. Solid Earth 1986, 91, 8098–8112. [Google Scholar] [CrossRef]
  40. Smith, M.O.; Ustin, S.L.; Adams, J.B.; Gillespie, A.R. Vegetation in Deserts: I. A Regional Measure of Abundance from Multispectral Images. Remote Sens. Environ. 1990, 31, 1–26. [Google Scholar] [CrossRef]
  41. Small, C.; Lu, J.W. Estimation and Vicarious Validation of Urban Vegetation Abundance by Spectral Mixture Analysis. Remote Sens. Environ. 2006, 100, 441–456. [Google Scholar] [CrossRef]
  42. Badola, A.; Panda, S.K.; Thompson, D.R.; Roberts, D.A.; Waigl, C.F.; Bhatt, U.S. Estimation and Validation of Sub-Pixel Needleleaf Cover Fraction in the Boreal Forest of Alaska to Aid Fire Management. Remote Sens. 2023, 15, 2484. [Google Scholar] [CrossRef]
  43. Ochoa, F.; Brodrick, P.G.; Okin, G.S.; Clark, R.N.; Thompson, D.R.; Green, R.O.; Ochoa-Gonzalez, J.A.; Gillespie, M.N.; Meyer, T. Field validation of fractional cover and mineral retrieval estimates from the EMIT L2 Spectral Unmixing Algorithms. In American Geophysical Union Fall Meeting 2023; American Geophysical Union: San Francisco, CA, USA, 2023. [Google Scholar]
Figure 1. Index map for EMIT sample sites. Each of the 33 agricultural sites was chosen on the basis of climate, biome, geologic substrate and cropping stage to maximize diversity of vegetation cover density and soil exposure.
Remotesensing 16 03768 g001
Figure 2. (A) EMIT mosaic of sites used in this study. Common linear stretch [0, 0.8] for all granules. (B). EMIT mosaic of sites used in this study. Identical to Figure 2A, but with a scene-specific 2% linear stretch for each granule.
Remotesensing 16 03768 g002aRemotesensing 16 03768 g002b
Figure 3. Spectral mixing space formed by low-order principal components of the EMIT mosaic (Figure 2). Orthogonal projections of PCs 1–3 clearly show prominent apexes corresponding to substrate, vegetation and dark reflectances. The outward convexity in PC 3 reveals an additional non-photosynthetic (N) vegetation endmember. Substrate endmember S corresponds to sandy soils, but pure sands have distinct reflectances and form separate mixing trends with the dark endmember. A linear mixture model using the S, V, D and N endmembers projects the mixing space into a tetrahedron bounded by a convex hull of 6 linear mixing trends, excluding sands, cloud and turbid water.
Remotesensing 16 03768 g003
Figure 4. Spectral mixing space and joint characterization for the EMIT mosaic. A 3D embedding derived from Uniform Manifold Approximation and Projection (UMAP) reveals two distinct continua for substrates and vegetation surrounded by a constellation of distinct sand and water body reflectances (top). The joint characterization using UMAP and PC projections combines the global structure of the orthogonal PCs with the local structure preserved by UMAP (bottom). Distinct soil and NPV continua increase in reflectance amplitude with PC distinguishing the substrates (PC1) and vegetation (PC2). NPV spans both continua. A single continuum spanning multiple sample sites splits to yield general soil (S1) and NPV (N1) endmembers while many other site-specific soil continua yield endmembers corresponding to spectrally distinct sands shown in Figure 5. In contrast to the distinct soil and sand endmembers, all vegetation forms a single continuum spanned by photosynthetic and non-photosynthetic vegetation endmembers.
Remotesensing 16 03768 g004
Figure 5. Reflectance spectra from Soil and NPV continua in Figure 4. Two distinct NPV continua (N3 and N4) converge to a single continuum that branches (N2) from the soil continuum to a single higher amplitude NPV endmember (N1). The soil continuum extends from the branch point to a single higher amplitude soil endmember (S1). In parallel to this main soil continuum, seven different soil continua (S3–S9) extend to spectrally distinct sand endmembers. Isolated clusters correspond to geographically distinct pure sands in the Negev desert (S2, S10) and Anza-Borrego desert (S11).
Remotesensing 16 03768 g005
Figure 6. (A). EMIT SVD composite from SVDN model. Common linear stretch [0, 1] for all. (B). EMIT NPV + misfit composite from SVDN model. Common linear stretch [0, 1] for NPV and [0, 0.05] for misfit.
Remotesensing 16 03768 g006aRemotesensing 16 03768 g006b
Figure 7. Endmember fraction spaces for the SVD, SVDN and NVD models. All models are subsets of the same SVDN endmembers, differing only in the inclusion of the S and N endmembers. Comparing the left and center columns, it is apparent that including the N endmember increases the negative fractions for all endmembers. For the SVDN model, RMS misfit diminishes with increasing NPV fraction, but is greatest for spectra with negative NPV fractions. Note much wider ranges for all fraction distributions for the NVD model.
Remotesensing 16 03768 g007
Figure 8. SVD versus SVDN model comparison. The Substrate fraction is most sensitive to the addition of the NPV endmember. However, the Vegetation fraction is quite insensitive and the Dark fraction is most sensitive at low fractions. As expected, the SVD model has somewhat higher misfit, although still relatively low at well under 0.04 for the vast majority of spectra in the mosaic. The negligible number of higher misfit spectra are associated with clouds and high albedo sands, which are not represented in either model. The inset covariability matric shows EM correlations on/above the diagonal and Mutual Information (MI) scores below. Note high correlation and MI for S and N.
Remotesensing 16 03768 g008
Figure 9. Raw and modeled EMIT spectra with SVD vs. SVDN model misfit space. The NPV-dominant spectra are modeled more accurately with the SVDN than the SVD model. Sands (1,2,3) have higher misfits for both models because neither has a sand endmember. SVD and SVDN models have 90% and 95% (respectively) of spectra with less than 0.03 misfit. Note expanded reflectance scale on example 7.
Remotesensing 16 03768 g009
Figure 10. Endmember sensitivity analysis. Three peripheral spectral endmembers (upper left) for S, V and D yield 33 = 27 SVD model permutations. Pairwise combinations of each resulting endmember fraction distribution for the EMIT mosaic yield (272) = 351 model inversion correlations (inset) for each SVD endmember. S and V fraction distribution correlations are > 0.99 but D fractions go as low as 0.98 because differences among S and V endmembers are amplified in D fractions. Standard deviations among model pairs are < 0.05 for each fraction for 99.8% of all 63,692,800 spectra.
Remotesensing 16 03768 g010
Figure 11. Linearity of scaling for the SVDN model. The 4 m resolution AVIRIS-3 line was collected the day after the 47 × 60 m resolution EMIT scene. All fractions scale linearly over the order of magnitude difference in resolution. Dispersion is greater for Substrate and NPV fractions. The slight bias of the fractions relative to 1:1 is consistent with the lower solar elevation at time of EMIT collection. Some of the dispersion about the 1:1 lines results from orthographic displacements between images.
Remotesensing 16 03768 g011
Disclaimer/Publisher’s Note: The statements, opinions and data contained in all publications are solely those of the individual author(s) and contributor(s) and not of MDPI and/or the editor(s). MDPI and/or the editor(s) disclaim responsibility for any injury to people or property resulting from any ideas, methods, instructions or products referred to in the content.