Abstract
This paper examines the long-term morphological evolution of the Bevano River sand spit (Ravenna, Italy) after an artificial intervention carried out in 2006 that artificially relocated the river mouth to improve the hydraulic efficiency, preventing flooding and reconstructing a local dune system. Using multitemporal Lidar data (2004–2019), combined with orthophotos and a storm dataset, this study analysed shoreline changes and morphological variations, highlighting the role of overwash processes in sediment transfer from the dunes to back-barrier areas. Based on the analysis, a set of washover fans was identified that began to form after a storm event in 2008 and accreted until 2015. These fans, which later coalesced into terraces and were colonised by vegetation, became stable after 2015. Despite an initial low resilience, due to insufficient nourishment and slow vegetation development, the barrier system eventually stabilised, with dunes growing higher and forming a continuous dune crest. The study illustrates the role of surge levels, waves, and low initial elevation in triggering and shaping overwash processes.
1. Introduction
The importance of finding an equilibrium between human needs and ecosystem development is becoming indispensable. The balance between natural and anthropogenic components has been the focus of the last few decades of environmental research, especially since the exploitation of natural resources, which aims to achieve short-term benefits, is not sustainable [1,2]. Restoration projects and Building-with-Nature strategies are becoming a common theme for a large variety of environmental contexts [3]. In the case of the coastal environment, several case studies from highly different regions worldwide demonstrate how coastal dune restoration has been approached globally, providing examples and insights into the successes and challenges faced by restoration efforts in different environmental and socio-economic conditions [4]. The implementation of dune fencing, re-vegetation, and sediment trapping are typical techniques used to encourage natural dune formation, stabilise the shifting sand, and rebuild the foredune structure over time (e.g., [5,6,7]). Common techniques used in dune restoration projects are based on sand replenishment and dune rebuilding, revegetation, and monitoring (e.g., [8,9,10]). Large nourishments are a recognised and efficient methodology for beach restoration [1,11]. One example of a key milestone in the Building-with-Nature philosophy was the construction of the first “Sand Engine” in the Netherlands in 2011 [12]. This large-scale sand replenishment (21.5 million cubic metres) carried out in South Holland, designed for a 20-year lifespan, produced extremely positive results [13,14] and led to the reassessment of future modelling and monitoring efforts on such large-scale nourishment projects [15,16].
The issues related to climate change, such as sea-level rise (SLR) and increasing coastal erosion, have sparked growing interest in understanding the potential of Nature-based Solutions (NbS) to enhance resilience along sandy coastlines, globally recognised and highly valued for their natural and cultural significance and economic importance to coastal communities [17,18]. Beaches, dunes, barrier islands, spits and other coastal landforms act as natural barriers against SLR, erosion, and storms, helping to protect anthropogenic infrastructure [19,20] and natural ecosystems. However, these systems are highly complex, and their evolution depends on a wide range of bio-geomorphological and marine processes that need to be properly integrated.
In the case of coastal barriers, the interaction between meteo-marine processes and morphological characteristics of the system defines the shape of the nearshore and beach environment and their migration (e.g., [21,22]). In these coastal systems, overwash processes may occur when the surge level, combined with wave runup, exceeds the dune crest height. This process usually occurs on low-lying coasts where the energy of storms is sufficient to generate waves able to wash over the barrier and transport sediments on the back-dune areas, leading to the formation of overwash deposits, known as washover fans. The number and shape of washover deposits are influenced by several factors, including the relative heights of the beach crest, water level, and wave height, as well as the storm’s duration [23,24,25,26]. Furthermore, the morphology of the back-dune areas, the presence of vegetation, and the strength and direction of the wind all contribute to determining the extent and characteristics of the washover. On natural coasts with sufficient back-barrier accommodation space, overwash and wind sediment transport influence the migration of barrier islands and their response to extreme wave events and sea-level rise [27,28,29,30]. Overwash can be a hazard in areas where the barrier and back-barrier are occupied by human activities and assets. The erosion of the beach and dunes can lead to an increased vulnerability to storms, whereas washover formation and dune/barrier crest migration can damage coastal property and infrastructure. However, preventing overwash processes may result in increased beach erosion [23,28]. Sand that is not transported inland by storm waves because of the presence of artificial protection structures is brought offshore, causing a net-negative sediment budget.
In high energy systems (e.g., oceanic barrier islands), although catastrophic events like hurricanes can have a large impact, recovery of the systems is proven to take place on a multidecadal scale [30]. On oceanic beaches, once inundation or obliteration of the dunes takes place, the barrier is flooded repeatedly for all the high spring tides following the storm. The recovery is rapid but then it slows down until the dunes recover to their previous elevation. Studies on North American Atlantic barriers [31] proved that they were resistant to overwash and washover deposition for 220 years prior to Hurricane Irene in 2011. During the first year after establishment, the washover volume and area increased 1595% and 197%, respectively, due to a monthly occurrence of overwashing. Most of the washover accretion resulted from the site morphology having a low resistance to overwash, as opposed to being directly impacted by major storms. The previous authors also recognise that the natural evolution of the washover fan is to eventually merge into a composite morphology. Composite washover deposits are not uncommon; Rodriguez et al. (2020) [31] mention their existence along the coasts of Denmark, Australia, and the USA.
Two main types of overwash regimes are found in the literature: (i) runup overwash, generally caused by high wave runup, and (ii) inundation overwash, when the mean water level exceeds the maximum dune elevation [32,33,34]. Based on Donnelly et al. (2006) [23], the behaviour of the first type of overwash can be classified following the equation ΔR = R + S − dc, where R is the relative wave runup height, S is the storm surge height, and dc is the elevation of the dune crest compared to the mean sea level. Sallenger (2000) [33] proposed a methodology to evaluate the influence of storm events on coastal systems/barrier islands characterised by the presence of dune ridges. Specifically, the author provided an impact classification that relates the runup, swash elevations and the water level, including surge, to the elevation of the dune crest and foot. The author identified four regimes, from a lower to higher impact: (i) swash regime (no impact); (ii) collision regime (dune front erosion); (iii) overwash regime (dune overwash); (iv) inundation regime (dune obliteration and inundation of the rear part of the beach). Several restoration projects of dune systems and associated studies have been carried out on the northern Adriatic Coast (e.g., [35,36,37,38,39,40]). However, there is a lack of information regarding washover formation processes, with only a few specific studies that have focused on this issue (e.g., [41,42]).
Monitoring soft engineering projects like nourishment and dune reconstruction using ground data collection is time-consuming, expensive and is rarely performed over long time scales. While satellite datasets collected over tens of years are now available (e.g., [43]), and UAV surveys provide high-resolution datasets at a very local scale (e.g., [44,45,46,47,48]), the use of airborne Lidar remains the best compromise between satisfactory coverage at a spatial and temporal scale. However, until only very recently, the payload could only be carried by manned vehicles like aeroplanes and helicopters. The most recent development in airborne Lidar surveys is the application using UAV (e.g., [49]).
This study focuses on the long-term evolution (i.e., >10 years) of the mouth of the Bevano River, the river’s sand spit (Ravenna, Italy, Figure 1), and the formation and evolution of washover fans that developed after an artificial intervention in 2006 that modified the location of the river outlet.
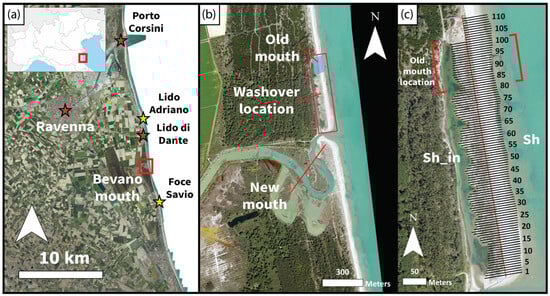
Figure 1.
(a) Location of the Bevano River mouth in the Emilia-Romagna Region (Italy). The yellow stars indicate the location of the nearest points where Pranavam Ayyappan Pillai et al. (2022) [50] extracted the wind regime (see Figure 2 below). (b) The study area is located on the northern side of the current Bevano mouth (red rectangle). (c) The analyses were performed along 111 transects that cover an area characterised by washover fans which developed after the deviation of the river mouth in 2006. Sh_in represents the shoreline identified on the westward side of the barrier, while Sh represents the shoreline on the seaward side (on the east). Background images: AGEA and RER 2023/24.
Afterwards, washover fans developed, leading to the shoreward migration of these deposits and modification of dune crest elevation and position. The shorelines on the seaward side (Sh hereafter), on the shoreward side (internal shoreline, Sh_in), the dune crest (DC) and foot (DF) position, the beach slope, and the volumetric changes were evaluated to describe the system’s evolution and the drivers of overwash processes. The changes were related to the magnitude of the storms that occurred in the analysed period, applying the Sallenger (2000) [33] impact classification.
2. Study Area
2.1. Coastline Setting
The Emilia-Romagna coastline is in Northern Italy, facing the Adriatic Sea. It is a microtidal, low-energy coastline that is generally highly developed for urban use, with the exception of a few areas with dunes in the Ferrara and Ravenna Provinces (Figure 1a). The region is dominated by three main wind directions: NNE to E (locally known as Bora), ESE to SSE (locally known as Sirocco), and NW (locally known as Maestrale). Winds from N, NE, and SSE blow with similar magnitudes. Bora winds, coming from a shorter fetch, can reach velocities up to 18 m/s, while Sirocco winds, from a longer fetch, rarely exceed 16 m/s. Given the different orientation of the coast prevailing wind directions vary [51]. Through the analysis of the wind velocities and directions measured at the permanent stations of Arpae in Marina di Ravenna (located 10 km northward of the study site) in the period 2001–2005 [51], Corbau et al. (2015) [52] reported that in the central part of the regional coastline, the predominant wind directions are from east and west; specifically, the most frequent winds in autumn and winter are from the west, while winds exceeding 20 m s−1 blow from the east. The rates of potential aeolian transport [53] throughout the coast are generally low, averaging around 0.10 g/cm s−1. The highest values were recorded in the northern part of the regional coastline (Ferrara province) (0.15 g/cm s−1) and at Marina di Ravenna (0.14 g/cm s−1).
Pranavam Ayyappan Pillai et al. (2022) [50] analysed winds from a longer period (2010–2019) using the European Centre for Medium-Range Weather Forecasts reanalysis (ECMWF) (https://doi.org/10.5281/zenodo.6360348, accessed on 20 January 2025) and compared it with extended records of the stations of ISPRA-Porto Corsini (44°29′31.5″N 12°16′58.6″E), ARPAE-Porto Garibaldi (44°40′36.0″N 12°14′58.0″E), and ARPAE-Cesenatico Port (44°12′52.5″N 12°28′33.1″E). The nearest points where the wind characteristics were extracted from the reanalysis are located in Lido Adriano and Foce Savio (Figure 2). They found significant seasonal and spatial wind variability, while good uniformity was found on an annual basis for mean wind speeds. Annual average winds predominantly come from the east–northeast, with speeds ranging from 0.5 to 2 m s−1 and a standard deviation of 1.6–3 m s−1. Seasonal variations show the highest wind speeds in winter (2.9 m s−1), moderate speeds in autumn (2.4 m s−1), and the lowest in spring and summer (1.5–1.8 m/s). In winter and spring, winds are typically easterly (Bora), while summer brings southeasterly winds (Sirocco). In the central part of the region, where the Bevano area is located, the highest wind speeds occur with average values of about 3–4 m s−1, approaching with an angle in the range 45–90° (Pranavam Ayyappan Pillai et al., 2022 [50]; Figure 2). Considering the exposure to the effective fetch for waves, this explains the dominant marine storm direction (see Section 3.3).
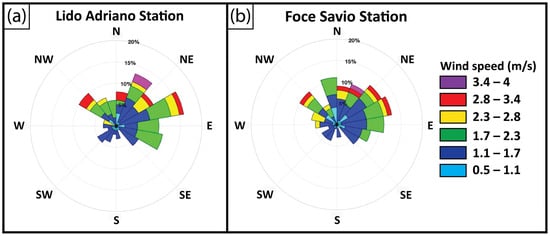
Figure 2.
Wind speed extracted using the ECMWF reanalysis (https://doi.org/10.5281/zenodo.6360348, accessed on 20 January 2025) in (a) Lido di Adriano and (b) the Savio River mouth (Foce Savio) between 2010 and 2019 (modified from Pranavam Ayyappan Pillai et al., 2022 [50]). The position of the grid points can be found in Figure 1a.
The area is microtidal (neap range 30–40 cm; spring range 80–90 cm [54]), with 70% of significant wave heights below 1 m [54,55]. The 1-year return period storm is characterised by a wave height of 3.3 m [56]. High surge levels can significantly affect the coastal area, causing beach erosion and flooding. Based on the Porto Corsini tide gauge station, located inside Ravenna Port, using the dataset from the decade of 2000–2009, Masina and Ciavola (2011) [57] showed that storms with a 2-year return period produce extreme sea levels of around 0.85 m that can almost double the spring high-tide level. The 1-in-10-years return period surge can reach elevations of about 1.05 m, and the 1-in-100-years surge can reach maximum levels of up to 1.28 m.
Regarding subsidence values in the area, Teatini et al. (2005) [58] estimated in the period 1972–1977 an average 42 mm/yr using high-precision levelling. More recently, Taramelli et al. (2015) [59], using remote sensing data and the PSInSAR technique, indicated displacement rates from 3–5 mm/year (1992–1998) to approximately 7–9 mm/year after 1998.
Armaroli et al. (2012) [60] identified forcing thresholds for morphological changes generated by storm events on natural areas with dunes. The thresholds were developed considering the characteristics of the dune system in the coastal area of the Ravenna Province, that includes the Bevano site. The threshold values of Hs ≥ 3.3 m and water level ≥ 0.85 m were derived from the analysis of the impact of storms on the dunes considering the foredune width, through the computation of a Dune Stability Factor [60,61].
2.2. Bevano River Mouth Evolution
The study area is the low-lying beach at the Bevano River mouth (Ravenna Province, Figure 1a,b). The coastal area that includes the river outlet is protected and is part of the NATURA 2000 network. It is in the Po Delta Park area and includes marshes, pine forests and natural dune systems. The fact that the area is subjected to many protection regulations has allowed the dune system between Lido di Savio and Foce Savio (Figure 1) to remain unoccupied, unlike the rest of the regional coastline.
The Bevano River is highly modified by human activities and artificial structures. The discharge of the river is regulated by the presence of an artificial drainage network; therefore, it has a small bedload sediment transport (estimated at 3950 m3/yr; [62]) that occurs in short periods of high river flows. The sand is injected on the submerged delta and then moved onshore, increasing the beach width [55]. Floods are rare, and the river mouth is mainly controlled by marine processes [62,63,64].
The area located to the north from the study area up to Lido di Dante (Figure 1a) experienced a critical erosive trend (i.e., >3 m/year of shoreline retreat) from 1943 to 2014. However, this trend diminished to the south, with only the area near the Bevano River showing accretion rates between 0.2 and 1 m/year over the same period [65].
The beach is intermediate/dissipative [66] and is composed of fine-to-medium sand (D50 ~200 µm [64]) with the presence of subtidal crescentic and oblique bars, intertidal swash bars and a submerged delta in front of the river mouth [64,65].
The dune system presents a pioneer vegetation community (Cakiletum) with highly discontinuous coverage, composed exclusively of annual plants, among which Cakile maritima predominates. Cakile maritima, Agropyron junceum, and Ammophila littoralis represent the three plant communities in spatial succession from the shoreline landward [67,68].
Starting from the late 1970s (Figure 3a), the river mouth progressively migrated northward at an increasing rate. Between 1998 and 2006, the mouth migrated about 60–70 m/year [69,70]. This erosional trend, especially during 2004–2005, led to the destruction of more than 150 m of natural sand dunes and part of the pine forest [71]. Overall, the mouth of the Bevano River migrated northwards by 500–600 m in 9 years (1998–2006; see Figure 3b). Balouin et al. (2006 III) [72] showed that the mouth was strongly influenced by the interaction between tidal currents entering/exiting the mouth and longshore drift, producing a northward accretion of the sand spit. The mouth can be compared to an ebb tidal delta where currents are able to transport the sediments from inside the river outlet to the submerged delta and northward, feeding the beach and the dunes.
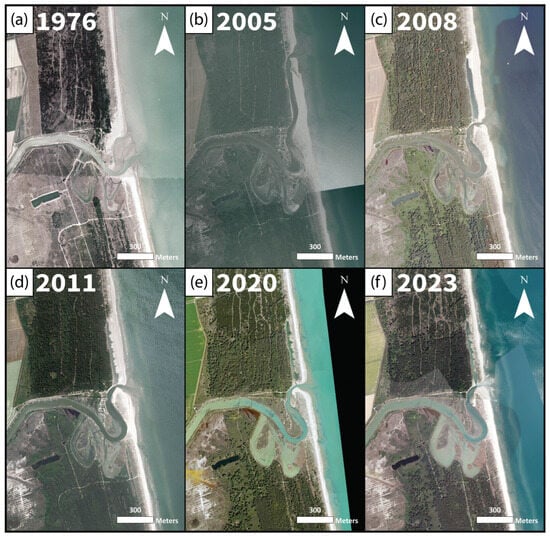
Figure 3.
Evolution of the mouth of the Bevano River. In 1976 (a), the river presented a meandering behaviour. Two abandoned meanders are also visible. In the following years, the mouth migrated northward, as shown in the image of 2005 (b). (c) The image from 2008 shows the results of the intervention that moved the mouth southward, and the water body that corresponds to the abandoned final stretch of the river channel. The mouth position was artificially fixed in the following years, as shown in the images of (d) 2011, (e) 2020, and (f) 2023. Orthophotos provided by AGEA and RER.
Longshore sediment transport caused the silting up of the river mouth, leading to a reduced efficiency of the drainage network overall. The critical hydraulic conditions, combined with the northward migration of the mouth and consequent dune dismantling and pine forest damaging, were at the basis of the decision of local authorities (Regione Emilia Romagna) to artificially move the river outlet southwards [69,73].
The deviation works took place from 23 January to 14 April 2006. The actions undertaken included the following: (i) the opening of a new mouth southward (Figure 3c), at the same point where the mouth was located in the 1970s (see Figure 1a); (ii) the closing of the existing mouth with the sand derived from the excavation of the new mouth; and (iii) the reconstruction of the eroded dune to protect the pine forest (Figure 3c). The sand volumes available from dredging were in the order of 25,000 m3 [74] and the reconstructed dune was designed to be properly integrated in the natural context and therefore connected with the dunes in the north. The dredged sand was mainly used to fill the old mouth (Figure 1c) and was also redistributed along the former sand spit. The newly formed dune elevation ranged around 1–1.5 m above m.s.l. [75], reaching 2 m only in the southernmost portion of the study area, next to the new mouth, and in the northernmost part corresponding to the old mouth area. The new dune was also protected with wind fences to favour sediment trapping. It was decided to avoid the removal of wood debris from the breach to protect the dunes from erosion and to stimulate possible embryo dune development. Two plant species were collected in nature, reproduced in a nursery and planted. The Agropyron junceum was one of the chosen species. This plant, which anchors the sand with its long horizontal rhizomes, creates a much greater obstacle to the wind than the sparse Cakiletum, allowing the formation of “embryonic dunes”. The second species was Ammophila littoralis, which dominates the plant community of the Ammophiletum and plays a crucial role in dune building [67,68]. This intervention also aimed at developing a protocol for dune revegetation that could be applied to other coastal sites in the region. Post-implant monitoring was carried out between November 2006 and April 2009 [76]. Both species showed good vegetative activity starting from April 2007. Finally, the new dredged mouth was consolidated at a fixed position using wood poles and geotextiles that were placed on the left bank of the outlet to halt northward river migration (Figure 4a). The abandoned portion of the lowest Bevano reach was connected to the sea through a spillway that allowed tidal exchange with the river, maintaining satisfactory water quality inside the system (Figure 4b,c).
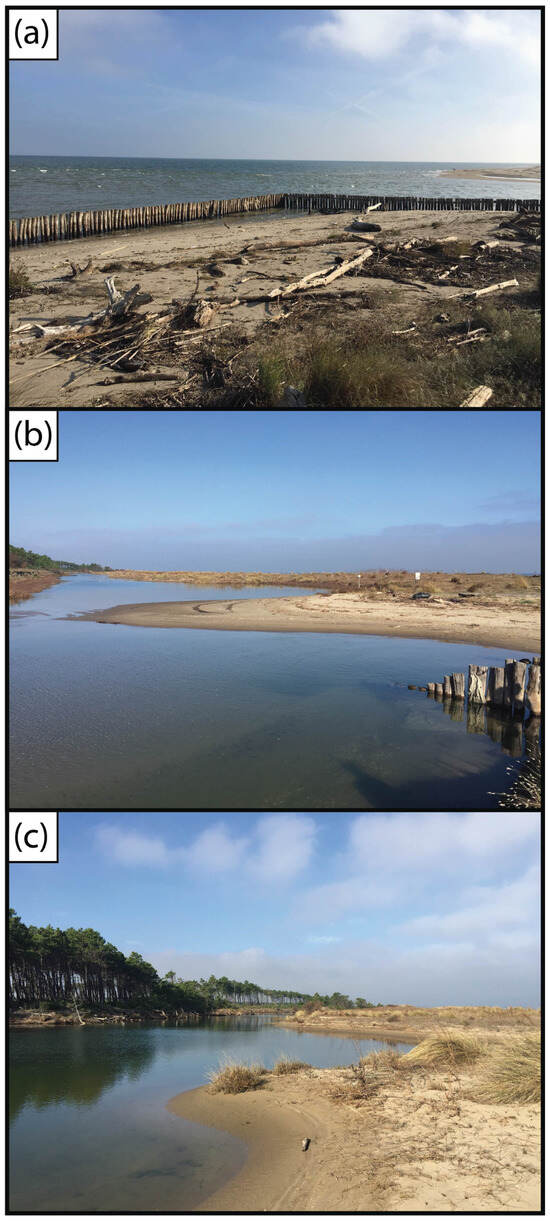
Figure 4.
Photographs of the Bevano River mouth in 2018. In figure (a), the photo is taken towards the southeast and shows the wood pole protection built after the intervention of 2006 to halt the northward migration of the river outlet. In (b,c), the photos are taken towards the north and show the southern washover fans and the abandoned Bevano channel.
2.3. Washover Fans’ Initial Formation and Development
After the intervention of 2006, several overwash events occurred and many washover fans formed (see Figure 5 in the next section). Sedrati et al. (2011) [77] highlighted that the first significant overwash event occurred in December 2008, marking the beginning of notable morphological changes. This event was characterised by a high-tide level of 0.93 m, and an offshore significant wave height of 1.45 m. The overwash caused significant damage to wind fences and dune vegetation, with the formation of 11 washover fans and throats (defined as gaps in the barrier/dune crest through which the overwash funnels and spreads laterally on the back barrier [23]). The largest washover fan produced a landward migration of the back-barrier limit of about 9 m. The overwash development, triggered by the 1 December 2008 storm, continued through subsequent storms in the following years.
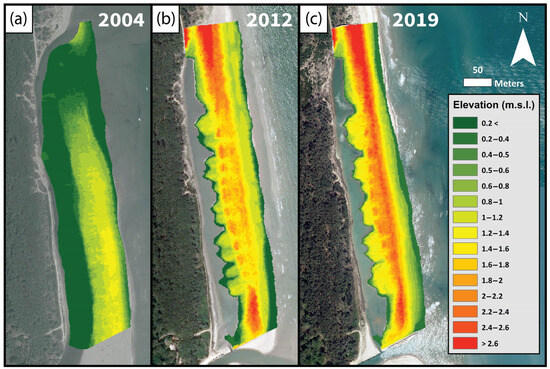
Figure 5.
Evolution of the study area. (a) DTM of 2004 before the outlet relocation; (b) DTM of 2012 after the intervention; (c) DTM of 2019. The washover fans are visible on the western side of the (former) river spit. Elevations refer to mean sea level (IGM Genova 42 Italian Datum).
3. Materials and Methods
3.1. Data Preparation (Pre-Processing)
Three Digital Terrain Models (DTMs) with a resolution of 1 × 1 m provided by RER (Regione Emilia-Romagna) were used in this study: (i) September 2004, (ii) July 2012, and (iii) February 2019 (Figure 5).
Sh and Sh_in shorelines were defined as continuous contour lines identified in all DTMs [78,79] corresponding to the average neap high-tide level (tidal datum-based shorelines [80]). Since the water body located behind the barrier has a different water level compared to the sea level, two different contour lines were chosen: (i) a contour line of 0.3 m above m.s.l. for the seaward side and (ii) a contour line of 0.2 m above m.s.l. for the inner contour. The DTMs were cropped based on the identified shorelines. Several images provided by AGEA (Agenzia per le Erogazioni in Agricoltura), RER, and Google Earth (Landsat/Copernicus) were used to support the analyses and give a better context to the processes that occurred after the intervention. All the details of the images and the DTMs are listed in Table 1.

Table 1.
Summary of all spatial data (i.e., DTMs, images) and their characteristics used in this study.
3.2. Dem of Difference (Post-Processing)
A Dem of Difference (DoD) is a subtraction of elevation values between two DTMs; therefore, it allows one to calculate the vertical and the volume variations between two instants in time. However, since DTMs are models derived from algorithm interpolations, they present a certain level of uncertainty. The calculations between DTMs cause the propagation of individual errors that needs to be considered. The Geomorphic Change Detection tool (GCD) published by Wheaton et al. (2010) [81] was used to estimate vertical and volume variations considering a threshold for change detection (TCD) below which the changes are not considered significant, allowing the calculation of the associated uncertainties. This method is based on the linear theory of error propagation; consequently, it is assumed that the error is spatially constant. The TCD can be assessed and chosen based on the Root Mean Square Error (RMSE) of the single DTM. In this case, the accuracy of the DTMs is not known and a direct evaluation of the vertical accuracy cannot be undertaken. Hence, it is necessary to find a threshold that fits the most probable error of Lidar-derived DEMs in beach environments, considering the range of variations that occurred in the study area, and avoid data loss [82]. The accuracy of a Lidar-derived DEM depends on several factors, such as the Lidar sensor resolution [83], the features of the surveyed environment [17] and the presence of vegetation [84]. Airborne photogrammetry by UAVs and LiDAR can achieve good technical performance on both narrow and wide beaches at lower cost than ground surveys. One limit for its usage on dunes is the presence of dense vegetation. However, the study case of the Bevano experienced high vertical and horizontal variations in the analysed period (i.e., most changes are above 0.5 m), and since in beach environments, 0.15 m of accuracy is usually sufficient to track changes [85], the chosen threshold for change detection was 0.15 m.
3.3. Storm Data Integration
The storms that occurred in the analysed period were derived from the analysis carried out by Arpae (Agenzia regionale per la prevenzione, l’ambiente e l’energia dell’Emilia-Romagna) and described in the report Arpae IdroMeteoClima (2023) [86]. A storm event is defined as a marine event characterised by a significant wave height above the threshold of 1.35 m, which represents the value corresponding to the 95th percentile of the 2008–2022 wave dataset [87], and a minimum duration of 4 h. Two consecutive storms are considered independent if separated by at least 12 h with waves below the threshold. In addition, the total energy (E) of each storm was calculated using the Mendoza and Jiménez (2005) [88] approach, integrating the square of the height of the significant wave height for the duration of the event. The energy content of every event was then grouped into classes [88], with Class I (E ≤ 58.4 m2 h) being the weakest event and Class V (E > 706.9 m2 h) representing extreme conditions. The events are described by different parameters.
The storm wave characteristics were also associated with the water levels measured by the two tide gauges installed in Emilia-Romagna: Porto Garibaldi—Ferrara since 2009; Porto Corsini—Ravenna for the previous period. For each storm event, the maximum water level at Hs max was considered. Wave data were recorded at the wave buoy located in Cesenatico between 2007 and 2023.
3.4. DSAS (Digital Shoreline Analysis System) Analyses, Beach Profiles and Storm Impact
The shorelines were processed with the DSAS tool (Digital Shoreline Analysis System—DSAS v6 for ArcGIS [89]). This tool allows the identification of rates-of-change statistics based on a series of historical shorelines. An alongshore spacing of 5 m was chosen between transects for both shorelines. The number of profiles for the DSAS analysis are 111 for the Sh and 101 for the Sh_in (Figure 1c).
The same shore-normal profiles were used to analyse the beach topography to extract the location of the dune crest and to identify the dune foot. The dune crest was identified over an area of ~500 m alongshore length (78 profiles from the new river mouth to the northward limit of the reconstructed dune (Figure 1c), every 5 m in the central part (57 profiles) and every 10 m in the southern (8 profiles) and northern portions (13 profiles) because the variability of the dune was limited at the two extremes of the system. The position and elevation of the dune foot were analysed along beach profiles and used to draw the dune foot line from the DTMs of 2012 and 2019. The dune foot (DF) lines were analysed with DSAS and compared with the variations in Sh, Sh_in and the dune crest (DC) location. The dune foot of 2004 was not considered because the area was at the time a low-lying sandy spit/barrier without dunes but with uniform slopes both seaward and landward of a continuous crest. On the contrary, the barrier crest was extracted from the 2004 DTM and compared with the dune crests of the successive surveys.
The same profiles were used to compute the average beach slope in 2012 and 2019, in order to apply the Sallenger (2000) [33] storm impact classification using the storm characteristics identified with the methods described in the next paragraph. Specifically, the runup and swash components were computed using the Holman (1986) [90] formula between 2012 and 2019. An additional evaluation of the Sallenger (2000) [33] parameters was carried out in the period 2019–2023 to identify if recent storms were able to generate overwash events.
The four impact categories of Sallenger (2000) [33] are classified according to the values of (i) the maximum runup RHIGH, defined as the 2% exceedance runup, computed using the Holman (1986) [90] formula, plus the measured mean sea level that includes both astronomical tides and storm surge; (ii) RLOW, defined as RHIGH minus 2% of the exceedance swash amplitude and computed using the Holman (1986) [90] formula; (iii) the dune crest height (DHIGH); and (iv) the dune foot height (DLOW).
The four regimes are classified according to the following criteria (refer to Table 2 of Sallenger, 2000 [33]):
- RHIGH/DHIGH is between 0 and DLOW/DHIGH: the storm is not able to impact the dune system (swash regime).
- RHIGH/DHIGH is between DLOW/DHIGH and 1: the impact category is the collision regime.
- RHIGH/DHIGH > 1 and RLOW/DHIGH < 1: the impact category is the overwash regime.
- RHIGH/DHIGH > 1 and RLOW/DHIGH > 1: inundation is expected to occur.
The Holman (1986) [90] formulas read as follows:
where R2% is the 2% exceedance runup and S2% is the 2% exceedance swash amplitude; ξ0 is the Iribarren number ξ0 = tanβ/(H0/L0)1/2 where β is the local beach slope; H0 is the deep water significant wave height; and L0 is the deep water wavelength. For the present study, H0 was set to be equal to the maximum significant wave height measured during storm events (Hs max). The slope values (tanβ) were derived from the DTMs of 2012 and 2019 as the slope of the beach from the dune foot to Sh, and introduced in the formula as the average slope of the whole study area computed using the transect of the DSAS and located in the former spit area, i.e., in the area affected by overwash events. DHIGH and DLOW were extracted from shore-normal profiles corresponding to the transects used to run the DSAS tool. RHIGH/DHIGH and RLOW/DHIGH parameters were computed considering different dune crest elevations equal to the average values over the whole study area, plus or minus one standard deviation of the distribution of crest elevations. The computation of the parameters using different values of DHIGH allows for the evaluation of the variability of the regimes according to the morphological variation of the dunes. The comparisons are named RHIGH/DHIGH “worst” and “best” corresponding to values obtained with DHIGH minus one standard deviation and DHIGH plus one standard deviation, respectively, and RHIGH/DHIGH “average” is obtained using using the mean value of DHIGH. Also, the comparison between RHIGH/DHIGH and DLOW/DHIGH for the definition of the collision regime considers the dune crest variability. Only events able to generate the collision, overwash and inundation regimes will be analysed in the results.
R2% = H0 (0.83 ξ0 + 0.2)
S2% = H0 (0.85 ξ0 + 0.06)
4. Results
4.1. Aerial and Satellite Image Analysis
The 2008 image (Figure 6a) was captured before the triggering event of December 2008 [77]. The plants placed during the intervention are visible along the shoreline of the water body (Sh_in). In winter and early spring periods (November 2008–April 2009), several storms impacted a significant part of the existing vegetation. This was due to overwash events that affected the area. However, after some months (June 2009), the vegetation showed a good recovery all over the system [76]. In 2011 (Figure 6b), the washover fans are visible and well developed. The next image in 2015 confirms the increase in the landward extension of the fans that merged into washover terraces (Figure 6c). However, the vegetation cover was still scarce. After 2015, the washover system became stable and the vegetation colonised the dunes and the washover terraces (Figure 6d of 2017, Figure 6e of 2020, and Figure 6f of 2023).
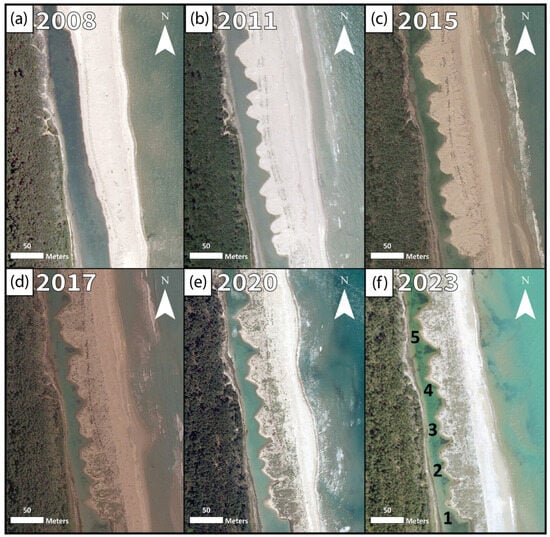
Figure 6.
Development and evolution of the washover fans. The washover fans started to form between (a) 2008 and 2010 [77]. The first washover fans are visible in (b) 2011 and they continued to extend until (c) 2015. In the following years, the vegetation established, as visible in (d) 2017, (e) 2020, and (f) 2023. The numbers in (f) represent the 5 main washover terraces.
4.2. Storms Impact
The number of storms identified between 2007 and 2023 is equal to 314, of which 241 occurred up to 2019. The statistics of the events are summarised in Figure 7 and Table 2 [86].
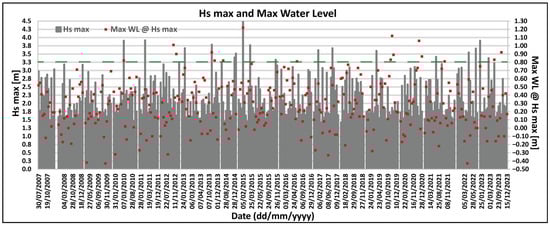
Figure 7.
Maximum significant wave height (Hs max) and maximum water level (WL) at Hs max of all storm events identified between 2007 and 2023 [86]. The wave height threshold identified by Armaroli et al. (2012) [60] for natural areas with dunes is represented by the dashed green line (Hs ≥ 3.3 m). Wave dataset obtained from the buoy of Cesenatico; max water level measured at the two tide gauges located in Porto Garibaldi, Ferrara Province, since 2009 and Porto Corsini, Ravenna Province, for the previous period [86].
Table 2.
Summary of the statistics of the storm events identified in the period 2008–2023 [86]. Refer to Arpae, 2024 [86] for the description of the parameters introduced in the table.
The missing data are ~10% on average between 2007 and 2023 [86]. However, they are not evenly distributed along the seasons, with winter having ~12%, spring having ~13%, summer having ~5%, and autumn having ~11%.
There is a significant variability in storm energy in the analysed period. The most energetic year was 2015 (Total Energy, Table 2) followed by 2018 and 2023. In 2015, there was the highest maximum Hs max (4.54 m) of the whole series that was registered during an extreme event from the ENE (Bora wind) that occurred on 5 February of that year and caused extensive erosion and inundation along the whole regional coastline [48,91]. The event was given the name “St. Agatha storm” by previous authors. The least energetic years were 2014 and 2009 (Table 2). The event called “Halloween storm” of Harley et al. (2015) [92] was an E-ESE storm that occurred on the night of 31 October 2012, which resulted in elevated water levels (equivalent to a 1-in-20- to 1-in-50-year event) and widespread erosion and flooding along the whole Emilia-Romagna regional coastline, as well as the northern-most Italian Adriatic coast [42].
The implementation of the Sallenger (2000) [33] impact classification in the period between 2012 and 2019 led to the identification of 41 events that were able to generate the collision and/or overwash regimes. Figure 8 and Table 3 summarise the main characteristics of the storms. The events were classified as an “overwash regime” if the three cases (RHIGH/DHIGH “average”, “worst” and “best”) were ≥1 with RLOW/DHIGH < 1. They were classified as collision/overwash if RHIGH/DHIGH “worst” was ≥1 and/or RHIGH/DHIGH “average” ≥ 1 but DLOW/DHIGH < RHIGH/DHIGH “best” < 1. In this condition, areas where the dune had a lower elevation could have been affected by overwash processes, while more elevated zones could have experienced collision. If the three cases are between DLOW/DHIGH and 1, it means that there was just the collision regime without overwash processes. The overwash regime is predicted to have occurred for three storms. Only one event was able to generate the inundation regime, specifically the storm that occurred on 2 February 2015.
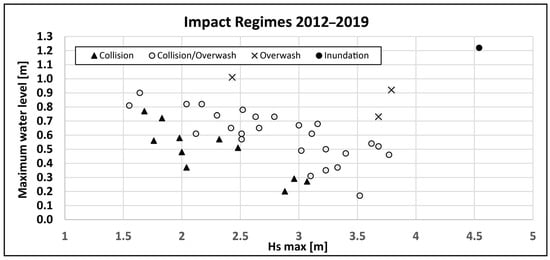
Figure 8.
Values of Hs max and maximum water level at Hs max grouped per impact category (2012–2019).
Table 3.
Summary of the storm events between 2012 and 2023 that are predicted to have caused overwash and inundation.
Between 2012 and 2019, there were only two events above the wave height and water level thresholds defined by Armaroli et al. (2012) [60] (Hs ≥ 3.3 m and TWL ≥ 0.85 m; Figure 7). However, considering the two thresholds separately, the analysed period was characterised by nine events with Hs max ≥ 3.3 m and four events with TWL ≥ 0.85 m. The distribution of the impact categories between 2012 and 2019 is summarised in Figure 8.
The collision/overwash categories are the majority (26 events), but only 8 events show both RHIGH/DHIGH “average” and “worst” ≥ 1. There are 11 events that fall into the category “collision”.
The analysis of the regimes between 2019 and 2023 was carried out using the morphological and topographic information extracted from the 2019 DTM. In this period, there were only six events with Hs max ≥ 3.3 m and five events with TWL ≥ 0.85 m (Figure 7). There are 20 events that are included in one of the three impact categories (Figure 9). There are eight storms capable of generating a collision/overwash regime, two of which have both RHIGH/DHIGH “average” and “worst” ≥ 1. The events that fall into the collision regime number 10. Only three events that occurred on 9 April 2022, 20 January 2023 and 16 May 2023 are predicted to have caused an overwash event.
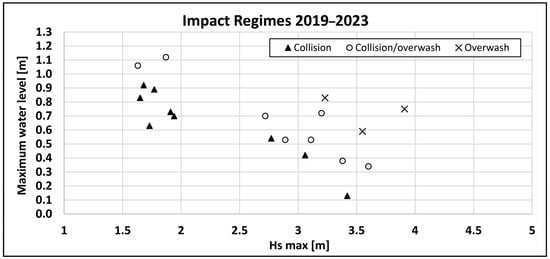
Figure 9.
Values of Hs max and maximum water level at Hs max grouped per impact category (2019–2023).
The characteristics of the storm that are classified as capable of generating overwash processes are listed in Table 3.
4.3. Volumes and Shorelines Change
4.3.1. Changes Pre- and Post-Intervention: 2004–2012
The first-time interval (2004–2012) includes the morphological changes experienced due to the intervention carried out in 2006, and the natural evolution occurred in the following six years. The increase in elevation of the whole area and the large sediment budget is mainly related to the intervention. The largest amount of sediment is found in the northern portion of the area (Figure 10a), due to the artificial closure of the Bevano mouth. The volumes assessed by this first DoD (i.e., 28,000 m3) are comparable to the nourishment volumes provided by the regional authorities (25,000 m3 [74]). However, besides the initial increase in elevation due to human intervention, the study area experienced positive sedimentation along the whole monitored period.
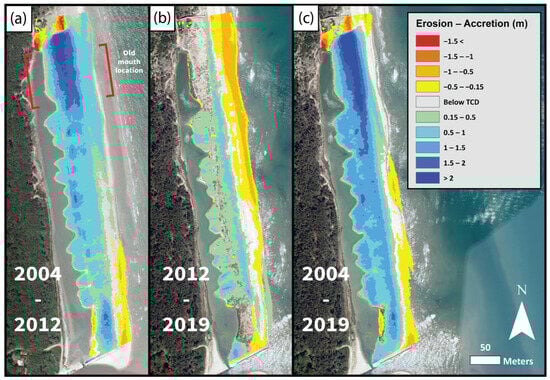
Figure 10.
Vertical changes occurred between (a) 2004 and 2012, representing the main morphological variations pre- and post-intervention (2006); (b) 2012 and 2019; and (c) the overall study period, from 2004 to 2019.
The washover fans developed within this time interval [77], extending towards the water body with a maximum cross-shore displacement of 23 m (Figure 11a and Figure 12a). Positive values of Sh_in in fact represent landward movements. This accretion trend is found also for the Sh with a rate of about 0.33 m/year. The Sh shows a pivotal point located in the central part of the barrier (in the area of profile 40) with the northern section in accretion and the southern one in erosion (Figure 11a and Figure 12a).
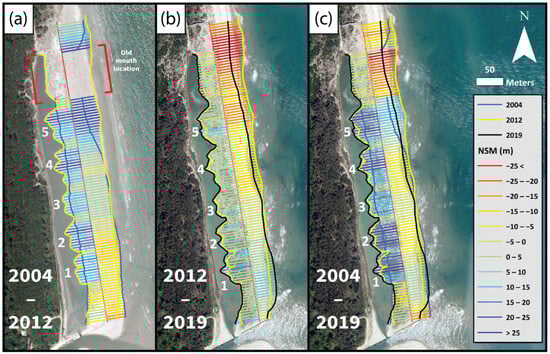
Figure 11.
Shoreline analyses of the northern side of the Bevano mouth from 2004 to 2019. Time intervals of (a) 2004–2012, (b) 2012–2019, and for the whole period of (c) 2004–2019. The numbers represent the 5 main washover terraces.
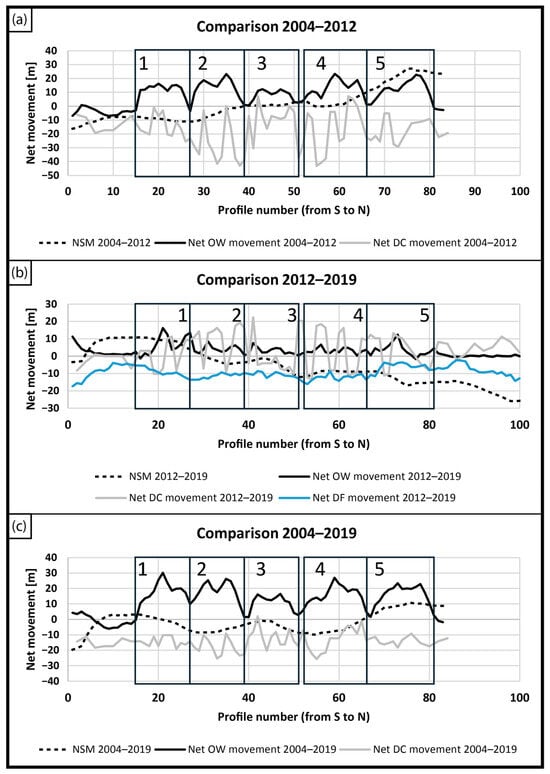
Figure 12.
Net movement calculated along cross-shore topographic profiles and with DSAS of the identified “boundaries” (Sh_in internal shoreline—net OW movement; Sh NSM—net shoreline movement on the seaward side, DF dune crest and DF dune foot) for the periods (a) 2004–2012, (b) 2012–2019, and (c) 2004–2019. The dashed rectangles delimit the 5 washover terraces. Note that the landward (towards the west) migration is represented for Sh_in by positive values and for DC, DF and Sh by negative values. The scale of the y axes is different to better evidence the variations. The numbers represent the 5 main washover terraces.
4.3.2. Natural Evolution After the Intervention: 2012–2019
A positive sediment budget is found in the following period, between 2012 and 2019 (Figure 10b). Although the net budget variation is lower compared to the previous period (i.e., ~2000 m3), about 7000 m3 accumulated mainly on the dune and washover fans, while beach erosion occurred in the central/northern portion of the study area (i.e., 5000 m3). The average height increase in the washover terraces was 0.44 m (maximum variation of 1.27 m).
There is an inversion in the Sh displacement with respect to the pivotal point. Significant Sh retreat occurred in the northern part of the study area, reaching more than 25 m of landward migration, especially in correspondence with the old mouth (Figure 11b), and the southern sector experienced mild accretion of 5–10 m (Figure 12b). Overall, the Sh retreated on average by about 7.6 m, with a rate of 1.2 m/year. Although the dune system gained sediment, the growth of the washover terraces drastically decreased compared to the previous period. In fact, only a few transects show a positive Sh_in movement of about 5–15 m, while most of the fans migrated landward a few metres (i.e., <5 m).
The five washover terraces are identified in Figure 12 where the net movement of the analysed boundaries is shown (Sh_in, Sh, DF and DC). Washover terraces from 1 to 3 and 5 are composed of two fans, while the number 4 morphology is formed by three fans that are merged, although the landward lobes are still visible and show a significant net landward migration. DC retreat in the period 2004–2012 seems partially related to the washover fan accretion. In fact, for some locations of terraces number 3, 4 and 5, the dune crest retreat corresponds to locations where the washover fans experienced a more marked landward migration (Figure 12a). The overall accretion and retreat of Sh_in and DC, respectively, between 2004 and 2019 are evidenced in Figure 12c.
During the whole study period, the system gained about 30,000 m3 (Figure 10c), experiencing an overall Sh retreat of 5.4 m on average (rate of −0.6 m/year), and a Sh_in accretion of 10.2 m on average (rate of 0.7 m/year) (Figure 11c and Figure 12c). All volume changes are listed in Table 4.
Table 4.
Volumetric changes assessed from 2004 to 2019. The time intervals considered were before–after the intervention (2004–2012), after the intervention (2012–2019), and the whole study period (2004–2019).
4.4. Beach Profiles Variations
The alongshore crest elevation distribution is presented in Figure 13. The average dune crest elevation values, ± one standard deviation, increased between 2004 and 2019, specifically from 1.1 ± 0.2 m in 2004, to 2.0 ± 0.3 m in 2012 and 2.4 ± 0.2 m in 2019. The dune system, as also evidenced by the DoD analysis, increased its elevation of 1.3 m on average in the period 2004–2019. The area where there was the most significant modification is the old mouth that was closed and where the dune was reconstructed. The mean elevation change in the reconstructed dune between 2012 and 2019 is ~0.23 m. The dune crest vertical oscillations in 2012 are due to the presence of overwash throats and backward migration of the dune/barrier crest triggered by the events identified by Sedrati et al. (2011) [77]. In 2019, the dune crest elevation shows a more uniform alongshore pattern (Figure 13), because there was recovery, accretion of the whole dune system and sedimentation in the throats (Figure 10b,c), independently from their width and depth with respect to the dune crest (~7 m and ~0.6 m on average in 2012, respectively; Figure 5b). The mean slopes did not show significant changes in the period 2012–2019, ranging from 0.05 in 2012 to 0.08 in 2019.
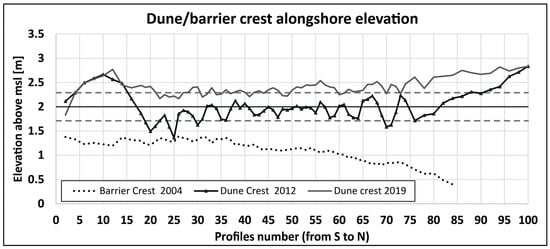
Figure 13.
Dune/barrier crest alongshore elevations in 2004, 2012 and 2019 extracted from topographic cross-shore profiles (refer to Figure 14a for the location of each dune crest). The two dashed lines represent the values of the ± one standard deviation of the elevation distribution in 2012. The average 2012 value of 2 m is highlighted with the continuous black line.
The locations of the barrier crest in 2004 and dune crests in 2012 and 2019 are presented in Figure 14. As shown in Figure 11b and Figure 14a, from 2012 to 2019, the dune foot retreated in the whole study area by about ~9 m on average. The retreat appears overall homogeneous, but lower values are found in the northern part (i.e., 0–5 m) in the area corresponding to the northernmost washover fan.
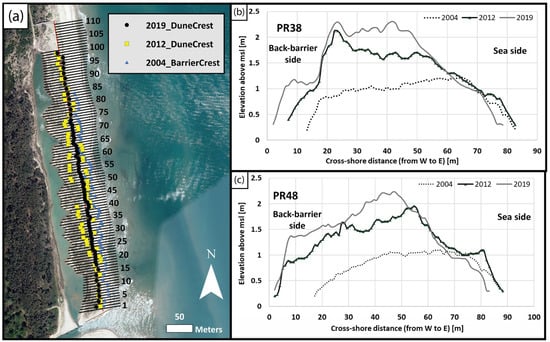
Figure 14.
In (a), the location of the dune crest in 2004, 2012, and 2019 is shown as well as the transects used for the analyses. In (b,c), examples of two profiles located in the central portion of the barrier and the evolution of the dune system between 2004 and 2019 are shown. The sea is on the right-hand side.
Beach profiles show a response to energetic events where the barrier preserves the shape of the dune crest and where large accretion occurs both in the dune system and in the washover deposits [23]. Some profiles show a landward dune crest due to sediment accumulation favoured by the artificially introduced vegetation and by overwash processes (Figure 14b—2012 profile), but between 2012 and 2019, the accretion occurred all over the barrier (Figure 14b,c—2019 profiles).
5. Discussion
The dune system evolution at the Bevano River mouth along the Emilia-Romagna coastline can be summarised as follows:
- Before 2006: River spit formation and northward migration of the mouth (no washover fans);
- 2006–2007: Intervention to close the natural river mouth, opening of the new outlet, and dune reconstruction/revegetation;
- Storm impact in 2008 and initial washover fans formation [77];
- 2008–2019: Washover fans accretion (up to 2015); dune accretion and sediment deposition in washover throats; vegetation starts to colonise the washover fans;
- After 2019: Barrier and washover system stabilisation (vegetation cover increase).
Previous studies on the artificially modified Bevano barrier system have identified the triggering events able to favour overwash processes over the barrier and initiate the formation of washover deposits [77]. The authors highlight two main controlling and triggering factors: high surge levels and low elevation of the crest of the barrier. The triggering event can be classified as runup overwash that caused crest lowering [23] where the water level exceeded the barrier crest, leading to the formation of several washover fans. The initial formation of these morphologies occurred in the spit area after two years from the end of the intervention. To note that the nourishment of the barrier was not sufficient to increase its elevation to preserve it from overwash events, except for the old mouth area. In addition, the vegetation that was artificially introduced was not yet mature and able to capture the limited sand transported by winds [51,52]. In the period between the 2006 intervention, the finalisation of the vegetation planting in autumn 2007, and the winter 2008 triggering event, the system was not affected by overwash processes. Even if not yet mature, the vegetation had sufficient time to grow to cope with the December 2008 storm that caused overtopping, barrier lowering and throat formation, sediment erosion/deposition, and vegetation burying [68,70,77,93].
Casagrande et al. (2023) [42] analysed the formation, evolution and recovery of a large washover located in the barrier island system of the Marano and Grado Lagoon (Italy), using UAV monitoring between 2016 and 2021. Some analogies with the Bevano behaviour can be seen. The Marano and Grado Lagoon system is periodically overwashed and breached by storm events, but the longshore transport can rapidly reconstruct the spit and favour progradation. Casagrande et al. (2023) [42] analysed and observed the evolution of one single washover fan that formed in the location of a previous breach (i.e., erosive hot spot), related to the same storm of 31 October 2012 that produced overwash at the Bevano. At the site studied by the previous authors, this event was the trigger for the formation of a large washover deposit. The Bevano area was not breached by the original triggering event of 1 December 2008 and by none of the events that took place afterwards, considering that the exposure of the two sites is different and, consequently, the direction of wave approach differed as well. Moreover, the two sites are hundreds of kilometres away and the fetch extension is different. However, the dune overwash generated in 2008 formed low elevated throats beneath the barrier/dune crest that favoured successive events and the deposition of more sediments on the fans. Similarly to the case study of Casagrande et al. (2023) [42], the shallow conditions of the back barrier favoured sediment deposition and accumulation on the fans. Casagrande et al. (2023) [42] observed a full recovery of the system over 8 years through sedimentation, thanks to the significant longshore transport and vegetation growth. The system at the Bevano recovered in nearly the same time interval as that of Casagrande et al. (2023) [42] (7–9 years, Figure 6 and Figure 14), although longshore processes and the system characteristics are different.
Using field data collected along the Lido di Classe coastline, 3 km southward from the Bevano site, Armaroli et al. (2013) [61] proved that simple indicators can be used for predictive purposes, analysing the good agreement in estimating the storm impacts between indicators (i.e., impact classification of Sallenger, 2000 [33] and the Dune Stability Factor (DSF) [60], and numerical modelling results). The impact classification applied here in the period 2012–2019 identifies the events that were able to shape the barrier and washover fans. The successive period (2019–2023), however, does not show an agreement between the predicted overwash regimes and the evolution of the system. This supports the finding that in the Bevano case study, the barrier elevation is the main controlling factor for overwash processes. This is also evidenced by the response of the tracts located close to the new mouth (profiles from 1 to 14, Figure 11c and Figure 12c) and the old mouth (profiles from 82 to 100, Figure 11c and Figure 12c) that were not affected by the triggering event in 2008 and were not overwashed by successive extreme events. The two sections have dune crest elevations > 2 m (Figure 5b,c) and did not experience significant accretion between 2012 and 2019 (Figure 10b), remaining stable after the intervention and throughout the analysed period.
Aagard and Kroon (2019) [94] found an interesting relationship between the linear rate of accretion and the steady onshore migration of nearshore bars that provided a supply of sand for transfer to the fan after welding to the beach. Balouin et al. (2006 I) [63] in fact showed the presence in the area of swash bars able to migrate onshore and feed the beach. At Santa Rosa in the US, Houser et al. (2015) [30] observed that the dunes take longer to recover when there is a controlling role by the nearshore bathymetry, with the rate of recovery dependent on the landward migration and welding of the nearshore bars to the beach and the recolonization by dune-building vegetation. Clearly, at the site of interest of the current paper, we are not considering a “recovery” after a catastrophic event but rather a recovery after reconstruction of the dune ridge at an elevation below a critical threshold for inundation. This process should be further explored in future studies, trying, for example, to reproduce the wave and tide climate of the storms that occurred during the monitored period, and simulating the observations of morphological changes using a morphological model, as it was implemented by Houser (2013) [95]. The topic of exchange between the submerged beach and the dunes has so far not been considered at the study site. The area shows an unclear net annual longshore drift [54]. However, during storms from N-NE, strong currents can generate significant north-to-south longshore transport [96]. The submerged delta that formed in front of the new mouth welded to the submerged bars, similarly to the previous conditions before the intervention [77]. The former delta was dismantled soon after the end of the works, consequently reducing the sheltering effect of the subtidal morphologies [77]. The new river outlet, even if it cannot migrate northward, shows a similar behaviour of the natural mouth, i.e., likewise, an ebb tidal delta where tidal currents transport the sediments from inside the river outlet to the submerged delta. Sedrati et al. (2011) [77] suggest that the presence and migration of nearshore rhythmic bars significantly influence wave attenuation, which in turn affects overwash processes. Under low-energy conditions, these bars migrate landward and can protect the dune foot, while during high-energy events, they may be eroded, contributing sediment that enhances overwash sedimentation.
The results presented show that the evolution of the washover fans progressed in the same locations of the initial “morphological imprinting” generated by the storms that occurred in 2008. The initial modification of the system generated a sort of signature that was then maintained through time up to its final evolution and stabilisation. This concept of the control of pre-storm morphology was observed and modelled by Houser (2013) [95] along the barrier islands of Texas in the Matagorda Peninsula. The author proves that the response to storm surges is associated with dune scarping, washover and inundation. The different alongshore profile responses suggest that the impact of an extreme storm is sensitive to initial conditions and specifically the pre-storm variability of the crest elevation alongshore. The evolution of the Bevano was therefore characterised by storms able to overtop the dunes in the same locations of the initial triggering event and increase the volume of the washover fans. However, the increase in the fans’ landward extension slowed down as time passed (Figure 11b and Figure 12b). Aagard and Kroon (2019) [94] at Skallingen (Denmark) observed a linear rate of accretion in which the initial breach in the foredunes and the formation of the washover fans was followed by a recovery phase where waves and winds supplied sand to the system through frequent overwash events that fed the fans. It is important to state that at a later stage, a recovery phase characterised by the elevation increase, also due to the vegetation capability of trapping sand, was observed. In fact, the vegetation cover increased in the Bevano area (Figure 6), suggesting that the system was not affected by overwash processes after 2015. Therefore, the events predicted to have caused a collision/overwash and overwash after 2015 were not able to fully overtop the barrier, but they still contributed to feed the dunes, without reaching the fans. This role of limited overwashing was firstly observed by Matias et al. (2010) [97] along the Ria Formosa barrier island system in Southern Portugal. Using extensive field data collected during extreme high tides, the authors proved that when the proper conditions are generated, non-storm overwash induces sediment transport comparable to storm overwash and therefore may be significant for barrier evolution. This is demonstrated by the final uniform alongshore dune crest elevation (Figure 13) in which the throats have been filled by sediments (Figure 12). The identified storm events in the category of overwash and inundation regimes between 2012 and 2019 could have increased the volume of sand in the washover terraces, especially the extreme event in 2015. Several examples of dune restoration projects were carried out in recent years following similar techniques (i.e., dune replenishment/rebuilding, revegetation, and monitoring), such as for the case of the Leirosa Sand Dunes in Portugal [8], Le Goulet Beach in New Brunswick (Canada) [10], or along the coastline of the New Zeeland [9]. However, the Bevano area did not follow the same evolution. For example, the Leirosa dune system, whose dunes were rebuilt and revegetated with Ammophila arenaria, similarly to the Bevano case, experienced a great loss one year after restoration due to a severe storm that removed sand and vegetation in one night. Therefore, sand-filled geotextile was used to improve stability on the artificial dunes. At the Bevano study site, there was a long period, after 2019, with a relative lower occurrence of energetic events according to the impact classification. This has led to the recovery of the area in terms of elevation and vegetation cover that could have reduced wave runup erosion [98]. The process of dune building after the occurrence of overwashes and their welding into a continuous dune ridge was also enhanced by the continuous deposition of beach wrack (wood and vegetation debris floating out from the river mouths) on the upper part of the beach. It is common that in beaches adjacent to the three rivers of the area (Figure 1) the Fiumi Uniti at Lido Adriano, the Bevano itself and the Savio (see Grottoli et al., 2020 [99] and Cilli et al. 2021 [100]), a large amount of driftwood is discharged after storm events, transported alongshore and beached during storms. Faelga et al. (2023) [39], monitoring a site of dune protection through fences located at the dune base, just a few kilometres southwards, observed over a period of 5 years an increase of 160% of driftwood, coupled with a 9% of vegetation increase inside the fences. Field observations performed by the authors at the Bevano site immediately before and after overwash occurrence observed a similar process as the driftwood was deposited, and it is believed to have enhanced the spreading of vegetation, which, according to Vittuari et al. (2013) [101], after an initial slow growth in 2008–2010, exponentially increased the area coverage of Ammophila up to 2011, when their monitoring finished. It is important to also note that the access of beach users to the area where the overwash fans are located was stopped by the intervention and construction of a palisade. The importance of driftwood that has been accumulating after storms is clearly visible in the satellite image below (Figure 15), captured on 15 April 2022 after the occurrence of winter storms. In the same image, also notice the presence of the swash bars described by Balouin et al., 2006 I [63].
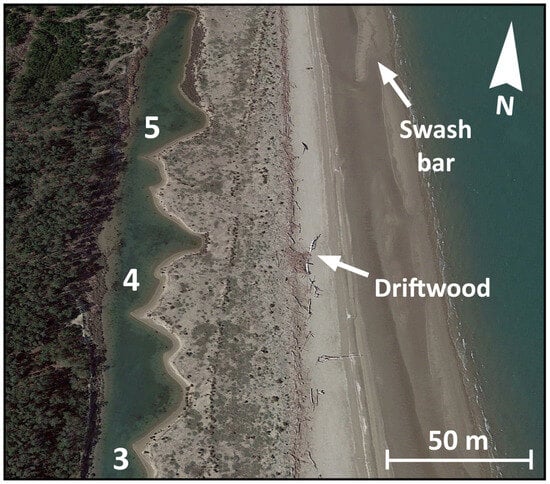
Figure 15.
Image of the washover deposits, driftwood and swash bars in April 2022, obtained from Google Earth. The numbers represent the washover terraces (refer to Figure 11).
6. Conclusions
The paper focused on the long-term morphological evolution (i.e., >10 years) of the former sand spit of the Bevano River (Ravenna, Italy) and the overwash processes that occurred after an artificial intervention that included dune reconstruction, and a nourishment project carried out in 2006. The intervention changed the position of the river mouth to increase its hydraulic efficiency during flood conditions.
Multitemporal Lidar datasets (DTMs) captured between 2004 and 2019 integrated with orthophotos (2008–2023) and storm data analysis (2008–2022) allowed the detection and interpretation of morphological changes as well as shoreline change quantification. Through this paper, the authors have demonstrated that, even in a microtidal and low-energy context, the washover mechanism provides sediment transfer from the dune to back-barrier environments. The previous literature on the area highlighted that the occurrence of an extreme high-water event in 2008 provided the trigger for the development of washover fans as it produced dune crest lowering. The pre-storm condition and the initial morphology generated by the storms that occurred in 2008 had a pivotal role in the washover evolution in the following years. The analyses of the current study show that the evolution of the fans occurred up to 2015, and thereafter, the system stabilised. The rate of landward growth was very high in the period 2004–2012 due to some events that were able to overtop the dunes repeatedly at the same eroded locations, increasing the volume of the washover fans. The nourishment that provided sediment to the barrier did not sufficiently increase the elevation of the system, leading to an initial low resilience to overwashing. Furthermore, the artificially introduced vegetation did not fully develop during the first years; therefore, sediment trapping was limited.
The period of 2012–2019 showed a lower rate of accretion of the fans, because the system reached a stable condition. The washover fans merged to create terraces which were colonised by vegetation in the following years (2015–2023).
The dunes grew in height, preventing complete overtopping by high waters that filled the throats of the washover fans, producing a nearly linear dune crest and finally a stabilisation of the system.
Overall, after a few years (~5 years) characterised by frequent storm events (1–2 per year), the washover fans stopped their growth in a period when less impactful events occurred, according to the impact classification of Sallenger (2000). The area recovered in terms of elevation and vegetation cover, and the barrier system developed a continuous dune crest system. Two main controlling and triggering factors that formed the washover fans were identified: high surge levels and an initial low elevation of the crest of the barrier, artificially reconstructed and nourished in 2006 and vegetated with Ammophila littoralis. The observed morphological behaviour confirms results from studies performed on oceanic barriers as well as other microtidal systems in the Adriatic. The scale of the studied morphological system (e.g., the washover fans develop over an area with a length of 500 m) makes the study case an ideal natural model for process understanding, as the natural variability observed in larger systems (e.g., barrier islands) is minimised. The availability of remotely sensed data through Lidar surveys allowed a detailed computation of volume changes and the capturing of variations in dune crest morphology.
Finally, it should be noted that this intervention of river diversion, without the construction of embankments and trailing walls, coupled with dune reconstruction and revegetation was performed in 2006, almost 20 years before the term “Nature-Based Solutions” would enter the dictionary of coastal managers. It was arguably one of the first projects of its kind undertaken in the country. Its reassessment after 20 years of life proved its good sustainability as well as its positive value, having recreated and enhanced the development of a dune ecosystem.
Author Contributions
C.A.: research and paper conceptualization, formal analysis, writing and editing (original manuscript), discussion of results; R.B. formal analysis, writing and editing (original manuscript), discussion of results; P.C.: field surveys, writing (original manuscript), discussion of results. All authors have read and agreed to the published version of the manuscript.
Funding
A.C. was supported by internal funding RFO assigned to C. Armaroli by the University of Bologna during the paper preparation. P.C. and R.C. were supported by internal funding FAR assigned to P. Ciavola by the University of Ferrara during the paper preparation.
Data Availability Statement
The airborne DTMs of 2012 and 2019 are available via WMS Service though the geoportal of the Emilia-Romagna Region (https://geoportale.regione.emilia-romagna.it/, accessed on 20 January 2025). The DTM of 2004 can be requested from the Area Geologia, Suoli e Sismica of the Emilia-Romagna Region. The orthophotos (i.e., 1976, 2005, 2008, 2011, 2020, 2023/24) can be visualised and downloaded from the geoportal of the Emilia-Romagna Region. The satellite images (i.e., 2015, 2017) can be visualised in Google Earth. The wave and tide data can be downloaded from Dext3r portal of Arpae (https://simc.arpae.it/dext3r/, accessed on 20 January 2025). The characteristics and analysis of the storms between 2007 and 2023 can be found in the report of Arpae (2023) [86].
Acknowledgments
This work is the result of 20 years of research performed by C.A and P.C. on the studied location, a surviving pearl of natural beauty in the context of one of the most artificially modified coastlines in Europe. The authors are grateful to Ten. Col. G. Nobili, head of the station of Punta Marina of Carabinieri per la Biodiversità, for allowing access to the Bevano Nature Reserve and for the fruitful discussions over so many years. The authors are grateful to Dott.ssa L. Perini and Dott.ssa J. Lelli of AGSS for the provision of the DTM of 2004. The authors are grateful to Dott.ssa L. Perini of AGSS and A. Valentini of Arpae for the fruitful discussions over the years.
Conflicts of Interest
The authors declare no conflicts of interest.
References
- Capobianco, M.; Stive, M.J.F. Soft intervention technology as a tool for integrated coastal zone management. J. Coast. Conserv. 2000, 6, 33–40. [Google Scholar] [CrossRef]
- Slobbe, E.; Vriend, H.J.; Aarninkhof, S.; Lulofs, K.; Vries, M.; Dircke, P. Building with nature: In search of resilient storm surge protection strategies. Nat. Hazards 2013, 65, 947–966. [Google Scholar] [CrossRef]
- Masselink, G.; Lazarus, E.D. Defining coastal resilience. Water 2019, 11, 2587. [Google Scholar] [CrossRef]
- Martínez, M.L.; Hesp, P.A.; Gallego-Fernández, J.B. Coastal Dune Restoration: Trends and Perspectives. In Restoration of Coastal Dunes; Martínez, M.L., Gallego-Fernández, J.B., Hesp, P.A., Eds.; Springer: Berlin/Heidelberg, Germany, 2013; pp. 323–339. [Google Scholar] [CrossRef]
- Lawlor, P.; Jackson, D.W.T. A Nature-Based Solution for Coastal Foredune Restoration: The Case Study of Maghery, County Donegal, Ireland. In Human-Nature Interactions; Misiune, I., Depellegrin, D., Egarter Vigl, L., Eds.; Springer: Cham, Switzerland, 2022; pp. 417–429. [Google Scholar] [CrossRef]
- Johnston, K.K.; Dugan, J.E.; Hubbard, D.M.; Emery, K.A.; Grubbs, M.W. Using dune restoration on an urban beach as a coastal resilience approach. Front. Mar. Sci. 2023, 10, 1187488. [Google Scholar] [CrossRef]
- Zainuddin, S.N.H.; Ariffin, E.H.; Taslin, P.N.A.; Dong, W.S.; Ramli, M.Z.; Abdul Maulud, K.N.; Awang, N.A.; Nadzri, M.I.; Ibrahim, M.S.I.; Ratnayake, A.S. Sand dune restoration as sustainable natural architectural design for coastal protection along seasonal storm-prone beach. Results Eng. 2024, 22, 102149. [Google Scholar] [CrossRef]
- Reis, C.S.; Antunes do Carmo, J.; Freitas, H. Leirosa Sand Dunes: A case study on coastal protection. In Maritime Transportation and Exploitation of Ocean and Coastal Resources; Balkema: Leiden, The Netherlands, 2005; pp. 1469–1474. [Google Scholar] [CrossRef]
- Jenks, G.K. Restoring the natural functional capacity of coastal dune ecosystems: Utilising research records for New Zealand littoral refurbishment as a proxy for analogous global responses. J. Coast. Conserv. 2018, 22, 623–665. [Google Scholar] [CrossRef]
- Hébert, C.; Paulin, A.; Tétégan Marion, S. Monitoring of Dune Restoration Techniques to Protect Against Coastal Erosion and Flooding: Case Study of a Beach in Le Goulet (N.B.). SSRN 2022, 20. [Google Scholar] [CrossRef]
- Mulder, J.P.M.; Tonnon, P.K. “Sand Engine”: Background and Design of a Mega-Nourishment Pilot in the Netherlands. Int. Conf. Coastal. Eng. 2011, 35, 1–10. [Google Scholar] [CrossRef]
- Stive, M.J.F.; de Schipper, M.A.; Luijendijk, A.P.; Aarninkhof, S.G.J.; van Gelder-Maas, C.; van Thiel de Vries, J.S.M.; de Vries, S.; Henriquez, M.; Marx, S.; Ranasinghe, R. A new alternative to saving our beaches from sea-level rise: The sand engine. J. Coast. Res. 2013, 29, 1001–1008. [Google Scholar] [CrossRef]
- de Schipper, M.A.; de Vries, S.; Ruessink, G.; de Zeeuw, R.C.; Rutten, J.; van Gelder-Maas, C.; Stive, M.J.F. Initial spreading of a mega feeder nourishment: Observations of the Sand Engine pilot project. Coast. Eng. 2016, 111, 23–38. [Google Scholar] [CrossRef]
- Roest, B.; de Vries, S.; de Schipper, M.; Aarninkhof, S. Observed Changes of a Mega Feeder Nourishment in a Coastal Cell: Five Years of Sand Engine Morphodynamics. J. Mar. Sci. Eng. 2021, 9, 37. [Google Scholar] [CrossRef]
- Luijendijk, A.P.; Ranasinghe, R.; de Schipper, M.A.; Huisman, B.A.; Swinkels, C.M.; Walstra, D.J.R.; Stive, M.J.F. The initial morphological response of the Sand Engine: A process-based modelling study. Coast. Eng. 2017, 119, 1–14. [Google Scholar] [CrossRef]
- van Westen, B.; Luijendijk, A.P.; de Vries, S.; Cohn, N.; Leijnse, T.W.B.; de Schipper, M.A. Predicting marine and aeolian contributions to the Sand Engine’s evolution using coupled modelling. Coast. Eng. 2024, 188, 104444. [Google Scholar] [CrossRef]
- Orams, M.B. Sandy beaches as a tourism attraction: A management challenge for the 21st century. J. Coast. Res. 2003, 35, 74–84. [Google Scholar]
- King, P.; Symes, D. Potential loss in GNP and GSP from a failure to maintain California’s beaches. Shore Beach 2004, 72, 3–8. [Google Scholar]
- Brown, S.; Nicholls, R.J.; Woodroffe, C.D.; Hanson, S.; Hinkel, J.; Kebede, A.S.; Neumann, B.; Vafeidis, A.T. Chapter 5: Sea-level rise impacts and responses: A global perspective in Coastal Hazards. In Coastal Research Library; Finkl, C.W., Ed.; Springer: Dordrecht, The Netherlands, 2013; Volume 1000. [Google Scholar] [CrossRef]
- Bryant, D.B.; Bryant, M.A.; Sharp, J.A.; Bell, G.L.; Moore, C. The response of vegetated dunes to wave attack. Coast. Eng. 2019, 152, 103506. [Google Scholar] [CrossRef]
- Sloss, C.R.; Shepherd, M.; Hesp, P. Coastal Dunes: Geomorphology. Nat. Educ. 2012, 3, 2. [Google Scholar]
- Yousefi Lalimi, F.; Silvestri, S.; Moore, L.J.; Marani, M. Coupled topographic and vegetation patterns in coastal dunes: Remote sensing observations and ecomorphodynamic implications. J. Geophys. Res. Biogeosci. 2017, 122, 119–130. [Google Scholar] [CrossRef]
- Donnelly, C.; Kraus, N.; Larson, M. State of Knowledge on Measurement and Modeling of Coastal Overwash. J. Coast. Res. 2006, 224, 965–991. [Google Scholar] [CrossRef]
- Matias, A.; Ferreira, O.; Vila-Concejo, A.; Garcia, T.; Alveirinho Dias, J. Classification of washover dynamics in barrier islands. Geomorphology 2008, 97, 655–674. [Google Scholar] [CrossRef]
- Matias, A.; Masselink, G. Overwash Processes: Lessons from Fieldwork and Laboratory Experiments. In Coastal Storms: Processes and Impacts; Ciavola, P., Coco, G., Eds.; Wiley: Hoboken, NJ, USA, 2016; pp. 175–194. [Google Scholar] [CrossRef]
- Pouzet, P.; Idier, D. A composite approach to document a century of overwash events in a high tide environment of southern Brittany, France. Estuar. Coast. Shelf Sci. 2024, 298, 108626. [Google Scholar] [CrossRef]
- Byrnes, M.R.; Gingerich, K.J. Cross-island profile response to Hurricane Gloria. In Proceedings Coastal Sediments ’87; ASCE: New Orleans, LA, USA, 1987; pp. 1486–1502. [Google Scholar]
- Dolan, R.; Godfrey, P. Effects of Hurricane Ginger on the barrier islands of North Carolina. Geol. Soc. Am. Bull. 1973, 84, 1329–1334. [Google Scholar] [CrossRef]
- Houser, C. Controls on coastal dune morphology, shoreline erosion and barrier island response to extreme storms. Geomorphology 2008, 100, 223–240. [Google Scholar] [CrossRef]
- Houser, C.; Wernette, P.; Rentschlar, E.; Jones, H.; Hammond, B.; Trimble, S. Post-storm beach and dune recovery: Implications for barrier island resilience. Geomorphology 2015, 234, 54–63. [Google Scholar] [CrossRef]
- Rodriguez, A.B.; Theuerkauf, E.J.; Ridge, J.T.; VanDusen, B.M.; Fegley, S.R. Long-term washover fan accretion on a transgressive barrier island challenges the assumption that paleotempestites represent individual tropical cyclones. Sci. Rep. 2020, 10, 19755. [Google Scholar] [CrossRef]
- Morton, R.A.; Gonzalez, J.L.; Lopez, G.I.; Correa, I.D. Frequent non-storm washover of barrier islands, Pacific coast of Columbia. J. Coast. Res. 2000, 16, 82–87. [Google Scholar]
- Sallenger, A.H., Jr. Storm impact scale for barrier islands. J. Coast. Res. 2000, 16, 890–895. [Google Scholar]
- Donnelly, C.; Kraus, N.C.; Larson, M. Coastal Overwash; Part 1: Overview of Processes. Regional Sediment Management Demonstration Program Technical Note, ERDC/RSM-TN-14; U.S. Army Engineer Research and Development Center: Vicksburg, MS, USA, 2004; Available online: https://apps.dtic.mil/sti/tr/pdf/ADA602107.pdf (accessed on 23 January 2025).
- Nordstrom, K.F.; Gamper, U.; Fontolan, G.; Bezzi, A.; Jackson, N.L. Characteristics of Coastal Dune Topography and Vegetation in Environments Recently Modified Using Beach Fill and Vegetation Plantings, Veneto, Italy. Environ. Manag. 2009, 44, 1121–1135. [Google Scholar] [CrossRef]
- Giambastiani, B.M.S.; Greggio, N.; Sistilli, F.; Fabbri, S.; Scarelli, F.; Candiago, S.; Anfossi, G.; Lipparini, C.A.; Cantelli, L.; Antonellini, M.; et al. RIGED-RA project—Restoration and management of Coastal Dunes in the Northern Adriatic Coast, Ravenna Area—Italy. IOP Conf. Ser. Earth Environ. Sci. 2016, 44, 052038. [Google Scholar] [CrossRef]
- Bezzi, A.; Pillon, S.; Martinucci, D.; Fontolan, G. Inventory and conservation assessment for the management of coastal dunes, Veneto coasts, Italy. J. Coast. Conserv. 2018, 22, 503–518. [Google Scholar] [CrossRef]
- Della Bella, A.; Fantinato, E.; Scarton, F.; Buffa, G. Mediterranean developed coasts: What future for the foredune restoration? J. Coast. Conserv. 2021, 25, 49. [Google Scholar] [CrossRef]
- Faelga, R.; Cantelli, L.; Silvestri, S.; Giambastiani, B. Dune belt restoration effectiveness assessed by UAV topographic surveys (northern Adriatic coast, Italy). Biogeosciences 2023, 20, 4841–4855. [Google Scholar] [CrossRef]
- Della Bella, A.; Del Vecchio, S.; Fantinato, E.; Buffa, G. Coastal Dune Restoration: A Checklist Approach to Site Selection. Land 2024, 13, 135. [Google Scholar] [CrossRef]
- Nordstrom, K.F.; Armaroli, C.; Jackson, N.L.; Ciavola, P. Opportunities and constraints for managed retreat on exposed sandy shores: Examples from Emilia-Romagna, Italy. Ocean Coast. Manag. 2015, 104, 11–21. [Google Scholar] [CrossRef]
- Casagrande, G.; Bezzi, A.; Fracaros, S.; Martinucci, D.; Pillon, S.; Salvador, P.; Sponza, S.; Fontolan, G. Quantifying Transgressive Coastal Changes Using UAVs: Dune Migration, Overwash Recovery, and Barrier Flooding Assessment and Interferences with Human and Natural Assets. J. Mar. Sci. Eng. 2023, 11, 1044. [Google Scholar] [CrossRef]
- Klemas, V.V. Remote Sensing of Coastal Ecosystems and Environments. In Coastal Wetlands: Alteration and Remediation; Springer: Berlin/Heidelberg, Germany; IEEE: Piscataway, NJ, USA, 2014; Volume 9, pp. 3–30. [Google Scholar] [CrossRef]
- Javernick, L.; Brasington, J.; Caruso, B. Modeling the topography of shallow braided rivers using Structure-from-Motion photogrammetry. Geomorphology 2014, 213, 166–182. [Google Scholar] [CrossRef]
- Ryan, J.C.; Hubbard, A.L.; Box, J.; Todd, J.; Christoffersen, P.; Carr, J.R.; Holt, T.O.; Snooke, N. UAV photogrammetry and structure from motion to assess calving dynamics at Store Glacier, a large outlet draining the Greenland ice sheet. Cryosphere 2015, 9, 1–11. [Google Scholar] [CrossRef]
- Casella, E.; Rovere, A.; Pedroncini, A.; Stark, C.P.; Casella, M.; Ferrari, M.; Firpo, M. Drones as tools for monitoring beach topography changes in the Ligurian Sea (NW Mediterranean). Geo Lett. 2016, 36, 151–163. [Google Scholar] [CrossRef]
- Dąbski, M.; Zmarz, A.; Pabjanek, P.; Korczak-Abshire, M.; Karsznia, I.; Chwedorzewska, K.J. UAV-based detection and spatial analyses of periglacial landforms on Demay Point (King George Island, South Shetland Islands, Antarctica). Geomorphology 2017, 290, 29–38. [Google Scholar] [CrossRef]
- Duo, E.; Trembanis, A.C.; Dohner, S.; Grottoli, E.; Ciavola, P. Local-scale post-event assessments with GPS and UAV-based quick-response surveys: A pilot case from the Emilia–Romagna (Italy) coast. Nat. Hazards Earth Syst. Sci. 2018, 18, 2969–2989. [Google Scholar] [CrossRef]
- Giordano, C.M.; Girelli, V.A.; Lambertini, A.; Tini, M.A.; Zanutta, A. UAV Data Collection Co-Registration: LiDAR and Photogrammetric Surveys for Coastal Monitoring. Drones 2025, 9, 49. [Google Scholar] [CrossRef]
- Pranavam Ayyappan Pillai, U.; Pinardi, N.; Federico, I.; Causio, S.; Trotta, F.; Unguendoli, S.; Valentini, A. Wind-wave characteristics and extremes along the Emilia-Romagna coast. Nat. Hazards Earth Syst. Sci. 2022, 22, 3413–3433. [Google Scholar] [CrossRef]
- Brunelli, V. Analisi Evolutiva del Sistema Spiaggia-Duna in Emilia-Romagna: Processi Morfodinamici e Trasporto Eolico. Ph.D. Thesis, Università degli Studi di Ferrara, Ferrara, Italy, 2010; p. 327. Available online: https://hdl.handle.net/11392/2389172 (accessed on 20 January 2025).
- Corbau, C.; Simeoni, U.; Melchiorre, M.; Rodella, I.; Utizi, K. Regional variability of coastal dunes observed along the Emilia-Romagna littoral, Italy. Aeolian Res. 2015, 18, 169–183. [Google Scholar] [CrossRef]
- Zingg, A.W. Wind tunnel studies of movement of sedimentary material. Proc. 5th Hydraul. Conf. Bull. 1953, 34, 111–134. [Google Scholar]
- Arpae. Stato del Litorale Emiliano-Romagnolo al 2018 Erosione e Interventi di Difesa; ARPAE Emilia-Romagna: Bologna, Italy, 2018; ISBN 978-88-87854-48-0. Available online: https://ambiente.regione.emilia-romagna.it/it/suolo-bacino/argomenti/difesa-della-costa/stato-del-litorale-emiliano-romagnolo-allanno-2007-e-piano-decennale-di-gestione/stato-litorale-slem-arpae-2020-web-leggera.pdf/@@download/file (accessed on 23 January 2025).
- Katalinić, M.; Parunov, J. Wave statistics in the Adriatic Sea based on 24 years of satellite measurements. Ocean Eng. 2018, 158, 378–388. [Google Scholar] [CrossRef]
- Armaroli, C.; Ciavola, P.; Masina, M.; Perini, L. Run-up computation behind emerged breakwaters for marine storm risk assessment. J. Coast. Res. 2009, 56, 1612–1616. Available online: https://ambiente.regione.emilia-romagna.it/it/geologia/geologia/costa-e-mare/pdf/ICS2009_runup.pdf/@@download/file (accessed on 23 January 2025).
- Masina, M.; Ciavola, P. Analisi dei livelli marini estremi e delle acque alte lungo il litorale ravennate. Studi Costieri 2011, 18, 84–98. Available online: https://www.researchgate.net/publication/285758342 (accessed on 23 January 2025). (In Italian).
- Teatini, P.; Ferronato, M.; Gambolati, G.; Bertoni, W.; Gonella, M. A century of land subsidence in Ravenna, Italy. Environ. Geol. 2005, 47, 831–846. [Google Scholar] [CrossRef]
- Taramelli, A.; Di Matteo, L.; Ciavola, P.; Guadagnano, F.; Tolomei, C. Temporal evolution of patterns and processes related to subsidence of the coastal area surrounding the Bevano River mouth (Northern Adriatic)–Italy. Ocean Coast. Manag. 2015, 108, 74–88. [Google Scholar] [CrossRef]
- Armaroli, C.; Ciavola, P.; Perini, L.; Calabrese, L.; Lorito, S.; Valentini, A.; Masina, M. Critical storm thresholds for significant morphological changes and damage along the Emilia-Romagna coastline, Italy. Geomorphology 2012, 143–144, 34–51. [Google Scholar] [CrossRef]
- Armaroli, C.; Grottoli, E.; Harley, M.D.; Ciavola, P. Beach morphodynamics and types of foredune erosion generated by storms along the Emilia-Romagna coastline, Italy. Geomorphology 2013, 199, 22–35. [Google Scholar]
- Ciavola, P.; Billi, P.; Armaroli, C.; Balouin, Y.; Preciso, E.; Salemi, E. Valutazione della morfodinamica di foce del Torrente Bevano (RA): Il ruolo del trasporto solido di fondo—Morphodynamics of the Bevano Stream outlet: The role of bedload yield. Geol. Tec. Ambient. 2005, 1, 41–57. [Google Scholar]
- Balouin, Y.; Ciavola, P.; Anfuso, G.; Armaroli, C.; Corbau, C.; Tessari, U. Morphodynamics of intertidal sand bars: Field studies in the Northern Adriatic, NE Italy. J. Coast. Res. 2006, I, 323–328. [Google Scholar]
- Balouin, Y.; Ciavola, P.; Armaroli, C. Sediment transport patterns and coastal evolution at Lido di Dante beach, Adriatic Sea. In Proceedings Coastal Dynamics; ASCE: New York, NY, USA, 2006; Volume II. [Google Scholar]
- Perini, L.; Luciani, P.; Calabrese, L. Indicatori di suscettibilità costiera ai fenomeni di erosione e inondazione marina. In Regione Emilia-Romagna, Servizio Geologico, Sismico e dei Suoli; Regione Emilia-Romagna: Bologna, Italy, 2019; Available online: https://ambiente.regione.emilia-romagna.it/it/geologia/geologia/costa-e-mare/pdf?set_language=it&post_path=/report_indicatori_2019_pdf/%40%40download/file/report_indicatori_2019_.pdf (accessed on 20 January 2025).
- Wright, L.D.; Short, A.D. Morphodynamic variability of surf zones and beaches: A synthesis. Mar. Geol. 1984, 56, 93–118. [Google Scholar]
- Merloni, N.; Speranza, M. La biodiversità: Le specie vegetali. In Foce Bevano: L’area Naturale Protetta e L’intervento di Salvaguardia; Centro Stampa della Regione Emilia-Romagna: Bologna, Italy, 2009; Chapter 1.3; pp. 10–11. Available online: https://ambiente.regione.emilia-romagna.it/it/geologia/geologia/costa-e-mare/pdf/pubblicazione_bevano_LQ.pdf/@@download/file (accessed on 15 November 2024).
- Speranza, M.; Ferroni, L.; Pritoni, G. L’intervento di vegetalizzazione della duna. In Foce Bevano: L’area Naturale Protetta e L’intervento di Salvaguardia; Marasmi, C., Ed.; Centro Stampa della Regione Emilia-Romagna: Bologna, Italy, 2009; Chapter 3; pp. 26–29. Available online: https://ambiente.regione.emilia-romagna.it/it/geologia/geologia/costa-e-mare/pdf/pubblicazione_bevano_LQ.pdf/@@download/file (accessed on 15 November 2024).
- Perini, L.; Calabrese, L. Le caratteristiche e l’evoluzione dell’area di foce Bevano. In Foce Bevano: L’area Naturale Protetta e L’intervento di Salvaguardia; Marasmi, C., Ed.; Centro Stampa della Regione Emilia-Romagna: Bologna, Italy, 2009; Chapter 1.1; pp. 4–7. Available online: https://ambiente.regione.emilia-romagna.it/it/geologia/geologia/costa-e-mare/pdf/pubblicazione_bevano_LQ.pdf/@@download/file (accessed on 15 November 2024).
- Calabrese, L.; Luciani, P.; Perini, L. Gli impatti delle mareggiate tra foce Fiumi Uniti e foce Fiume Savio. In Foce Bevano: Stato Dell’area Naturale Protetta e Prospettive per una sua Gestione Integrata e Sostenibile; Montanari, R., Marasmi, C., Eds.; Centro Stampa della Regione Emilia-Romagna: Bologna, Italy, 2013; Chapter 3.2; pp. 37–45. Available online: https://ambiente.regione.emilia-romagna.it/it/suolo-bacino/servizi/pubblicazioni/servizio-difesa-del-suolo-della-costa-e-bonifica/pdf/foce-bevano/@@download/file/Bevano%20-%20stato%20dell'area%20naturale%20protetta.pdf (accessed on 21 January 2025).
- Gardelli, M.; Caleffi, S.; Ciavola, P. Evoluzione morfodinamica della foce del Torrente Bevano. Studi Costieri 2007, 13, 53–74. (In Italian) [Google Scholar]
- Balouin, Y.; Ciavola, P.; Michel, D. Support of subtidal tracer studies to quantify the complex morphodynamics of a river outlet: The Bevano, NE Italy. J. Coast. Res. 2006, III, 602–607. [Google Scholar]
- Montanari, R. Le problematiche idrauliche a ambientali. In Foce Bevano: L’area Naturale Protetta e L’intervento di Salvaguardia; Marasmi, C., Ed.; Centro Stampa della Regione Emilia-Romagna: Bologna, Italy, 2009; Chapter 2.1; pp. 19–22. Available online: https://ambiente.regione.emilia-romagna.it/it/geologia/geologia/costa-emare/pdf/pubblicazione_bevano_LQ.pdf/@@download/file (accessed on 15 November 2024).
- Miccoli, C.; Ceroni, M.; Castelli, M.; Malavolta, E.; Marasmi, C. Il progetto di riqualificazione funzionale nel tratto costiero in corrispondenza di foce Bevano. In Foce Bevano: L’area Naturale Protetta e L’intervento di Salvaguardia; Marasmi, C., Ed.; Centro Stampa della Regione Emilia-Romagna: Bologna, Italy, 2009; Chapter 2.3; pp. 19–22. Available online: https://ambiente.regione.emilia-romagna.it/it/geologia/geologia/costa-e-mare/pdf/pubblicazione_bevano_LQ.pdf/@@download/file (accessed on 15 November 2024).
- Ciavola, P. La morfodinamica della foce dopo l’intervento. In Foce Bevano: L’area Naturale Protetta e L’intervento di Salvaguardia; Marasmi, C., Ed.; Centro Stampa della Regione Emilia-Romagna: Bologna, Italy, 2009; Chapter 4.1; pp. 17–18. Available online: https://ambiente.regione.emilia-romagna.it/it/geologia/geologia/costa-e-mare/pdf/pubblicazione_bevano_LQ.pdf (accessed on 15 November 2024).
- Speranza, M.; Ferroni, L.; Pritoni, G. La copertura vegetale. In Foce Bevano: L’area Naturale Protetta e L’intervento di Salvaguardia; Marasmi, C., Ed.; Centro Stampa della Regione Emilia-Romagna: Bologna, Italy, 2009; Chapter 5.3; pp. 39–40. Available online: https://ambiente.regione.emilia-romagna.it/it/geologia/geologia/costa-e-mare/pdf/pubblicazione_bevano_LQ.pdf/@@download/file (accessed on 15 November 2024).
- Sedrati, M.; Ciavola, P.; Armaroli, C. Morphodynamic evolution of a microtidal barrier; the role of overwash: Bevano, Northern Adriatic Sea. J. Coast. Res. 2011, 696–700. [Google Scholar]
- Harris, M.; Brock, J.; Nayegandhi, A.; Duffy, M. Extracting Shorelines from NASA Airborne Topographic Lidar-Derived Digital Elevation Models; Geological Survey Open-file Report 2005-1427; U.S. Department of the Interior and U.S. Geological Survey: Reston, VA, USA, 2006. [Google Scholar]
- Robertson, W.; Whitman, D.; Zhang, K.; Leatherman, S.P. Mapping shoreline position using airborne laser altimetry. J. Coast. Res. 2004, 20, 884–892. [Google Scholar]
- Boak, E.H.; Turner, I.L. Shoreline Definition and Detection: A Review. J. Coast. Res. 2005, 21, 688–703. [Google Scholar]
- Wheaton, J.M.; Brasington, J.; Darby, S.E.; Sear, D.A. Accounting for uncertainty in DEMs from repeat topographic surveys: Improved sediment budgets. Earth Surf. Proc. Land. 2010, 35, 136–156. [Google Scholar] [CrossRef]
- Duo, E.; Fabbri, S.; Grottoli, E.; Ciavola, P. Uncertainty of Drone-Derived DEMs and Significance of Detected Morphodynamics in Artificially Scraped Dunes. Remote Sens. 2021, 13, 1823. [Google Scholar] [CrossRef]
- Wehr, A.; Lohr, U. Airborne laser scanning—An introduction and overview. ISPRS J. Photogramm. Remote Sens. 1999, 54, 68–82. [Google Scholar] [CrossRef]
- Hladik, C.; Alber, M. Accuracy assessment and correction of a LIDAR derived salt marsh digital elevation model. Remote Sens. Environ. 2012, 121, 224–235. [Google Scholar] [CrossRef]
- Sallenger, A.H., Jr.; Krabill, W.B.; Swift, R.N.; Brock, J.; List, J.; Hansen, M.; Holman, R.A.; Manizade, S.; Sontag, J.; Meredith, A.; et al. Evaluation of Airborne Topographic Lidar for Quantifying Beach Change. J. Coast. Res. 2003, 19, 125–133. [Google Scholar]
- Arpae. Rapporto Idro-Meteo-Clima 2023; Regione Emilia-Romagna: Bologna, Italy, 2023; ISBN 978-88-87854-59-6. Available online: https://www.regione.emilia-romagna.it/urp/novita-editoriali/rapporto-idro-meteo-clima-2023 (accessed on 23 January 2025).
- Martzikos, N.T.; Prinos, P.E.; Memos, C.D.; Tsoukala, V.K. Statistical analysis of Mediterranean coastal storms. Oceanologia 2021, 63, 133–148. [Google Scholar] [CrossRef]
- Mendoza, E.T.; Jiménez, J.A. Factors Controlling Vulnerability to Storm Impacts Along the Catalonian Coast. Coast. Eng. 2005, 3087–3099. [Google Scholar] [CrossRef]
- Himmelstoss, E.A.; Henderson, R.E.; Farris, A.S.; Kratzmann, M.G.; Bartlett, M.K.; Ergul, A.; McAndrews, J.; Cibaj, R.; Zichichi, J.L.; Thieler, E.R. Digital Shoreline Analysis System; Version 6.0; U.S. Geological Survey: Reston, VA, USA, 2024. Available online: https://code.usgs.gov/cch/dsas/-/tree/v6.0.168 (accessed on 20 January 2025).
- Holman, R.A. Extreme value statistics for wave runup on a natural beach. Coast. Eng. 1986, 9, 527. [Google Scholar]
- Fernández-Montblanc, T.; Duo, E.; Ciavola, P. Dune reconstruction and revegetation as a potential measure to decrease coastal erosion and flooding under extreme storm conditions. Ocean Coast. Manag. 2020, 188, 105075. [Google Scholar] [CrossRef]
- Harley, M.D.; Valentini, A.; Armaroli, C.; Perini, L.; Calabrese, L.; Ciavola, P. Can an early warning system help minimize the impacts of coastal storms? A case study of the 2012 Halloween storm, Northern Italy. Nat. Hazards Earth Syst. Sci. 2016, 16, 209–222. [Google Scholar] [CrossRef]
- Ciavola, P. La morfodinamica della foce prima dell’intervento. In Foce Bevano: L’area Naturale Protetta e L’intervento di Salvaguardia; Marasmi, C., Ed.; Centro Stampa della Regione Emilia-Romagna: Bologna, Italy, 2009; Chapter 2.2; pp. 17–18. Available online: https://ambiente.regione.emilia-romagna.it/it/geologia/geologia/costa-e-mare/pdf/pubblicazione_bevano_LQ.pdf (accessed on 15 November 2024).
- Aagard, T.; Kroon, T. Decadal behaviour of a washover fan, Skallingen Denmark. Earth Surf. Process. Land. 2019, 44, 1755–1768. [Google Scholar] [CrossRef]
- Houser, C. Alongshore variation in the morphology of coastal dunes: Implications for storm response. Geomorphology 2013, 199, 48–61. [Google Scholar] [CrossRef]
- Ciavola, P.; Tondello, M.; Carniel, S.; Sclavo, M. Artificial deviation of a small inlet (Bevano, Northern Italy): Prediction of future evolution and planning of management strategies using open-source community coastal models. Coast. Eng. Proc. 2012, 1, 1–13. [Google Scholar] [CrossRef]
- Matias, A.; Ferreira, Ó.; Vila-Concejo, A.; Morris, B.; Dias, J. Short-term morphodynamics of non-storm overwash. Mar. Geo. 2010, 274, 69–84. [Google Scholar] [CrossRef]
- Feagin, R.A.; Furman, M.; Salgado, K.; Martinez, M.L.; Innocenti, R.A.; Eubanks, K.; Figlus, J.; Huff, T.P.; Sigren, J.; Silva, R. The role of beach and sand dune vegetation in mediating wave run up erosion. Estuar. Coast. Shelf Sci. 2019, 219, 97–106. [Google Scholar] [CrossRef]
- Grottoli, E.; Cilli, S.; Ciavola, P.; Armaroli, C. Sedimentation at River Mouths bounded by Coastal Structures: A Case Study along the Emilia-Romagna Coastline, Italy. J. Coast. Res. 2020, 95, 505–510. [Google Scholar] [CrossRef]
- Cilli, S.; Billi, P.; Schippa, L.; Grottoli, E.; Ciavola, P. Bedload transport and dune bedforms characteristics in sand-bed rivers supplying a retreating beach of the northern Adriatic Sea (Italy). J. Hydrol. Reg. 2021, 37, 100894. [Google Scholar] [CrossRef]
- Vittuari, L.; Speranza, M.; Ferroni, L.; Mandanici, E.; Pritoni, G. Evoluzione della copertura vegetale della duna ricostruita e sua relazione con le variazioni morfologiche superficiali. In Foce Bevano: Stato Dell’area Naturale Protetta e Prospettive per una sua Gestione Integrata E Sostenibile; Montanari, R., Marasmi, C., Eds.; Centro Stampa della Regione Emilia-Romagna: Bologna, Italy, 2013; Chapter 3.4; Available online: https://ambiente.regione.emilia-romagna.it/it/suolo-bacino/servizi/pubblicazioni/servizio-difesa-del-suolo-della-costa-e-bonifica/pdf/foce-bevano/@@download/file/Bevano%20-%20stato%20dell'area%20naturale%20protetta.pdf (accessed on 21 January 2025).
Disclaimer/Publisher’s Note: The statements, opinions and data contained in all publications are solely those of the individual author(s) and contributor(s) and not of MDPI and/or the editor(s). MDPI and/or the editor(s) disclaim responsibility for any injury to people or property resulting from any ideas, methods, instructions or products referred to in the content. |
© 2025 by the authors. Licensee MDPI, Basel, Switzerland. This article is an open access article distributed under the terms and conditions of the Creative Commons Attribution (CC BY) license (https://creativecommons.org/licenses/by/4.0/).