Article

Sentinel-2 Reveals Record-Breaking Po River Shrinking Due to Severe Drought in 2022

1
Institute of Environmental Geology and Geoengineering-National Research Council (CNR-IGAG), 00010 Montelibretti, Italy
2
Department of Environment, Land and Infrastracture Engineering, Politecnico di Torino, 10129 Torino, Italy
3
Regional Environmental Protection Agency (ARPA) Valle d’Aosta, Loc. La Maladière 48, 11020 Saint-Christophe, Italy
*
Author to whom correspondence should be addressed.
Remote Sens. 2025, 17(6), 1070; https://doi.org/10.3390/rs17061070
Submission received: 1 February 2025 / Revised: 12 March 2025 / Accepted: 14 March 2025 / Published: 18 March 2025
(This article belongs to the Special Issue Remote Sensing in Hydrometeorology and Natural Hazards)

Abstract

:
Monitoring inland waters is of critical importance for the effective and sustainable management of water resources, especially under climate change scenarios. This paper introduces a satellite-based approach for river monitoring using optical multispectral data. Time series of percentage water content, derived by the normalized difference water index (NDWI) calculated for each satellite acquisition, are aggregated at monthly timesteps to generate monthly water frequencies. Then, the river dynamics are evaluated by comparing each month with the previous one and with the average conditions of the same month in previous years. The ability of the method to investigate hydromorphological processes over time is demonstrated with the case study of the record-breaking Po River shrinking due to the severe 2022 drought in northern Italy, through the analysis of Copernicus Sentinel-2 satellite acquisitions. Earth observation data analysis is complemented with metrics generated from in situ river discharge measurements, including the coefficient of variation and the Streamflow Drought Index (SDI), to provide a more comprehensive understanding of the severity and variability of the hydrological drought throughout the year 2022. The findings demonstrate the satellite-based observation capabilities in monitoring surface waters, thereby stimulating the development of operational services like hydromorphological assessment.

Graphical Abstract

1. Introduction

Rivers are dynamic systems where abiotic and biotic elements interact across spatial and temporal scales [1]. They are fundamental in the global hydrological cycle and are crucial in providing essential goods and services to human society and ecosystems [2]. However, many rivers worldwide are heavily impacted by anthropogenic pressures, population growth, and climate change, leading to significant alterations in channel patterns and hydrology [3,4]. These alterations often result in a reduction in freshwater quality and quantity, further driven by extreme events. In Europe, projections suggest increased seasonality of river discharge and more intense summer droughts and heat waves, affecting the kinetics of solute, pollutant, and oxygen dissolution and precipitation, which in turn may degrade water quality and disrupt plant and fish habitats [5]. Variations in discharge also impact fluvial dynamics and sediment transport, impairing vegetation growth and influencing meander development and channel parameters (slope, width, depth, etc.), thereby modifying the morphology of river systems [6]. Therefore, quantifying the spatio-temporal variation in surface water bodies and monitoring hydromorphological processes are essential to understand river changes induced by climate change and human activity, and to manage the current and future water resources and land use, supporting effective biodiversity conservation and climate adaptation strategies [7,8].
Traditionally, river monitoring techniques have involved in situ observations and measurements, which are labor-intensive, costly, and often lack a uniform spatial distribution of measurement stations (e.g., gauges). Effective integrated river management requires methodologies that exploit near-real-time data over wide geographic areas for both long and short-term intervention planning, especially with the increasing frequency and intensity of extreme events (like floods and droughts) caused by climate change [9]. Consequently, there has been a shift to explore new and cost-effective approaches for targeted monitoring over longer periods, with more detailed explicit spatial information over large geographic areas. Satellite remote sensing has emerged as a promising solution for detecting surface waterbodies and delineating their changes [2,10], which is the most widely used technique to date for the morphological assessment of rivers [1]. Recent advances in approaches to remote sensing data analysis address the need for a global understanding of the physical river hydromorphological processes [11]. Satellite imagery has been used to monitor drought impacts on surface water resources in specific regions, enabling improved water resource management, drought detection, and preparedness efforts in resource-limited environments [12].
The implementation of the EU Water Framework Directive, which mandates the classification of water bodies’ hydrological and morphological conditions, has stimulated the development of new cross-disciplinary methods [13,14]. For example, satellite remote sensing data are integrated with numerical models to fill gaps when data series are incomplete, generating indices and maps that facilitate the characterization of rivers in response to natural or anthropogenic pressures and climate change [14]. Recent years have seen an increase in inland water Earth observation products, which provide valuable information at the global level, including remote and hazardous areas [15]. Indeed, numerous national and international initiatives, such as the International Precipitation Working Group (IPWG), NASA Energy and Water Cycle Study (NEWS), European Union Water and Global Change (WATCH), the Global Energy and Water Exchanges (GEWEX 2018) initiative, the EU Copernicus Programme, the Copernicus Italian IRIDE program (part of the Copernicus Mirror Programme), have been developed over the years to improve the hydromorphological monitoring [16,17]. Italian National Institute for Environmental Protection and Research (ISPRA) developed the IDRAIM methodology based on an integration of remote sensing, GIS, and field surveys for the hydromorphological quality assessment of Italian streams [18].
Mapping surface water bodies from remote sensing data includes several approaches suitable for different specific objectives, scales (local, regional, or global), and sensor characteristics [19,20,21]. Methodologies to detect water pixels from synthetic aperture radar and optical imagery include supervised and unsupervised classification [22], water index thresholding [23], object segmentation [24], spectral mixture analysis (SMA) [20,25], multidimensional hierarchical clustering [21], and deep learning [26]. A wide number of supervised machine learning models used for water mapping are available in the literature, including methods like decision trees [27], support vector machines [28], random forests [29], multilayer perceptron [30], and convolutional neural networks [31].
Detecting water from optical imagery is more straightforward than using synthetic aperture radar, although the latter has the advantage that it is not affected by cloud or weather conditions and can detect water through a thin canopy. For automatic water detection, the most commonly used methodologies include pre-trained machine learning algorithms, while the majority of developed methods rely on thresholding in one or more spectral bands or water-related spectral indices [26]. While supervised machine learning models are preferable over thresholding for accurate results, they might not be the best option when multiple sites at a global scale are addressed [32]. This is due to different water constituents (sediments, organic dissolved matter, and chlorophyll) and atmospheric conditions at different sites, other than their dependency on the training data [21].
Remote sensing optical multispectral imagery at high and very-high spatial resolution, acquired with high revisit frequency, has great potential for monitoring small surface water bodies and water dynamics [10]. Water, vegetation, and bare ground represent the most common cover types of Earth’s surface, reflecting solar radiation differently in various wavelengths. Water only reflects in the visible spectral wavelengths and has almost no reflection in the near-infrared range, making it very distinct from other surfaces. Water pixels will, therefore, be clearly detected from low reflectance values in the near-infrared range. Various spectral indices, such as normalized difference water index (NDWI), modified NDWI (MNDWI), multispectral water index (WuWI), automated water extraction index (AWEI), normalized difference moisture index (NDMI), and simple water index (SWI) have been designed to classify water pixels from remote sensing optical multispectral data.
Although remote sensing provides a comprehensive database for hydrological monitoring, the utilization of satellite images necessitates the input of specialist expertise and a specific analytical approach (e.g., GIS analysis and data processing), in addition to high spatial and temporal resolution [14]. Moreover, integrating near-real-time observation with hydrological and meteorological models enables the description of hydromorphological dynamics, weather-climate-induced variations, and permanent transformations associated with extreme events [10].
The majority of developed methods rely on thresholding in one or more spectral bands or water-related spectral indices [26] to identify water pixels. The pixel classification approach, however, does not take into account the gradient of water coverage in the subpixel, reducing the percentage of water content in the pixel to a water/non-water pixel. Keeping the information about percentage water content (PWC) in pixels is a requirement for a more detailed quantitative assessment of hydromorphological processes at the metric scale when working on data with a spatial resolution of a few meters. In fact, during a drought, the variation in flow rate shows a reduction in riverbed width, which results in a gradually decreasing PWC in riverbank pixels due to changes in the proportions of subpixel water and non-water components. Another advantageous feature is the possibility of using virtual constellations of satellites to increase the temporal revisit and consequently increase the monitoring capacity [33]. In recent years, the availability of a wide number of small satellites mounting low-cost optical multispectral sensors, even if equipped with a spectral configuration, not including some radiometric intervals, opened the way to the characterization of slightly wide or highly branched riverbeds.
For these reasons, the objective of this study is to present a simple but effective and portable approach for the monitoring of river hydromorphology through remote sensing time series analysis. Simple, because it makes use of a fuzzy transform function on a single spectral index; effective, because it takes into account the gradient of water cover, expressed as the percentage of water content in the pixel, and exploits dense time series; and portable, because the selected spectral index is calculated on the spectral bands available in most multispectral optical sensors. It is based on the extraction of PWC from satellite optical data and the use of relative metrics, which can be applied to a variety of high and very-high-resolution optical multispectral sensors and different geographic sites. The effectiveness of the methodology is demonstrated in the case study of the Po River shrinking during the record-breaking drought of year 2022, through the use of open-access Copernicus Sentinel-2 satellite data.

2. Materials and Methods
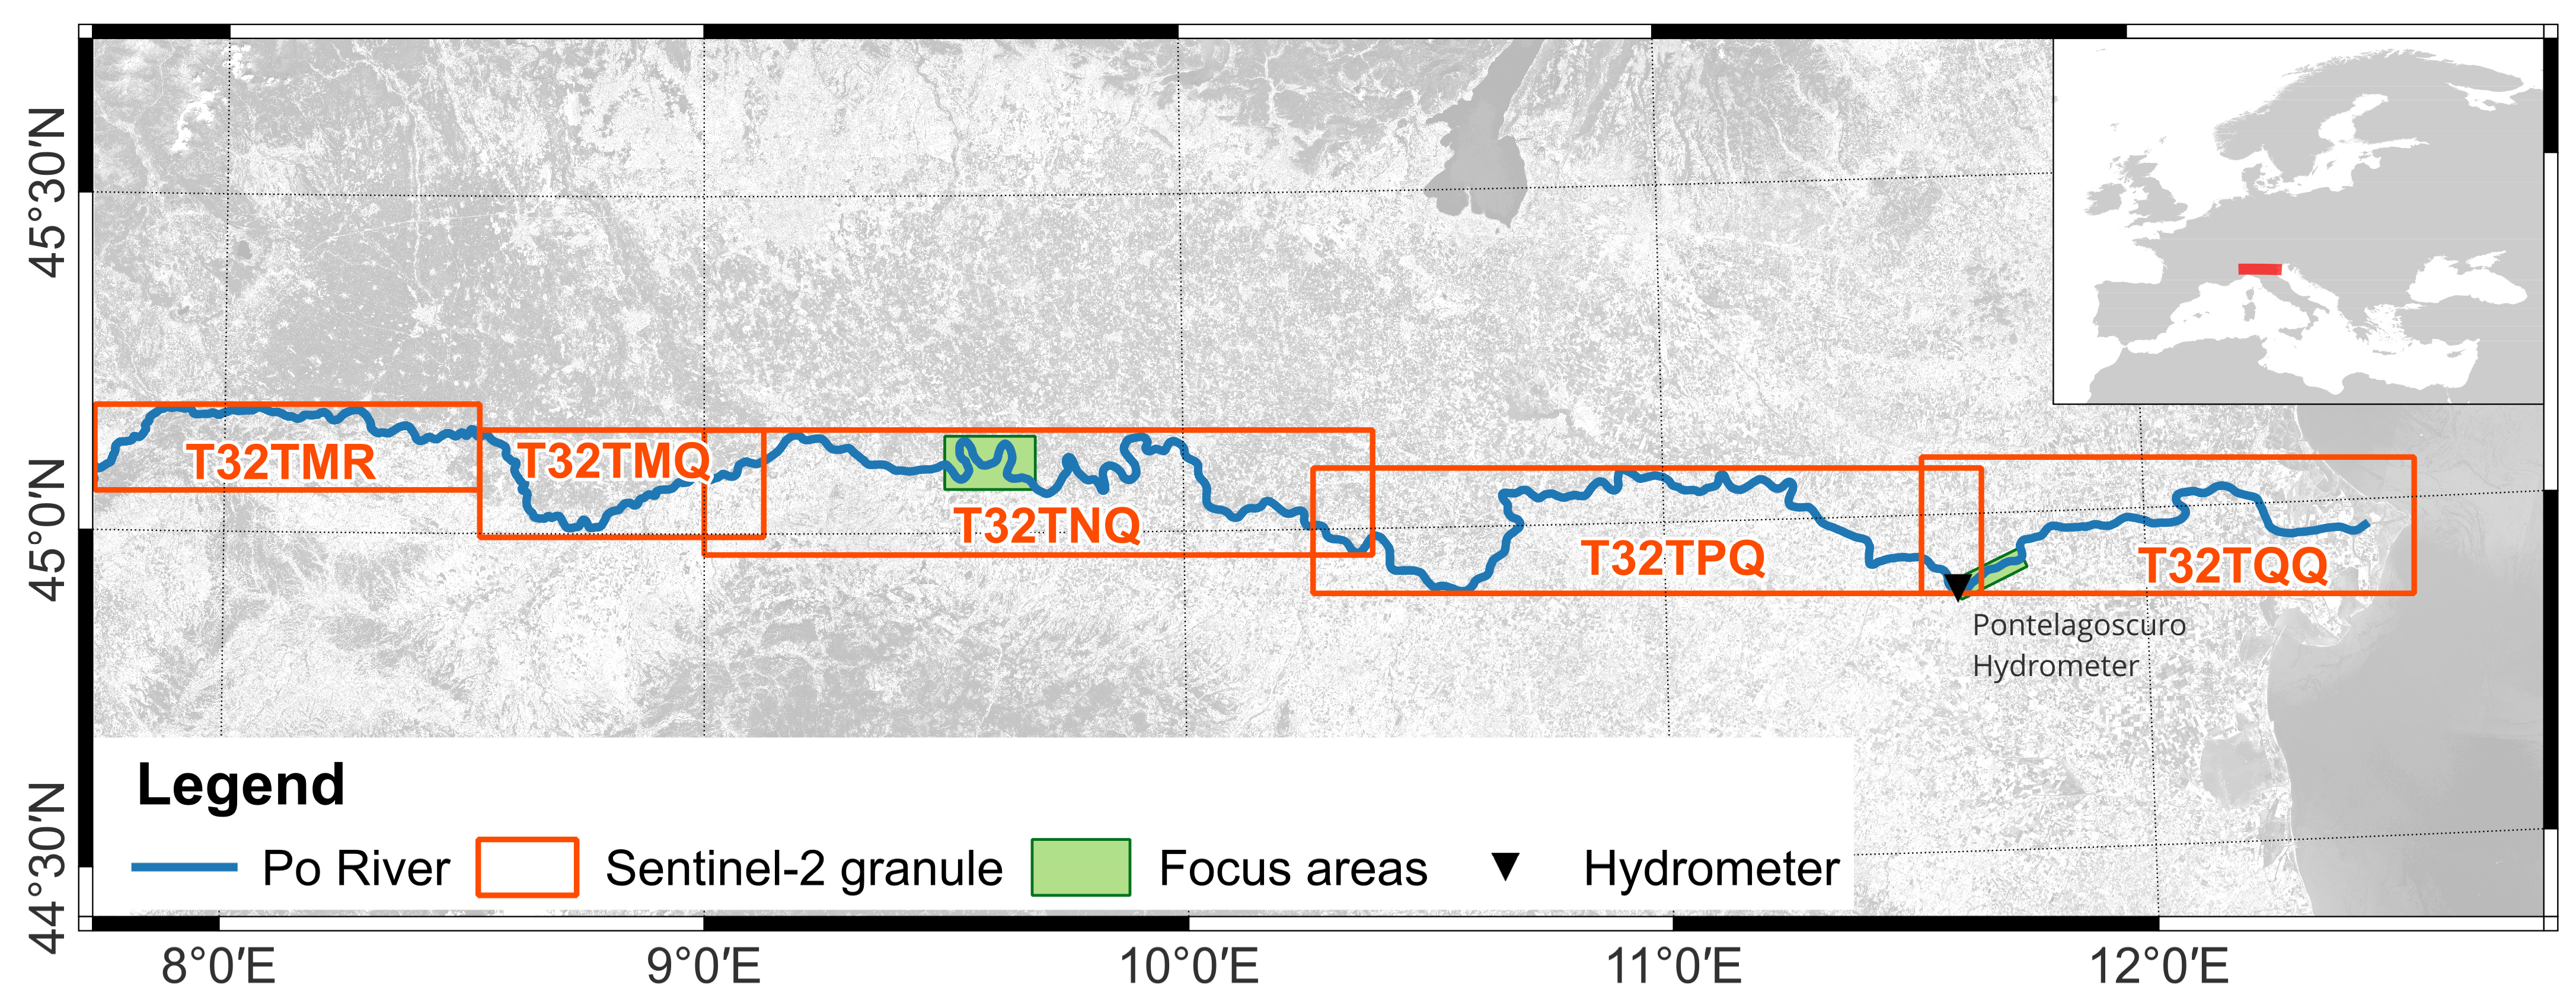
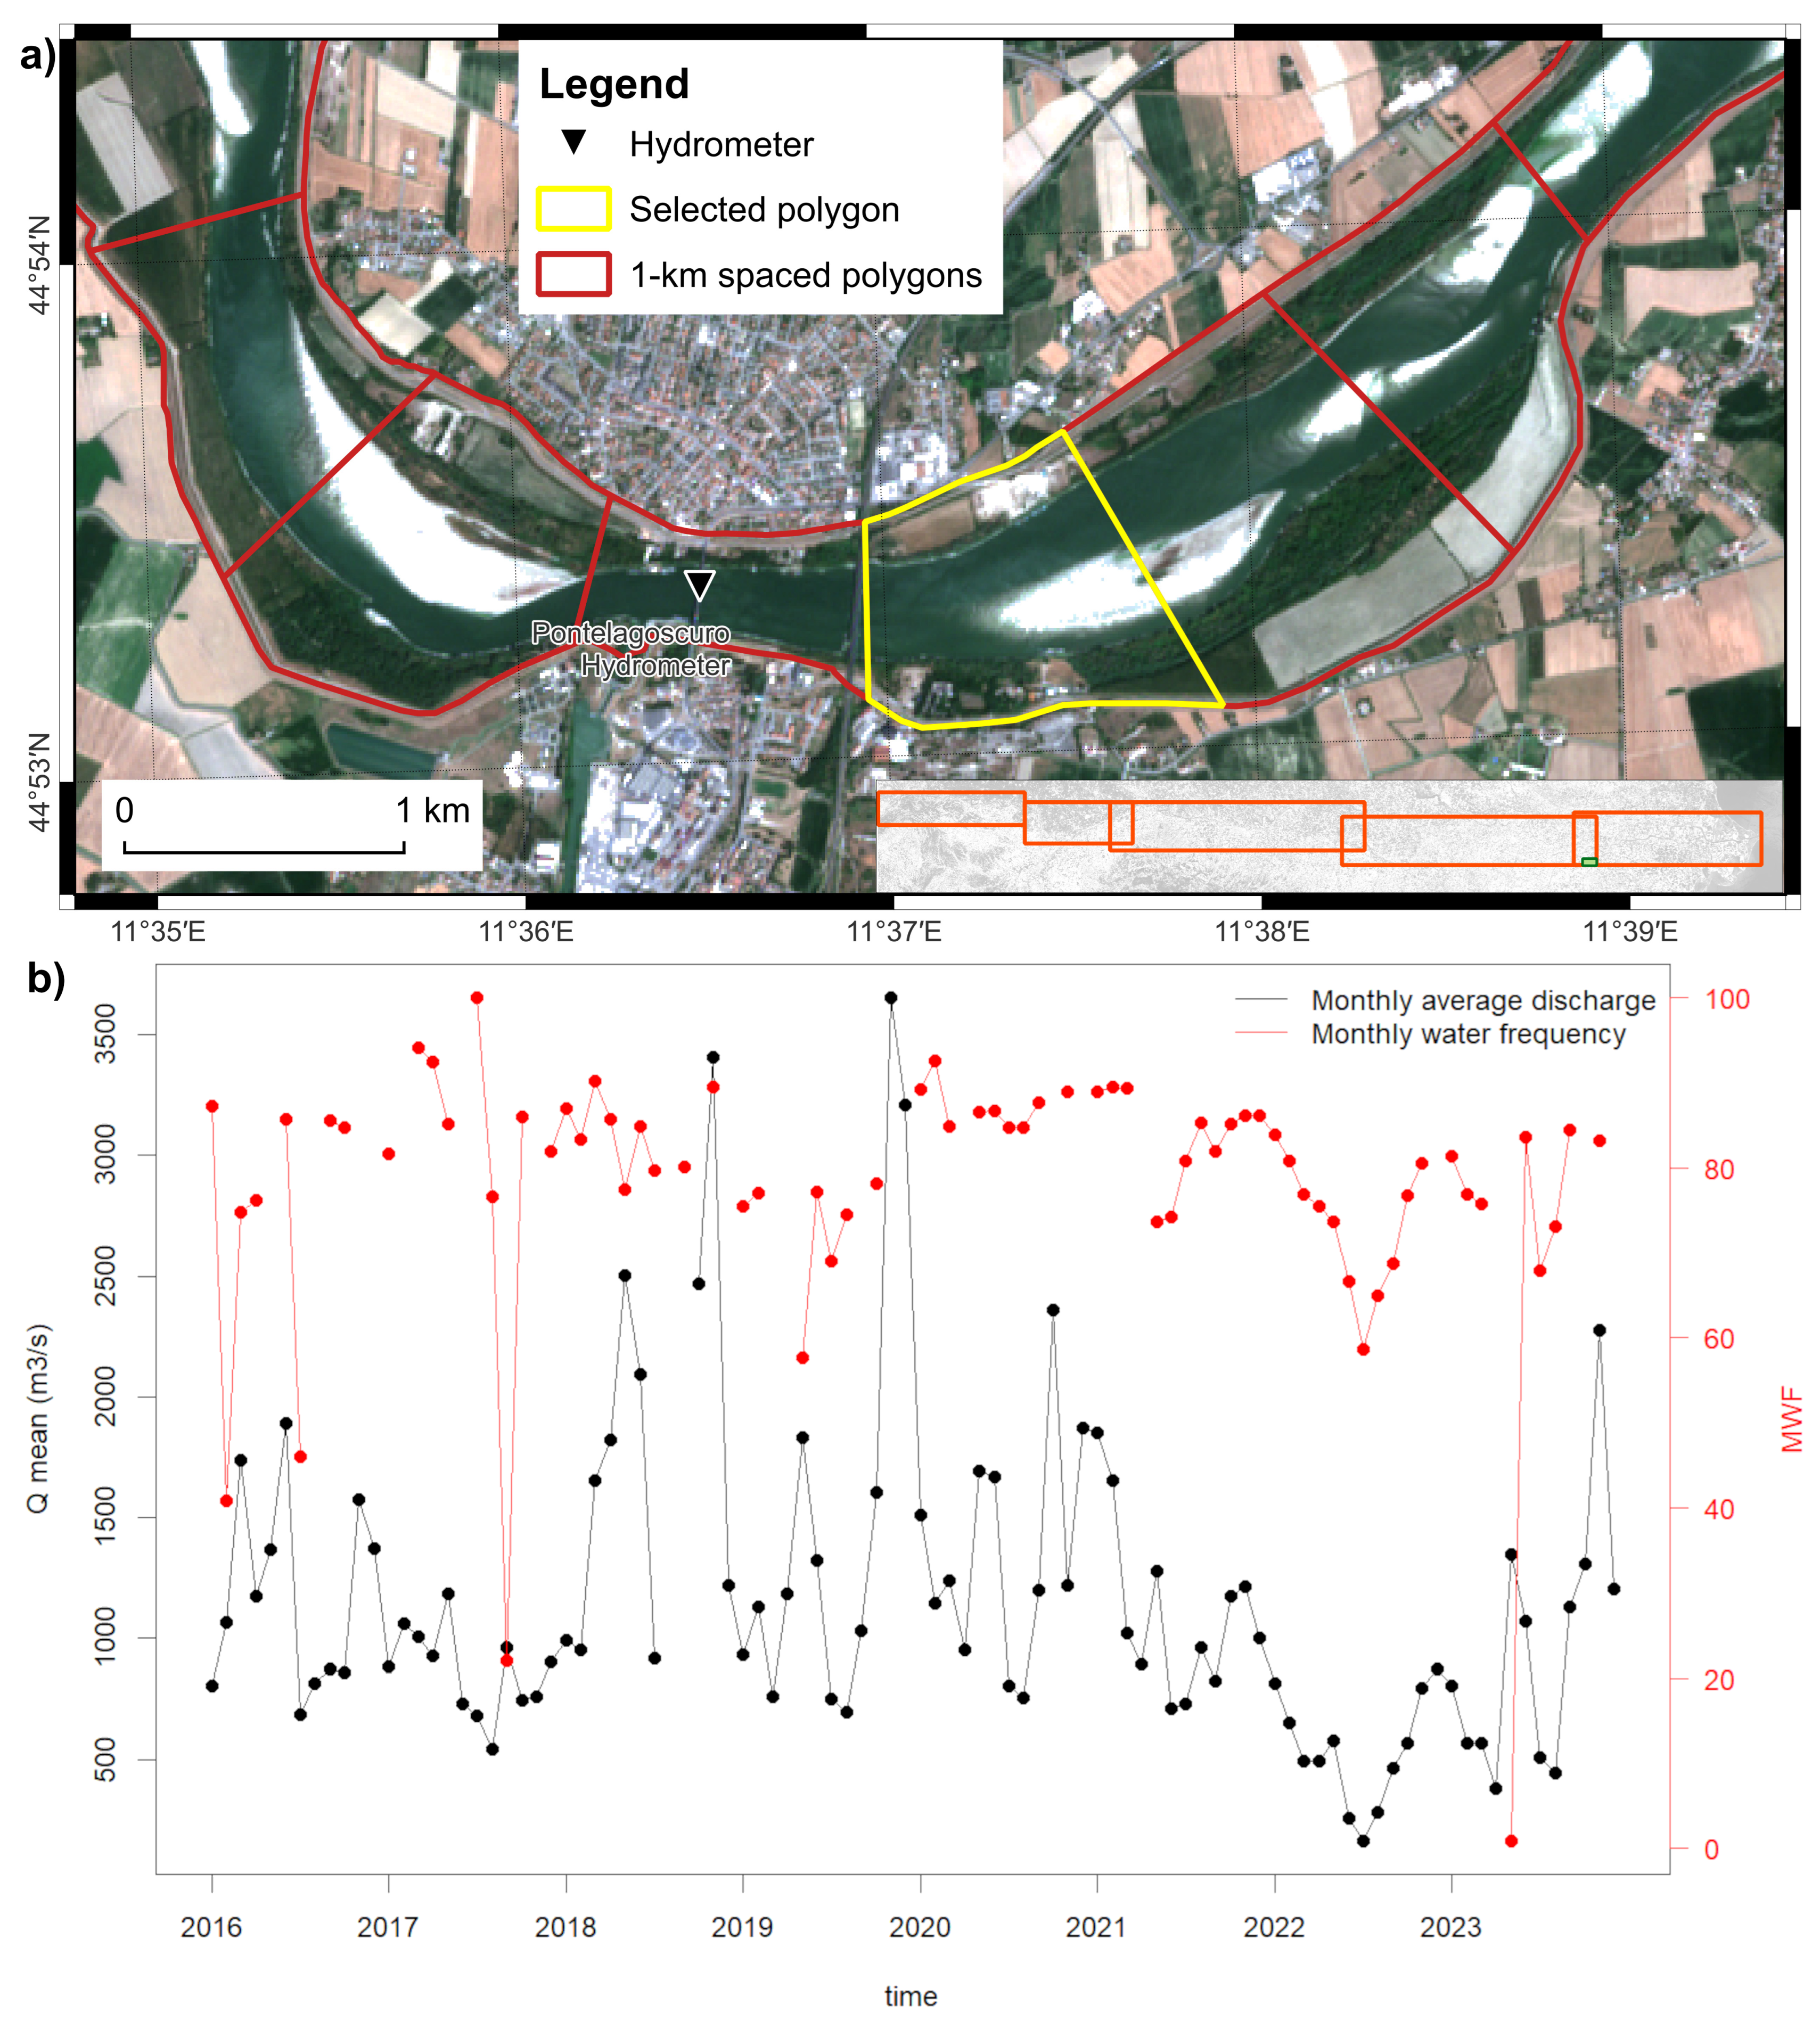
2.1. Study Area

The Po River, the longest river in Italy, flows for approximately 652 km from the Monviso mountain in the Cottian Alps, to its delta in the Adriatic Sea. The Po basin covers approximately 74,000 km2, counting 141 main tributaries and 31,000 km of natural and artificial channels, crossing seven Italian regions and a diverse range of geomorphological features, including mountains, hills, and plains [34]. According to the hydrometer located in Pontelagoscuro, considered as a reference for the Po River watershed [35], during the period 1923–2006 the mean recorded annual discharge was 1500 m3/s, with a maximum observed peak flow of 10,300 m3/s in 1951 and a minimum observed flow of 168 m3/s in July 2006 [34,36]. The Po River hydrology is characterized by a mixed regime: Alps mountain streams are dominated by snowmelt, with seasonal peak flows in spring and early summer; the Apennine streams are dominated by rainfall, showing a minimum seasonal flow during the summer. The hydrological behavior is influenced by various tributaries, such as the Dora Baltea, Ticino, and Adda rivers, which play crucial roles in sustaining its flow and impacting its overall water balance [35,37]. Po River watershed represents one of the most densely populated, cultivated, and highly developed areas in Europe, which results in high water demand for many purposes including irrigation, hydro-power production, and civil and industrial uses [34,35]. As a result of the intense human activity, the morphology and the hydrology of the River Po have been significantly modified over time. Historically, the river had irregular, meandering channels formed by natural processes, with discontinuous embankments and minimal bank protection. However, extensive land use changes have led to the artificial straightening of its channels [36]. Agriculture dominates land use in the Po basin, contributing to 46% of Italy’s total agricultural production [35]. To support this, an extensive network of artificial canals has been developed for irrigation. Currently, 80% of the irrigation water is withdrawn from surface water sources, amounting to approximately 16.5 billion m3 per year, while the remaining 20% is extracted from aquifers [38]. Additionally, nearly 5 billion m3 per year are withdrawn for industrial and civil uses. These water extractions, combined with evapotranspiration, significantly reduce available water, resulting in only about 60% of the total annual inflow being converted into discharge [36].
Climate change has intensified these challenges. Rising temperatures and decreasing precipitation have led to increased dryness, reducing surface runoff and intensifying seasonal flow variability. The combined effects of long-term water resource exploitation and climate change have made this region particularly vulnerable to both floods and droughts, placing growing pressure on all economic activities [39].
Furthermore, from an ecological perspective, the delta of the Po River is one of the most significant in the Mediterranean Sea for its substantial biodiversity, with the presence of 460 vertebrates and more than 1000 plant species [34,40]. However, increasing hydrological instability threatens this ecosystem, jeopardizing habitats and species dependent on the river’s natural dynamics. As a result, a robust monitoring system and sustainable management strategies are urgently needed to protect the Po River ecosystem and prevent conflicts over water resource access, ultimately fostering long-term resilience and sustainability [39].
Figure 1 shows the study area, which encompasses the Po River from the city of Turin (about 535 km from the river mouth) to the delta on the Adriatic Sea.
In 2022, Europe experienced a severe meteorological drought, characterized by record-low precipitations and high temperatures. This led to an intensified hydrological drought, endangering the security of water resources and the stability of riverine ecosystems. In northern Italy, the Po River discharge was significantly reduced by the drought, which severely impacted the agricultural and energy sectors. The reduction in the water available for irrigation, the seawater intrusion, and the low flows affected food and energy production throughout the year [35,41]. The mean flow during this period was about 30% lower than the second-lowest flow recorded in the past two centuries, observed in the summer of 2006 [38].
According to the 2023 ISPRA National Hydrological Balance Report, the Po River watershed experienced a 36% precipitation deficit, with 650.2 mm in 2022, compared with the long-term average annual precipitation of 1015.7 mm [38,42]. Additionally, warmer temperatures induced a decline in snow precipitation with a consequent reduction in snowmelt contribution to the annual stream flow. The increase in temperature also resulted in enhanced evapotranspiration, which amplified the runoff deficit and shifted the timing of spring river flow. This led to an anticipated higher water demand, particularly for irrigation [9,38]. These factors collectively reduced the average flow rate of many rivers, leading to the record-breaking drought event selected in this study for testing the effectiveness of the proposed methodology.

2.2. Discharge Analysis

The level of the Po River has been gauged at various stations since the beginning of the 19th century. In this study, the daily flow dataset from 1961 to 2023 measured by the Pontelagoscuro hydrometer (located 83 km from the river mouth, see Figure 1) has been analyzed. Po River discharge data were collected from https://simc.arpae.it/dext3r/ (accessed on 11 September 2024). The average monthly runoff was calculated for each year, and then two different indices were quantified on a monthly basis to detect anomalies in Po River runoff: the coefficient of variation (CV) and the Streamflow Drought Index (SDI) [43].
For each month, CV was calculated to assess the variability of river discharge during the considered year according to Equation (1).
C V t = σ t μ t
where t is the considered year, σt is the standard deviation of the considered year, and μt is the average discharge of the considered year.
SDI was computed using the same approach as the Standardized Precipitation Index (SPI), which is commonly used for the detection of meteorological droughts [44]. SDI, defined in terms of discharge, was calculated for the period from 1961 to 2022 to quantify the intensity and duration of the hydrological drought by comparing runoff anomalies to historical averages. For each month, the discharge data were fitted to a long-term reference period (1961–2021) to determine the mean and standard deviation. These values were then used to standardize the discharge (Equation (2)), resulting in monthly SDI values.
S D I t = X i , t μ i t 0 , t 1 / σ i , t 0 , t 1
where Xi,t is the mean monthly discharge over the considered year t, and  μ i t 0 , t 1  and  σ i , t 0 , t 1  are, respectively, the monthly discharge average and the monthly standard deviation of a multi-year time series, corresponding to the reference period. The SDI values were then used to classify the wet and drought periods according to Table 1 [43]. A positive SDI value typically outlines conditions that are wetter than average, whereas values around zero indicate conditions that are at the median level. Conversely, negative SDI values are indicative of drier-than-average conditions [43,44].
Considering the analyzed case study and the available discharge dataset, the following time periods were used to calculate CV and SDI: t = 2022; t−1 = 2021; and t0 = 1961.

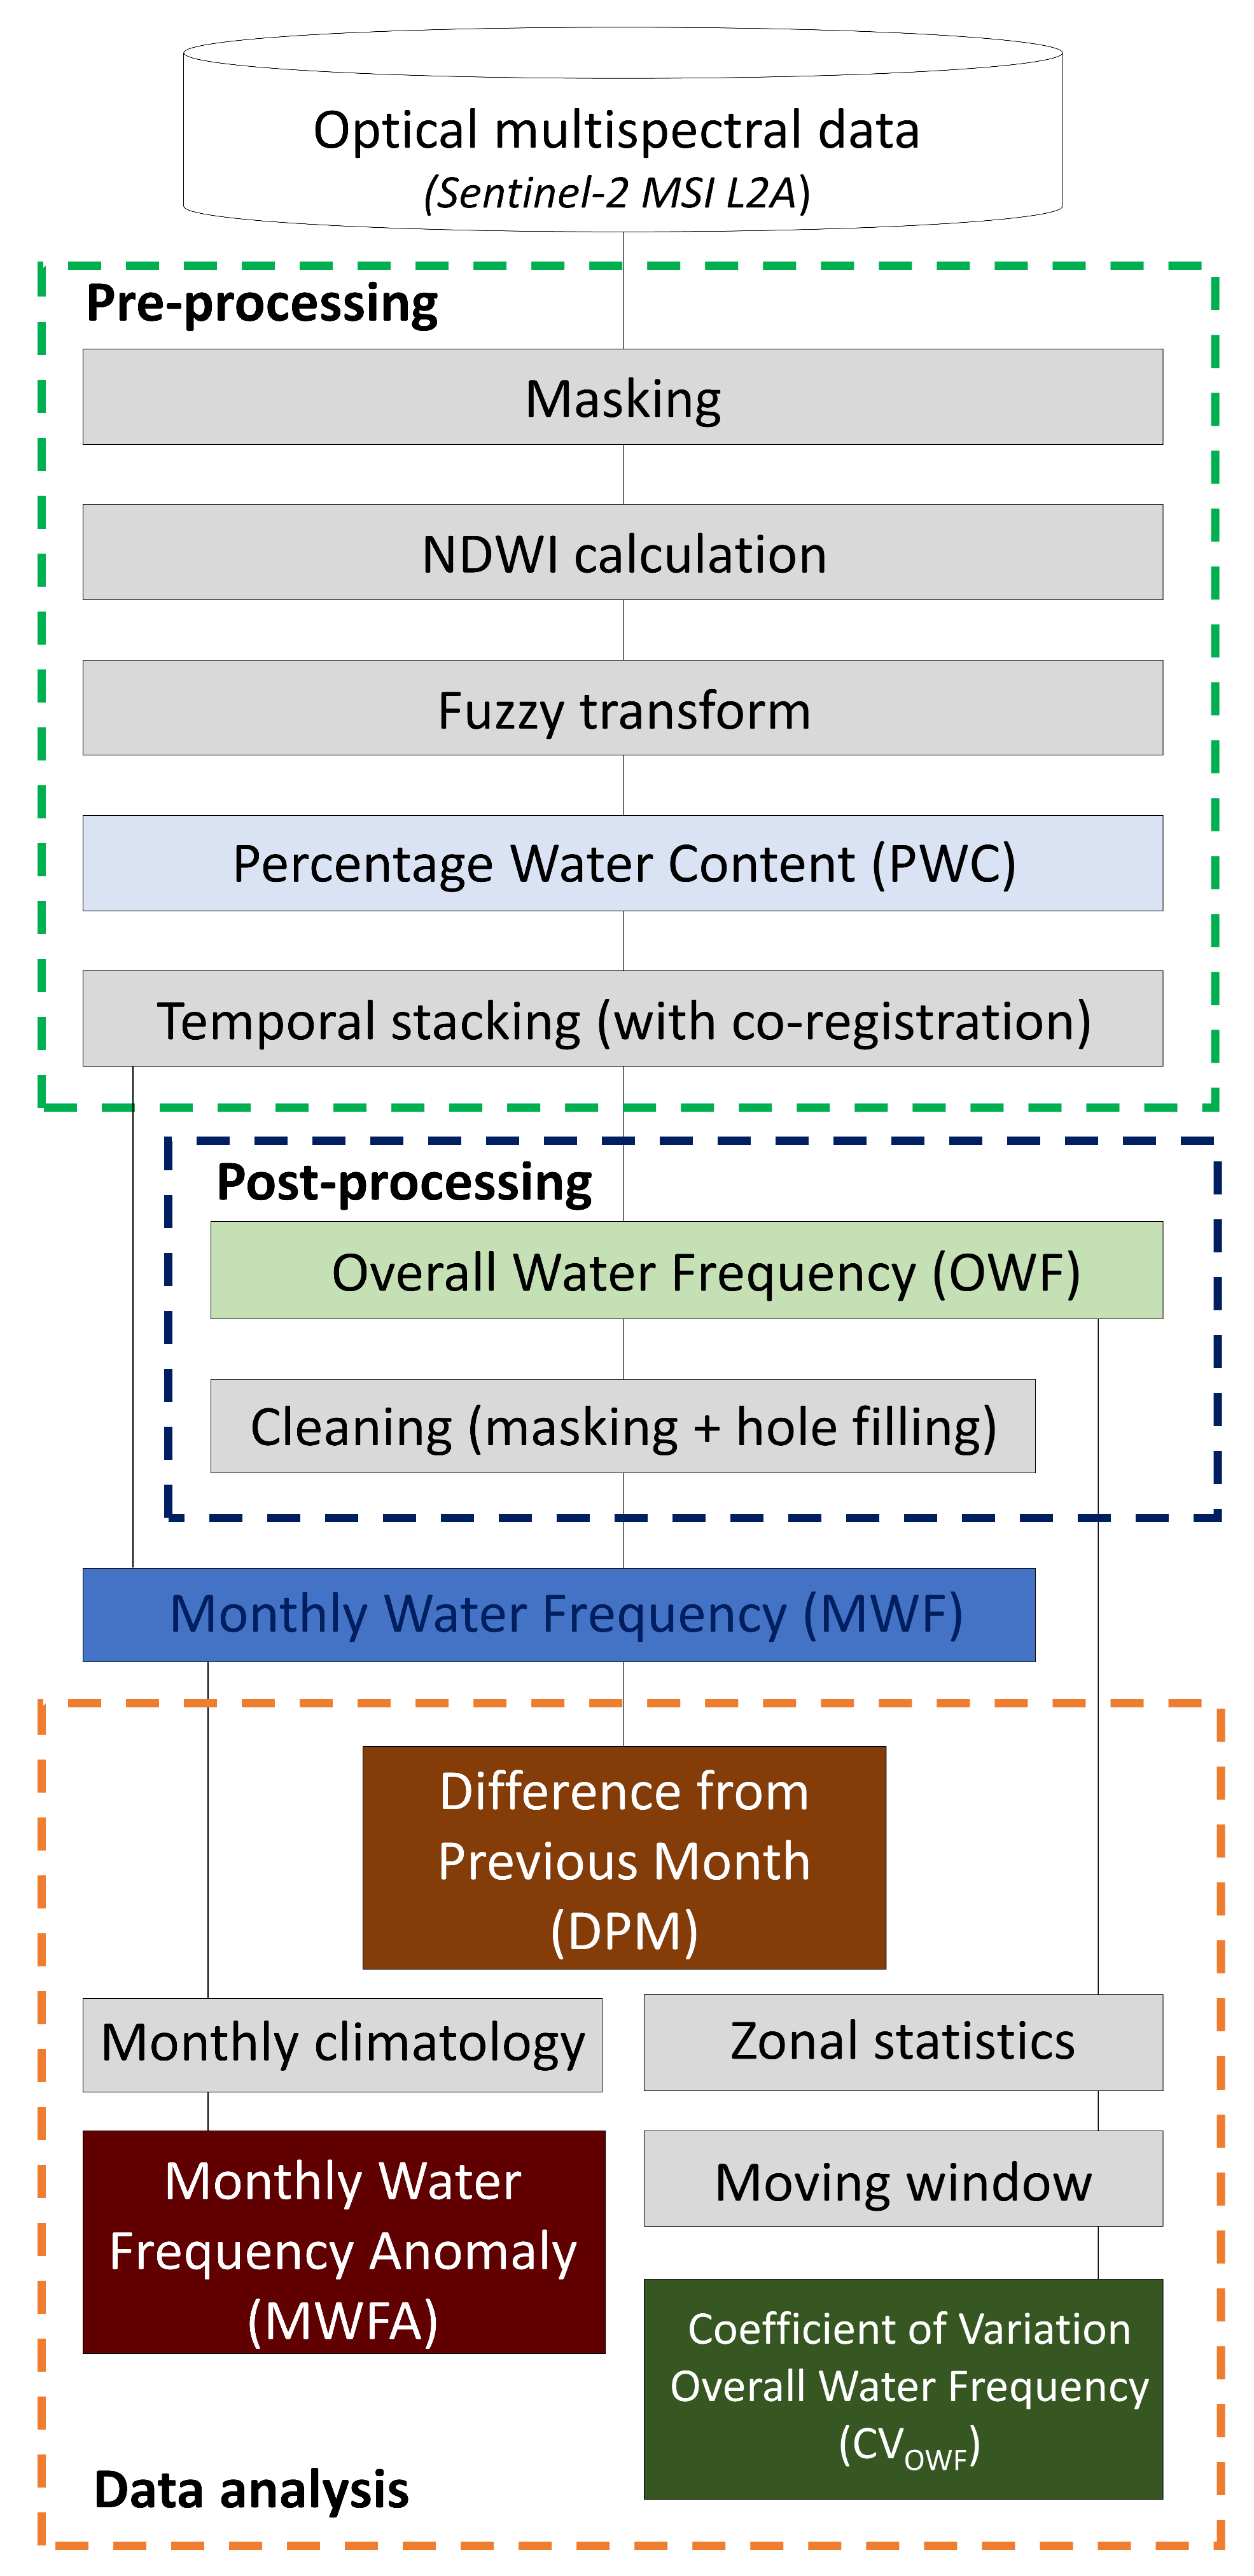
2.3. Remote Sensing Data Processing

Time series of the satellite imagery acquired by MultiSpectral Instrument (MSI) onboard Copernicus Sentinel-2 satellites constellation, consisting of a set of 13 spectral bands in the visible, near-infrared, and short-wave infrared radiometric intervals at 10, 20, and 60 m spatial resolution, were collected and analyzed. Specifically, all the Sentinel-2 MSI satellite acquisitions processed at level L2A for the period 2016–2023 with cloud cover lower than 90% were collected for the entire study area, for a total of around 2700 images distributed in 5 tiles (Figure 1).
For each satellite acquisition dataset, the provided raster masks corresponding to clouds, cloud shadows, and snow were used to identify and remove bad pixels from further analysis. Normalized difference water index (NDWI) was calculated from masked surface reflectance spectral bands in the green (B3) and near-infrared (nir) spectral intervals (B8) at 10 m spatial resolution according to Equation (3) [45].
N D W I = g r e e n n i r / g r e e n + n i r
Percentage water content (PWC) in each pixel was calculated from NDWI using a fuzzy transform with the following rules: PWC = 0 for NDWI ≤ 0; PWC = 1000.0 × NDWI for NDWI > 0 and NDWI ≤ 1; PWC = 100 for NDWI > 1. Thresholds were identified by expert operators’ visual inspection on 250 NDWI transects perpendicular to riverbanks.
S2SDB Database [46], freely accessible from the open access data repository available at link https://github.com/ffilipponi/S2SDB (accessed on 11 September 2024), generated using of AROSICS algorithm [47] for operational image co-registration, was used to spatially co-register PWC time series, in order to deal with weak spatial coherence of Sentinel-2 MSI time series [48]. Co-registered PWC time series were stacked in large multidimensional datacubes, one for each Sentinel-2 granule, and spatially sub-set to the study area.
Monthly water frequency (MWF) was calculated as the monthly average of PWC for a total of 96 months in the period 2016–2023. River shrinking analysis was based on the monthly water frequency anomaly (MWFA), which is the difference of each month from the average values of the same month calculated from a multi-year time series, and the difference from the previous month (DPM), calculated as the difference between MWF and the MWF of the previous month. MWFAs were calculated for the years 2021–2023 with respect to the monthly climatology, identified in the previous period 2016–2020. Furthermore, overall water frequency (OWF), which is the average water frequency, was calculated for the entire considered period 2016–2023.
The MWFs of June, July, August, and September of a given year were compared against all the remaining years by means of t-tests (e.g., July 2022 MWF was tested against July MWFs of the remaining years). The analysis was conducted for each 1 km slice separately (n = 479). For each month and year, the number of significant t-tests (p < 0.05), under the alternative hypothesis that the MWF of the given year was lower than that of the remaining years, was computed.
The boundary area potentially subjected to a 200 yr return period flood is referred to as “Fascia A” and represents an administrative layer for the Po Basin Authority (data available at https://webgis.adbpo.it/catalogue/#/map/1664 (accessed on 24 July 2024). Within this area, the spatial domain of the analysis was determined based on OWF for the complete time series (2016–2023). Pixels with an OWF higher than or equal to 5% were considered as belonging to the riverbed under normal conditions. The 5% mask was then polygonized, and holes were filled in a GIS environment. The resulting polygon was cut into 1 km long slices, and for each slice the mean of all OWF pixel values was calculated, resulting in a time series of spatially averaged OWF for each slice. The coefficient of variation of the OWF (CVOWF) was calculated as:
C V O W F = σ 2 O W F / μ O W F
where σ2OWF is the variance of overall water frequency and µOWF is the average of overall water frequency. To reduce the noise of CVOWF data, the analysis was performed on a 10 km moving average along the distance from the river mouth.
Figure 2 presents a summary of the main phases of the pre- and post-processing of satellite data applied to monitor river shrinking.
Two focus areas along the Po River were selected for presenting the key results of this study based on the following: the intensity of the anomalies (MWFAs) observed (as high-intensity anomalies facilitate a more comprehensive understanding of the variation and impact of the drought within the regions); the absence of artifacts, such as cloudiness (essential for obtaining accurate and unobstructed observations, which in turn ensures data quality and integrity); and, the existence of extensive riverbeds and breaching areas (crucial for comprehending the dynamics of river flow and the interconnectivity of diverse hydrological systems).

3. Results

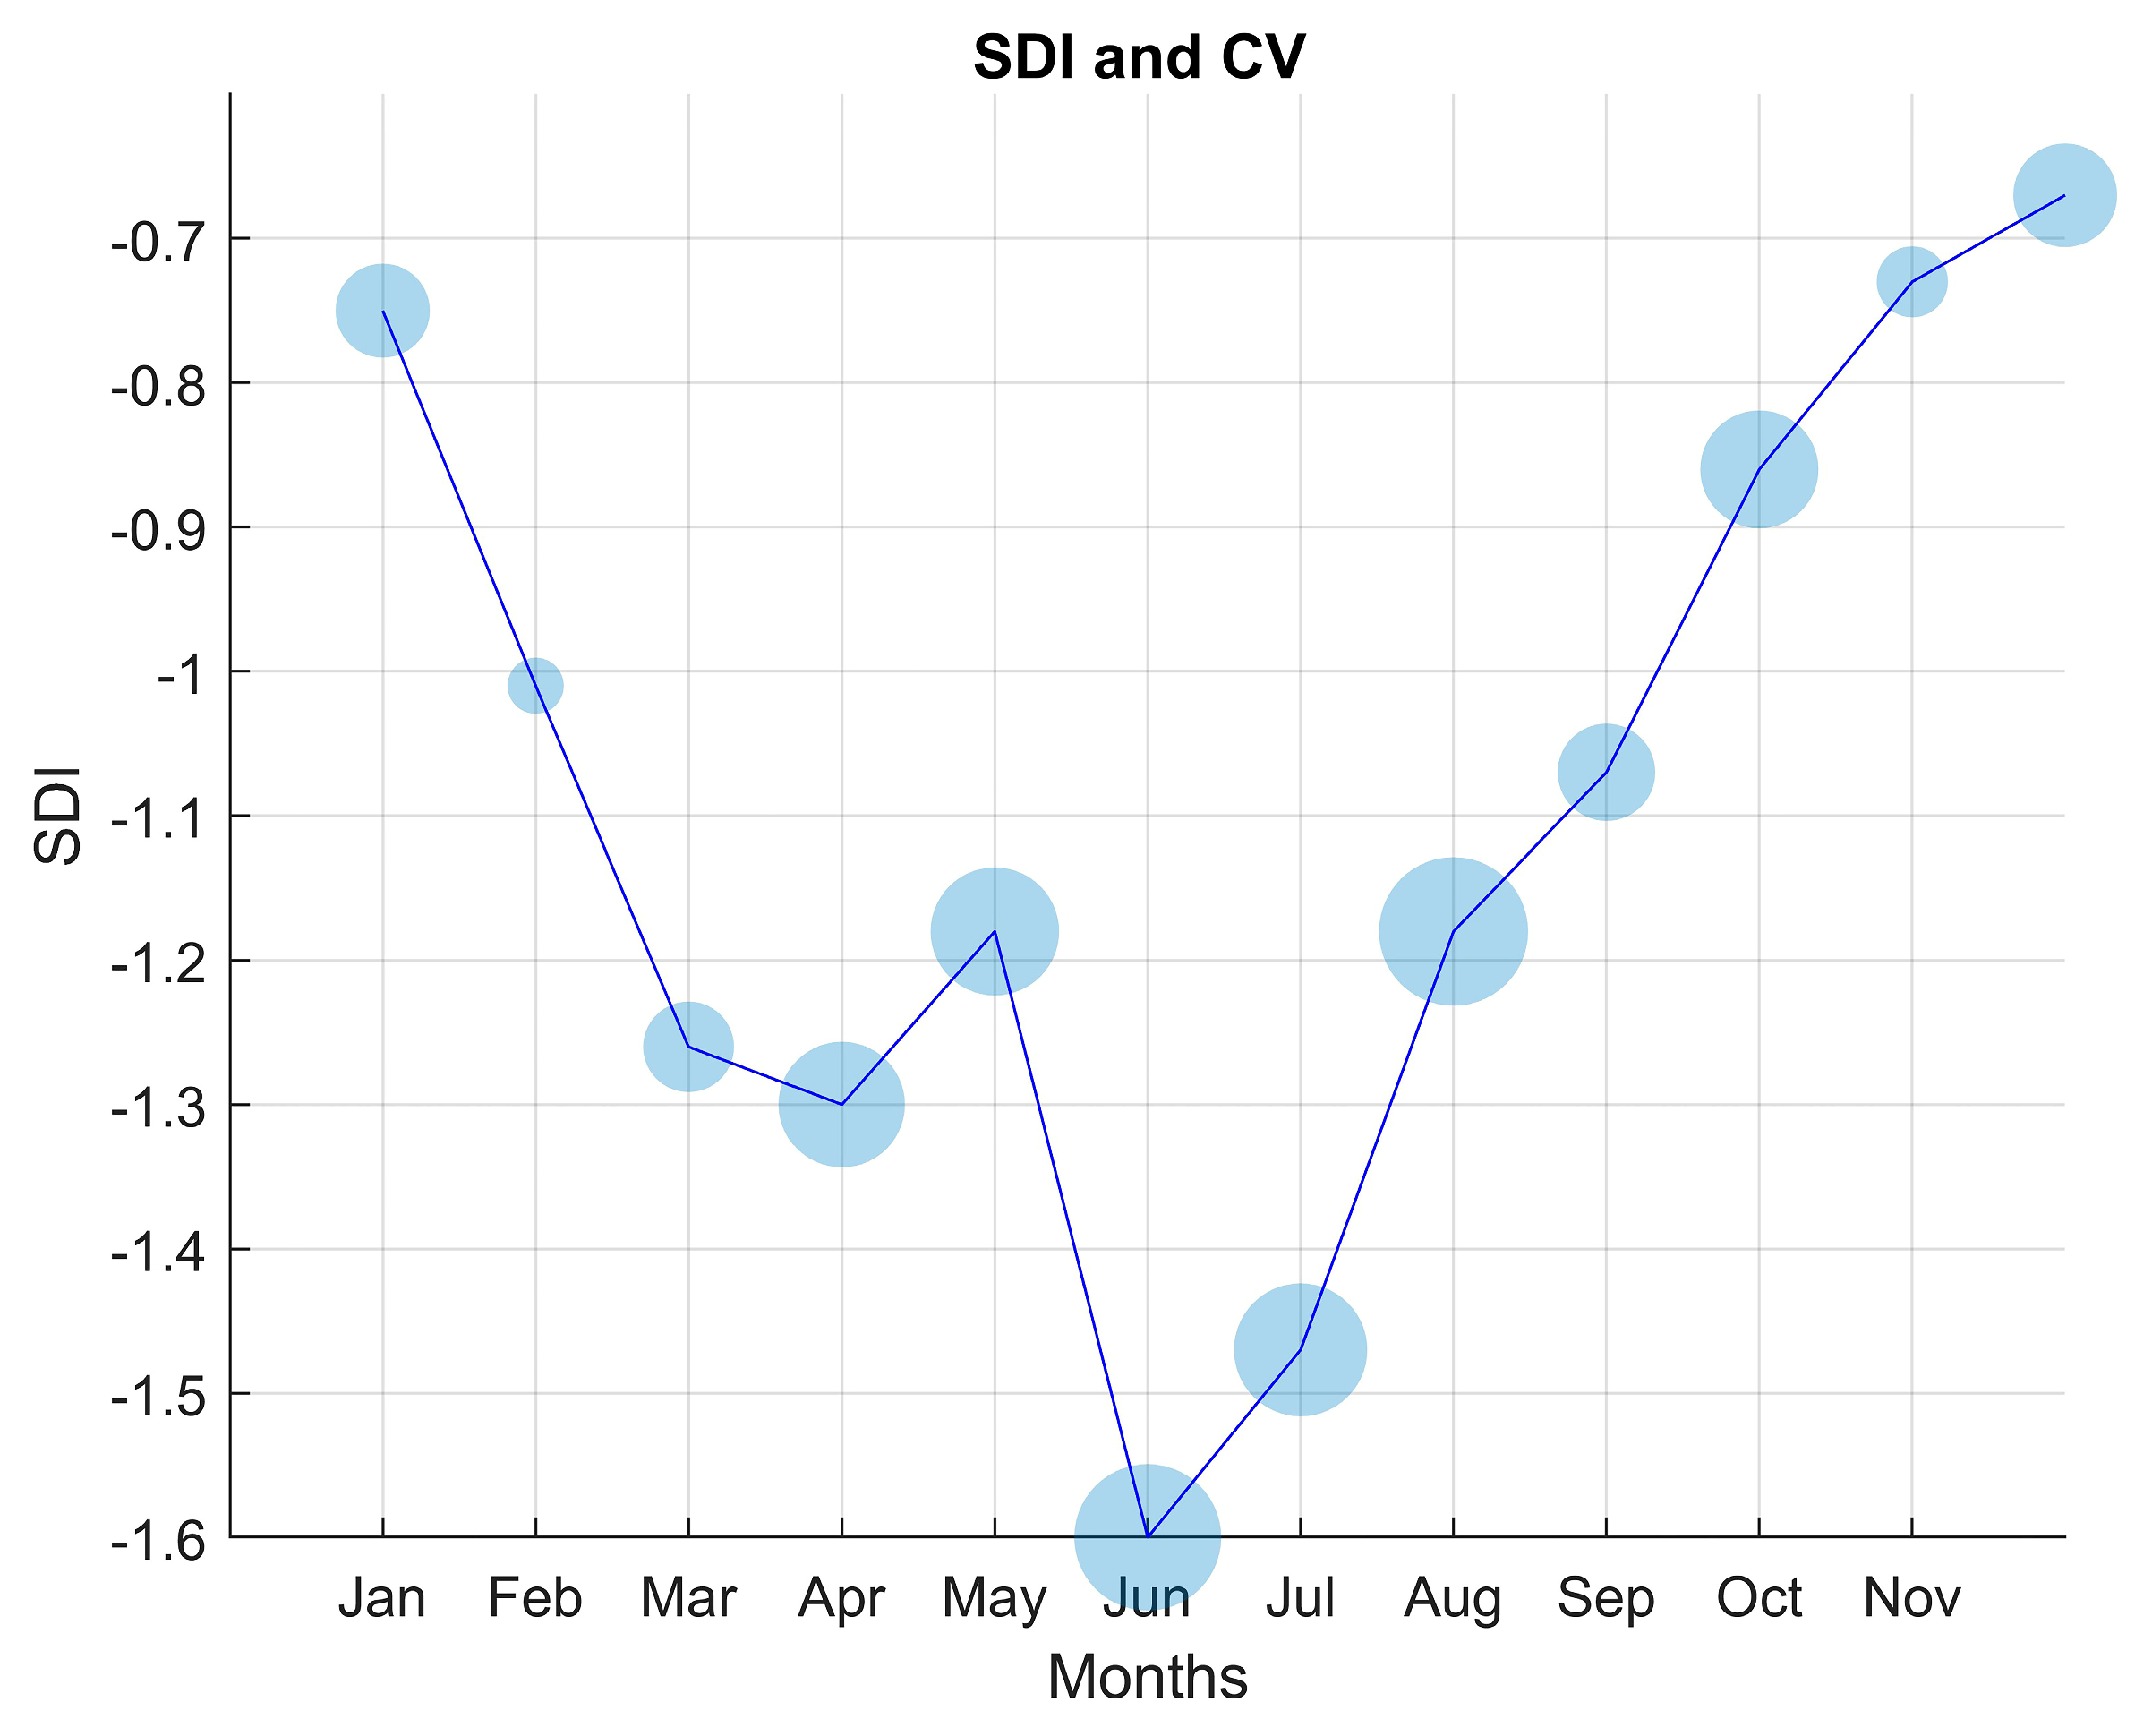
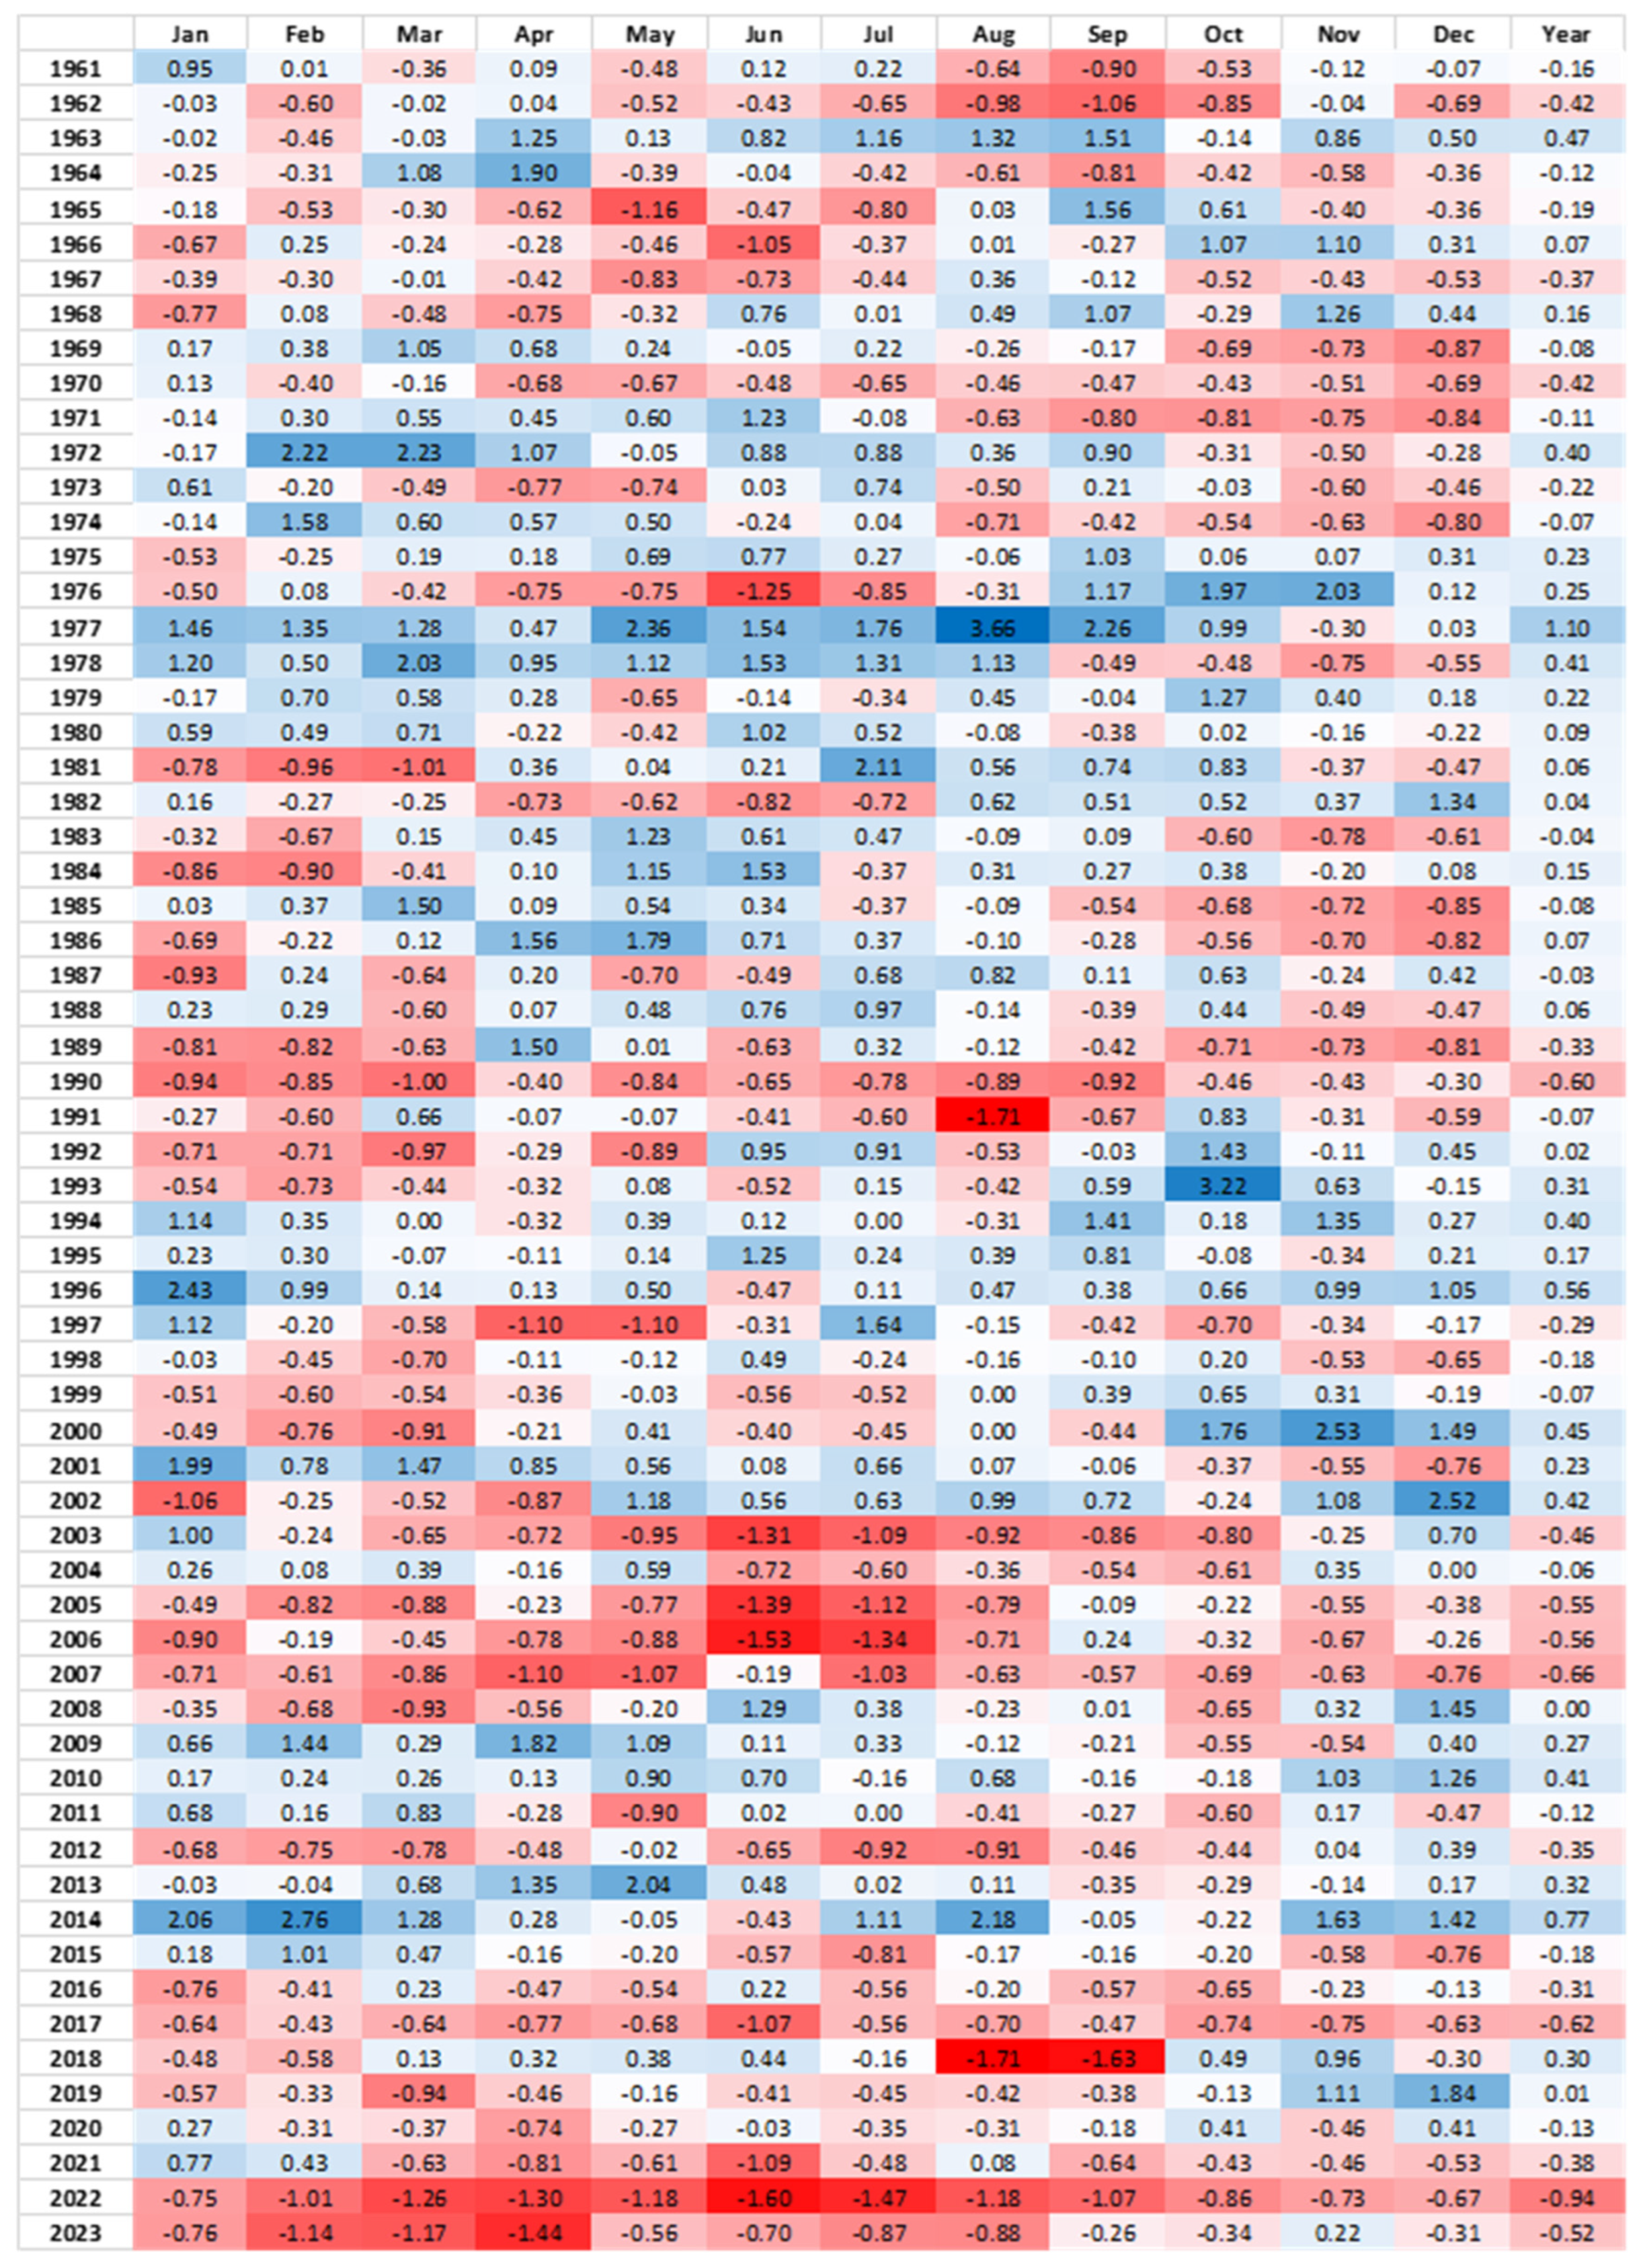
3.1. River Discharge

According to the data provided by the hydrological station in Pontelagoscuro, Po River’s mean flow in July 2022 was approximately 160.6 m3/s, significantly lower than the 2016–2021 average of 750.8 m3/s [49]. The July 2022 drought was part of a broader trend of declining river flows, with a particularly pronounced summer decline.
The combined analysis of SDI and CV for the year 2022 demonstrates the intensity and variability of the hydrological drought conditions observed throughout the year in the entire Po River basin. Figure 3 shows how the SDI values remained negative throughout the year, with the lowest values observed between June and July, indicating continuous moderate to severe drought conditions from February to September. On an annual basis, the comparison shows that 2022 has the lowest SDI value (−0.94) along the entire study period (1961–2023), followed by 2007 (−0.66). While considering individual months of 2022, the SDI values range between −0.67 in December (mild drought) and −1.6 in June (severe drought). In addition, CV, represented by the size of the bubbles in Figure 3, was generally higher in spring and summer (April to August), with a maximum in June, corresponding to the most severe SDI anomalies. This indicates increased variability in hydrological conditions, particularly river discharge, during the peak drought months. In contrast, there was a continuous increase in SDI values towards the end of the year (September–December), accompanied by a decline in CV, which points to an overall stabilization of river discharge variability.
Figure 4 shows the SDI values calculated for the study period 1961–2023, referring to the single month and the entire hydrological year. Negative values indicate dry periods, ranging from 0 to −2 as mild to extreme drought. In addition to 2022 and 2007, already mentioned, the years characterized by the lowest SDI annual values are 1990 (−0.60), 2005 (−0.55), 2006 (−0.56), 2017 (−0.62), and 2023 (−0.52), indicating that the frequency of drought conditions has increased over the last decades. Notably, the year 2022 has the lowest SDI, resulting in negative values during all the months and a minimum in June. A similar situation can be observed for other years (e.g., 2005 or 2017), but in these cases, the mean monthly discharge is always higher than the corresponding discharge of 2022 (excluding November 2017). On the contrary, during the year 2023, characterized by monthly discharge values even lower than 2022 from January to April, the discharge notably increased over the last months of the year (above all in November, with discharge higher than 2000 m3/s).
Evidence suggests that the hydrological drought experienced in 2022 was not merely a sporadic occurrence confined to the summer months; rather, it is indicative of a more extensive and persistent decline in river discharge, reaching its peak during the June–July window. Compared to 2022, past years with a similar trend of flow rate and low SDI annual values, like 1990 or 2017, are characterized by higher monthly discharge values for almost all the months.

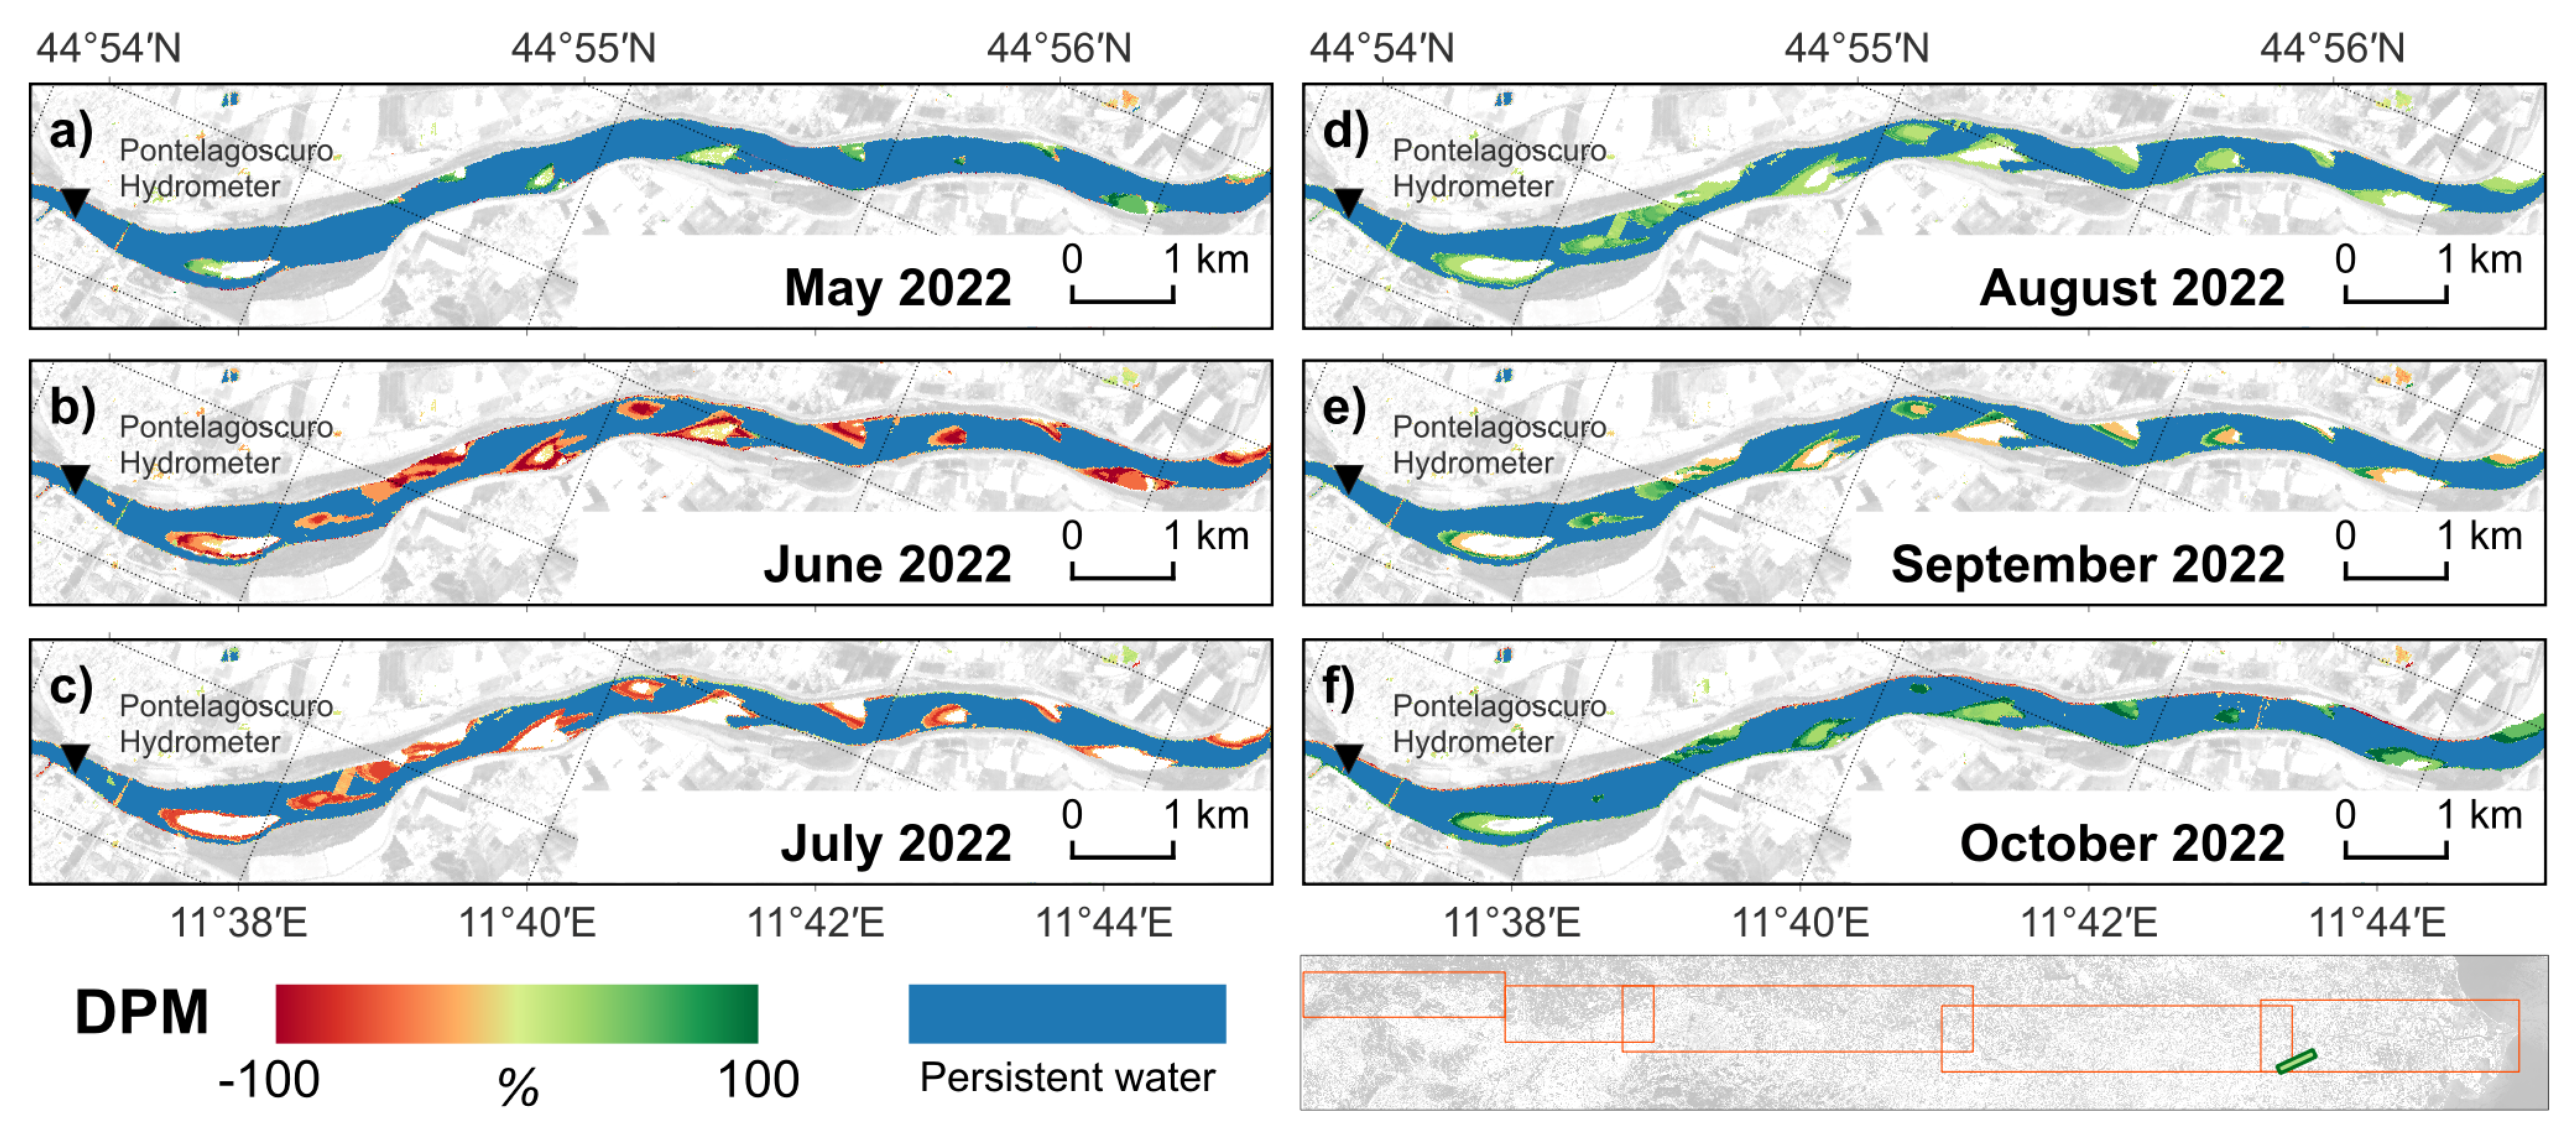
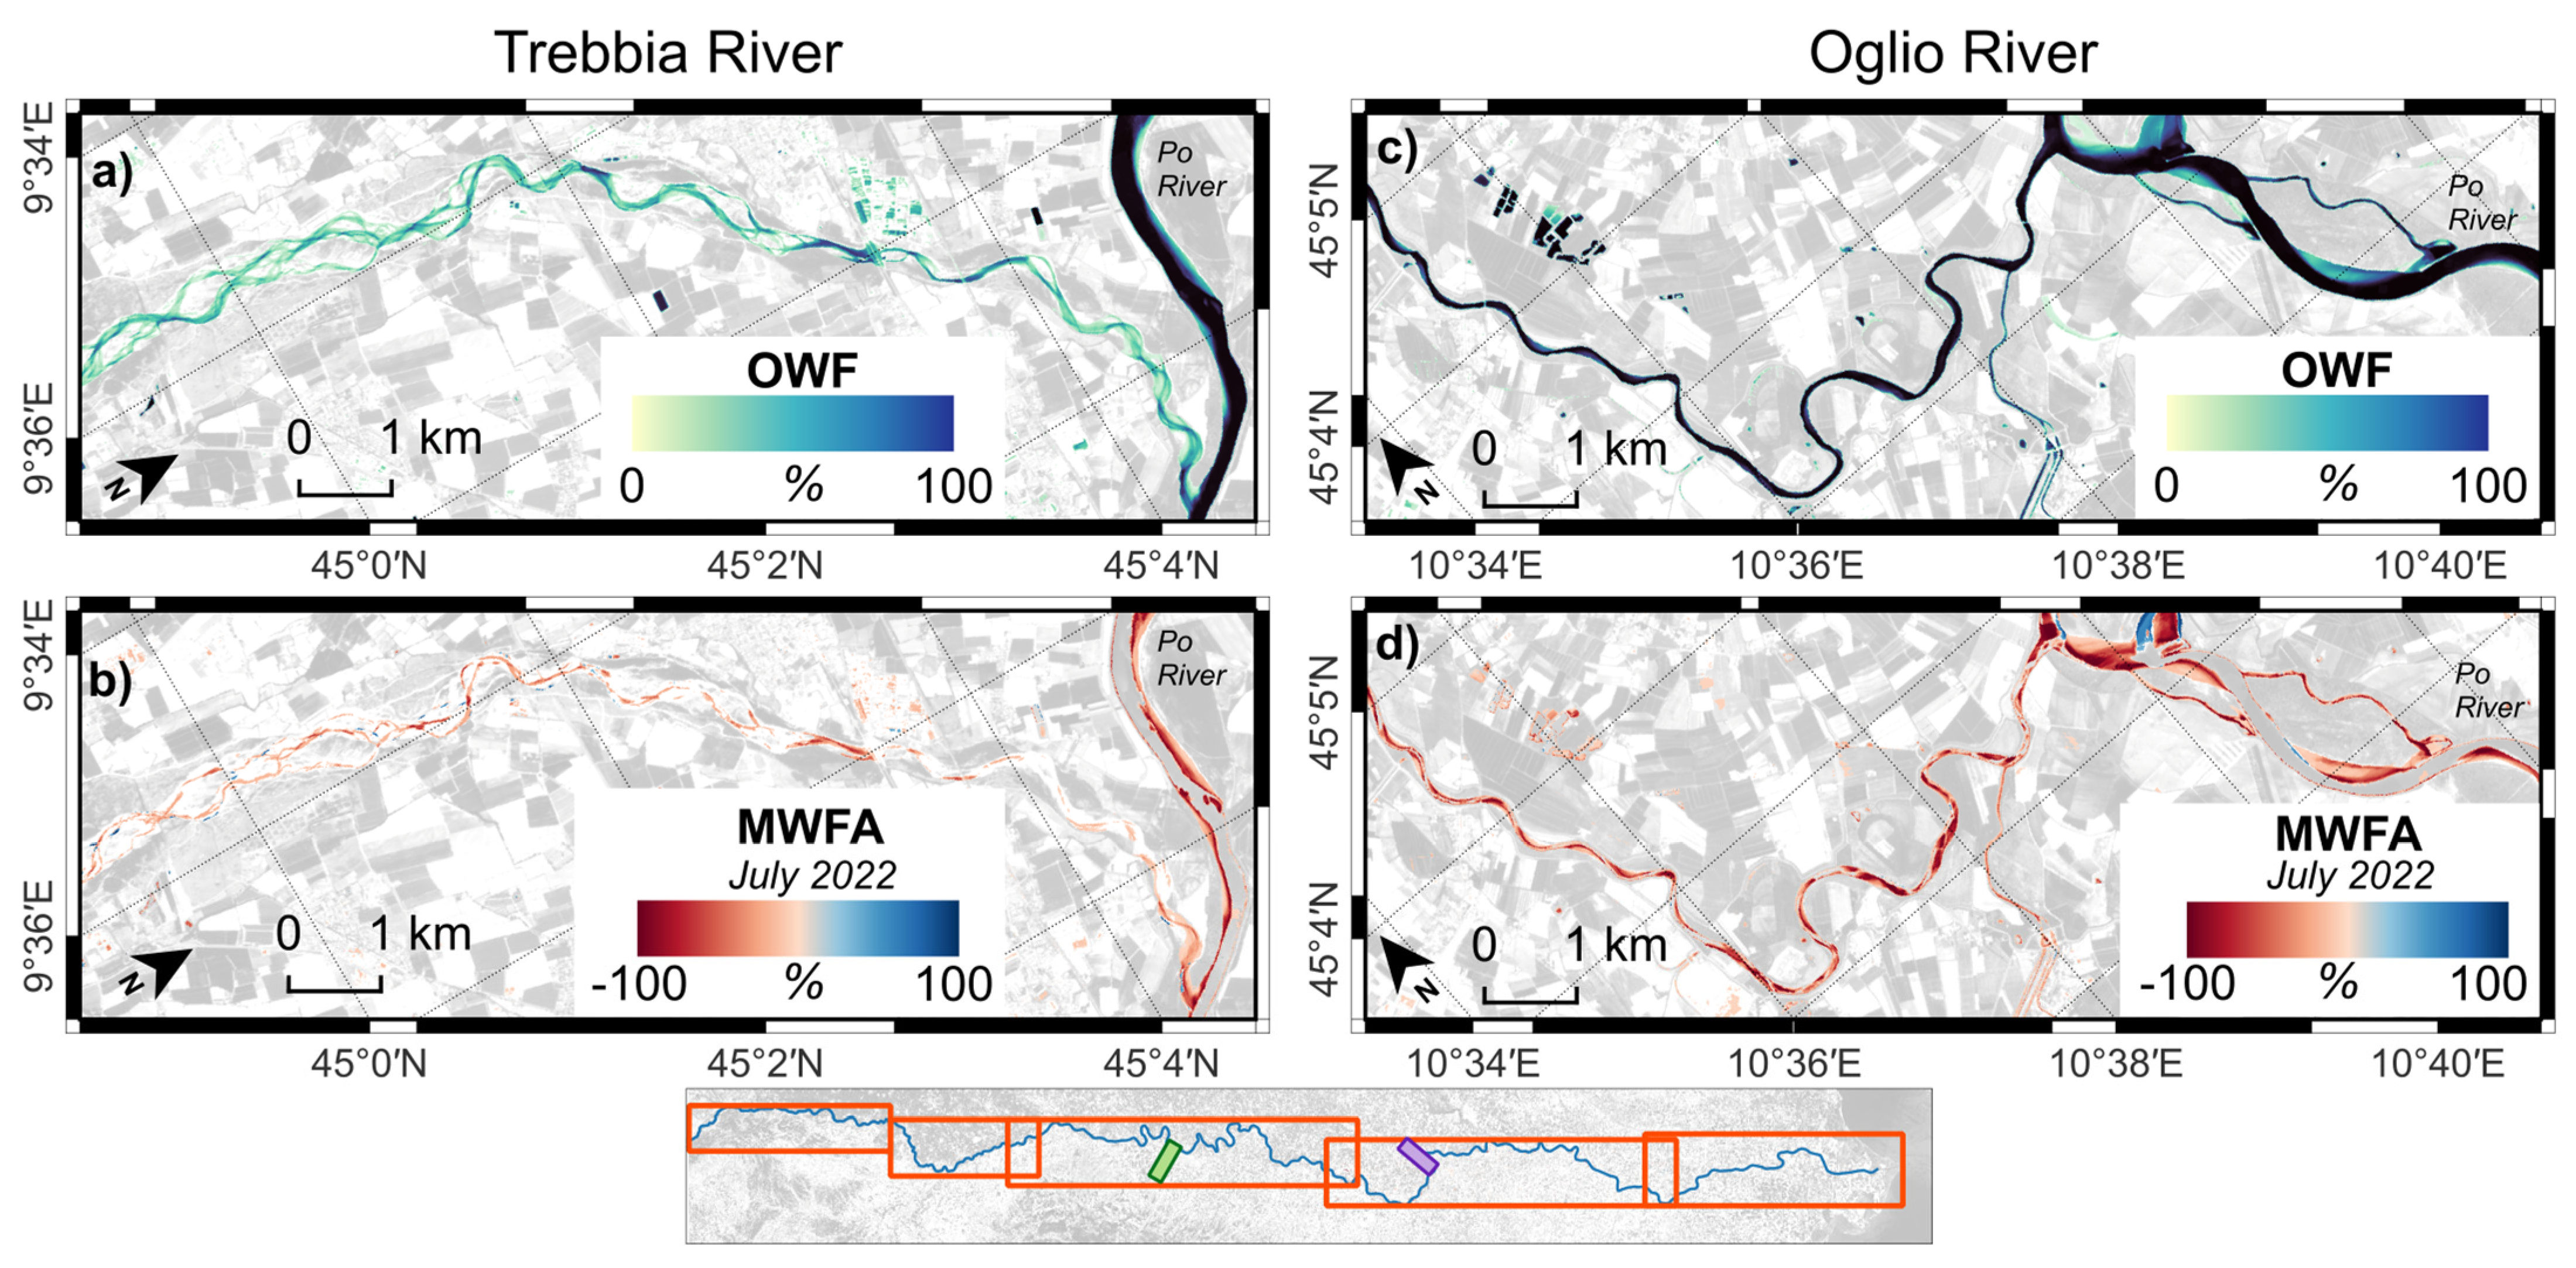
3.2. Changes in Monthly Water Frequency

MWF in the June–September period of 2022 was significantly lower than in other years on 71.4% of the analyzed area of the Po River (Table 2), whereas the remaining years show proportions lower than 20%.
Figure 5 shows the significant reduction in the river width between July 2018 and July 2022 in the focus area of Calendasco (located near Piacenza, 340 km from the river mouth, 45 m a.s.l.). In 2022, the number of pixels with MWF equal to 100% is approximately one order of magnitude lower than in 2018, associated with a corresponding decrease in water-full pixels (>90% water content, Figure 5c). The anomaly against the 2016–2023 mean (Figure 5d) also indicates a reduction in the water content in July 2022 compared to the average of previous years, highlighting with a red color scale (i.e., negative PWC anomaly) the areas where the riverbed has narrowed as a result of the reduced river flow due to drought conditions.
Figure 6 shows the DPM during the period May 2022–October 2022 in Pontelagoscuro (where the reference hydrometer is located, 83 km from the river mouth, 5 m a.s.l.), highlighting the shrinking during the period May–July, followed by a widening of the riverbed as rainfall returned.
The MWFA against the 2016–2023 mean was further evaluated across space and time. Figure 7 shows the spatio-temporal evolution of MWFA during the whole study period and across the ~500 km of the Po River analyzed in this study. Across the temporal dimension, the entire year 2022 results as a negative MWFA, while the spatial dimension shows areas with almost no morphological changes as an effect of artificial elements on channel forms and processes.
The wide range of river morphologies along the Po course resulted in markedly different CVOWF (Figure 8), with values close to 10% in meander-rich areas and almost zero in confined single-thread channels.
The OWF along the Po River has the capability to represent the diversity of geomorphic units, showing braided patterns (Figure 8a), partially confined channel forms (Figure 8b), and longitudinal lateral bars (Figure 8c).
The analysis of the MWF values highlights a higher variability for more dynamic river areas, characterized by larger riverbeds and the presence of longitudinal bars, also associated with higher CVOWF values.
For example, the CVOWF calculated for the polygon about 1 km downstream of the reference hydrometer in Pontelagoscuro (Figure 9a) is equal to 5.21%. The trend of the MWF values over the period 2016–2023 for the area downstream of the Pontelagoscuro hydrometer is shown in Figure 9b. A significant decrease in the MWF values during summer 2022 is evident, as well as the relation of the MWF and monthly discharge, which results in a dynamic morphology characterized by a partly confined channel and the presence of a mid-channel bar.
Figure 10 shows OWF and July 2022 MWFA calculated for the last river stretch before the confluence with the Po River of two tributaries: Trebbia River (originates from Apennine mountains, flows into Po River 42 m a.s.l. approximately 320 km from the river mouth), and Oglio River (originates from Alps mountains, flows into Po River 18 m a.s.l. approximately 183 km from the river mouth). For the considered stretches, OWF maps reveal a braided pattern of Trebbia River and partially confined channel forms for Oglio River, while the MWFA of July 2022 reveals the patterns of river shrinking, even at a channel width of about 20 m.

4. Discussion

4.1. Proposed Methodological Approach

While a number of alternative methodologies for the classification of water, vegetation, and sediments in riverine systems are available and commonly deployed, the proposed approach specifically aims at quantitatively monitoring the river water component and represents a novel contribution to the field, offering a reproducible, relatively user-friendly solution that can be applied with diverse sensors and extended to any site. It relies on the use of a simple spectral index, calculated from optical multispectral imagery, to generate a PWC time series. NDWI spectral index is designed to maximize the reflectance of a water body by using green wavelengths, minimize the low reflectance in the near-infrared of water bodies, and take advantage of the high reflectance in the near-infrared of vegetation and bare ground features. From the use of a random forest classification model to map water bodies, NDWI resulted as one of the predictor variables exhibiting higher importance. It could alone classify water pixels with an overall accuracy higher than 90%, comparable to the one obtained by the random forest classification model [29]. The use of a short-wave infrared spectral band in place of a near-infrared spectral band, in combination with the green wavelength, can provide a more accurate detection of water bodies [50]. Nevertheless, it has been demonstrated that using Sentinel-2 MSI, the NDWI spectral index could classify the water body better than the modified MNDWI, which is based on short-wave infrared spectral bands [23,50]. A comparative analysis of normalized difference spectral indices to map water surface is provided in [51].
The choice to select the NDWI spectral index, based on green and near-infrared wavelengths, is motivated by the aim of maximizing the applicability of the proposed procedure to a large number of remote sensing optical multispectral sensors. In fact, spectral bands in the green and near-infrared radiometric ranges are typically available in both high and very-high-resolution optical multispectral sensors, unlikely other radiometric ranges such as short-wave infrared, making the methodology applicable to a wide number of remote sensing datasets. In addition, green and near-infrared spectral bands, unlike those in other radiometric ranges such as short-wave infrared and red-edge, are available at higher spatial resolution in Sentinel-2 MSI satellite acquisitions.
When the percentage of water content in a pixel is lower than 100%, the water-related spectral indices values show significant variations, which depend on the relative fractions of bare ground and vegetation within the pixel [52]. Although this is a critical issue in the classification of water bodies, it could be considered as relevant information in monitoring hydromorphological conditions using time series. In fact, the use of a continuous variable (PWC) instead of a discrete variable (classified pixel) can provide a more detailed quantitative assessment of water cover within the pixel and consequently improve monitoring over time. This particularly applies during periods of slow but high variability, like those characterized by drought conditions. Among other existing data analysis techniques that allow us to estimate fractional water in pixels, SMA is a good candidate. Nevertheless, it does not represent a simple but effective method because it is computationally more demanding, requires a minimum number of spectral bands to run, needs a sensor-specific training set that makes it less easily portable to other sensors, and does not necessarily lead to a better result than the use of a fuzzy transform function on NDWI values.
The use of a spatial co-registration algorithm should minimize the effect of spatial misalignment of different acquisitions [46], which is critical when working on metric-scale processes at a spatial resolution of a few meters, possibly reducing biases in the subsequent processing steps for time series analysis. The use of percentiles to clean spurious pixels allows us to remove neighboring cropland fields with very high soil moisture, which may result in pixels with high PWC. Generally speaking, water content modifies the spectral signature of soil targets, affecting mapping products also generated using many other techniques.
The methodology presented here allows near-real-time monitoring at a meter scale of both climate-related phenomena and hydromorphological processes. These two processes often co-occur, making it difficult to single out the effect of an individual phenomenon on the river dynamics. The three proposed statistics integrate each other, since PWC and MWFA are more suitable for the detection of climate-related phenomena (e.g., the reduction in the river width in July 2022 compared to July 2018, and the July 2022 anomaly computed against the long-term average, Figure 5) and year-by-year changes in river morphology (Figure 7 and Figure 9), while DPM allows the detection of short-term dynamics (Figure 6), thereby providing an effective tool for the near-real-time monitoring of river hydromorphological processes.
The combined use of satellite data and metrics generated from in situ river discharge measurements (i.e., the CV and the SDI) allows a more comprehensive understanding of the effects of extreme events on river dynamics, as demonstrated in the case study of the record-breaking Po River shrinking during the severe 2022 drought event. A global assessment of water dynamics at the whole river mainstem scale (as in Figure 7 and Figure 8) allows us to clearly depict anomalies over time and to identify hotspots, as the illustrated case studies, where climate-related phenomena combine with geomorphic singularities resulting in unique river dynamics.
While the proposed approach has been tested on the Po River, it can be used to assess a variety of rivers worldwide since it only requires satellite optical multispectral acquisitions and discharge data.

4.2. Applicability of the Proposed Methodology: Po River Shrinking in Summer 2022

The proposed methodology is a cost-effective tool, relatively easy to use also by non-specialists, and fully reproducible. Being based on normalized band reflectance differences, this method is easily applicable to other sensors and allows the synergic use of multiple sensors operating at different spatial and temporal scales.
Po River shrinking during the record-breaking summer 2022 drought was analyzed using all the available Sentinel-2 MSI optical multispectral satellite acquisitions over the period 2016–2023. The analysis was based on the calculation of the PWC through the application of the fuzzy transform function, a mathematically well-founded soft computing method [53], on the normalized difference water index (NDWI), calculated from satellite imagery at 10 m spatial resolution. Spatio-temporal variations were analyzed through MWF maps, which were used to calculate the DPM and anomalies from the reference climatology (MWFA) (shown here as a time series over the period 2016–2021), showing the seasonal and interannual variation in the width of the riverbed. This approach enabled the quantitative assessment of drought impact as indicated by the reduction in the PWC compared to the previous year. Additionally, the difference in water frequency from the preceding month facilitated the identification of anomalies crucial for monitoring short-term dynamics and planning timely interventions. The main variations were evident especially in more dynamic river sections, characterized by braided patterns or longitudinal lateral bars, as the two selected focus areas, i.e., Calendasco and Pontelagoscuro (see Figure 5 and Figure 6). Moreover, the OWF calculated over the period 2016–2023 was used to calculate CVOWF, which provided a summary of the temporal changes and river dynamics during the investigated years. The CVOWF values range between more than 10% in meander-rich areas and almost zero in single-thread channels (Figure 8).
The results demonstrate a notable reduction in the riverbed area in 2022, particularly during the late spring and summer months. This is evident both by comparing the MWF of July in the years 2018 and 2022, and by comparing July 2022 with the climatological average of the study years. The statistical significance of the slices’ average number where the MWF was found to be lower than the average demonstrates how effective MWF is in revealing the river shrinking. Further developments of the methodology based on the classification of additional variables, such as vegetation and sediments, could facilitate the interpretation of riverine data, potentially enabling the prediction of riverbed changes.
Integration with in situ data and measurements has improved the interpretation of the results obtained through satellite image processing. Water discharge records across the years facilitated the reconstruction of the historical trend of Po River discharge (1961–2021), enabling a comparative analysis with the 2022 flow. In particular, the application of the SDI allowed for the quantification of the hydrological drought severity, while through the discharge CV, it was possible to identify the months of greatest water stress (late spring–summer), evidencing that the observed river shrinkage correlates with record-low water discharges in June and July 2022. The integration of diverse analytical approaches was crucial in addressing the limitations of employing individual methods, thereby facilitating a more precise comprehension of the hydrological drought dynamics and their repercussions on riverine systems.
While this study is primarily focused on the Po River 2022 summer drought, the satellite observations facilitate not only the monitoring of climate change-related phenomena but also the observation of the geomorphological processes of the river. These examples demonstrate the potential of satellite tools in general and of this methodology in particular for monitoring variations and supporting the effective planning and management of water resources and alluvial environments.
The proposed approach provides an effective cognitive tool for water resource management. Indeed, surface water extents are variable in time, occasionally presenting extreme changes, as in floods [54]. Furthermore, the combined effects of climate change and anthropogenic pressures are contributing to the increase in hydrological extremes at the global level, including water scarcity and floods [15]. For these reasons, watercourse monitoring tools must evolve to improve our knowledge of complex hydromorphological processes and the possibility to predict water dynamics [55]. Information produced from the analysis of remote sensing data would be useful not only to monitor a specific watercourse but also to support the integrated management of river systems at the regional or national level, including efficient water management strategies to optimize water allocation [15].

4.3. Lessons Learned and Future Perspectives

Despite its multiple strengths, the proposed methodology is not without intrinsic limitations. For instance, some errors may occur, above all in heavily vegetated or urbanized regions, due to reflection patterns (adjacency effect) or object shadows similar to water spectra [56]. Cloud cover may limit the availability of satellite observations, usually during autumn and spring periods. Moreover, snow, ice, and frozen river systems can generate additional complexities [33]. Sun-glint affects water pixel detectability, since it may contaminate Sentinel-2 imagery acquired during late spring and early summer periods. A metric of robustness based on missing data would also be useful. However, the use of a standardized pre-processing procedure to remove bad pixels is essential to have consistent data quality and maximize information [15].
Concerning the choice of spectral index to use, the NDWI can enhance information about water bodies and restrict information about vegetation and soil features, but it cannot completely distinguish built-up features from water bodies. Short-wave infrared-based spectral indices have a lower impact from subpixel vegetation components, even if such radiometric interval is not available in most of very-high-resolution satellite optical multispectral sensors or it is available at a lower spatial resolution. Moreover, NDWI thresholds vary depending on the proportions of subpixel water and non-water components. The proposed approach could be applied elsewhere, provided that possible adjustment of the threshold values of NDWI used for fuzzy transform, based on actual site conditions, is taken into account. It should be considered that using a threshold value larger than 0.1 on the NDWI calculated from Sentinel-2 MSI imagery, leads to a severe decrease in water maps classification performances [57]. NDWI threshold could, for example, be adjusted to match a reference dataset that has a finer spatial resolution [52]. Field surveys are still required to validate and integrate with the hydromorphological analysis conducted using satellite data. This will mitigate the misclassification errors resulting from the automated procedure and enhance the precision and efficiency of monitoring, particularly in the case of smaller river systems [58].
The reference period for the calculation of anomalies in MWF was limited to the period 2016–2020 due to the unavailability of Sentinel-2 MSI satellite acquisitions during previous years. Such a reference period is far from being considered a climatology, which is typically calculated over a 30-year period.
Copernicus Sentinel-2 satellites constellation offers a relatively high temporal resolution due to dense revisit time satellite acquisitions. However, the spatial resolution of 10 m limits the applicability of the proposed methodology to watercourses with active channels wider than 50 m [15,59]. Therefore, the narrower river networks, like most mountain and small river watersheds, where the effects of climate change could be even more dramatic, are excluded from the analysis using Sentinel-2 MSI imagery [1,15]. The analysis focused on the last river stretches of two tributaries before the confluence with the Po, namely Trebbia River and Oglio River, demonstrates the effectiveness of using PWC to account for the gradient of water cover within pixel, extending the use of datasets at 10 m spatial resolution to rivers with active channels less than 50 m wide. The exploitation of higher spatial resolution satellite imagery acquired with optical multispectral sensors, which is increasingly available and can even be used in synergy with the Copernicus satellite acquisitions, would overcome the spatial resolution limitation. Many of the newer constellations of CubeSat satellites provide optical multispectral data at a very high spatial resolution, even at daily revisit frequency. However, such data are distributed at a cost, which makes this solution often not practically or financially feasible [33], even if less expensive than other high-resolution satellite or airborne imagery [33,60]. For detailed characterization of specific stretches, the use of unmanned aerial systems remains a valuable tool [15], also for calibration and validation purposes [59], although without the ability to revisit in time. Future developments of the proposed methodology will consider the synergic use of Copernicus Sentinel-2 and PlanetScope imagery. LiDAR acquisitions can be complemented with multispectral optical data analyses to provide additional quantitative information useful in characterizing hydromorphological changes. The different large-scale information obtained from the analysis of remote sensing data would be useful not only to monitor a specific watercourse but also to support the integrated management of river systems at the regional or national level [15].
While the CV and SDI metrics generated from in situ river discharge measurements effectively measure the magnitude and variability of a hydrological event and highlight the anomalies, they have inherent statistical limitations. SDI is useful for long-term drought monitoring, but its sensitivity to extremes makes it less effective under climate change. For example, a single extreme flood can skew the standard deviation, reducing the SDI values and underestimating the severity of the drought. Conversely, a distorted standard deviation can exaggerate the coefficient of variation, making stable conditions appear highly variable. The CV, which measures relative variability, does not take into account long-term trends, such as increasing drought frequency due to climate change, meaning that a gradual decline in flow may not be reflected in the CV and may not indicate worsening conditions. In addition, both indices focus on streamflow droughts, neglecting meteorological and groundwater droughts, which may misrepresent actual water availability. Therefore, for a more comprehensive hydrological assessment, these indices should be used in combination with other methods and trend analysis.
A list of specific goals for future developments, in order of priority, is as follows: (i) demonstrate PWC reliability through the comparison with other methodological approaches to extract the percentage of water content in pixel, as well as cost-effectiveness analysis; (ii) tune fuzzy transform function on specific sites and a variety of sensors; (iii) demonstrate the improved monitoring capabilities using virtual satellite constellations, even providing datasets at higher spatial resolution; (iv) account for homogeneous geomorphic units. Future development of the proposed methodology could, in fact, account for the subdivision of river stretches according to homogeneous geomorphic units at different spatial scales. This should enable an evaluation of the ecological response to drought conditions, as geomorphic units represent the physical foundation for habitat units, provided that also vegetation and bare-ground features are mapped, according to the applications proposed in previous studies [59]. Moreover, it will yield insights into the existing range of habitats present within a given reach [11], opening the way for the characterization of river habitats and the assessment of river ecosystem state.
The proposed mapping products can be even used to extend the existing hydromorphological indicators, thus providing further information that can support decision-makers and agencies involved in hydromorphological monitoring. The provided insights would be useful for the assessment of river dynamics, allowing the analysis of the variation in these features over time and with different water levels [61], as well as understanding the past and current river processes and forecasting future watercourse dynamics. Moreover, the availability of a simple approach for the assessment of river dynamics could have positive returns by growing the community engaged in watercourse protection [15].

5. Conclusions

This study proposes a simple but effective and portable approach for the monitoring of river hydromorphology through remote sensing. A case study focusing on the Po River is presented, providing evidence of the impact of the 2022 drought on river width. The use of PWC time series calculated from Sentinel-2 NDWI, together with the derived indicators (i.e., MWF, MWFA, DPM, and OWF), contributed to a more comprehensive understanding of the river dynamics and spatio-temporal variations compared to an assessment based only on the available hydrological dataset. The findings demonstrate that (i) during June and July 2022, due to a reduction in precipitation and an increase in temperature and evapotranspiration, the Po River experienced a significant shrinkage; (ii) the annual and interannual satellite-based analysis conducted from 2016 to 2023 highlighted higher sensitivity areas; and (iii) variation in river width was evident as a result of both climate change and river hydromorphological dynamics.
The potential for generalizing the methodology through the proposed approach, in terms of applicability to other geographic sites and the possible use of various optical multispectral sensors, allows detailed assessments of surface water dynamics across entire river basins, enhancing monitoring capabilities and supporting the effective management of water resources. Application of the procedure to imagery acquired by a virtual constellation of high- and very-high-resolution satellite sensors can provide a more detailed understanding of the phenomenon, stimulating the development of operational services like hydromorphological assessment. While the results confirm the reliability of the proposed approach, future improvements could further refine the methodology, with the aim of advancing sustainable strategies in response to climate change and anthropogenic pressures.

Author Contributions

Conceptualization, F.F. and G.F.; methodology, F.F., G.C. and G.F.; software, F.F.; formal analysis, F.F., G.C., E.V. and G.F.; investigation, F.F., G.C., E.V. and G.F.; data curation, F.F.; writing—original draft preparation, F.F. and G.C.; writing—review and editing, F.F., G.C., E.V., C.C. and G.F.; supervision, C.C. All authors have read and agreed to the published version of the manuscript.

Funding

This manuscript is not funded by a specific project grant.

Data Availability Statement

Dataset available upon request from the authors.

Acknowledgments

G.C. acknowledges the support of project PNRR-NGEU, which has received funding from the MUR–DM 118/2023. This work contains modified Copernicus Sentinel data (2025). Authors are grateful to the many individuals working on the development of free and open-source software for supporting the sharing of knowledge. The authors thank the anonymous reviewers for their careful reading of our manuscript and their insightful comments and suggestions.

Conflicts of Interest

The authors declare no conflicts of interest.

References

  1. Belletti, B.; Rinaldi, M.; Bussettini, M.; Comiti, F.; Gurnell, A.M.; Mao, L.; Nardi, L.; Vezza, P. Characterising Physical Habitats and Fluvial Hydromorphology: A New System for the Survey and Classification of River Geomorphic Units. Geomorphology 2017, 283, 143–157. [Google Scholar] [CrossRef]
  2. Pizzarro, A.; Gran, D.V.; Navarrete Muñoz, E.M.; Dal Sasso, S.F. The Use of Unmanned Aerial Systems for River Monitoring: A Bibliometric Analysis Covering the Last 25 Years. Hydrology 2024, 11, 80. [Google Scholar] [CrossRef]
  3. Koutalakis, P.; Tzoraki, O.; Zaimes, G.N. Detecting riverbank changes with remote sensing tools. Case study: Aggitis River in Greece. Ann. Dunarea De Jos Univ. Galati. Fascicle II Math. Phys. Theor. Mech. 2019, 42, 134–142. [Google Scholar] [CrossRef]
  4. Brenna, A.; Bizzi, S.; Surian, N. How Multiple Anthropic Pressures May Lead to Unplanned Channel Patterns: Insights from the Evolutionary Trajectory of the Po River (Italy). Catena 2024, 234, 107598. [Google Scholar] [CrossRef]
  5. Floury, M.; Delattre, C.; Ormerod, S.J.; Souchon, Y. Global versus local change effects on a large European river. Sci. Total Environ. 2012, 441, 220–229. [Google Scholar] [CrossRef]
  6. Kiss, T.; Blancka, V. River channel response to climate- and human-induced hydrological changes: Case study on the meandering Hernád River, Hungary. Geomorphology 2012, 175–176, 115–125. [Google Scholar] [CrossRef]
  7. Jakovljević, G.; Govedarica, M.; Álvarez-Taboada, F. Waterbody mapping: A comparison of remotely sensed and GIS open data sources. Int. J. Remote Sens. 2018, 40, 2936–2964. [Google Scholar] [CrossRef]
  8. Malahlela, O.E. Inland waterbody mapping: Towards improving discrimination and extraction of inland surface water features. Int. J. Remote Sens. 2016, 37, 4574–4589. [Google Scholar] [CrossRef]
  9. Colombo, N.; Guyennon, N.; Valt, M.; Salerno, F.; Godone, D.; Cianfarra, P.; Freppaz, M.; Maugeri, M.; Manara, V.; Acquaotta, F.; et al. Unprecedented Snow-Drought Conditions in the Italian Alps during the Early 2020s. Environ. Res. Lett. 2023, 18, 074014. [Google Scholar] [CrossRef]
  10. Yang, X.; Qin, Q.; Yésou, H.; Ledauphin, T.; Koehl, M.; Grussenmeyer, P.; Zhu, Z. Monthly Estimation of the Surface Water Extent in France at a 10-m Resolution Using Sentinel-2 Data. Remote Sens. Environ. 2020, 244, 111803. [Google Scholar] [CrossRef]
  11. Rinaldi, M.; Belletti, B.; Bussettini, M.; Comiti, F.; Golfieri, B.; Lastoria, B.; Marchese, E.; Nardi, L.; Surian, N. New Tools for the Hydromorphological Assessment and Monitoring of European Streams. J. Environ. Manag. 2017, 202, 363–378. [Google Scholar] [CrossRef] [PubMed]
  12. Bhaga, T.D.; Dube, T.; Shekede, M.D.; Shoko, C. Investigating the effectiveness of Landsat-8 OLI and Sentinel-2 MSI satellite data in monitoring the effects of drought on surface water resources in the Western Cape Province, South Africa. Remote Sens. Appl. Soc. Environ. 2023, 32, 101037. [Google Scholar] [CrossRef]
  13. Directive 2000/60/EC of the European Parliament and of the Council of 23 October 2000 Establishing a Framework for Community Action in the Field of Water Policy. 2000. Available online: https://eur-lex.europa.eu/legal-content/EN/TXT/HTML/?uri=CELEX:32000L0060 (accessed on 12 March 2025).
  14. Belletti, B.; Rinaldi, M.; Buijse, A.D.; Gurnell, A.M.; Mosselman, E. A Review of Assessment Methods for River Hydromorphology. Environ. Earth Sci. 2014, 73, 2079–2100. [Google Scholar] [CrossRef]
  15. Carbonneau, P.E.; Bizzi, S. Global mapping of river sediment bars. Earth Surf. Process. Landf. 2024, 49, 15–23. [Google Scholar] [CrossRef]
  16. Manfreda, S.; Saddi, K.C.; Miglino, D.; Jomaa, S.; Eltner, A.; Perks, M.; Peña-Haro, S.; Bogaard, T.; Van Emmerik, T.H.M.; Mariani, S.; et al. Advancing River Monitoring Using Image-Based Techniques: Challenges and Opportunities. Hydrol. Sci. J. 2024, 69, 657–677. [Google Scholar] [CrossRef]
  17. Mariani, S.; Bussettini, M. I Dati Sentinel per Monitorare i Corsi d’acqua. Ecoscienza 2021, 5, 28–30. (In Italian) [Google Scholar]
  18. Rinaldi, M.; Surian, N.; Comiti, F.; Bussettini, M. A Method for the Assessment and Analysis of the Hydromorphological Condition of Italianan Streams: The Morphological Quality Index. Geomorphology 2013, 180–181, 96–108. [Google Scholar] [CrossRef]
  19. Pekel, J.-F.; Cottam, A.; Gorelick, N.; Belward, A.S. High-resolution mapping of global surface water and its long-term changes. Nature 2016, 540, 418–422. [Google Scholar] [CrossRef]
  20. Souza, C.; Kirchhoff, F.; Oliveira, B.; Ribeiro, J.; Sales, M. Long-term annual surface water change in the Brazilian Amazon biome: Potential links with deforestation, infrastructure development and climate change. Water 2019, 11, 566. [Google Scholar] [CrossRef]
  21. Cordeiro, M.C.; Martinez, J.M.; Peña-Luque, S. Automatic water detection from multidimensional hierarchical clustering for Sentinel-2 images and a comparison with Level 2A processors. Remote Sens. Environ. 2021, 253, 112209. [Google Scholar] [CrossRef]
  22. Yousefi, P.; Jalab, H.A.; Ibrahim, R.W.; Noor, N.F.M.; Ayub, M.N.; Gani, A. Waterbody segmentation in satellite imagery applying modified kernel kmeans. Malays. J. Comput. Sci. 2018, 31, 143–154. [Google Scholar] [CrossRef]
  23. Karaman, M. Comparison of thresholding methods for shoreline extraction from Sentinel-2 and Landsat-8 imagery: Extreme Lake Salda, track of Mars on Earth. J. Environ. Manag. 2021, 298, 113481. [Google Scholar] [CrossRef] [PubMed]
  24. Kaplan, G.; Avdan, U. Object-based water body extraction model using Sentinel-2 satellite imagery. Eur. J. Remote Sens. 2017, 50, 137–143. [Google Scholar] [CrossRef]
  25. Valentini, E.; Taramelli, A.; Filipponi, F.; Giulio, S. An effective procedure for EUNIS and Natura 2000 habitat type mapping in estuarine ecosystems integrating ecological knowledge and remote sensing analysis. Ocean Coast. Manag. 2015, 108, 52–64. [Google Scholar] [CrossRef]
  26. Wieland, M.; Martinis, S. A modular processing chain for automated flood monitoring from multi-spectral satellite data. Remote Sens. 2019, 11, 2330. [Google Scholar] [CrossRef]
  27. Acharya, T.D.; Lee, D.H.; Yang, I.T.; Lee, J.K. Identification of water bodies in a Landsat 8 OLI image using a J48 decision tree. Sensors 2016, 16, 1075. [Google Scholar] [CrossRef]
  28. Nandi, I.; Srivastava, P.K.; Shah, K. Floodplain mapping through support vector machine and optical/infrared images from Landsat 8 OLI/TIRS sensors: Case study from Varanasi. Water Resour. Manag. 2017, 31, 1157–1171. [Google Scholar] [CrossRef]
  29. Jiang, Z.; Wen, Y.; Zhang, G.; Wu, X. Water Information Extraction Based on Multi-Model RF Algorithm and Sentinel-2 Image Data. Sustainability 2022, 14, 3797. [Google Scholar] [CrossRef]
  30. Mishra, K.; Prasad, P.R.C. Automatic extraction of water bodies from Landsat imagery using perceptron model. J. Computat. Environ. Sci. 2015, 2015, 903465. [Google Scholar] [CrossRef]
  31. Wang, X.; Xie, S.; Zhang, X.; Chen, C.; Guo, H.; Du, J.; Duan, Z. A robust multiband water index (MBWI) for automated extraction of surface water from Landsat 8 OLI imagery. Int. J. Appl. Earth Obs. Geoinf. 2018, 68, 73–91. [Google Scholar] [CrossRef]
  32. Bangira, T.; Alfieri, S.M.; Menenti, M.; van Niekerk, A. Comparing thresholding with machine learning classifiers for mapping complex water. Remote Sens. 2019, 11, 1351. [Google Scholar] [CrossRef]
  33. Valman, S.J.; Boyd, D.S.; Carbonneau, P.E.; Johnson, M.F.; Dugdale, S.J. An AI Approach to Operationalise Global Daily PlanetScope Satellite Imagery for River Water Masking. Remote Sens. Environ. 2024, 301, 113932. [Google Scholar] [CrossRef]
  34. Formetta, G.; Tootle, G.; Therrell, M. Regional Reconstruction of Po River Basin (Italy) Streamflow. Hydrology 2022, 9, 163. [Google Scholar] [CrossRef]
  35. Montanari, A. Hydrology of the Po River: Looking for changing patterns in river discharge. Hydrology Earth Syst. Sci. 2012, 16, 3739–3747. [Google Scholar] [CrossRef]
  36. Zanchettin, D.; Traverso, P.; Tomasino, M. Po River discharges: A preliminary analysis of a 200-year time series. Clim. Change 2008, 89, 411–433. [Google Scholar] [CrossRef]
  37. Vezzoli, R.; Mercogliano, P.; Pecora, S.; Zollo, A.L.; Cacciamani, C. Hydrological simulation of Po River (North Italy) discharge under climate change scenarios using the RCM COSMO-CLM. Sci. Total Environ. 2015, 521–522, 346–358. [Google Scholar] [CrossRef]
  38. Bozzola, M.; Swanson, T. Policy implications of climate variability on agriculture: Water management in the Po river basin, Italy. Environ. Sci. Policy 2014, 43, 26–38. [Google Scholar] [CrossRef]
  39. Coppola, E.; Verdecchia, M.; Giorgi, F.; Colaiuda, V.; Tomassetti, B.; Lombardi, A. Changing hydrological conditions in the Po basin under global warming. Sci. Total Environ. 2014, 493, 1183–1196. [Google Scholar] [CrossRef]
  40. Simeoni, U.; Corbau, C. A review of the Delta Po evolution (Italy) related to climatic changes and human impacts. Geomorphology 2009, 107, 64–71. [Google Scholar] [CrossRef]
  41. Barca, G.; Mariani, S.; Lastoria, B.; Piva, F.; Archi, F.; Botto, A.; Casaioli, M.; Forte, T.; Marchetti, G.; Peruzzi, C.; et al. Bilancio Idrologico Nazionale: Focus Su Siccità e Disponibilità Naturale Della Risorsa Idrica Rinnovabile. Aggiornamento al 2022. Ist. Super. Per La Prot. E La Ric. Ambient. 2023, 388, 22. Available online: https://www.isprambiente.gov.it/files2023/pubblicazioni/rapporti/rapporto_388_2023_siccita_2022.pdf (accessed on 12 March 2025). (In Italian).
  42. Montanari, A.; Nguyen, H.; Rubinetti, S.; Ceola, S.; Galelli, S.; Rubino, A.; Zanchettin, D. Why the 2022 Po River Drought Is the Worst in the Past two Centuries. Environ. Stud. 2023, 9, eadg8304. [Google Scholar] [CrossRef] [PubMed]
  43. Dokić, M.; Stričević, L.; Gocić, M.; Golubović, N.; Mileti, M. Analysis of discharge fluctuation using modified Streamflow Drought Index (SDI) and Standardized Precipitation Index (SPI) in the upper Nišava River Basin. Serbian J. Geosci. 2023, 8, 15–26. [Google Scholar] [CrossRef]
  44. Cancelliere, A.; Di Mauro, G.; Bonaccorso, B.; Rossi, G. Drought forecasting using the Standardized Precipitation Index. Water Resour Manag. 2007, 21, 801–819. [Google Scholar] [CrossRef]
  45. Mcfeeters, S.K. The use of the Normalized Difference Water Index (NDWI) in the delineation of open water features. International. J. Remote Sens. 1996, 17, 1425–1432. [Google Scholar] [CrossRef]
  46. Filipponi, F. Improve Sentinel-2 time series consistency with S2SDB DataBase for operational image co-registration. Trends Earth Obs. Earth Obs. Curr. Chall. Oppor. Environ. Monit. 2024, 3, 162–166. Available online: https://aitonline.org/wp-content/uploads/2024/11/EarthObservation_current_challenges_opportunities_environmental_monitoring.pdf (accessed on 12 March 2025). [CrossRef]
  47. Scheffler, D.; Hollstein, A.; Diedrich, H.; Segl, K.; Hostert, P. AROSICS: An Automated and Robust Open-Source Image Co-Registration Software for Multi-Sensor Satellite Data. Remote Sens. 2017, 9, 676. [Google Scholar] [CrossRef]
  48. Filipponi, F.; Smiraglia, D.; Agrillo, E. Earth Observation for Phenological Metrics (EO4PM): Temporal Discriminant to Characterize Forest Ecosystems. Remote Sens. 2022, 14, 721. [Google Scholar] [CrossRef]
  49. ARPAE. Annali Idrologici. Agenzia Regionale Prevenzione e Ambiente Emilia Romagna. 2024. Available online: https://www.arpae.it/it/temi-ambientali/meteo/report-meteo/annali-idrologici (accessed on 11 September 2024). (In Italian)
  50. Sekertekin, A.; Cicekli, S.Y.; Arslan, N. Index-based identification of surface water resources using Sentinel-2 satellite imagery. In Proceedings of the 2nd International Symposium on Multidisciplinary Studies and Innovative Technologies (ISMSIT), Ankara, Turkey, 19–21 October 2018; IEEE: New York, NY, USA, 2018; pp. 1–5. [Google Scholar] [CrossRef]
  51. Boschetti, M.; Nutini, F.; Manfron, G.; Brivio, P.A.; Nelson, A. Comparative analysis of normalised difference spectral indices derived from MODIS for detecting surface water in flooded rice cropping systems. PLoS ONE 2014, 9, e88741. [Google Scholar] [CrossRef]
  52. Ji, L.; Zhang, L.; Wylie, B. Analysis of dynamic thresholds for the normalized difference water index. Photogramm. Eng. Remote Sens. 2009, 75, 1307–1317. [Google Scholar] [CrossRef]
  53. Perfilieva, I.; Novák, V.; Dvořák, A. Fuzzy transform in the analysis of data. Int. J. Approx. Reason. 2008, 48, 36–46. [Google Scholar] [CrossRef]
  54. Montanari, A.; Young, G.; Savenije, H.H.G.; Hughes, D.; Wagener, T.; Ren, L.L.; Koutsoyiannis, D.; Cudennec, C.; Toth, E.; Grimaldi, S.; et al. “Panta Rhei—Everything Flows”: Change in hydrology and society—The IAHS Scientific Decade 2013–2022. Hydrollogy Sci. J. 2013, 58, 1256–1275. [Google Scholar] [CrossRef]
  55. García, M.; Alcayaga, H.; Pizarro, A. Automatic Segmentation of Water Bodies Using RGB Data: A Physically Based Approach. Remote Sens. 2023, 15, 1170. [Google Scholar] [CrossRef]
  56. Zheng, Y.; Tang, L.; Wang, H. An improved approach for monitoring urban built-up areas by combining NPP-VIIRS nighttime light, NDVI, NDWI, and NDBI. J. Clean. Prod. 2021, 328, 129488. [Google Scholar] [CrossRef]
  57. Du, Y.; Zhang, Y.; Ling, F.; Wang, Q.; Li, W.; Li, X. Water Bodies’ Mapping from Sentinel-2 Imagery with Modified Normalized Difference Water Index at 10-m Spatial Resolution Produced by Sharpening the SWIR Band. Remote Sens. 2016, 8, 354. [Google Scholar] [CrossRef]
  58. Bizzi, S.; Demarchi, L.; Grabowsky, R.C.; Weissteiner, C.J.; Van de Bund, W. The use of remote sensing to characterise hydromorphological properties of European rivers. Aquat. Sci. 2016, 78, 57–70. [Google Scholar] [CrossRef]
  59. Carbonneau, P.E.; Belletti, B.; Micotti, M.; Lastoria, B.; Casaioli, M.; Mariani, S.; Marchetti, G.; Bizzi, S. UAV-based training for fully fuzzy classification of Sentinel-2 fluvial scenes. Earth Surf. Process. Landf. 2020, 45, 3120–3140. [Google Scholar] [CrossRef]
  60. Cornebise, J.; Oršolić, I.; Kalaitzis, F. Open high-resolution satellite imagery: The WorldStrat dataset–with application to super-resolution. Adv. Neural Inf. Proces. Syst. 2022, 35, 25979–25991. [Google Scholar] [CrossRef]
  61. Fryirs, K.; Brierley, G. Assemblages of geomorphic units: A building block approach to analysis and interpretation of river character, behaviour, condition and recovery. Earth Surf. Process. Landf. 2022, 47, 92–108. [Google Scholar] [CrossRef]
Figure 1. Study area. The orange rectangles represent the extent of the 5 satellite image tiles used for the analysis (the same orange rectangles are used in the overview map in the following figures). The focus areas extent are represented by the green rectangles. The location of the Pontelagoscuro hydrometer is represented by a black triangle.
Remotesensing 17 01070 g001
Figure 2. Data processing flowchart showing the main steps followed to analyze Sentinel-2 MSI data for detecting anomalies in water frequency.
Remotesensing 17 01070 g002
Figure 3. Monthly SDI and CV (the latter represented by bubble size) calculated for Po River discharge at the Pontelagoscuro hydrological station for the year 2022. See Table 1 for SDI values classification (drought).
Remotesensing 17 01070 g003
Figure 4. Streamflow Drought Index (SDI) values calculated for the Po River discharge in the period 1961–2023. Discharge data refer to the Pontelagoscuro hydrometer (see Figure 1). The blue gradient colors represent positive SDI values; the red gradient colors represent negative SDI values.
Remotesensing 17 01070 g004
Figure 5. Calendasco focus area (green rectangle in the overview map). Monthly water frequencies (MWFs) observed in (a) July 2018 and (b) July 2022. (c) Comparison of distribution frequency of MWF in July 2018 and July 2022. (d) Monthly water frequency anomalies (MWFAs) in July 2022.
Remotesensing 17 01070 g005
Figure 6. Pontelagoscuro focus area (green rectangle in the overview map). Difference from the previous month (DPM) during the period May 2022–October 2022. (a) May 2022. (b) June 2022. (c) July 2022. (d) August 2022. (e) September 2022. (f) October 2022.
Remotesensing 17 01070 g006
Figure 7. Spatio-temporal evolution of monthly water frequency anomalies (MWFAs) calculated against the monthly means for the period 2016–2023 at 1 km increments along the Po River.
Remotesensing 17 01070 g007
Figure 8. Spatial distribution of OWF for the three selected focus areas (green rectangles in the overview map, with corresponding sub-figure letter). (a) Braided patterns. (b) Partially confined channel forms. (c) Longitudinal lateral bars. (d) Coefficient of variation in monthly water frequency (CVOWF, 10 km moving average) over the river course.
Remotesensing 17 01070 g008
Figure 9. (a) Subdivision of the Po river area, in Pontelagoscuro (green rectangle in the overview map), into slices (polygons in red color) of 1 km length: the location of the reference hydrometer is indicated by a black triangle, while the selected polygon for the analysis of monthly water frequencies is highlighted in yellow color. (b) The trend of monthly average discharge measured by the Pontelagoscuro hydrometer and the trend of monthly water frequency (MWF) calculated for the selected area over the period 2016–2023.
Remotesensing 17 01070 g009
Figure 10. (a) Overall water frequency (OWF) of Trebbia River tributary. (b) Monthly water frequency anomaly (MWFA) during July 2022 of Trebbia River tributary. (c) Overall water frequency (OWF) of Oglio River tributary. (d) Monthly water frequency anomaly (MWFA) during July 2022 of Oglio River tributary.
Remotesensing 17 01070 g010
Table 1. Classification of wet and drought period according to SDI.
SDICategory
SDI ≥ 2Extremely wet
1.5 ≤ SDI < 2Severely wet
1 ≤ SDI < 1.5Moderately wet
0 < SDI < 1Mildly wet
−1 ≤ SDI < 0Mild drought
−1.5 ≤ SDI < −1Moderate drought
−2 ≤ SDI < 1.5Severe drought
SDI < −2Extreme drought
Table 2. Results of t-test analysis on MWF for the period June–September. For each year in the period 2016–2023, average number of slices where the MWF of the given year was found to be lower than the average (p < 0.05), along with the % over the whole study area, are reported.
YearNumber of 1 km SlicesProportion of the Entire Study Area (%)
20168918.5
20176613.7
2018275.5
2019214.3
202081.7
2021326.7
202234271.4
20236112.7
Values in bold refers to the analyzed drought year 2022.
Disclaimer/Publisher’s Note: The statements, opinions and data contained in all publications are solely those of the individual author(s) and contributor(s) and not of MDPI and/or the editor(s). MDPI and/or the editor(s) disclaim responsibility for any injury to people or property resulting from any ideas, methods, instructions or products referred to in the content.

