Article

An Improved YOLOv8-Based Lightweight Attention Mechanism for Cross-Scale Feature Fusion

College of Field Engineering, Army Engineering University of PLA, Nanjing 210007, China
*
Author to whom correspondence should be addressed.
Remote Sens. 2025, 17(6), 1044; https://doi.org/10.3390/rs17061044
Submission received: 8 February 2025 / Revised: 13 March 2025 / Accepted: 14 March 2025 / Published: 16 March 2025

Abstract

:
This paper addresses the challenge of small object detection in remote sensing image recognition by proposing an improved YOLOv8-based lightweight attention cross-scale feature fusion model named LACF-YOLO. Prior to the backbone network outputting feature maps, this model introduces a lightweight attention module, Triplet Attention, and replaces the Concatenation with Fusion (C2f) with a more convenient and higher-performing dilated inverted convolution layer to acquire richer contextual information during the feature extraction phase. Additionally, it employs convolutional blocks composed of partial convolution and pointwise convolution as the main body of the cross-scale feature fusion network to integrate feature information from different levels. The model also utilizes the faster-converging Focal EIOU loss function to enhance accuracy and efficiency. Experimental results on the DOTA and VisDrone2019 datasets demonstrate the effectiveness of the improved model. Compared to the original YOLOv8 model, LACF-YOLO achieves a 2.9% increase in mAP and a 4.6% increase in mAPS on the DOTA dataset and a 3.5% increase in mAP and a 3.8% increase in mAPS on the VisDrone2019 dataset, with a 34.9% reduction in the number of parameters and a 26.2% decrease in floating-point operations. The model exhibits superior performance in aerial object detection.

1. Introduction

In recent years, with the increasing prominence of remote sensing technology in both production and daily life [1], there has been a growing focus on this field. Consequently, research on remote sensing imagery has become increasingly sophisticated, particularly in the area of small object detection within remote sensing images, attracting a larger and more dedicated community of researchers. This has the potential to greatly advance various fields such as traffic management [2,3,4,5,6,7], environmental monitoring [8,9,10,11,12,13,14], urban planning [15,16,17,18], and agricultural production [19,20,21,22,23]. Despite these potential benefits, the high-altitude dynamic flight of aerial vehicles leads to images with extremely wide fields of view, small target sizes, and blurred features. Additionally, since the images are captured from the air, weather conditions significantly impact the process, with factors like lighting, haze, and cloud cover exacerbating the difficulty of remote sensing image target detection. Given that uncontrollable factors like the weather are difficult to alter, we must focus on technical improvements to the targets post-imaging. In remote sensing images, small targets with dimensions below 32 × 32 pixels constitute the majority, as shown in Figure 1. The vertical axis represents the names of image datasets, while the horizontal axis indicates the proportion of targets classified by size within each dataset. Red denotes small targets, labeled as ‘S’. Yellow signifies medium targets, labeled as ‘M’. Blue represents large targets, labeled as ‘L’. It is evident from the figure that small targets in red dominate, while large targets in blue account for a minority.
The detection challenge associated with small targets is primarily due to the inherent blurriness of their features and the loss of these features through continuous convolutional operations within models, ultimately making it difficult to improve the accuracy of small target detection. In response to this challenge, numerous scholars have conducted research in this area. Xu et al. [24] integrated downsampling operations into the original backbone structure of YOLOv5 to obtain richer positional information of objects. Under the function of an FPN (feature pyramid network), they generated deeper hierarchical and more semantically rich feature mappings, ultimately producing a detection head with stronger semantic expression to enhance the feature extraction capability for small targets. Liu [25], addressing the issue of poor real-time performance in small target segmentation, proposed a dual-branch hierarchical decoder (DBHD) and a small object instance mining (SOEM) algorithm. These approaches assist the backbone network in fully exploring the relationships between small objects and retain more complex small target instances for training. Liu [26], facing the challenge of increased computational and memory demands when using image magnification to improve small target detection accuracy, employed an efficient small object detection method (ESOD) based on CNN detectors. This method, which involves object searching and patch slicing operations, reduces the number of feature extractions while maintaining effectiveness, thus overcoming the computational and memory issues caused by image magnification. Chen [27], to enhance the tracking of small targets in mosaic spectral videos, utilized a spectral filter array (SFA)-guided mosaic transformer (SMT). The transformer has roles in extracting spatial–spectral features, reorganizing features at different levels, and target localization in its backbone, neck, and head modules.
It is evident that some researchers have employed two-stage detection algorithms such as Fast R-CNN [28] and Faster R-CNN [29]. As classic algorithms in the field of object detection, their superior accuracy in detection must be acknowledged. However, in the context of current real-time detection requirements, detection efficiency is as crucial as detection accuracy. The two-stage algorithms, which first generate prediction boxes, have inherent structural limitations that make it difficult for them to achieve greater improvements in detection efficiency. On the other hand, improvements made to one-stage network models like YOLO [30] and SSD [31] show significant potential for development. Nevertheless, examining the research of the aforementioned scholars also reveals existing issues: to address the low precision in small target detection, enhancements have been made to strengthen feature representation or reduce the loss of detailed information, without considering the practical need to deploy the network models on UAVs and other imaging systems, which necessitates attention to model size. Furthermore, these improvements exhibit overlapping effects, which do not significantly enhance the model’s performance. Therefore, this paper proposes a more comprehensive and rational improvement based on YOLOv8 [32]. Specifically, the contributions of this paper are as follows:
  • We propose a lightweight attention mechanism combined with a cross-scale feature fusion model called LACF-YOLO, which is based on YOLOv8. This approach was adopted after a comprehensive analysis of detection accuracy and efficiency, and it contributes to enhancing the level of detection in remote sensing images.
  • During the feature extraction phase, we employ a lightweight DIB (dilated inverted bottleneck) module coupled with a parameter-efficient TA (Triplet Attention) mechanism to reconstruct the feature extraction network. This enhancement improves the feature map’s representation and the network’s capability for feature extraction, while significantly reducing the number of parameters.
  • A convolutional block composed of PC (partial convolution) and PWC (pointwise convolution) is utilized to connect feature maps across different levels, thereby enhancing the capability to integrate cross-scale feature information.
  • The Focal-EIOU loss function is employed as a replacement for the CIOU loss. The Focal strategy allocates greater influence to high-quality anchor boxes, addressing the issue of sample imbalance and overcoming the challenge of slow convergence associated with the traditional CIOU loss function.

2. Related Work

In this section, we will focus on several aspects related to this study, which will be discussed in detail across Section 2.1, Section 2.2, Section 2.3 and Section 2.4. Specifically, we will introduce the overall framework of YOLOv8, the challenges in small object detection, the evolution and application of attention mechanisms, and the development and application of feature fusion techniques.

2.1. YOLOv8 Detection Framework

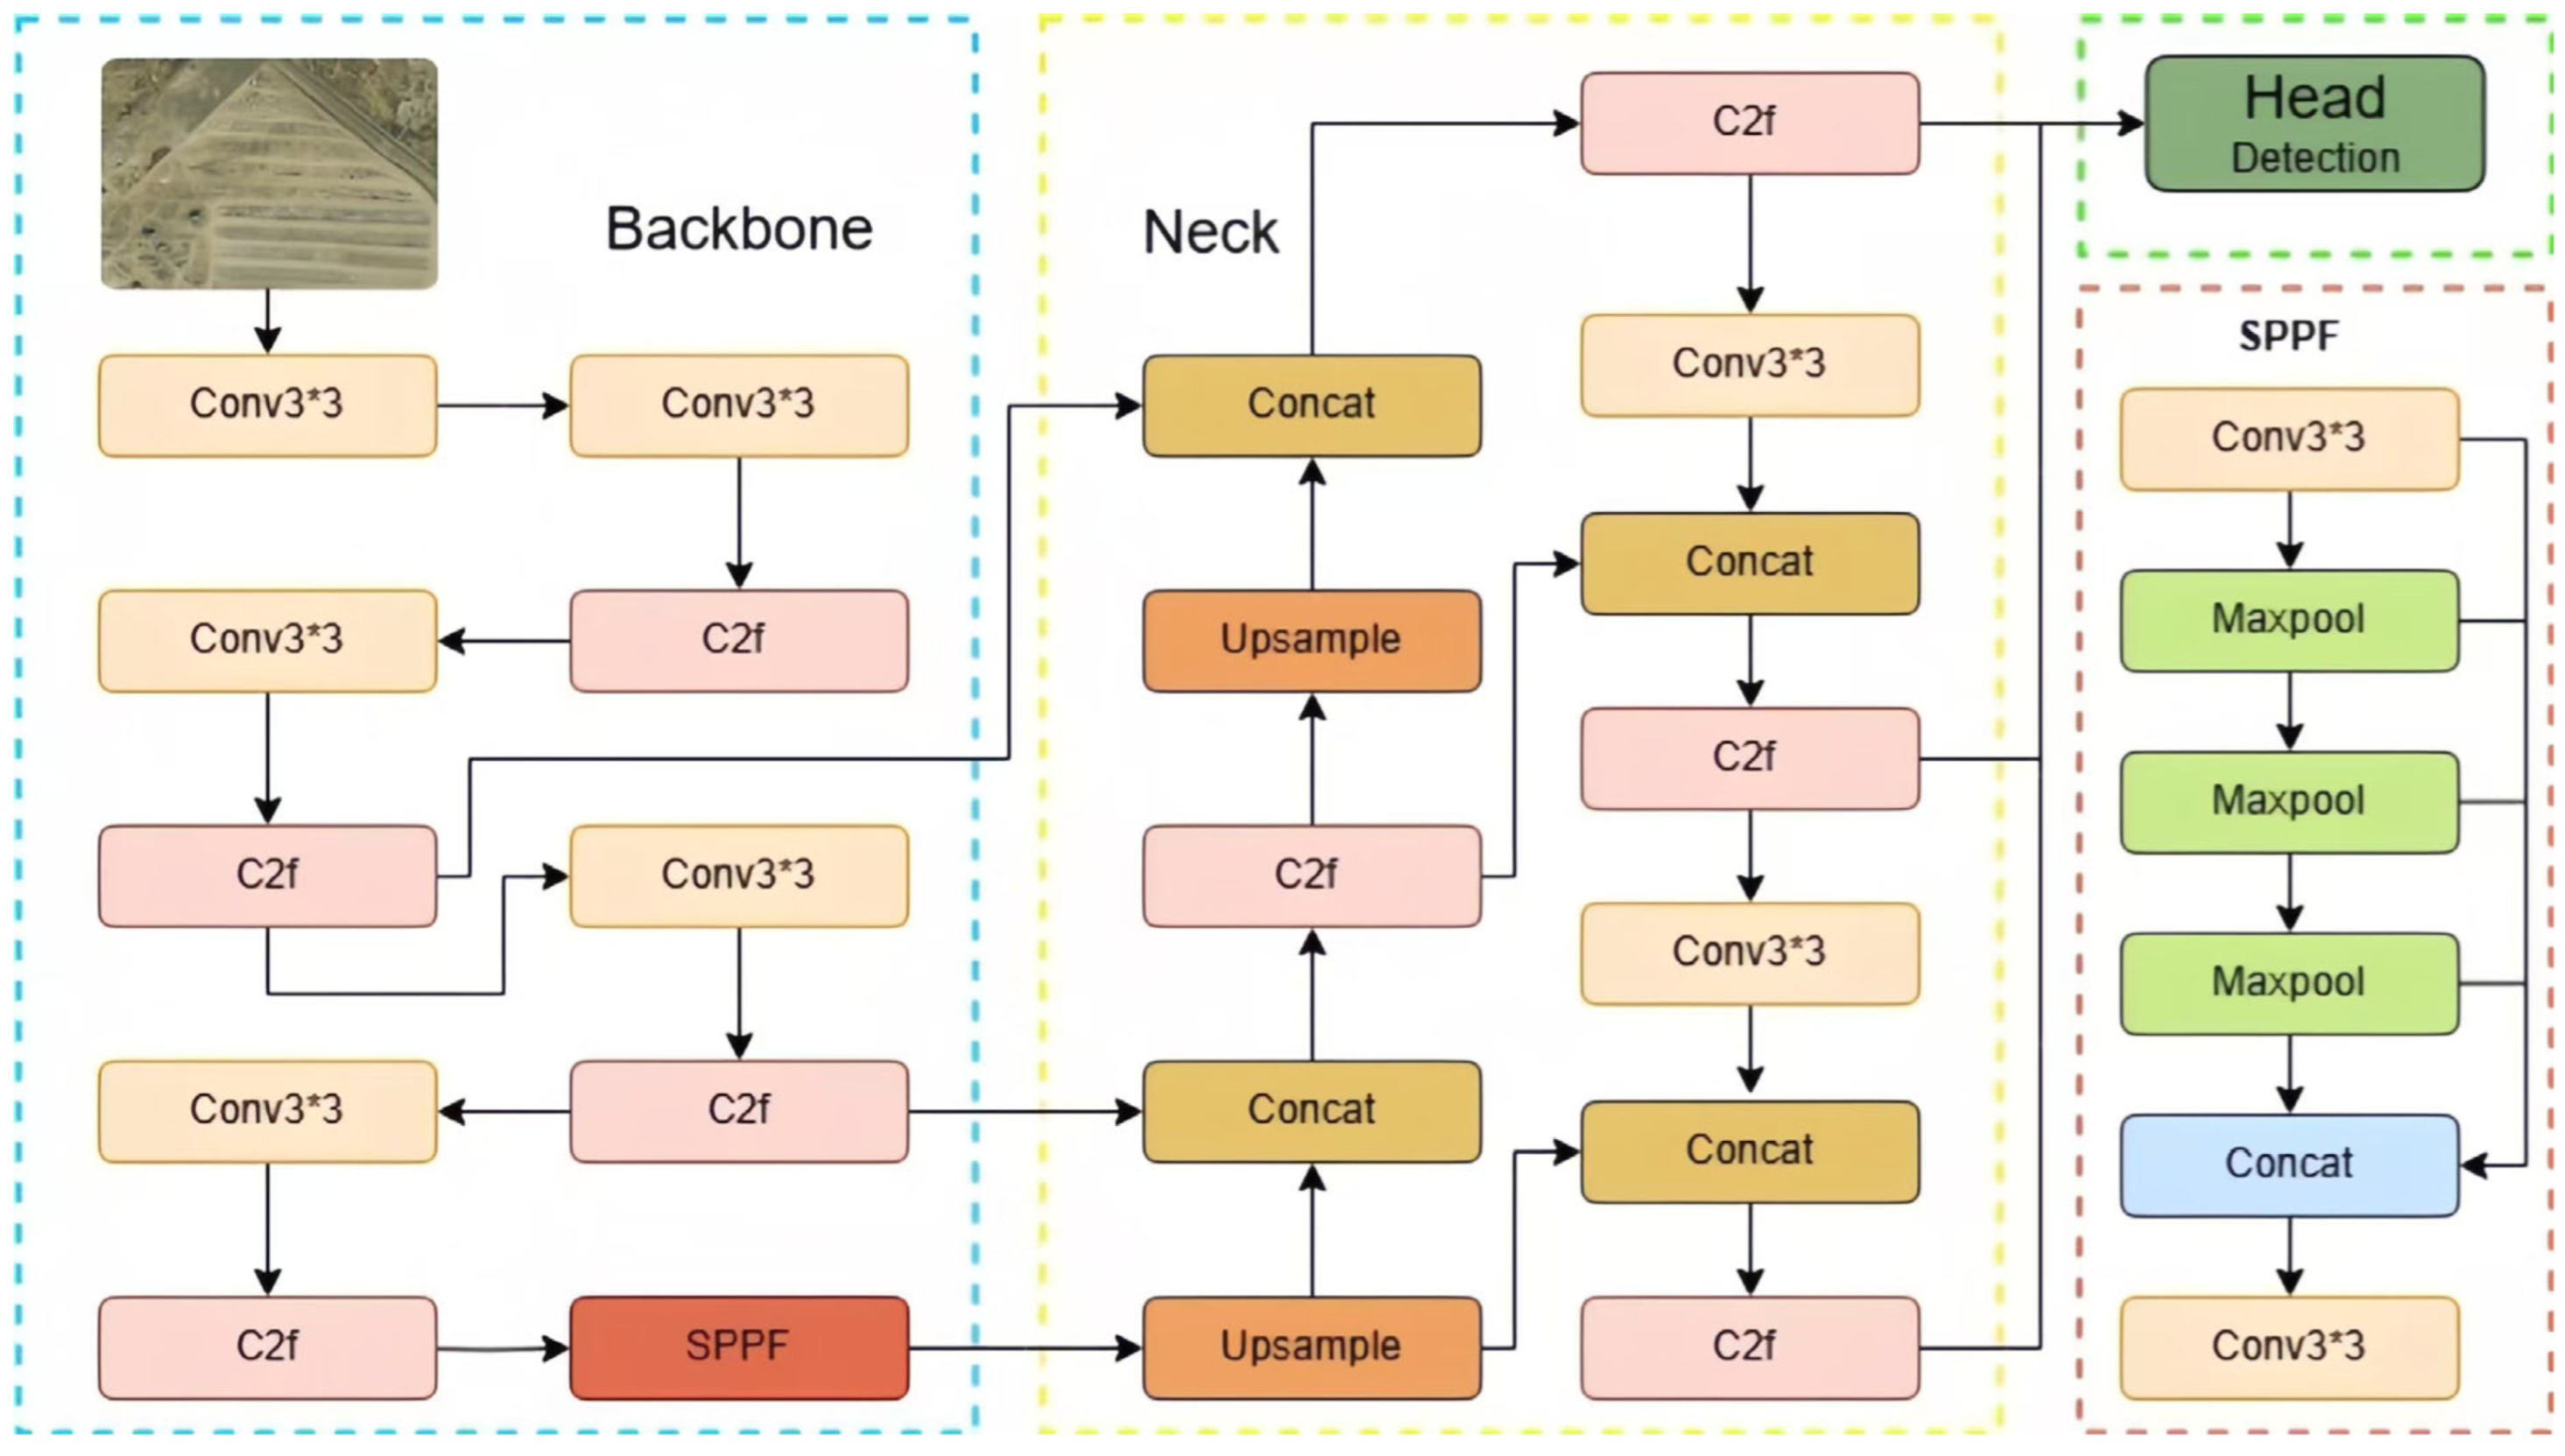
In 2023, Ultralytics developed YOLOv8, which inherits the design philosophy of YOLOv5 and introduces significant improvements over its predecessor, marking another iterative update in the YOLO series. The network architecture of YOLOv8 is primarily divided into three components: the backbone, neck, and head, as depicted in Figure 2. Different parts are delineated with dashed lines of various colors, and distinct modules within the structure are represented by solid colored boxes. The input image, guided by black arrows, sequentially undergoes feature extraction, feature fusion, and detection operations. The feature extraction network is primarily composed of convolutional blocks and C2f modules, with a crucial module, the SPPF (Spatial Pyramid Pooling—Fast), located at the end of this section, highlighted within the red dashed box on the right side of Figure 2. The feature fusion network, building upon convolutional blocks and C2f modules, incorporates concatenation and upsampling operations to connect feature maps output from different levels of the feature extraction network and process them before passing them through the C2f modules to the detection head. Specifically, the backbone is the phase where the model extracts features from the input images. In YOLOv8, the backbone utilizes the C2f module, which is a distinct feature from YOLOv5. Additionally, an improved CSPDarknet backbone network is employed to allow for better feature fusion, enhancing the model’s efficiency and accuracy. The neck serves as an intermediary network connecting the backbone to the detection head, playing a crucial role in aggregating feature maps outputted by the backbone and passing them to the detection head. YOLOv8’s fusion network in the neck combines the feature pyramid network (FPN) structure with the path aggregation network (PANet), strengthening the network’s feature fusion capabilities, especially when dealing with multi-scale target images, thus providing the model with smoother and more efficient performance. The head is where predictions are made, and bounding boxes and object class probabilities are outputted. YOLOv8’s detection head introduces an anchor-free architecture, which, in contrast to previous anchor-based detection heads that required the prior generation of bounding boxes, can directly predict the center coordinates of objects, significantly improving detection efficiency.
Furthermore, to accommodate various hardware and application scenarios, YOLOv8 offers five model sizes: YOLOv8n, YOLOv8s, YOLOv8m, YOLOv8l, and YOLOv8x. This paper selects YOLOv8s, which balances high detection accuracy with speed, as the base model for our experiments. YOLOv8s, a lightweight model in the YOLOv8 series, performs well on multiple datasets. It has few parameters and low computational complexity, making it suitable for deployment on drones and in line with our research goals.

2.2. Challenges in Small Object Detection

In the field of computer vision, the detection of small objects has long been an unresolved challenge. An in-depth analysis of the characteristics of small objects and the impact of external factors on detection performance reveals that the scarcity and susceptibility of small object features to interference present the primary challenge. Much like how law enforcement struggles to make effective arrests without sufficient information about criminals, small object detection also faces the issue of insufficient feature information. The limited pixel footprint of small objects in images results in a corresponding reduction in the available features that can be extracted, leading to greater difficulty for models in making accurate object identifications. Furthermore, small objects often blend with the background or other objects, increasing the complexity of detection and potentially causing false positives or false negatives.
The lack of representativeness in datasets is also a significant factor limiting the effectiveness of small object detection. Most mainstream detection models are primarily trained on large-scale datasets; however, these datasets often provide insufficient coverage of small objects. For instance, datasets such as Pascal VOC [33] and ImageNet [34], while encompassing a variety of object categories, fall short in terms of the variety and quantity of small objects. This insufficiency fails to accurately reflect the actual demands of small object detection tasks.
Lastly, the performance limitations of detection models cannot be overlooked. In convolutional neural networks, the limited receptive field makes it difficult for models to capture contextual information of small targets. Additionally, the spatial resolution reduction of feature maps due to convolutional operations exacerbates the challenge of detecting targets that inherently have a limited number of pixels.
To address the aforementioned challenges, we need to optimize both the dataset and model performance. Regarding the dataset, training with datasets specifically tailored to small object detection can be beneficial. For instance, the Lost_and_Found [35] traffic dataset and the AI-TO [36] aerial image dataset contain a substantial number of small object instances, which can help improve the model’s detection capabilities. In terms of model development, exploring new network architectures or algorithms to expand the receptive field and enhance the resolution of feature maps can strengthen the model’s performance in detecting small objects. Through these efforts, we anticipate achieving more significant advancements in the field of small object detection.

2.3. Development and Application of Attention Mechanisms

To assist models in enhancing the detection accuracy of small objects, the attention module mechanism has been introduced. This mechanism dates back to the 1990s, when attention mechanisms primarily relied on manually designed features, yielding limited effectiveness. Subsequently, with the ongoing advancement of deep learning, attention mechanisms have become intricately integrated with neural networks. A milestone in this evolution was the first application of attention mechanisms to machine translation tasks in 2014. Attention mechanisms can be likened to a thoughtful camera that focuses more on designated target areas, which is of great assistance for small objects with few pixels and blurred features. This has attracted a multitude of scholars to conduct related optimization research. Wang [37] inserted a CA (channel attention) module after his proposed feature fusion module TP-Fusion, which can compute the weights of positional pixels in feature maps, helping the network focus on regions of interest, reduce background noise interference, acquire richer contextual information, and maintain computational efficiency. Che [38], facing the challenge of detecting small underwater objects, combined the advantages of channel attention, spatial attention, and size attention to construct a unified framework, thus fully leveraging the feature extraction capabilities of the backbone network and capturing more detailed information of small targets. Xu [24] introduced a decoupled attention detection head to avoid interference between different bounding box predictions; it first computes the weights of feature channels and then applies these weights to the channels. Using the decoupled head’s attention mechanism, it separates the computation of bounding boxes for location, confidence, and class probabilities. Wang [39] used selective convolution based on attention mechanisms to endow input images of varying sizes with the ability to adapt to changes in receptive fields and then aggregate images assigned different weights. Xiong [40] employed a subspace attention-based channel shuffling spatial attention module (CSSAM) to improve the recognition accuracy of small objects and reduce background noise interference, also using a weight allocation approach that can detect more detailed subspace weight differences and promote information interaction between channels through channel shuffling operations. Pierre Le Jeune [41] combined spatial alignment, global attention mechanisms, and fusion layers in few-shot object detection, using attention modules between support images and query images to align feature maps and enhance the features between them, highlighting information related to the detection targets and improving detection accuracy. Additionally, the global attention mechanism was used to weaken irrelevant targets and suppress background noise in the support images.

2.4. Development and Application of Feature Fusion

Although attention mechanisms can enhance the ability to capture contextual information during the feature extraction phase, integrating information from different hierarchical levels is also crucial for improving object detection performance. Feature fusion strategies consolidate features from various levels into a more comprehensive, complete, and information-rich output feature map. In the early stages of object detection, the concept of feature fusion was not yet fully formed. Despite initial attempts through handcrafted features [42,43] combined with classifiers [44], the outcomes were far from satisfactory. With the rise of convolutional neural networks, the idea of feature fusion began to be gradually applied, as seen in models such as R-CN [45], Fast R-CNN, and Faster R-CNN, which employ an end-to-end approach to feature fusion. The Spatial Pyramid Pooling Network (SPPNet) [46] further deepens and extends the concept of feature fusion.
With the further advancement of convolutional neural networks, there has been a growing recognition of the significance of features at different hierarchical levels. Nowadays, cross-scale feature fusion is increasingly favored. Considering that the traditional YOLOv8’s path aggregation network lacks the integration of feature maps from various hierarchical levels and the advantages of cross-scale feature fusion, the application of a cross-scale feature fusion module is expected to significantly enhance the model’s performance.

3. Materials and Methods

In this section, we will explore the improvement methods made on the basis of the YOLOv8 model. Initially, we introduce the overall framework structure of the improved model and elucidate the necessity of these enhancements. Subsequently, following the processing flow of images within the model, we will discuss the refinement of the C2f module, the introduction of the TA attention module, the application of cross-layer feature fusion networks in the neck, and the optimization of the loss function in Section 3.1 through Section 3.4, respectively.
In the traditional YOLOv8 model, the C2f module employs standard convolutions and bottleneck structures. This combination performs well in general object detection tasks. However, numerous researchers have made improvements on this basis. Wang [47] introduced partial convolutions and efficient attention modules into the bottleneck structure of C2f, aggregating multi-scale spatial structural information without reducing channel dimensions. Yan [48] replaced the C2f module with a more efficient feature extraction module, the FasterCSP module, aiming to alleviate computational load through its partial convolution module. Wang [49] integrated spatial channel restructured convolution into C2f, reducing redundant spatial and channel components, thereby enhancing the model’s computational efficiency and obtaining richer gradient flow information. Given that this study aims to enhance the detection performance of remote sensing images, it is essential to consider the impact of model parameters and minimize their increase during the improvement process. Therefore, this paper proposes the use of dilated convolutions as a replacement for traditional convolutions and employs an inverted bottleneck structure. This improvement not only reduces network parameters but also enhances detection accuracy.
Furthermore, the feature extraction phase is crucial within the entire network architecture, and merely improving the C2f module may not significantly enhance the feature extraction effectiveness. To address this, the introduction of an attention mechanism during the feature extraction phase can focus on more critical information while suppressing redundant details, thereby strengthening the feature representation capability. This mechanism is particularly adept at capturing detailed information about small objects, thereby improving the detection performance of small targets. To meet the lightweight requirement, a Triplicate Attention (TA) module is added after each DIBL layer; this mechanism requires minimal parameters but plays a significant role in the feature extraction phase.
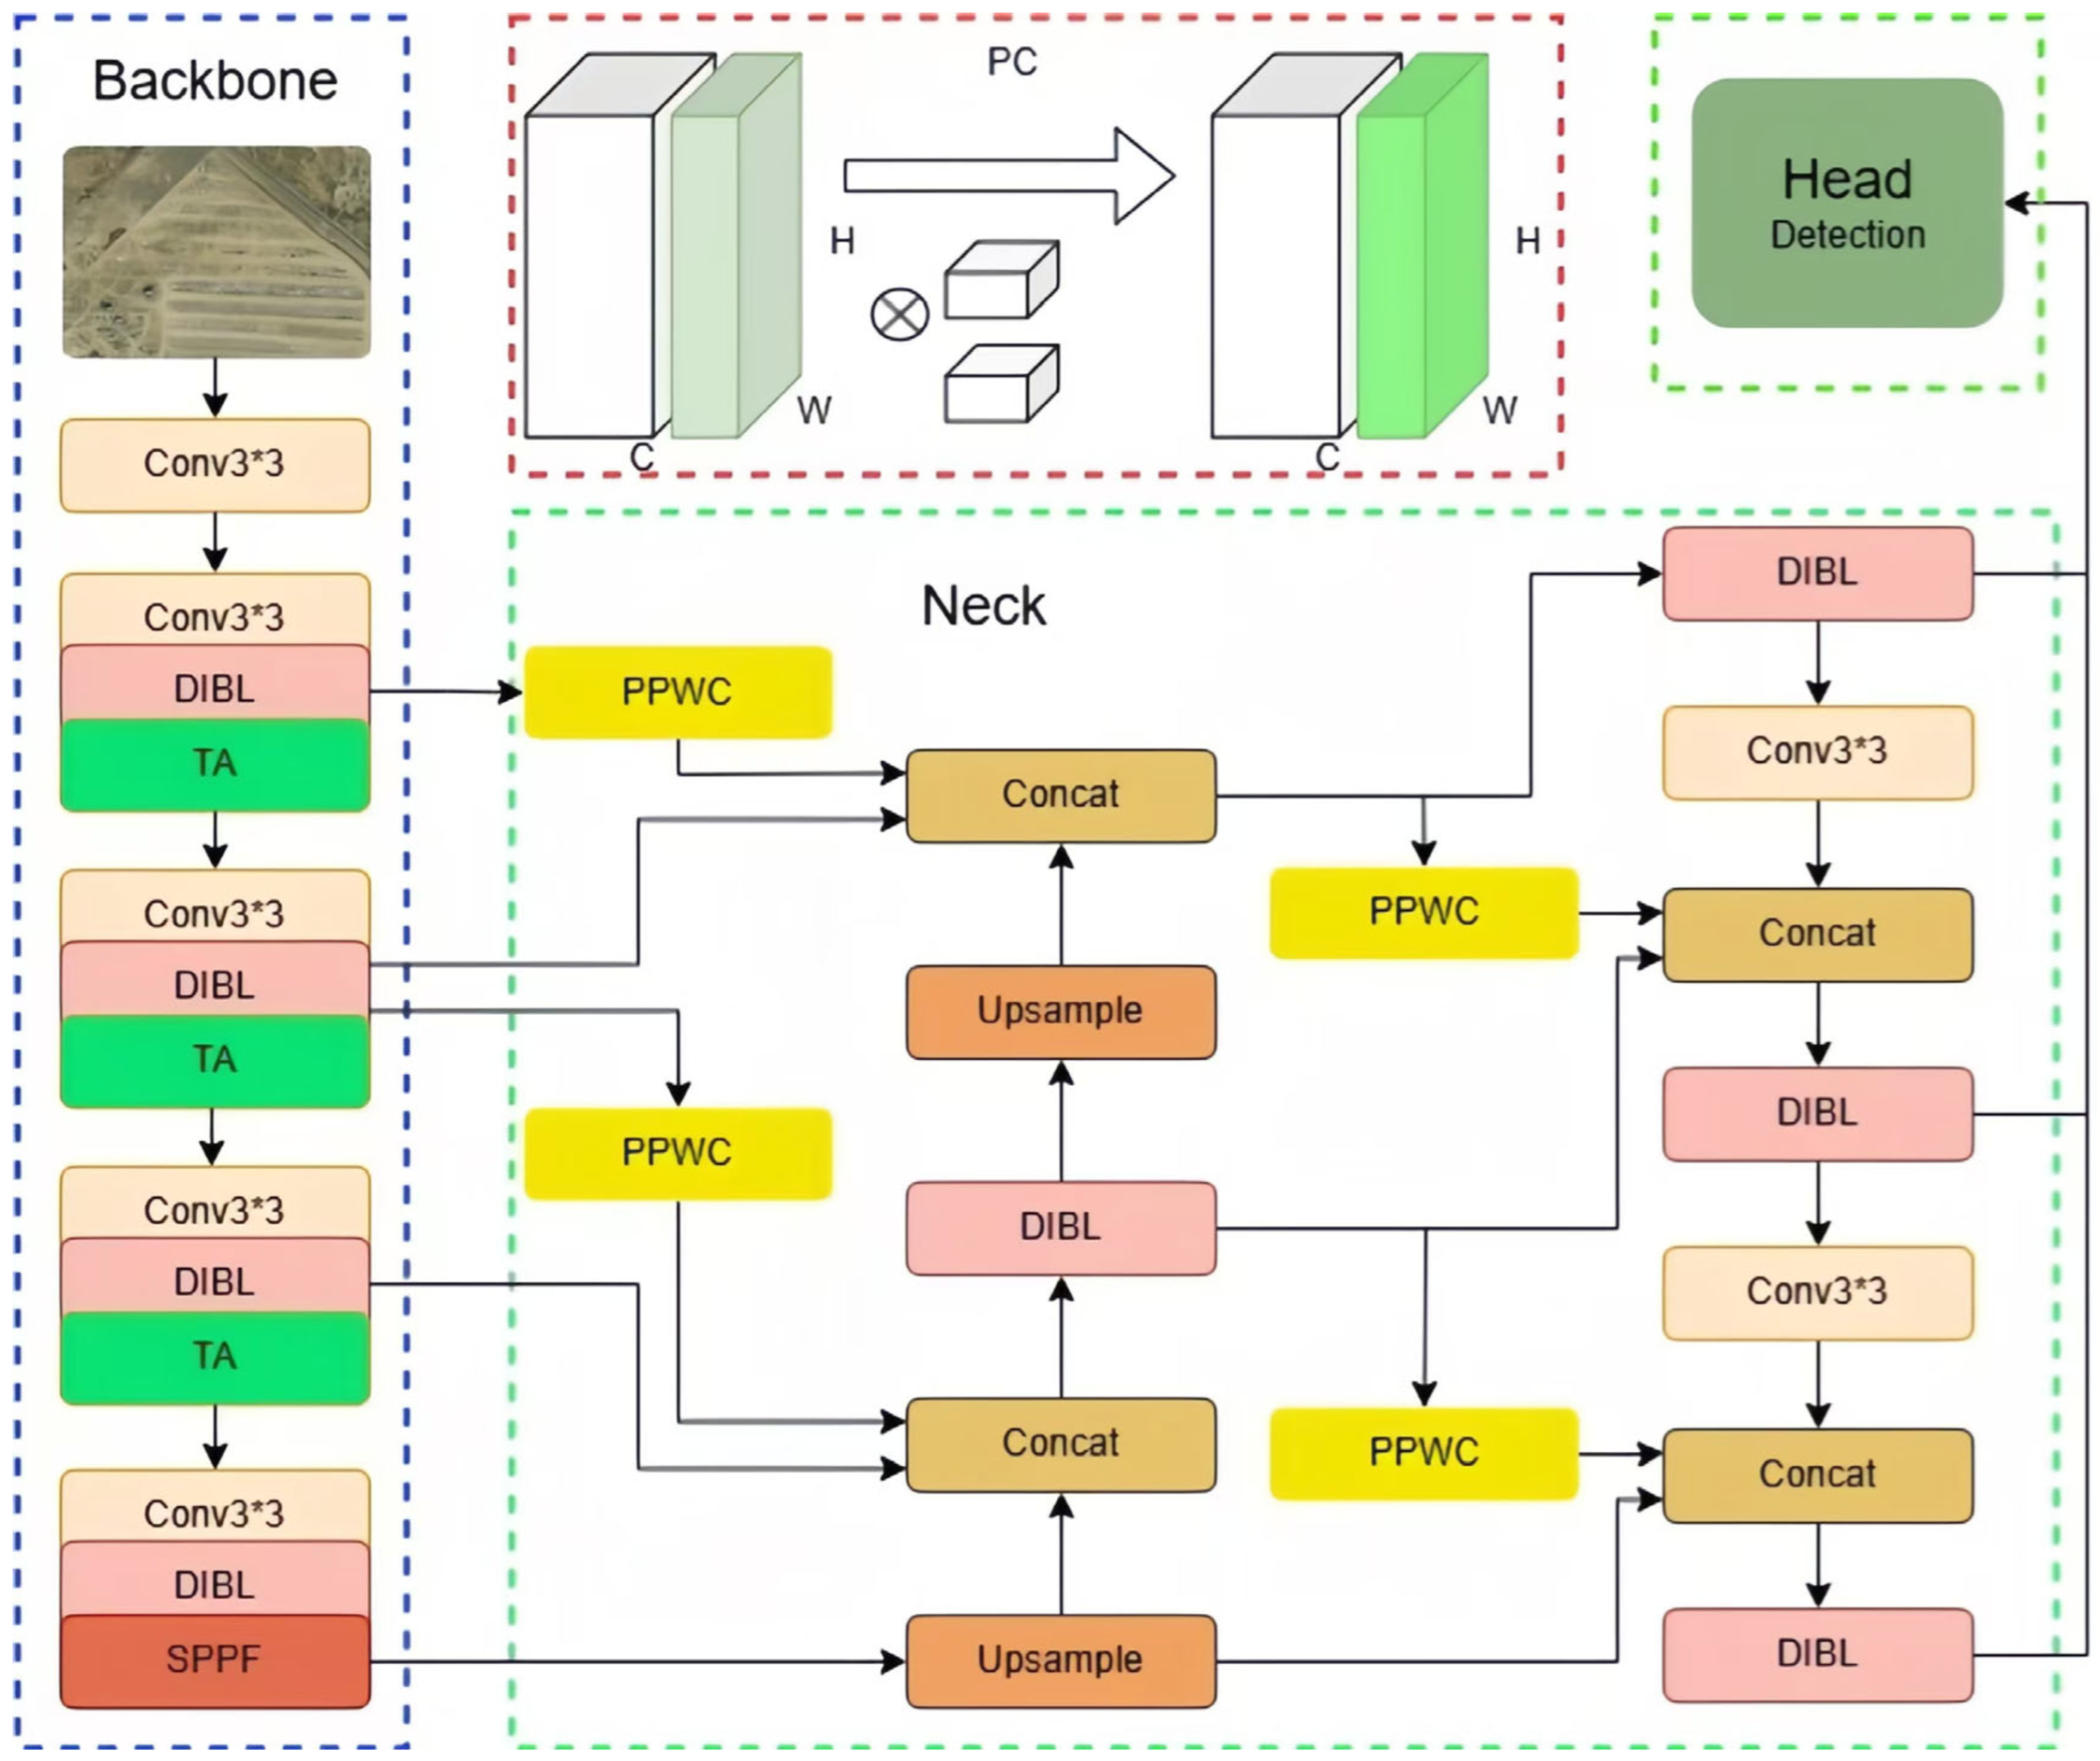
In the traditional structure of the neck network, the bottom-up and top-down path aggregation networks focus only on the feature maps of adjacent levels, neglecting the cross-level differences between the bottom and top feature maps. To integrate more feature information, a lightweight convolutional block (PPWC) is introduced in the neck network to connect feature maps across different levels and consolidate more detailed information from various levels. This convolutional block combines partial convolution and pointwise convolution; although it consists of two types of convolutions, it increases fewer parameters and offers higher computational efficiency compared to traditional convolutions.
Finally, we replace the CIOU loss in YOLOv8 with the Focal-EIOU loss, which converges faster and offers higher localization accuracy. Although CIOU takes into account the loss of width and height, its approach of adding geometric parameters often leads to slower convergence, implying that the model requires more iterations to achieve the same level of performance, thereby increasing training time and consuming more computational resources. Focal-EIOU, on the other hand, employs the Focal loss to allocate more weight to high-quality anchor boxes with high overlap, thus reducing the impact of numerous low-overlap anchor boxes on regression. The structure of the improved model is shown in Figure 3. In the figure, Conv3×3, DIBL, and TA trios within the backbone network are represented as an integrated output module. The newly added PPWC in the feature fusion network is indicated by a yellow box, which connects to the output module of the backbone network and leads to the concatenation layer of different hierarchical levels in the feature fusion network. The red dashed box at the top of Region 3 visualizes the partial convolution process; C, W, and H represent the channel length, width, and height, respectively. It can be observed that after partial convolution, the light-green parts become dark green, illustrating that partial convolution refers to the operation conducted on a subset of channels.

3.1. Dilated Inverted Bottleneck (DIB) Layer

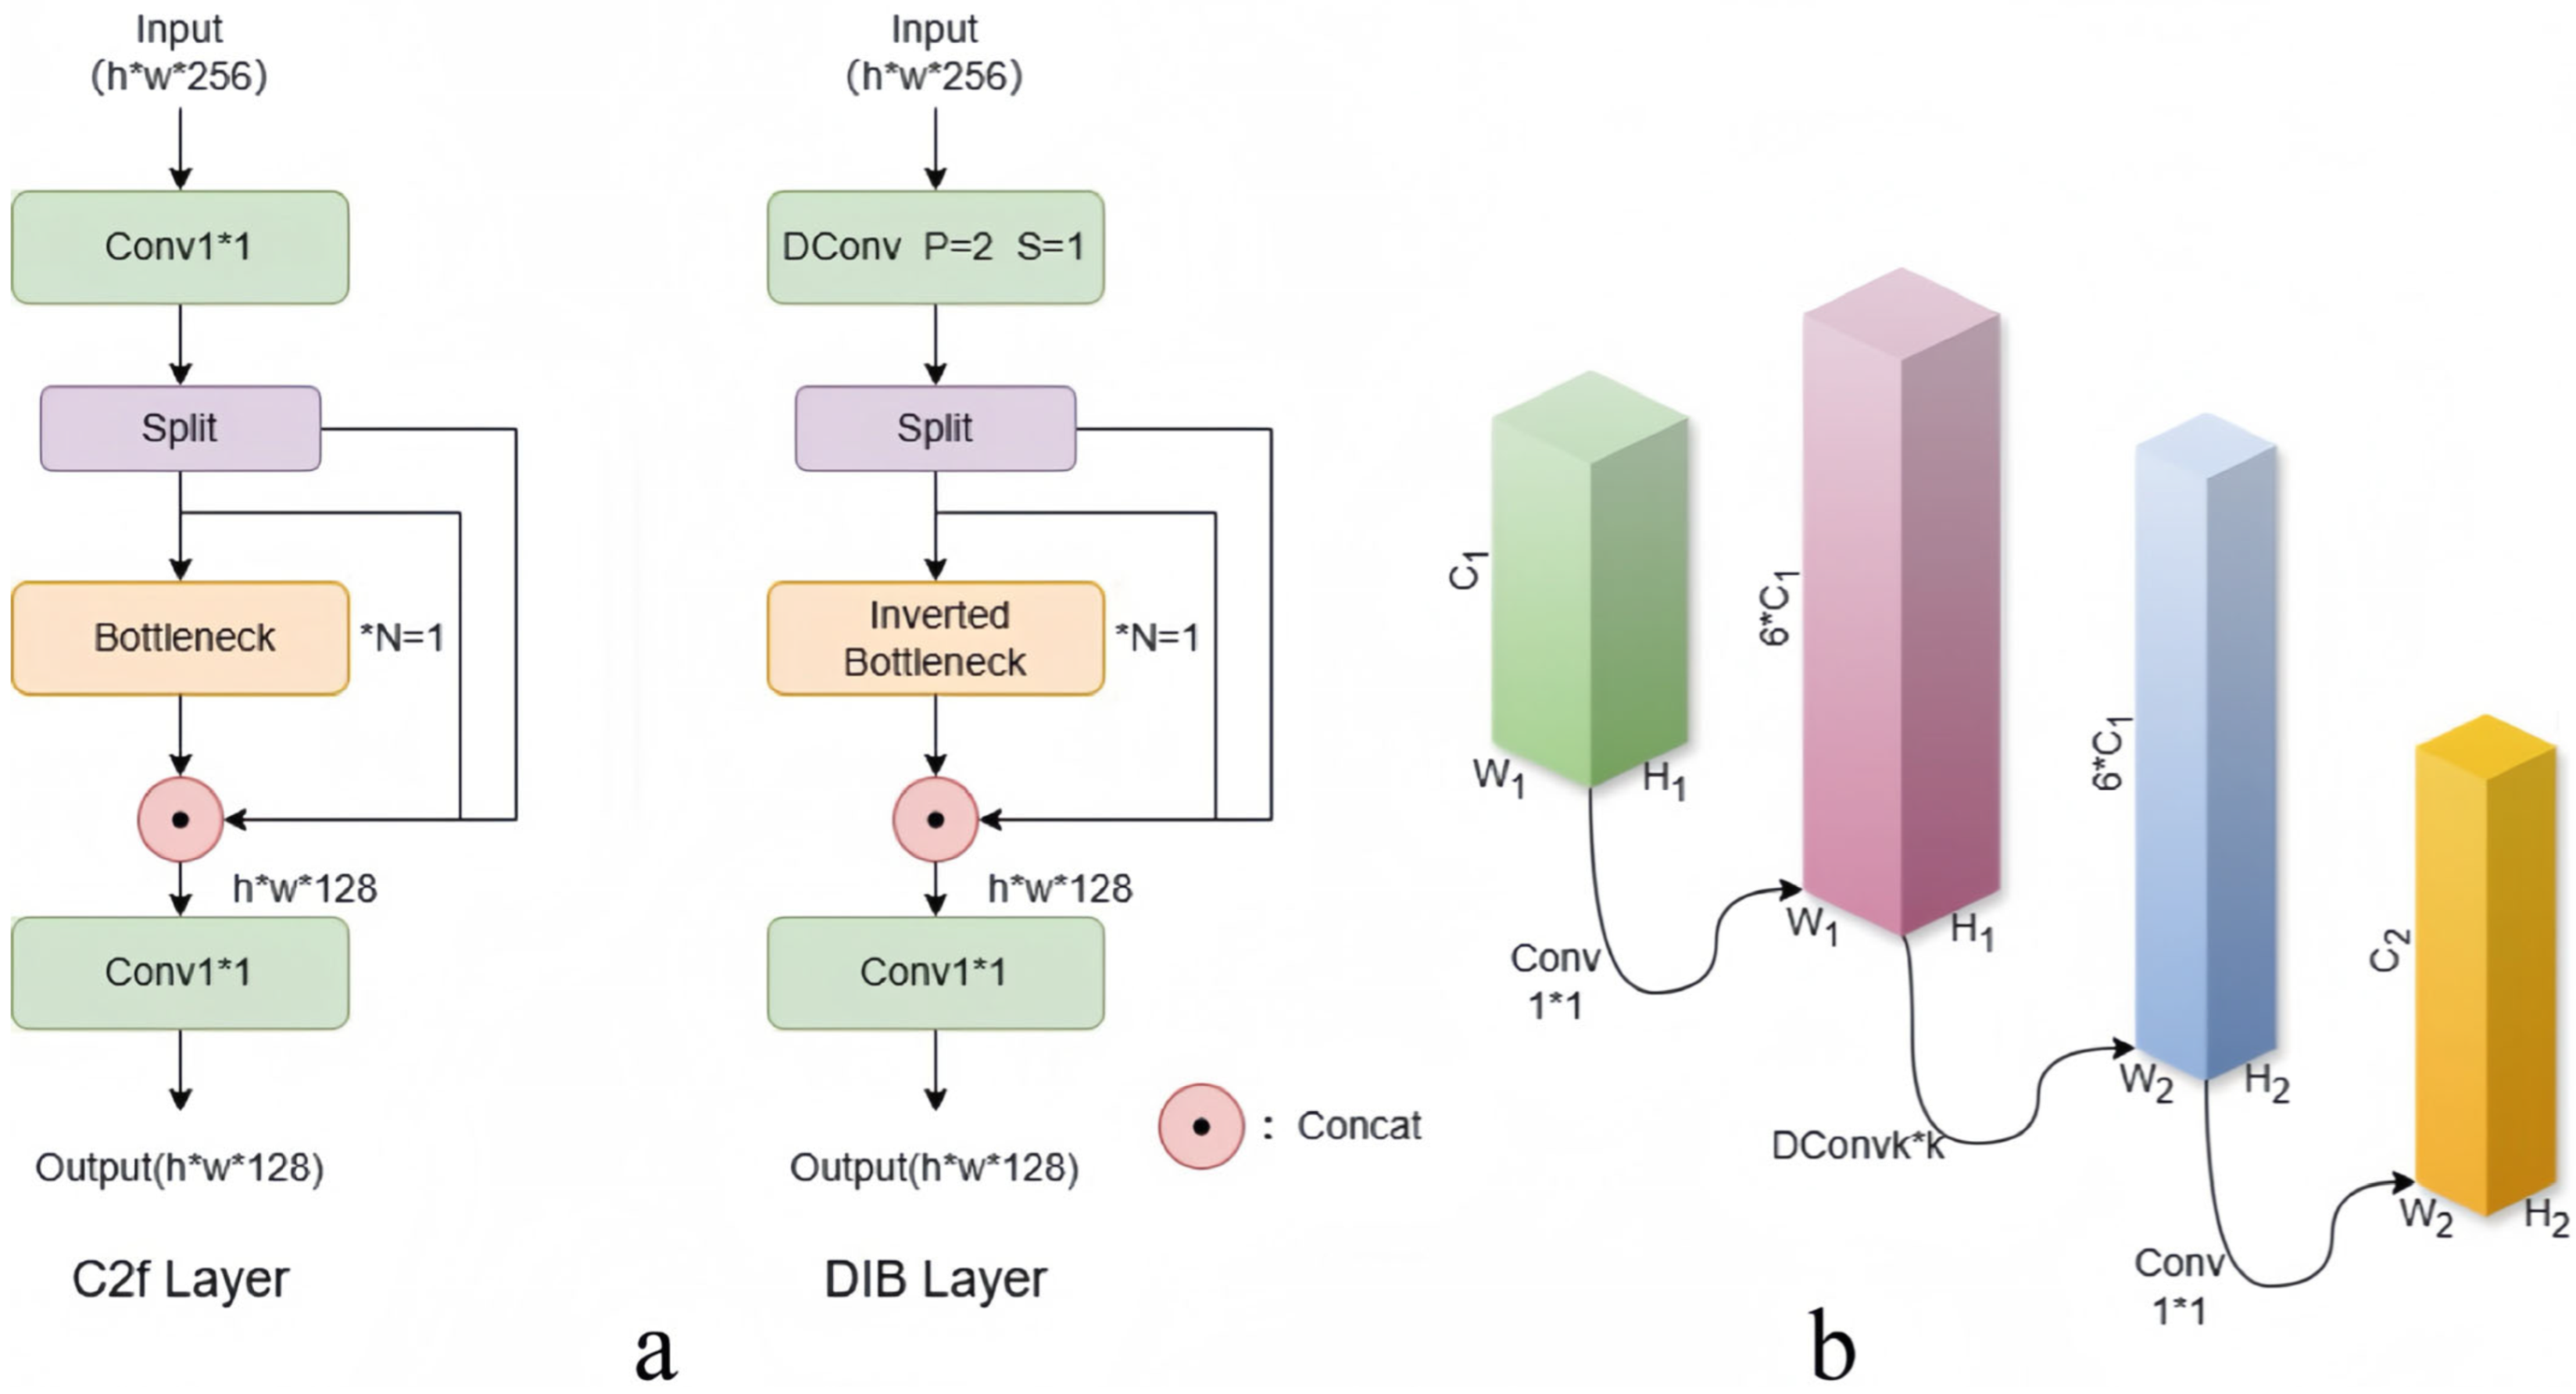
In the traditional YOLOv8 network backbone, the C2f module plays a crucial role, primarily responsible for enhancing the flow and fusion of feature information between different hierarchical levels, thereby effectively integrating deep and shallow layer information. Specifically, during the feature extraction phase, the input image generates multiple feature maps, with shallow feature maps containing more fine-grained information but lacking in the ability to recognize large-scale targets, whereas deep features provide richer semantic information but have a lower resolution. To balance the advantages and disadvantages of these two types of feature maps and improve the overall accuracy of the network, this paper proposes replacing the traditional convolution in the C2f module with dilated convolution [50] and introduces the dilated inverted bottleneck layer (DIB) with an inverted bottleneck structure [51], as shown in Figure 4. Dilated convolution, as a variant of traditional convolution, introduces multiple “gaps” within the convolution kernel’s elements, as depicted in Figure 5. Without adding extra parameters, it expands the receptive field of the convolution kernel as it slides over the feature map, capturing a broader range of feature information compared to regular convolution. The formulas for dilated convolution are shown in Equations (1) and (2):
h o u t p u t = h i n p u t + 2 p d k 1 1 s + 1
w o u t p u t = w i n p u t + 2 p d k 1 1 s + 1
In the equation, h i n p u t , w i n p u t , h o u t p u t , and w o u t p u t denote the height and width of the input image and the height and width of the output image, respectively. p = 2 represents the size of padding, d = 2 denotes the dilation rate, which is the spacing between the elements of the convolution kernel, k = 3 is the size of the convolution kernel, s = 1 indicates the stride of the convolution kernel when it moves across the feature map, and · represents the operation of flooring.
Furthermore, the inverted bottleneck structure employed offers notable advantages over the conventional bottleneck structure. Specifically, this architecture has three main benefits: (1) Enhanced gradient propagation capability: The inverted bottleneck module is structurally similar to residual connections, which enhances the propagation of gradients between layers. (2) Improved memory efficiency: During the feature map extraction process, this structure operates on low-dimensional feature maps within a high-dimensional space and then reverts back to low-dimensional space after processing, significantly reducing the intermediate tensor volume generated during operations in low-dimensional space, thereby decreasing the demand for primary memory access and increasing memory utilization. (3) Reduced information loss: As can be seen in Module b of Figure 4, during the feature extraction process, the inverted bottleneck structure first applies 1 × 1 convolution to the input feature map to increase the number of channels, followed by depthwise separable convolution for feature extraction, and finally compresses the number of channels through 1 × 1 convolution. This design effectively enhances feature representation capabilities and minimizes information loss. The formulas for the inverted bottleneck structure are shown in Equations (3)–(5).
Q = p o i n t w i s e c o n v Z , f i l t e r s , k e r n e l s i z e = 1
Z = d e p t h w i s e c o n v Y , f i l t e r s , k e r n e l s i z e = k
Y = p o i n t w i s e c o n v X , f i l t e r s , k e r n e l s i z e = 1
In the equations, X , Y , Z , Q represent the input feature map, the feature map after pointwise convolution, the feature map after depthwise convolution, and the final output map after pointwise convolution, respectively. f i l t e r s and f i l t e r s denote the number of channels in the corresponding feature maps, which correspond to the modules C 1 and s C 1 in Figure 4b.
Although these methods have demonstrated commendable performance individually, there are still some shortcomings. Consequently, after comprehensive consideration, this paper employs dilated convolutions and inverted bottleneck structures in a concatenated manner. It is hoped that the inverted bottleneck structure, known for its ability to reduce information loss, can compensate for the discontinuity in information caused by the “gaps” in dilated convolutions. Additionally, there may be non-linear layers within the inverted bottleneck structure, which could lead to a decrease in detection performance. This can be mitigated by the advantage of dilated convolutions in expanding the receptive field.

3.2. Triplicate Attention (TA) Module

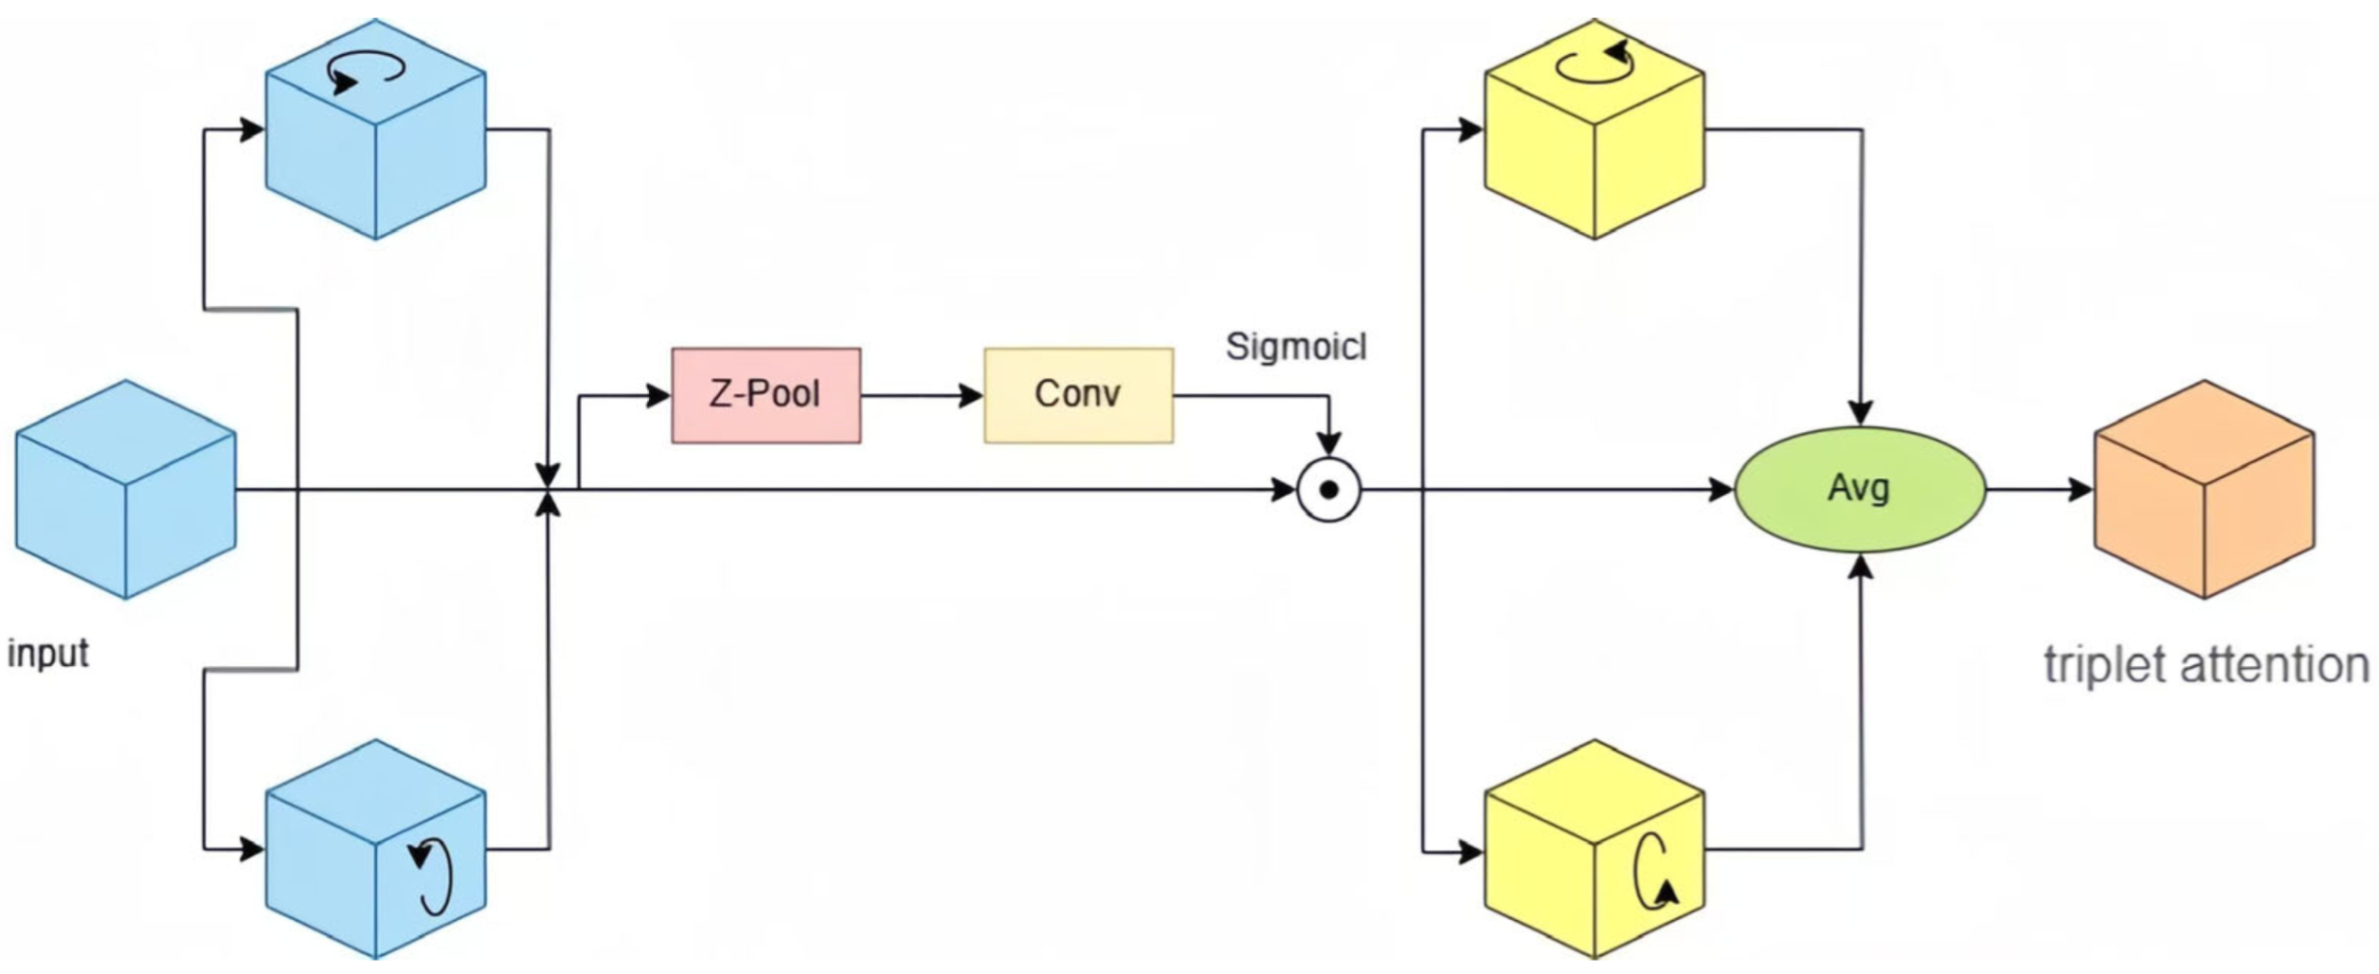
In this paper, the Triplicate Attention [52] mechanism is positioned beneath the DIB layer in the feature extraction network, aiming to address significant challenges such as substantial variations in target scales, complex backgrounds, and severe noise interference in current aerial imagery. These factors pose substantial obstacles to enhancing network detection accuracy, thus necessitating the introduction of an attention module to focus on regions of interest and reduce interference from complex backgrounds. However, some existing attention mechanisms often demonstrate insufficiency in handling multidimensional data or lead to increased computational complexity. Compared to self-attention and multi-head attention [53], the Triplicate Attention mechanism offers the advantage of lower computational complexity; compared to the CoordAttention module [54], it demonstrates greater flexibility when dealing with multidimensional features; and in contrast to the efficient attention mechanism [55], the Triplicate Attention mechanism significantly reduces the number of parameters. Furthermore, the Triplicate Attention mechanism effectively coordinates the interaction between spatial attention [56] and channel attention [57]. While current dynamic [58] and deformable [59] attention mechanisms effectively boost detection accuracy, their computational complexity is much higher than that of the Triplet Attention mechanism, which does not align with our research goals. Specifically, the Triplicate Attention mechanism is a lightweight and efficient attention module, and its process is illustrated in Figure 6. Initially, the mechanism divides the input tensor into three branches, two of which undergo rotations in different spatial dimensions. The tensor H × W × C can be rotated to W × H × C , and this rotation effectively coordinates the interdependencies between different dimensions, such as the relationship between the channel dimension C and the spatial dimensions H and W . Unlike CBAM [60] and SENet [57], which require learning a large number of adjustable parameters to establish dependencies between different dimensions, the Triplicate Attention mechanism achieves the transformation of dimensional dependencies merely through tensor rotation, adding almost no additional parameters while significantly enhancing network performance. Furthermore, a Z p o o l layer is shown in the figure, which is essentially a concatenation of a max pooling layer (MaxPooling) and an average pooling layer (AvgPooling). Its expression is given by Z P o o l x = [ M a x P o o l x , A v g P o o l x ] . The advantage of this pooling layer lies in its combination of the max pooling layer’s ability to retain the maximum value and highlight important features, along with the average pooling layer’s capability to capture average values and reduce the impact of noise. This results in good robustness when processing features of different types. Moreover, despite the integration of the two pooling operations, the computational efficiency is maintained due to the simplicity of the operations. Following the pooling operation, the application of convolutional operations and activation functions assigns corresponding weights to the output feature maps. Ultimately, the results from the three branches are obtained through a simple average aggregation (Avg) to yield the final output of the Triplicate Attention mechanism, which can be represented by Equation (6):
F = 1 3 A c X + A s X + A c s X
Here, F represents the final output result, while A c = σ C Z c , A s = σ C Z s , A c s = σ C Z c s denotes the channel attention branch, spatial attention branch, and the branch where spatial and channel attention interact. signifies element-wise multiplication. X represents the input feature map. During the attention computation, activation function σ and convolution operation C are used to compute Z from the output of layer C P o o l . The calculation steps of this formula are from inside the parentheses to outside, consistent with the process shown in the figure.

3.3. Multi-Scale Feature Fusion Across Layers

The traditional YOLOv8 model employs an optimized PANet-FPN structure in its neck fusion network, which integrates multi-scale feature maps from different hierarchical levels by combining top-down and bottom-up pathways. Although this method has shown certain performance improvements in feature enhancement and fusion, analysis indicates that the structure only integrates feature maps from adjacent levels. The feature maps across hierarchical levels typically exhibit significant differences, leading to insufficient robustness in the network, especially evident in small object detection. To address the potential loss of detail information and the issue of missed detections in this process, this paper introduces a cross-level convolutional operation in the neck network, aiming to retain more details and rich semantic information by integrating feature information from different levels. The main advantages include (1) identifying the shortcomings of the traditional YOLOv8 neck fusion network and proposing a solution to enhance network detection capabilities through the rational use of convolutional operations, (2) enhancing the network’s ability to capture features at different scales by introducing a new convolutional block to connect cross-level feature maps while ensuring network detection efficiency, and (3) discarding the traditional convolution method, leveraging the lightweight advantages of partial convolution and pointwise convolution to minimize the increase in network parameters. Additionally, this paper innovatively proposes the combined use of partial convolution and pointwise convolution, named PPWC, with advantages including (1) partial convolution only convolves a subset of feature maps, avoiding redundant convolution operations; (2) employing pointwise convolution after partial convolution further enhances the network’s depth and feature expression capabilities; and (3) since partial convolution [61] does not convolve all channels and the pointwise convolution [62] kernel size is 1, the increase in network parameters remains minimal despite the use of two types of convolution operations.
Next, we will analyze the principle of introducing the PPWC convolutional block into the neck network. The improved structure is shown in Figure 7. In the top-down and bottom-up paths of the original neck structure, two convolutional blocks proposed in this paper are incorporated, respectively. In the bottom-up path, the shallow feature maps after the first and second stages of DIB layers are concatenated with the feature maps on this path through the convolutional block. A similar operation is performed in the top-down path. This method can fully leverage the detailed information from the shallow layers and semantic information from the deep layers, significantly enhancing the network’s detection performance on small objects in multi-scale images. This process can be represented by Equation (7):
Z = p o i n t w i s e c o n v p a r t i a l c o n v X
X represents the input feature map, p a r t i a l c o n v X denotes the partial convolution operation applied to the input feature map, and p o i n t w i s e c o n v signifies the pointwise convolution operation.

3.4. Focal Loss for Efficient Intersection over Union (EIOU) Loss Function

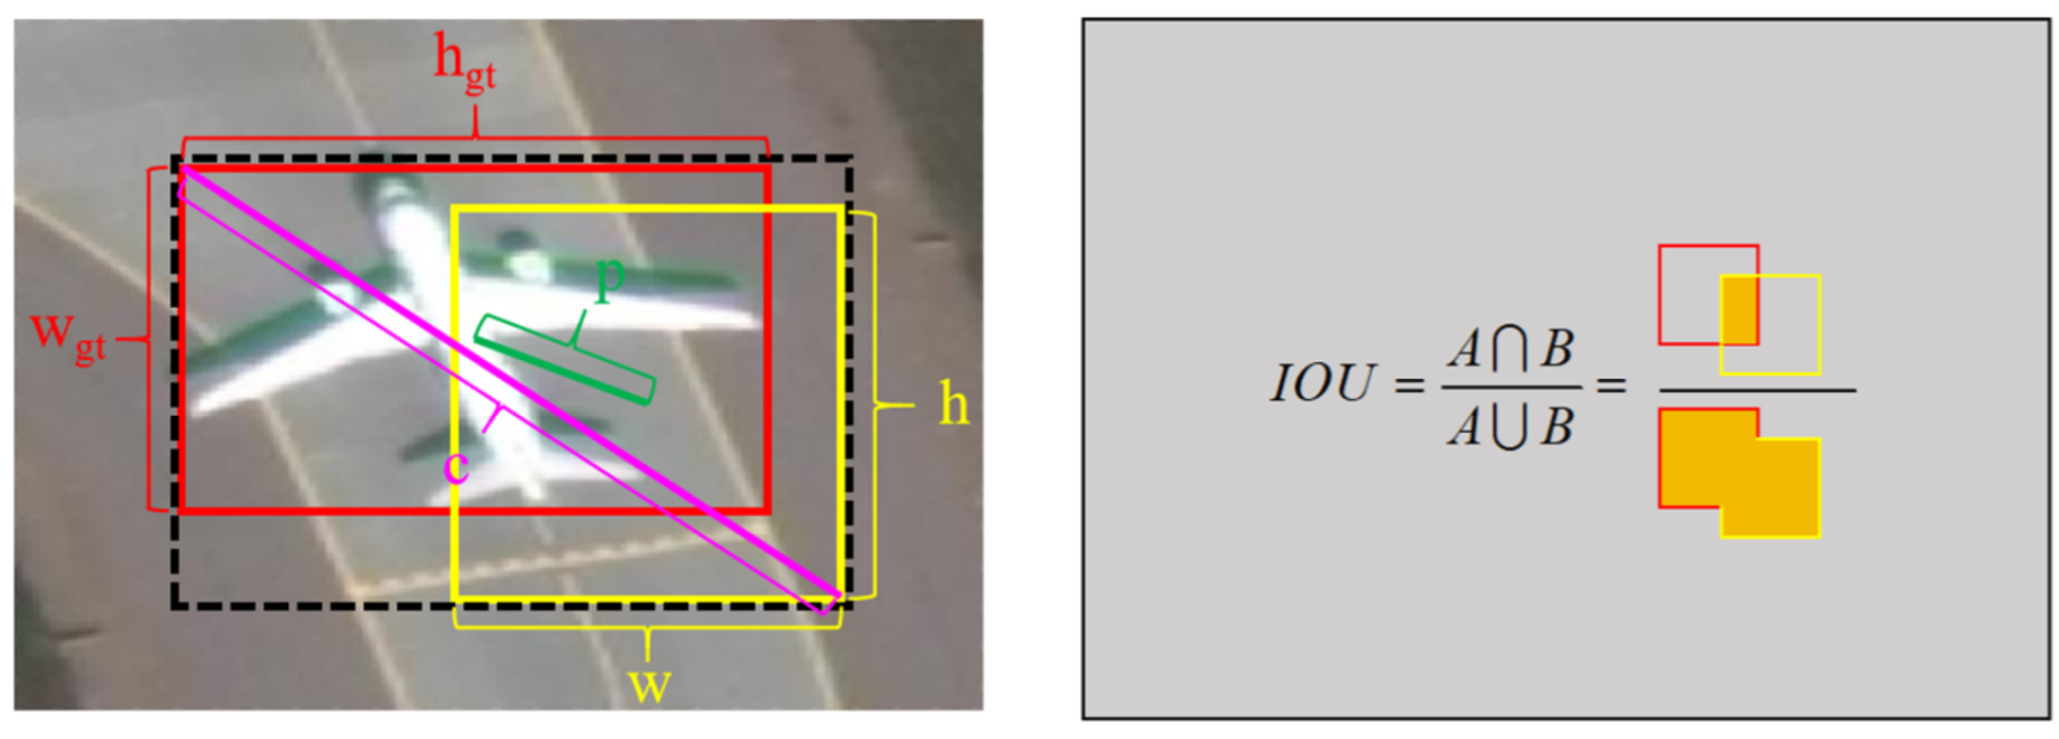
Loss functions play a pivotal role in the field of object detection, effectively modeling the discrepancies between true labels and predicted labels. In object detection tasks, there exist discrepancies in distance and position between the model’s ground truth and predictions. The primary function of a loss function is to minimize these discrepancies, thereby significantly enhancing the model’s detection accuracy. The original model utilizes the CIOU loss function, as depicted in Figure 8. The left side of Figure 8 illustrates the visualization of CIOU, highlighting its equivalence to the part of DIOU; the red box represents the true bounding box of the labeled target, the yellow portion indicates the predicted box, and the black dashed line box denotes the minimum rectangle encompassing both the true and predicted boxes. The right side of Figure 8 presents a graphical explanation of IoU.
Although it has been optimized based on IoU, taking into account the loss of width and height, the introduction of additional geometric factors has led to a slower convergence rate, as shown in Equations (8) and (9).
L C I O U = 1 I O U + p 2 c 2 + a v
v = 4 π 2 arctan w h arctan w g t h g t 2
In the formula, I O U represents the ratio of the intersection to the union between the predicted bounding box and the ground truth bounding box, p is the Euclidean distance between the centers of the predicted and ground truth bounding boxes, c denotes the diagonal length of the minimum rectangle that encloses both the ground truth and predicted bounding boxes, and v is a metric used to measure the similarity in aspect ratio between the predicted and ground truth bounding boxes, with its calculation formula shown in Equation (9). w and h refer to the width and height of the predicted bounding box, respectively, while w g t and h g t refer to the width and height of the ground truth bounding box.
The Focal-EIOU [63] employed in this paper integrates the Focal strategy with the optimization method of EIOU, effectively enhancing convergence speed and localization accuracy. The EIOU is illustrated in Figure 9. The left side of Figure 9 provides an intuitive conceptual explanation of EIOU, while the right side labels some parameters from the left diagram, with the rest referring to Figure 8. By comparing Figure 8 and Figure 9, the most apparent difference between CIOU and EIOU is that CIOU uses the diagonal distance of the minimum bounding rectangle, whereas EIOU maps the diagonal distance to horizontal and vertical distances, calculating them separately. Furthermore, the introduction of the Focal strategy is also an innovation.
Specifically, the Focal strategy analyzes the impact of high-quality anchor boxes versus low-quality anchor boxes on the overall model performance during the regression process. This enhances the contribution of the relatively fewer high-quality anchor boxes while diminishing the influence of the more numerous low-quality anchor boxes, thus alleviating the issue of sample imbalance. Additionally, Focal-EIO introduces a parameter γ to adjust the degree of outlier suppression. Compared to CIOU, which lacks outlier adjustment capabilities, Focal-EIO can focus more on high-quality samples. The formulas are shown in Equations (10) and (11):
L E I O U = L I O U + L d i s + L a s p = 1 I O U + p 2 b , b g t c 2 + p 2 w , w g t C w 2 + p 2 h , h g t C h 2
L F o c a l E I O U = I O U γ L E I O U
In the equations, L I O U , L d i s , L a s p represent the Intersection over Union ( I O U ) loss function, distance loss function, and aspect ratio loss function, respectively. C w and C h denote the width constant and height constant, respectively.

4. Results

4.1. Dataset

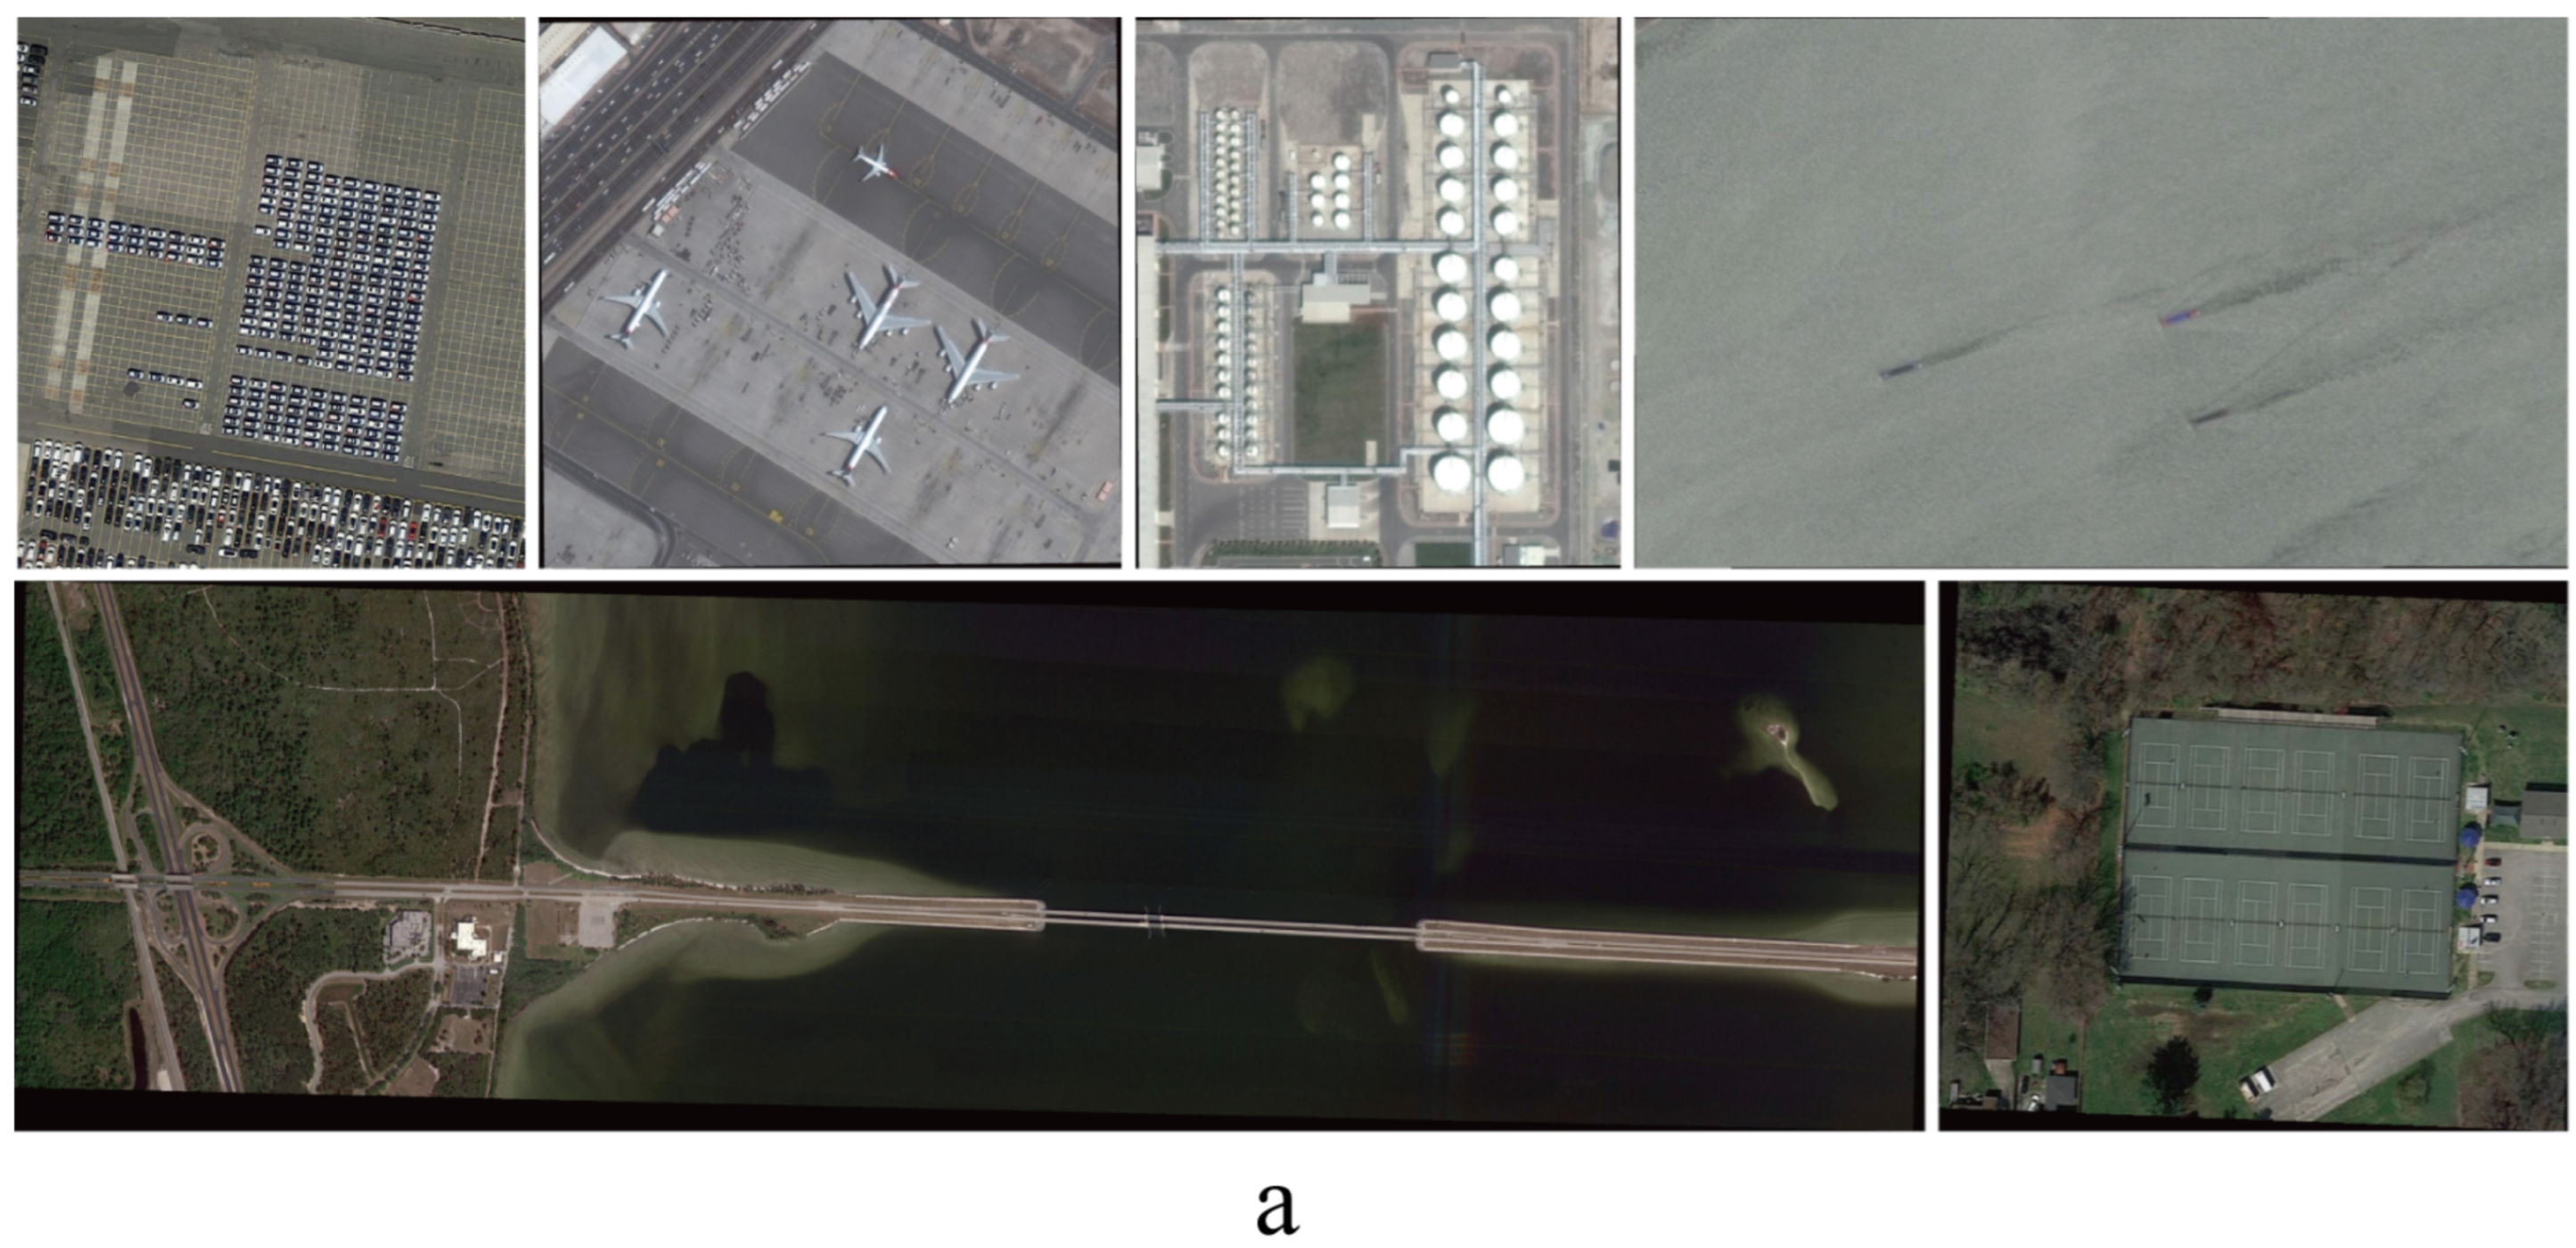
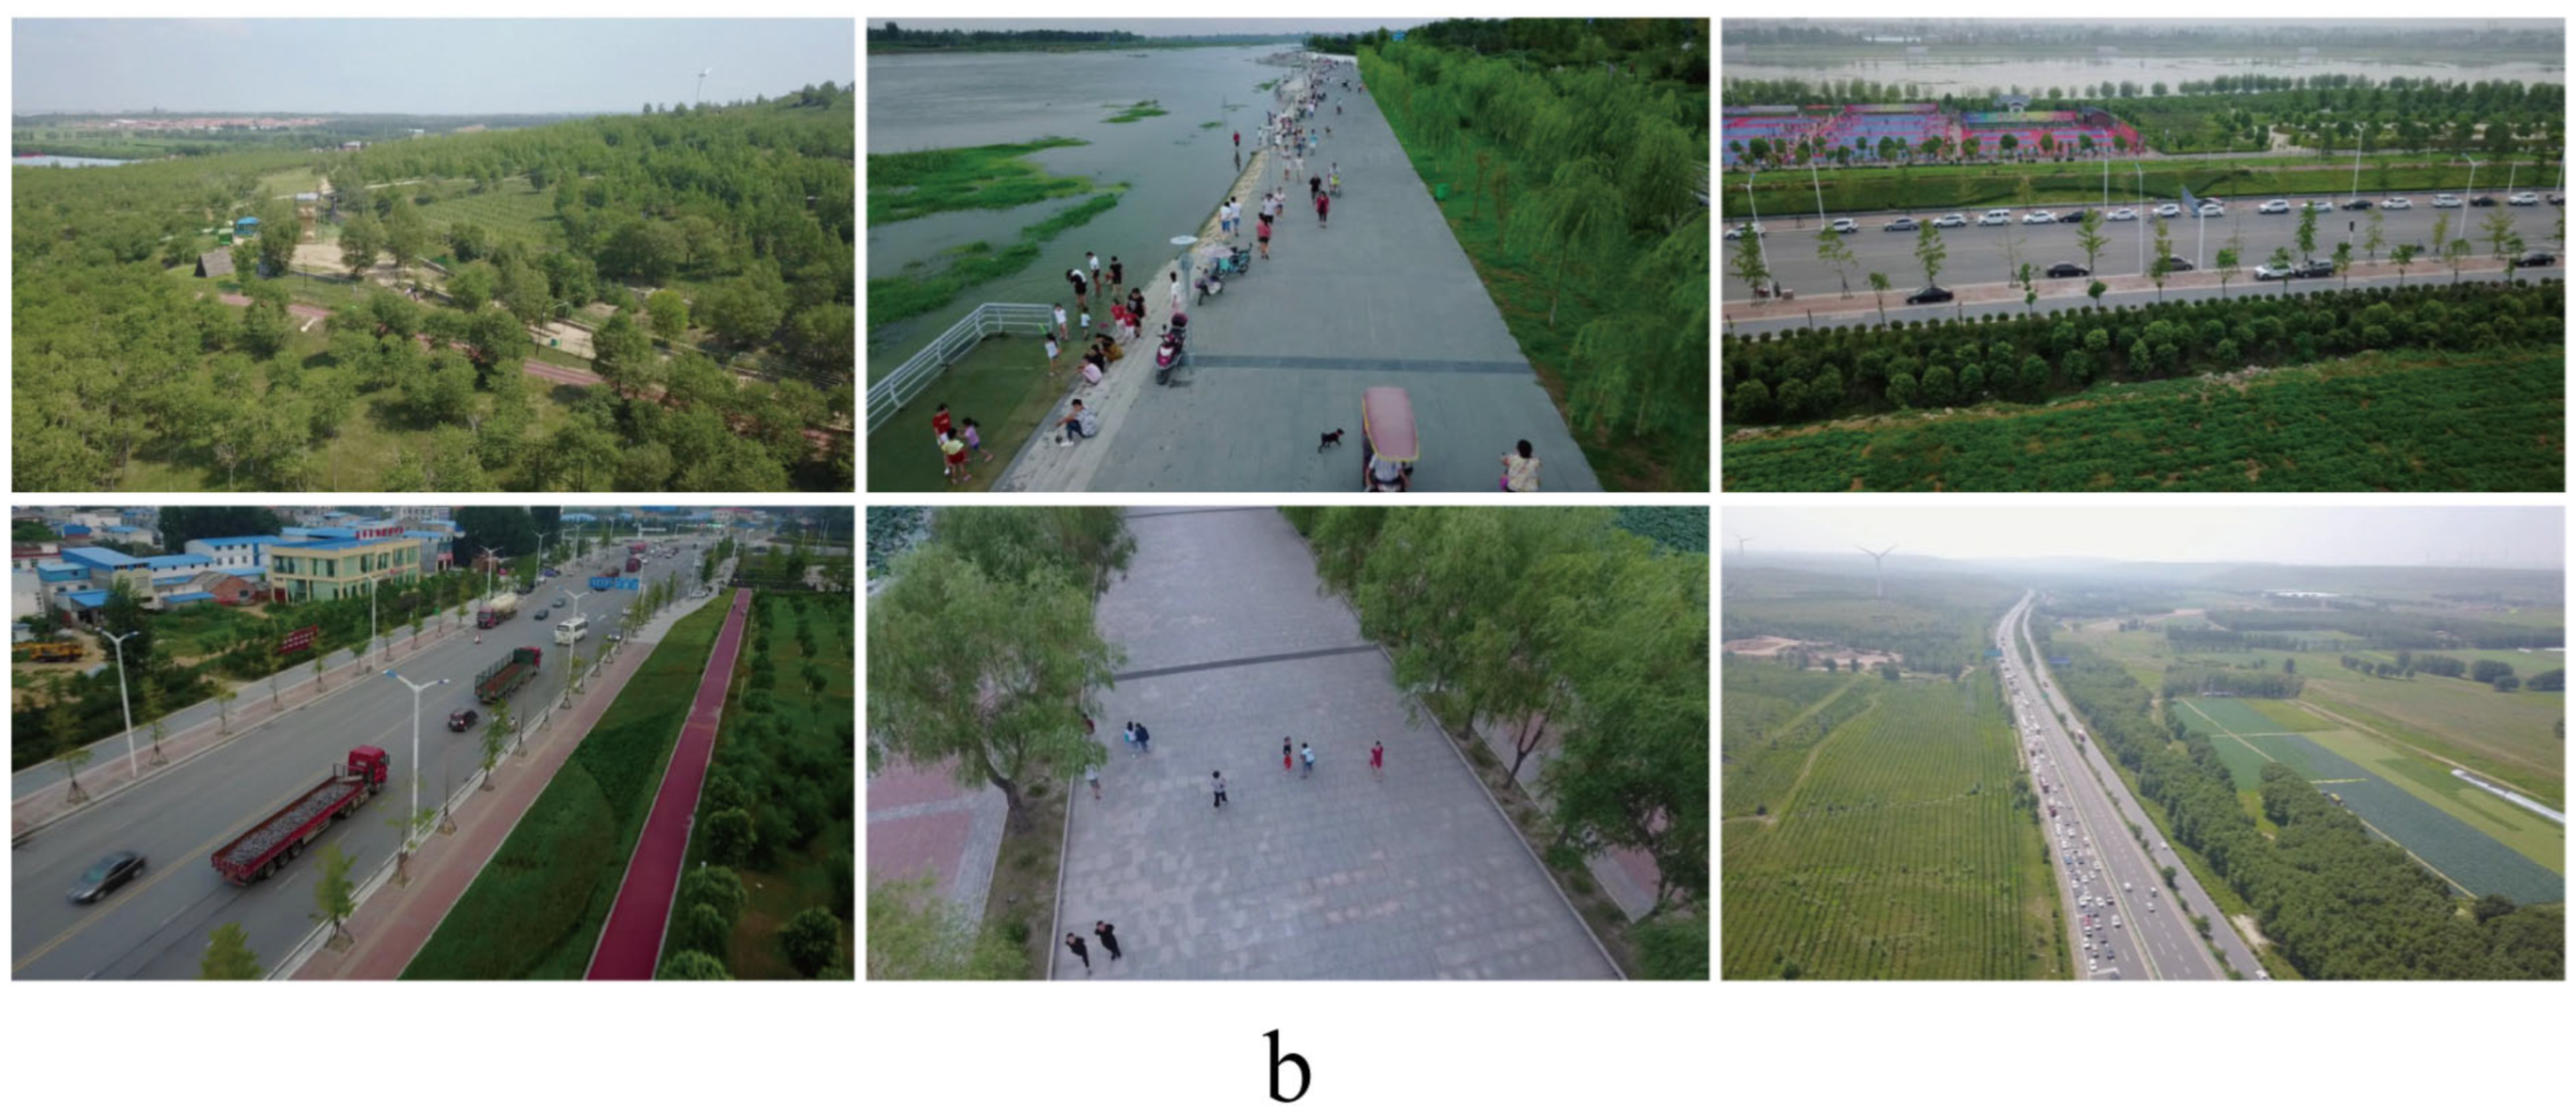
The improved strategy proposed in this paper primarily addresses the issue of insufficient detection accuracy for small objects due to scale variation in aerial images. Therefore, extensive experiments were conducted on the DOTA [64] and VisDrone2019 [65] datasets. Some images from these datasets are shown in Figure 10.
Figure 10a displays some examples from the DOTA dataset, which was created by Wuhan University. It is a large-scale aerial remote sensing image dataset consisting of 11,268 images, encompassing 15 object categories such as planes, ships, storage tanks, vehicles, bridges, baseball diamonds, tennis courts, etc., with a total number of object instances exceeding 180,000. It is well suited for object detection tasks in remote sensing images. The image sizes range from 800 × 800 to 20,000 × 20,000 pixels, covering objects at multiple scales. Figure 10b illustrates a selection of images from the VisDrone2019 dataset. This dataset was established by the Machine Learning and Data Mining Laboratory at Tianjin University, comprising 10,209 static images sourced from videos and static images captured in various cities across China. It includes more than ten object categories such as cars, pedestrians, bicycles, etc. Data collection was conducted under diverse lighting and weather conditions using UAVs of different models, posing significant challenges for object detection tasks.
In Figure 10, the characteristics of remote sensing images can be observed. Part a shows distant, densely distributed small vehicles, blurred ship features, and planes of varying scales, etc. Part b displays occluded targets, as well as small and densely packed crowds and traffic flows.
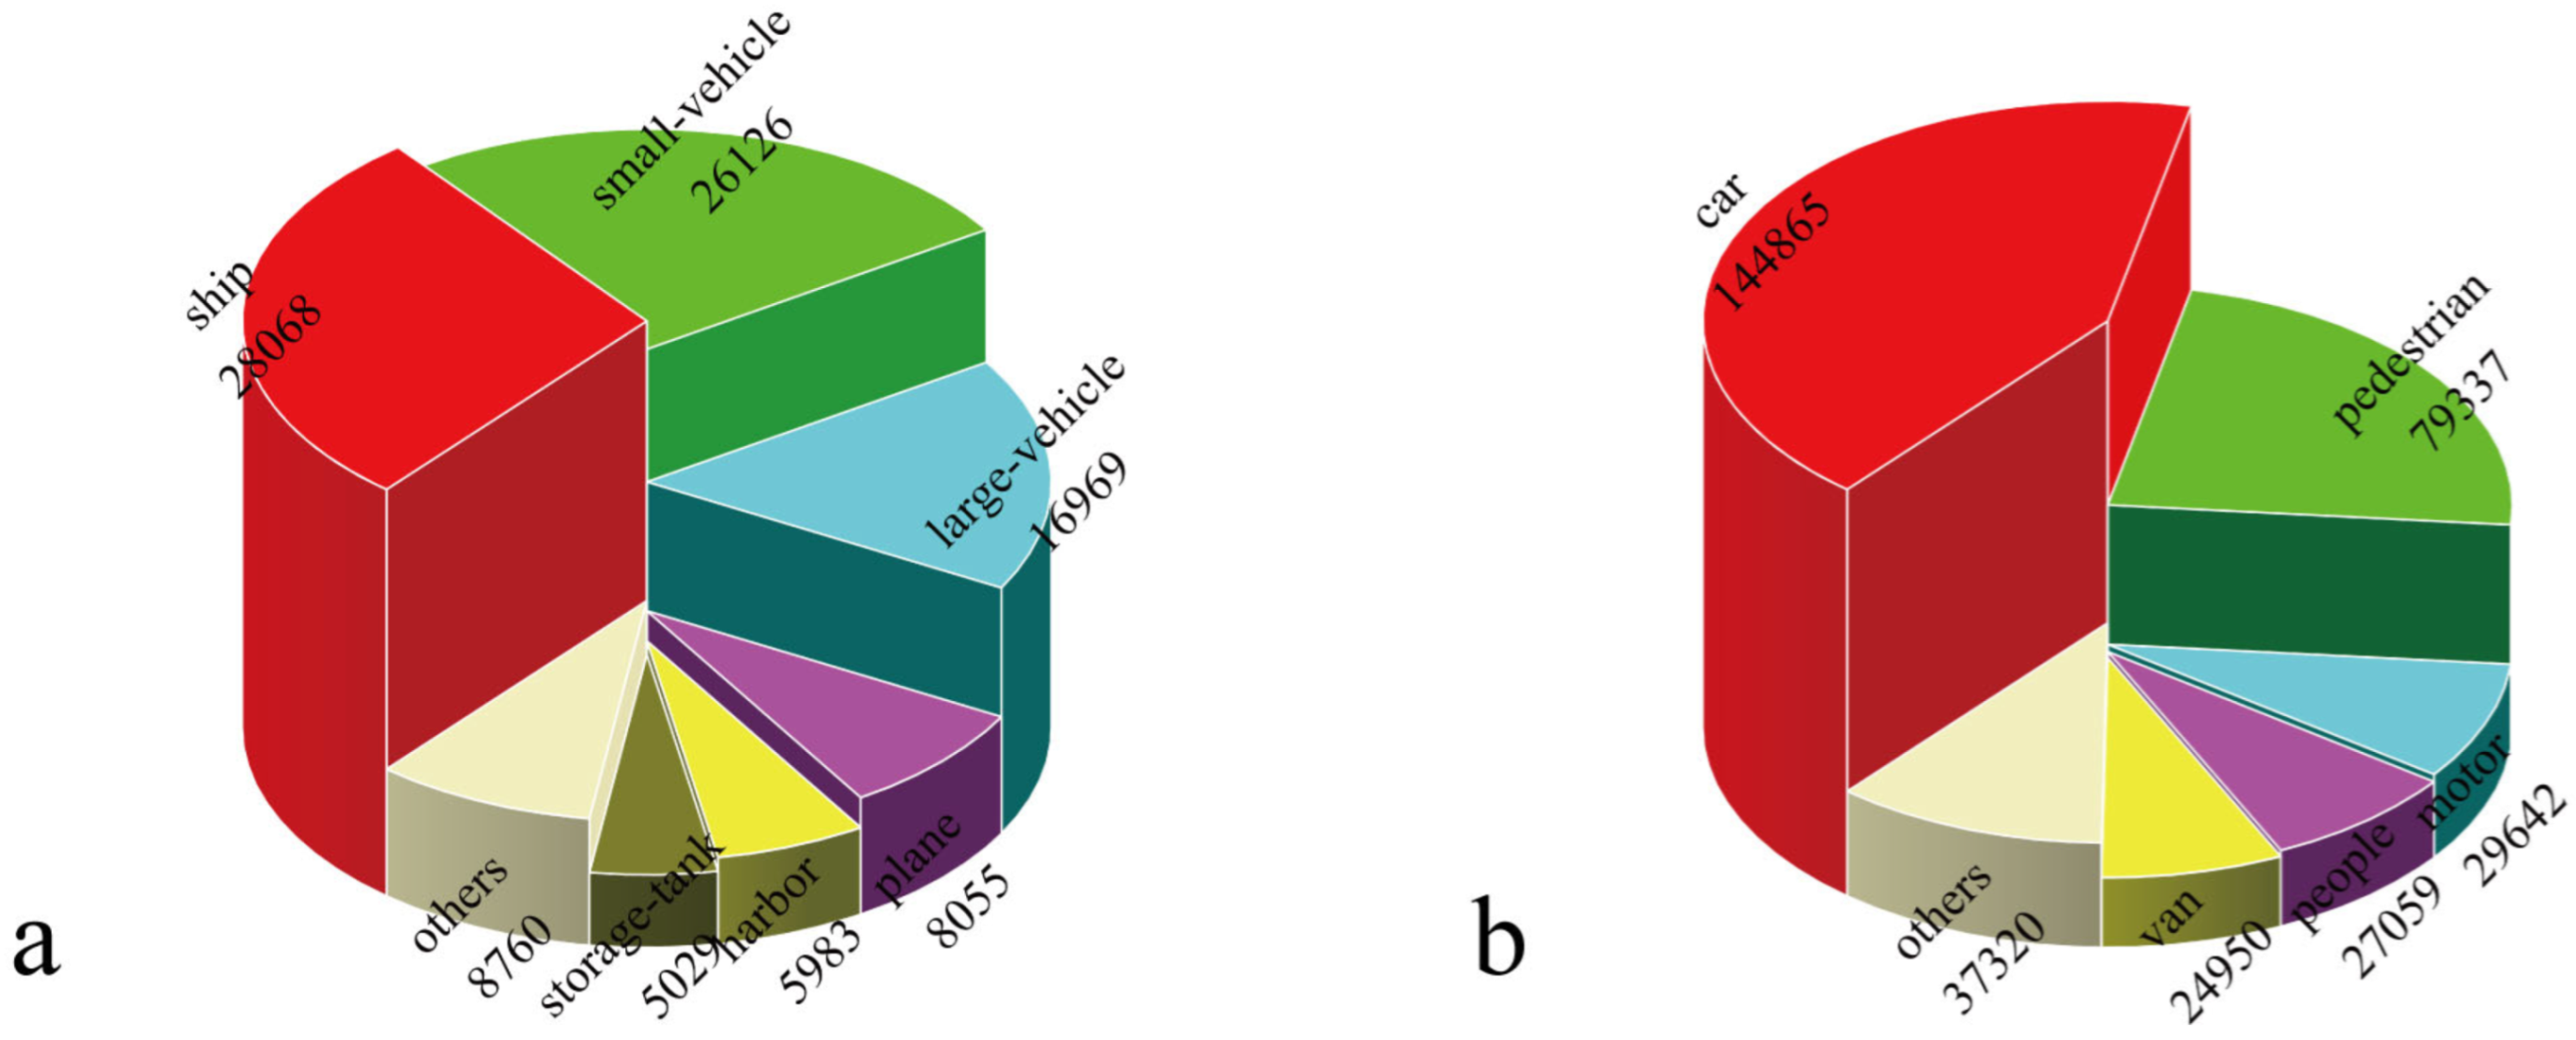
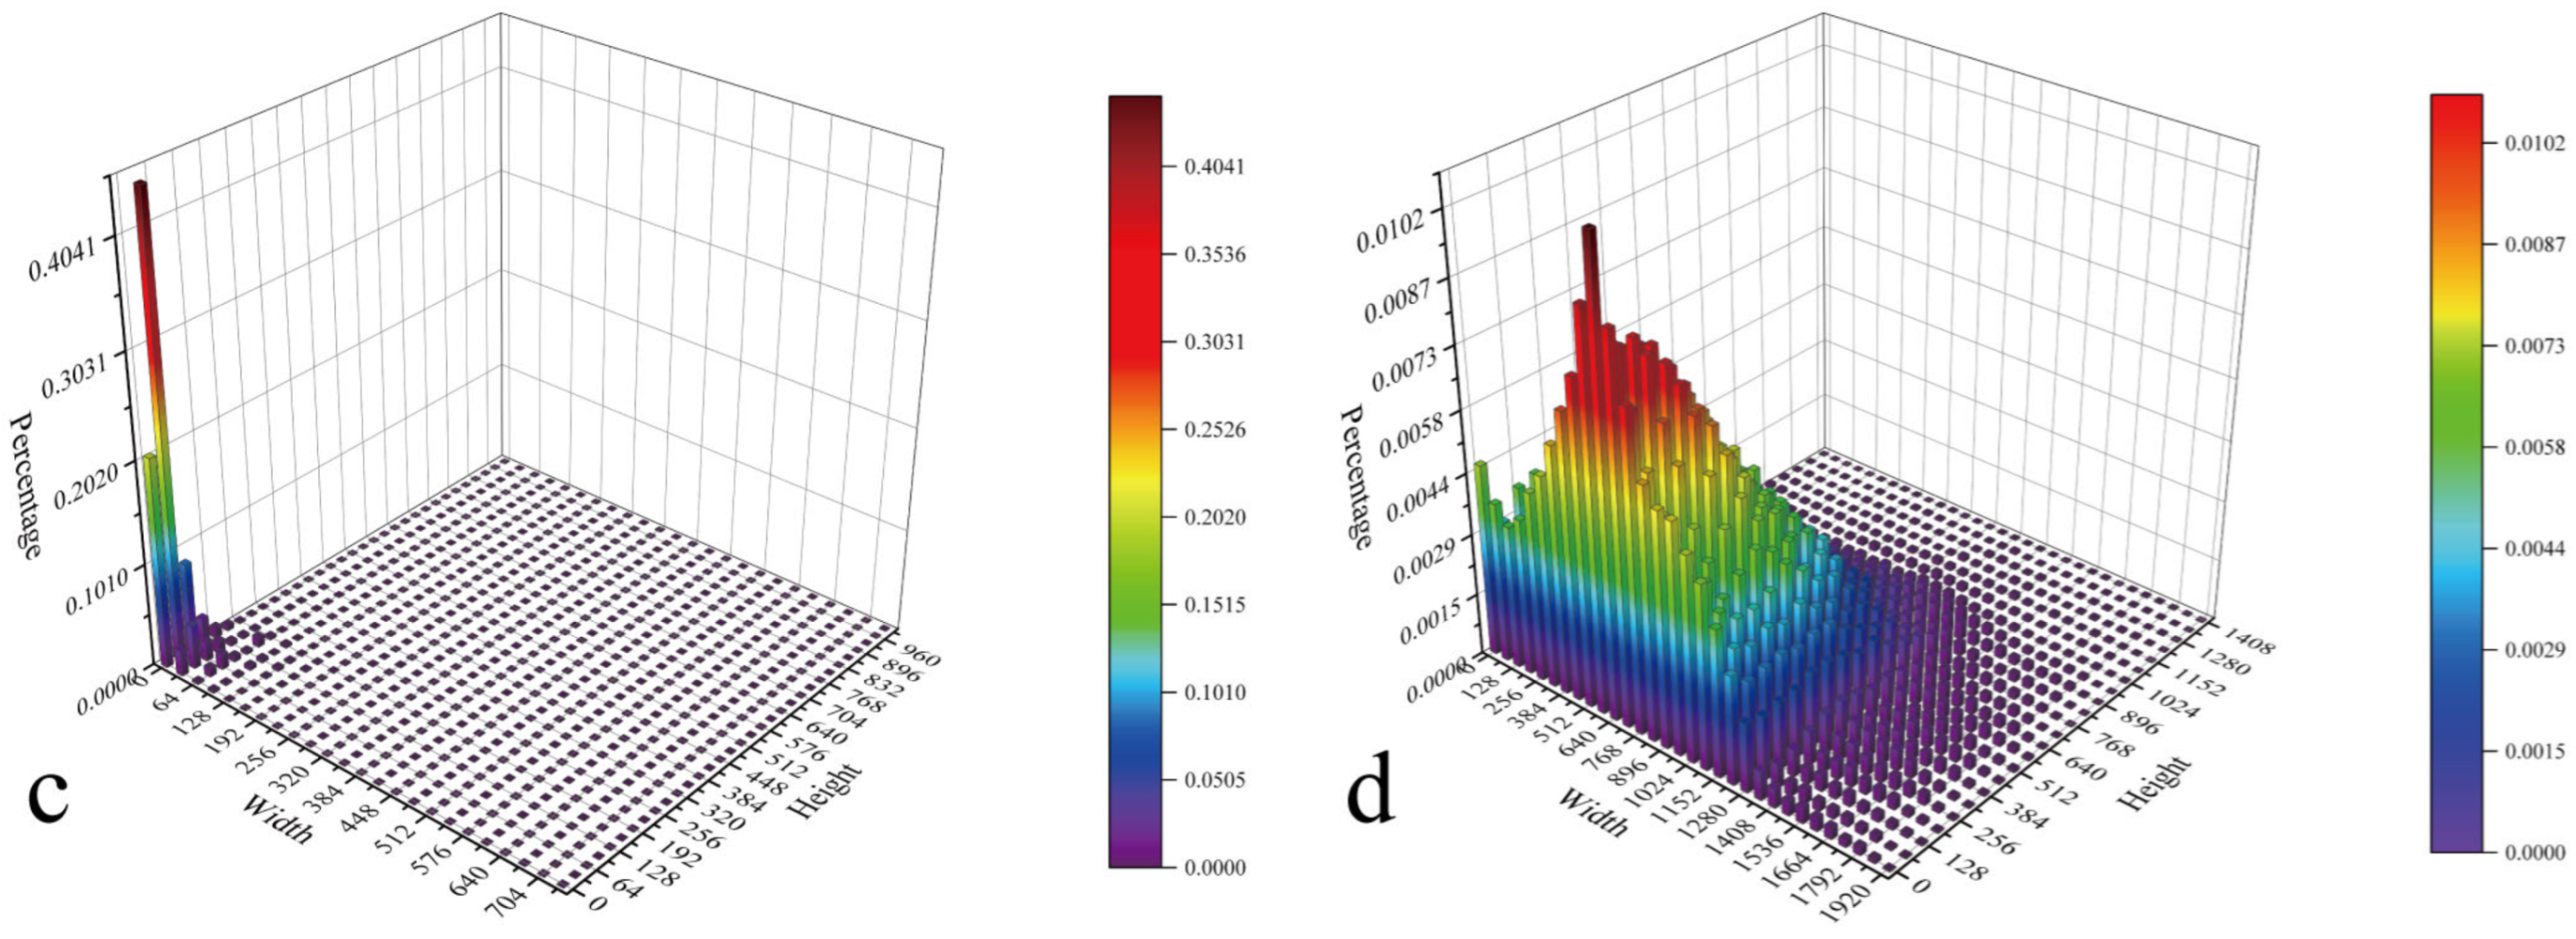
The number of instances in the selected training datasets is shown in parts a and b of Figure 11. Based on the width and height of the target pixels, parts c and d of Figure 11 illustrate the three-dimensional bar charts. Here, parts a and c correspond to the DOTA dataset, while parts b and d correspond to the VisDrone2019 dataset. The 3D pie charts in a and b clearly show the number and proportion of various instance targets in the two training sets. In the three-dimensional bar charts of c and d, the bottom plane represents the width and height of the targets, and the vertical axis indicates the proportion of instances within specified ranges of width and height. Additionally, each three-dimensional chart has a color-changing scale on the right side, which clearly shows the distribution of instances across different size ranges. From the distributions in c and d, it can be observed that the DOTA training set has a more concentrated size distribution, while VisDrone2019 is relatively more evenly distributed within specific ranges. However, overall, both datasets predominantly consist of targets with smaller widths and heights.

4.2. Experimental Setup

During the experimental process, a high-performance computing environment was constructed to ensure the training process and validation results of the model, as shown in Table 1. This environment is equipped with an Intel Core i7-9700k processor, which features an eight-core, eight-thread CPU, offering robust computational capabilities. Additionally, an NVIDIA GeForce RTX 3090 Ti was selected as the graphics processing unit to facilitate efficient parallel computation during training. The system operates on Ubuntu 18.04 LTS 64-bit, an open-source operating system renowned for its stability and security. The deep learning framework chosen was PyTorch 1.9.1, favored by researchers for its flexibility and ease of use, supporting dynamic computation graphs and automatic differentiation. To fully leverage the computational power of the GPU, CUDA 10.2 was configured as the GPU accelerator, NVIDIA’s parallel computing platform and programming model. The integrated development environment selected was PyCharm, a powerful IDE that provides multiple functionalities such as code editing, debugging, and version control, significantly enhancing development efficiency. For scripting, Python 3.8 was utilized, a widely used high-level programming language favored by the deep learning community for its concise syntax and extensive library support. Furthermore, cuDNN 7.6.5 was set up as a neural network accelerator, NVIDIA’s deep neural network acceleration library, optimizing operations such as convolutional neural networks in deep learning frameworks to improve computational performance. Overall, our computing environment configuration aims to provide an efficient, stable, and developer-friendly platform for network model research, ensuring smooth progress in our research endeavors.
Furthermore, the configuration of the training parameters is shown in Table 2. The neural network optimizer used in this experiment is stochastic gradient descent. According to past experience, the learning rate was set to 0.001, with 200 training epochs, a momentum of 0.937, a batch size of 32, and a weight decay of 0.0005.

4.3. Evaluation Metric

To evaluate the effectiveness of the proposed model, this paper selects precision, recall, F1 score, and average precision as metrics, denoted by P , R , F 1 , and A P , respectively. Their calculation formulas are shown in Equations (12)–(15). In addition, the paper also employs params and GFlops to compare the model’s parameters and speed.
P = T P T P + F P
R = T P T P + F N
In this context, T P (true positives) represents the number of correctly predicted true instances, F P (false positives) denotes the number of incorrectly predicted true instances, and F N (false negatives) indicates the number of instances incorrectly predicted as non-true. From Equations (12) and (13), it is evident that there is an inherent trade-off between precision and recall, making it challenging to achieve high precision while maintaining high recall. Consequently, this paper introduces the F 1 score as an additional evaluation metric, the formula for which is as follows:
F 1 = 2 × P × R P + R
The F1 score is an important metric for evaluating binary classification models, designed to balance the relationship between precision and recall. It takes into account the interplay between these two metrics, thereby providing a more comprehensive perspective on the model’s performance assessment. When the F1 score approaches 1, it indicates that the model’s predictive accuracy is higher; conversely, a lower score suggests reduced accuracy.
A P = 0 1 p r d r
In a coordinate system where precision P is the vertical axis and recall R is the horizontal axis, A P represents the area enclosed by the curve and the axes. This metric considers the relationship between precision and recall from another perspective, similar to the F1 score. The closer F 1 is to 1, the higher the predictive accuracy, and the closer it is to 0, the lower the accuracy, comprehensively reflecting the overall performance of the model.

4.4. Results and Analysis

In this section, the improved model will be compared with the baseline model and other selected models through comparative experiments, including metrics such as detection accuracy, recall rate, number of parameters, and floating-point operations. The analysis will be conducted in various forms and from multiple perspectives to demonstrate the performance of the model presented in this paper.

4.4.1. Comparison Test with Other Models

In this section, several commonly used models in the field of object detection are selected for comparison with the model presented in this paper. Table 3 and Table 4, respectively, demonstrate the comparison of models on the VisDrone2019 and DOTA datasets in terms of parameters, floating-point operations, and average precision metrics.
Within each set of models, a selection of two-stage and one-stage algorithms are included, with comparison metrics derived from both computational accuracy and efficiency perspectives. Additionally, precision metrics are further divided into categories based on confidence levels and target sizes, offering a more detailed and directional analysis compared to simple precision comparisons. This approach can better demonstrate that the improved model maintains superior detection performance across various scenarios.
From Table 3, it can be observed that two-stage detectors have relatively higher numbers of parameters and floating-point operations. Among the selected one-stage detectors, YOLOv7 has the lowest parameters and floating-point operations. However, a comprehensive analysis of the models’ performance reveals that LACF-YOLO consistently leads in detection accuracy on the VisDrone2019 dataset, particularly for small objects. Compared to the baseline model YOLOv8s, mAPS improved by 3.8%, with a reduction in the number of parameters and floating-point operations by 34.9% and 26.2%, respectively.
On Table 4’s DOTA dataset, although the mAPL decreased by 0.2%, the mAP values for other sizes of targets, as well as the mAP values under different IoU thresholds, have all improved. The improved model has comprehensively enhanced the level of detection performance.
Although our model’s precision is often surpassed by YOLOv8m and YOLOv8l, when considering deployment on resource-constrained UAV platforms, their high parameters and computational complexity make them less suitable. Thus, our model remains highly competitive.
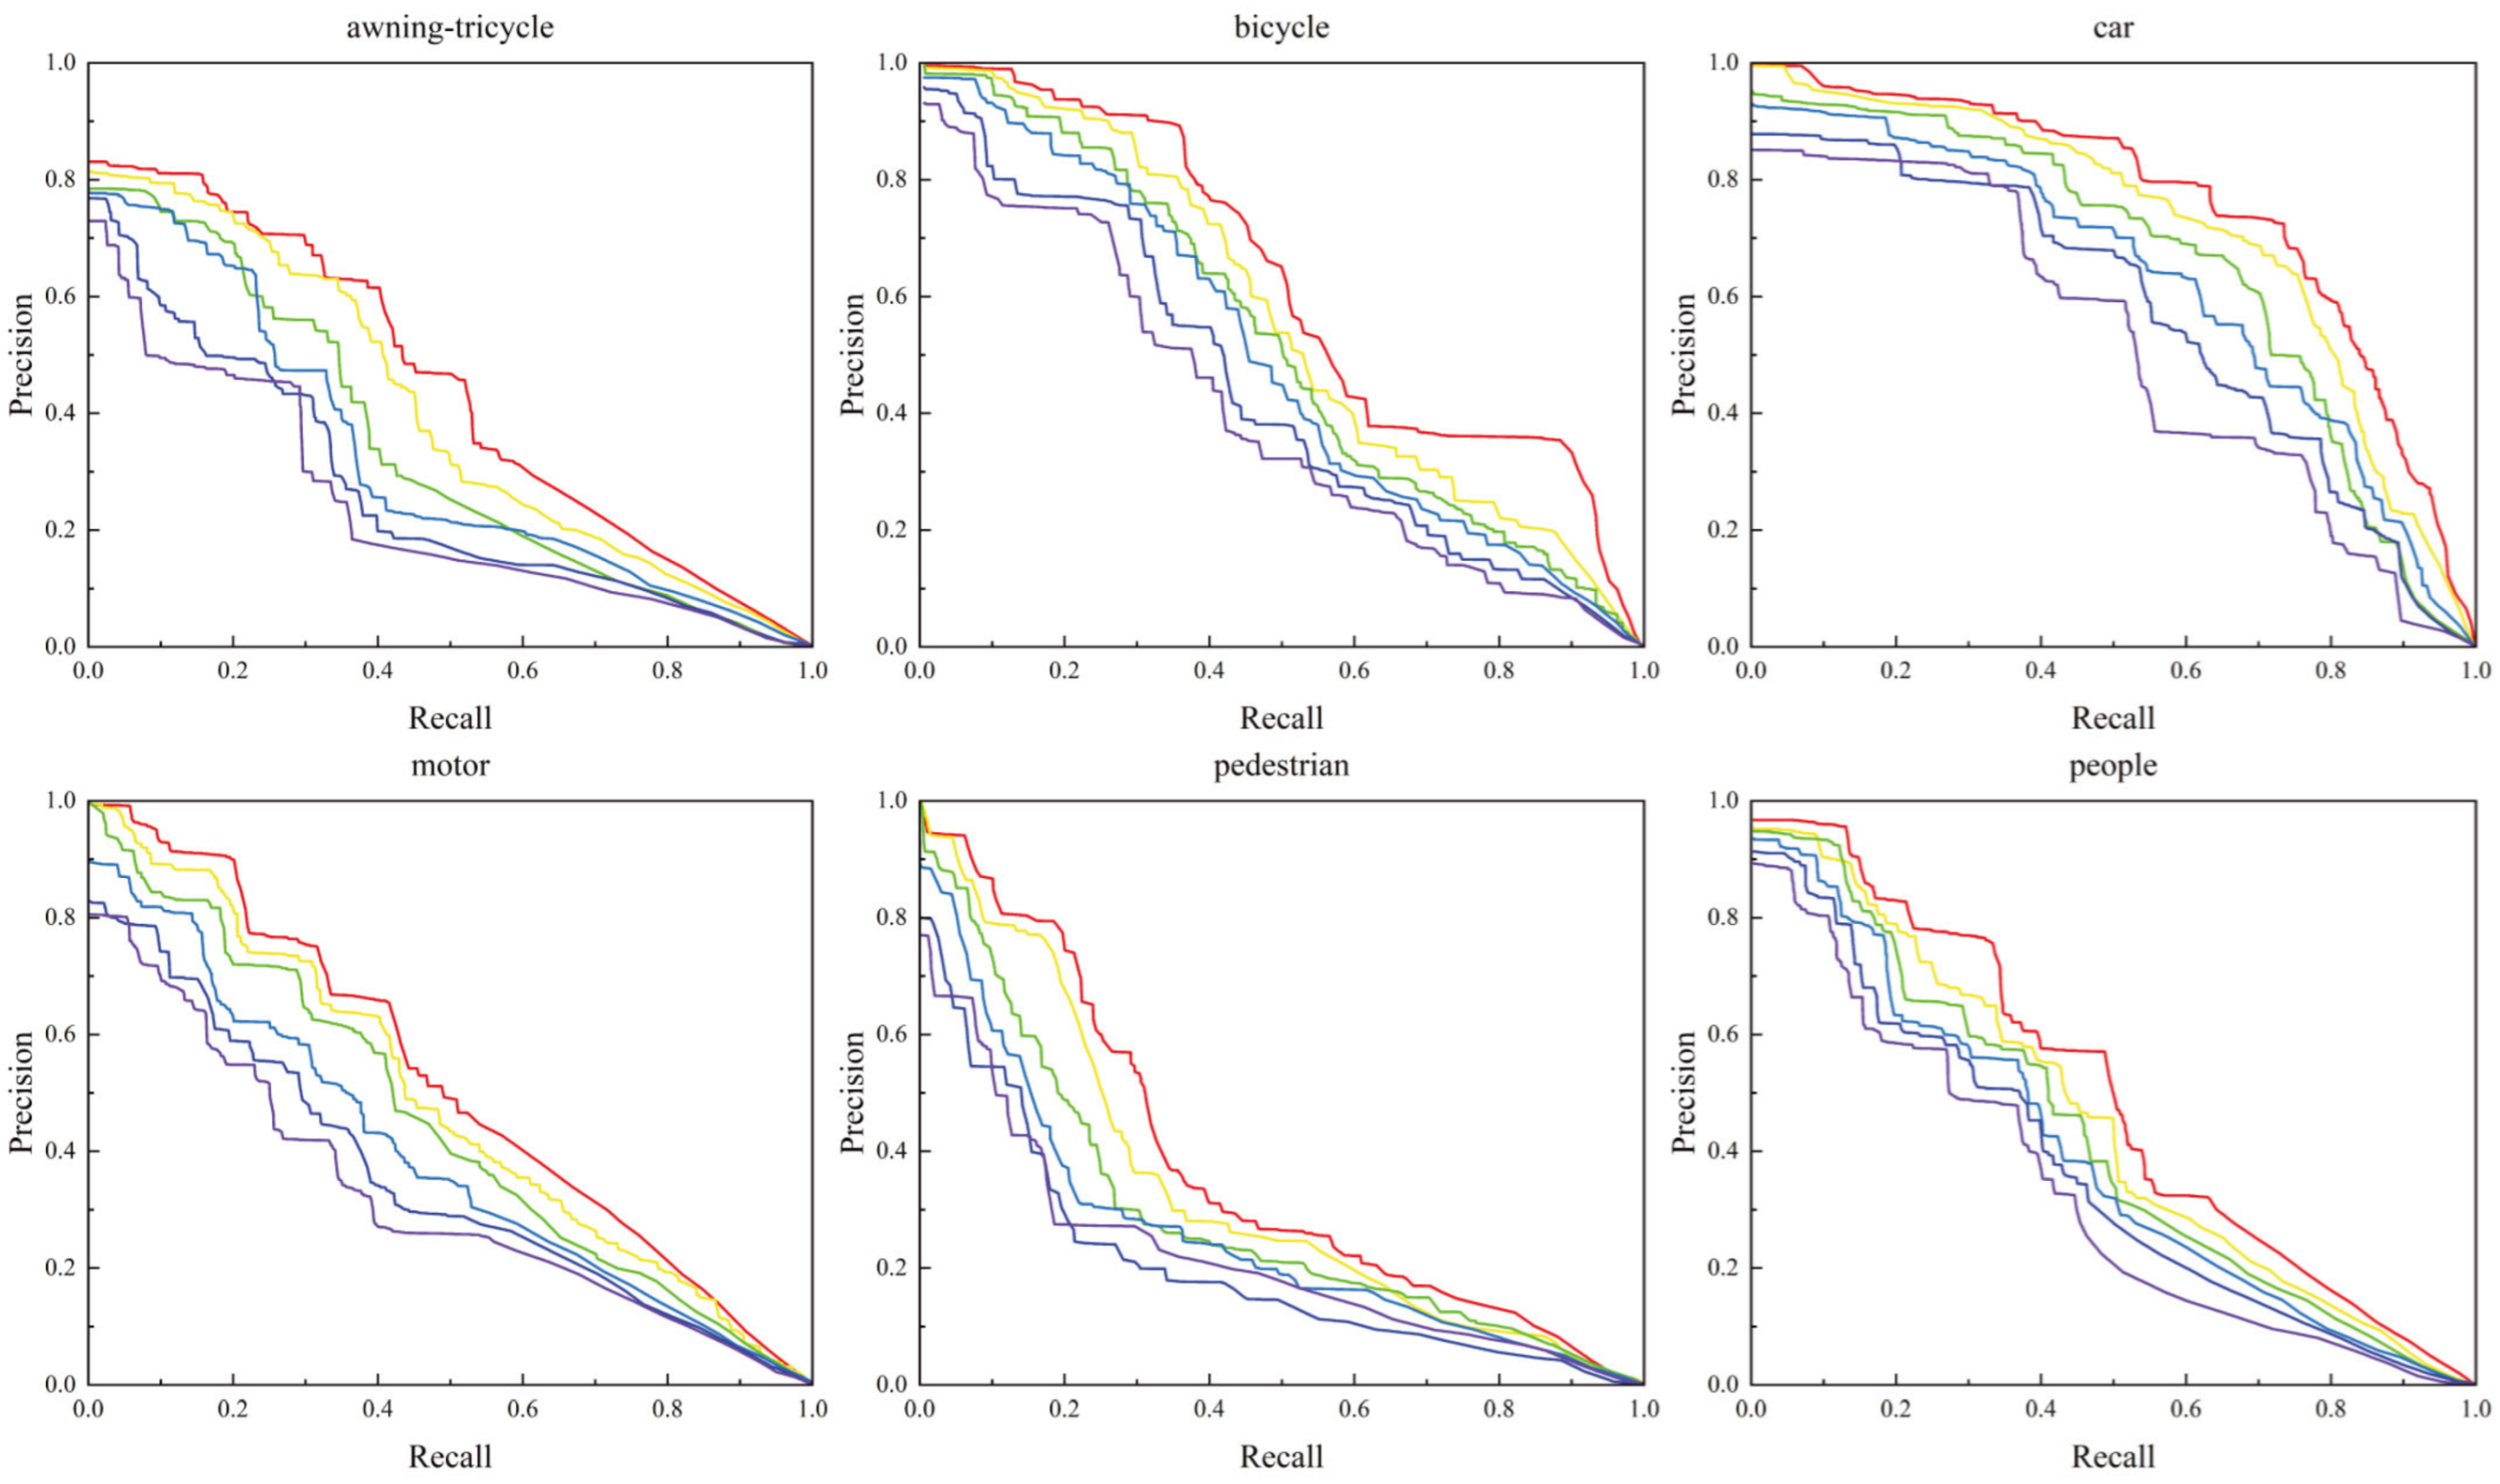
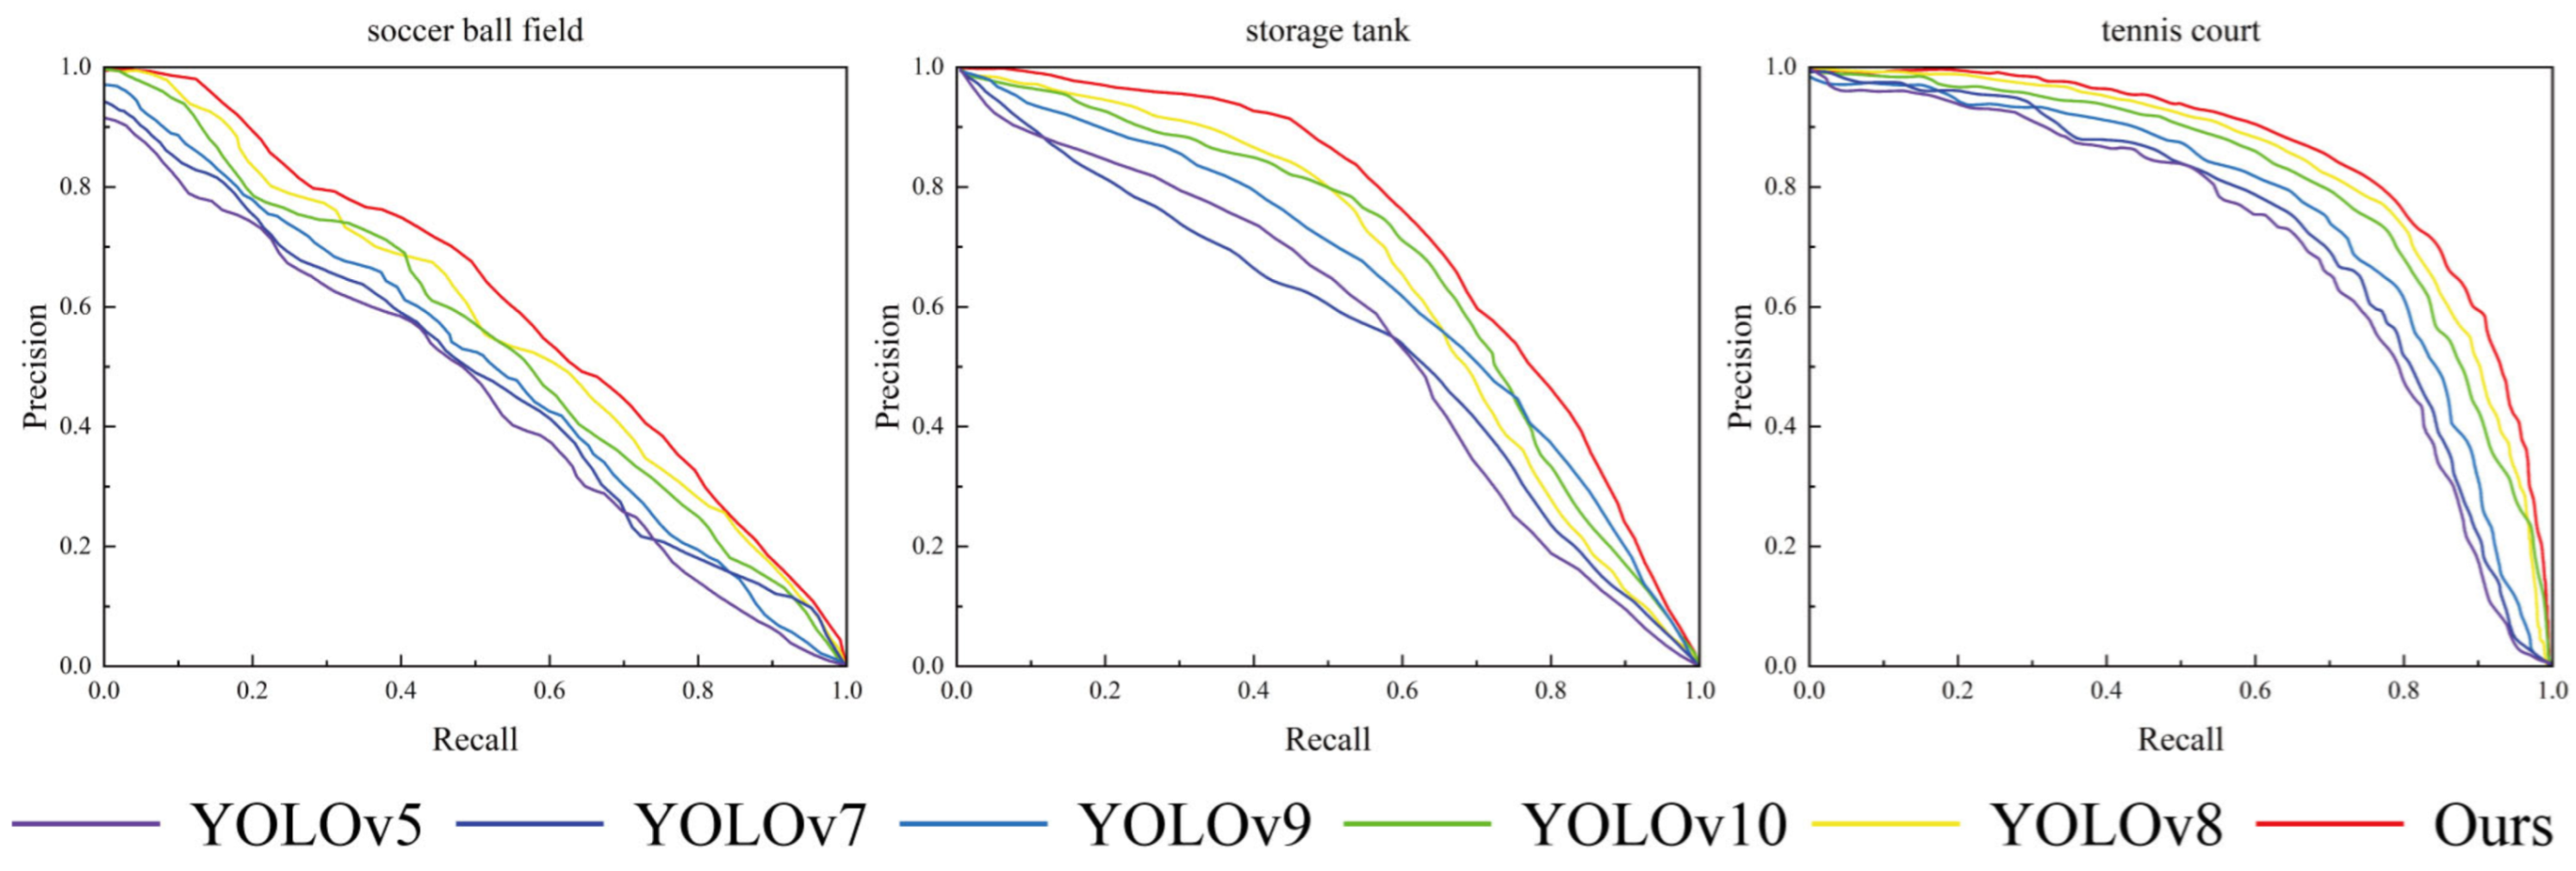
In addition, several commonly used models from the YOLO series were selected as a control group for the improved model in this paper. Figure 12 displays a comparison of P–R curves for six models when nine object categories were selected from the VisDrone2019 dataset, and Figure 13 shows a comparison of P–R curves for six models when twelve object categories were selected from the DOTA dataset.
In Figure 12 and Figure 13, nine categories of objects serve as the experimental basis, with the target categories labeled at the top of each image, the horizontal axis representing recall rate, and the vertical axis representing precision. The curves within the framework are represented by different colors to indicate different models, and the models that each curve represents are indicated in the lower-left corner. The overall trend of the curves is downward, reflecting the trade-off relationship between precision and recall. For some larger-sized, more distinct objects, the P–R curves are roughly the same, but the improved model still holds a leading position. It can also be seen from Figure 12 that detection results for objects like cars, which are numerous and have distinct features, are at a higher level, whereas for objects like pedestrians, which are generally smaller in size and less distinct in features, the detection performance is comparatively lower.
Figure 13 includes 12 object categories, and its overall structure is consistent with Figure 12. Although the improved model slightly lagged behind other models in certain stages for images of bridges and basketball courts, it quickly surpassed them afterward, maintaining a good detection performance. The enhancement is most evident for targets such as helicopters and storage tanks.
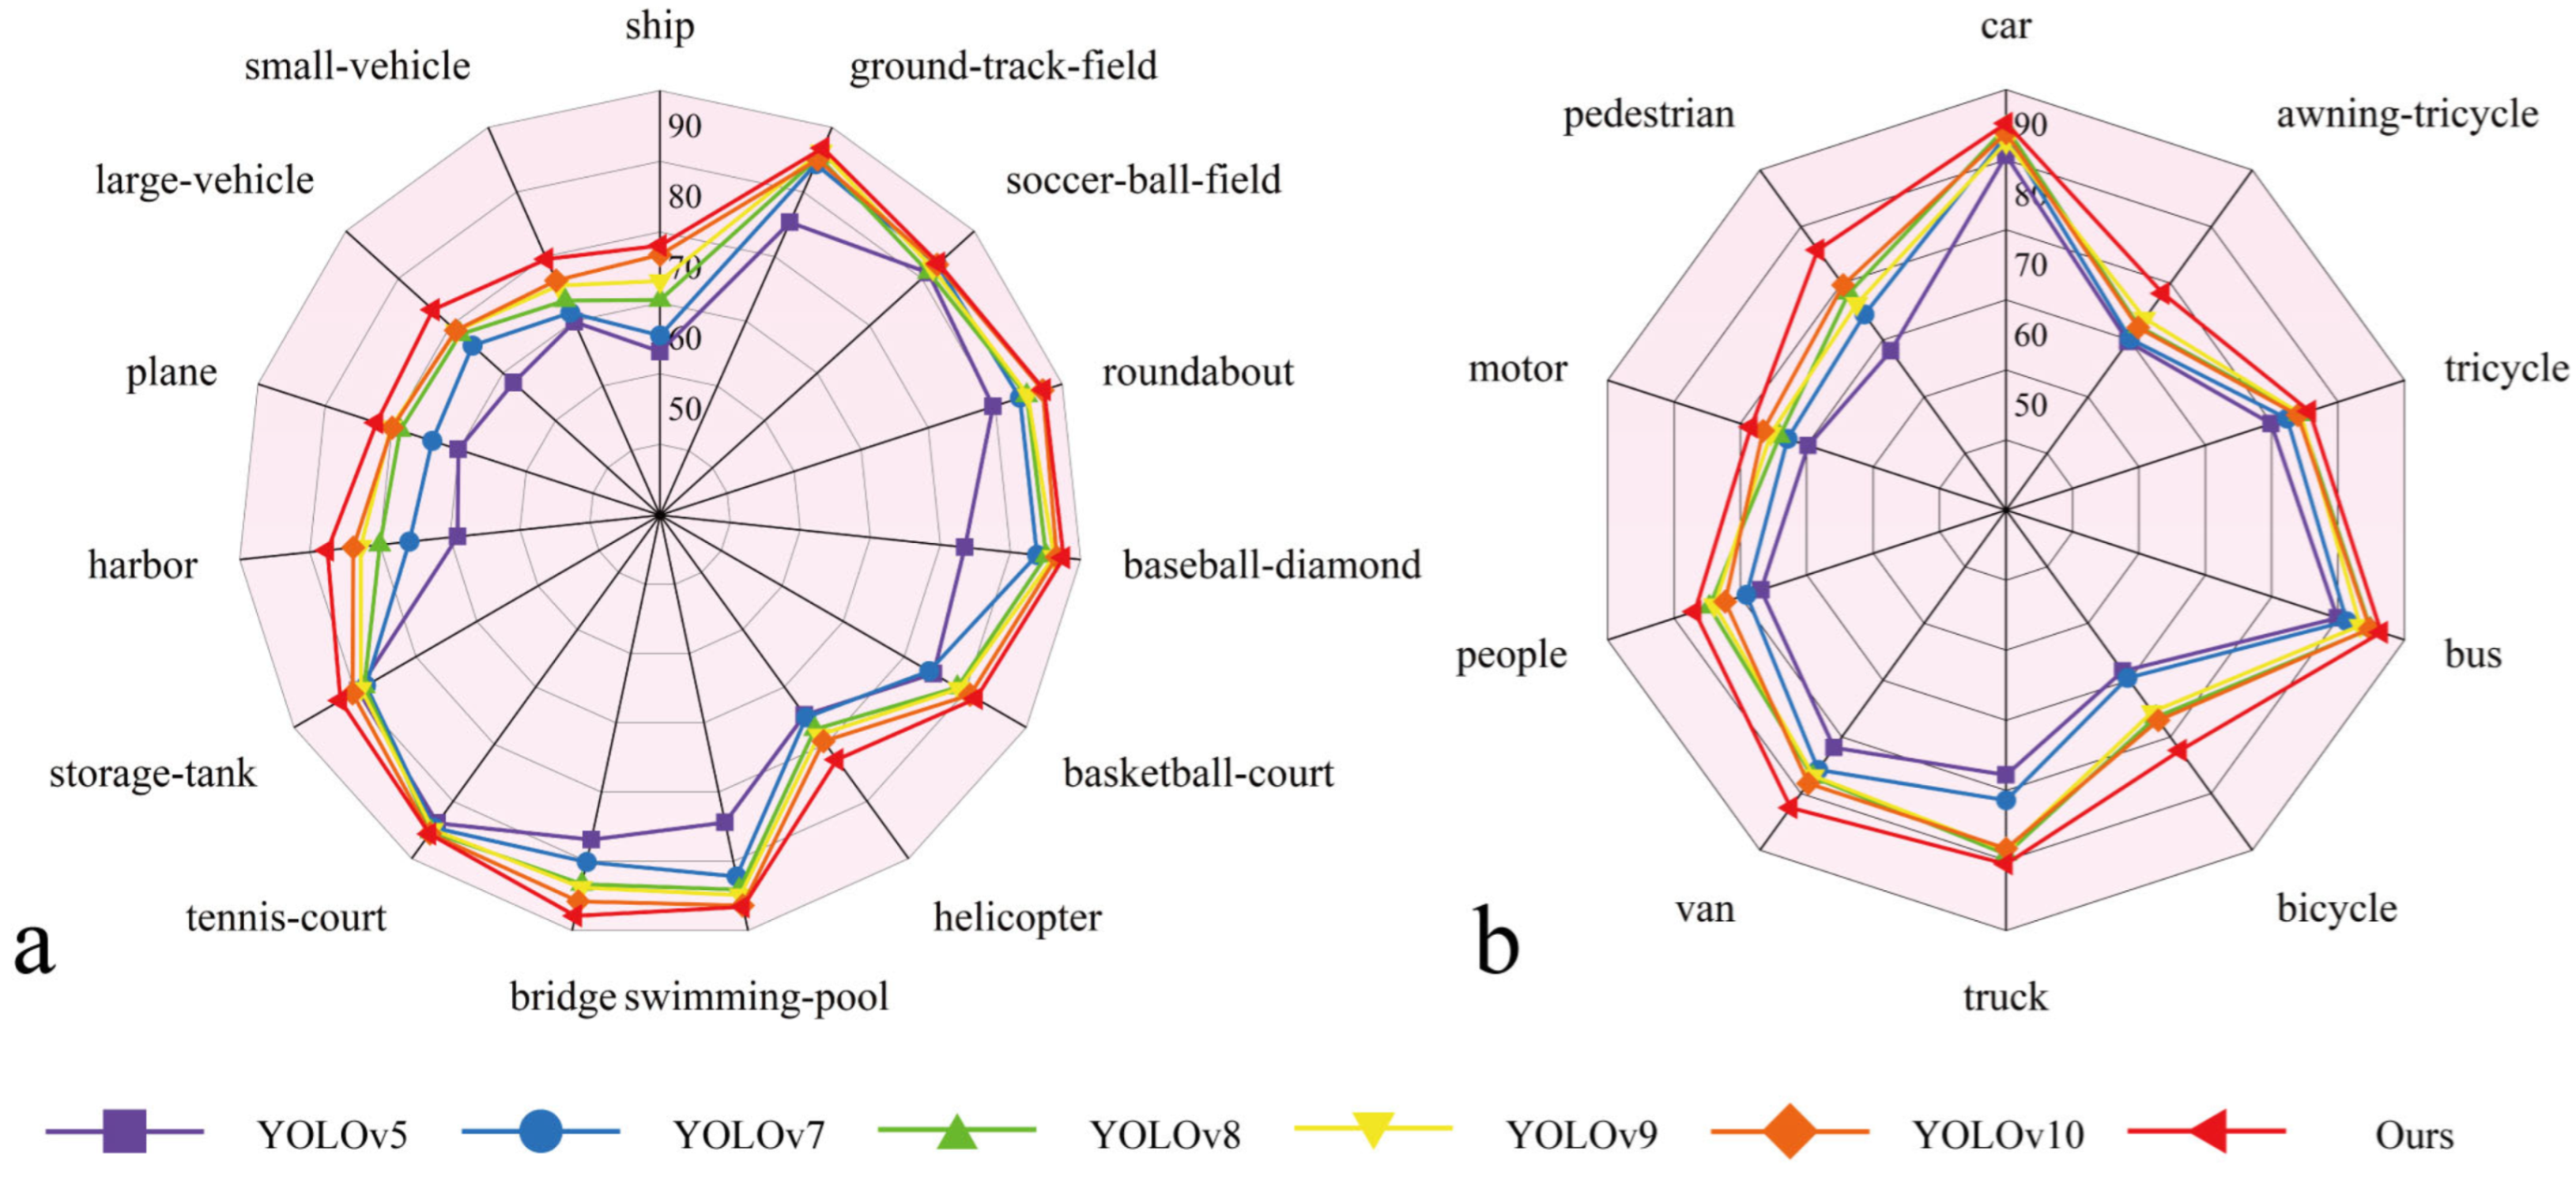
In Figure 14’s radar chart, the left side (a) represents the AP50 values for various categories on the DOTA dataset, while the right side (b) shows the AP50 values for various categories on the VisDrone2019 dataset. Different colors are used to illustrate the results and trends of the selected comparison models on different targets, with each color representing a specific model as indicated at the bottom of the chart. From the two radar charts and their performance across different targets, it can be observed that there are varying detection performances for different types of objects. Overall, the values for structures like ground track fields, tennis courts, roundabouts, and bridges are higher than those for ships and small vehicles, while values for cars, buses, and trucks are higher than those for awning-tricycles and motors. Moreover, the model proposed in this paper outperforms other models in detection results for each target category.
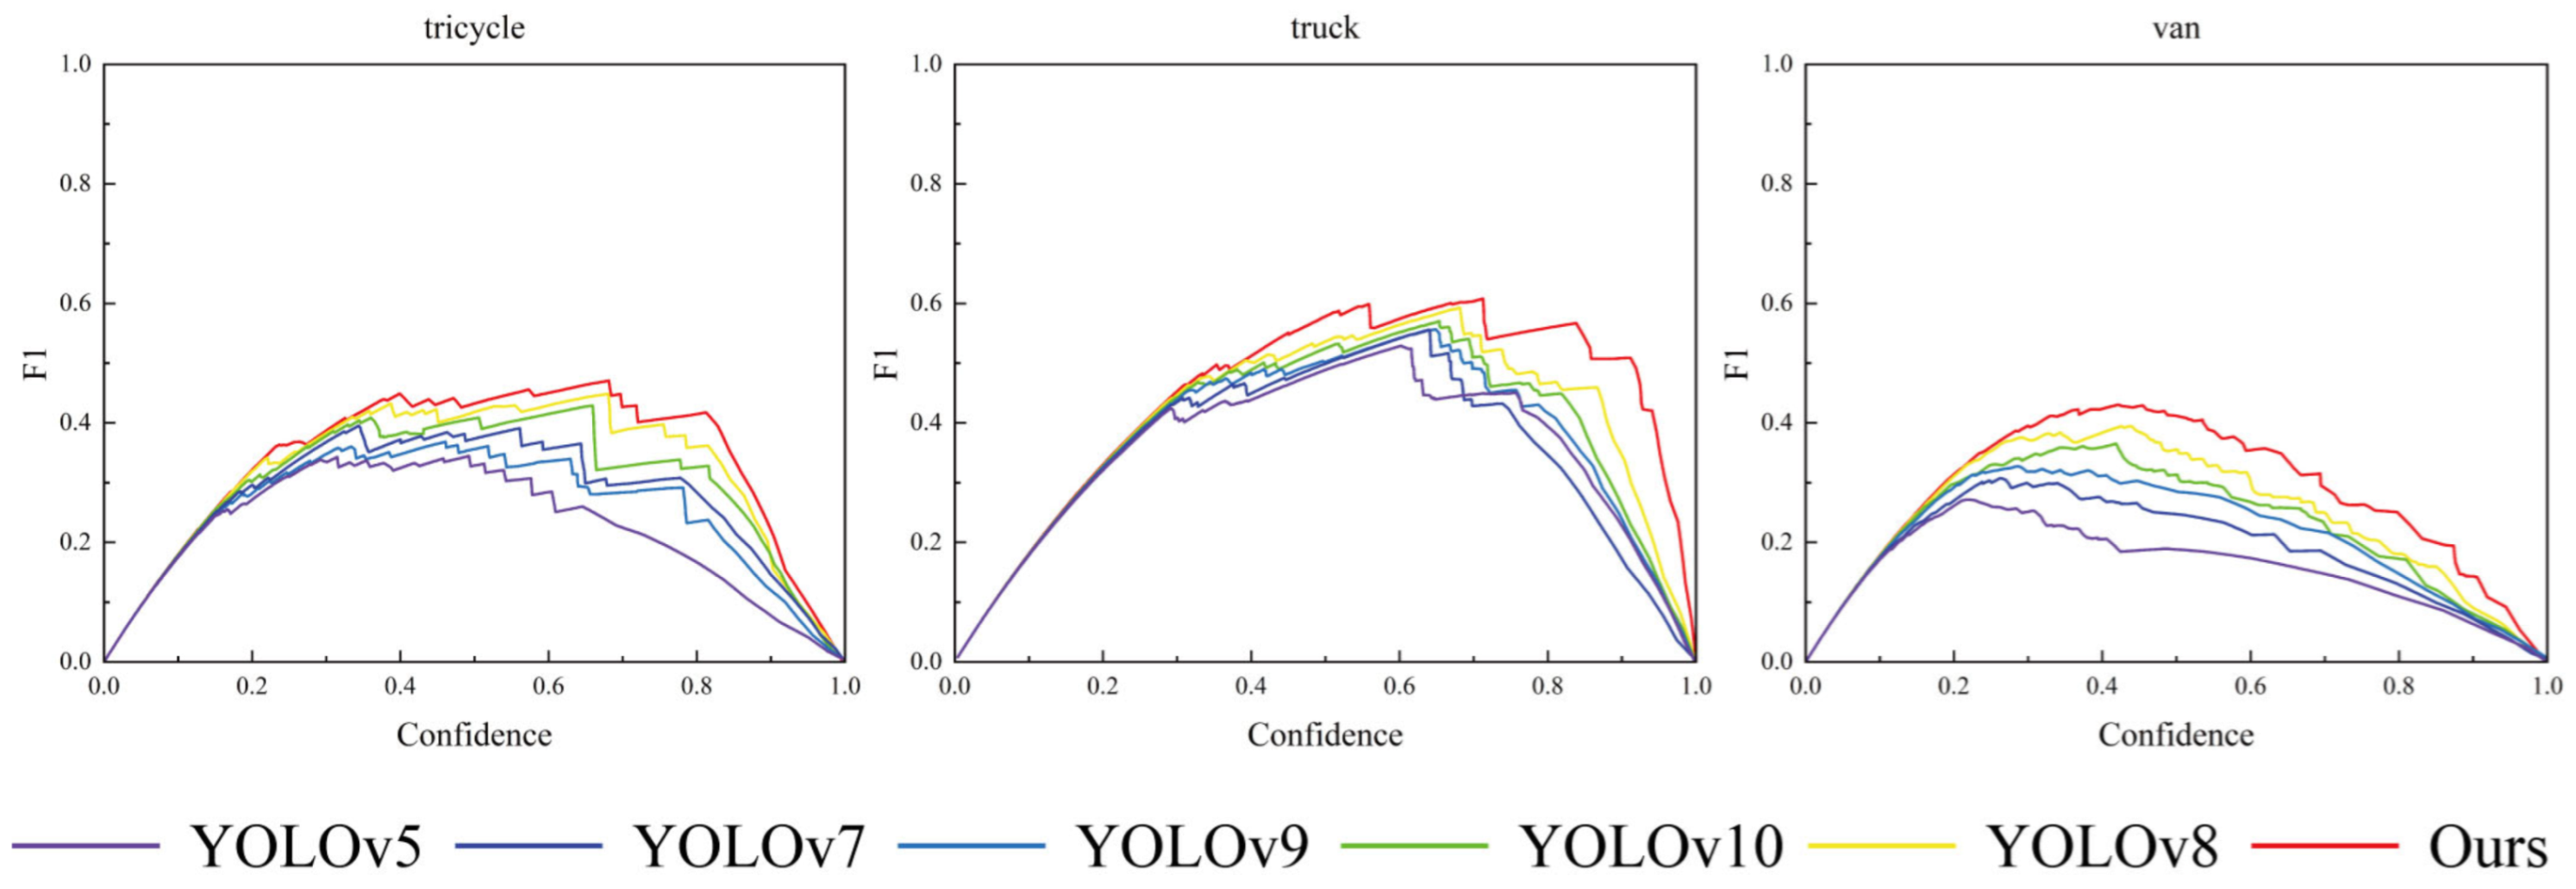
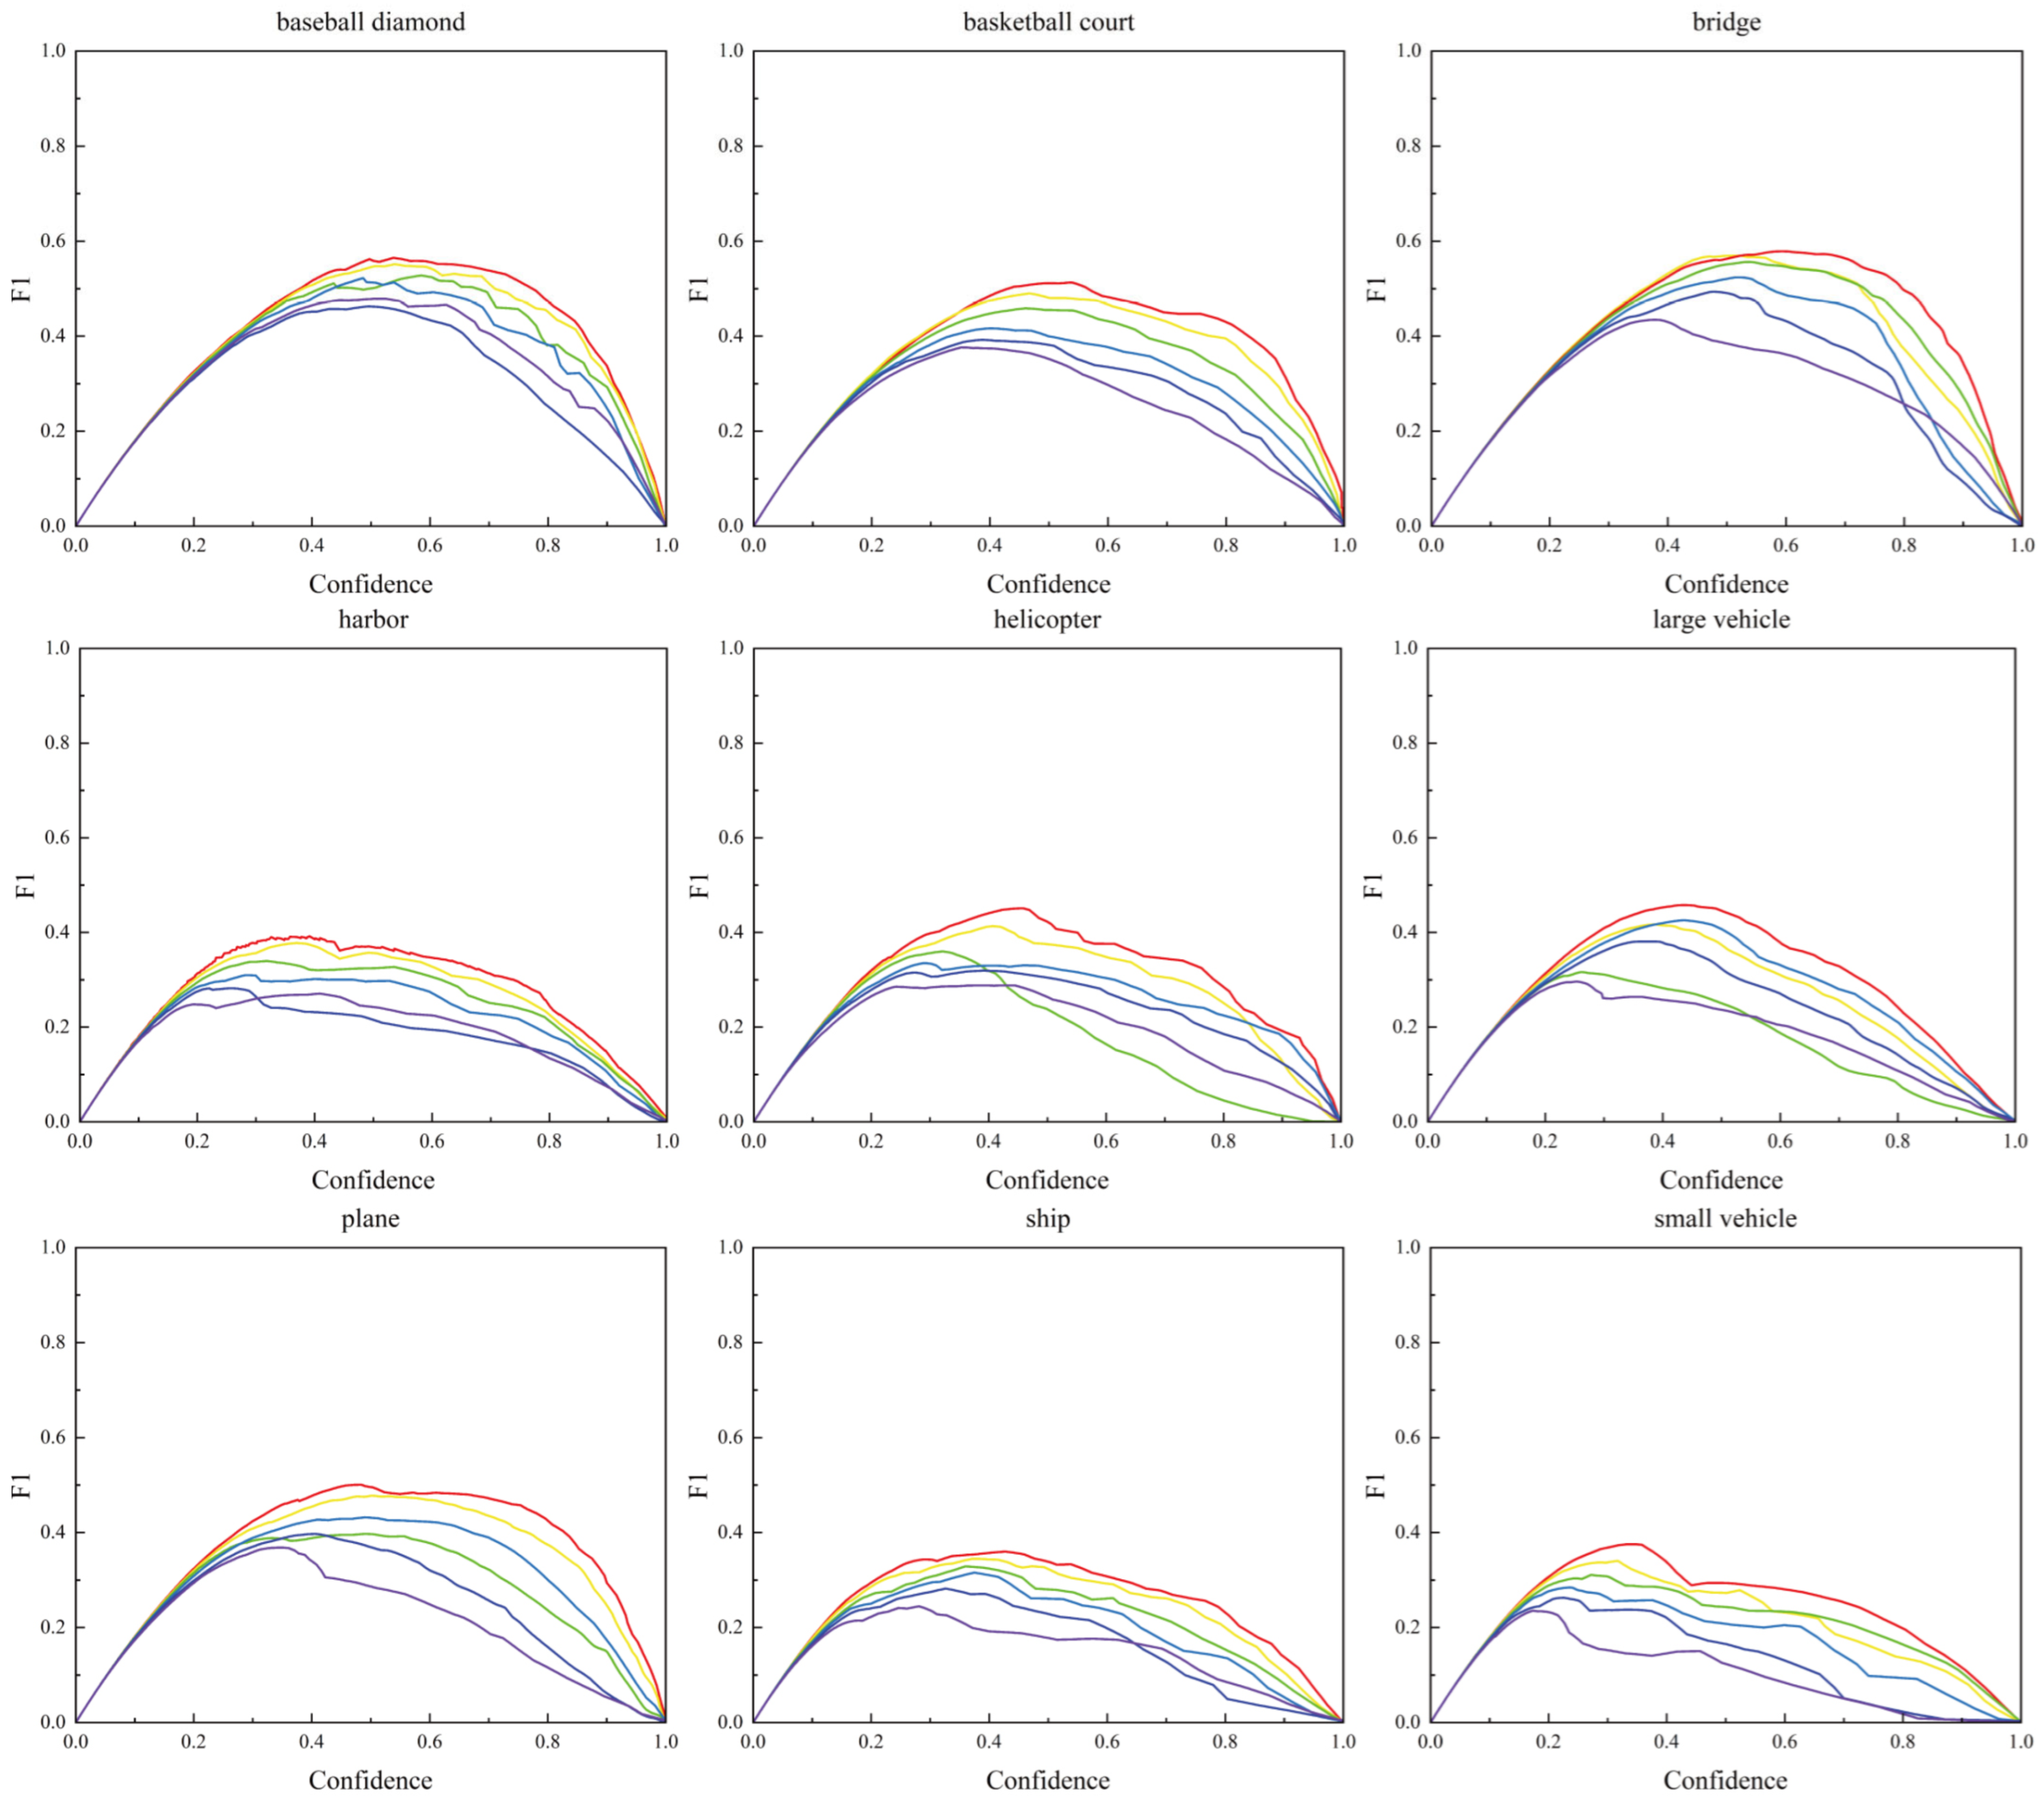
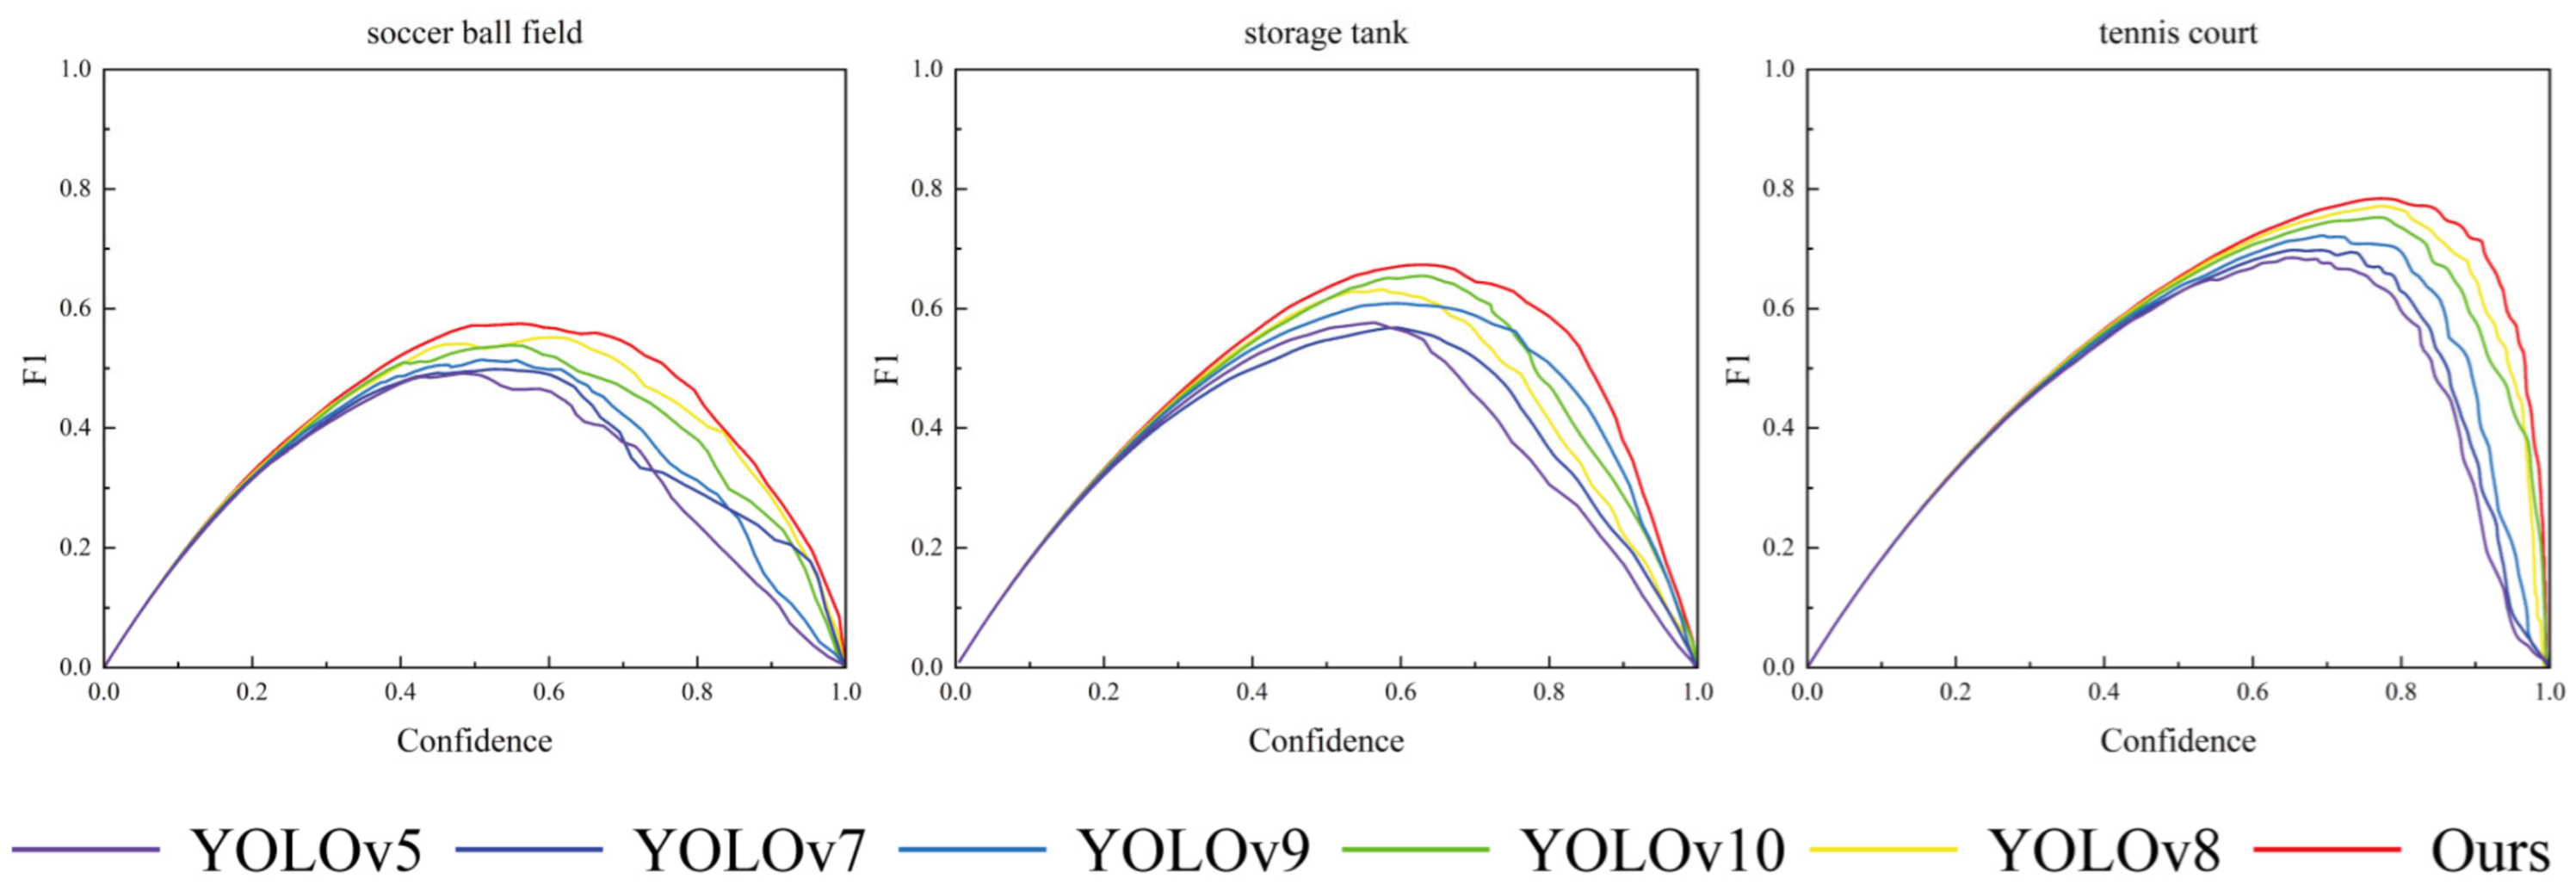
Due to the trade-off relationship between precision and recall, this paper also selects the F1 score as a comparative metric, taking into account the interplay between the two. Figure 15 presents a comparison of the F1 score curves for six models when nine object categories are selected from the VisDrone2019 dataset, and Figure 16 shows the F1 score curve comparison for six models when twelve object categories are selected from the DOTA dataset. Similar to Figure 12 and Figure 13, in Figure 15 and Figure 16, each subplot has the target category labeled at the top, with the horizontal axis representing confidence level and the vertical axis representing the F1 score. The type of each curve is represented by a different color, and the color representing the category is indicated in the upper-right corner of each subplot.
In all subplots, there is a state where the curves of various models overlap when the confidence level is below 0.1. Upon analysis and a literature review, this phenomenon is primarily due to the fact that at low confidence levels, the models produce a high number of false positives, leading to significant uncertainty in target identification, which greatly impacts both precision and recall, ultimately resulting in similar F1 scores. Secondly, the comparative models selected in this paper are all from the YOLO series and share similarities in structure, which may lead to conservative predictions when processing data. These factors could also contribute to the overlap of the F1 score lines in environments with low confidence levels.
Some F1 score curves exhibit fluctuations, as seen with tricycles, trucks, bicycles, etc., in Figure 15. Analysis reveals that the VisDrone2019 dataset contains a significant number of occluded objects, with some images showing a substantial coexistence of occluded objects and regular objects. This leads to large variations in features among targets of the same category. The F1 score, serving as a harmonic mean between precision and recall, is a more sensitive performance metric, where slight changes in precision or recall can cause significant fluctuations in the F1 score.
Additionally, it can be observed that some F1 score curves are relatively smooth and fluid, as seen with targets such as basketball courts, planes, bridges, and storage tanks in Figure 16. This indicates that there are fewer occluded objects in this dataset, and the features of the same targets are comprehensive and consistent. As the confidence threshold varies from 0 to 1, the changes in the F1 score are more gradual, without the significant ‘spikes’ that appear in Figure 15.
In summary, by comparing the precision–recall curves and F1 score curves of several models on the DOTA and VisDrone2019 datasets, the model proposed in this paper demonstrates the best performance. This also validates the superior detection capabilities of the model introduced in this study.
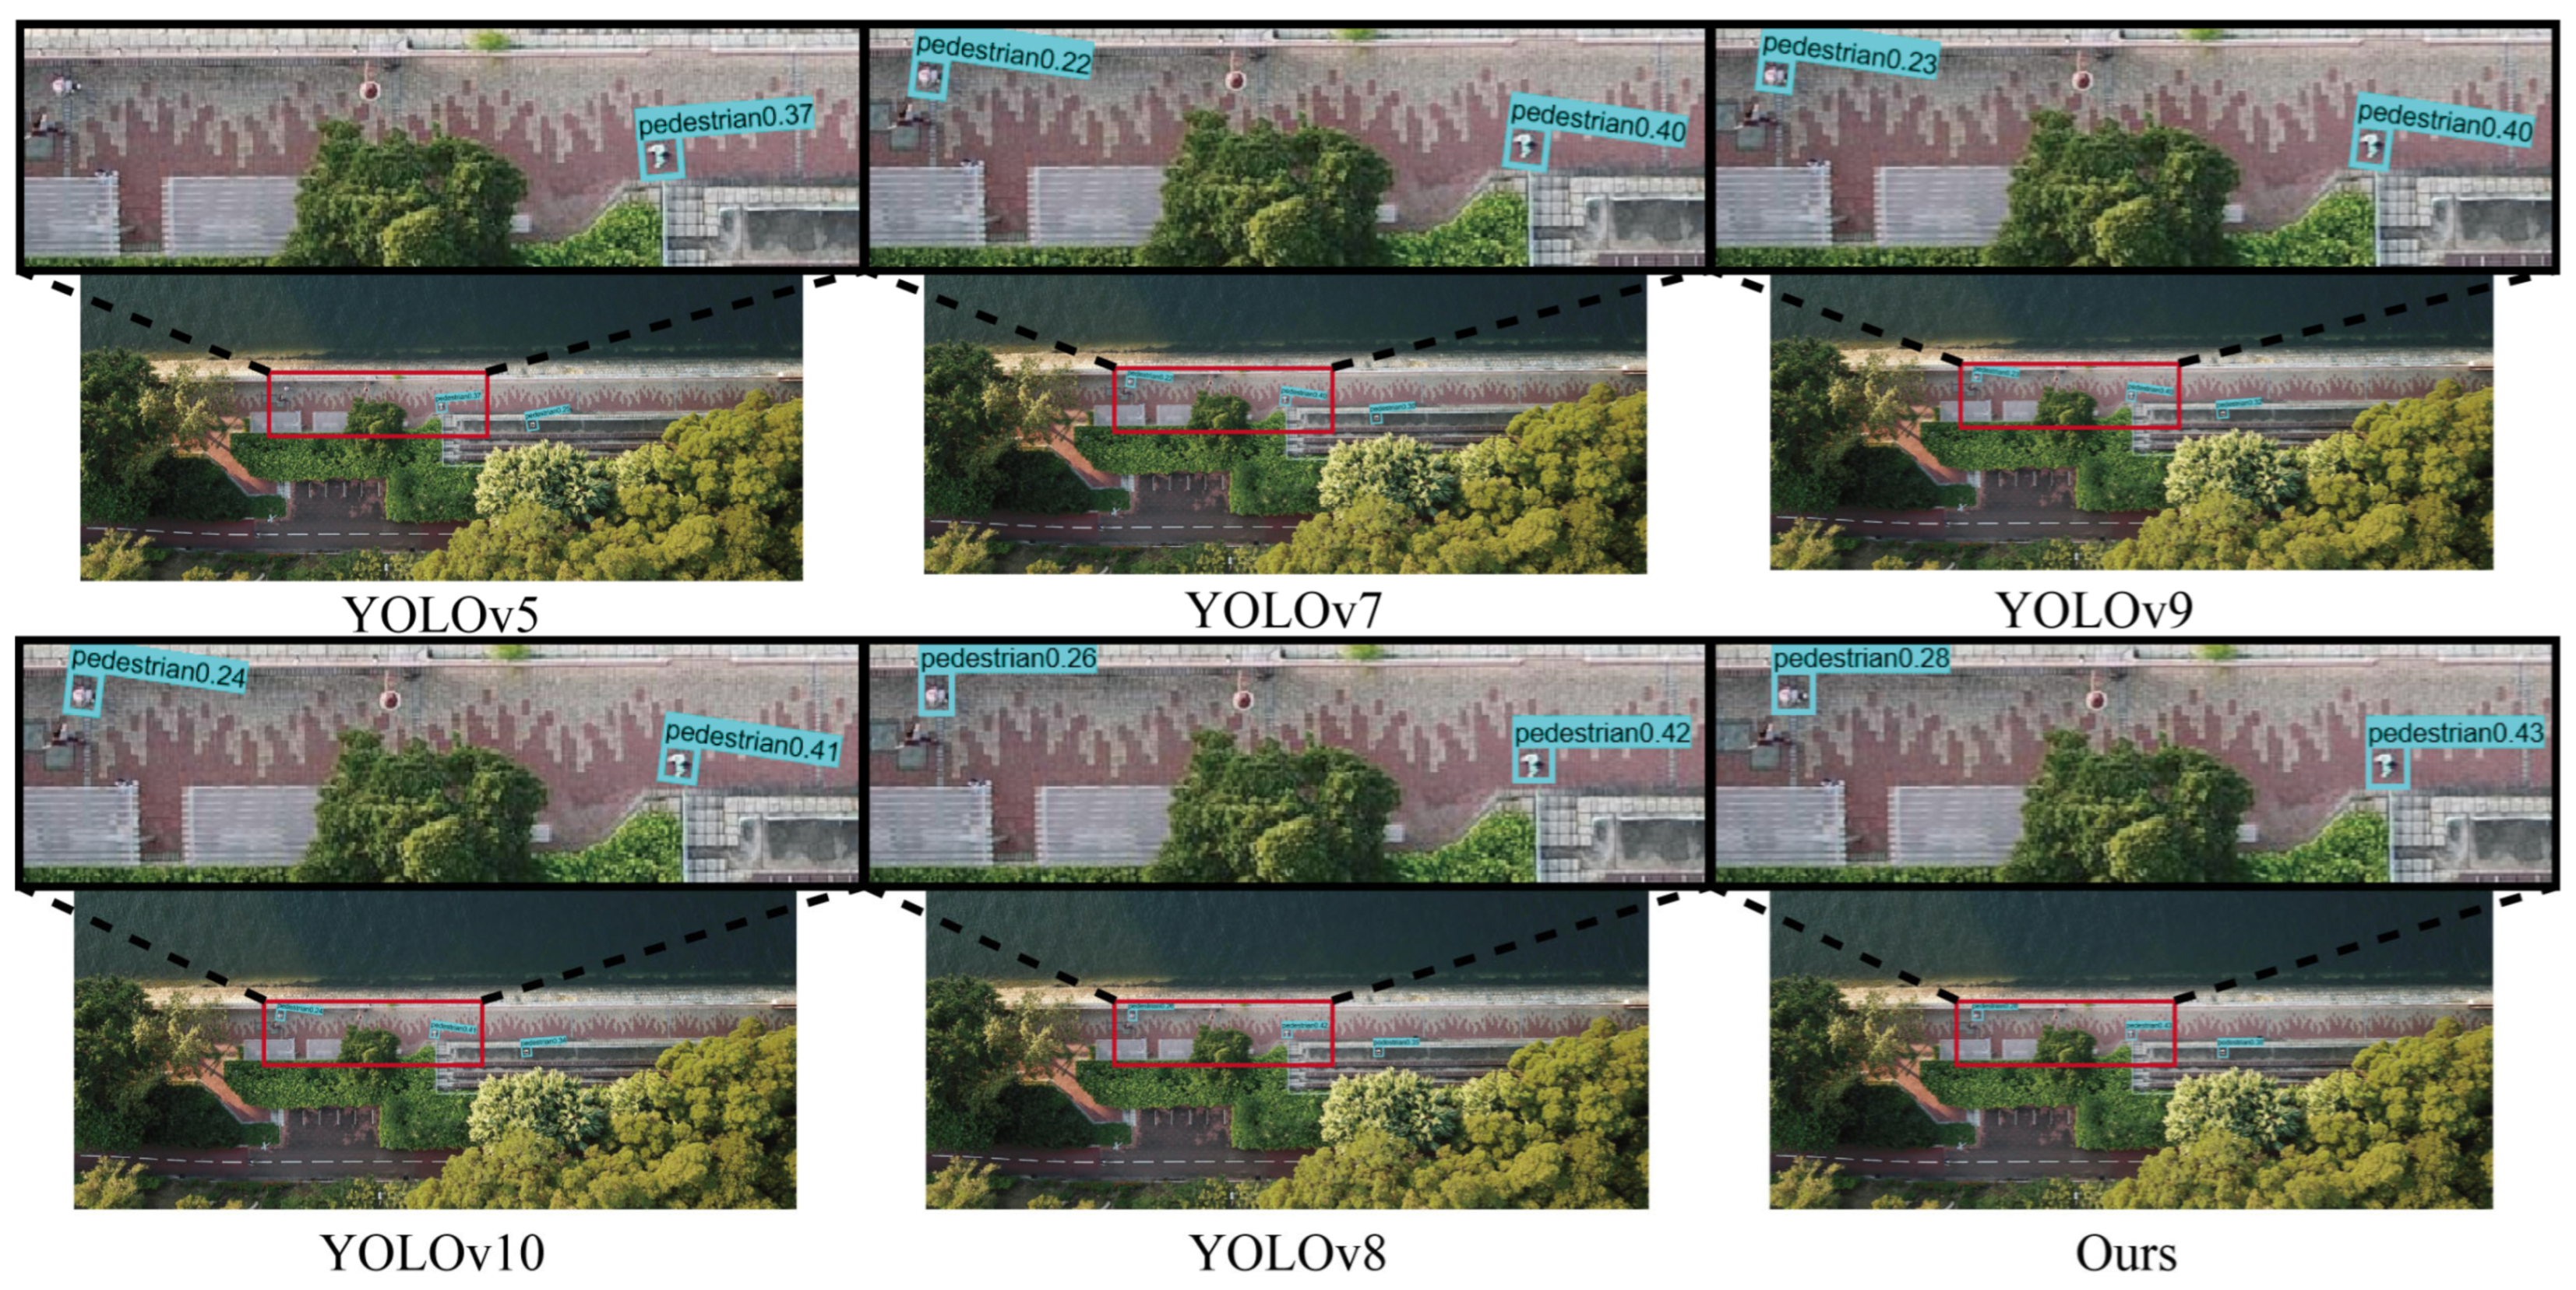
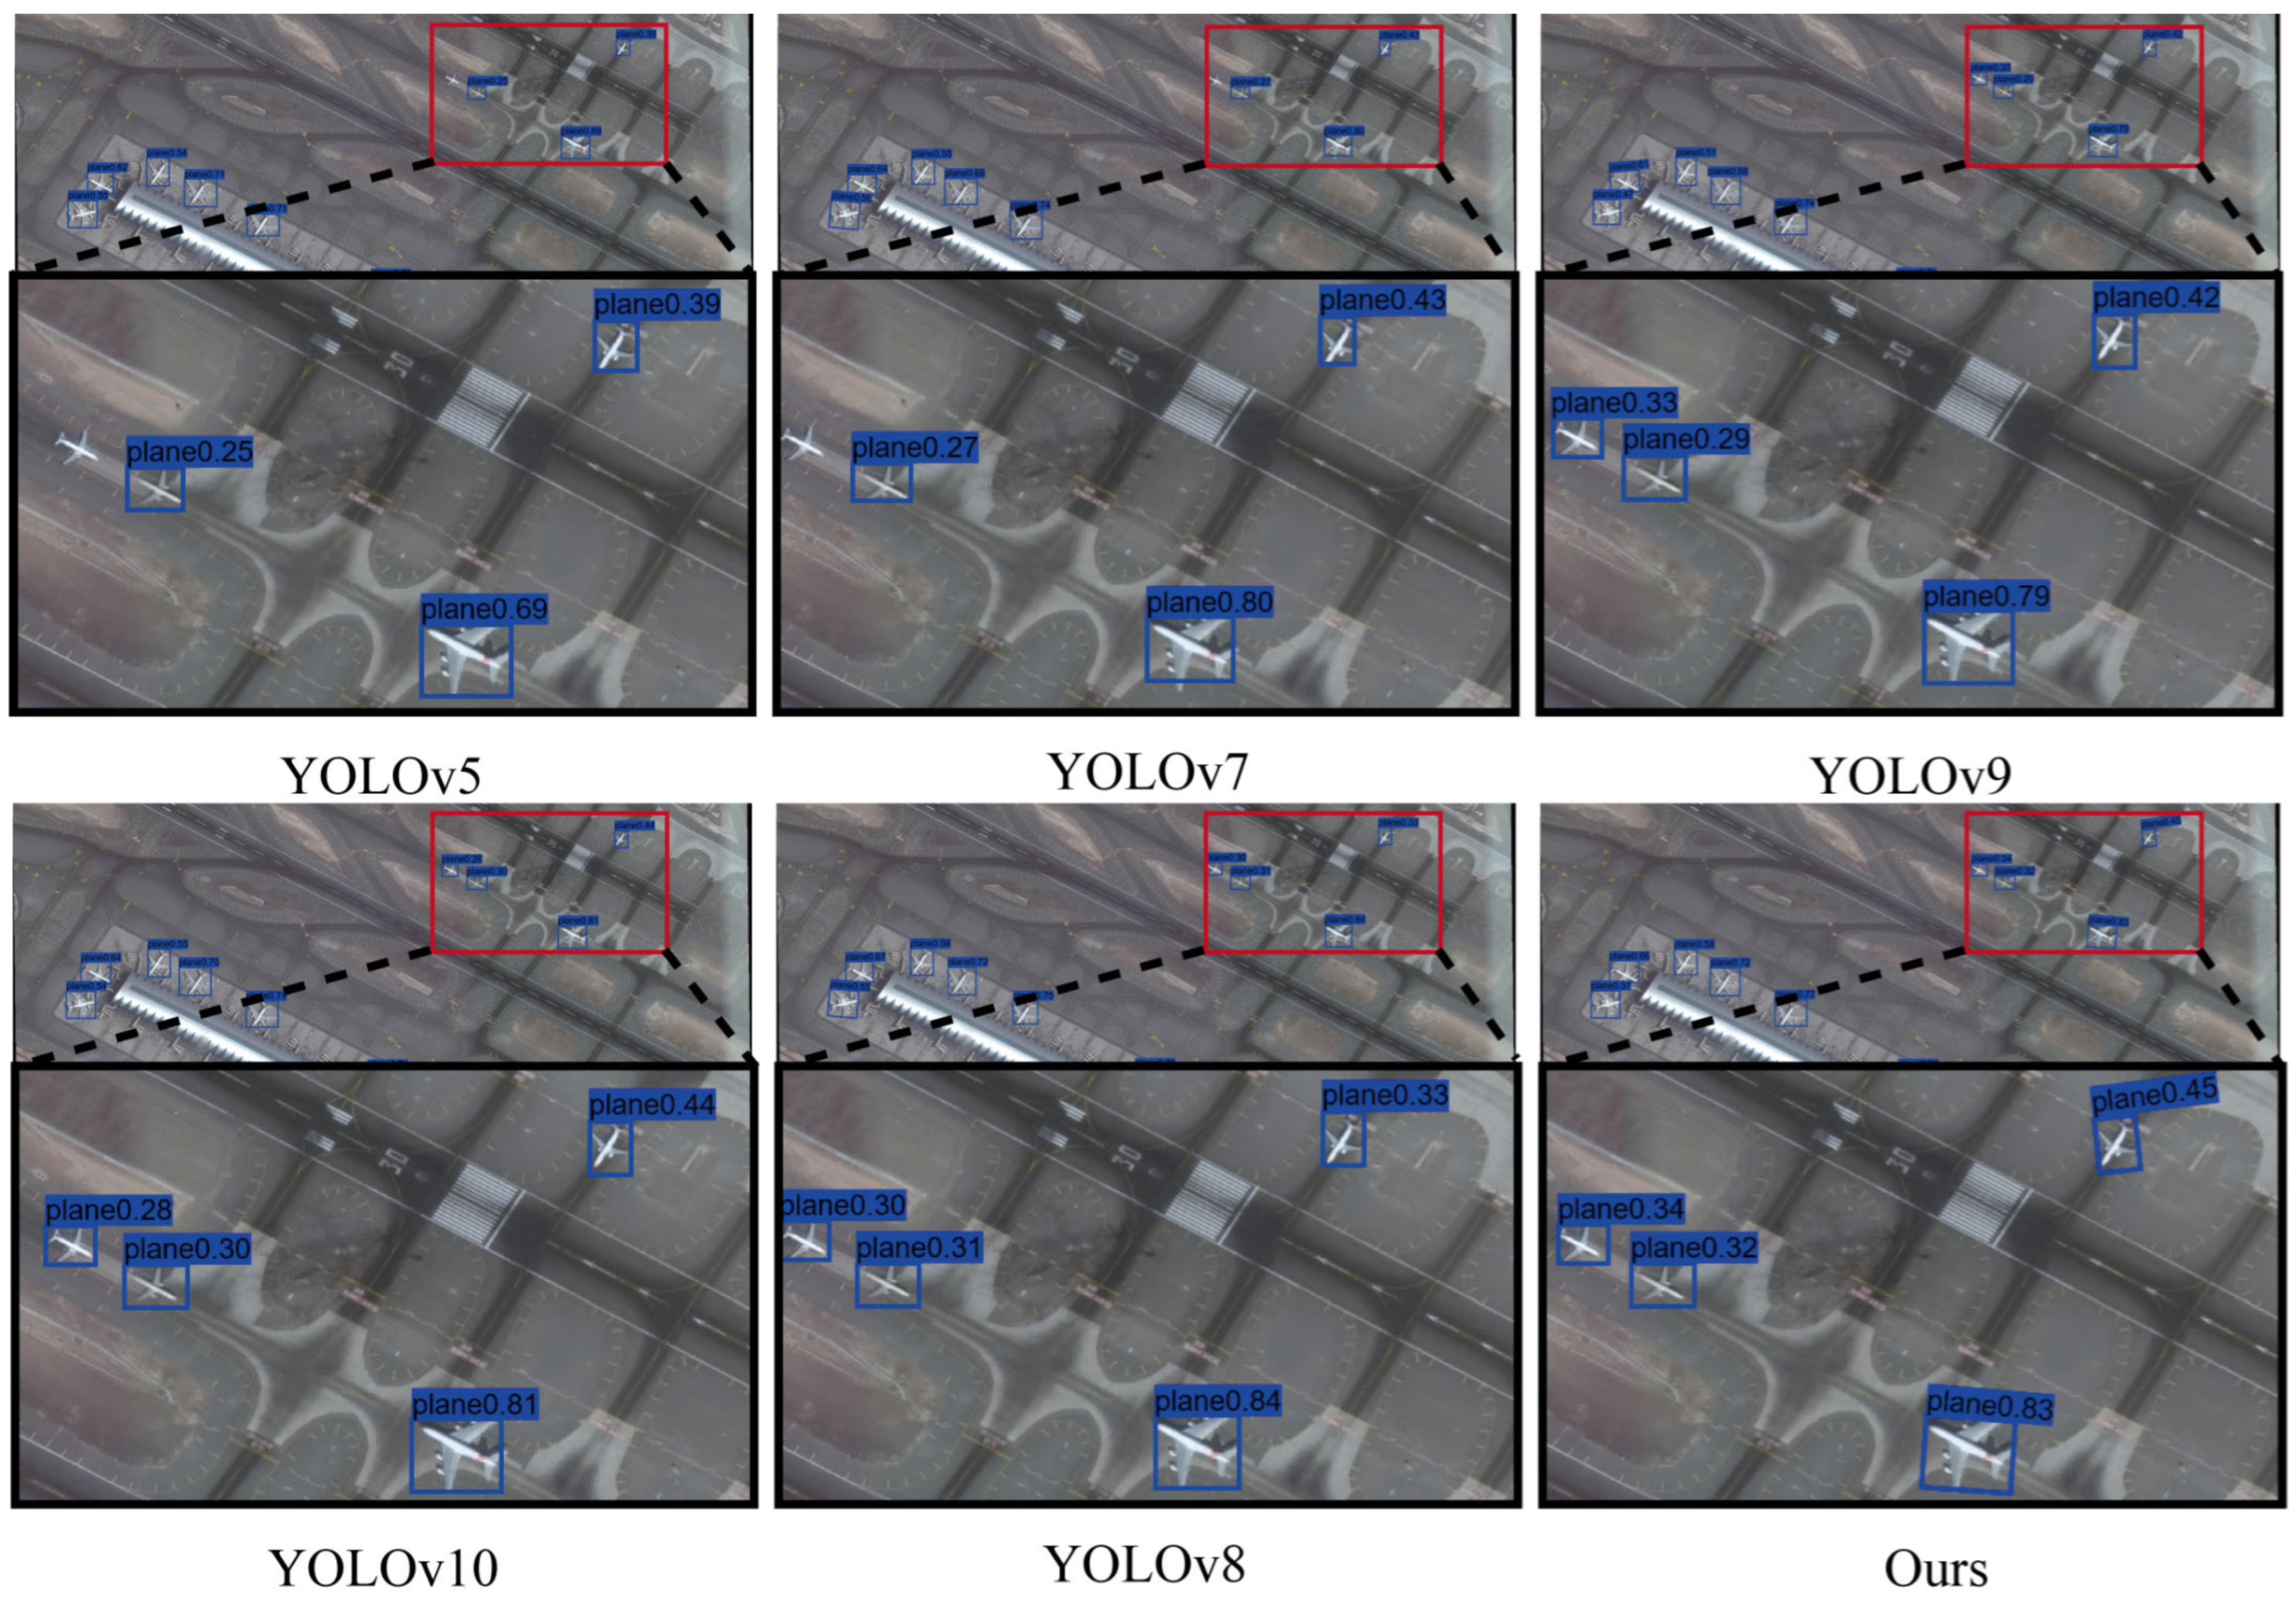
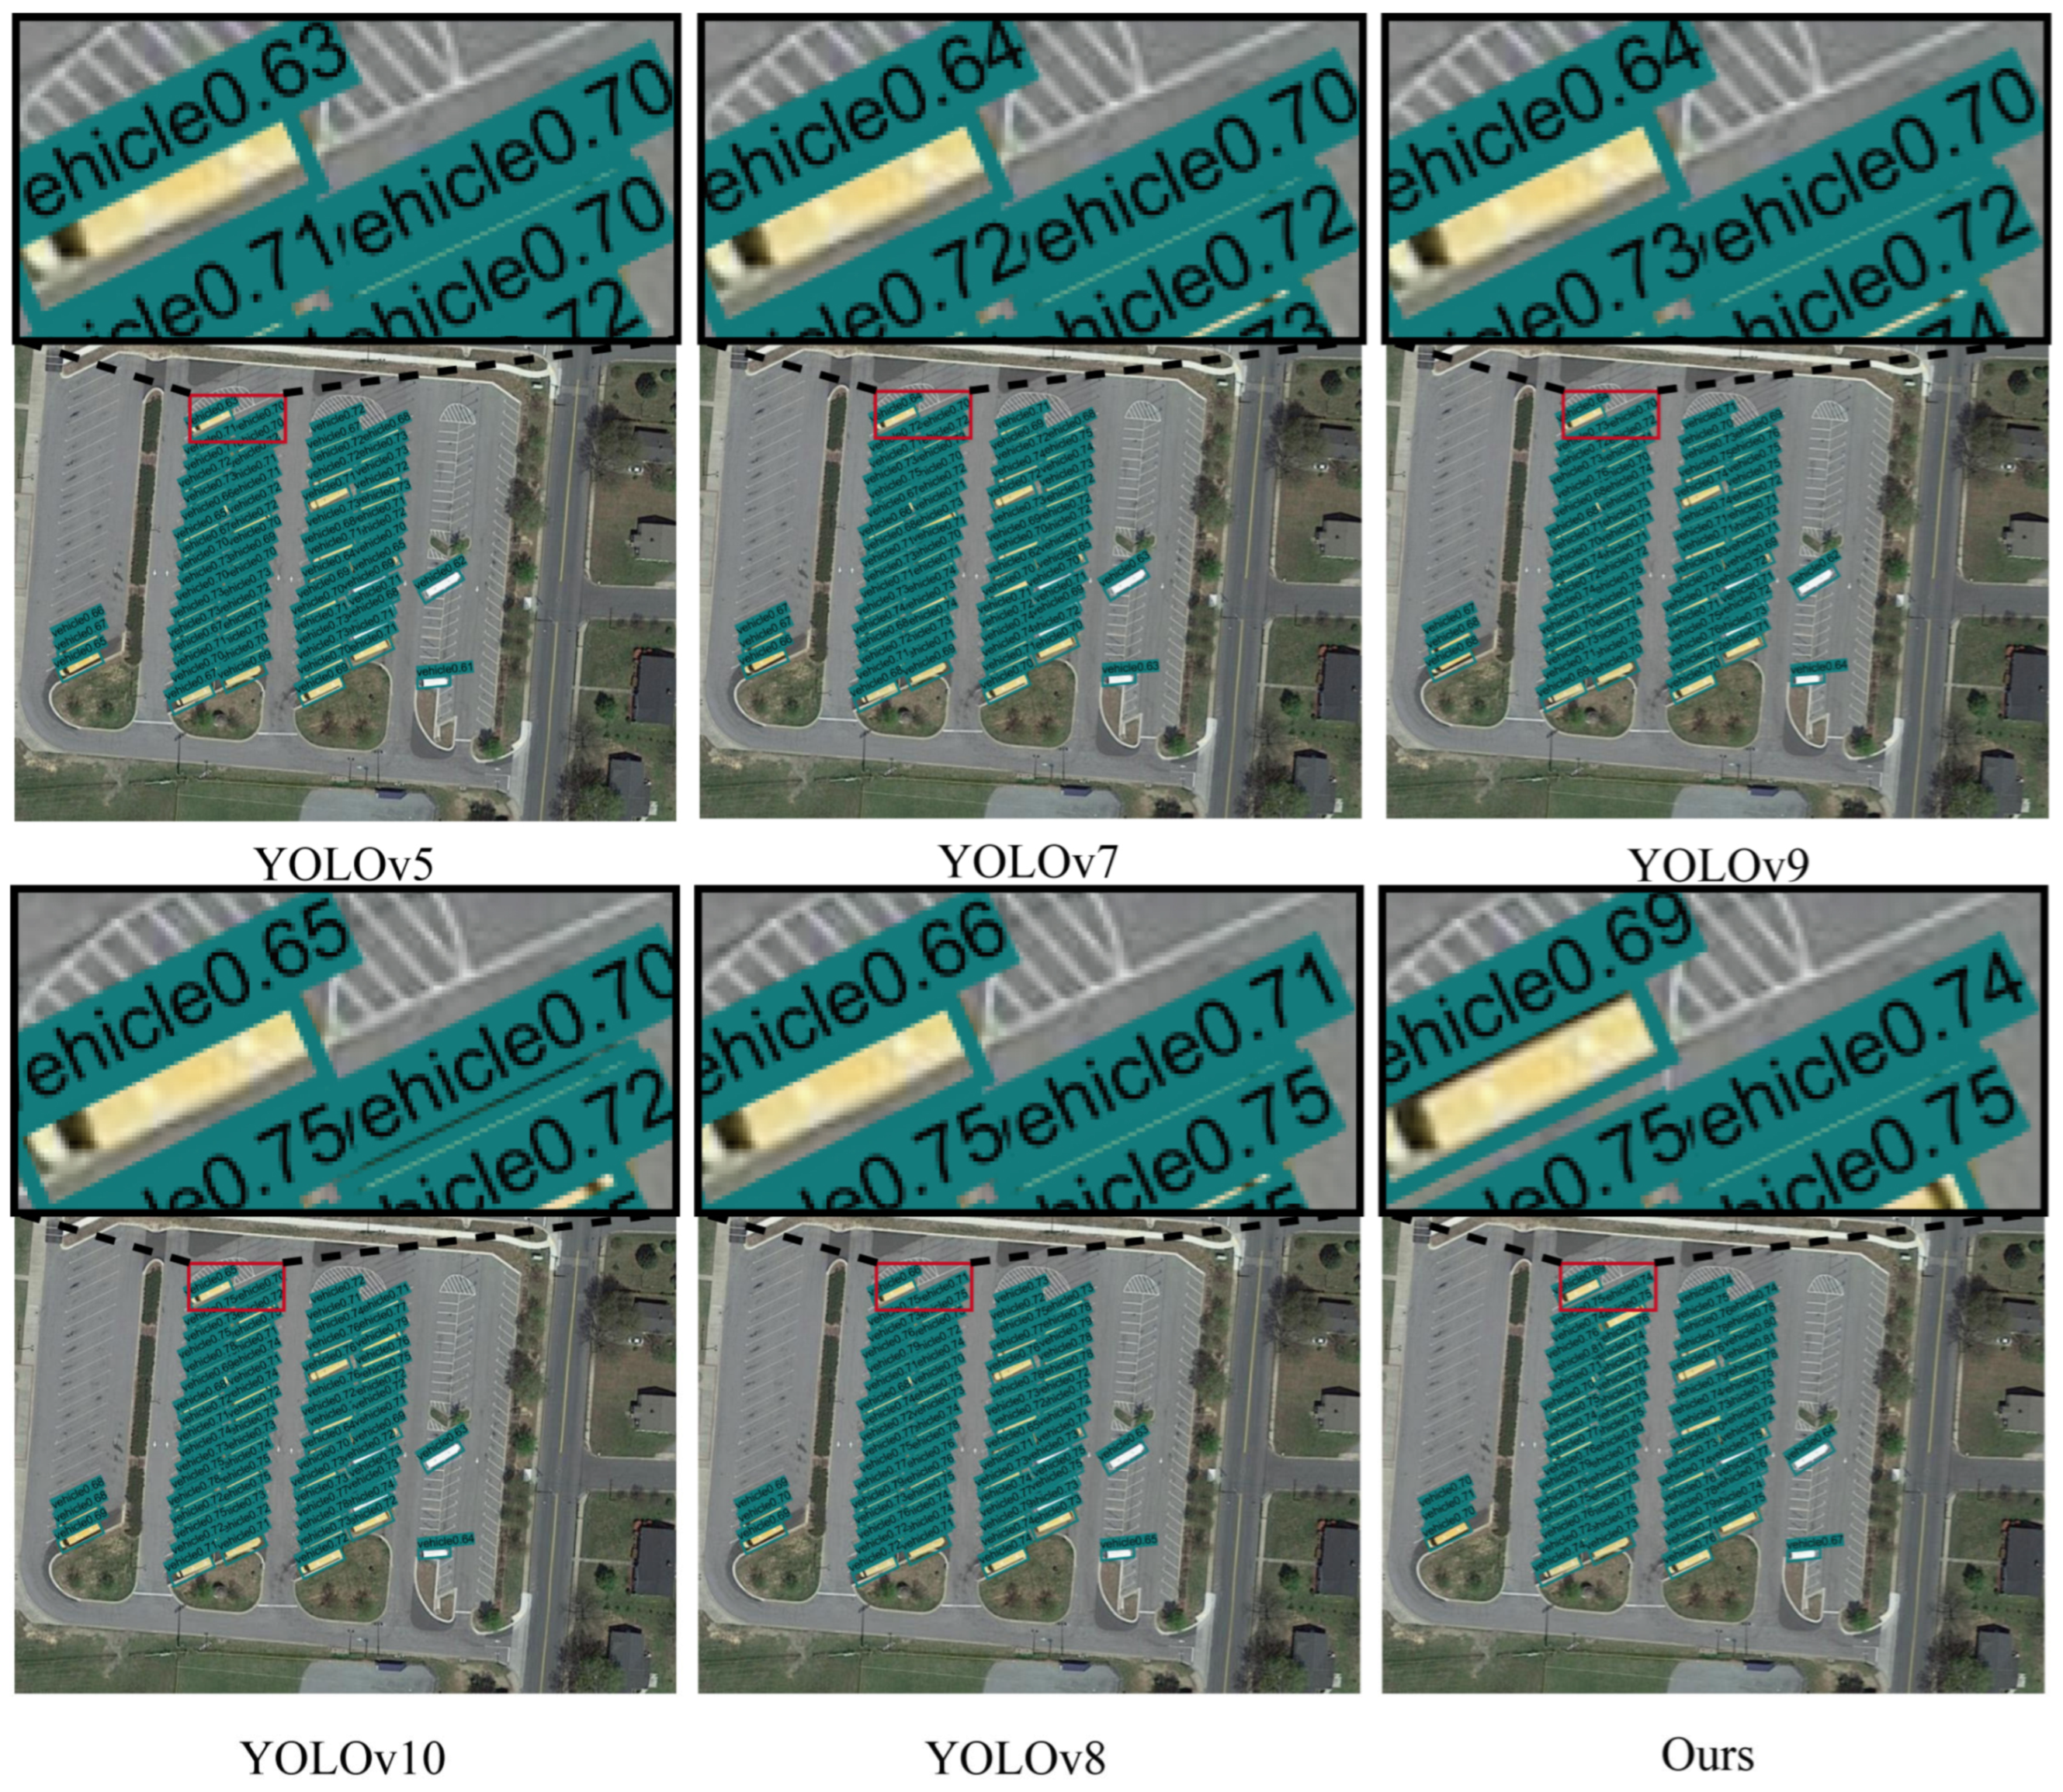
In addition to the aforementioned P–R curves and F1 score curves, this paper also employs visualization methods to verify the advancement of the improved model. As shown in Figure 17 and Figure 18, the results for the VisDrone2019 dataset and the DOTA dataset are displayed, respectively. From left to right in each figure are the detection outcomes on YOLOv5, YOLOv7, YOLOv9, YOLOv8, YOLOv10, and our model. The scenes selected in Figure 17 and Figure 18 are representative, such as people with background occlusions in Figure 17 and planes of varying scales, densely packed large vehicles, etc., in Figure 18, which are challenges faced in the field of remote sensing image detection. By comparison, it can be observed that different models exhibit varying levels of detection accuracy and degrees of missed and false detections under different scenarios. The improved model consistently maintains a higher level of performance, as evidenced by the pedestrian detection in Figure 17, where pedestrians closely resemble the background, and in the second scenario of Figure 18 for plane detection, where some models fail to detect the small-sized plane in the upper right corner, LACF-YOLO still manages to detect it with commendable precision.

4.4.2. Comparative Analysis of the Improved Model Versus the Original Model

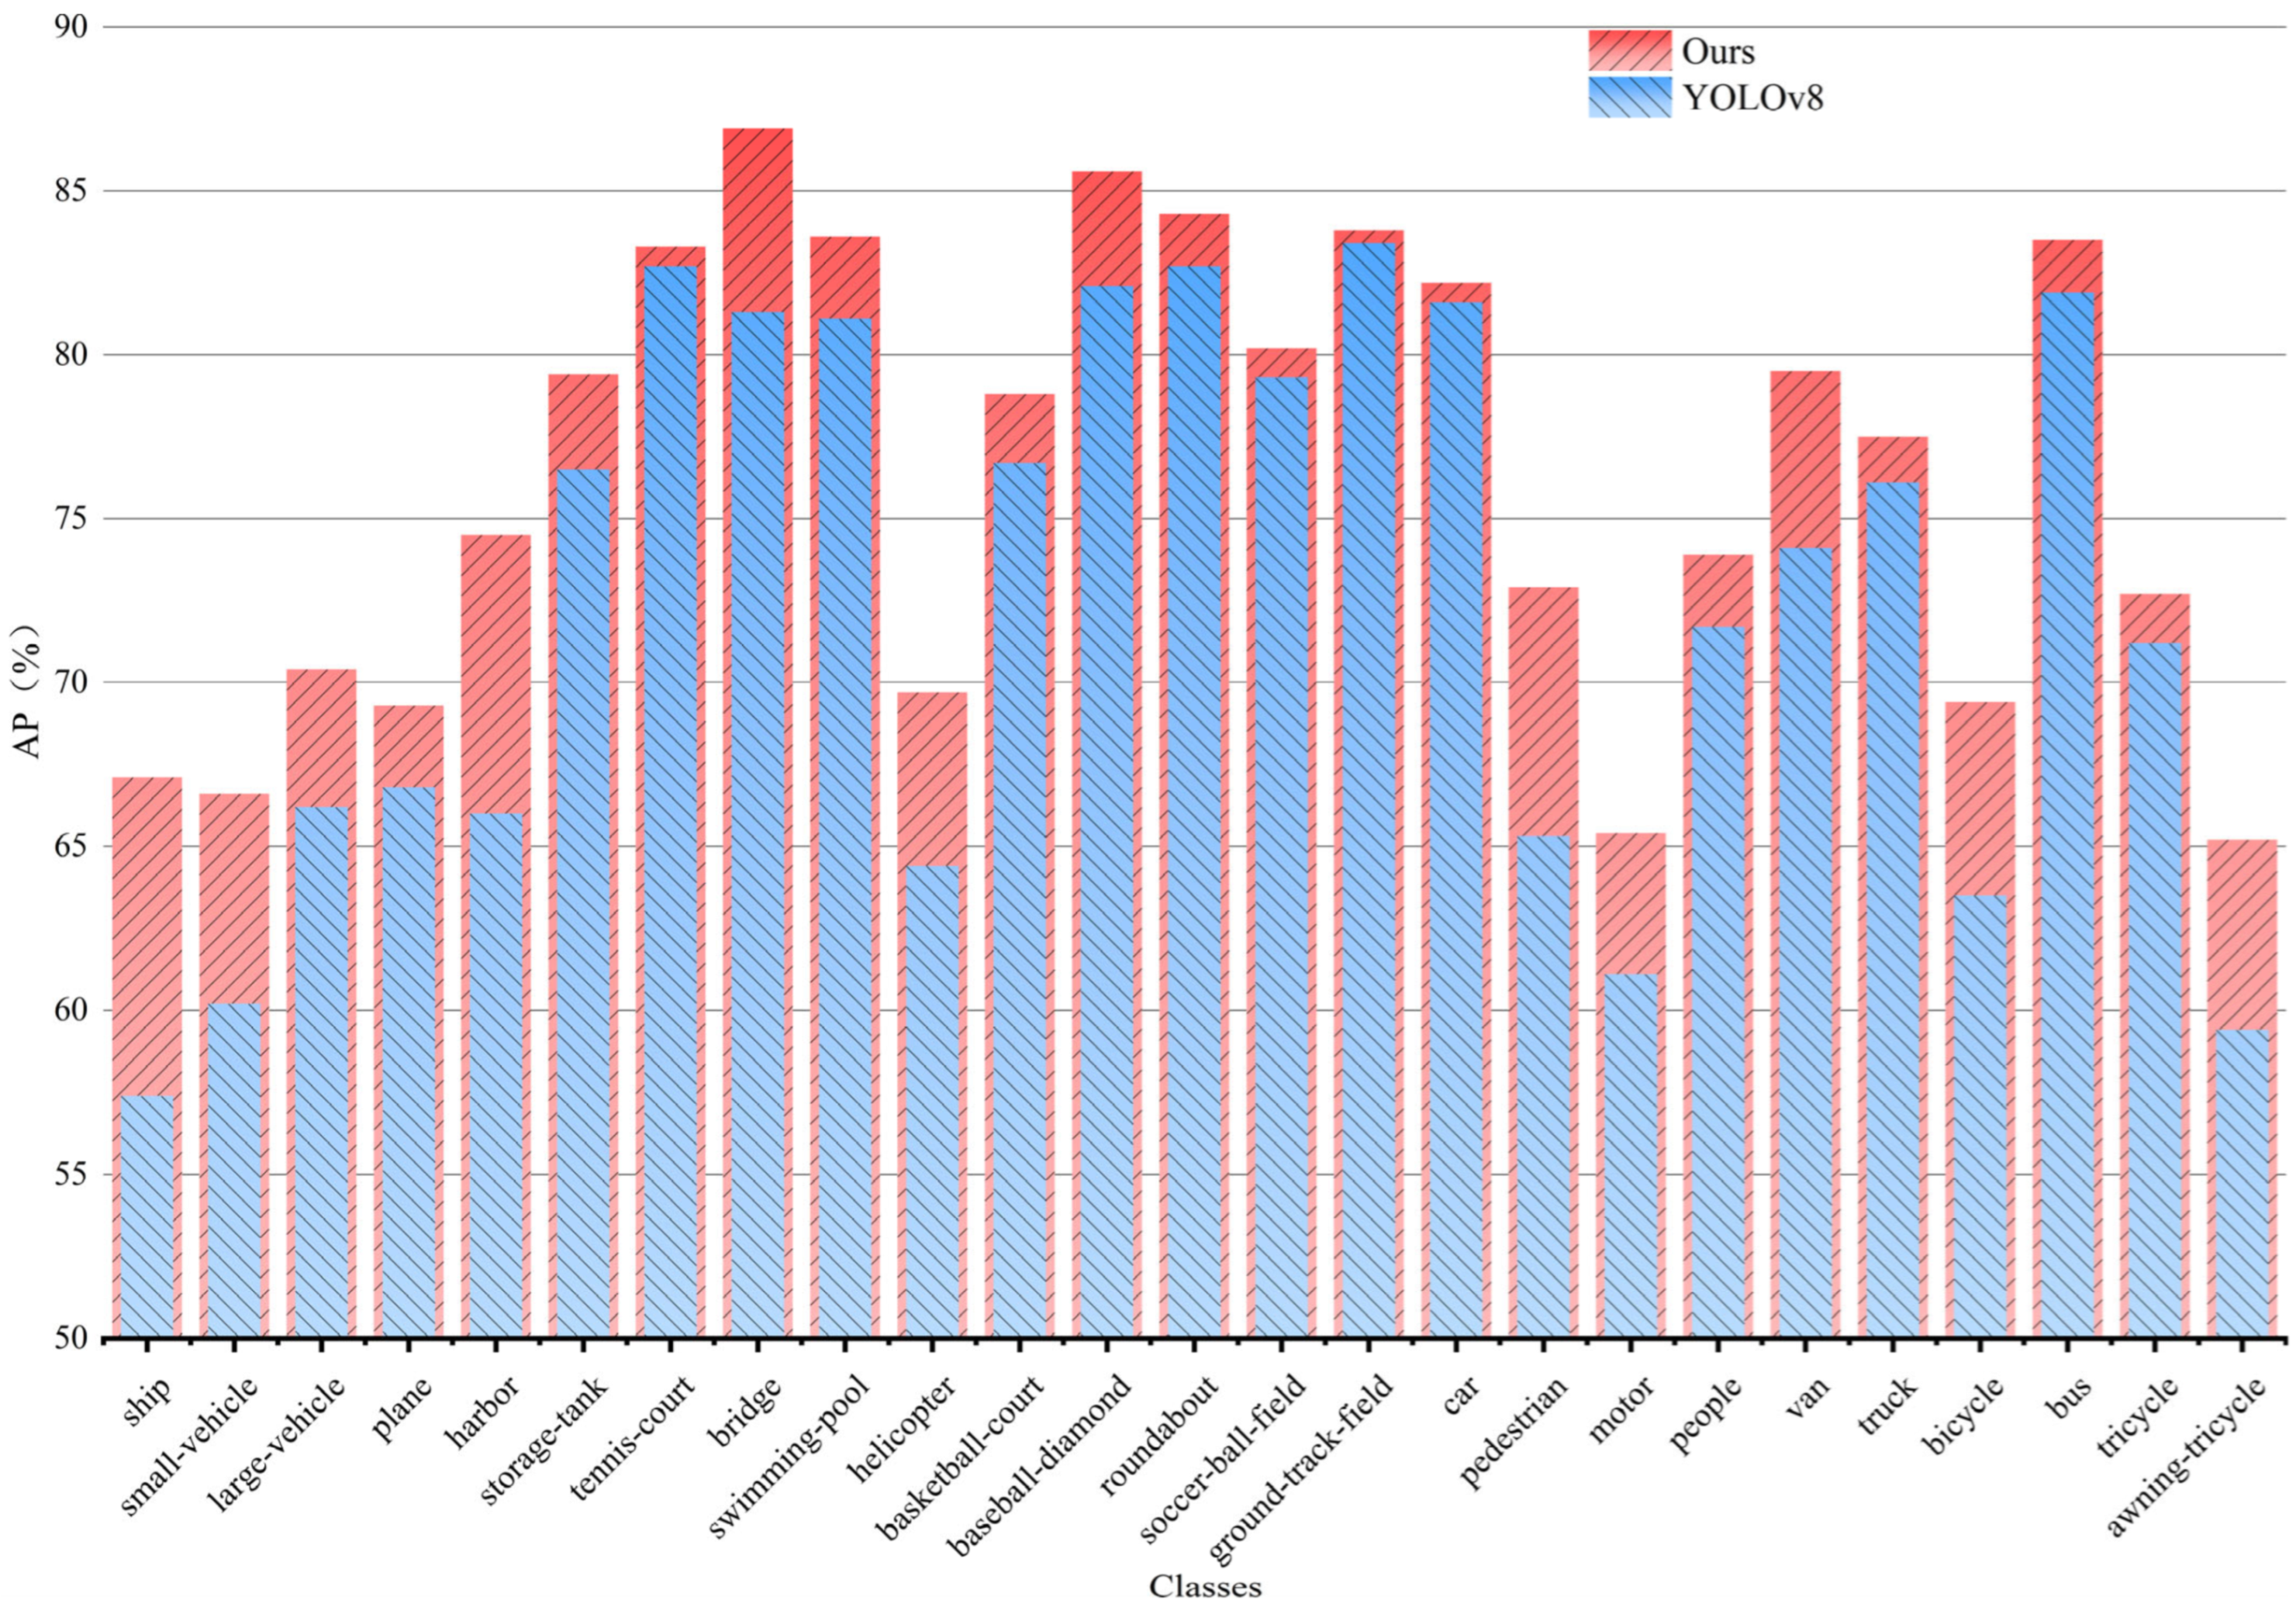
In addition to comparing with several state-of-the-art models, this section conducts a more in-depth analysis of the original model, as shown in the bar chart of Figure 19. The bar chart uses the targets from the DOTA and VisDrone2019 datasets as the horizontal axis of the bar chart and the AP values of each target detected by the original and improved models as the vertical axis. The red gradient bars represent the results of the improved model, while the blue gradient bars represent the outcomes of the original model, with a legend provided at the top right of the figure for clarification. For each target, the bars of the two models are overlaid to facilitate a clearer comparison.
Analysis of the overlaid bar chart reveals that the improved model demonstrates superior detection outcomes across a total of 25 object categories. Compared to the original model, there are improvements to varying degrees for each target, with particularly significant enhancements in AP values for ships, small vehicles, harbors, pedestrians, bicycles, and awning-tricycles.
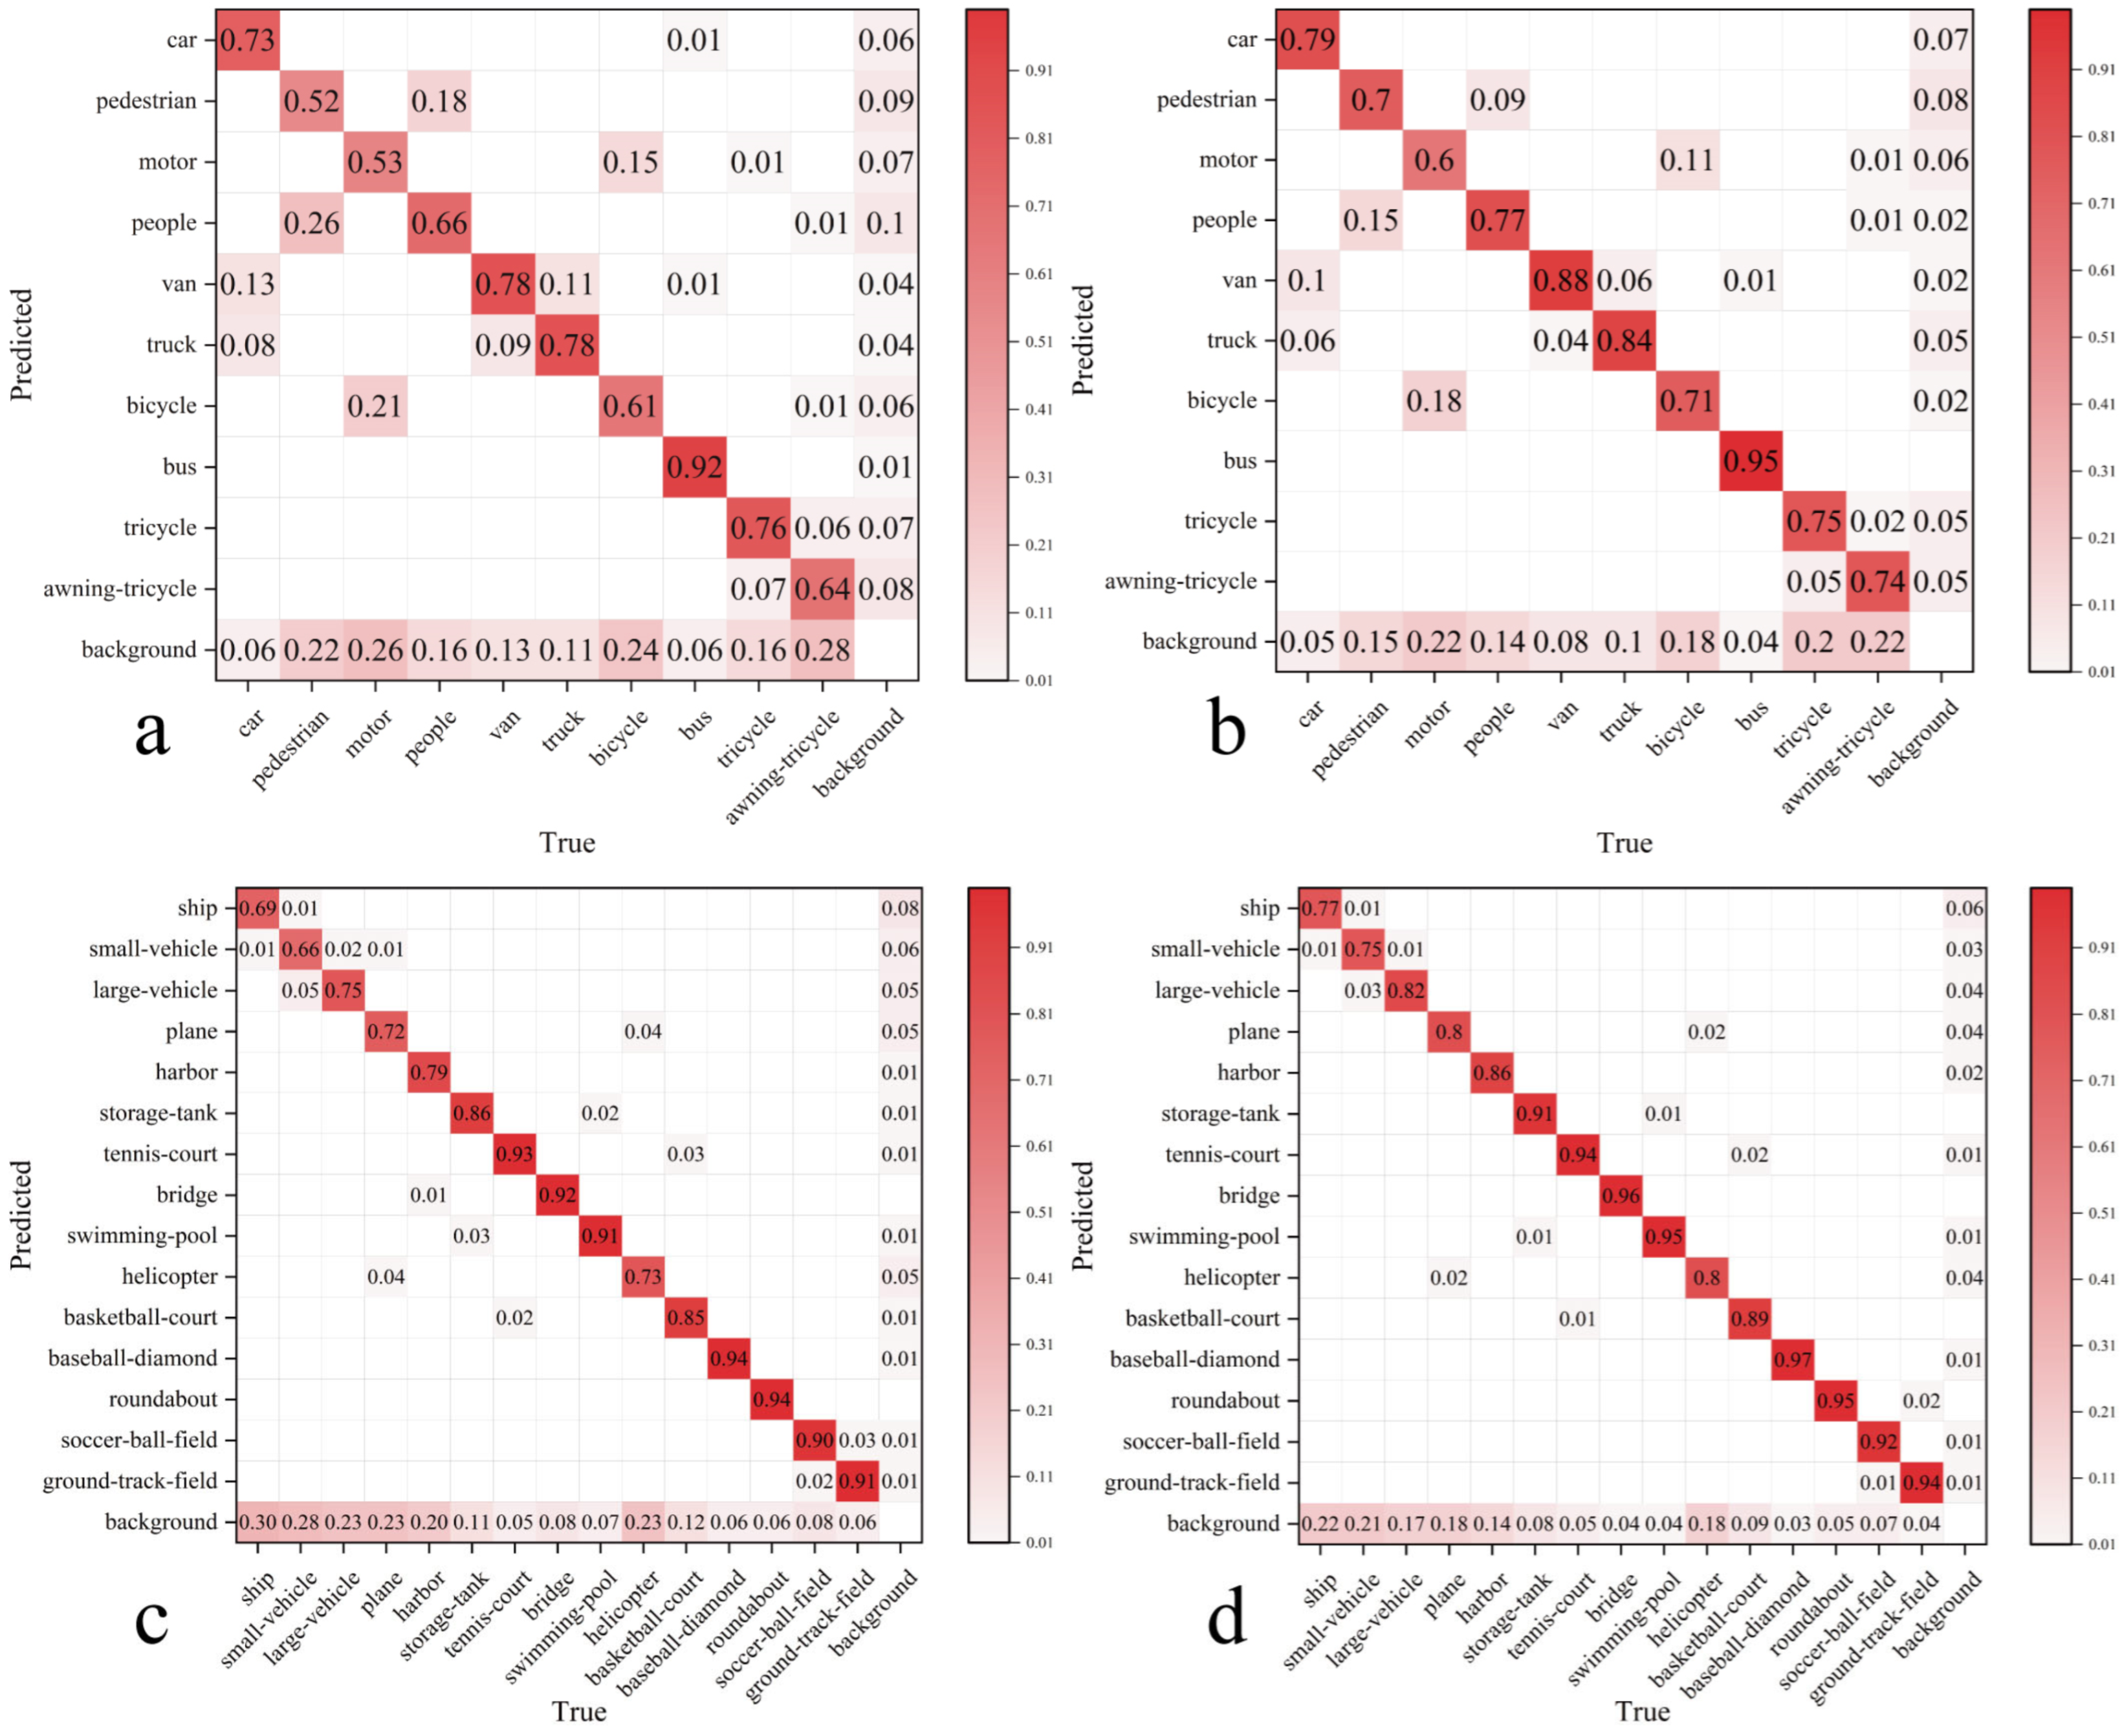
The confusion matrices before and after improvement are shown in Figure 20, where (a) and (c) represent the confusion matrices of the original model on the VisDrone2019 and DOTA datasets, respectively, while (b) and (d) represent those of the improved model on the VisDrone2019 and DOTA datasets. In each confusion matrix, the horizontal axis indicates the true class labels, and the vertical axis indicates the predicted class labels by the model. The values in the cells represent the proportion of predicted class labels that correspond to the actual class labels, with darker colors indicating higher proportions and blank cells indicating a value of zero at that position.
By comparing the confusion matrices in Figure 20 for the two datasets, it can be observed that the improved model represented by (b) and (d) has a higher proportion of correct predictions along the diagonal, which indicates the true positive predictions. Additionally, the increased number of blank cells across the entire confusion matrices suggests that the improved model makes more accurate judgments for each target, reducing the deficiencies in false positives and false negatives. This demonstrates that our model achieves higher accuracy in the detection of various targets.

4.4.3. Ablation Experiment

In addition to the comparative experiments with other models mentioned above, this paper also conducts ablation experiments on the model itself to analyze the specific impact of various improvement strategies on the model’s performance, further demonstrating the superiority of the improved model in detection capabilities. This section will introduce the effects on detection accuracy and computational efficiency when several different strategies are added separately and in combination.
Table 5 and Table 6 present ablation experiments on the VisDrone2019 and DOTA datasets, respectively. The basic model YOLOv8 is incrementally enhanced with the addition of DIBLayer, TA, and PPWC modules, comparing the performance before and after the incorporation. The performance of the model is then contrasted using pairs of these methods to assess the combined effect of both modules. From the tables, it is evident that detection accuracy is somewhat higher on the DOTA dataset, which is closely related to the presence of a large number of challenging detection samples in the VisDrone2019 dataset. It is also observed that while the DIBLayer contributes the least to the improvement in detection accuracy, it significantly impacts the number of model parameters and floating-point operations. The TA attention mechanism and the cross-scale feature fusion of the CCWC module demonstrate a notable enhancement in the detection accuracy of small targets. It is worth noting that the FPS values in Table 5 and Table 6 have both been increased. This suggests that the improved model has better real-time performance and efficiency on both datasets. This meets our expectations for deployment on UAV platforms and shows its application potential.
The experimental methods and control groups in Table 6 maintain consistent performance metrics with those in Table 5, with the only difference being the datasets utilized. By employing this method of controlling variables, it is also more convincingly demonstrated that the model presented in this paper effectively enhances detection performance across different datasets.
Next, we will integrate the TA mechanism and the PPWC cross-layer feature fusion into the model for visualization experiments, further demonstrating the enhancement effect of the improvement strategies on detection levels.
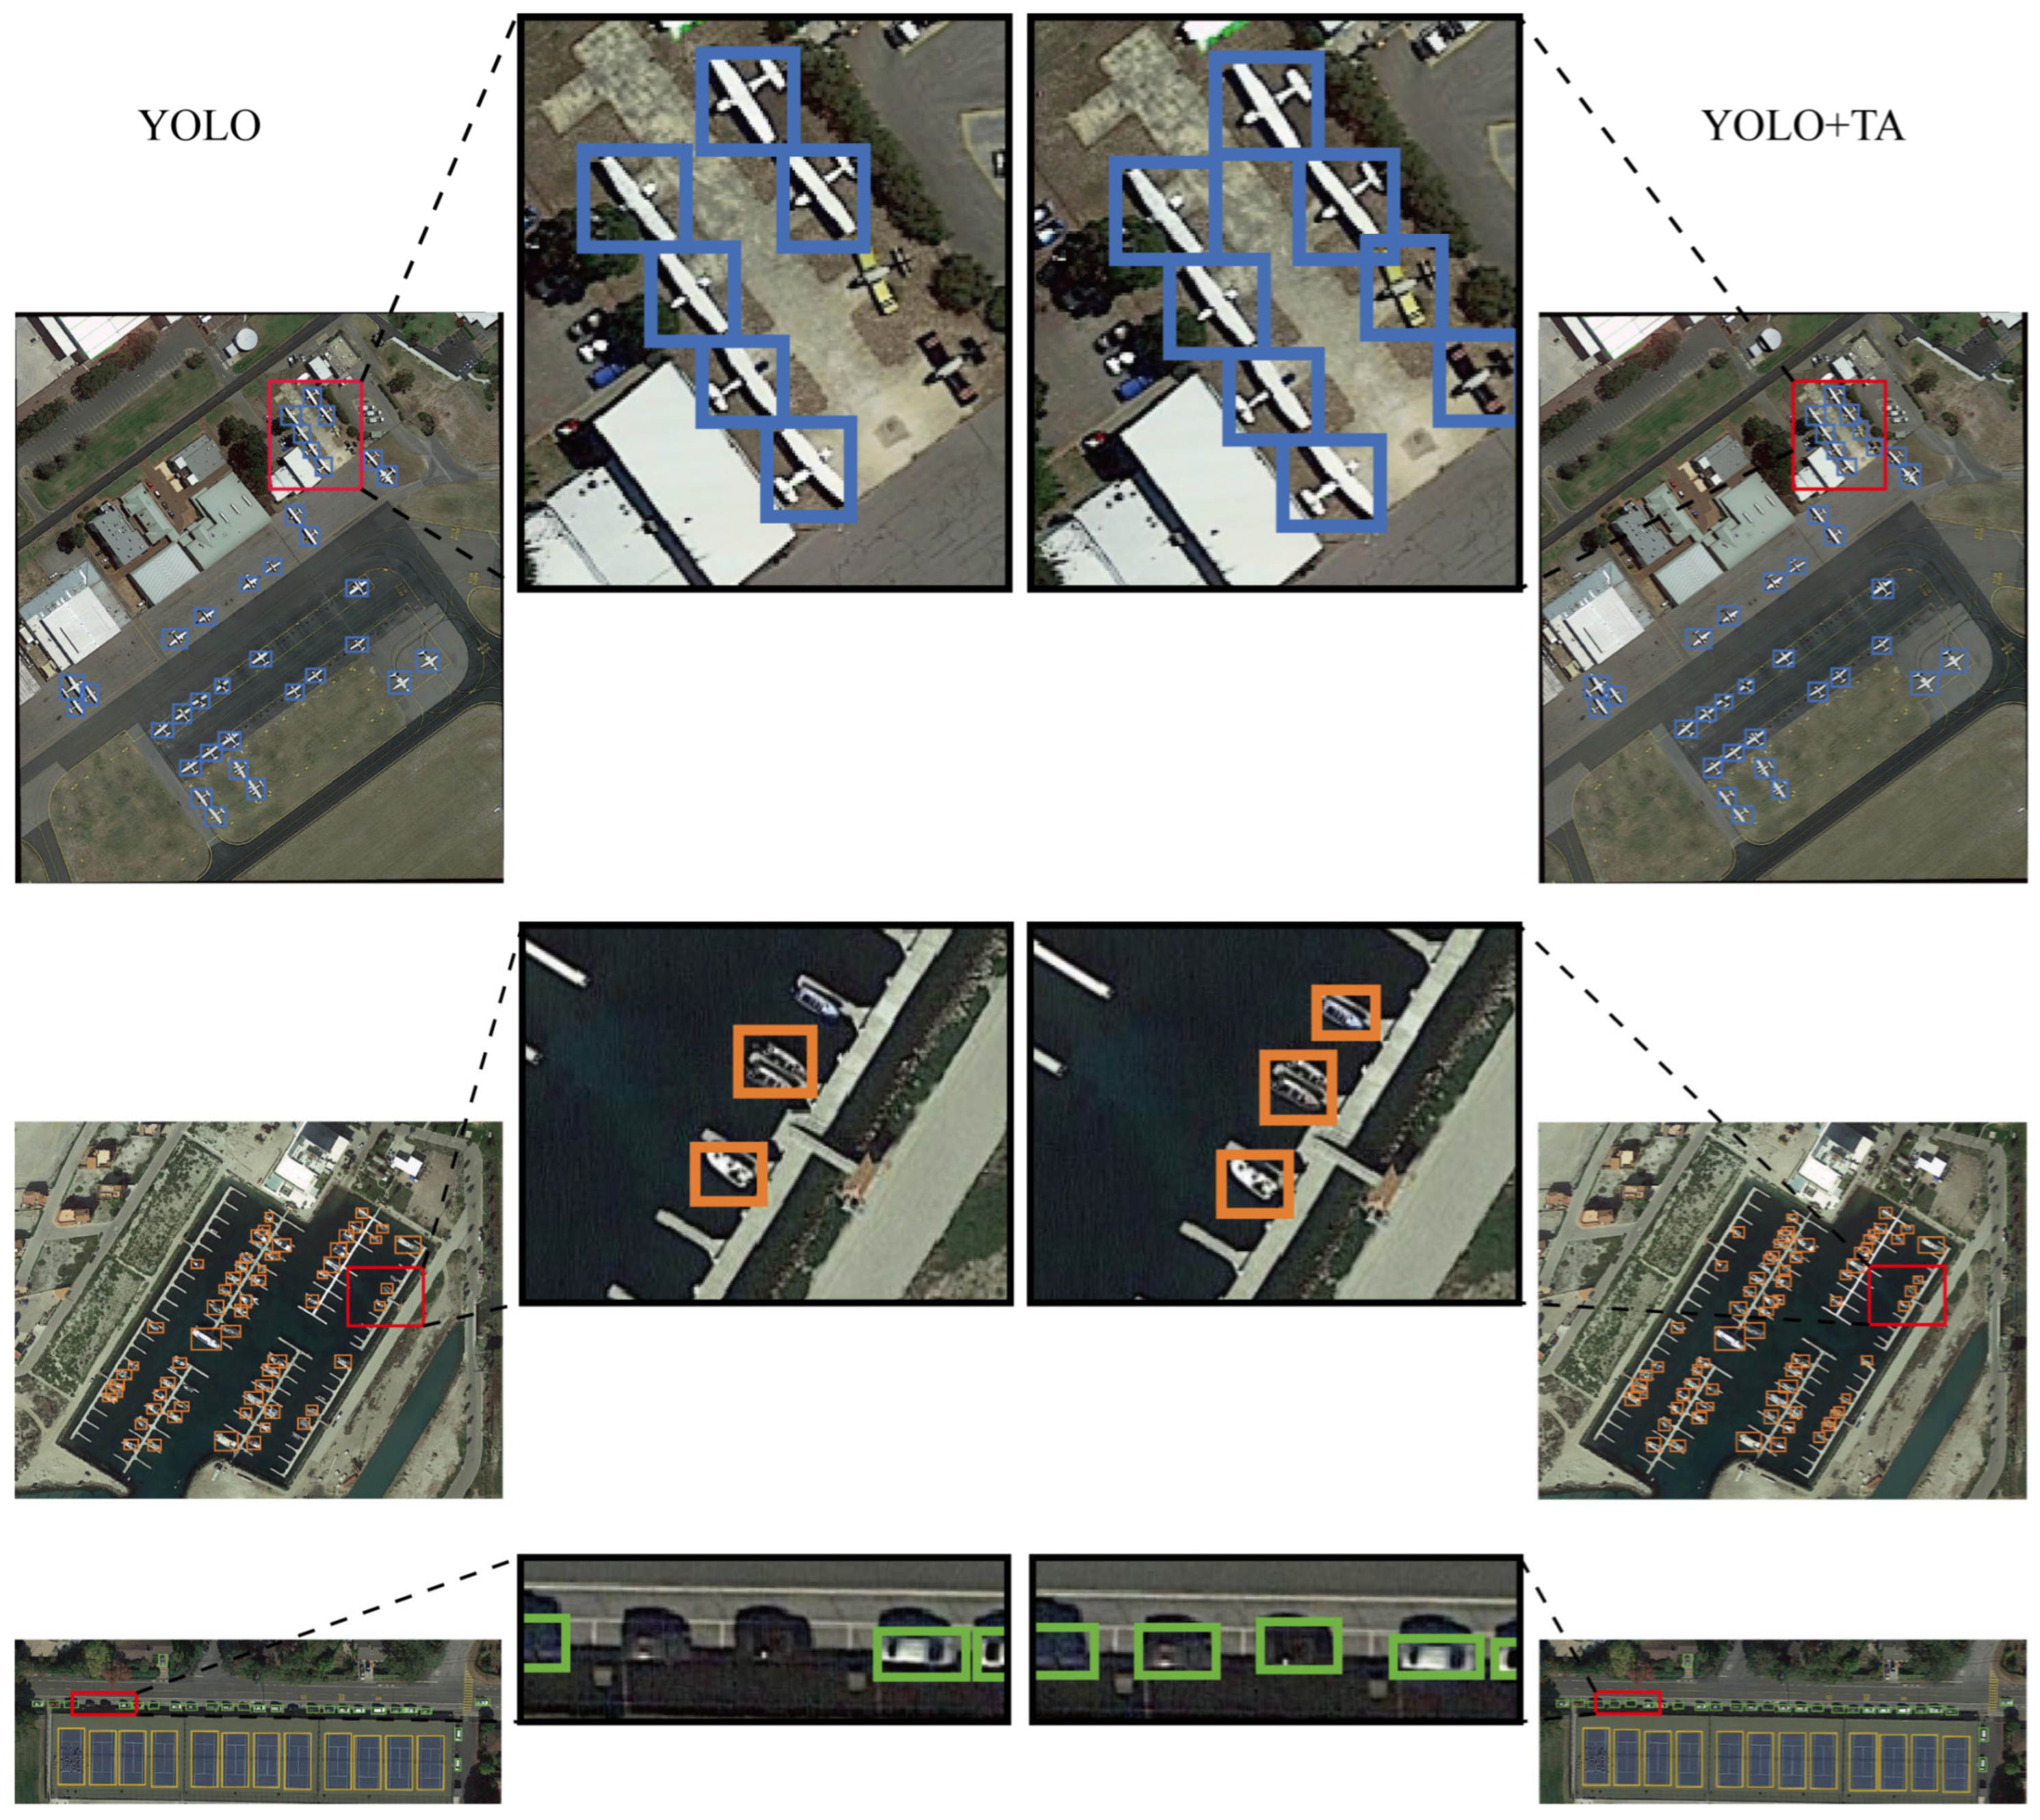
In Figure 21, the visualization results after incorporating the Triplicate Attention module alone into the model on the DOTA dataset are presented. In the figure, the far left and far right represent the original model and the model with the attention module added, respectively. In the three identical scenes, the middle section displays the locally enlarged images, with the enlarged area being the region within the red boxes in the left and right scenes.
In this dataset, three distinct types of objects were selected: planes, ships, and cars. From these three scenarios, it can be observed that the addition of the Triplicate Attention module results in the detection of more targets, exhibiting superior detection performance. Specifically, for planes that are smaller in size and have beneficial colors, ships with features similar to the background, and cars whose colors blend into shadows, the inclusion of the Triplicate Attention module leads to the identification of a greater number of targets.
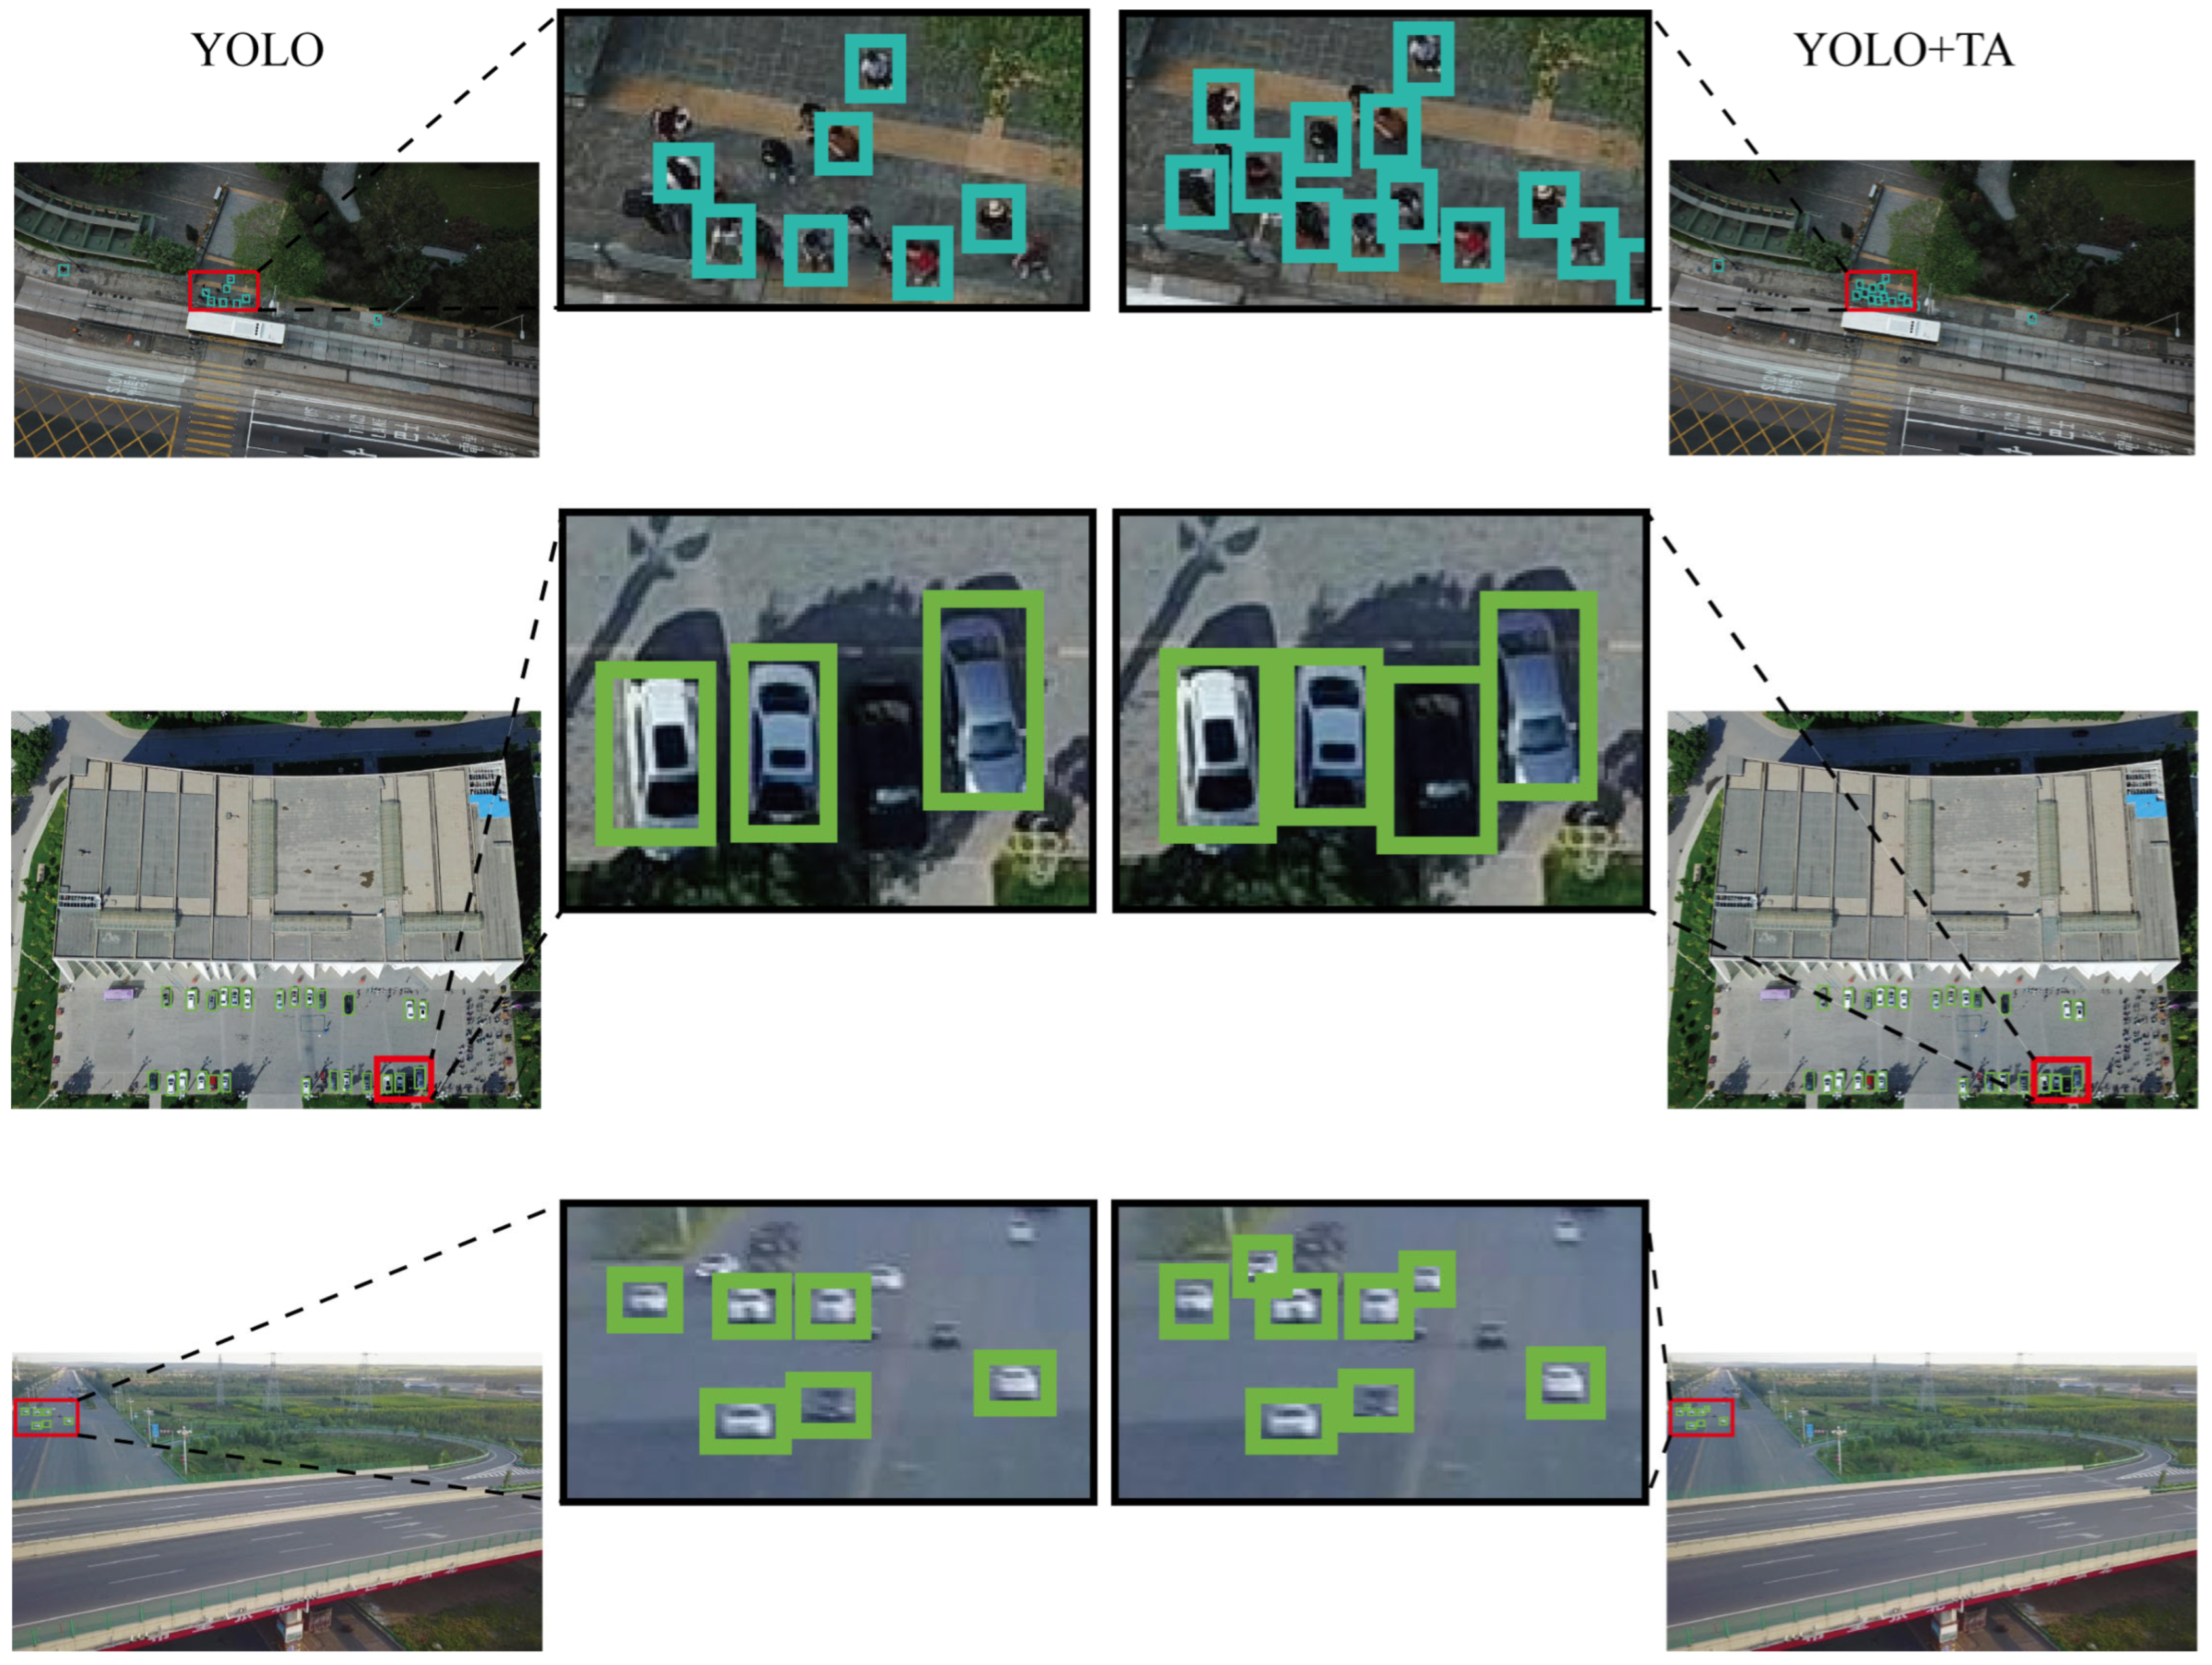
The results on the VisDrone2019 dataset, as shown in Figure 22, are similarly promising. The VisDrone2019 dataset features more complex scenarios that closely resemble real-life situations, but it poses higher demands on object detection tasks. As illustrated, the selected scenes include an overhead view of a stationary crowd, an overhead view of a parking lot with stationary vehicles, and a dynamic vehicle scene on a highway at a non-vertical angle. Their characteristics include small sizes, feature occlusion, presence of trees or other covering objects that obscure features, and scale variations due to different distances. Even from the enlarged images, it is evident that in such complex scenarios, the inclusion of the Triplicate Attention module still results in better performance.
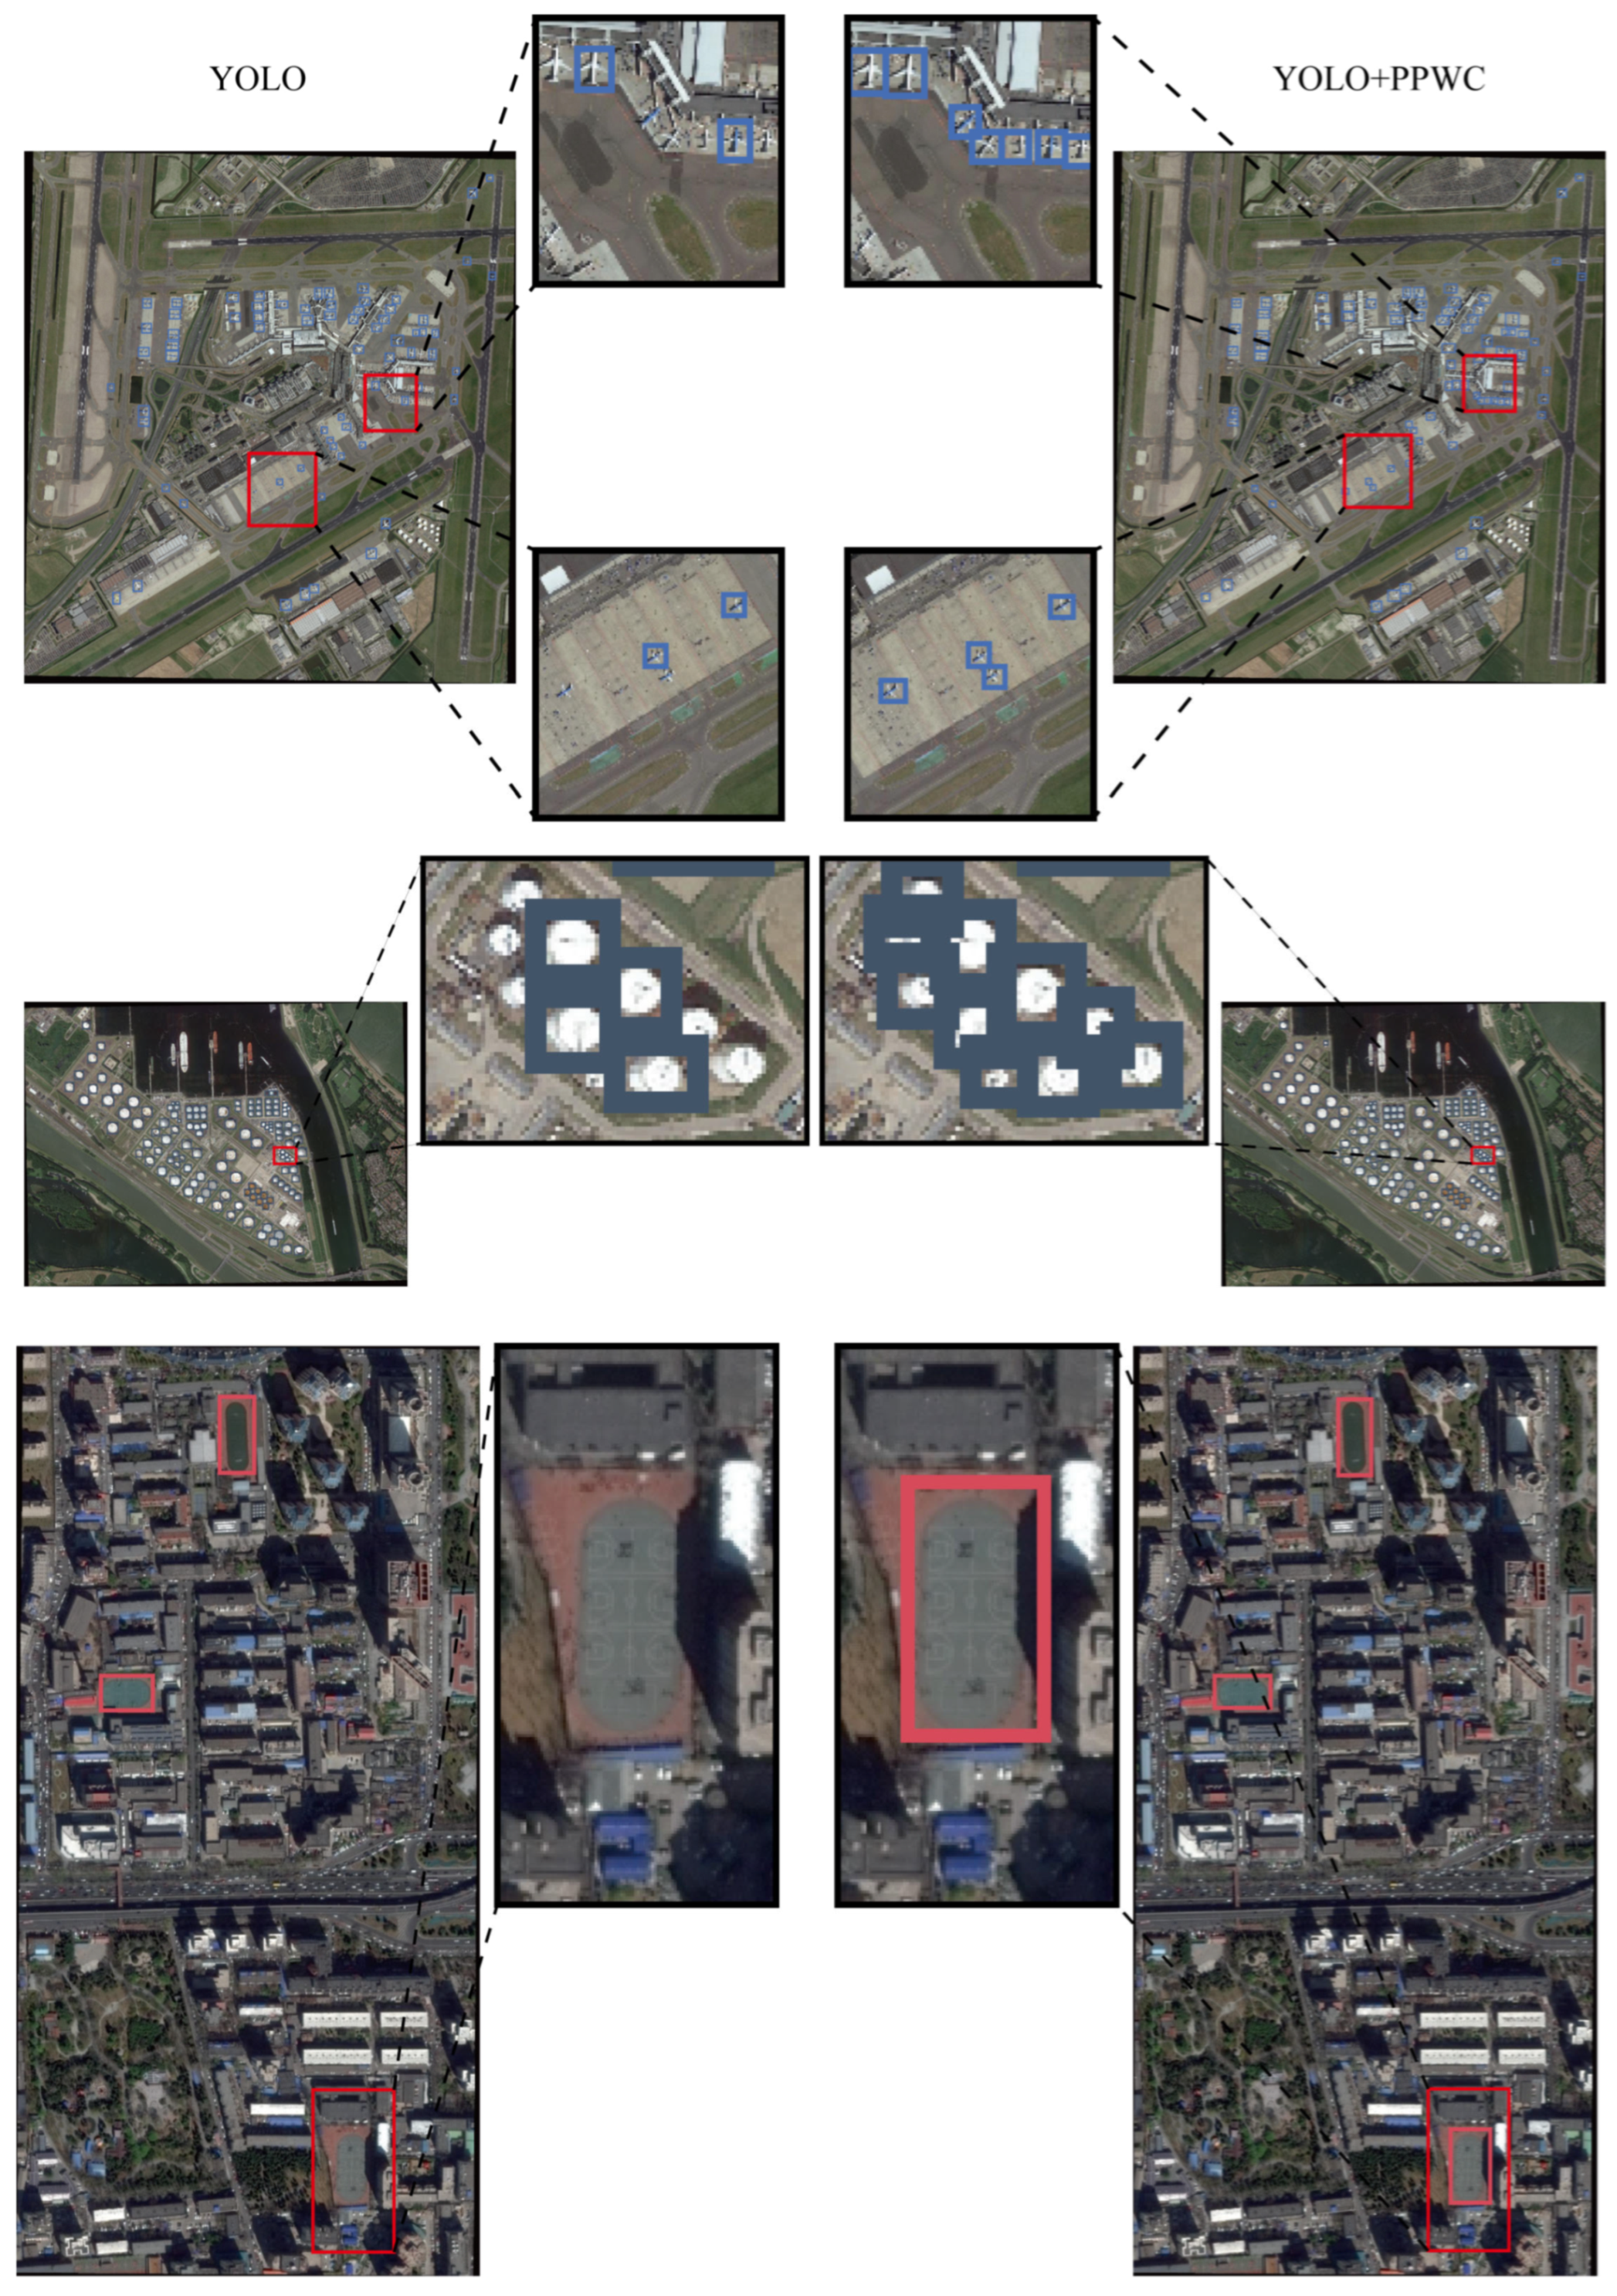
Following this approach, the Triplicate Attention module was replaced with a cross-scale feature fusion network composed of PPWC convolutional blocks, and experiments were conducted on both datasets. Figure 23 shows the results on the DOTA dataset, where the selected targets include planes at the airport, storage tanks near the harbor, and playgrounds in residential areas, representing tiny targets, densely packed small targets, and targets that blend with the background, respectively. From this figure, it can be observed that employing the cross-scale feature fusion method effectively integrates semantic information and detailed information, which enhances the model’s detection capabilities. This is visually represented by the ability to detect more targets and those that were undetected by the original model, such as the increased detection of planes, storage tanks, and playgrounds that were not detected by the original model in Figure 23.
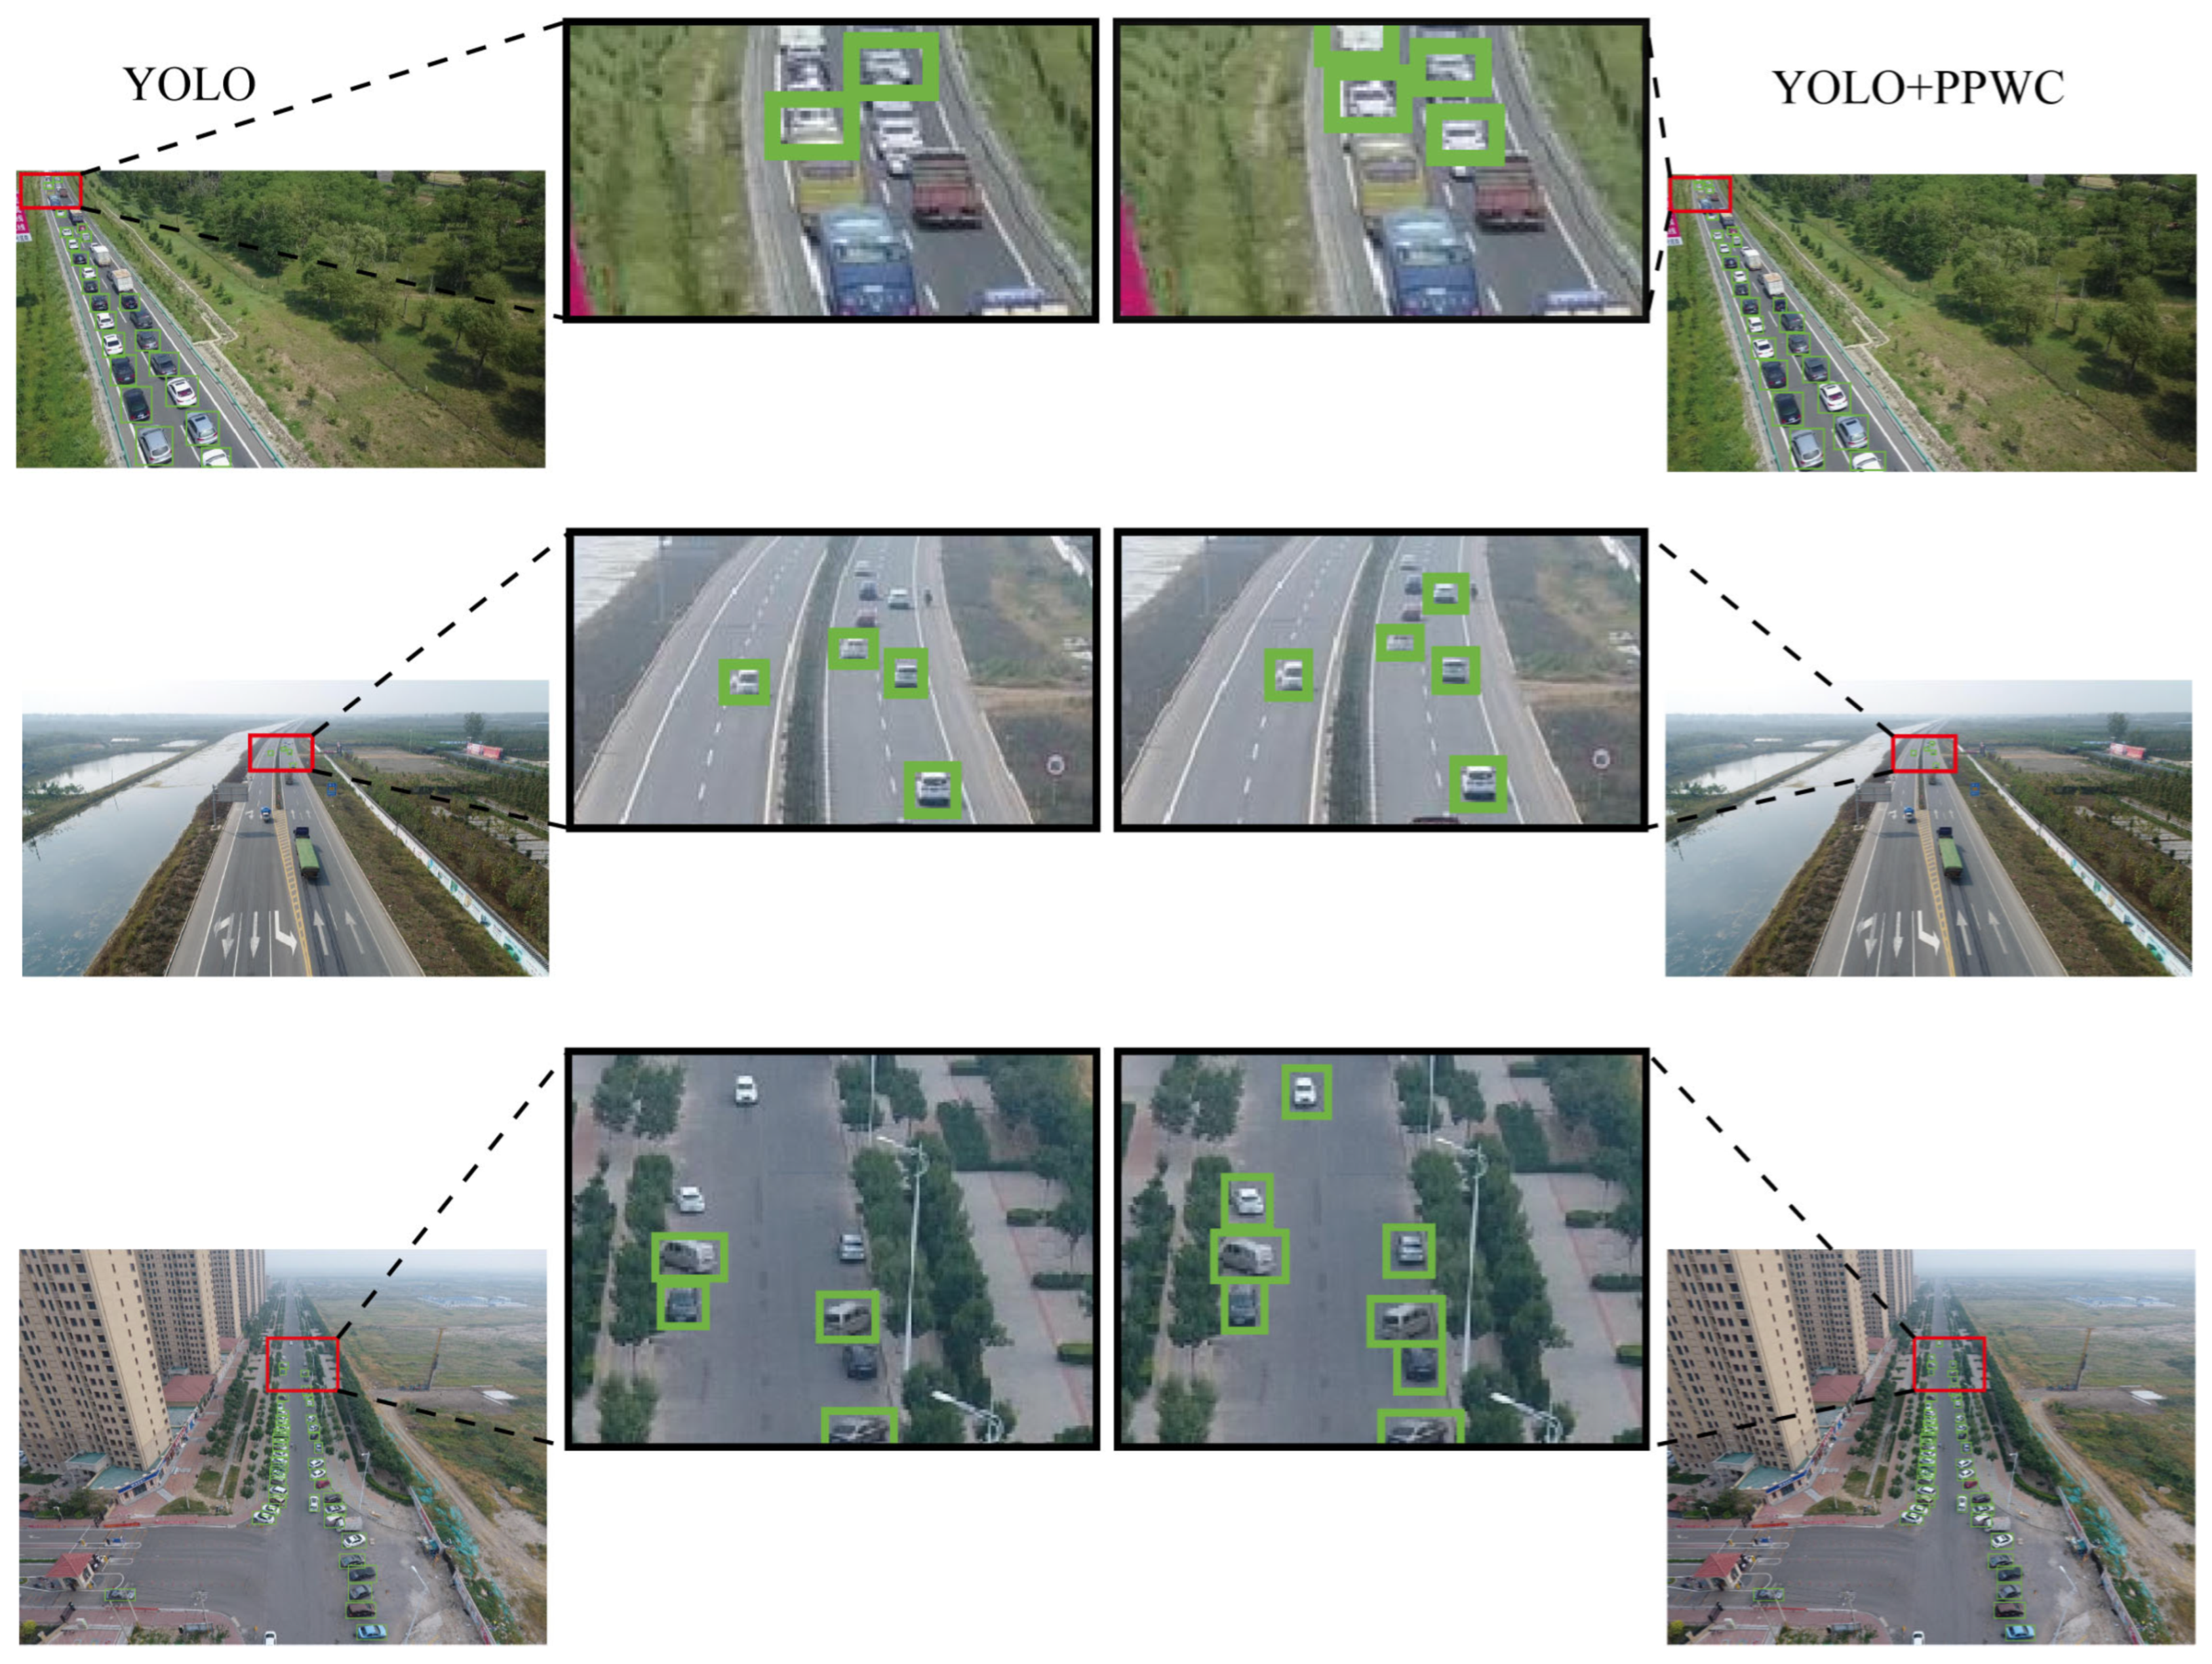
The detection results of the cross-scale feature fusion network composed of PPWC convolutional blocks on the VisDrone2019 dataset are shown in Figure 24. The selected scene targets include dense traffic flows on highways, sparse traffic flows, and dynamic vehicles coexisting with static vehicles along the streets. All three images utilize a forward extension shooting method, leading to significant scale variations of the same category of targets within the same image, which is evident in these three figures. At the extended distance, vehicle sizes diminish, and features become blurred, a situation that is commonly encountered in practice and represents one of the current challenges in object detection. The middle two enlarged comparison images clearly show that the model on the right can detect more targets, further validating the effectiveness of this improvement strategy.

5. Conclusions

Remote sensing technology has permeated every aspect of our production and daily life, yet the detection of remote sensing images has always faced challenges such as low detection accuracy or even undetectable situations, especially for small objects, multi-scale targets, and occluded targets. Additionally, factors like the weather, angle, and altitude further exponentially increase the difficulty of detection. This paper addresses the issue of low detection accuracy for small targets in images with large scale variations, based on the YOLOv8 model with the following improvements. Firstly, the DIBLayer replaces the C2f module, combining the parameter-free expansion of dilated convolution to increase the receptive field with the inverted bottleneck structure to reduce information loss and improve memory efficiency, thus enhancing features and reducing parameters. The TA attention module added after each DIBLayer effectively utilizes this outcome, analyzing and enhancing the weight parameters within features to allocate more attention to small targets, and this module only slightly increases the number of parameters. Secondly, a cross-layer feature fusion technique composed of partial convolution and pointwise convolution blocks is used in the neck fusion network part, integrating information from different hierarchical feature maps extracted from the backbone network to improve detection levels, with a very limited increase in model parameters. Then, Focal-EIOU replaces CIOU, where the Focal strategy balances high-quality low-quantity anchor boxes and low-quality high-quantity anchor boxes, converging faster. Finally, experimental results based on the VisDrone2019 and DOTA datasets show that compared to the original model, mAP values increased by 3.5% and 2.9%, respectively, and mAPS increased by 3.8% and 4.6%, respectively. The number of parameters and floating-point operations decreased by 34.9% and 26.2%, demonstrating good detection performance. Our lightweight model is highly practical, especially for UAVs and real-time aerial monitoring systems with limited computing resources. It reduces complexity and improves real-time performance, key aspects of its application value.
Despite the improved model’s good performance and enhancement effects, there is still a situation where detection accuracy decreases when facing complex small targets, which can be seen in the detection results on the VisDrone2019 dataset. Due to the complexity of the dataset, both the original and improved models experience a slight decrease in accuracy. The DOTA dataset contains images of larger sizes, which can slow down the model’s inference speed. Adjusting the image size can decrease detection accuracy. Selecting a suitable model for the application scenario and balancing the relationship between accuracy and speed is part of our future work. In the next steps, we will continue to delve deeper and further study methods to enhance the model’s robustness, hoping to maintain excellent performance in future aerial image detection.

Author Contributions

Methodology, S.L. and F.S.; Software, H.Z.; Validation, J.D.; Resources, S.L. and W.C.; Data curation, F.S.; Writing—original draft, S.L.; Writing—review & editing, S.L.; Visualization, S.L.; Supervision, F.S.; Project administration, F.S.; Funding acquisition, F.S. All authors have read and agreed to the published version of the manuscript.

Funding

This research was funded by the National Natural Science Foundation of China (grant number: 61671470).

Data Availability Statement

The original contributions presented in this study are included in the article. Further inquiries can be directed to the corresponding author.

Conflicts of Interest

The authors declare no conflicts of interest.

References

  1. Chi, M.; Plaza, A.; Benediktsson, J.A.; Sun, Z.; Shen, J.; Zhu, Y. Big Data for Remote Sensing: Challenges and Opportunities. Proc. IEEE 2016, 104, 2207–2219. [Google Scholar] [CrossRef]
  2. Ruhe, M.; Dalaff, C.; Kuhne, R.; Woesler, R. Air- and Space Borne Remote Sensing Systems for Traffic Data Collection-European Contributions. In Proceedings of the 2003 IEEE International Conference on Intelligent Transportation Systems, Shanghai, China, 12–15 October 2003; pp. 750–752. [Google Scholar]
  3. Guo, Y.; Wu, C.; Du, B.; Zhang, L. Density Map-Based Vehicle Counting in Remote Sensing Images with Limited Resolution. ISPRS J. Photogramm. Remote Sens. 2022, 189, 201–217. [Google Scholar] [CrossRef]
  4. Li, J.; Zhang, Z.; Sun, H. DiffuYOLO: A Novel Method for Small Vehicle Detection in Remote Sensing Based on Diffusion Models. Alex. Eng. J. 2025, 114, 485–496. [Google Scholar] [CrossRef]
  5. Domínguez-Sáez, A.; Urgorri, F.R.; Fernández-Berceruelo, I.; Pujadas, M. Large Eddy Simulation of the Dispersion of Short Duration Emissions: Implications for the Metrological Evaluation of Remote Sensing Devices for on-Road Emissions Monitoring. Sci. Total Environ. 2024, 955, 176994. [Google Scholar] [CrossRef]
  6. Chen, H.; Li, Z.; Wu, J.; Xiong, W.; Du, C. SemiRoadExNet: A Semi-Supervised Network for Road Extraction from Remote Sensing Imagery via Adversarial Learning. ISPRS J. Photogramm. Remote Sens. 2023, 198, 169–183. [Google Scholar] [CrossRef]
  7. Zhou, G.; Wei, D. Survey and Analysis of Land Satellite Remote Sensing Applied in Highway Transportations Infrastructure and System Engineering. In Proceedings of the IGARSS 2008—2008 IEEE International Geoscience and Remote Sensing Symposium, Boston, MA, USA, 6–11 July 2008; pp. IV-479–IV-482. [Google Scholar]
  8. Lei, P.; Yi, J.; Li, S.; Li, Y.; Lin, H. Agricultural Surface Water Extraction in Environmental Remote Sensing: A Novel Semantic Segmentation Model Emphasizing Contextual Information Enhancement and Foreground Detail Attention. Neurocomputing 2025, 617, 129110. [Google Scholar] [CrossRef]
  9. Yuan, Q.; Shen, H.; Li, T.; Li, Z.; Li, S.; Jiang, Y.; Xu, H.; Tan, W.; Yang, Q.; Wang, J.; et al. Deep Learning in Environmental Remote Sensing: Achievements and Challenges. Remote Sens. Environ. 2020, 241, 111716. [Google Scholar] [CrossRef]
  10. Loozen, Y.; Rebel, K.T.; De Jong, S.M.; Lu, M.; Ollinger, S.V.; Wassen, M.J.; Karssenberg, D. Mapping Canopy Nitrogen in European Forests Using Remote Sensing and Environmental Variables with the Random Forests Method. Remote Sens. Environ. 2020, 247, 111933. [Google Scholar] [CrossRef]
  11. Ma, Y.; Chen, S.; Ermon, S.; Lobell, D.B. Transfer Learning in Environmental Remote Sensing. Remote Sens. Environ. 2024, 301, 113924. [Google Scholar] [CrossRef]
  12. Li, L.; Fu, M.; Zhu, Y.; Kang, H.; Wen, H. The Current Situation and Trend of Land Ecological Security Evaluation from the Perspective of Global Change. Ecol. Indic. 2024, 167, 112608. [Google Scholar] [CrossRef]
  13. Zhu, Z.; Qiu, S.; Ye, S. Remote Sensing of Land Change: A Multifaceted Perspective. Remote Sens. Environ. 2022, 282, 113266. [Google Scholar] [CrossRef]
  14. Dong, J.; Wang, Y.; Yang, Y.; Yang, M.; Chen, J. MCDNet: Multilevel Cloud Detection Network for Remote Sensing Images Based on Dual-Perspective Change-Guided and Multi-Scale Feature Fusion. Int. J. Appl. Earth Obs. Geoinf. 2024, 129, 103820. [Google Scholar] [CrossRef]
  15. Xiao, Y.; Zhan, Q. A Review of Remote Sensing Applications in Urban Planning and Management in China. In Proceedings of the 2009 Joint Urban Remote Sensing Event, Shanghai, China, 20–22 May 2009; pp. 1–5. [Google Scholar]
  16. Guo, J.; Ren, H.; Zheng, Y.; Nie, J.; Chen, S.; Sun, Y.; Qin, Q. Identify Urban Area From Remote Sensing Image Using Deep Learning Method. In Proceedings of the IGARSS 2019—2019 IEEE International Geoscience and Remote Sensing Symposium, Yokohama, Japan, 28 July 28–2 August 2019; pp. 7407–7410. [Google Scholar]
  17. Chen, X.; Li, Z.; Zhang, M. Potential and Status of High-Resolution Remote Sensing Information Applied in Urban Planning in China. In Proceedings of the 2009 Joint Urban Remote Sensing Event, Shanghai, China, 20–22 May 2009; pp. 1–5. [Google Scholar]
  18. Chen, G.; Zhou, Y.; Voogt, J.A.; Stokes, E.C. Remote Sensing of Diverse Urban Environments: From the Single City to Multiple Cities. Remote Sens. Environ. 2024, 305, 114108. [Google Scholar] [CrossRef]
  19. Laura, D.; Urrutia, E.P.; Salazar, F.; Ureña, J.; Avalos, D.H.; Célleri, L.A.; Cazorla-Logroño, M.; Altamirano, S. Aerial Remote Sensing System to Control Pathogens and Diseases in Broccoli Crops with the Use of Artificial Vision. Smart Agric. Technol. 2024, 10, 100739. [Google Scholar] [CrossRef]
  20. Ahmed, Z.; Ambinakudige, S. How Does Shrimp Farming Impact Agricultural Production and Food Security in Coastal Bangladesh? Evidence from Farmer Perception and Remote Sensing Approach. Ocean. Coast. Manag. 2024, 255, 107241. [Google Scholar] [CrossRef]
  21. Zhou, Y.; Ma, Y.; Ata-Ul-Karim, S.T.; Wang, S.; Ciampitti, I.; Antoniuk, V.; Wu, C.; Andersen, M.N.; Cammarano, D. Integrating Multi-Angle and Multi-Scale Remote Sensing for Precision Nitrogen Management in Agriculture: A Review. Comput. Electron. Agric. 2025, 230, 109829. [Google Scholar] [CrossRef]
  22. Jung, J.; Maeda, M.; Chang, A.; Bhandari, M.; Ashapure, A.; Landivar-Bowles, J. The Potential of Remote Sensing and Artificial Intelligence as Tools to Improve the Resilience of Agriculture Production Systems. Curr. Opin. Biotechnol. 2021, 70, 15–22. [Google Scholar] [CrossRef]
  23. Wang, J.; Zhang, S.; Lizaga, I.; Zhang, Y.; Ge, X.; Zhang, Z.; Zhang, W.; Huang, Q.; Hu, Z. UAS-Based Remote Sensing for Agricultural Monitoring: Current Status and Perspectives. Comput. Electron. Agric. 2024, 227, 109501. [Google Scholar] [CrossRef]
  24. Xu, B.; Gao, B.; Li, Y. Improved Small Object Detection Algorithm Based on YOLOv5. IEEE Intell. Syst. 2024, 39, 57–65. [Google Scholar] [CrossRef]
  25. Liu, W.; Kang, X.; Duan, P.; Xie, Z.; Wei, X.; Li, S. SOSNet: Real-Time Small Object Segmentation via Hierarchical Decoding and Example Mining. IEEE Trans. Neural Netw. Learn. Syst. 2023, 36, 3071–3083. [Google Scholar] [CrossRef]
  26. Liu, K.; Fu, Z.; Jin, S.; Chen, Z.; Zhou, F.; Jiang, R.; Chen, Y.; Ye, J. ESOD: Efficient Small Object Detection on High-Resolution Images. IEEE Trans. Image Process. 2025, 34, 183–195. [Google Scholar] [CrossRef] [PubMed]
  27. Chen, L.; Zhao, Y.; Kong, S.G. SFA-Guided Mosaic Transformer for Tracking Small Objects in Snapshot Spectral Imaging. ISPRS J. Photogramm. Remote Sens. 2023, 204, 223–236. [Google Scholar] [CrossRef]
  28. Hosang, J.; Benenson, R.; Dollar, P.; Schiele, B. What Makes for Effective Detection Proposals? IEEE Trans. Pattern Anal. Mach. Intell. 2016, 38, 814–830. [Google Scholar] [CrossRef] [PubMed]
  29. Chen, Y.; Wang, H.; Li, W.; Sakaridis, C.; Dai, D.; Van Gool, L. Scale-Aware Domain Adaptive Faster R-CNN. Int. J. Comput. Vis. 2021, 129, 2223–2243. [Google Scholar] [CrossRef]
  30. Hussain, M. YOLOv1 to v8: Unveiling Each Variant–A Comprehensive Review of YOLO. IEEE Access 2024, 12, 42816–42833. [Google Scholar] [CrossRef]
  31. Zhang, H.; Tian, Y.; Wang, K.; Zhang, W.; Wang, F.-Y. Mask SSD: An Effective Single-Stage Approach to Object Instance Segmentation. IEEE Trans. Image Process. 2020, 29, 2078–2093. [Google Scholar] [CrossRef]
  32. Rejin Varghese, S.M. YOLOv8: A Novel Object Detection Algorithm with Enhanced Performance and Robustness. In Proceedings of the 2024 International Conference on Advances in Data Engineering and Intelligent Computing Systems (ADICS), Chennai, India, 18–19 April 2024; pp. 1–6. [Google Scholar]
  33. Everingham, M.; Van Gool, L.; Williams, C.K.I.; Winn, J.; Zisserman, A. The Pascal Visual Object Classes (VOC) Challenge. Int. J. Comput. Vis. 2010, 88, 303–338. [Google Scholar] [CrossRef]
  34. Russakovsky, O.; Deng, J.; Su, H.; Krause, J.; Satheesh, S.; Ma, S.; Huang, Z.; Karpathy, A.; Khosla, A.; Bernstein, M.; et al. ImageNet Large Scale Visual Recognition Challenge. Int. J. Comput. Vis. 2015, 115, 211–252. [Google Scholar] [CrossRef]
  35. Pinggera, P.; Ramos, S.; Gehrig, S.; Franke, U.; Rother, C.; Mester, R. Lost and Found: Detecting Small Road Hazards for Self-Driving Vehicles. arXiv 2016, arXiv:1609.04653. [Google Scholar] [CrossRef]
  36. Wang, J.; Xu, C.; Yang, W.; Yu, L. A Normalized Gaussian Wasserstein Distance for Tiny Object Detection. arXiv 2021, arXiv:2110.13389. [Google Scholar] [CrossRef]
  37. Wang, J.; Li, X.; Chen, J.; Zhou, L.; Guo, L.; He, Z.; Zhou, H.; Zhang, Z. DPH-YOLOv8: Improved YOLOv8 Based on Double Prediction Heads for the UAV Image Object Detection. IEEE Trans. Geosci. Remote Sens. 2024, 62, 3487191. [Google Scholar] [CrossRef]
  38. Chen, J.; Er, M.J. Dynamic YOLO for Small Underwater Object Detection. Artif. Intell. Rev. 2024, 57, 165. [Google Scholar] [CrossRef]
  39. Wang, J.; Li, X.; Zhou, L.; Chen, J.; He, Z.; Guo, L.; Liu, J. Adaptive Receptive Field Enhancement Network Based on Attention Mechanism for Detecting the Small Target in the Aerial Image. IEEE Trans. Geosci. Remote Sens. 2024, 62, 3337266. [Google Scholar] [CrossRef]
  40. Xiong, X.; He, M.; Li, T.; Zheng, G.; Xu, W.; Fan, X.; Zhang, Y. Adaptive Feature Fusion and Improved Attention Mechanism-Based Small Object Detection for UAV Target Tracking. IEEE Internet Things J. 2024, 11, 21239–21249. [Google Scholar] [CrossRef]
  41. Le Jeune, P.; Bahaduri, B.; Mokraoui, A. A Comparative Attention Framework for Better Few-Shot Object Detection on Aerial Images. Pattern Recognit. 2025, 161, 111243. [Google Scholar] [CrossRef]
  42. Dalal, N.; Triggs, B. Histograms of Oriented Gradients for Human Detection. In Proceedings of the 2005 IEEE Computer Society Conference on Computer Vision and Pattern Recognition (CVPR’05), San Diego, CA, USA, 20–25 June 2005; Volume 1, pp. 886–893. [Google Scholar]
  43. Lowe, D.G. Object Recognition from Local Scale-Invariant Features. In Proceedings of the Seventh IEEE International Conference on Computer Vision, Kerkyra, Greece, 20–27 September 1999; Volume 2, pp. 1150–1157. [Google Scholar]
  44. Cortes, C.; Vapnik, V. Support-Vector Networks. Mach. Learn. 1995, 20, 273–297. [Google Scholar] [CrossRef]
  45. Girshick, R.; Donahue, J.; Darrell, T.; Malik, J. Rich Feature Hierarchies for Accurate Object Detection and Semantic Segmentation. In Proceedings of the IEEE Conference on Computer Vision and Pattern Recognition, Columbus, OH, USA, 23–28 June 2014; pp. 580–587. [Google Scholar] [CrossRef]
  46. He, K.; Zhang, X.; Ren, S.; Sun, J. Spatial Pyramid Pooling in Deep Convolutional Networks for Visual Recognition. IEEE Trans. Pattern Anal. Mach. Intell. 2015, 37, 1904–1916. [Google Scholar] [CrossRef]
  47. Wang, J.; Meng, R.; Huang, Y.; Zhou, L.; Huo, L.; Qiao, Z.; Niu, C. Road Defect Detection Based on Improved YOLOv8s Model. Sci. Rep. 2024, 14, 16758. [Google Scholar] [CrossRef]
  48. Yan, C.; Liang, Z.; Yin, L.; Wei, S.; Tian, Q.; Li, Y.; Cheng, H.; Liu, J.; Yu, Q.; Zhao, G.; et al. AFM-YOLOv8s: An Accurate, Fast, and Highly Robust Model for Detection of Sporangia of Plasmopara Viticola with Various Morphological Variants. Plant Phenomics 2024, 6, 0246. [Google Scholar] [CrossRef]
  49. Wang, L.; Hua, S.; Zhang, C.; Yang, G.; Ren, J.; Li, J. YOLOdrive: A Lightweight Autonomous Driving Single-Stage Target Detection Approach. IEEE Internet Things J. 2024, 11, 36099–36113. [Google Scholar] [CrossRef]
  50. Yu, F.; Koltun, V. Multi-Scale Context Aggregation by Dilated Convolutions. arXiv 2015, arXiv:1511.07122. [Google Scholar] [CrossRef]
  51. Sandler, M.; Howard, A.; Zhu, M.; Zhmoginov, A.; Chen, L.-C. MobileNetV2: Inverted Residuals and Linear Bottlenecks. In Proceedings of the 2018 IEEE/CVF Conference on Computer Vision and Pattern Recognition, Salt Lake City, UT, USA, 18–23 June 2018; pp. 4510–4520. [Google Scholar]
  52. Misra, D.; Nalamada, T.; Arasanipalai, A.U.; Hou, Q. Rotate to Attend: Convolutional Triplet Attention Module. In Proceedings of the 2021 IEEE Winter Conference on Applications of Computer Vision (WACV), Waikoloa, HI, USA, 3–8 January 2021; pp. 3138–3147. [Google Scholar]
  53. Vaswani, A.; Shazeer, N.; Parmar, N.; Uszkoreit, J.; Jones, L.; Gomez, A.N.; Kaiser, Ł.; Polosukhin, I. Attention Is All You Need. In Proceedings of the 31st International Conference on Neural Information Processing Systems, Long Beach, CA, USA, 4–9 December 2017; Curran Associates Inc.: Red Hook, NY, USA, 2017; pp. 6000–6010. [Google Scholar]
  54. Hou, Q.; Zhou, D.; Feng, J. Coordinate Attention for Efficient Mobile Network Design. In Proceedings of the 2021 IEEE/CVF Conference on Computer Vision and Pattern Recognition (CVPR), Nashville, TN, USA, 20–25 June 2021; pp. 13708–13717. [Google Scholar]
  55. Shen, Z.; Zhang, M.; Zhao, H.; Yi, S.; Li, H. Efficient Attention: Attention with Linear Complexities. In Proceedings of the 2021 IEEE Winter Conference on Applications of Computer Vision (WACV), Waikoloa, HI, USA, 3–8 January 2021; pp. 3530–3538. [Google Scholar]
  56. Zhu, X.; Cheng, D.; Zhang, Z.; Lin, S.; Dai, J. An Empirical Study of Spatial Attention Mechanisms in Deep Networks. In Proceedings of the 2019 IEEE/CVF International Conference on Computer Vision (ICCV), Seoul, Republic of Korea, 27 October–2 November 2019; pp. 6687–6696. [Google Scholar]
  57. Hu, J.; Shen, L.; Sun, G. Squeeze-and-Excitation Networks. In Proceedings of the 2018 IEEE/CVF Conference on Computer Vision and Pattern Recognition, Salt Lake City, UT, USA, 18–23 June 2018; pp. 7132–7141. [Google Scholar]
  58. An, Y.; Song, C. Multiscale Dynamic Attention and Hierarchical Spatial Aggregation for Few-Shot Object Detection. Appl. Sci. 2025, 15, 1381. [Google Scholar] [CrossRef]
  59. Xia, Z.; Pan, X.; Song, S.; Li, L.E.; Huang, G. Vision Transformer with Deformable Attention. arXiv 2022, arXiv:2201.00520. [Google Scholar] [CrossRef]
  60. Woo, S.; Park, J.; Lee, J.-Y.; Kweon, I.S. CBAM: Convolutional Block Attention Module. In Computer Vision–ECCV 2018; Ferrari, V., Hebert, M., Sminchisescu, C., Weiss, Y., Eds.; Lecture Notes in Computer Science; Springer International Publishing: Cham, Switzerland, 2018; Volume 11211, pp. 3–19. ISBN 978-3-030-01233-5. [Google Scholar]
  61. Liu, G.; Dundar, A.; Shih, K.J.; Wang, T.-C.; Reda, F.A.; Sapra, K.; Yu, Z.; Yang, X.; Tao, A.; Catanzaro, B. Partial Convolution for Padding, Inpainting, and Image Synthesis. IEEE Trans. Pattern Anal. Mach. Intell. 2022, 45, 1–15. [Google Scholar] [CrossRef]
  62. Liang, F.; Tian, Z.; Dong, M.; Cheng, S.; Sun, L.; Li, H.; Chen, Y.; Zhang, G. Efficient Neural Network Using Pointwise Convolution Kernels with Linear Phase Constraint. Neurocomputing 2021, 423, 572–579. [Google Scholar] [CrossRef]
  63. Liang, D.; Zhang, S.; Huang, H.-B.; Zhang, L.; Hu, Y. Deep Learning-Based Detection and Condition Classification of Bridge Elastomeric Bearings. Autom. Constr. 2024, 166, 105680. [Google Scholar] [CrossRef]
  64. Xia, G.-S.; Bai, X.; Ding, J.; Zhu, Z.; Belongie, S.; Luo, J.; Datcu, M.; Pelillo, M.; Zhang, L. DOTA: A Large-Scale Dataset for Object Detection in Aerial Images. In Proceedings of the 2018 IEEE/CVF Conference on Computer Vision and Pattern Recognition, Salt Lake City, UT, USA, 18–23 June 2018; pp. 3974–3983. [Google Scholar]
  65. Du, D.; Zhu, P.; Wen, L.; Bian, X.; Lin, H.; Hu, Q.; Peng, T.; Zheng, J.; Wang, X.; Zhang, Y.; et al. VisDrone-DET2019: The Vision Meets Drone Object Detection in Image Challenge Results. In Proceedings of the 2019 IEEE/CVF International Conference on Computer Vision Workshop (ICCVW), Seoul, Republic of Korea, 27–28 October 2019; pp. 213–226. [Google Scholar]
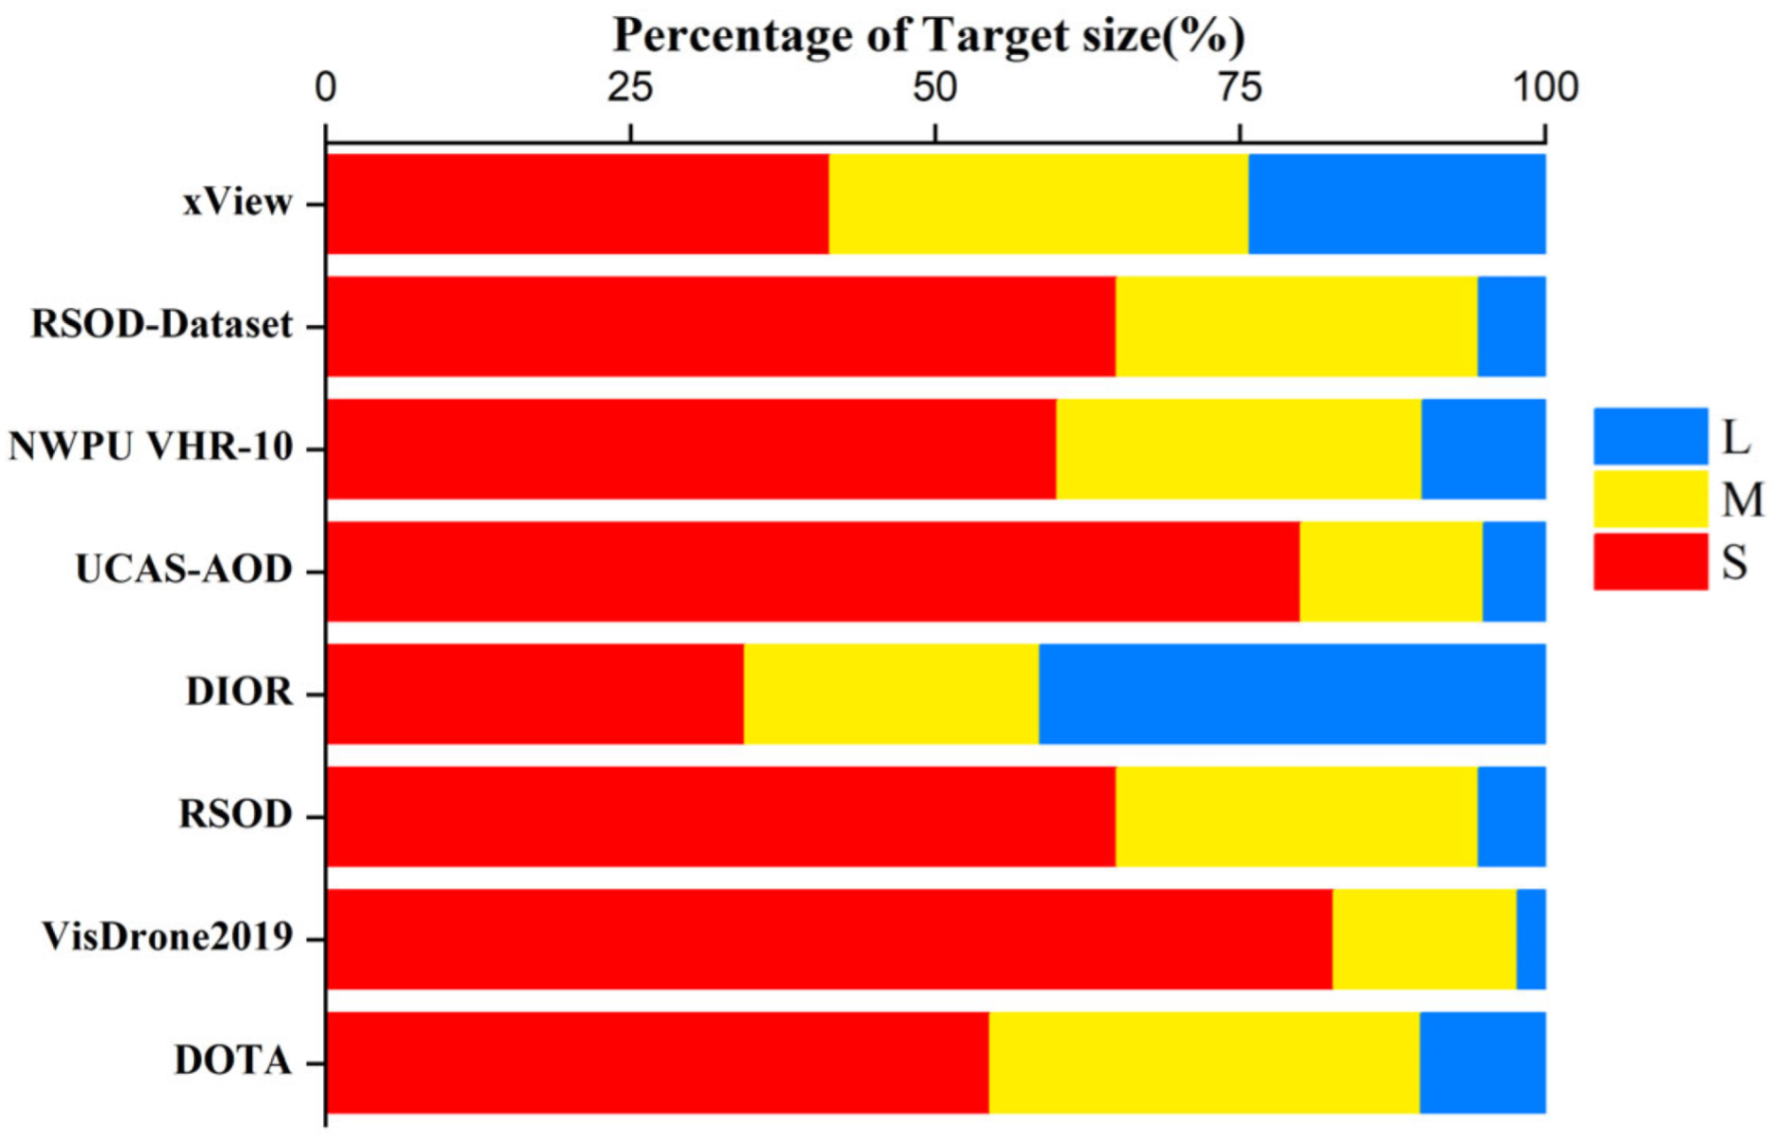
Figure 1. Percentage of each target size in different datasets.
Remotesensing 17 01044 g001
Figure 2. The overall framework of YOLOv8.
Remotesensing 17 01044 g002
Figure 3. The overall framework of our LACF-YOLO. Implementation of DIB module and TA mechanism in feature extraction network, custom convolutional blocks for multi-scale feature integration in neck network, and loss function optimization for enhanced convergence.
Remotesensing 17 01044 g003
Figure 4. The DIBl module. Comparison of the improved DIB module with the C2f module (a) and inverted bottleneck structure of DIB (b).
Remotesensing 17 01044 g004
Figure 5. Tradition convolution and dilated convolution. “Dilated Convolution Allows for a Larger Receptive Field under the Same Kernel Size”.
Remotesensing 17 01044 g005
Figure 6. The Triplet Attention module. Upper and lower branches capture cross-dimensional interactions between channel C and spatial dimensions H or W, the final branch constructs spatial attention, and the output is the average of the three branches.
Remotesensing 17 01044 g006
Figure 7. The PPWC module. PPWC modules are added in four parts of the neck network, represented by yellow icons, and enclosed with dashed lines around concat boxes.
Remotesensing 17 01044 g007
Figure 8. A visual representation of CIOU and IoU.
Remotesensing 17 01044 g008
Figure 9. A visual representation of EIOU.
Remotesensing 17 01044 g009
Figure 10. (a,b) Sample scene images from the dataset. (a) Image from the DOTA dataset. (b) Image from the VisDrone2019 dataset.
Remotesensing 17 01044 g010aRemotesensing 17 01044 g010b
Figure 11. Relevant statistics of the dataset. (a,b) The number of instance objects in the training sets of DOTA and VisDrone2019, respectively. (c,d) The histograms describing the size distribution of instance boxes in the training sets of DOTA and VisDrone2019, respectively. The two axes at the bottom represent height and width, and the vertical axis represents the proportion of instances within specific size ranges relative to the total number of instances.
Remotesensing 17 01044 g011aRemotesensing 17 01044 g011b
Figure 12. Precision–recall curves for the VisDrone2019 dataset.
Remotesensing 17 01044 g012aRemotesensing 17 01044 g012b
Figure 13. Precision–recall curves for the DOTA dataset.
Remotesensing 17 01044 g013aRemotesensing 17 01044 g013b
Figure 14. (a,b) Comparative analysis of AP50 (%) across diverse models. (a) Experiment conducted on the DOTA dataset. (b) Experiment conducted on the VisDrone2019 dataset.
Remotesensing 17 01044 g014
Figure 15. F1 score curves for the VisDrone2019 dataset.
Remotesensing 17 01044 g015aRemotesensing 17 01044 g015b
Figure 16. F1 score curves for the DOTA dataset.
Remotesensing 17 01044 g016aRemotesensing 17 01044 g016b
Figure 17. Visual comparison of six models on the VisDrone2019 dataset.
Remotesensing 17 01044 g017
Figure 18. Visual comparison of six models on the DOTA dataset.
Remotesensing 17 01044 g018aRemotesensing 17 01044 g018b
Figure 19. Bar chart comparing AP values across categories.
Remotesensing 17 01044 g019
Figure 20. An analysis contrasting the confusion matrices obtained prior to and subsequent to model refinement. (a,b) denote the baseline and improved models’ results on VisDrone2019; (c,d) indicate those on DOTA.
Remotesensing 17 01044 g020
Figure 21. Visualization of the TA module on the DOTA dataset.
Remotesensing 17 01044 g021
Figure 22. Visualization of the TA module on the VisDrone2019 dataset.
Remotesensing 17 01044 g022
Figure 23. Visualization of the PPWC module on the DOTA dataset.
Remotesensing 17 01044 g023
Figure 24. Visualization of the PPWC module on the VisDrone2019 dataset.
Remotesensing 17 01044 g024
Table 1. Configuration and training environment.
ParameterConfiguration
CPU modelIntel Core i7-9700k
GPU modelNVIDIA GeForce RTX 3090Ti
Operating systemUbuntu 18.04 LTS 64-bits
Deep learning framePyTorch1.9.1
GPU acceleratorCUDA10.2
Integrated development environmentPyCharm
Scripting languagePython3.8
Neural network acceleratorCUDNN7.6.5
Table 2. Hyperparametric configuration.
ParameterConfiguration
Neural network optimizerSGD
Learning rate0.001
Training epochs200
Momentum0.937
Batch size32
Weight decay0.0005
Table 3. Comparative analysis with other models on the VisDrone2019 dataset.
MethodParam.FLOPsmAPmAP50mAP75mAPSmAPMmAPL
Multi-stage detectorsFast R-CNN48.6586.1946.566.554.634.346.744.2
Faster R-CNN41.1563.2550.171.263.240.551.248.9
Cascade R-CNN68.9377.5252.372.264.341.252.350.2
RepPoints36.6135.6253.774.864.540.854.151.9
One-stage detectorsYOLOvX8.9313.3355.276.165.943.455.554.5
YOLOv57.018.2054.275.365.143.554.351.8
YOLOv617.1122.0157.778.867.445.157.755.4
YOLOv76.226.8869.584.568.855.269.768.7
YOLOv8s11.1314.2773.386.480.155.174.572.5
YOLOv8m26.2139.6175.688.581.757.875.573.9
YOLOv8l43.9283.1777.489.383.259.177.474.8
LACF-YOLO7.2510.5376.889.881.958.978.374.6
Table 4. Comparative analysis with other models on the DOTA dataset.
MethodParam.FLOPsmAPmAP50mAP75mAPSmAPMmAPL
Multi-stage detectorsFast R-CNN48.6486.1747.467.355.235.247.845.8
Faster R-CNN41.1363.2452.673.464.741.952.249.2
Cascade R-CNN68.9277.5154.573.664.942.853.752.5
RepPoints36.6235.6156.175.365.241.556.652.6
One-stage detectorsYOLOvX8.9113.3257.877.766.344.657.457.2
YOLOv57.008.1856.676.566.244.856.252.1
YOLOv617.0922.0259.179.268.646.758.456.1
YOLOv76.216.8672.385.969.358.472.569.5
YOLOv8s11.1214.2575.587.881.557.975.675.6
YOLOv8m26.1739.5676.889.482.659.777.377.3
YOLOv8l43.8883.1578.991.284.361.979.579.8
LACF-YOLO7.2410.5378.491.482.462.578.675.4
Table 5. Ablation experiments based on the VisDrone2019 dataset.
MobileDIBLayerTAPPWCFocal-EIOUmAPmAPSmAPMmAPLParam.FLOPSFPS
YOLOv8--------73.355.174.572.511.1314.27116
------73.555.474.672.77.2212.12140
------74.856.376.273.211.1412.01--
------74.956.976.573.611.1513.78--
----75.156.776.673.37.2311.31121
----75.257.476.973.97.2411.79--
----76.558.577.874.211.1611.58--
76.858.978.374.67.2510.53135
Table 6. Ablation experiments based on DOTA dataset.
MobileDIBLayerTAPPWCFocal-EIOUmAPmAPSmAPMmAPLParam.FLOPSFPS
YOLOv8--------75.557.975.675.611.1217.2586
------75.658.175.775.57.2114.16104
------76.460.876.474.711.1314.13--
------76.560.676.675.711.1416.58--
----76.661.276.875.17.2211.0793
----76.861.577.175.37.2313.29--
----77.662.377.975.311.1413.17--
78.462.578.675.47.2410.53109
Disclaimer/Publisher’s Note: The statements, opinions and data contained in all publications are solely those of the individual author(s) and contributor(s) and not of MDPI and/or the editor(s). MDPI and/or the editor(s) disclaim responsibility for any injury to people or property resulting from any ideas, methods, instructions or products referred to in the content.