
Spatiotemporal Characteristics, Causes, and Prediction of Wildfires in North China: A Study Using Satellite, Reanalysis, and Climate Model Datasets

 ,
,
Abstract
1. Introduction
2. Materials and Methods
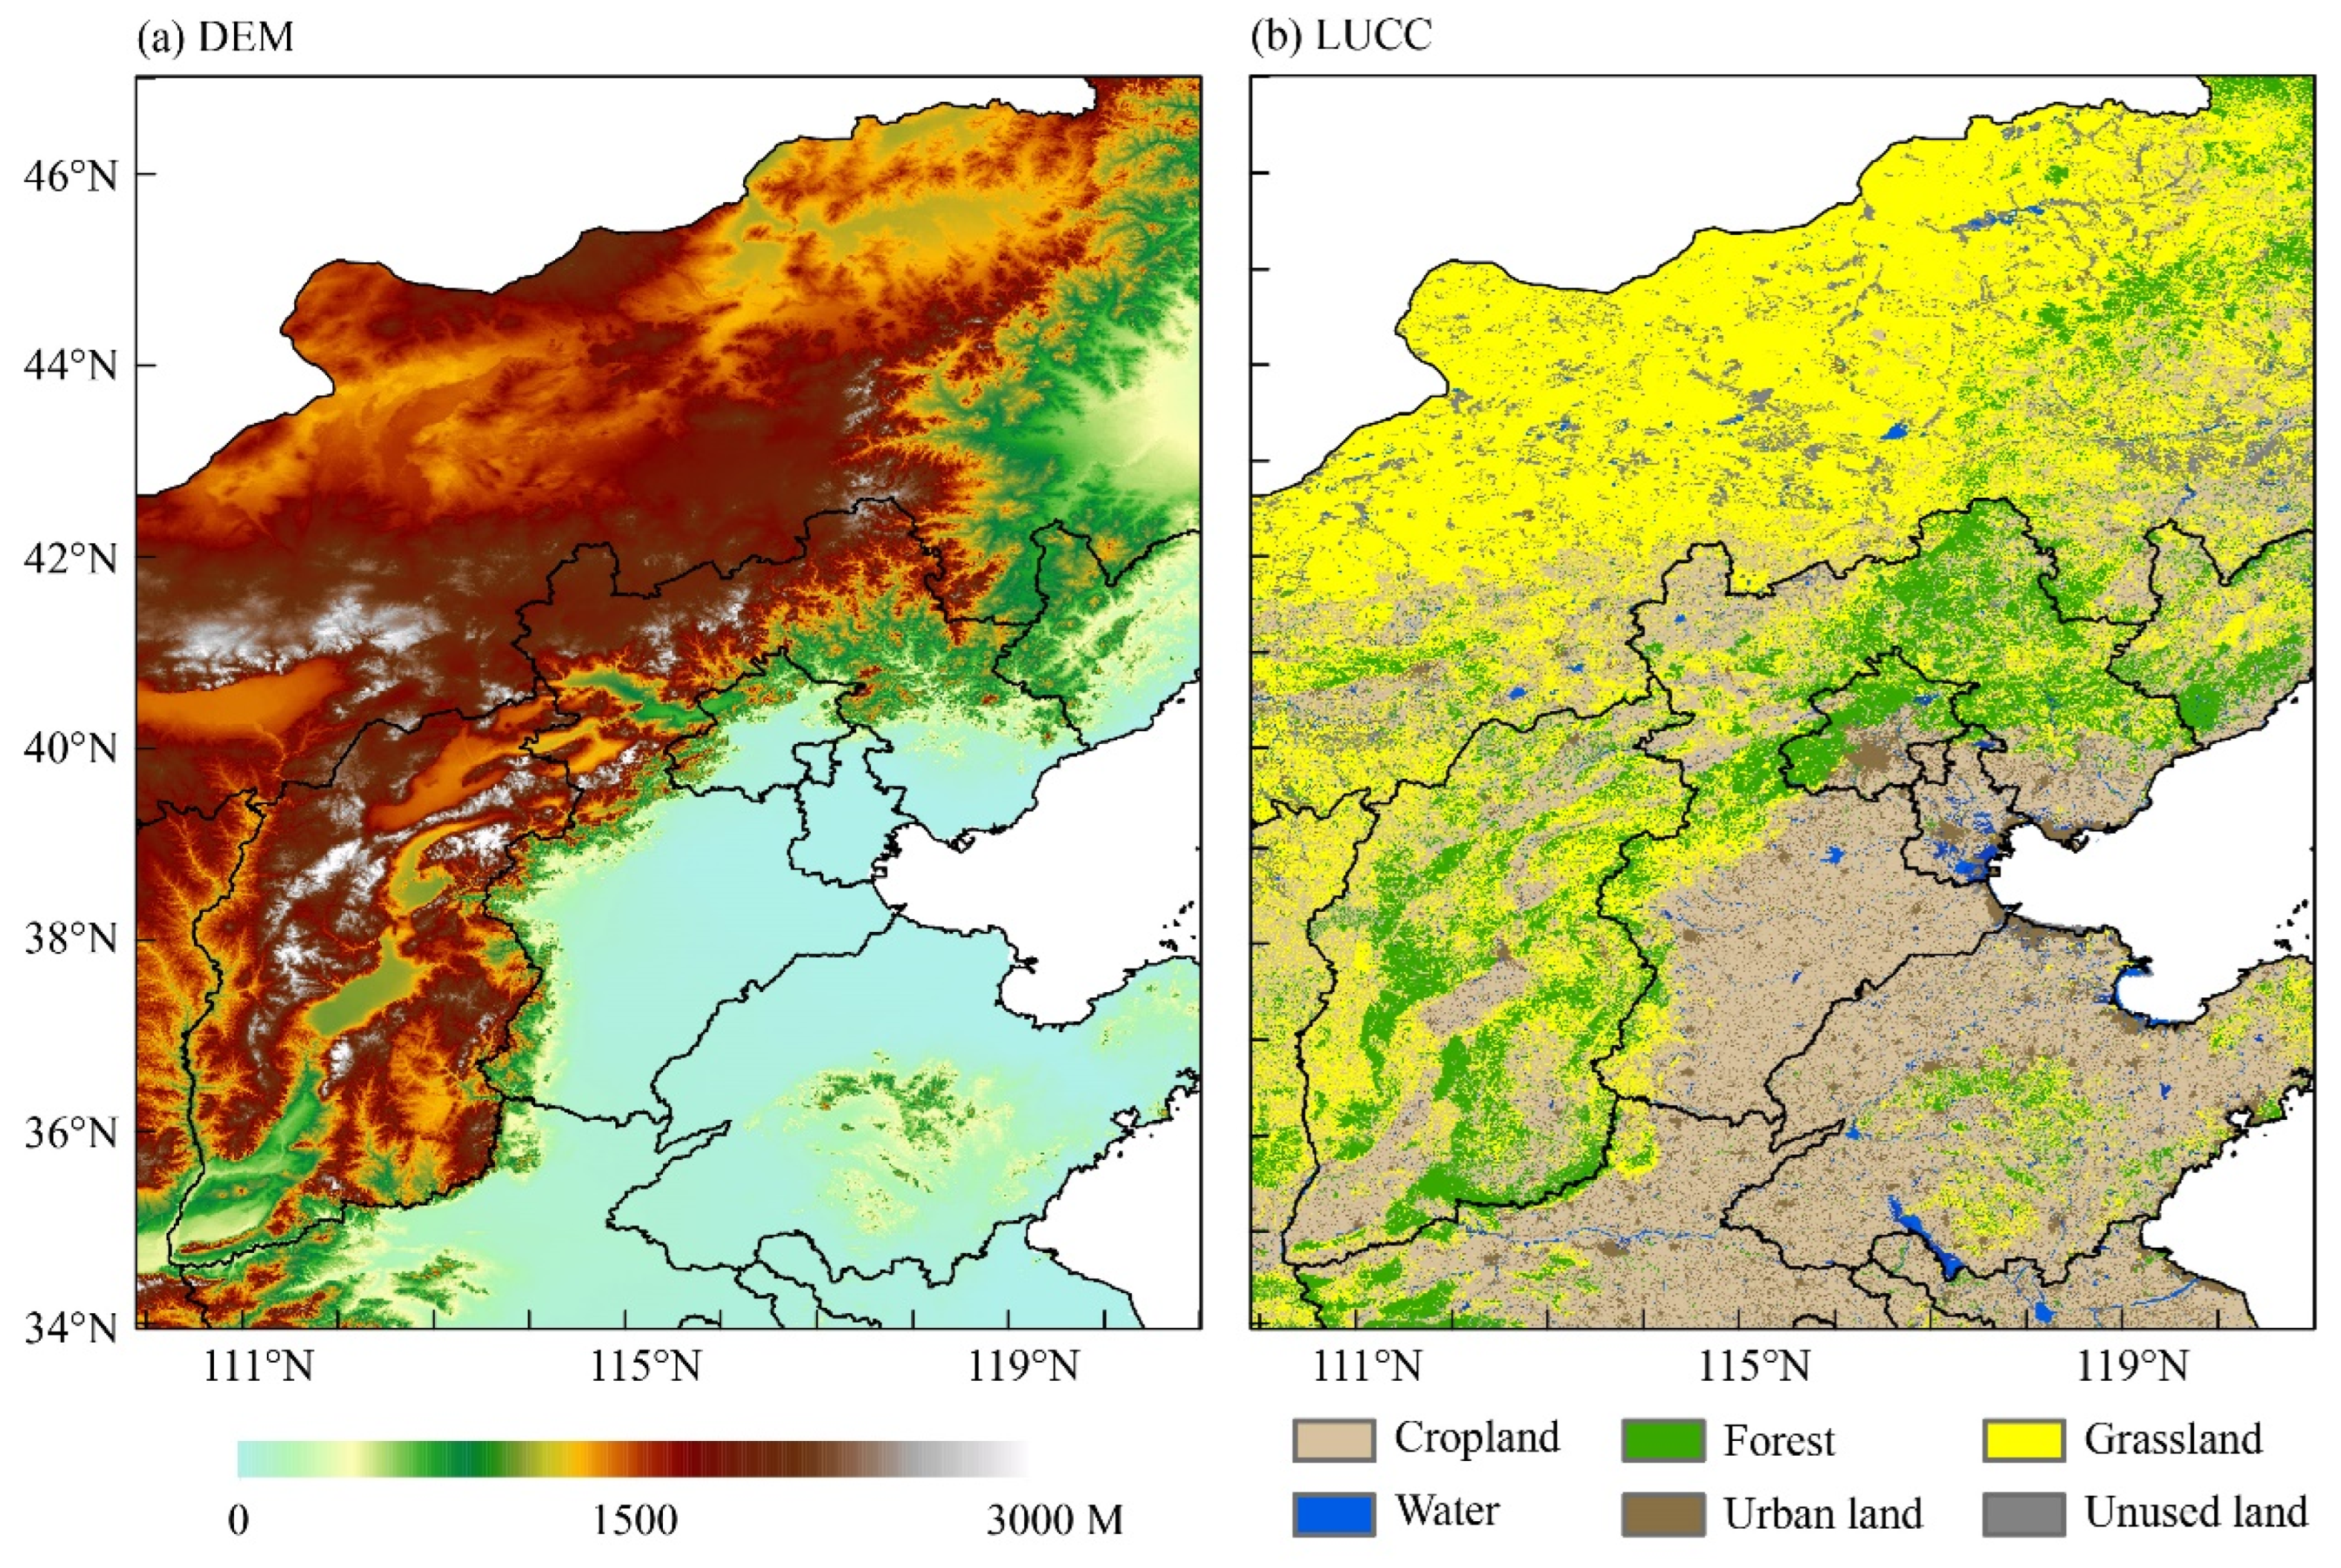
2.1. Study Area
2.2. Data
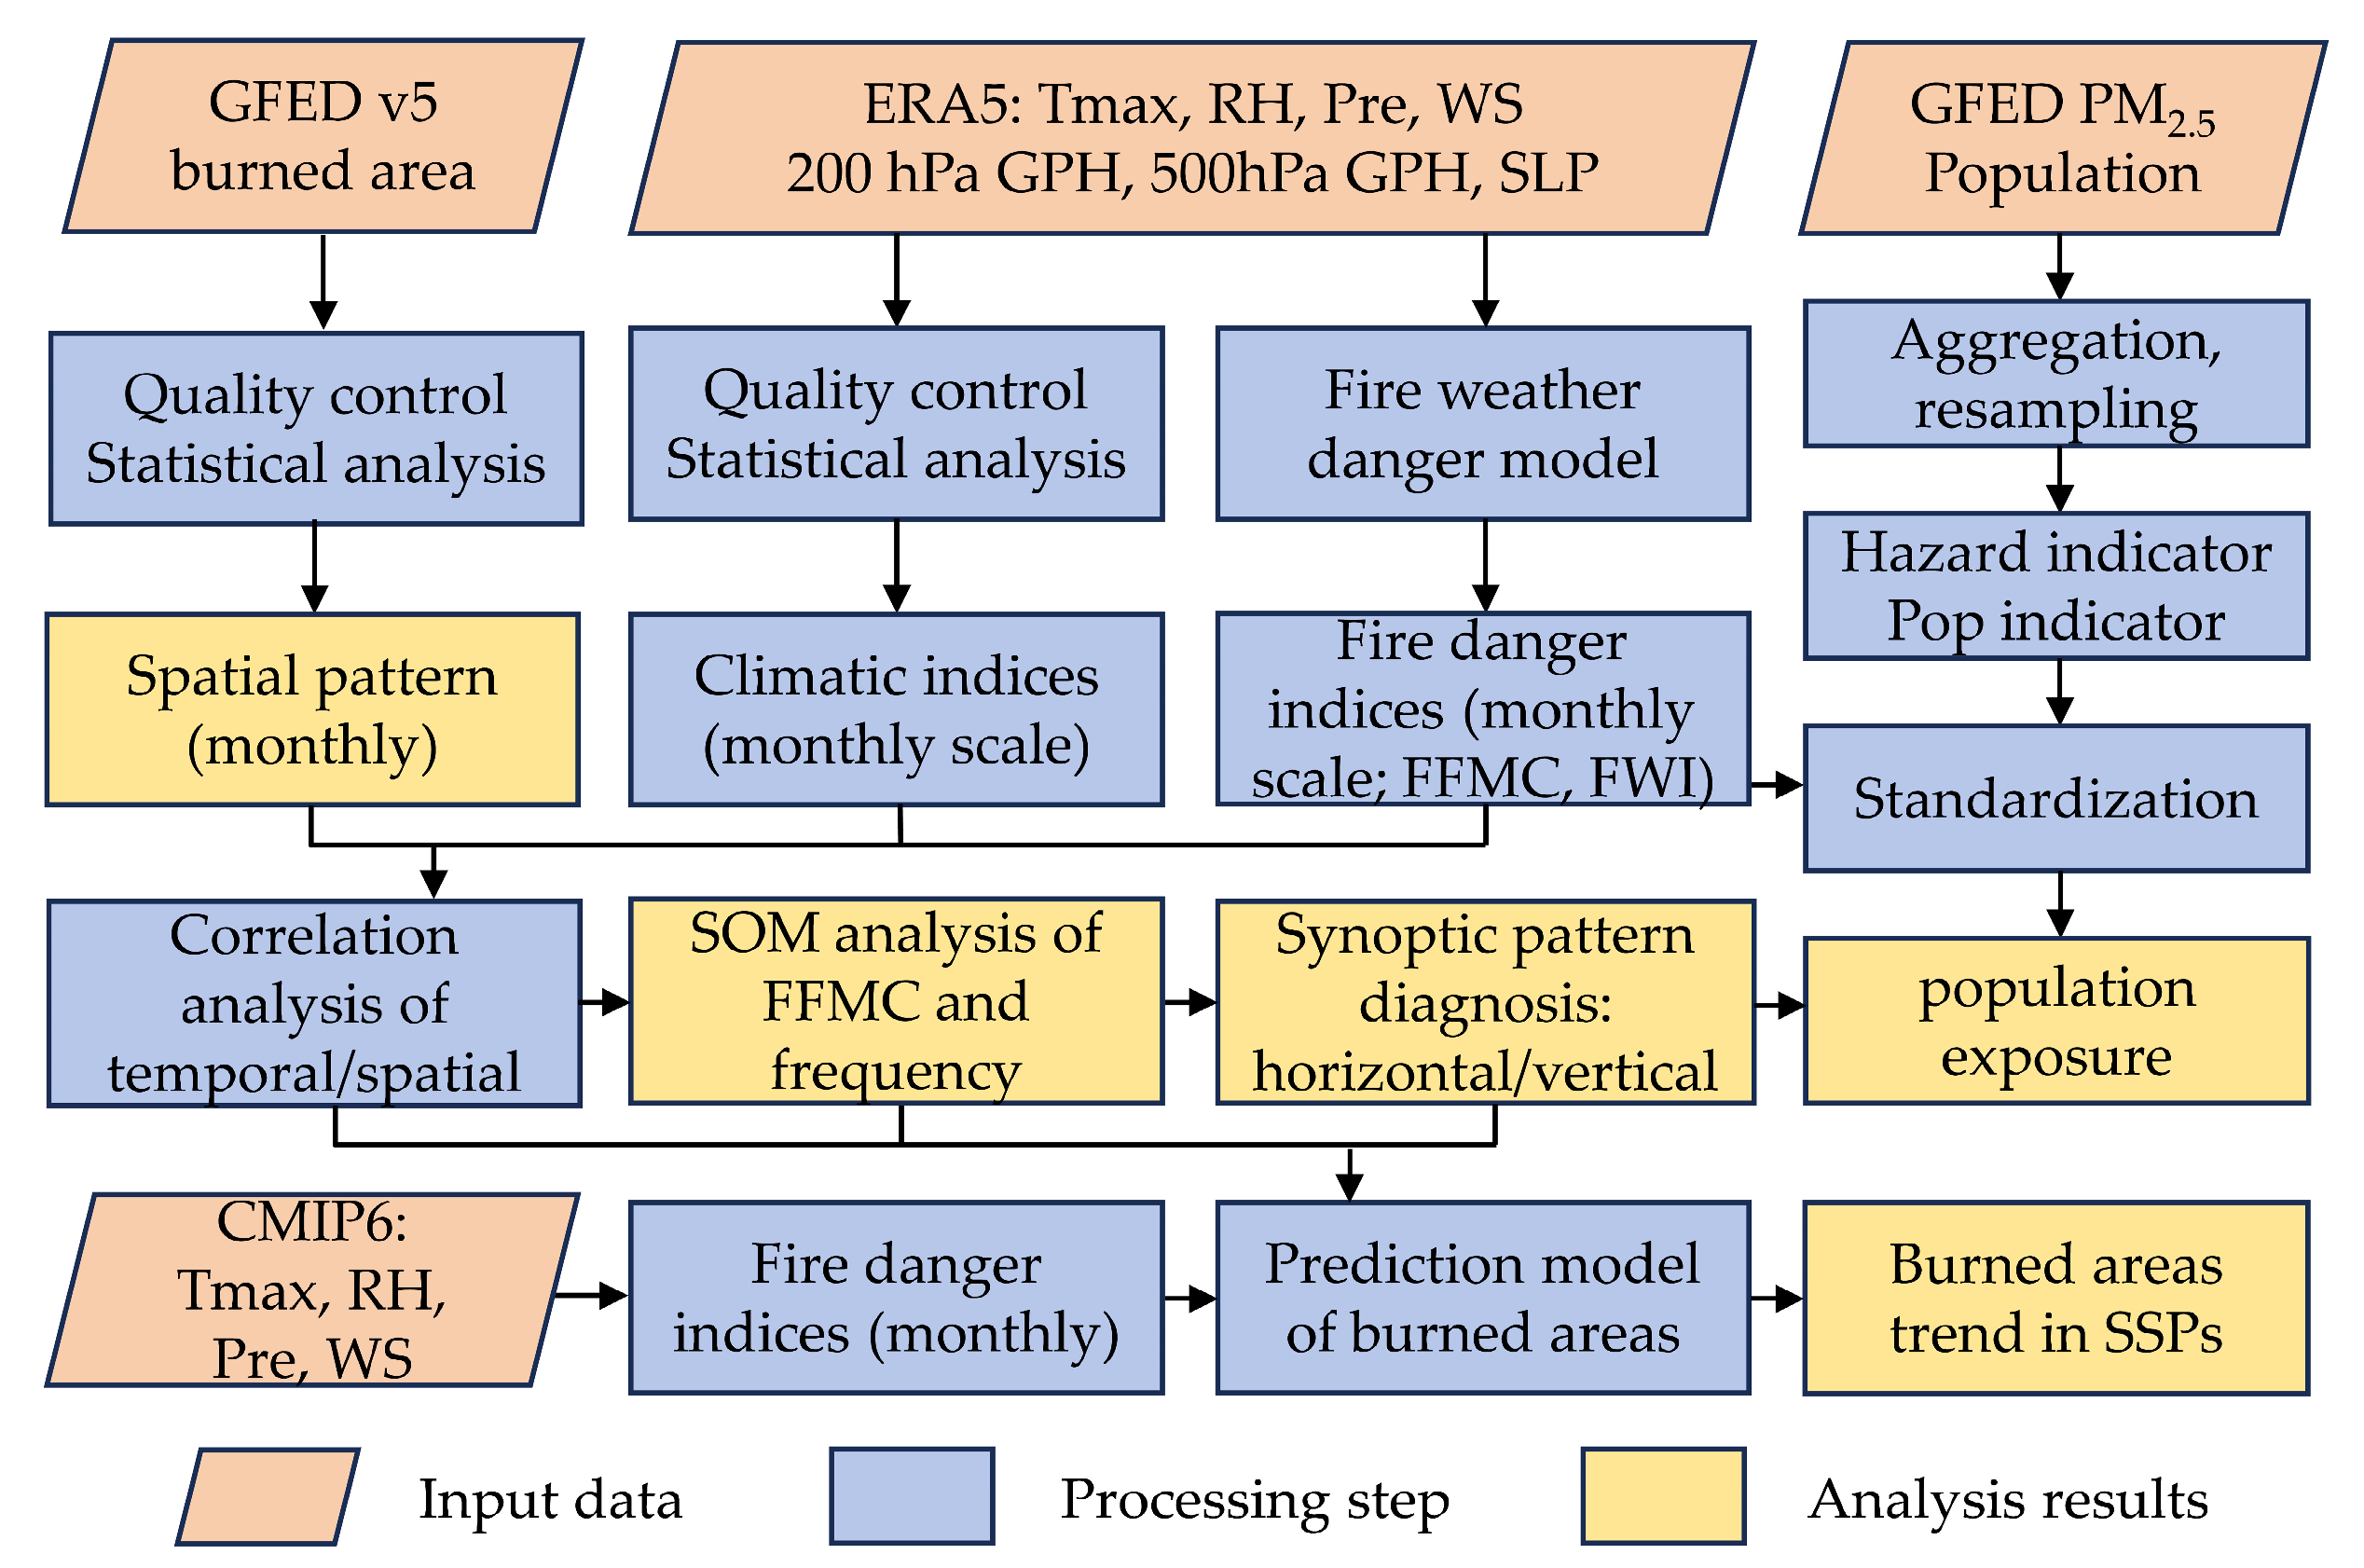
2.3. Methods
2.3.1. Fire Weather Danger Model
2.3.2. Self-Organizing Map Analysis
2.3.3. Population Exposure
2.3.4. Prediction Model of Future Burned Areas
3. Results
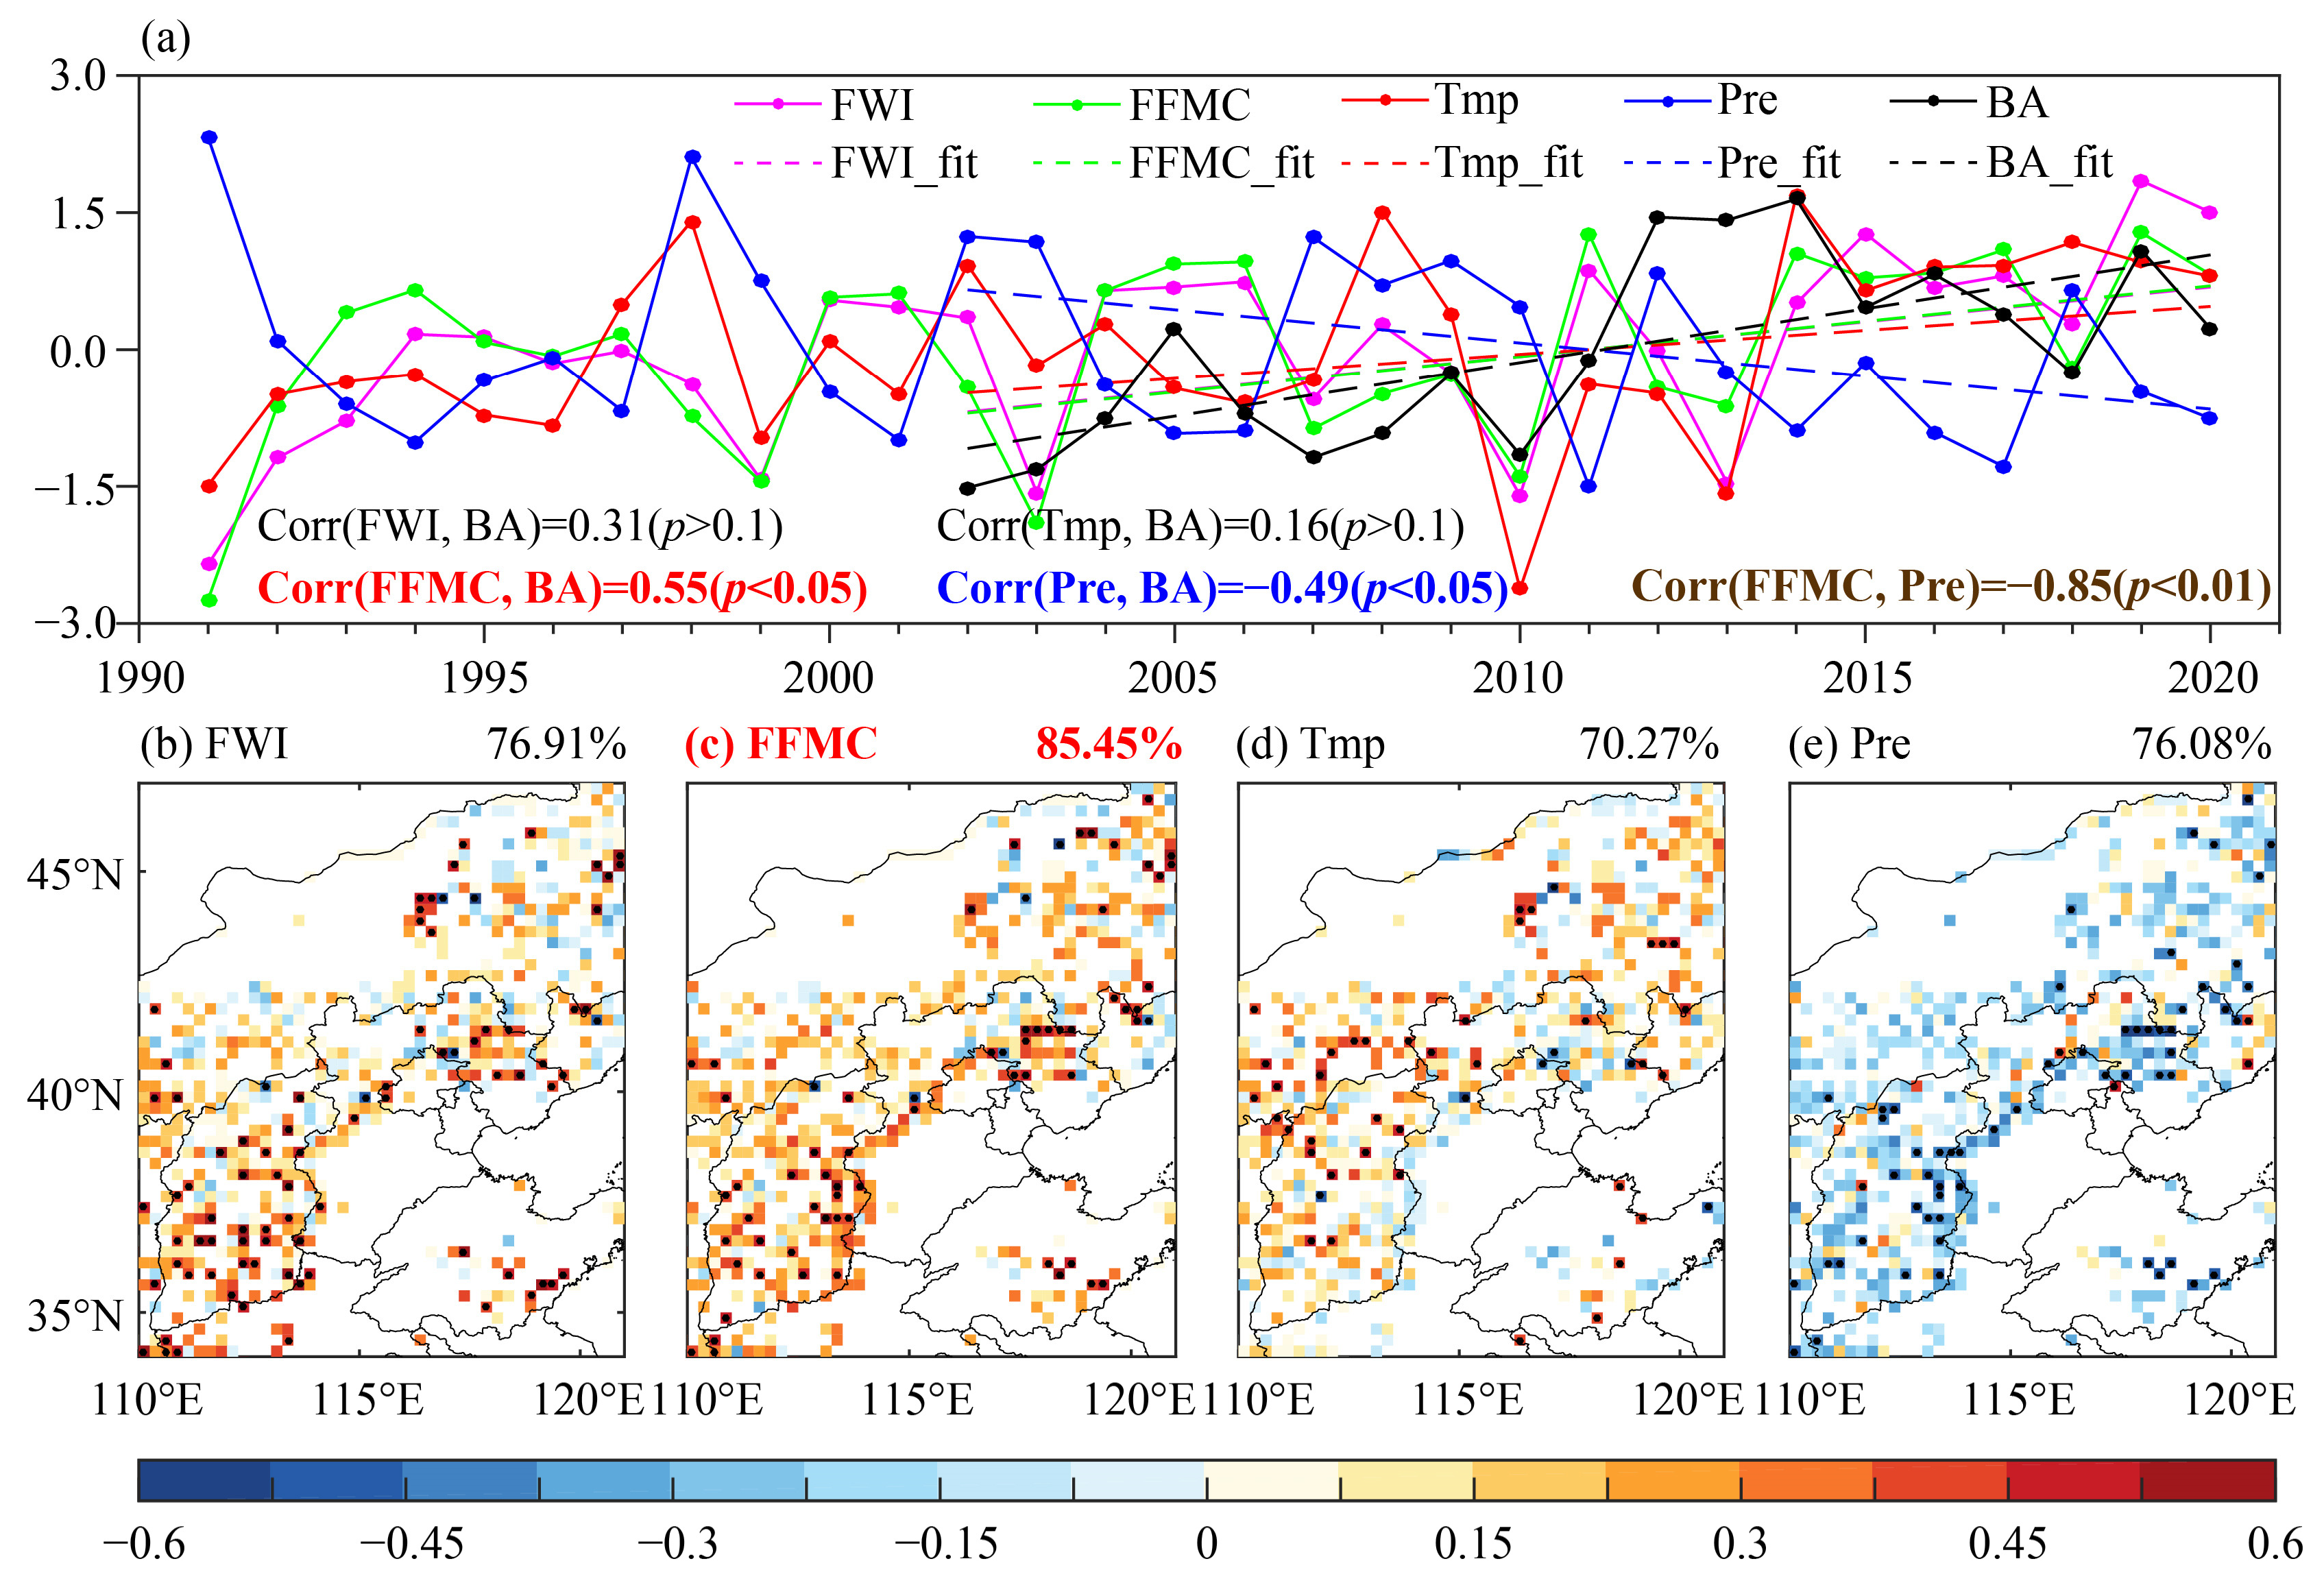
3.1. Spatiotemporal Characteristics of the Burned Area Fraction in North China
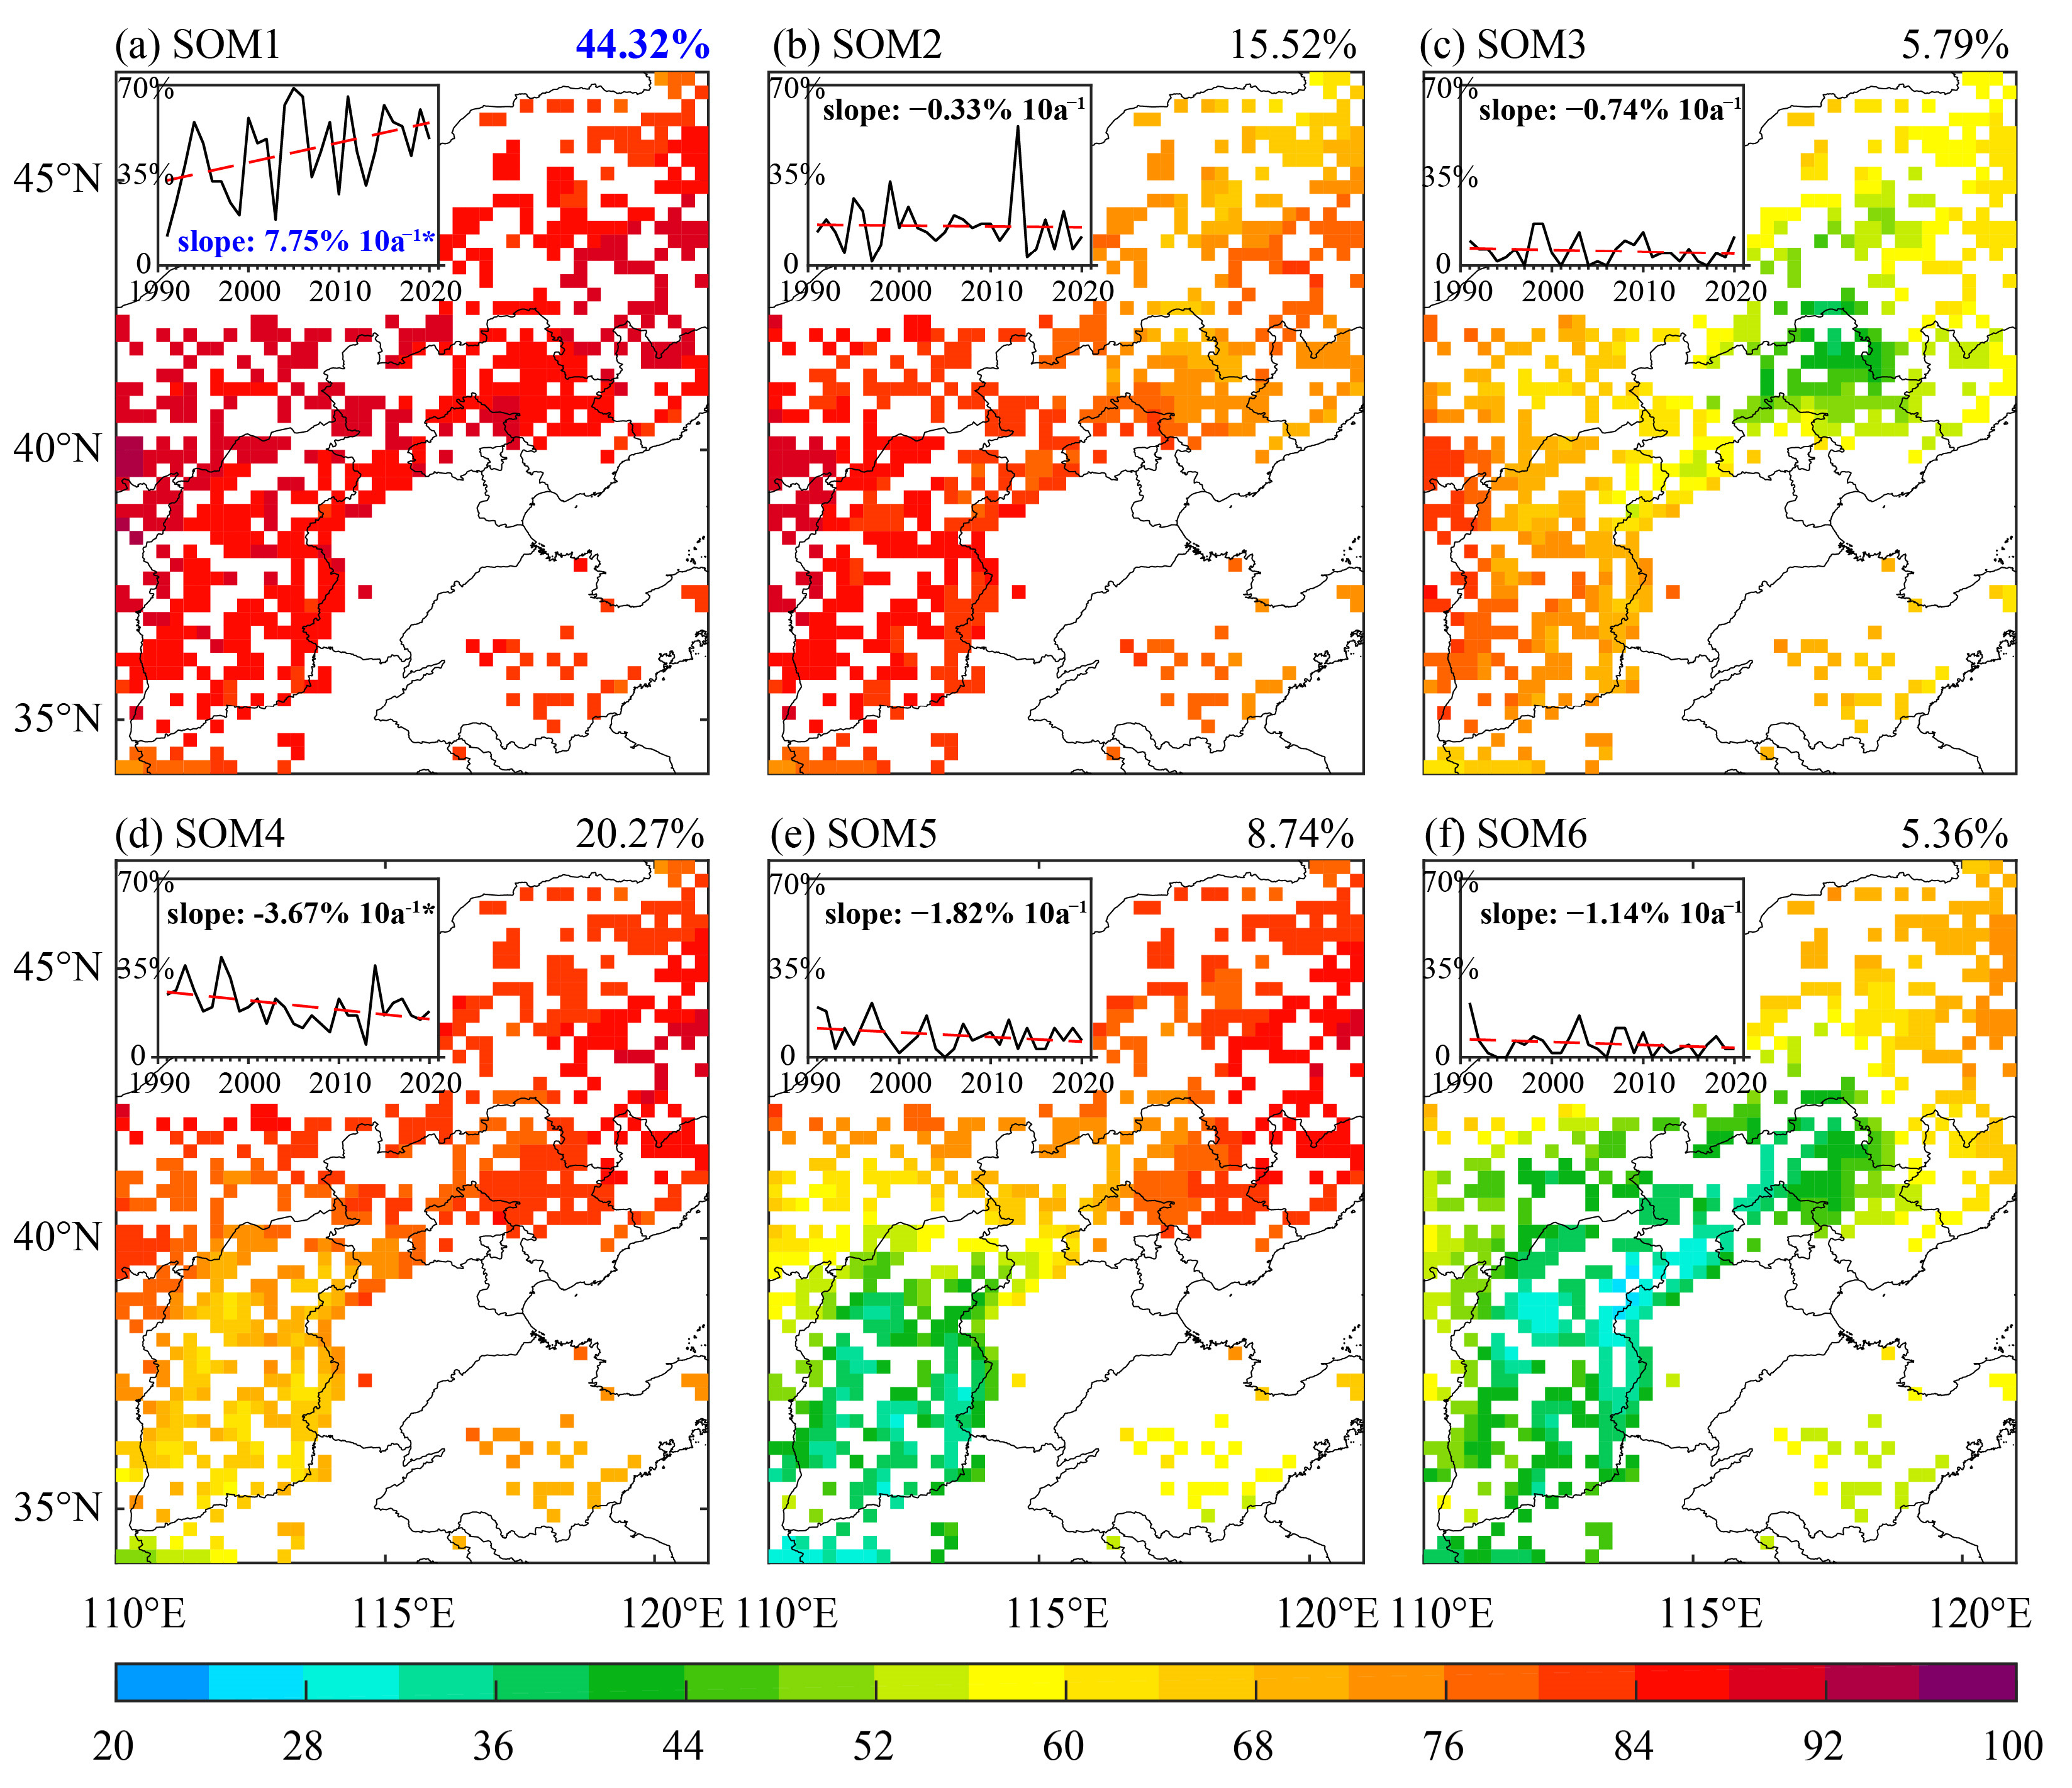
3.2. SOM Analysis of the FFMC Composites
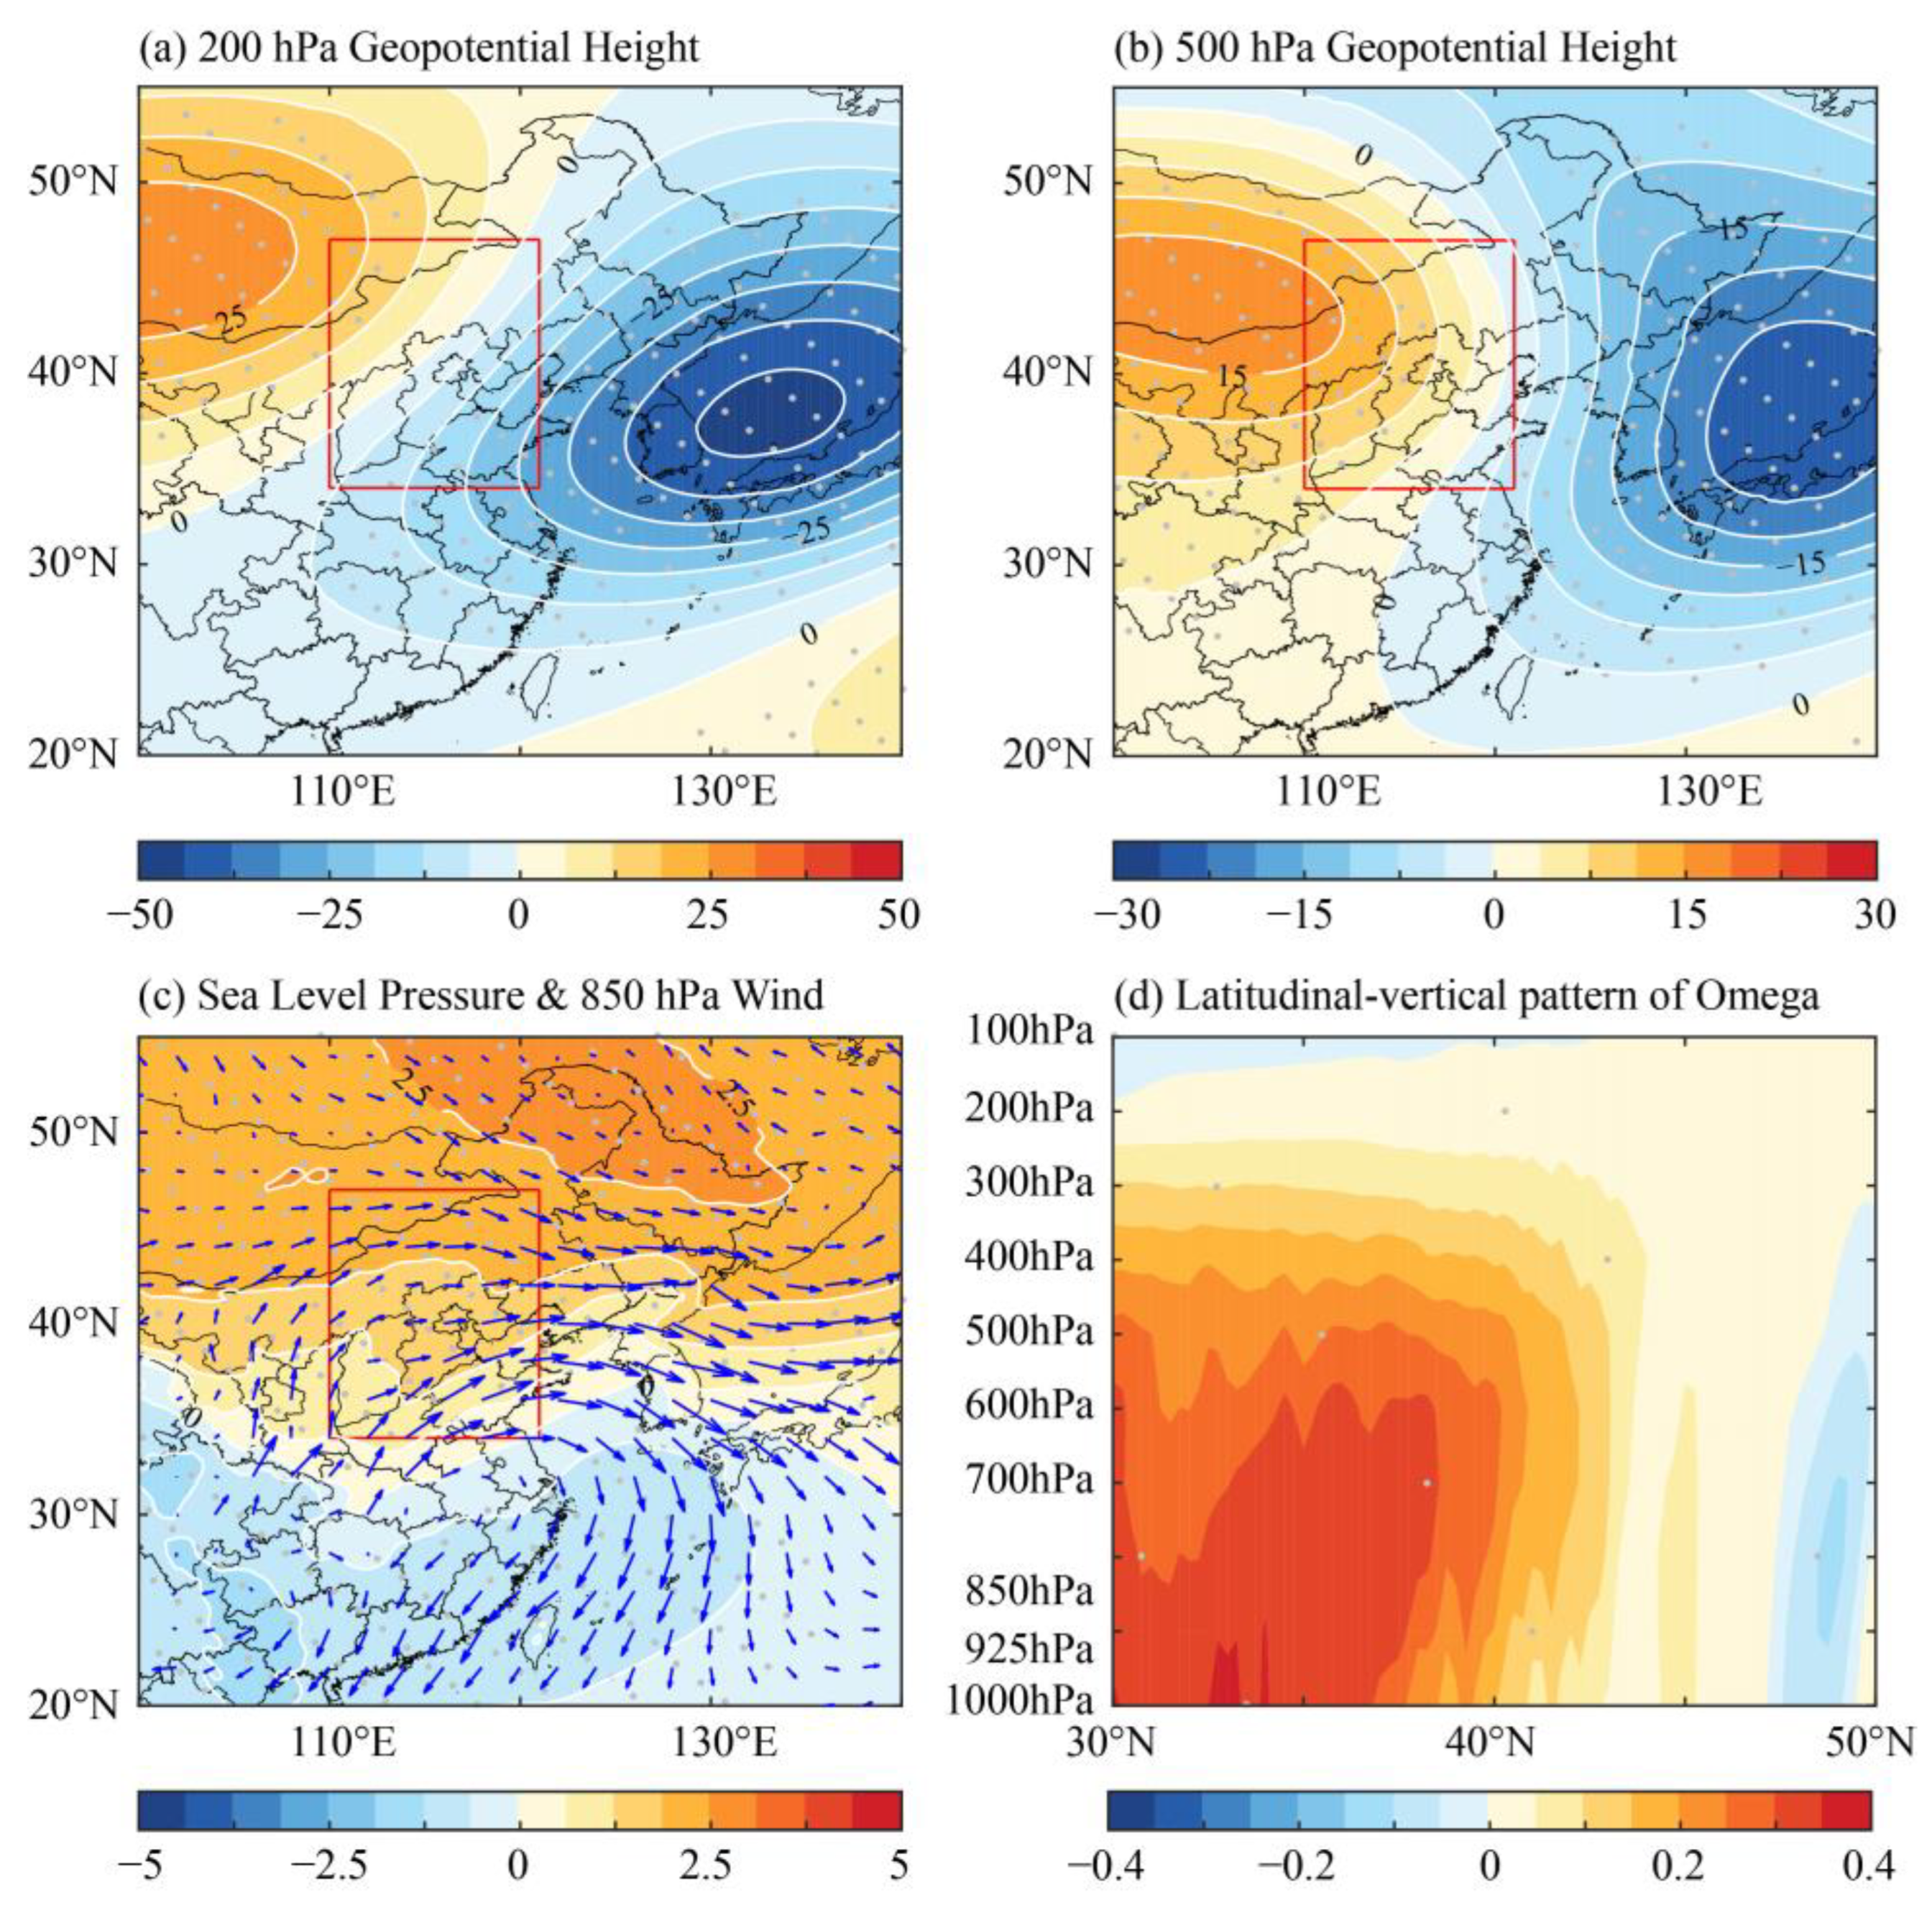
3.3. Atmospheric Circulation
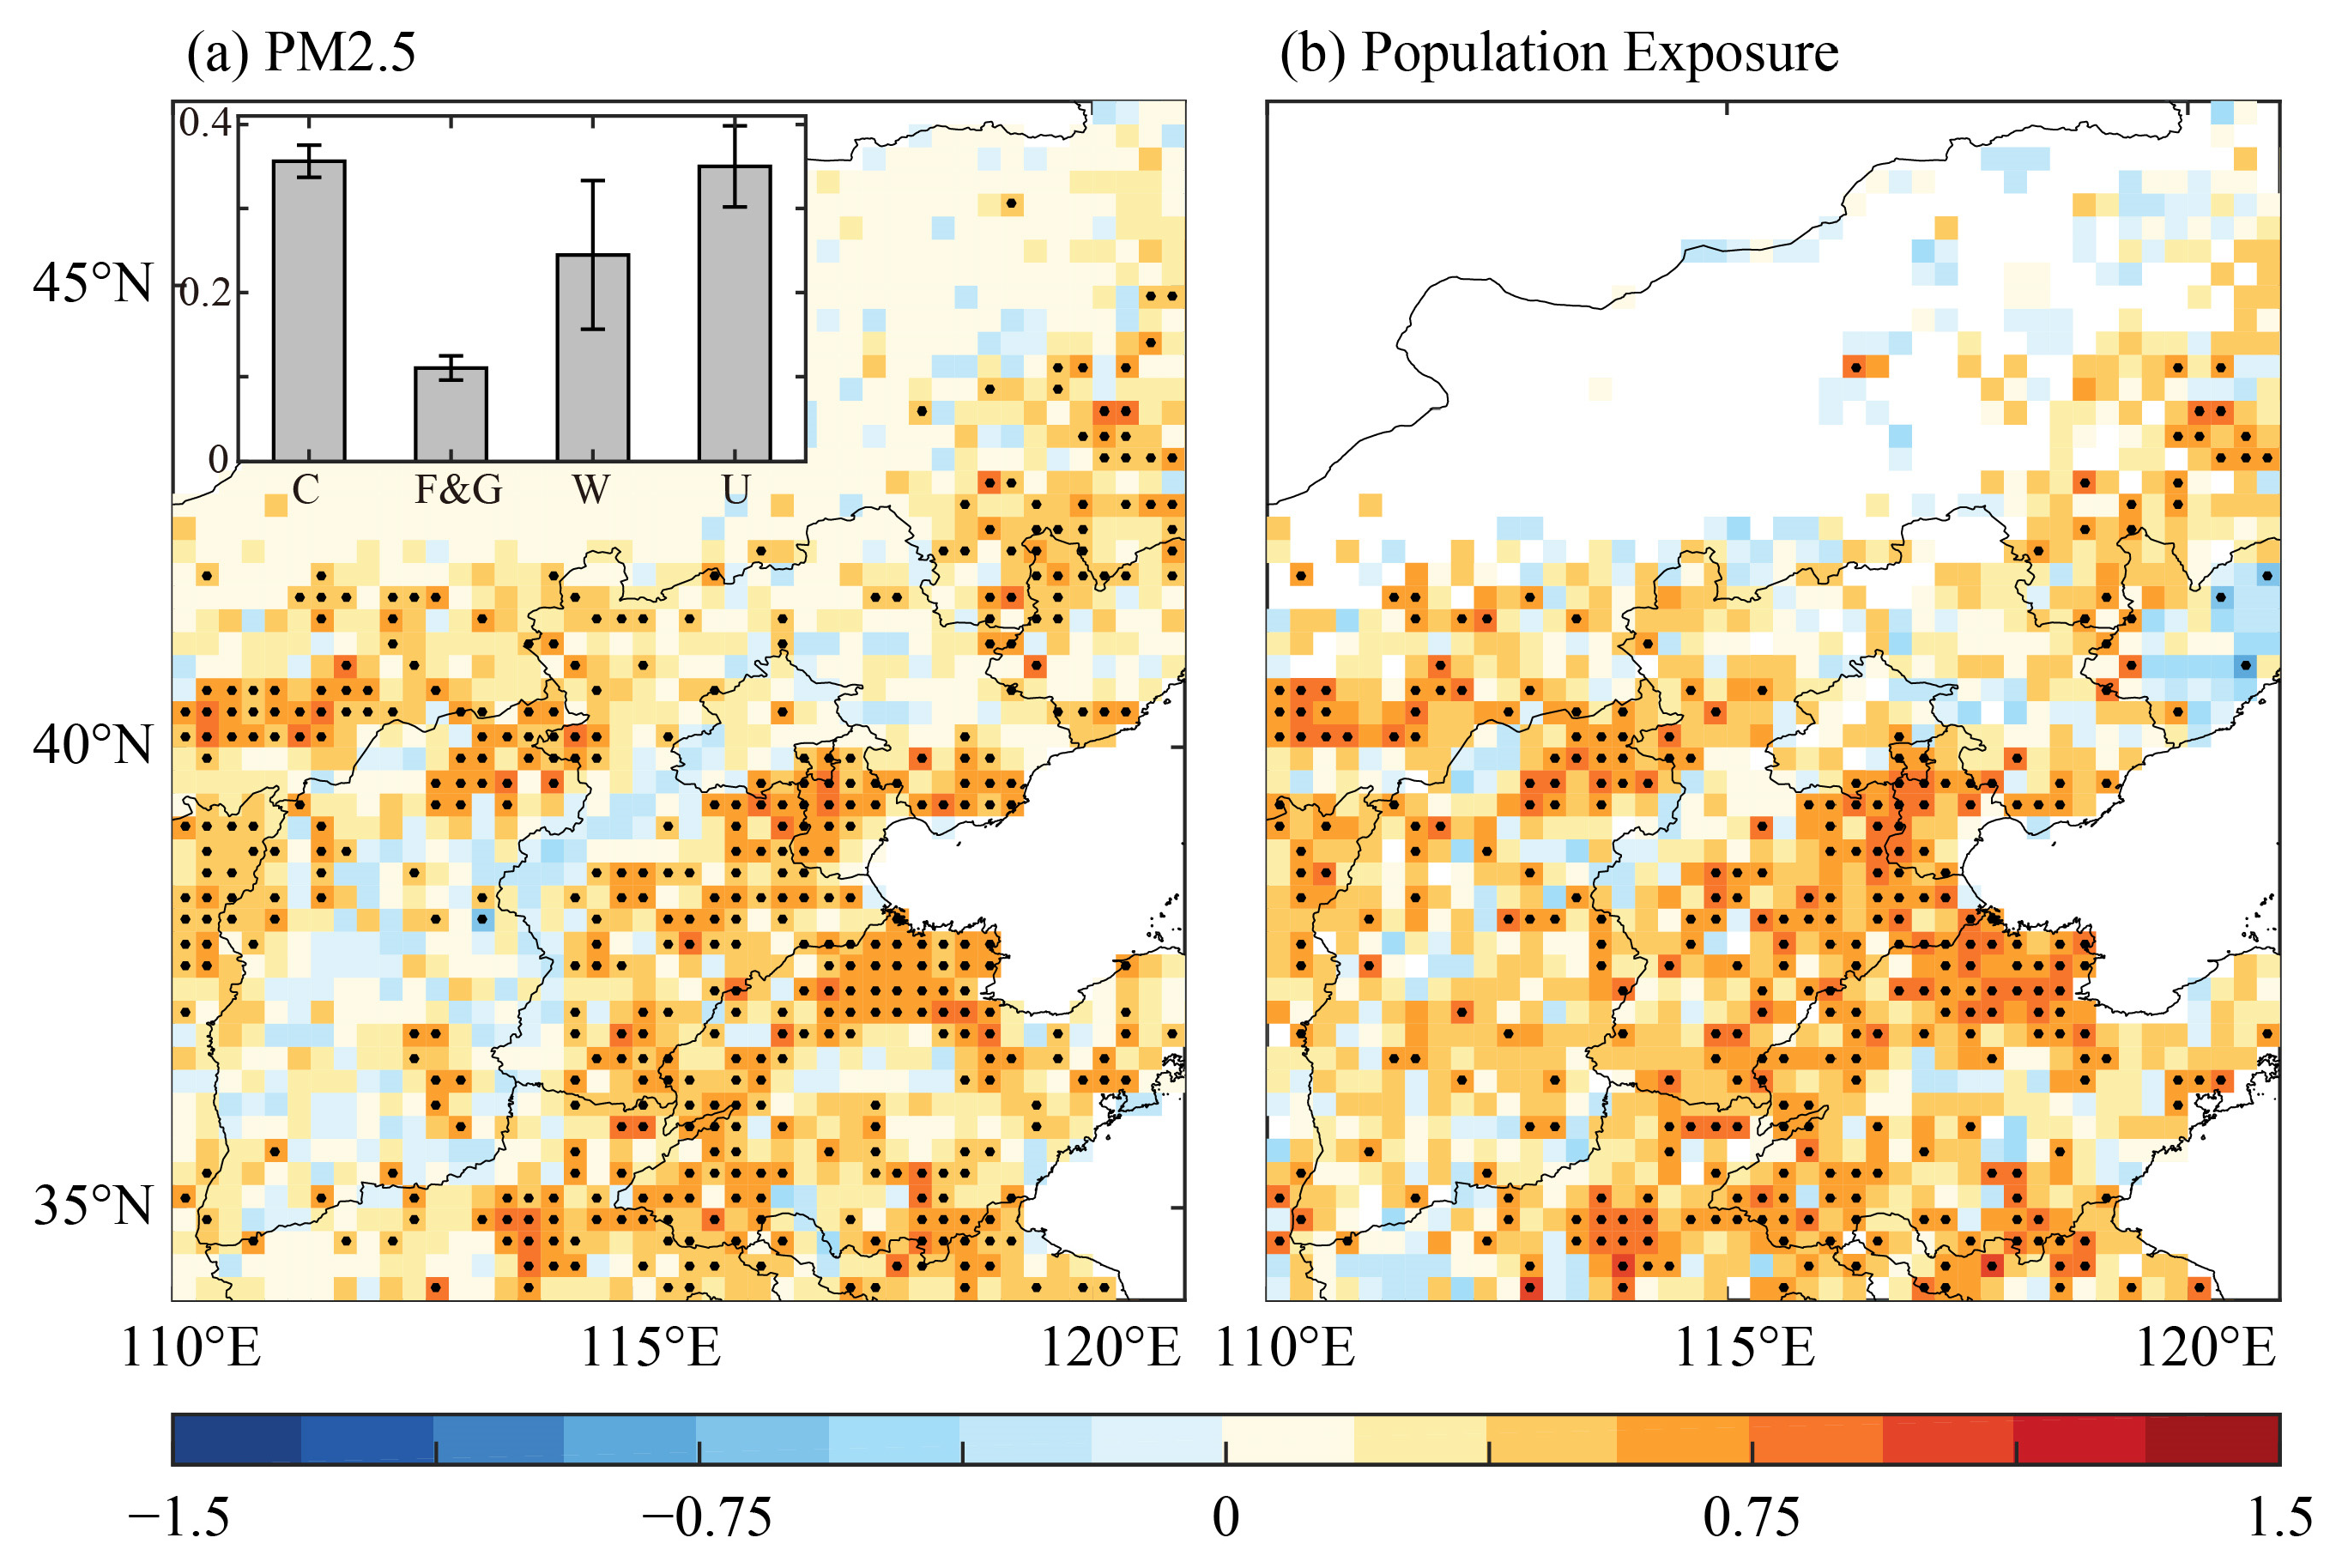
3.4. Trend of Pollution Concentration and Population Exposure
3.5. Predicted Burned Areas Under the Different SSP Scenarios
4. Discussion
5. Conclusions
Author Contributions
Funding
Data Availability Statement
Conflicts of Interest
References
- McDowell, N.G.; Allen, C.D. Darcy’s law predicts widespread forest mortality under climate warming. Nat. Clim. Change 2015, 5, 669–672. [Google Scholar] [CrossRef]
- Chinese Academy of Sciences. Blue Book of Forest Fire Carbon Emissions Research. 2023. Available online: http://www.iae.cas.cn/gb2019/xwzx_156509/ttxw_156510/202312/P020231212296936577850.pdf (accessed on 1 March 2024). (In Chinese).
- Staver, A.C.; Archibald, S.; Levin, S.A. The global extent and determinants of savanna and forest as alternative biome states. Science 2010, 334, 230–232. [Google Scholar] [CrossRef]
- Williams, A.P.; Abatzoglou, J.T.; Gershunov, A.; Guzman-Morales, J.; Bishop, D.A.; Balch, J.K.; Lettenmaier, D.P. Observed Impacts of Anthropogenic Climate Change on Wildfire in California. Earths Future 2019, 7, 892–910. [Google Scholar] [CrossRef]
- Touma, D.; Stevenson, S.; Lehner, F.; Coats, S. Human-driven greenhouse gas and aerosol emissions cause distinct regional impacts on extreme fire weather. Nat. Commun. 2021, 12, 212. [Google Scholar] [CrossRef]
- Jain, P.; Castellanos-Acuna, D.; Coogan, S.C.P.; Abatzoglou, J.T.; Flannigan, M.D. Observed increases in extreme fire weather driven by atmospheric humidity and temperature. Nat. Clim. Change 2021, 12, 63–72. [Google Scholar] [CrossRef]
- Abatzoglou, J.T.; Williams, A.P. Impact of anthropogenic climate change on wildfire across western US forests. Proc. Natl. Acad. Sci. USA 2016, 113, 11770–11775. [Google Scholar] [CrossRef]
- Goss, M.; Swain, D.L.; Abatzoglou, J.T.; Sarhadi, A.; Kolden, C.A.; Williams, A.P.; Diffenbaugh, N.S. Climate change is increasing the likelihood of extreme autumn wildfire conditions across California. Environ. Res. Lett. 2020, 15, 094016. [Google Scholar] [CrossRef]
- Kirchmeier-Young, M.C.; Zwiers, F.W.; Gillett, N.P.; Cannon, A.J. Attributing extreme fire risk in Western Canada to human emissions. Clim. Change 2017, 144, 365–379. [Google Scholar] [CrossRef]
- Phillips, N.; Nogrady, B. The climate link to Australia’s fires. Nature 2020, 577, 610–612. [Google Scholar] [CrossRef]
- Xing, H.; Fang, K.Y.; Yao, Q.C.; Zhou, F.F.; Ou, T.H.; Liu, J.E.; Zhou, S.F.; Jiang, S.X.; Chen, Y.; Bai, M.W.; et al. Impacts of changes in climate extremes on wildfire occurrences in China. Ecol. Indic. 2023, 157, 111288. [Google Scholar] [CrossRef]
- Xu, Y.X.; Guo, H.Y.; Liu, J.; Sun, R.; Li, X.L. Wildfire risks under a changing climate: Synthesized assessments of wildfire risks over southwestern China. Front. Environ. Sci. 2023, 11, 1137372. [Google Scholar] [CrossRef]
- Wang, A.A.; Zhang, D.Y.; Feng, Z.K.; Li, X.Y.; Li, X.Y. Spatiotemporal Patterns and Risk Zoning of Wildfire Occurrences in Northeast China from 2001 to 2019. Forests 2024, 14, 2350. [Google Scholar] [CrossRef]
- Tian, X.R.; Shu, L.F.; Zhao, F.J.; Wang, M.Y. Impacts of climate change on forest fire danger in China. Sci. Silvae Sin. 2017, 53, 159–169. [Google Scholar] [CrossRef]
- Bai, M.X.; Du, W.P.; Wu, M.W.; Zhang, C.P.; Xing, P.; Hao, Z.X. Variation in fire danger in the Beijing-Tianjin-Hebei region over the past 30 years and its linkage with atmospheric circulation. Clim. Change 2024, 177, 27. [Google Scholar] [CrossRef]
- China News. 2024. Available online: http://www.chinanews.com.cn/sh/2024/02-21/10167251.shtml (accessed on 10 March 2024).
- Available online: https://www.mem.gov.cn/xw/yjglbgzdt/202101/t20210108_376745.shtml (accessed on 1 March 2024).
- Le, T.; Kim, S.H.; Bae, D.H. Decreasing causal impacts of El Nino-Southern Oscillation on future fire activities. Sci. Total Environ. 2022, 826, 154031. [Google Scholar] [CrossRef]
- Hessilt, T.D.; Abatzoglou, J.T.; Chen, Y.; Randerson, J.T.; Scholten, R.C.; van der Werf, G.; Veraverbeke, S. Future increases in lightning ignition efficiency and wildfire occurrence expected from drier fuels in boreal forest ecosystems of western North America. Environ. Res. Lett. 2022, 17, 054008. [Google Scholar] [CrossRef]
- Lou, S.H.; Liu, Y.F.; Bai, Y.Q.; Li, F.; Lin, G.X.; Xu, L.L.; Liu, Z.; Chen, Y.D.; Dong, X.; Zhao, M.Z. Projections of mortality risk attributable to short-term exposure to landscape fire smoke in China, 2021–2100 a health impact assessment study. Lancet Planet. Health 2023, 7, 841–849. [Google Scholar] [CrossRef]
- Xu, R.B.; Ye, T.T.; Yue, X.; Yang, Z.Y.; Yu, W.H.; Zhang, Y.W.; Bell, M.L.; Morawska, L.; Yu, P.; Zhang, Y.X. Global population exposure to landscape fire air pollution from 2000 to 2019. Nature 2023, 621, 521–525. [Google Scholar] [CrossRef]
- Fang, C.L. Theoretical foundation and patterns of coordinated development of the Beijing-Tianjin-Hebei Urban Agglomeration. Prog. Geogr. 2017, 36, 15–24. (In Chinese) [Google Scholar] [CrossRef]
- Fan, J.; Lian, Y.N.; Zhao, H. Review of the research progress in Beijing-Tianjin-Hebei region since 1980. Acta Geogr. Sin. 2022, 77, 1299–1319. (In Chinese) [Google Scholar] [CrossRef]
- Dai, A.G.; Zhao, T.B. Uncertainties in historical changes and future projections of drought. Part I: Estimates of historical drought changes. Clim. Change 2017, 144, 519–533. [Google Scholar] [CrossRef]
- Zhao, T.B.; Dai, A.G. Uncertainties in historical changes and future projections of drought. Part II: Model-simulated historical and future drought changes. Clim. Change 2017, 144, 535–548. [Google Scholar] [CrossRef]
- Van Wagner, C.E. Development and Structure of the Canadian Forest Fire Weather Index System; Canadian Forest Search Technology Report; Canadian Forestry Service: Ottawa, ON, Canada, 1987. [Google Scholar]
- Laneve, G.; Pampanoni, V.; Shaik, R.U. The Daily Fire Hazard Index: A Fire Danger Rating Method for Mediterranean Areas. Remote Sens. 2020, 12, 2356. [Google Scholar] [CrossRef]
- Jain, P.; Wang, X.L.; Flannigan, M.D. Trend analysis of fire season length and extreme fire weather in North America between 1979 and 2015. Int. J. Wildland Fire 2017, 26, 1009–1020. [Google Scholar] [CrossRef]
- Field, R.D. Evaluation of Global Fire Weather Database reanalysis and short-term forecast products. Nat. Hazards Earth Syst. 2020, 20, 1123–1147. [Google Scholar] [CrossRef]
- McElhinny, M.; Beckers, J.F.; Hanes, C.; Flannigan, M.; Jain, P. A high-resolution reanalysis of global fire weather from 1979 to 2018—Overwintering the Drought Code. Earth Syst. Sci. Data 2020, 12, 1823–1833. [Google Scholar] [CrossRef]
- Rodrigues, M.; González-Hidalgo, J.C.; Peña-Angulo, D.; Jiménez-Ruano, A. Identifying wildfire-prone atmospheric circulation weather types on mainland Spain. Agric. Forest Meteorol. 2019, 264, 92–103. [Google Scholar] [CrossRef]
- Trouet, V.; Taylor, A.H.; Carleton, A.M.; Skinner, C.N. Fire-climate interactions in forests of the American Pacific coast. Geophys. Res. Lett. 2006, 33, 18. [Google Scholar] [CrossRef]
- Ma, W.Y.; Feng, Z.K.; Cheng, Z.X.; Chen, S.L.; Wang, F.G. Identifying Forest Fire Driving Factors and Related Impacts in China Using Random Forest Algorithm. Forests 2020, 11, 507. [Google Scholar] [CrossRef]
- Eslami, R.; Azarnoush, M.; Kialashki, A.; Kazemzadeh, F. GIS-based Forest Fire Susceptibility Assessment by Random Forest, Artificial Neural Network and Logistic Regression Methods. J. Trop. For. Sci. 2021, 33, 173–184. [Google Scholar] [CrossRef]
- Dixon, D.J.; Zhu, Y.Z.; Brown, C.F.; Jin, Y.F. Satellite detection of canopy-scale tree mortality and survival from California wildfires with spatio-temporal deep learning. Remote Sens. Environ. 2023, 298, 113842. [Google Scholar] [CrossRef]
- Sudiana, D.; Lestari, A.I.; Riyanto, I.; Rizkinia, M.; Arief, R.; Prabuwono, A.S.; Sumantyo, J.T.S. A Hybrid Convolutional Neural Network and Random Forest for Burned Area Identification with Optical and Synthetic Aperture Radar (SAR) Data. Remote Sens. 2023, 15, 728. [Google Scholar] [CrossRef]
- Li, X.D.; Gao, H.W.; Zhang, M.X.; Zhang, S.Y.; Gao, Z.M.; Liu, J.Q.; Sun, S.F.; Hu, T.X.; Sun, L. Prediction of Forest Fire Spread Rate Using UAV Images and an LSTM Model Considering the Interaction between Fire and Wind. Remote Sens. 2021, 13, 4325. [Google Scholar] [CrossRef]
- Ding, Y.H.; Wang, Z.Y.; Sun, Y. Inter-decadal variation of the summer precipitation in East China and its association with decreasing Asian summer monsoon. Part I: Observed evidences. Int. J. Climatol. 2008, 28, 1139–1161. [Google Scholar] [CrossRef]
- Ding, Y.H.; Sun, Y.; Wang, Z.Y.; Zhu, Y.X.; Song, Y.F. Inter-decadal variation of the summer precipitation in China and its association with decreasing Asian summer monsoon Part II: Possible causes. Int. J. Climatol. 2009, 29, 1926–1944. [Google Scholar] [CrossRef]
- Hersbach, H.; Bell, B.; Berrisford, P.; Hirahara, S.; Horányi, A.; Muñoz-Sabater, J.; Nicolas, J.; Peubey, C.; Radu, R. The ERA5 global reanalysis. Q. J. R. Meteorol. Soc. 2020, 146, 1999–2049. [Google Scholar] [CrossRef]
- Ramon, J.; Lledo, L.; Torralba, V.; Soret, A.; Doblas-Reyes, F.J. What global reanalysis best represents near-surface winds? Q. J. R. Meteorol. Soc. 2019, 145, 3236–3251. [Google Scholar] [CrossRef]
- Beck, H.E.; Pan, M.; Roy, T.; Weedon, G.P.; Pappenberger, F.; van Dijk, A.I.J.M.; Huffman, G.J.; Adler, R.F.; Wood, E.F. Daily evaluation of 26 precipitation datasets using Stage-IV gauge-radar data for the CONUS. Hydrol. Earth Syst. Sci. 2019, 23, 207–224. [Google Scholar] [CrossRef]
- van der Werf, G.R.; Randerson, J.T.; Giglio, L.; van Leeuwen, T.T.; Chen, Y.; Rogers, B.M.; Mu, M.Q.; van Marle, M.J.E.; Morton, D.C.; Collatz, G.J.; et al. Global fire emissions estimate during 1997–2016. Earth Syst. Sci. Data 2017, 9, 697–720. [Google Scholar] [CrossRef]
- Zhang, T.R.; Wooster, M.J.; de Jong, M.C.; Xu, W.D. How Well Does the “Small Fire Boost” Methodology Used within the GFED4.1s Fire Emissions Database Represent the Timing, Location and Magnitude of Agricultural Burning? Remote Sens. 2018, 10, 823. [Google Scholar] [CrossRef]
- Andela, N.; Morton, D.C.; Giglio, L.; Paugam, R.; Chen, Y.; Hantson, S.; van der Werf, G.R.; Randerson, J.T. The Global Fire Atlas of individual fire size, duration, speed and direction. Earth Syst. Sci. Data 2019, 11, 529–552. [Google Scholar] [CrossRef]
- Liu, J.Y.; Zhang, Z.X.; Xu, X.L.; Kuang, W.H.; Zhou, W.C.; Zhang, S.W.; Li, R.D.; Yan, C.Z.; Yu, D.S.; Wu, S.X.; et al. Spatial patterns and driving forces of land use change in China during the early 21st century. J. Geogr. Sci. 2010, 20, 483–494. [Google Scholar] [CrossRef]
- Kuang, W.H.; Chen, L.J.; Liu, J.Y.; Xiang, W.N.; Chi, W.F.; Lu, D.S.; Yang, T.R.; Pan, T.; Liu, A.L. Remote sensing-based artificial surface cover classification in Asia and spatial pattern analysis. Sci. China Earth Sci. 2016, 59, 1720–1737. [Google Scholar] [CrossRef]
- Jiang, T.; Su, B.D.; Wang, Y.J.; Wang, G.J.; Luo, Y.; Zhai, J.Q.; Huang, J.L.; Jing, C.; Gao, M.N.; Lin, Q.G.; et al. Gridded datasets for population and economy under Shared Socioeconomic Pathways for 2020–2100. Clim. Change Res. 2022, 18, 381–383. (In Chinese) [Google Scholar]
- Huang, J.L.; Qin, D.H.; Jiang, T.; Wang, Y.J.; Feng, Z.Q.; Zhai, J.Q.; Cao, L.G.; Chao, Q.C.; Xu, X.W.; Wang, G.F.; et al. Effect of fertility policy changes on the population structure and economy of China: From the perspective of the shared socioeconomic pathways. Earths Future 2019, 7, 250–265. [Google Scholar] [CrossRef]
- Otto-Bliesner, B.L.; Brady, E.C.; Fasullo, J.; Jahn, A.; Landrum, L.; Stevenson, S.; Rosenbloom, N.; Mai, A.; Strand, G. Climate Variability and Change Since 850 CE: An Ensemble Approach with the Community Earth System Model. Bull. Am. Meteorol. Soc. 2016, 97, 735–754. [Google Scholar] [CrossRef]
- Grillakis, M.; Voulgarakis, A.; Rovithakis, A.; Seiradakis, K.D.; Koutroulis, A.; Field, R.D.; Kasoar, M.; Papadopoulos, A.; Lazaridis, M. Climate drivers of global wildfire burned area. Environ. Res. Lett. 2022, 17, 045021. [Google Scholar] [CrossRef]
- Pinto, G.A.S.J.; Rousseu, F.; Niklasson, M.; Drobyshev, I. Effects of human-related and biotic landscape features on the occurrence and size of modern forest fires in Sweden. Agric. For. Meteorol. 2020, 291, 108084. [Google Scholar] [CrossRef]
- Schiks, T.J.; Wotton, B.M. Modifying the Canadian Fine Fuel Moisture Code for masticated surface fuels. Int. J. Wildland Fire 2015, 24, 79–91. [Google Scholar] [CrossRef]
- Han, L.S.; Braun, W.J. Block Bootstrap Calibration with Application to the Fire Weather Index. Commun. Stat. Simul. Comput. 2015, 44, 647–665. [Google Scholar] [CrossRef]
- Johnson, N.C.; Feldstein, S.B.; Tremblay, B. The Continuum of Northern Hemisphere Teleconnection Patterns and a Description of the NAO Shift with the Use of Self-Organizing Maps. J. Clim. 2008, 21, 6354–6371. [Google Scholar] [CrossRef]
- Kohonen, T. Essentials of the self-organizing map. Neural Netw. 2013, 37, 52–65. [Google Scholar] [CrossRef]
- Horton, D.E.; Johnson, N.C.; Singh, D.; Swain, D.L.; Rajaratnam, B.; Diffenbaugh, N.S. Contribution of changes in atmospheric circulation patterns to extreme temperature trends. Nature 2015, 522, 465–470. [Google Scholar] [CrossRef]
- Naserinejad, N.; Costanian, C.; Birot, O.; Barboni, T.; Roudier, E. Wildland fire, air pollution and cardiovascular health: Is it time to focus on the microvasculature as a risk assessment tool? Front. Physiol. 2023, 14, 1225195. [Google Scholar] [CrossRef]
- Koman, P.D.; Billmire, M.; Baker, K.R.; Carter, J.M.; Thelen, B.J.; French, N.H.F.; Bell, S.A. Using wildland fire smoke modeling data in gerontological health research (California, 2007–2018). Sci. Total Environ. 2022, 838, 156403. [Google Scholar] [CrossRef]
- Kim, M.K.; Kim, Y.H. Seasonal prediction of monthly precipitation in China using large-scale climate indices. Adv. Atmos. Sci. 2010, 27, 47–59. [Google Scholar] [CrossRef]
- Huang, C.; He, H.S.; Liang, Y.; Hawbaker, T.J.; Henne, P.D.; Xu, W.R.; Gong, P.; Zhu, Z.L. The changes in species composition mediate direct effects of climate change on future fire regimes of boreal forests in northeastern China. J. Appl. Ecol. 2021, 58, 1336–1345. [Google Scholar] [CrossRef]
- Luo, K.W.; Quan, X.W.; He, B.B.; Yebra, M. Effects of Live Fuel Moisture Content on Wildfire Occurrence in Fire-Prone Regions over Southwest China. Forests 2019, 10, 887. [Google Scholar] [CrossRef]
- Jolly, W.M.; Cochrane, M.A.; Freeborn, P.H.; Holden, Z.A.; Brown, T.J.; Williamson, G.J.; Bowman, D.M.J.S. Climate-induced variations in global wildfire danger from 1979 to 2013. Nat. Commun. 2015, 6, 7537. [Google Scholar] [CrossRef]
- Giannaros, T.M.; Papavasileiou, G. Changes in European fire weather extremes and related atmospheric drivers. Agric. For. Meteorol. 2023, 342, 109749. [Google Scholar] [CrossRef]
- Zhang, J.; Sheng, Z.; He, Y.; Zuo, X.J.; Jin, B.; He, M.Y. Analysis of the Impact of the 2019–20 Australian Bushfire Season on the Atmospheric Environment. Front. Earth Sci. 2021, 9, 566891. [Google Scholar] [CrossRef]
- Lyons, E.A.; Jin, Y.F.; Randerson, J.T. Changes in surface albedo after fire in boreal forest ecosystems of interior Alaska assessed using MODIS satellite observations. J. Geophys. Res. Biogeosci. 2008, 113, G02012. [Google Scholar] [CrossRef]
- Aragao, L.E.O.C.; Anderson, L.O.; Fonseca, M.G.; Rosan, T.M.; Vedovato, L.B.; Wagner, F.H.; Silva, C.V.J.; Silva, C.H.L.; Arai, E.; Aguiar, A.P. 21st Century drought-related fires counteract the decline of Amazon deforestation carbon emissions. Nat. Commun. 2018, 9, 536. [Google Scholar] [CrossRef] [PubMed]
- Dong, L.; Leung, L.R.; Qian, Y.; Zou, Y.F.; Song, F.F.; Chen, X.D. Meteorological Environments Associated with California Wildfires and Their Potential Roles in Wildfire Changes During 1984–2017. J. Geophys. Res. Atmos. 2021, 126, e2020JD033180. [Google Scholar] [CrossRef]
- Zhong, S.Y.; Yu, L.J.; Heilman, W.E.; Bian, X.D.; Fromm, H. Synoptic weather patterns for large wildfires in the northwestern United States-a climatological analysis using three classification methods. Theor. Appl. Climatol. 2020, 141, 1057–1073. [Google Scholar] [CrossRef]


| ID | Model Name | Institution and Country | Atmospheric Resolution (lon × lat: Number of Grids, L: Vertical Levels) |
|---|---|---|---|
| 1 | ACCESS-CM2 * | Commonwealth Scientific and Industrial Research Organization, Australian Research Council Centre of Excellence for Climate System Science, Australia | 192 × 145, L85 |
| 2 | ACCESS-ESM1-5 * | Commonwealth Scientific and Industrial Research Organization, Australia | 192 × 145, L38 |
| 3 | CanESM5 * | Canadian Centre for Climate Modelling and Analysis, Canada | 128 × 64, L49 |
| 4 | CMCC-ESM2 * | Euro-Mediterranean Centre for Climate Change Foundation, Italy | 288 × 192, L30 |
| 5 | EC-Earth3 * | EC-Earth Consortium, Europe | 512 × 256, L91 |
| 6 | FGOALS-g3 * | Chinese Academy of Sciences, China | 180 × 80, L26 |
| 7 | GFDL-CM4 * | National Oceanic and Atmospheric Administration, Geophysical FluidDynamics Laboratory, USA | 288 × 180, L49 |
| 8 | INM-CM4-8 * | Institute for Numerical Mathematics, Russia | 180 × 120, L21 |
| 9 | INM-CM5-0 * | Institute for Numerical Mathematics, Russia | 180 × 120, L73 |
| 10 | IPSL-CM6A-LR * | Institute Pierre Simon Laplace, France | 144 × 143, L79 |
| 11 | MIROC6 * | Atmosphere and Ocean Research Institute, The University of Tokyo, Japan | 256 × 128, L81 |
| 12 | MIROC-ES2L * | National Institute for Environmental Studies, The University of Tokyo, Japan | 128 × 64, L40 |
| 13 | MPI-ESM1-2-HR * | Max Planck Institute for Meteorology, Germany | 384 × 192, L95 |
| 14 | MPI-ESM1-2-LR * | Max Planck Institute for Meteorology, Alfred Wegener Institute, Germany | 192 × 96, L47 |
| 15 | MRI-ESM2-0 * | Meteorological Research Institute, Japan | 320 × 160, L80 |
| 16 | NorESM2-LM * | NorESM Climate Modeling Consortium, Norway | 144 × 96, L32 |
Disclaimer/Publisher’s Note: The statements, opinions and data contained in all publications are solely those of the individual author(s) and contributor(s) and not of MDPI and/or the editor(s). MDPI and/or the editor(s) disclaim responsibility for any injury to people or property resulting from any ideas, methods, instructions or products referred to in the content. |
© 2025 by the authors. Licensee MDPI, Basel, Switzerland. This article is an open access article distributed under the terms and conditions of the Creative Commons Attribution (CC BY) license (https://creativecommons.org/licenses/by/4.0/).
Share and Cite
Bai, M.; Zhang, P.; Xing, P.; Du, W.; Hao, Z.; Zhang, H.; Shi, Y.; Liu, L. Spatiotemporal Characteristics, Causes, and Prediction of Wildfires in North China: A Study Using Satellite, Reanalysis, and Climate Model Datasets. Remote Sens. 2025, 17, 1038. https://doi.org/10.3390/rs17061038
Bai M, Zhang P, Xing P, Du W, Hao Z, Zhang H, Shi Y, Liu L. Spatiotemporal Characteristics, Causes, and Prediction of Wildfires in North China: A Study Using Satellite, Reanalysis, and Climate Model Datasets. Remote Sensing. 2025; 17(6):1038. https://doi.org/10.3390/rs17061038
Chicago/Turabian StyleBai, Mengxin, Peng Zhang, Pei Xing, Wupeng Du, Zhixin Hao, Hui Zhang, Yifan Shi, and Lulu Liu. 2025. "Spatiotemporal Characteristics, Causes, and Prediction of Wildfires in North China: A Study Using Satellite, Reanalysis, and Climate Model Datasets" Remote Sensing 17, no. 6: 1038. https://doi.org/10.3390/rs17061038
APA StyleBai, M., Zhang, P., Xing, P., Du, W., Hao, Z., Zhang, H., Shi, Y., & Liu, L. (2025). Spatiotemporal Characteristics, Causes, and Prediction of Wildfires in North China: A Study Using Satellite, Reanalysis, and Climate Model Datasets. Remote Sensing, 17(6), 1038. https://doi.org/10.3390/rs17061038