Article

A Big Data Approach for the Regional-Scale Spatial Pattern Analysis of Amazonian Palm Locations

by
Matthew J. Drouillard
1,* and
Anthony R. Cummings
2
1
Geospatial Information Sciences, School of Economic, Political and Policy Sciences, University of Texas at Dallas, Richardson, TX 75080, USA
2
Department of Earth and Environmental Sciences, Wesleyan University, Middletown, CT 06459, USA
*
Author to whom correspondence should be addressed.
Remote Sens. 2025, 17(5), 784; https://doi.org/10.3390/rs17050784
Submission received: 11 December 2024 / Revised: 13 February 2025 / Accepted: 19 February 2025 / Published: 24 February 2025
(This article belongs to the Special Issue Advancements in Environmental Remote Sensing and GIS)

Abstract

:
Arecaceae (palms) are an important resource for indigenous communities as well as fauna populations across Amazonia. Understanding the spatial patterns and the environmental factors that determine the habitats of palms is of considerable interest to rainforest ecologists. Here, we utilize remotely sensed imagery in conjunction with topography and soil attribute data and employ a generalized cluster identification algorithm, Hierarchical Density-Based Spatial Clustering of Applications with Noise (HDBSCAN), to study the underlying patterns of palms in two areas of Guyana, South America. The results of the HDBSCAN assessment were cross-validated with several point pattern analysis methods commonly used by ecologists (the quadrat test for complete spatial randomness, Morista Index, Ripley’s L-function, and the pair correlation function). A spatial logistic regression model was generated to understand the multivariate environmental influences driving the placement of cluster and outlier palms. Our results showed that palms are strongly clustered in the areas of interest and that the HDBSCAN’s clustering output correlates well with traditional analytical methods. The environmental factors influencing palm clusters or outliers, as determined by logistic regression, exhibit qualitative similarities to those identified in conventional ground-based palm surveys. These findings are promising for prospective research aiming to integrate remote flora identification techniques with traditional data collection studies.

1. Introduction

Arecaceae (palms) are an important resource for indigenous communities [1,2,3] and fauna populations [4] in the Amazon region. As such, understanding the spatial patterns and environmental determinants of the growth habitats of palms is of considerable interest to rainforest ecologists. Scholars have long been interested in understanding how environmental variables, such as topography and soil fertility, affect the distribution of palms (and other tree species) [5,6,7,8,9,10,11,12,13], as well as delineating variations in species habitat distributions on local and regional scales [14,15,16]. The design of these studies frequently involves selecting discrete areas ranging from tens to hundreds of hectares in size and manually surveying for features within the species of interest, within that defined area. Concurrently, environmental parameters of interest are recorded adjacent to the features of interest (see Salm et al. [10] or Zuleta et al. [13] for examples of site selection and sampling design). Ecologists frequently employ spatial point pattern analysis (SPPA) to illuminate the ecological processes that shape the patterns found in surveyed data. These statistical methods are established tools for obtaining information about environmental processes from point data [17]. Ben-Said [18] asserts that the SPPA methods most commonly applied by forest ecologists are Ripley’s K or Ripley’s L-function [19,20], the pair correlation function [21], and O-ring function [22]. Because detailed information on the size of and differentiation in species is available within the catalog of field studies, as described previously, it is possible to infer processes related to seed propagation or the attraction or repulsion of different species, both of which are potentially influenced by environmental variables, using techniques such as marked pair correlation [23].
The remote sensing and image interpretation techniques that have emerged in recent years offer a unique perspective on rainforest palm surveys [24,25,26,27]. Remote sensing platforms are available in numerous different configurations, from satellite-based to unmanned aerial vehicles and from active to passive sensors [28]. In this study, we will only discuss the application of Very-High-Resolution (VHR) satellite imagery in the identification of palms within a rainforest setting. VHR imagery is defined as having a multispectral resolution of 2 to 3 m, with a panchromatic band resolution of 0.5 m; by the pan-sharpening process [29], one can effectively arrive at a multispectral resolution of 0.5 m. This resolution is sufficient to resolve features such as individual palms (even when clustered or overlapped) or tree crowns (applying the concept of the “sampling rate is twice as fine as the size of the feature to be detected” [30]). However, without a well-defined difference in the spectral response between palm species [31,32], it is very difficult to differentiate palm species simply by the overall shape of their palm crown as seen from a satellite sensor. Additionally, since the satellite is a passive sensor, it does not have the capability to view the subcanopy. Therefore, palms surveyed via remotely detected cataloging are effectively a subsample of the palms in a given area, as one can only discern presumably fully mature samples that have emerged from the canopy, while missing potential specimens such as juveniles that are hidden from view under the cover of the rainforest canopy ([33], pp. 542–544). Lastly, since an individual is not performing a manual survey in situ, there is no granular information available on the local environmental conditions and fine-scale changes that could affect the spatial patterns observed in the data.
Despite these inherent limitations, remotely sensed surveys have a significant advantage in that they provide extensive spatial coverage while maintaining high spatial resolution in the captured features (i.e., they have the capacity to distinguish features of interest within meters of each other). Consequently, it is pertinent to pose analogous inquiries to those in manual survey studies, such as examining the distribution of features and, if clustering is observed, identifying the distinction between cluster and outlier features. In this study, we investigate the following research question: can data derived from the remote sensing of flora effectively identify the determinants influencing the distribution of clusters or outliers in a manner consistent with the results of traditional ground-based survey methodologies?
This research addresses this question by adopting a Big Data methodology, supported by conventional point pattern analysis techniques, to illuminate the topographic and environmental determinants governing the spatial distribution of Amazonian palms in Guyana. Using 472,753 palm individuals identified through the remote sensing satellite imagery presented in [34], in conjunction with remotely sensed data on topography and predicted soil attributes, this study will conduct a spatially continuous analysis of the clustering and distribution of palms over 985 square kilometers. Acknowledging the difficulty of interpreting flora processes from remote sensing alone, this research offers insights into integrating this work with detailed ground-based studies. We believe this integration enhances our understanding of palm distributions and environmental factors beyond the reach of traditional surveys, bridging the use ground-based ecological research and remote sensing techniques.
In this study, we achieve the following:
(1)
Test our hypothesis. H O : Palms are randomly distributed on a regional scale. H A : Palms are clustered on a regional scale.
(2)
Investigate the pattern in the distribution of palms using appropriate statistical techniques.
(3)
Determine the correlation between palm distribution and environmental features, including cation exchange capacity, distance to drainage channels, elevation, nitrogen content, pH of soil water, sand content, slope, and the volume of the soil water.
(4)
Construct a logistic regression to identify multivariate responses to the presence or absence of palm features.
(5)
Compare the results from our model of remotely sensed palm locations with published ground-based palm ecological studies.

2. Materials and Methods

The area of interest for this study is south central Guyana, South America. Area of interest 1 (AOI-1) is centered at 59.04°W, 4.04°N and approximately 76% of it is covered by forest, with the remainder savanna or obscured by cloud or shadow, as determined by pixel classification of the image scene (see [34]). The terrain is generally flat, punctuated by approximately one dozen mountain peaks that rise abruptly from the forest to a maximum height of 438 m. Area of interest 2 (AOI-2) is 215 km southwest of AOI-1, centered at 59.2°W, 2.1°N. This scene is 86% forest, with the remainder savanna or concealed by cloud/shadow. The terrain is marked by the Marudi Mountains in the northeast of the scene, which have a maximum elevation of 529 m. The terrain slopes gently from the mountains south to the Parabara River, located in the southern third of the scene. Likewise, the southern edge of the scene slopes gently north to drain into the Parabara River as well.
The features of interest were extracted from satellite imagery as described in [34]. Species differentiation is not possible due to the lack of variable spectral responses between palms and insufficient resolution to identify different palms through their crown structure. However, species of palms known to reside in the areas of interest include Astrocaryum aculeatum, Astrocaryum vulgare, Attalea maripa, Euterpe oleracea, Manicaria saccifera, Mauritia flexuosa, Oenocarpus bacaba, and Oenocarpus bataua [3]. Each palm feature has a confidence level, assigned as an output of the detection algorithm, that ranges from 50% to 100%. AOI-1 was recorded on 31 December 2010, covers 348 square kilometers, and contains 194,483 palm features with a mean confidence of 77.4%, median of 78.0%, and standard deviation of 14.9%. AOI-2 was recorded on 14 June 2011, covers 637 square kilometers, and contains 278,270 palm features with a mean confidence of 83.5%, a median of 88.9%, and a standard deviation of 14.8%. As discussed in [34], each palm does have an associated crown diameter measurement which has the potential to be used for marked pattern analysis. However, because of the strong normal distribution seen and the small standard deviations of their crown diameters, we decided to forgo these measurements in favor of a univariate analysis. Within each area of interest (AOI), zones of interest (ZOI) were delineated according to their topographic positions and assumed variations in palm distribution due to proximity to various topographic features.

2.1. Elevation Model and Its Derivatives

A digital elevation model (DEM) was obtained for each AOI from the Shuttle Radar Topography Mission (SRTM), which is available in 30-m resolution and was collected in February 2000. This elevation dataset details the height of the canopy. Despite this, given the scale of our analysis, it is reasonable to assume that the canopy height is a good analog of the underlying ground surface height and therefore represents broad-scale variations in overall surface variability [35]. From the DEM, the slope is calculated to assess the impact of this variable on the placement of the relevant features. In addition, a standard geospatial hydrology workflow was carried out to identify primary drainage pathways within the AOI. The Hack stream ordering method [36] was applied due to the relative simplicity of its interpretation; a value of 1 indicates a primary channel to which all tributaries ultimately flow, and increasing values indicate smaller flow channels (e.g., an order 2 channel will have more tributaries than an order 3 one, and the channel with the highest value will not have tributaries). It is important to note that within the context of this analysis, this stream ordering is not meant to imply the presence of fully developed rivers, streams, creeks, or other waterways traversing the rainforest, but is simply a means of distinguishing drainage pathways of potentially greater magnitude than others based on elevation data. In reality, the identified drainage pathways may be nothing more than minor depressions, ephemeral creeks, or may indeed be waterways that flow year round (Figure 1). The only visible and validated waterway in either scene is the Parabara River within AOI-2.

2.2. Soil Data

Information concerning key soil characteristics was obtained from SoilGrids 2.0 [37]. SoilGrids is a global-scale product of the International Soil Reference and Information Centre (ISRIC) World Soil Information Service that uses quantile regression forests, approximately 240,000 soil observations, and more than 400 environmental covariates to model soil properties at a resolution of 250 m. In this study, the soil properties examined were the cation exchange capacity ( mmol ( c ) kg ), the nitrogen content ( cg kg ), the pH of the soil ( pH × 10 ), the sand content ( g kg ), and the volume of the soil water at −10 kPA ( ( cm 3 10 2 cm 3 ) 10 ) [38]. Each variable was examined at a selected depth of 15–30 cm below the surface. The selection of these covariates was influenced by those used in [39].

2.3. Pattern Analysis

Traditional spatial point pattern analysis (SPPA) was performed in RStudio 2024.04.2 software primarily using the package spatstat (version 3.0-8) [40]. For each zone of interest (ZOI), a complete spatial randomness (CSR) test was performed using the quadrat counts method [41], with an alternative hypothesis of the palms being clustered. As each ZOI is 1 km by 1 km square, the quadrat tessellations were set to a 10 by 10 matrix, or 1 hectare squares. The Pearson χ 2 statistic was calculated by counting, in each quadrant, the actual count of features and comparing it to the expected count of features assuming CSR; a χ 2 test was performed to compare this with the χ 2 distribution determined from the model parameters. A p-value of less than 0.05 suggests clustered point behavior. The values of the observed number of points in each quadrat were also used to select a minimum cluster size for the nonparametric clustering algorithm; of all ZOI, the 1st quartile value of 6 from the count distribution was chosen.
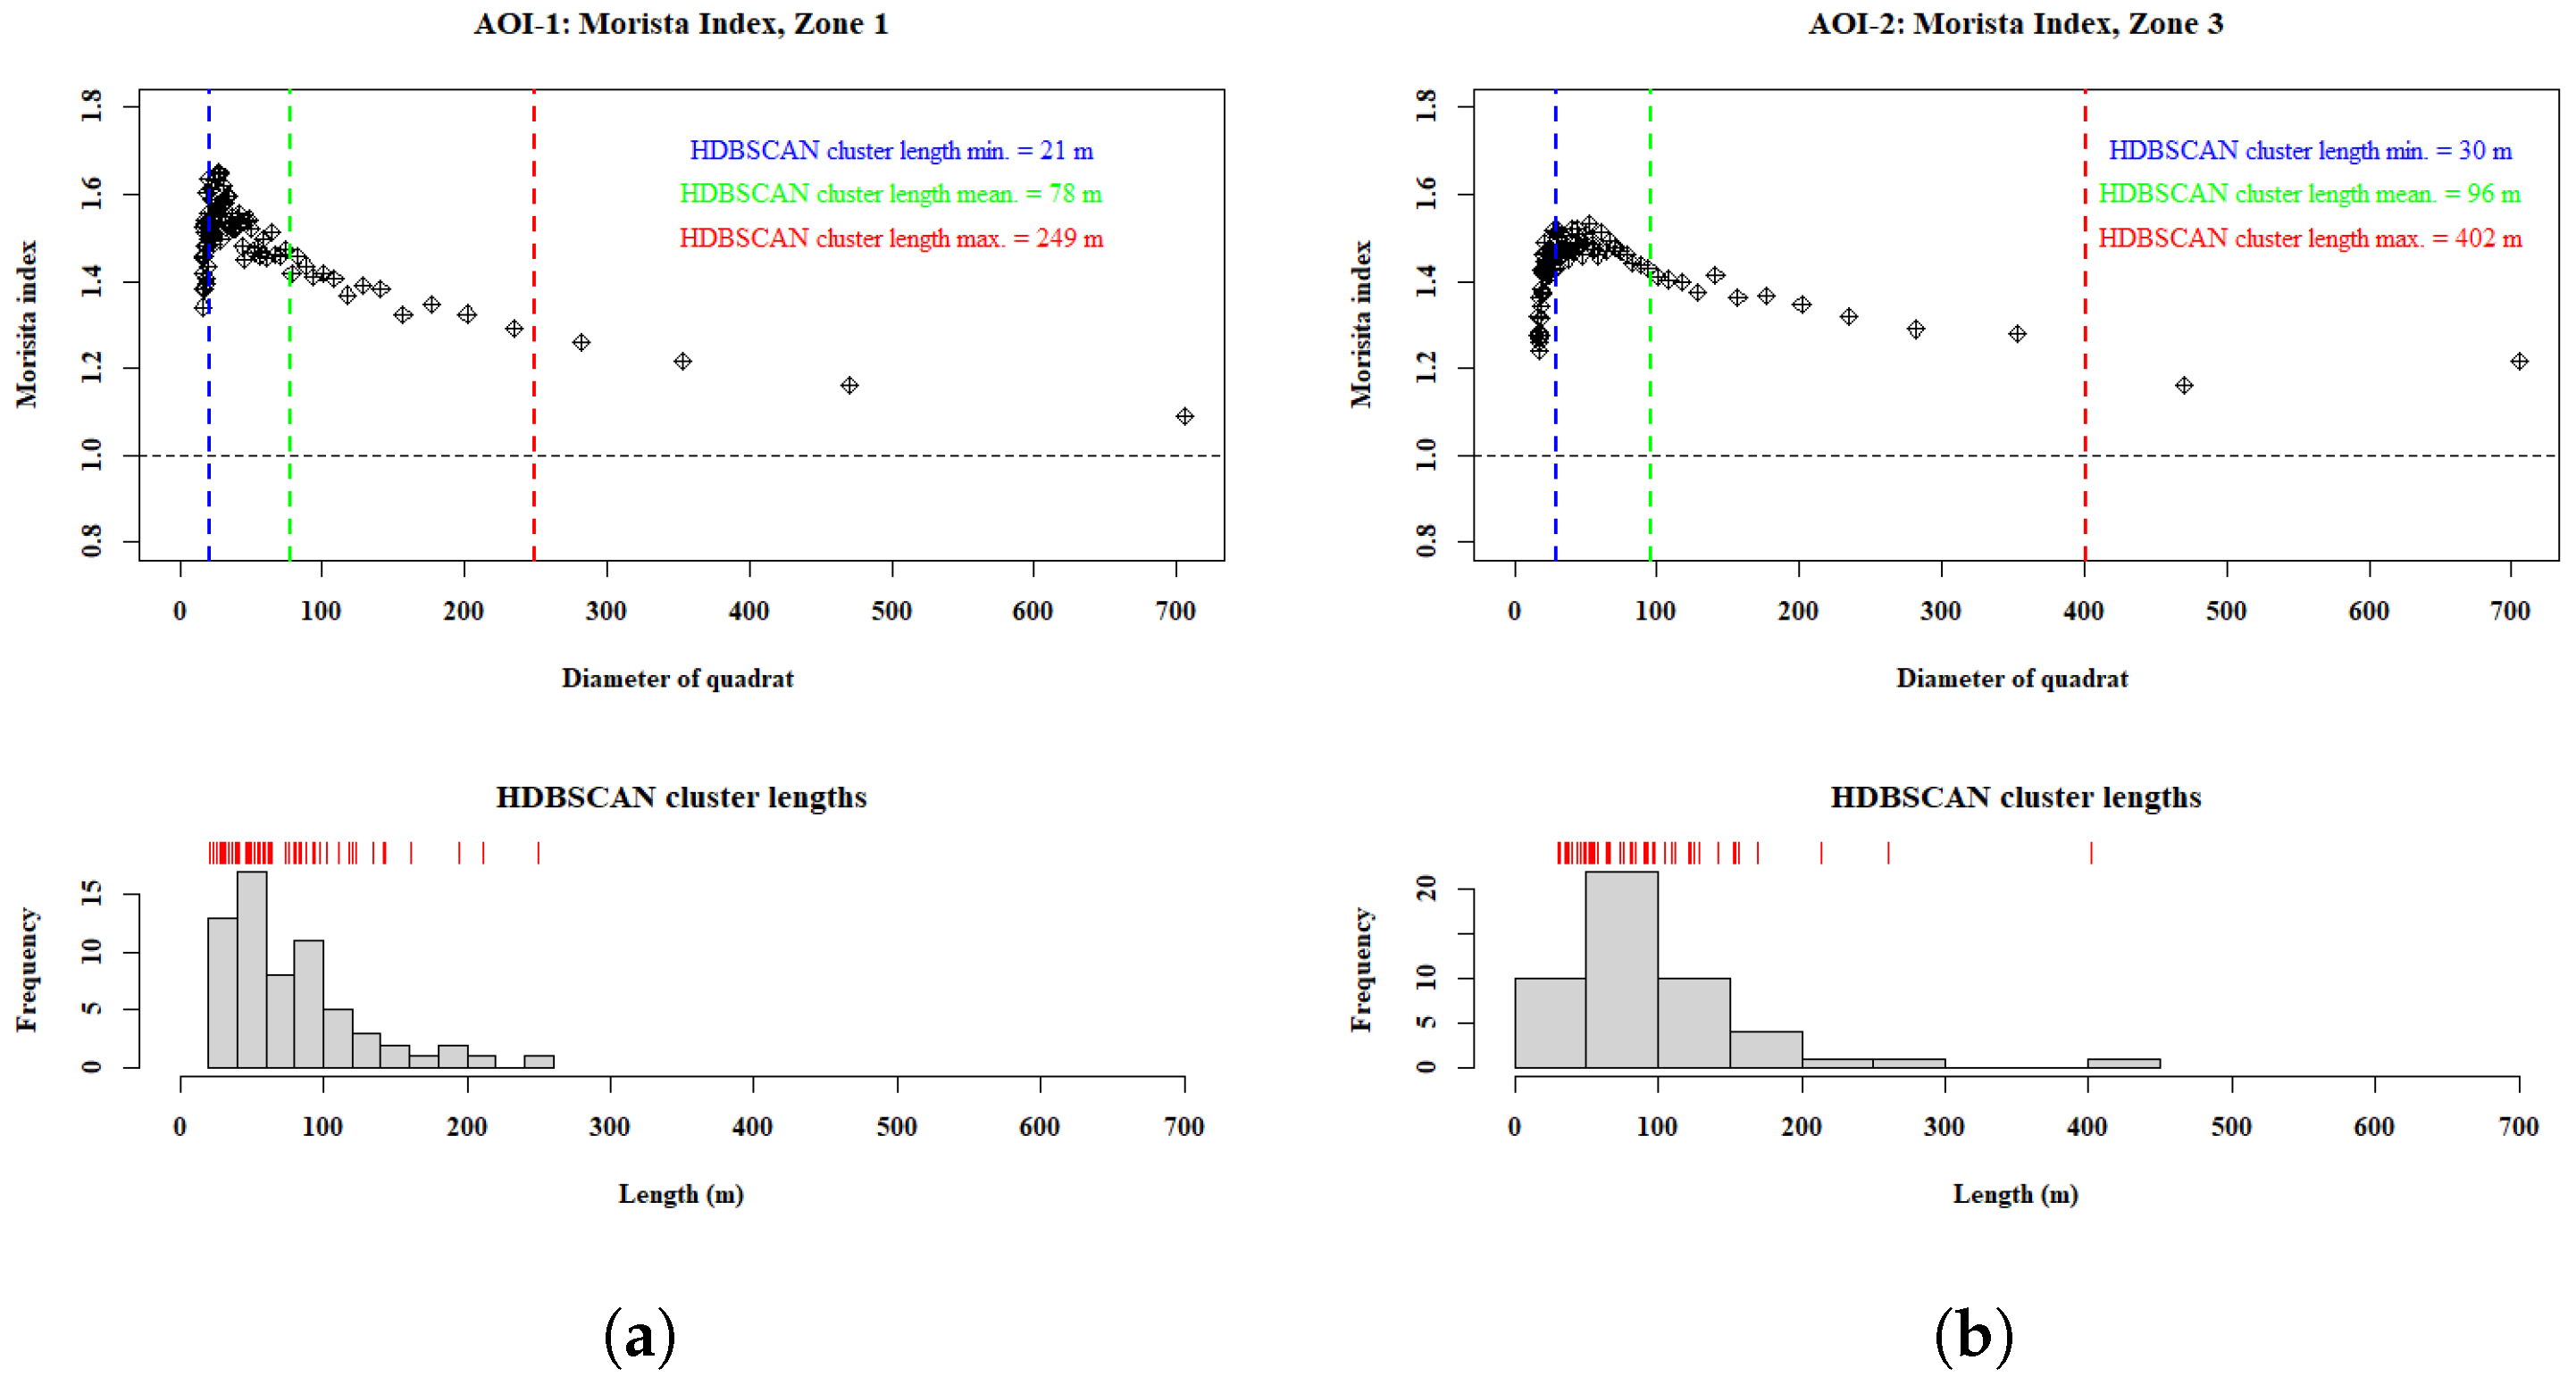
The Morista Index plot [42] was used to test the presence of clustering and quantify the interaction scales between palm features. This function tessellates the ZOI into equal quadrats of increasing sizes, computes the Morista Index for each quadrat size, and plots the results against the linear dimension of the quadrat. Morista Index values greater than 1 indicate clustering, while CSR is indicated by index values of approximately 1. The magnitude of the Morista Index at the given quadrat size yields some interpretable information about the scales of interaction for the point features.
Ripley’s L-function [20], specifically its inhomogeneous implementation [43], was used to assess the accumulative scales of interaction for the palm specimens based on the results of the CSR tests. The L-function is simply the square root of the K-function [19], which seeks to identify the expected count of points within some distance r from an arbitrary point i and divide this count by the intensity λ , where λ = N π r 2 . If the expected value matches the actual value, the function follows a linear trend; if not, the function deviates from the expected trend in such a way that it is interpreted as an attraction or repulsion of features [22]. The inhomogeneous L-function allows for the intensity λ to vary within the region, thus avoiding the biases that occur when attempting to apply and interpret the standard L-function using a non-stationary point pattern set. Simulations were used to develop envelopes of significance for departures from CSR; for each L-function, 99 simulations were run and the simulated data patterns were fixed such that they contained the same number of points as the original data pattern. Edge correction is an important requirement to avoid neighborhood sampling bias in point data analyses [44]; here, the Translation method [45] was utilized, as the Ripley edge correction method makes assumptions about the isotropic nature of the spatial data pattern that we cannot reasonably apply to this dataset. The radius of investigation was manually set to r = [ 0 , 1 , 2 , , 250 ] m.
The pair correlation function (PCF) [21] is a non-cumulative counterpart to the L-function. While the L-function views all points j from reference point i at varying radius r from point i, the PCF uses a ring structure to view different densities of the points j at varying radii r from the reference point i. This generates a probability density graph from which one may identify the radius r from some arbitrary point i at which the maximum neighborhood density occurs. For forest structures, this can be interpreted as the so-called critical scales of distance that may be related to biological processes ([22], p. 225). As with the calculations of the L-function, the inhomogeneous implementation of the PCF was used and 99 simulations were run, with the number of simulated points set as equal to the number of original points. Likewise, the Translation edge correction method was applied and a radius of investigation of r = [ 0 , 1 , 2 , , 250 ] meters was utilized.
Nontraditional pattern analysis was performed using the Hierarchical Density-Based Spatial Clustering of Applications with Noise (HDBSCAN) algorithm [46], implemented in ESRI ArcGIS 3.2. A wide variety of clustering algorithms are available for numerous applications, yet not all clustering algorithms make practical sense for interpreting biological processes. They may require parameters unknown to the analyst, require the analyst to dictate the number of clusters beforehand, be sensitive to odd shapes or outliers, or, as previously mentioned, make unreasonable assumptions regarding the density distribution of the point data [47]. HDBSCAN is a nonparametric clustering algorithm. It being nonparametric does not refer to a lack of user input, although there are relatively few inputs, but instead to the algorithm’s lack of assumption about the density distribution of the underlying data. The algorithm is capable of generating clusters and identifying outliers which are not solely attributable to the misconfiguration of algorithm parameters (e.g., the inaccurate specification of a search radius) but are derived through data-driven methodologies. Given that this study uses a biological dataset for which we cannot, due to the limitations of remotely sensed data, do the following:
(1)
Reasonably attribute clustering to parent–child effects;
(2)
Make connections concerning inter-species competition.
HDBSCAN is an attractive candidate to attempt to identify clustering. It operates unsupervised, allows for variations in feature density and arbitrary cluster geometry, and has only a single input: the minimum number of points needed to define a cluster. (Note: while Python implementations of HDBSCAN do give us the option to alter numerous algorithm parameters, we have opted to follow ([46] [p. 5:9]), who define the sole parameter as being the minimum cluster size,  m p t s .) The outliers produced by the algorithm are free from any subjective bias from the analyst, save for the specification of the minimum cluster size, which is also a data-driven parameter in this study (6, taken from the 1st quartile of the count distribution from the quadrat analysis test for CSR). The outputs of interest from the algorithm are cluster points (with attributed cluster ID numbers), outlier points, and the attribute “exemplar”, or the most representative palm features in the cluster. The cluster and outlier points are subsequently used as inputs for the logistic regression model.

2.4. Juxtaposition of Traditional vs. Nontraditional Pattern Analysis

The traditional SPPA methods of the Morista Index plot, Ripley’s L-function, and the pair correlation function each inherently seek to identify some sense of the scale of interaction between points in a spatial pattern. The nontraditional method of HDBSCAN merely outputs the original point pattern set with new attributes that identify the points as clusters (and the cluster to which they belong) or outliers. To validate the nontraditional against the traditional methods, we have split the point sets for each AOI into cluster and outlier sets. Next, we grouped each cluster set by its cluster ID and applied a minimum bounding geometry calculation, using the convex hull method. This captures the surface area that each cluster occupies, providing measurable geometry to validate HDBSCAN clusters against those from traditional SPPA methods. From the convex hull calculation, the width and length values of the polygons are available. In this comparison, we focus on the length measurement, which is the largest of the two dimensions.
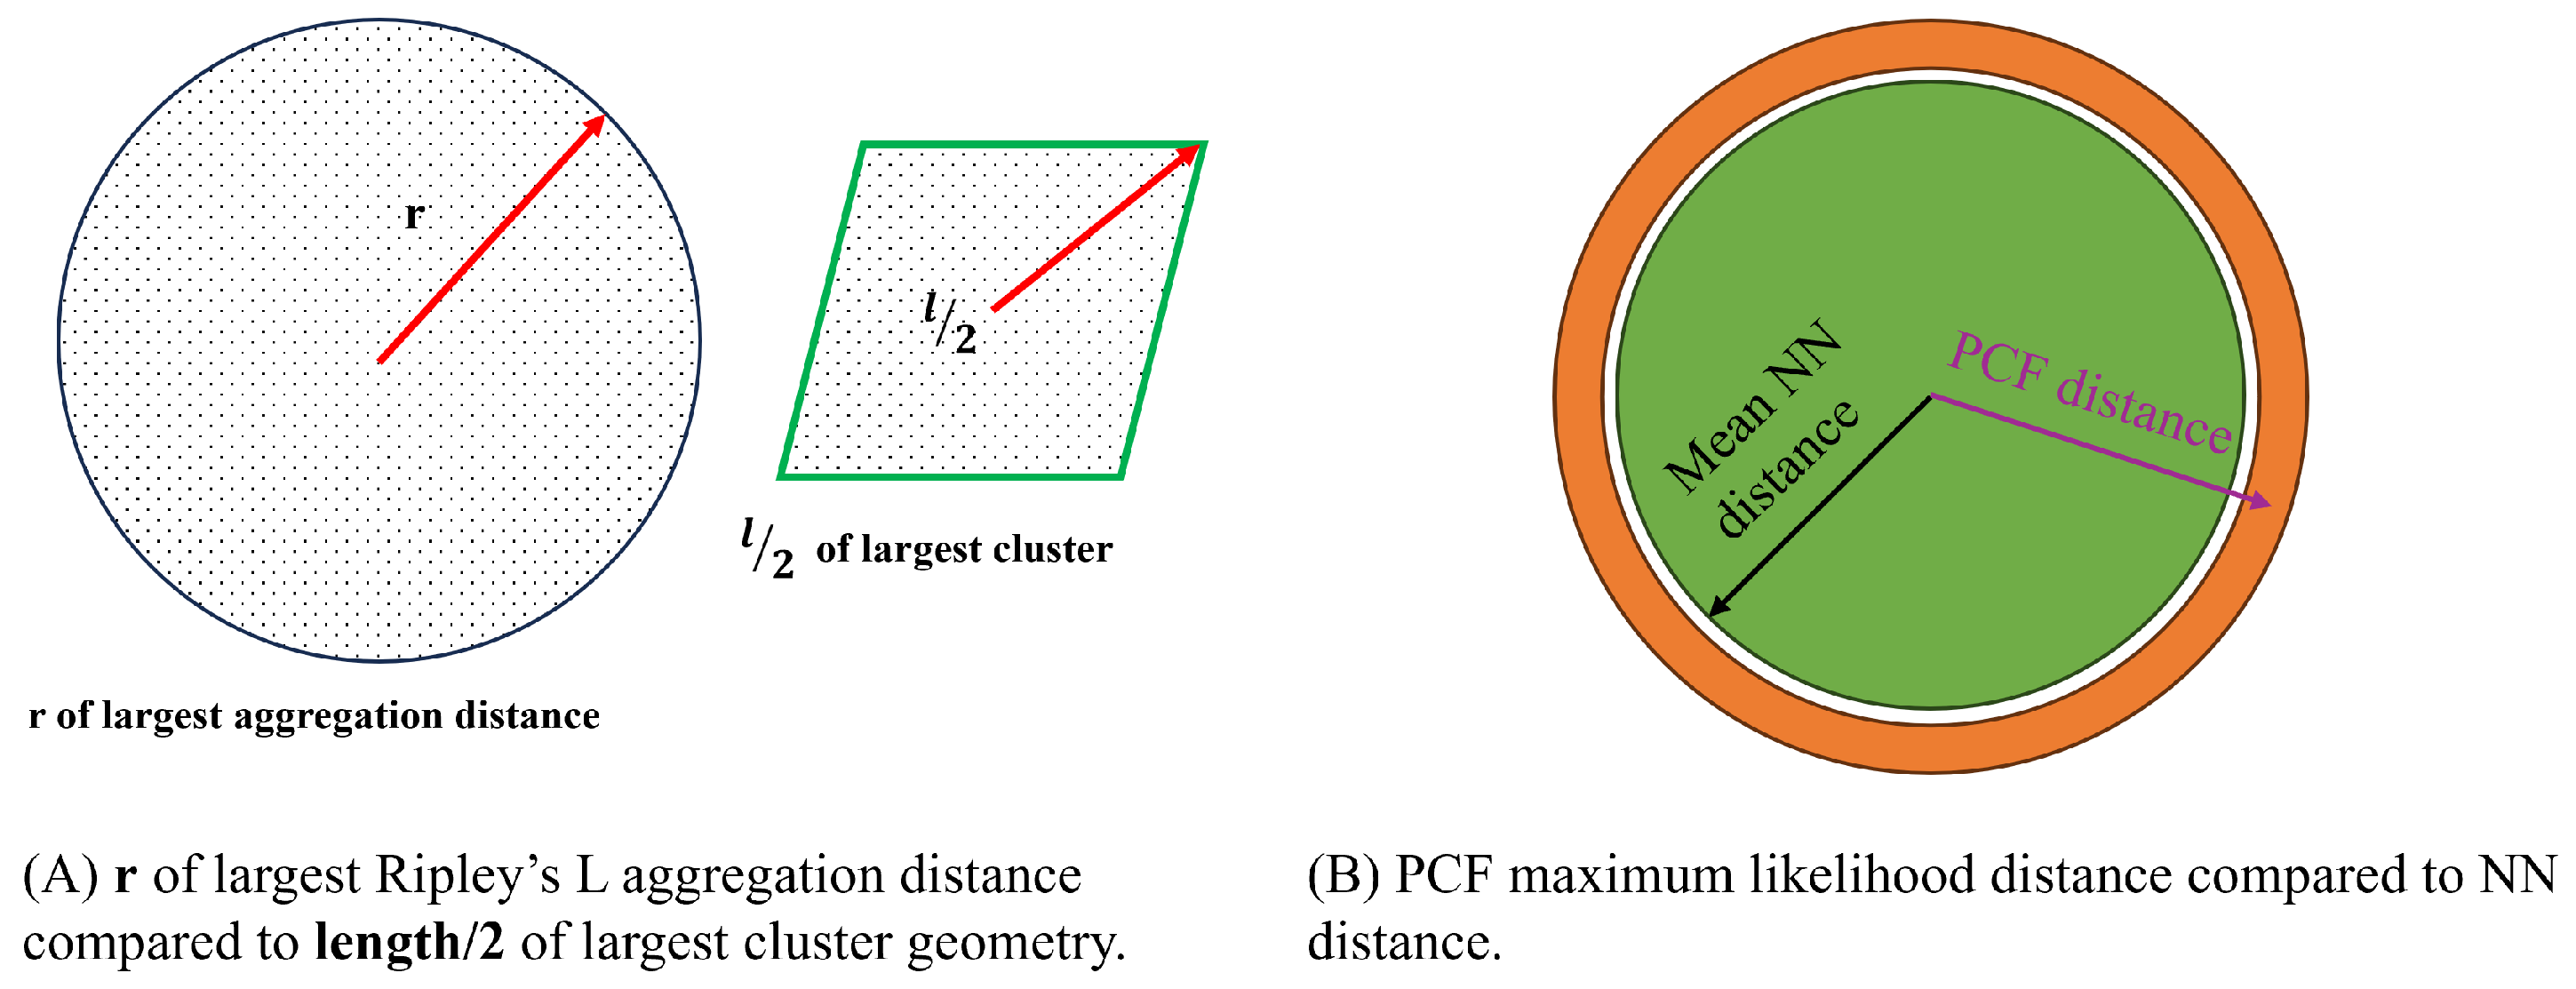
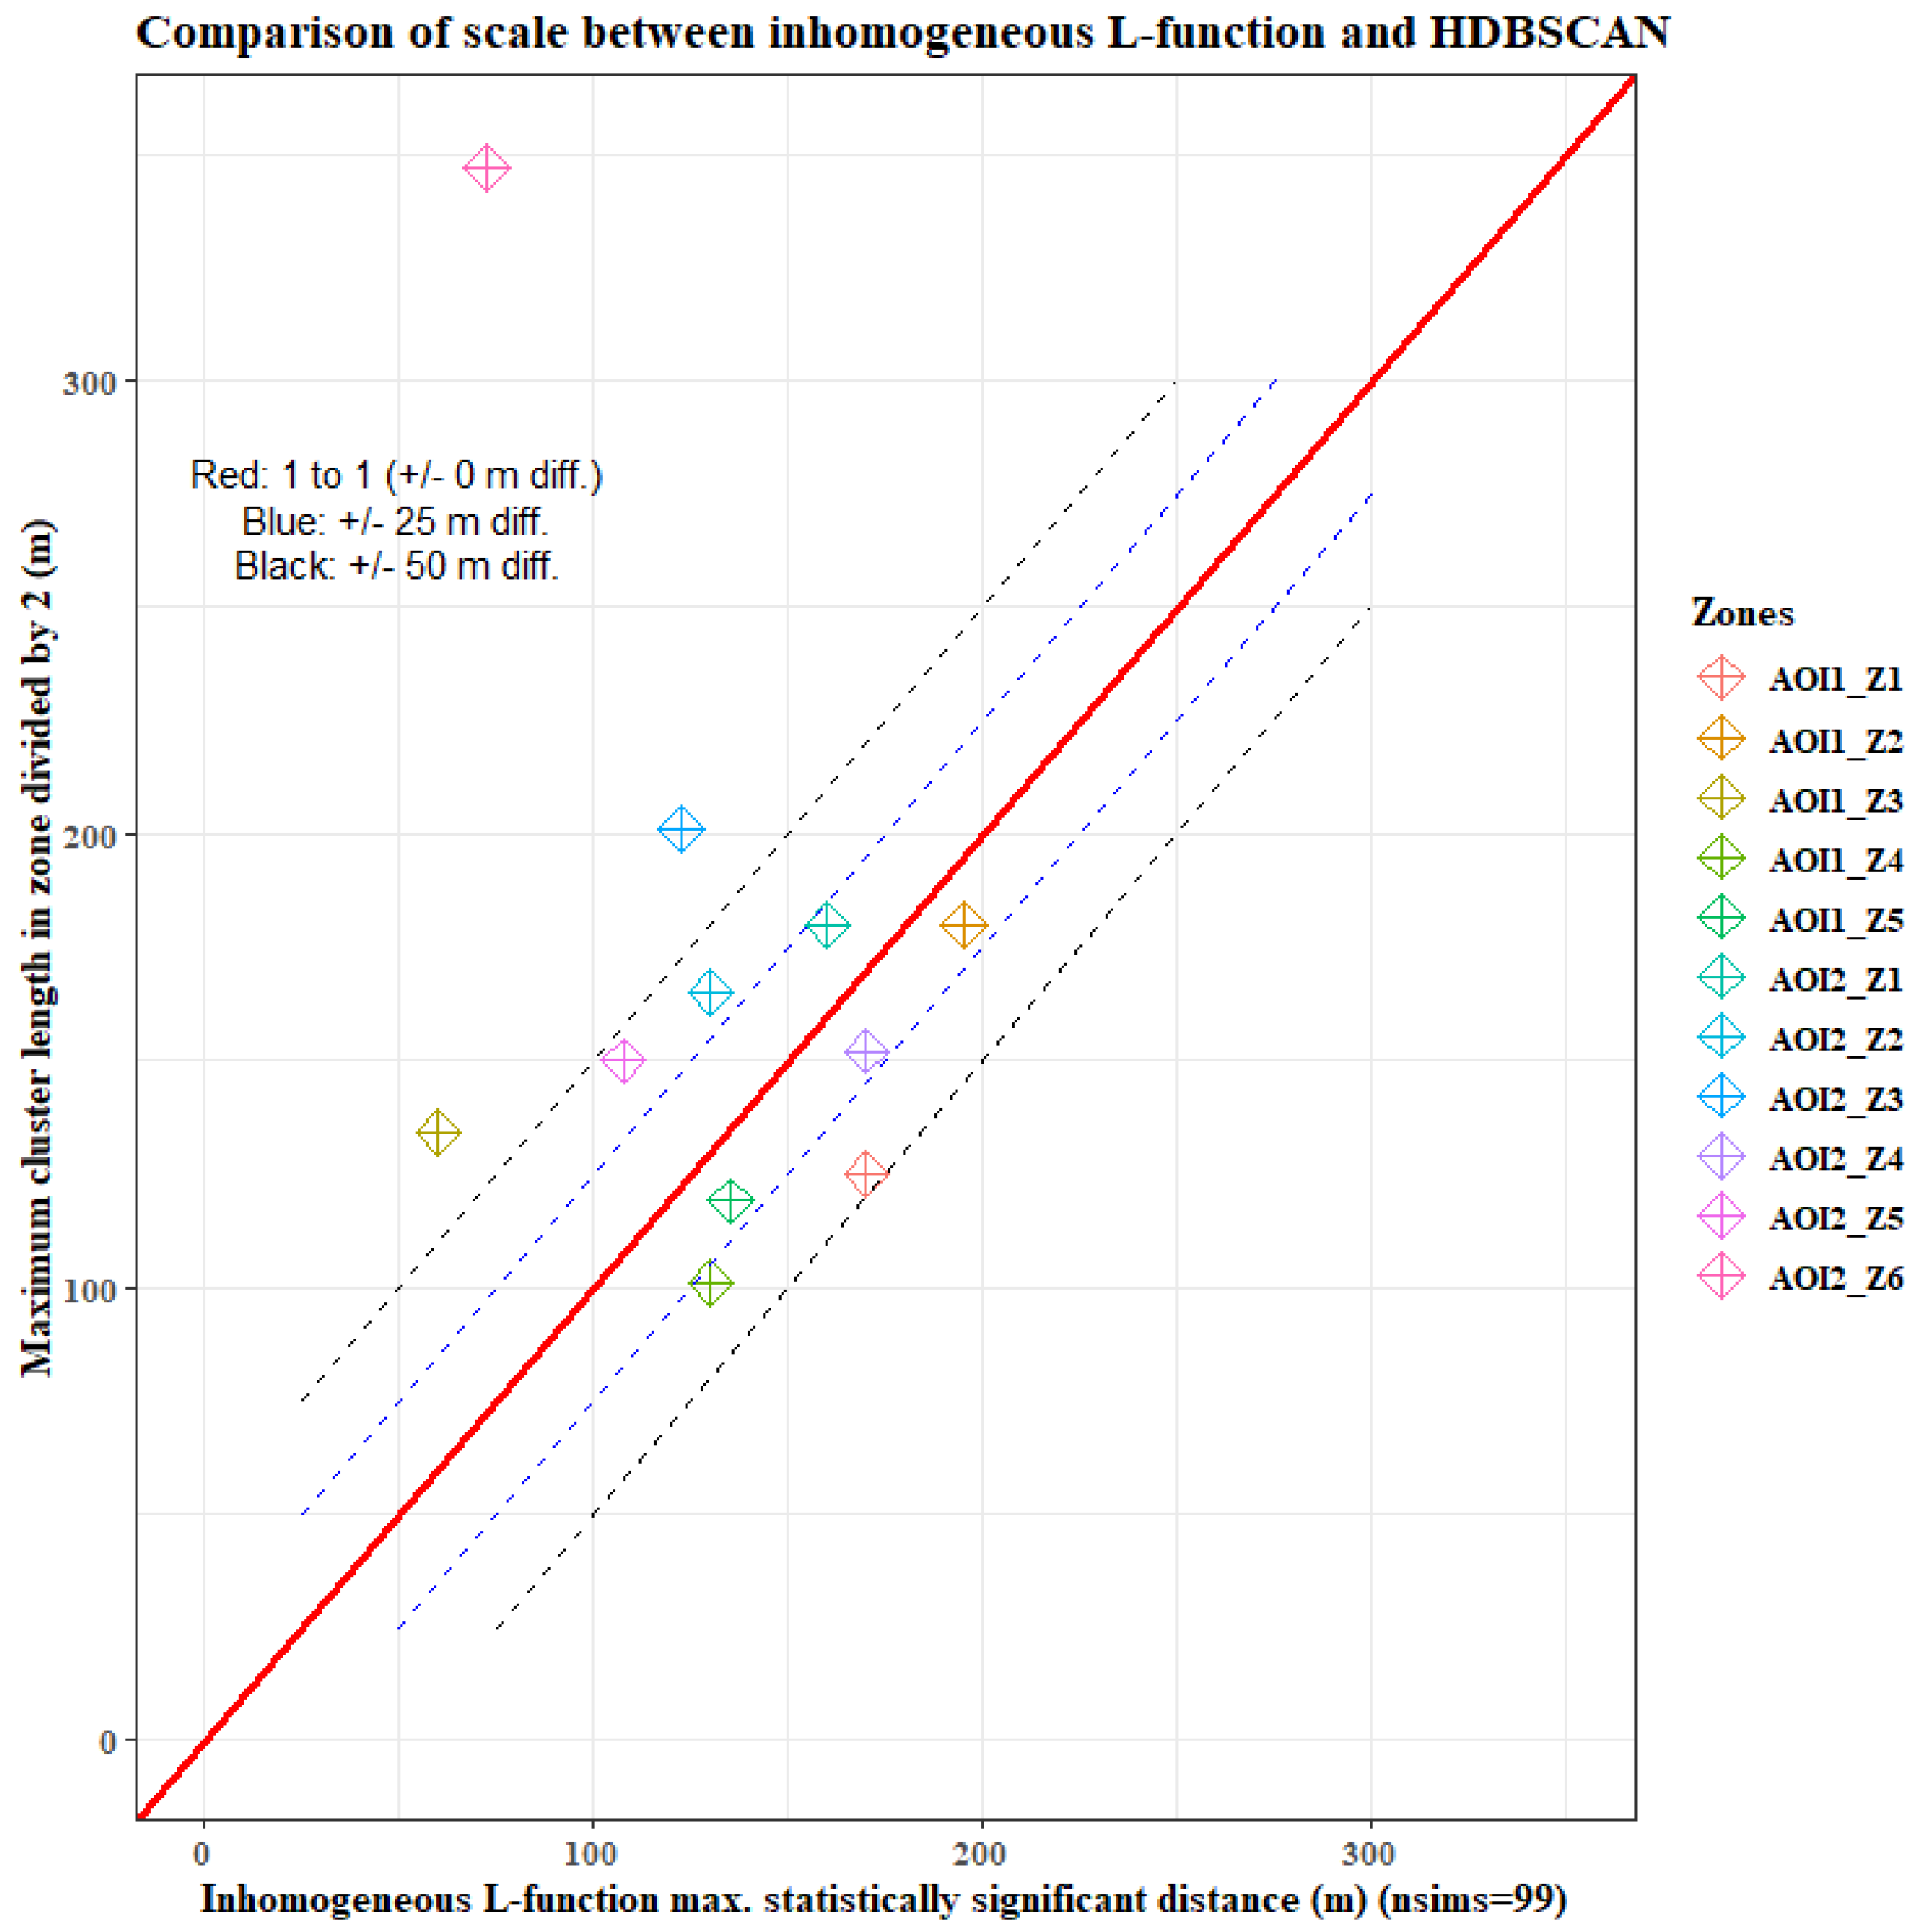
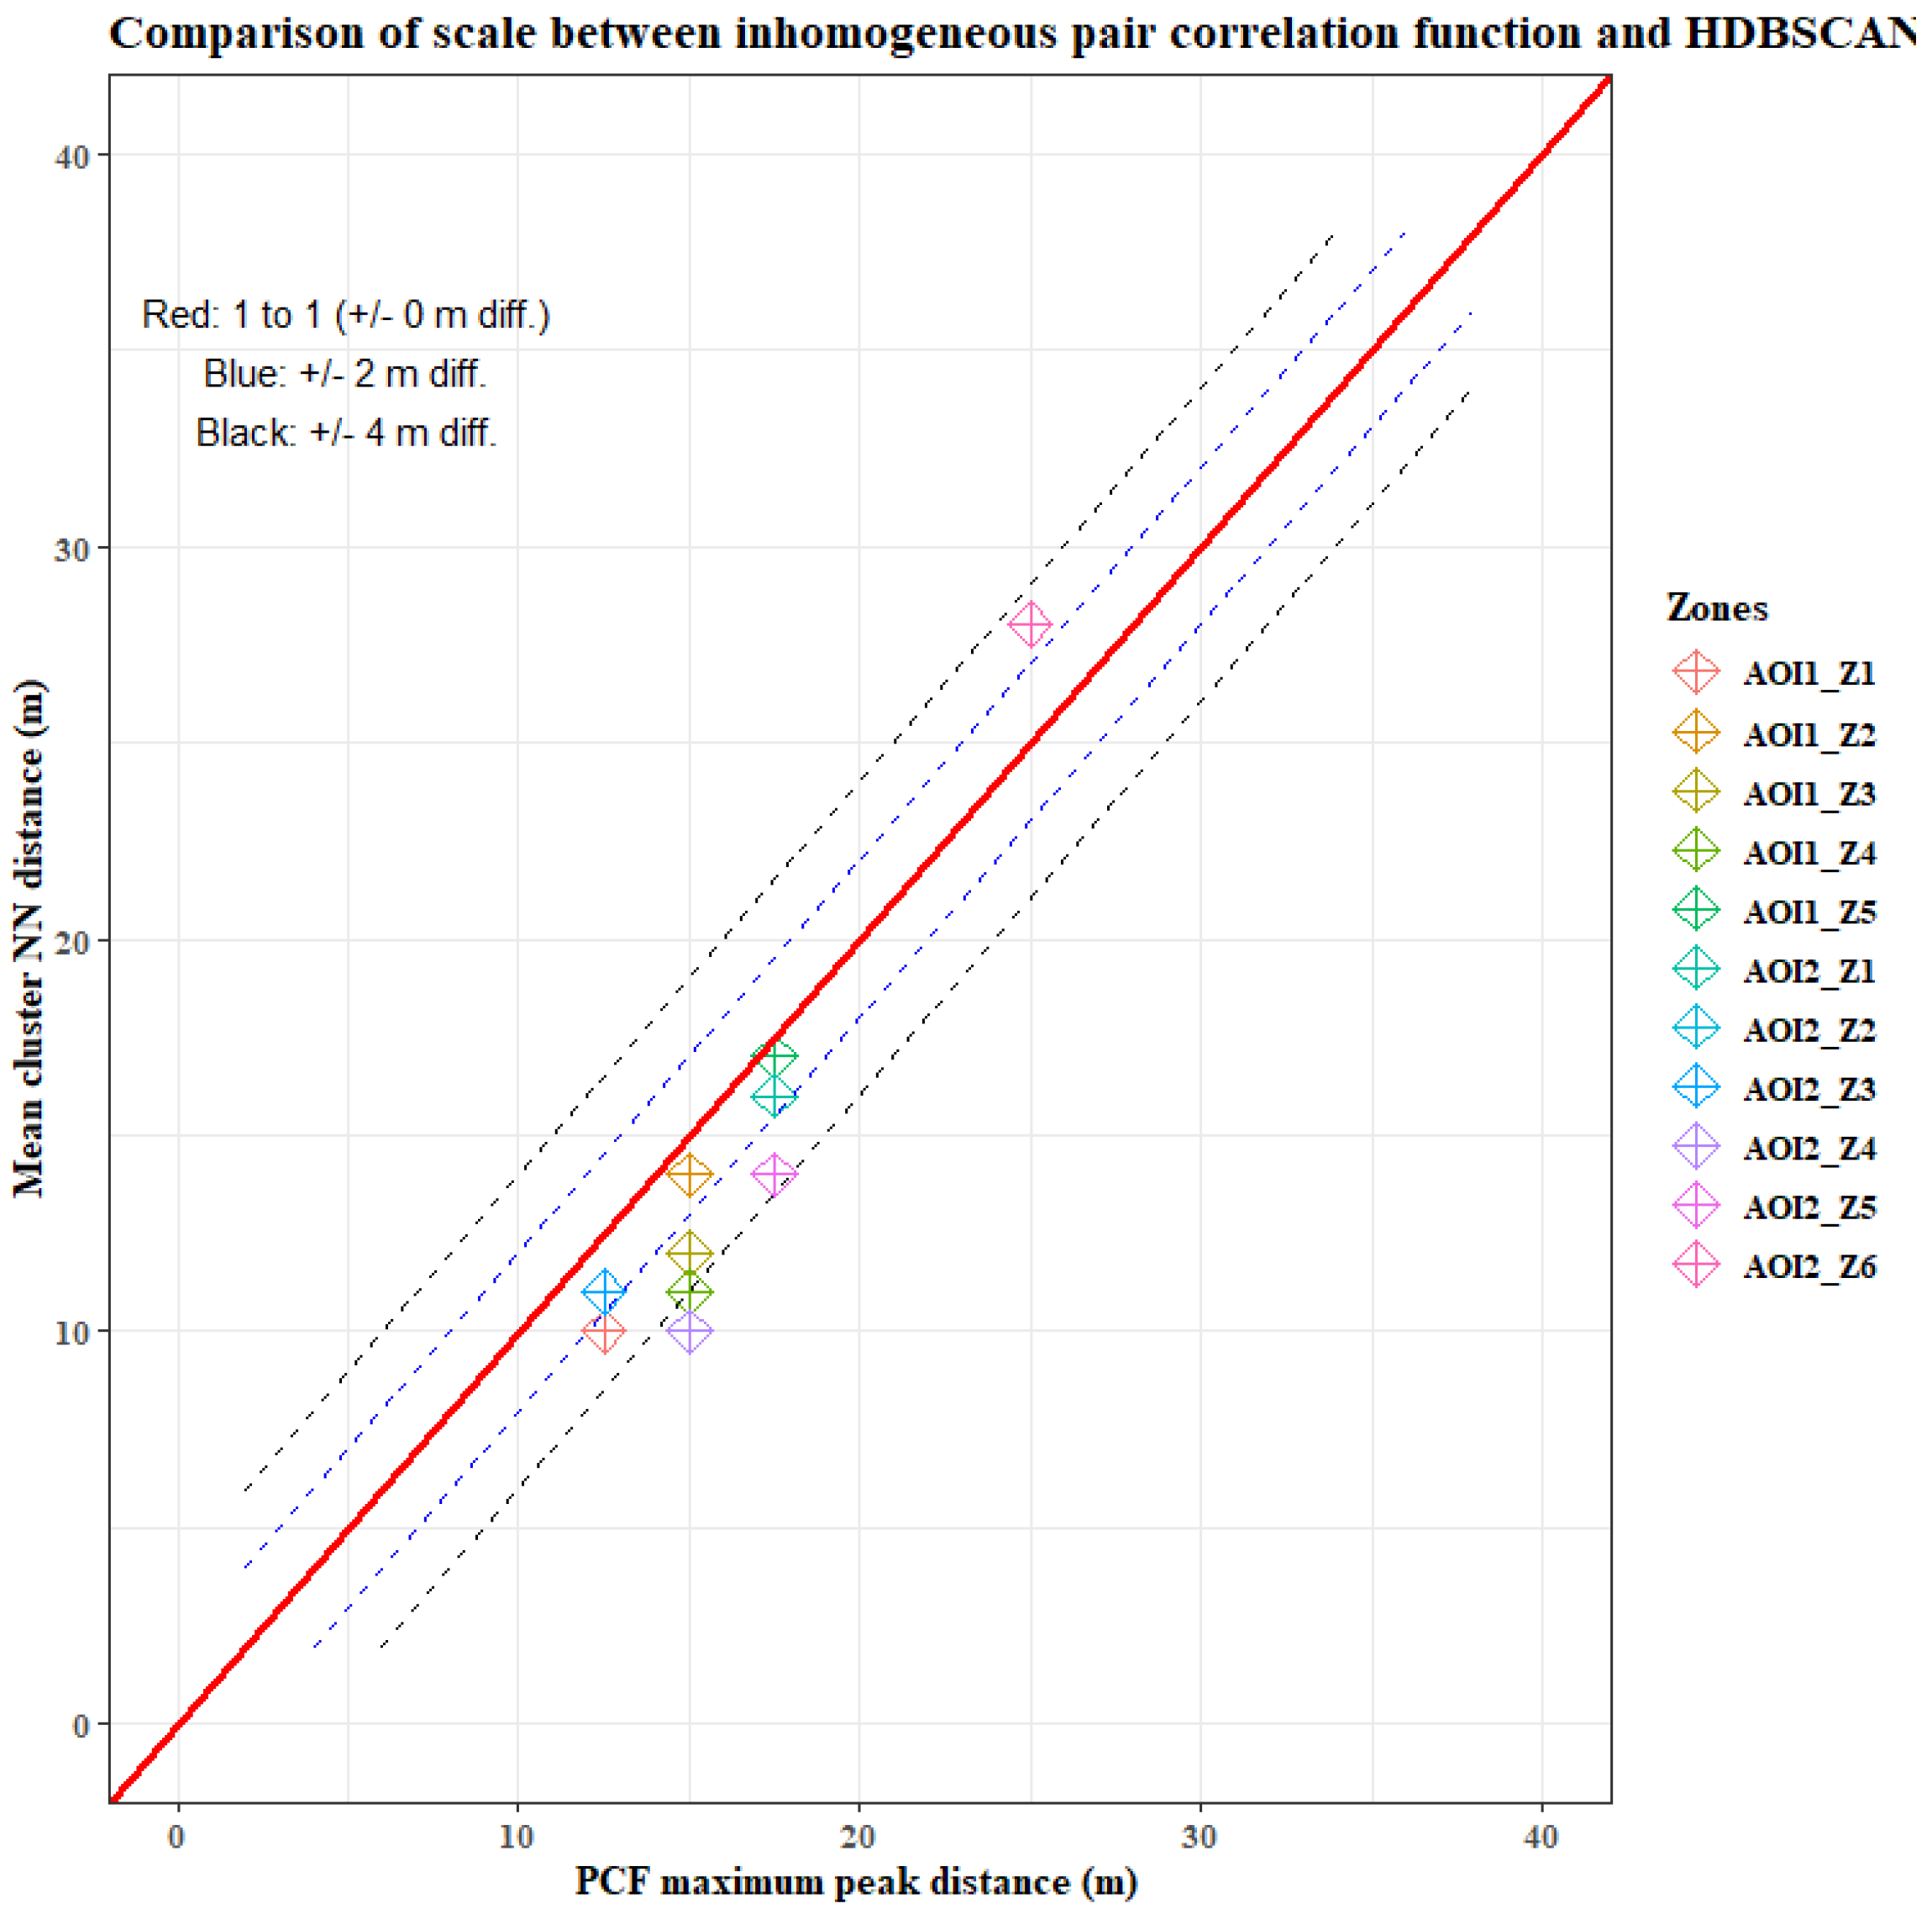
To compare HDBSCAN to the increasing quadrat dimensions and interpretations of clustering from the Morista Index, we qualitatively demonstrate the correspondence between the varying HDBSCAN cluster dimensions and the scales of interaction estimated from the Morista Index plot. Because Ripley’s L-function is a calculation with a radius r from some arbitrary point i, we employ l e n g t h 2 of the largest cluster dimension and contrast this to the farthest significant deviation from randomness as suggested from the simulation envelopes. In principle, the radius observed by using the apex point feature within the largest cluster in the ZOI is being analyzed in comparison to the largest radius delineated by Ripley’s L-function. In the case of the pair correlation function, the mean nearest neighbor distance from within the ZOI is evaluated against the maximal peak identified from the PCF to substantiate the HDBSCAN clustering. As the pair correlation function indicates the distance at which the likelihood of encountering similar features is maximized, the mean nearest neighbor distance affords a commensurate measure, positing that a radial buffer extended by a length of x units would, on average, intersect another similar feature (Figure 2).

2.5. Logistic Regression for Covariate Response to the Presence of Palms

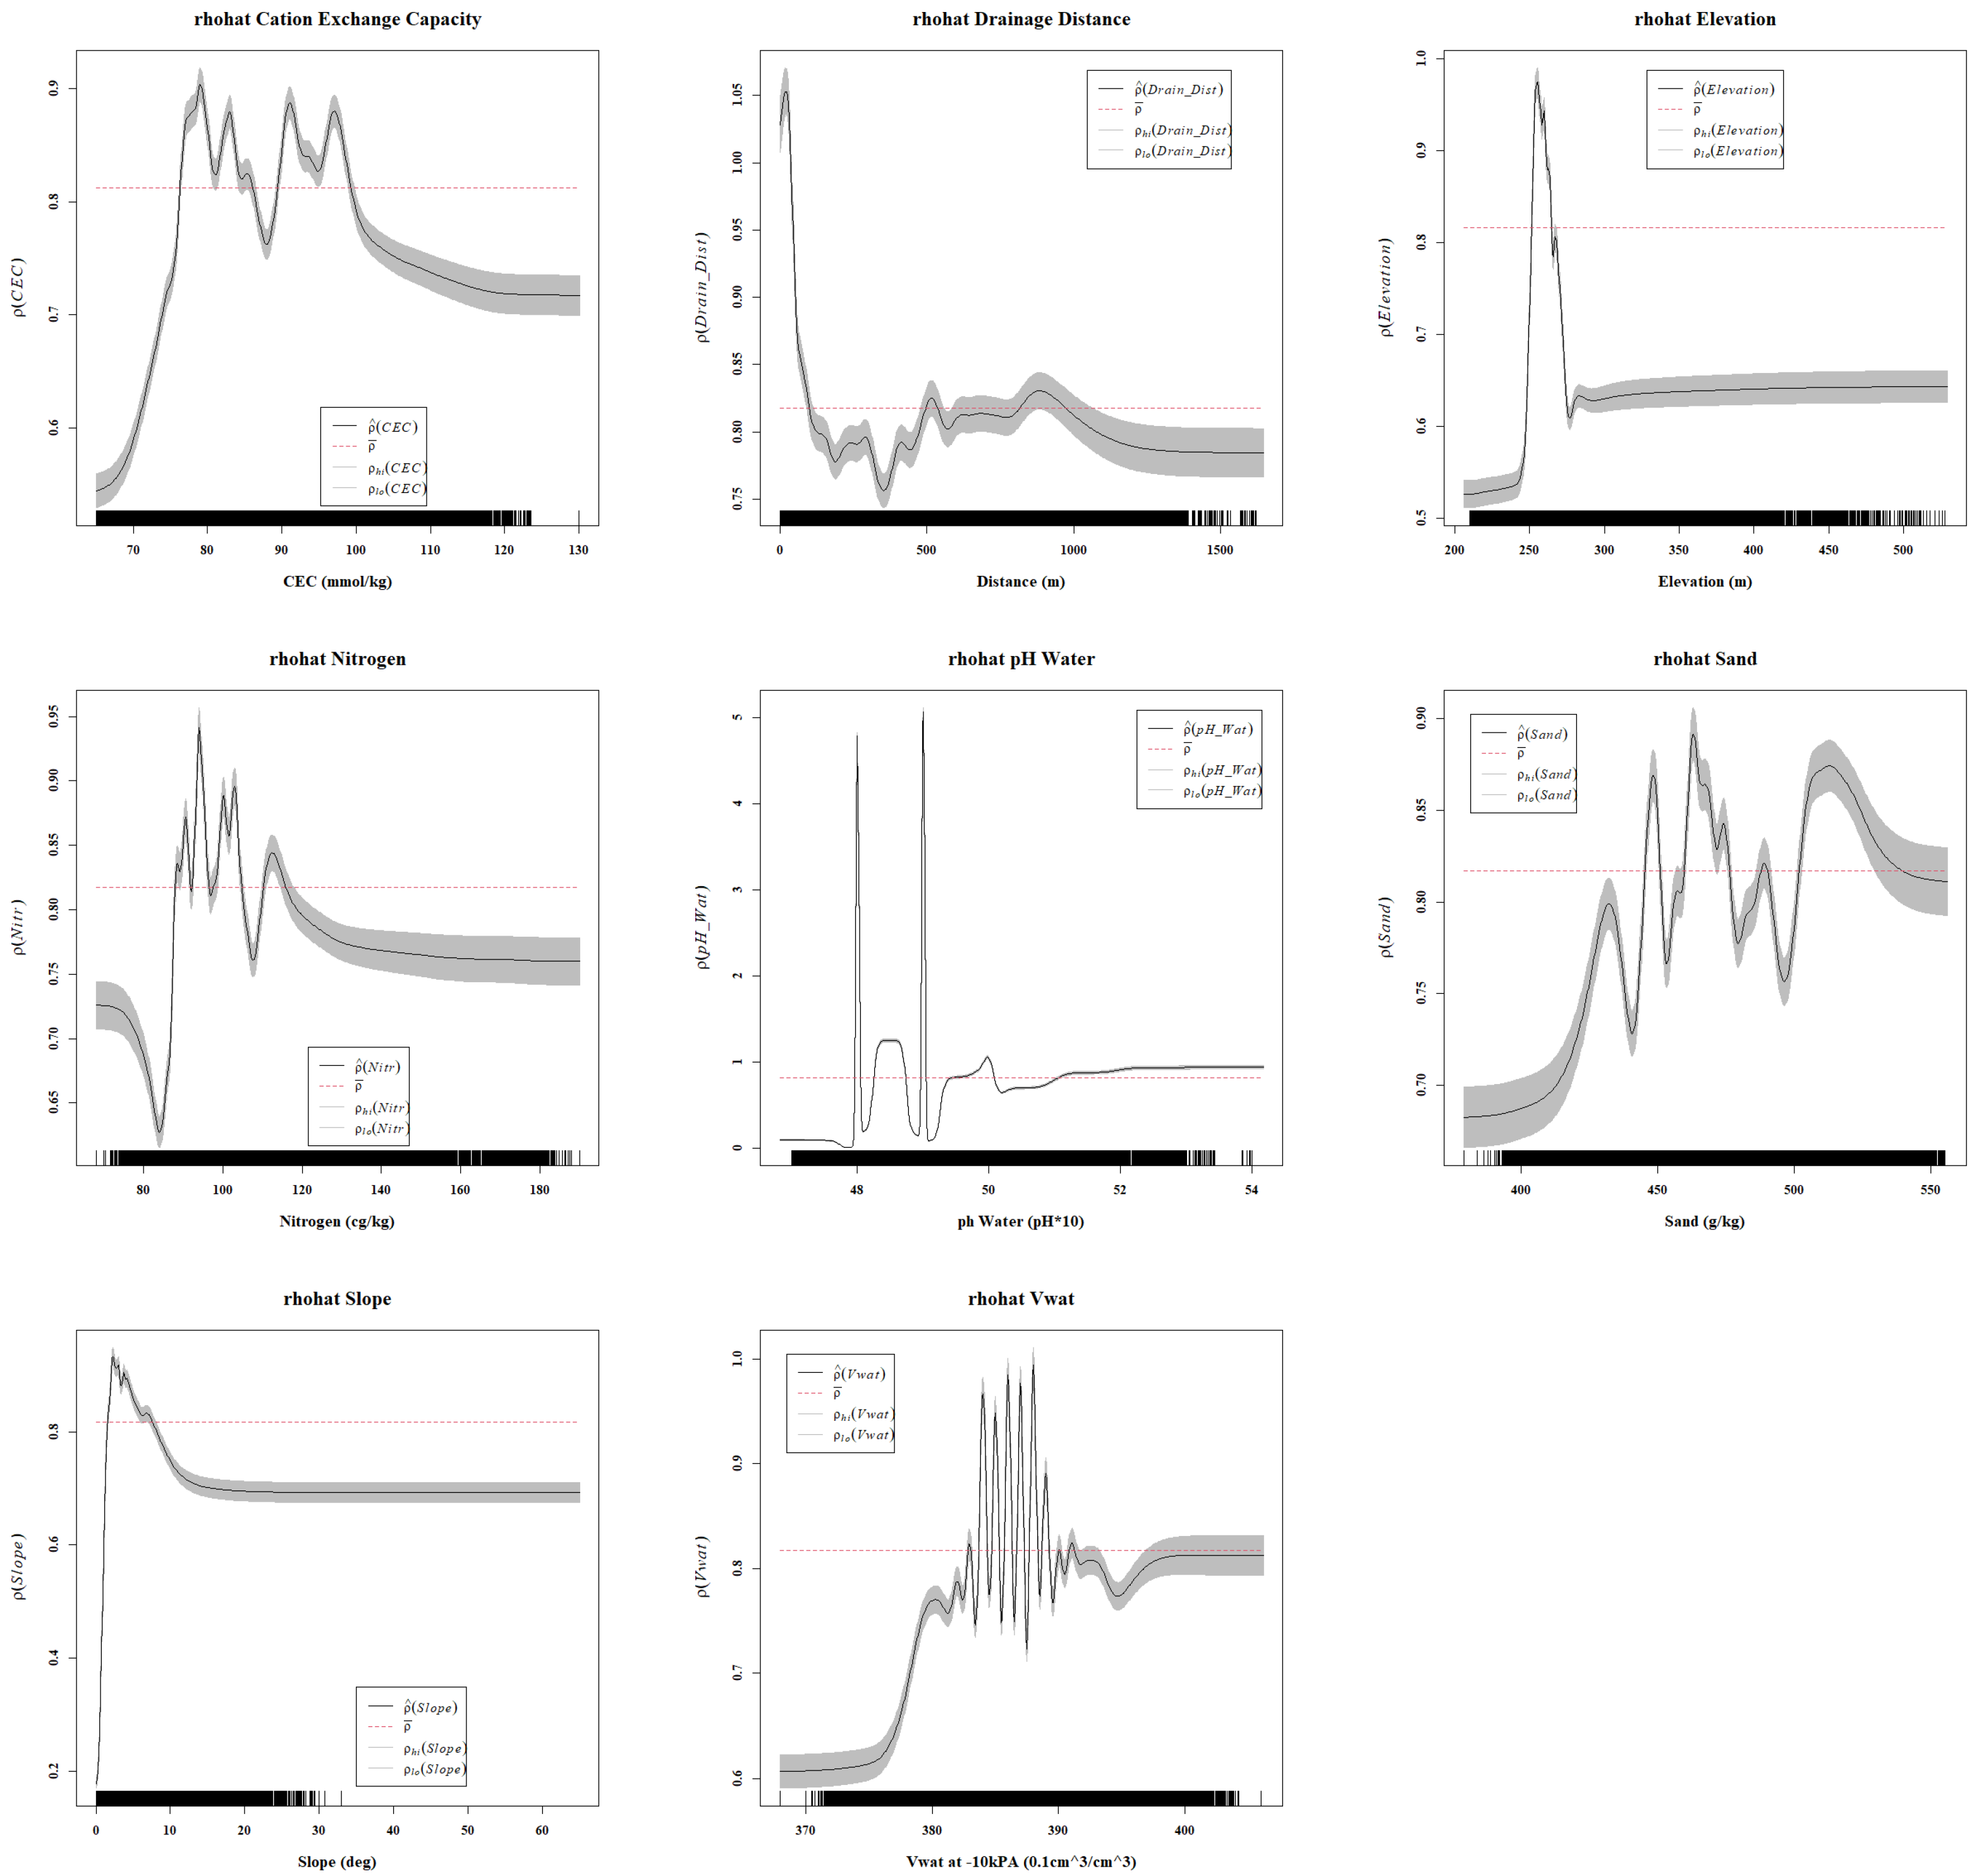
A Gibbs point process is not appropriate for this dataset as it assumes interactions among the point features [48] and requires the features to have marks, or attributes, that distinguish features of the same type [49]. This interaction cannot be reasonably assumed here, as marks are not available to differentiate palms of varying species. Therefore, a spatial logistic regression [50] is applied on the regional scale to both the cluster and outlier datasets, with the goal of identifying the key drivers of feature placement within each group. Logistic regression records the identity (that is, the presence or absence of a feature in a point) and relates this via probability to a linear mixture of input covariates. Before multivariate logistic modeling, each covariate was individually analyzed for spatial intensity as a function of the covariate response using the resource selection function (rhohat) method. This facilitates an understanding of the determinants of clustering on an individual-variable basis and establishes a foundational framework for the interpretation of logistic regression coefficients.
The dependent variable in the logistic regression model is palm locations, which are classified as either clusters or outliers by the HDBSCAN algorithm, while their covariate inputs are pixel images. Due to the relatively low resolution of the environmental data, particularly that of the soil data, at 250 m, cross-cluster features are likely sampled from the same pixel values at the microscale. Given the substantial quantity of point features and the extensive macroscale our AOI cover (approximately 20 by 18 km for AOI-1 and 30 by 22 km for AOI-2), it is hypothesized that, on the macroscale, the impact of this cross-cluster sampling is negligible. Although the relative magnitudes of the covariate values are comparable, all covariate pixels were z-score-normalized ( v a l u e = x μ σ ) to mitigate any potential bias attributable to individual covariates, remove the impact of mixed-variable units, and enhance the interpretability of the coefficients’ magnitudes, β . Areas of savanna where palms do not naturally occur in abundance and areas that were physically blocked by the environment, such as those under clouds or shadows, were masked in the analysis.
To select the most pertinent covariates, a stepwise model selection algorithm was employed, with the model built from a function of itself (null model) through all possible combinations of covariates, and each model’s Akaike Information Criterion was compared. In both AOI, the use of all covariates in both the cluster and outlier models yielded the lowest Akaike score (the best model). The confidence intervals for the β coefficients were subsequently calculated from the model variance–covariance matrix.

3. Results

3.1. HDBSCAN

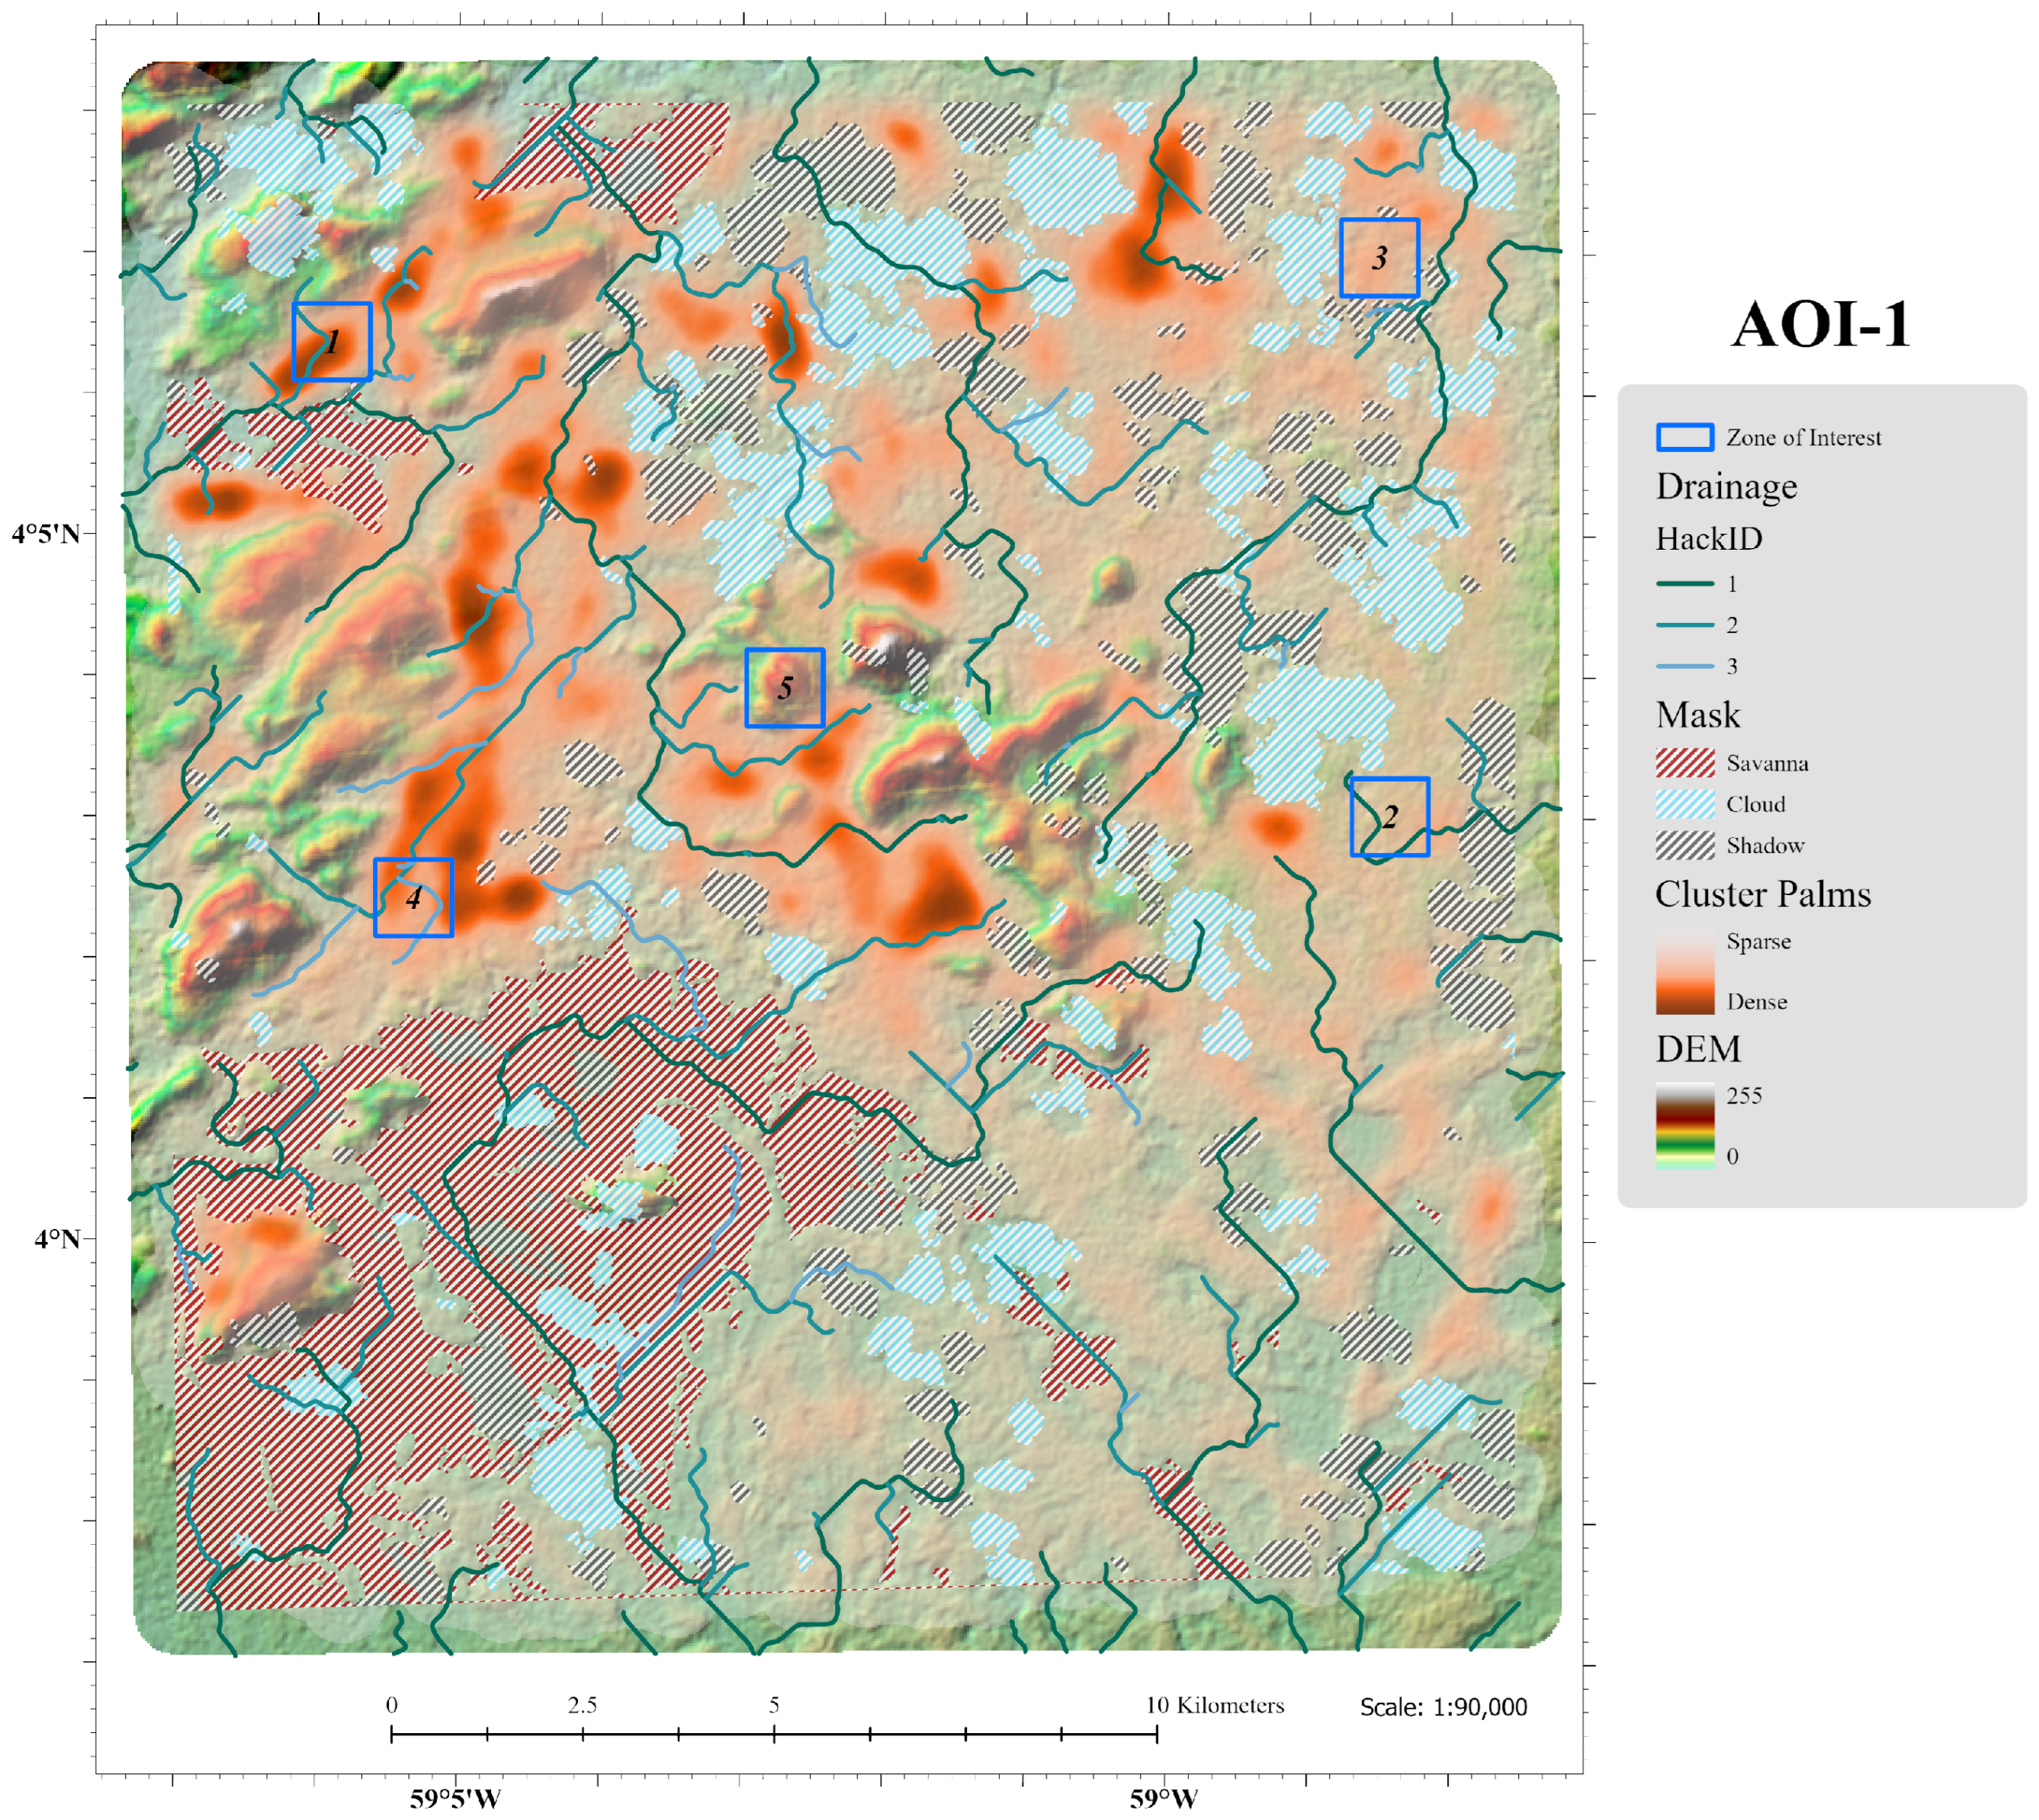
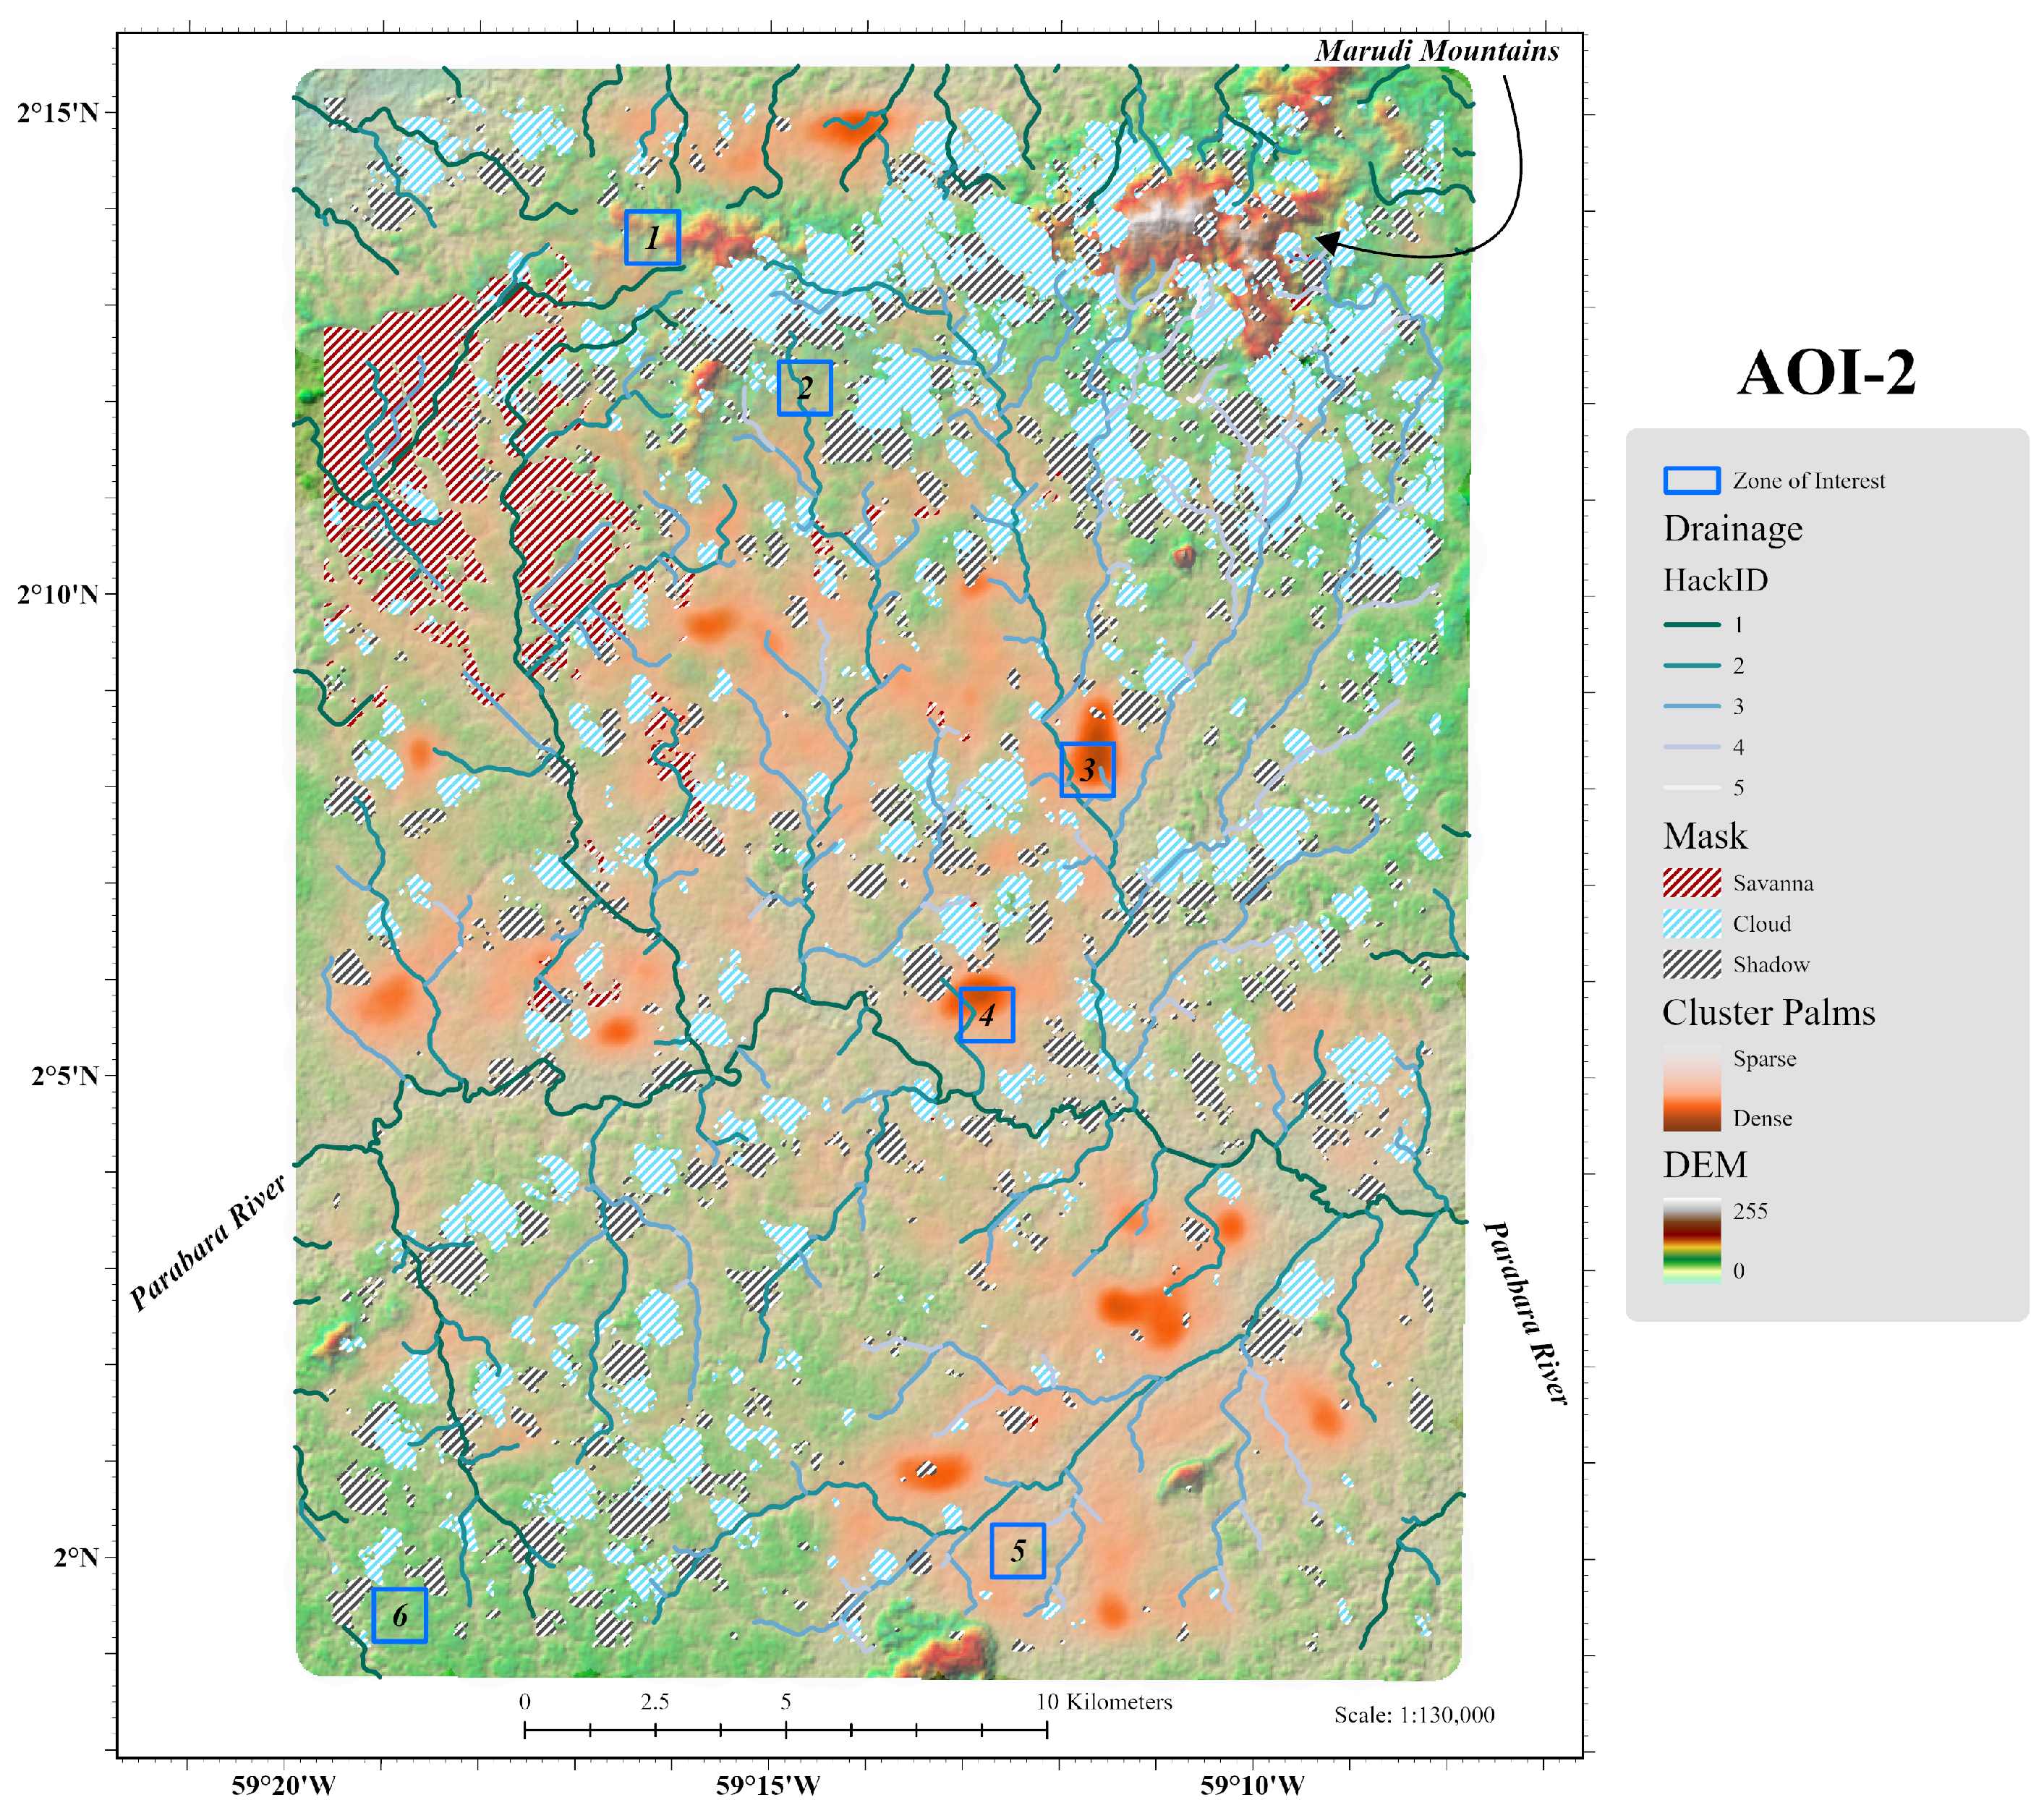
The HDBSCAN algorithm produced 6523 unique clusters (121,837 clustered palms; 72,646 outlier palms) in AOI-1 (Figure 3) and 8829 clusters (172,489 clustered palms; 105,781 outlier palms) in AOI-2 (Figure 4).
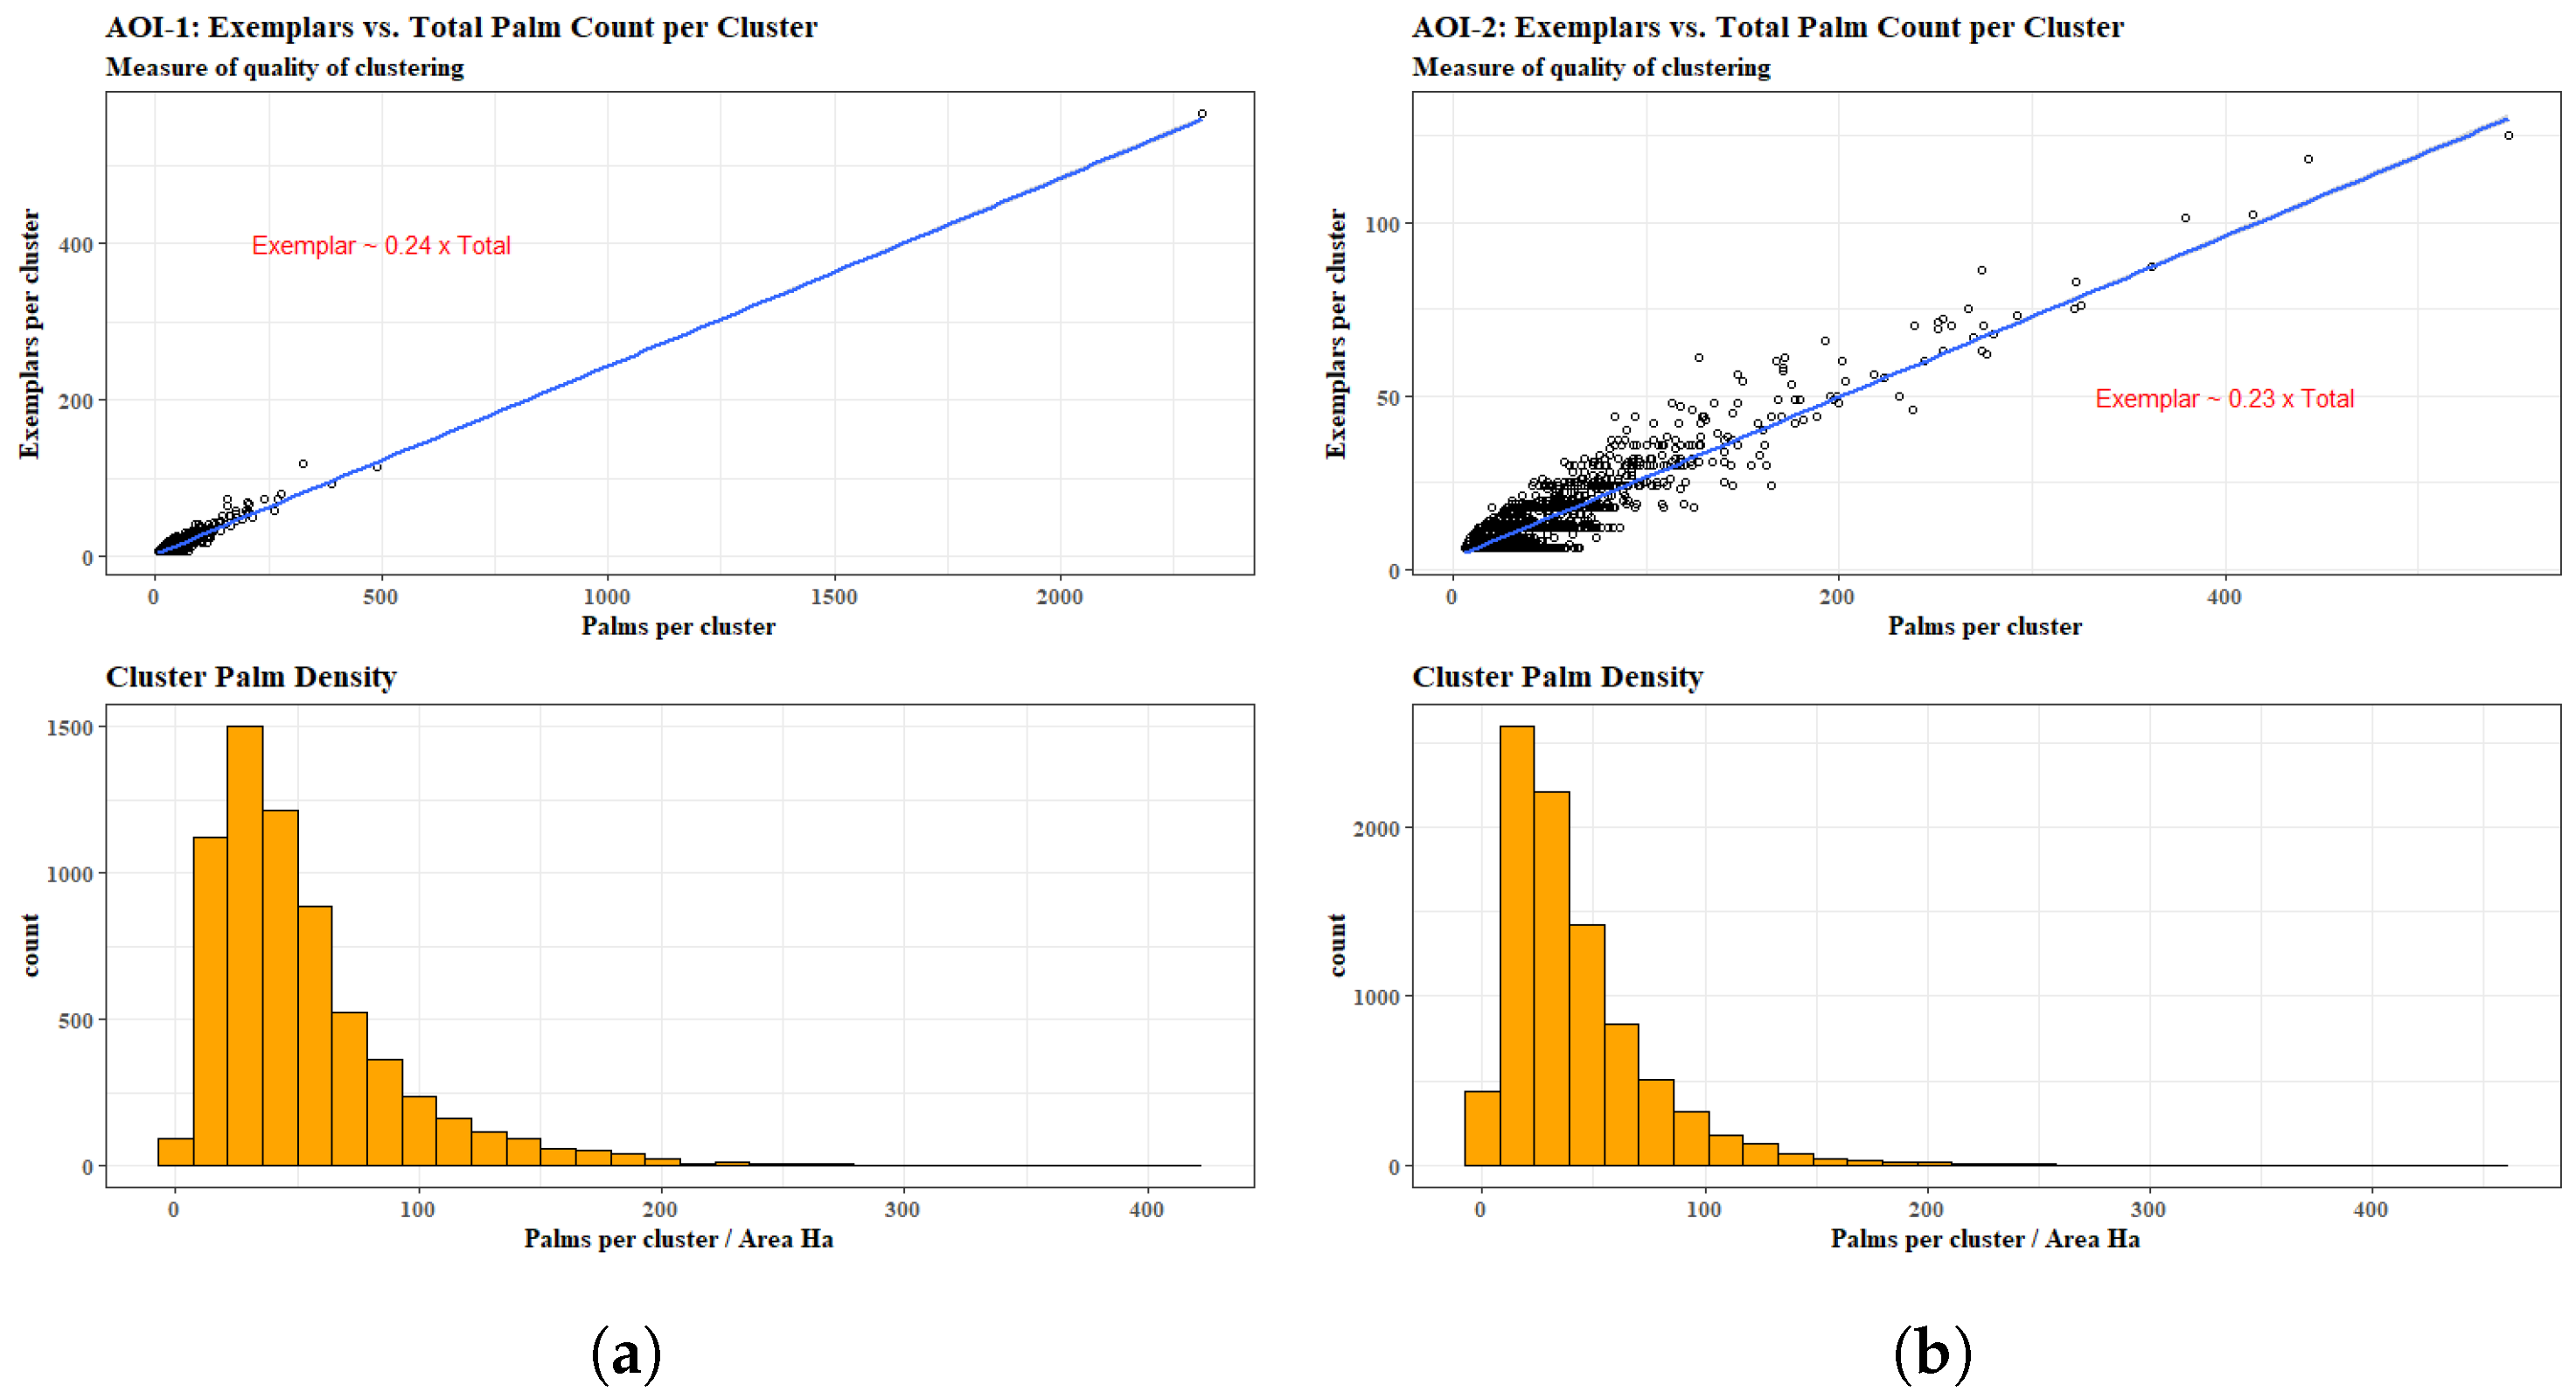
The mean and maximum area of the convex hull enclosing each cluster was 0.8 and 346.3 hectares for AOI-1 and 1.1 and 78.6 hectares for AOI-2. In AOI-1, 92% ( 5998 6523 ) of the clusters exceed the minimum threshold value (6 palms) to generate a cluster; in AOI-2 that value is 91% ( 8052 8829 ). The average total palm count per cluster is 19 in AOI-1 and 20 in AOI-2; however, their distribution varies considerably (Figure 5).
The exemplar features in the clusters are those considered to be the most representative within the cluster based upon the underlying statistics; we will use them here as a metric for the quality of clustering. In both AOI-1 and AOI-2, the exemplars represent approximately 20% of the total number of palms in each cluster (Figure 5). Therefore, one may consider that there are at least 2 out of 10 palms within a given cluster that are highly representative of that cluster’s unique distribution qualities, with the remainder being closely related. Palm density (total number of features per cluster divided by the area, in hectares, of the convex hull of the minimum bounding geometry) demonstrates a mean of 52 palms Ha in AOI-1 and 42 palms Ha in AOI-2 (Figure 5).

3.2. Spatial Point Pattern Analysis

Within both AOI-1 and AOI-2, all defined zones of interest (ZOI) exhibit χ 2 test p-values that support the rejection of the null hypothesis of complete spatial randomness at a 95% significance threshold, agreeing with the alternative hypothesis of clustering. These non-random spatial distributions of palm locations are furthermore observable through visual inspection (Supplementary Figures S1 and S2).
The Morista Index plots within both areas of interest (AOI) indicate aggregation patterns extending up to spatial scales of approximately 400 by 400 m. The summary metrics and cluster size distribution of the HDBSCAN clusters exhibit considerable agreement across the ZOI where our comparative analysis was carried out. Of particular note is that the commencement of aggregation as identified by the Morista Index closely coincides with the initialization of HDBSCAN cluster sizes. Furthermore, where the quadrant dimensions of the Morista Index suggest increased aggregation, the HDBSCAN cluster sizes show a substantial number of clusters of similar dimensions; also, their tail-end distribution decreases coherently with the trends indicated by the Morista Index (Figure 6).
A comparison of the maximum potential extent of the aggregation behavior suggested by the inhomogeneous L-function versus the half-length of the maximum cluster size in each ZOI is presented as a cross-plot (Figure 7). The values for the distance of the L-function are taken as the maximum value greater than 0 and greater than the simulation envelope, as seen from a plot of the centered L-function (Supplementary Figures S5 and S6). From the cross-plot we can see that there is, overall, no visible high or low bias, with 4 of 11 ZOI indicating matches of scale within 50 m and 4 of 11 indicating matches of scale within 25 m. In total, 3 of 11 demonstrate high estimates of scale from the HDBSCAN geometry compared to the L-function. In particular, one single ZOI (AOI-2, Zone 6) exhibits a significant deviation in this context.
Similarly to the scale comparison with the L-function, the distance corresponding to the maximum probability density peak of the inhomogeneous pair correlation function is plotted against the mean nearest neighbor distance for each ZOI (Figure 8). Here, an overall bias towards underestimation of the nearest neighbor distances in the HDBSCAN clusters is observed, with discrepancies reaching up to approximately 4 m.

3.3. Logistic Regression Model

The analysis of the resource selection function (rhohat) indicates that each of the environmental variables chosen contributes to an increase in palm aggregation in at least one of the AOI in AOI-1 (Figure 9) and AOI-2 (Figure 10). In either AOI, elevation fosters a higher intensity of palms at the lower end of the elevation range for the area, while a higher intensity is also observed at slope values of approximately 5°. In AOI-1, distance to prominent drainage features promotes greater palm intensity at very short distances and again at approximately 250 m; in AOI-2 a peak at very short distances is seen once again, yet AOI-2 lacks any sign of the far-field promotion of palm intensity due to their distance from drainage features. In fact, the rhohat graph for AOI-2 suggests that there may, in fact, be a propensity for palm disaggregation with proximity to drainage features. The pH of soil water suggests the promotion of a higher intensity of palms with pH values of approximately 4.6 to 5.0 in both AOI; however, the highly specific peaks at which increased intensity is predicted to occur, particularly in AOI-2, suggest limited variability in its underlying values.
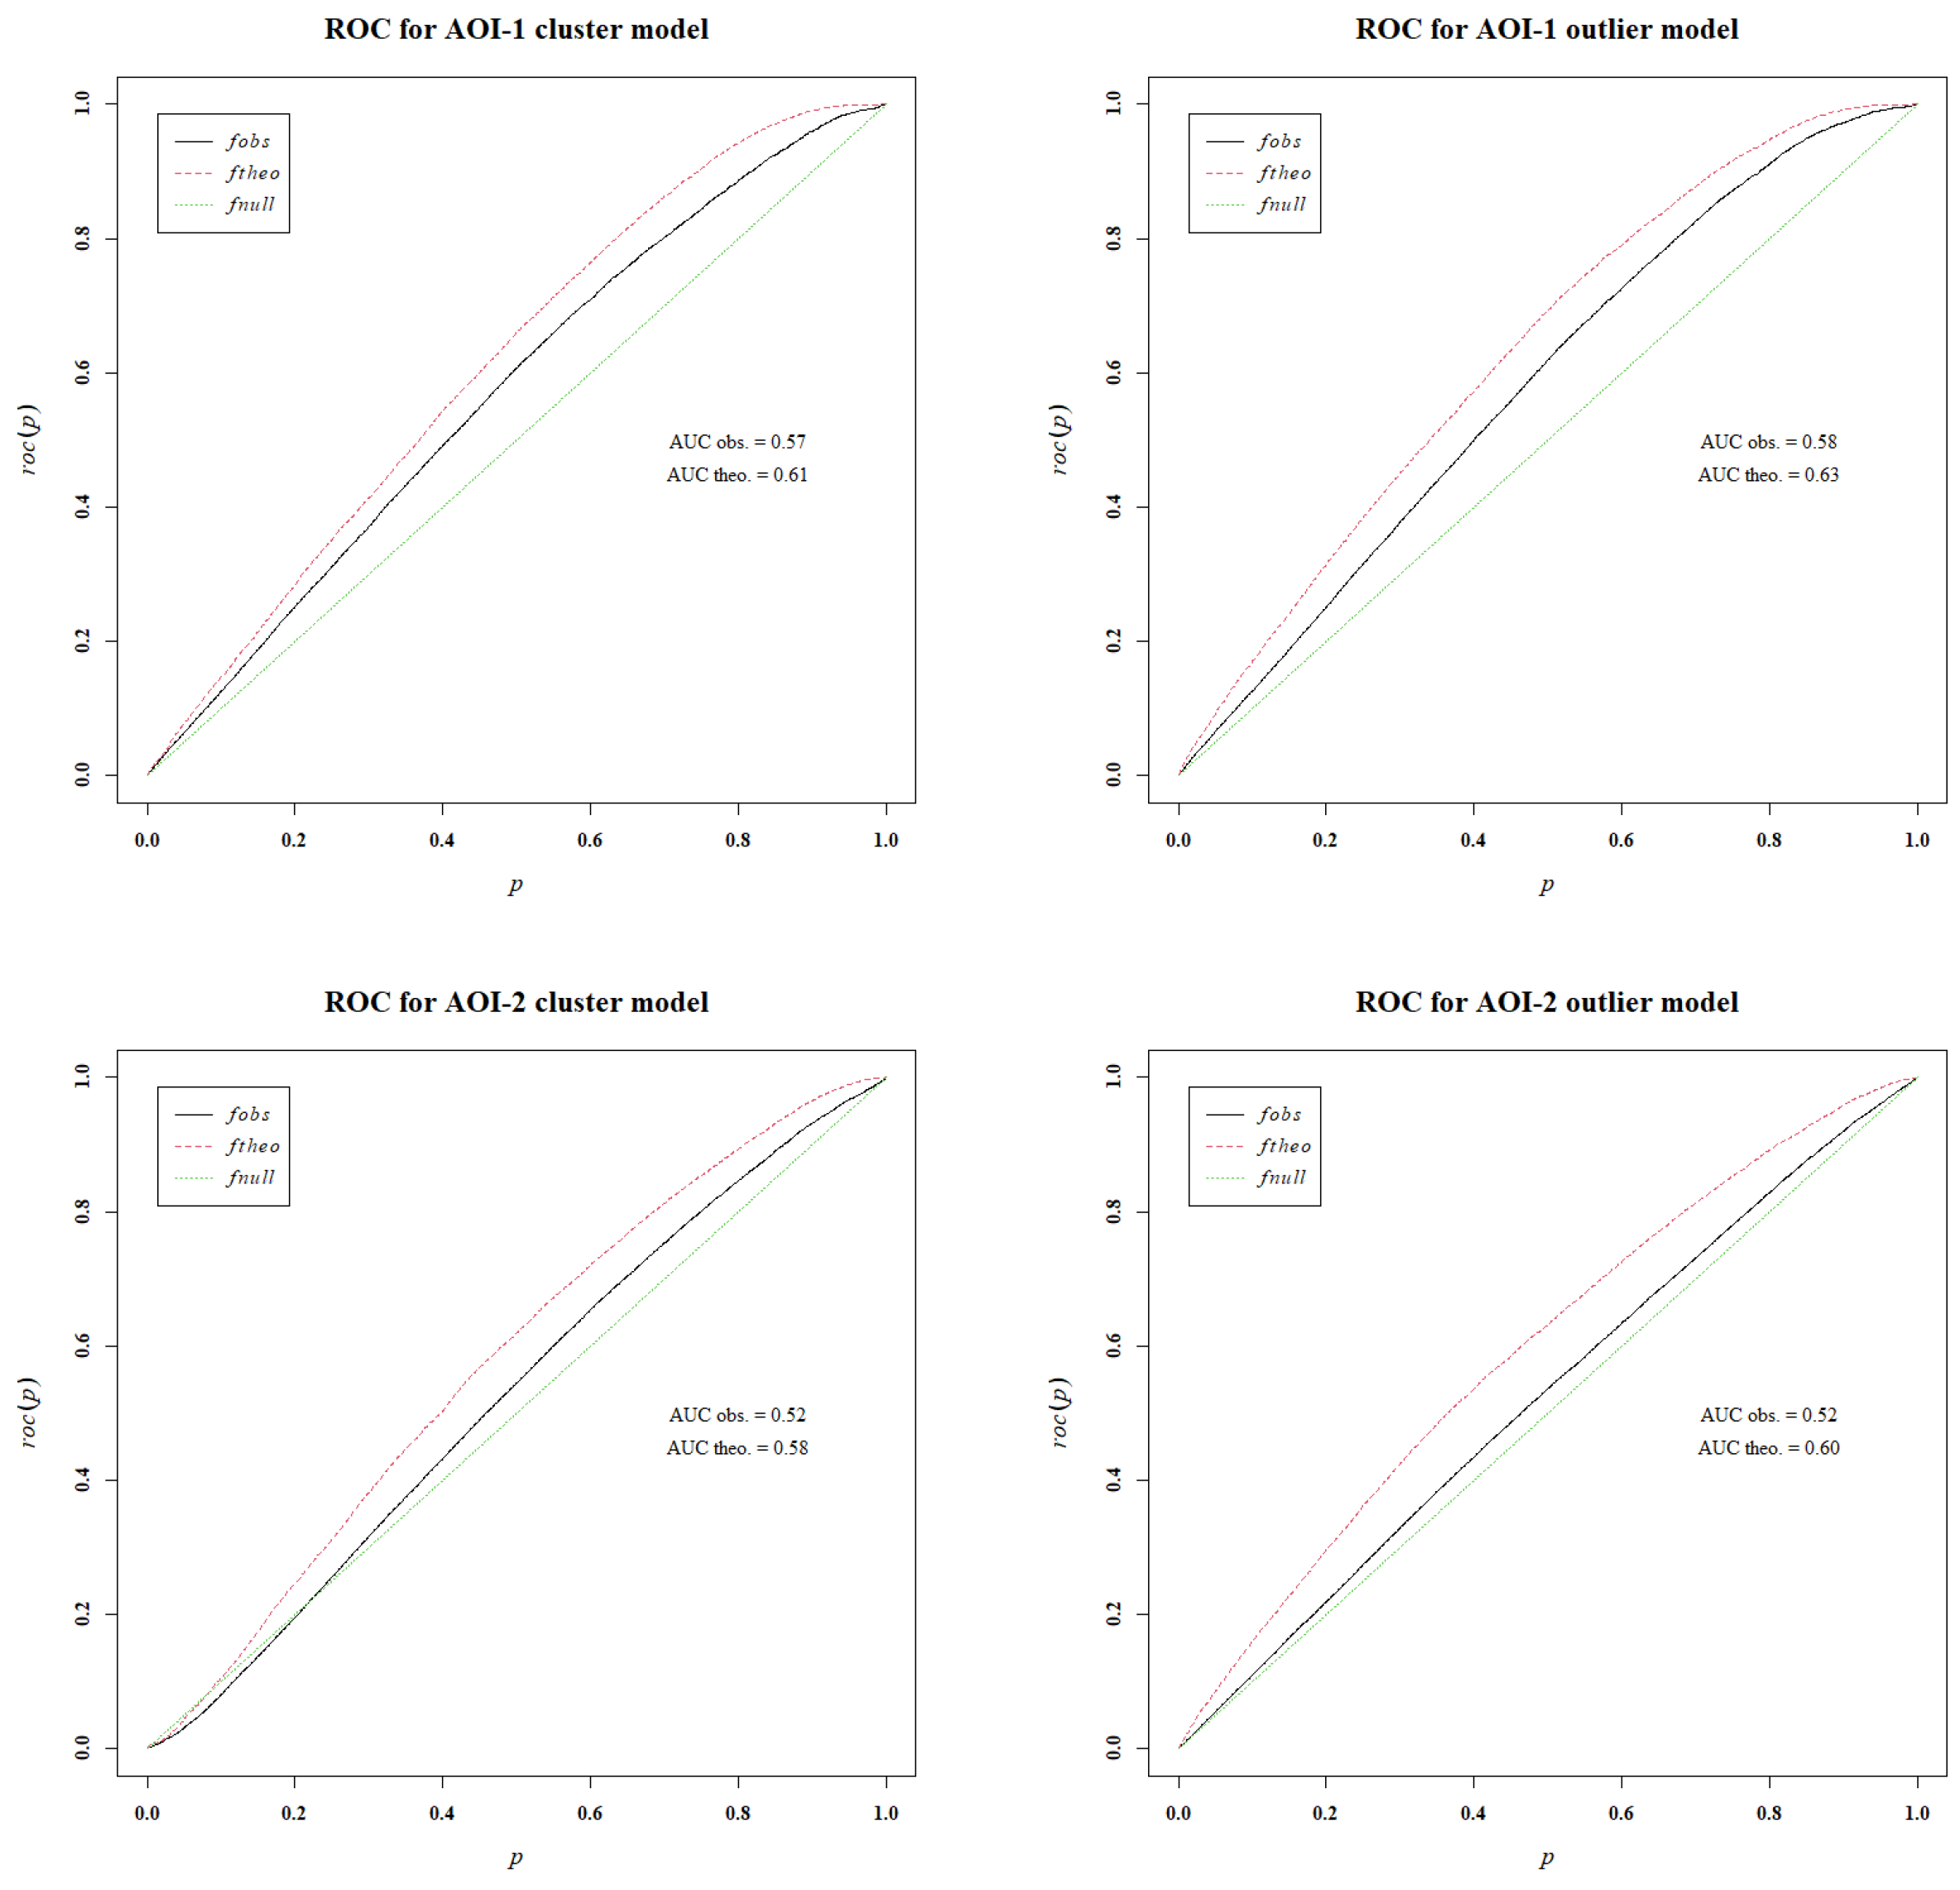
The McFadden R 2 [51], adjusted for the likelihood of a point process in continuous space, is 0.22 for both the cluster and the outlier model in AOI-1. This value is considered a very good metric for use as a measure of predictive power as established by McFadden ([52] [pgs. 306–308]). The McFadden R 2 for the cluster and outlier model in AOI-2 is similar, 0.24. In contrast, another measure of predictive power, the area under the curve (AUC) of the receiver operating characteristic (ROC) plot, suggests that the predictive power of these models is only slightly better than 50% in terms of their probability of predicting the presence of a palm correctly (Figure 11). However, the AUC has been criticized in relation to several issues [53]. Furthermore, it may be the case that because the palms detected by satellite imagery within the dataset are a fraction of what is actually present (as only canopy-emergent palms are visible), the model may be weakened by the fact that its response expects palms to be present where they are simply not visible in the dataset.
The results of the logistic model (Table 1) show that all covariates are significant at a rate greater than 95%, with the exception of three, which are weakly significant at 90%. In general, the coefficients of elevation, slope, and sand content are in agreement between both AOI; however, other covariates disagree and were thus subjected to further interpretation.

3.3.1. AOI-1

The conflicting influences of elevation and slope are a reflection of the presence of clustering activity that traverses the mountainous terrain in the AOI. Although mountainous reliefs are significantly different from the surrounding area, palms preferentially cluster in the lower sections of the slope, as implied by the higher magnitude coefficient β for slope versus elevation. In the outlier model, elevation has minimal influence, but slope continues to be a negative influence. The interplay of the positive β for soil water and negative β for distance from drainage features suggests there is a dependence on drainage channels due to their proximity to superficial water or soil water that is potentially closer to the surface. The magnitudes of the drainage distance and soil water coefficients imply that soil water is a greater influence than the distance to drainage; in the outlier model, their magnitudes are roughly equal but remain of opposing signs. The cluster model suggests that the soil properties of soil water pH, cation exchange capacity, sand content, and lastly nitrogen content have decreasing influences, in that order. In fact, soil water pH and cation exchange capacity have the greatest influence on the presence of clustered palms of all covariates. In the outlier model, soil water pH and cation exchange capacity have an even greater influence, with sand content having a diminished influence and nitrogen content a negligible influence (Table 1, Figure 12).

3.3.2. AOI-2

Elevation in AOI-2 has a very strong negative influence on the presence of palms. This is largely driven by the presence of the Marudi Mountains and its foothills in the northeast of the area, where clustering is sparse; the relief outside of this section is less severe. Similarly to AOI-1, slope has a negative influence, again suggesting that palms preferentially take root in flatter sections of the ground. Soil water has a low-significance positive coefficient β for the cluster features and a negative coefficient for outlier palms, which are very different results from AOI-1. Furthermore, the distance to drainage has positive coefficients for both cluster and outlier palms of approximately equal magnitudes. As in AOI-1, the sand content for the clustered palms and the outlier palms has a positive coefficient β , although the influence of sand is greater in the outlier model. Unlike in AOI-1, the cation exchange capacity has a low-magnitude negative coefficient for both cluster and outlier palms. Increases in nitrogen also show negative influences for both cluster and outlier palms of similar magnitudes, which is again the inverse of AOI-1. The soil water pH in AOI-2 is questionable, as the conflicting signs for the cluster and outlier β coefficients, coupled with the two very limited peaks in the rhohat graph (Figure 10), suggest limited variability of the underlying values within the area, which could skew the results (Table 1, Figure 12).

4. Discussion

Testing for complete spatial randomness within select zones of interest (ZOI) in each area of interest (AOI) strongly suggests that the palm point features are non-random and clustered on scales of interest for the inference of biological processes being involved in palm locations (1 to 10 hectare squares). Additional diagnostic evaluations, such as the application of the Morista Index, also indicate a tendency towards clustering or spatial heterogeneity. This pattern is quantified by the HDBSCAN nonparametric clustering algorithm, and clustering is shown to be geographically prevalent in both AOI, with approximately 62% of palms belonging to a cluster.
The results of the validation process for the HDBSCAN clustering output, when juxtaposed with traditional point pattern analysis methodologies, are demonstrably favorable. In particular, the magnitude and distribution of the cluster geometries developed from HDBSCAN align well with the aggregation scales suggested from the Morista Index plot, which are to the order of 10 s to 100 s of meters (Figure 6). Similarly, the comparison of the maximum probability distance derived from the pair correlation function with the mean nearest neighbor distance of the HDBSCAN clusters (Figure 8), although HDBSCAN exhibits a minor underestimation bias of up to 4 m, is considered highly reasonable considering the extensive and heterogeneous zones of interest examined. The validation of HDBSCAN using the maximum radius of aggregation of the L-function versus the half-length of the largest HDBSCAN cluster in a given zone of interest proves to be the weakest comparative evidence, with scale differences upward of 50 m. While the L-function views aggregation patterns as having the radius r of a perfect circle, the convex hull of the cluster is in no way guaranteed to be circular, and one or two sparse vertex features may extend the convex hull, and thus the length measurement, unusually far beyond the “core” of the cluster. This potentially explains some of the mismatch in the comparison from the side of HDSBCAN; one could also argue a case for edge effect corrections that impact the results from the L-function itself, which are a recognized complication [44]. However, when considering the comparative analyses holistically, it is proposed that HDBSCAN, when accurately parameterized, constitutes an effective algorithm to demarcate the cluster locations of biological phenomena that can be validated against established and conventionally trusted methodologies.
The results of the logistic regression applied to the environmental covariates show that topographical and soil characteristics exert a significant influence on the spatial distribution of palm clusters. This phenomenon is corroborated by previous researchers, who have found that these variables influence the growth of Amazonian palm species [9,12,15,54,55,56]. For example, Rodrigues et al. [9] find that the abundance of adult palms increases with a higher sand content, as seen in this study, and that the abundance of adult palms is sensitive to elevation. Kristiansen et al. [56] find a correlation between cation exchange capacity and species composition; while species is not a known variable in this study, the effect of the soil’s cation exchange capacity remains visible here. Considering the limitations inherent in this study, including the species-agnostic subsample of canopy-emergent palms used and the use of modeled rather than empirically measured covariates, it is crucial to acknowledge the correspondence of the observed responses to environmental variables in this study to those from field data-derived studies.
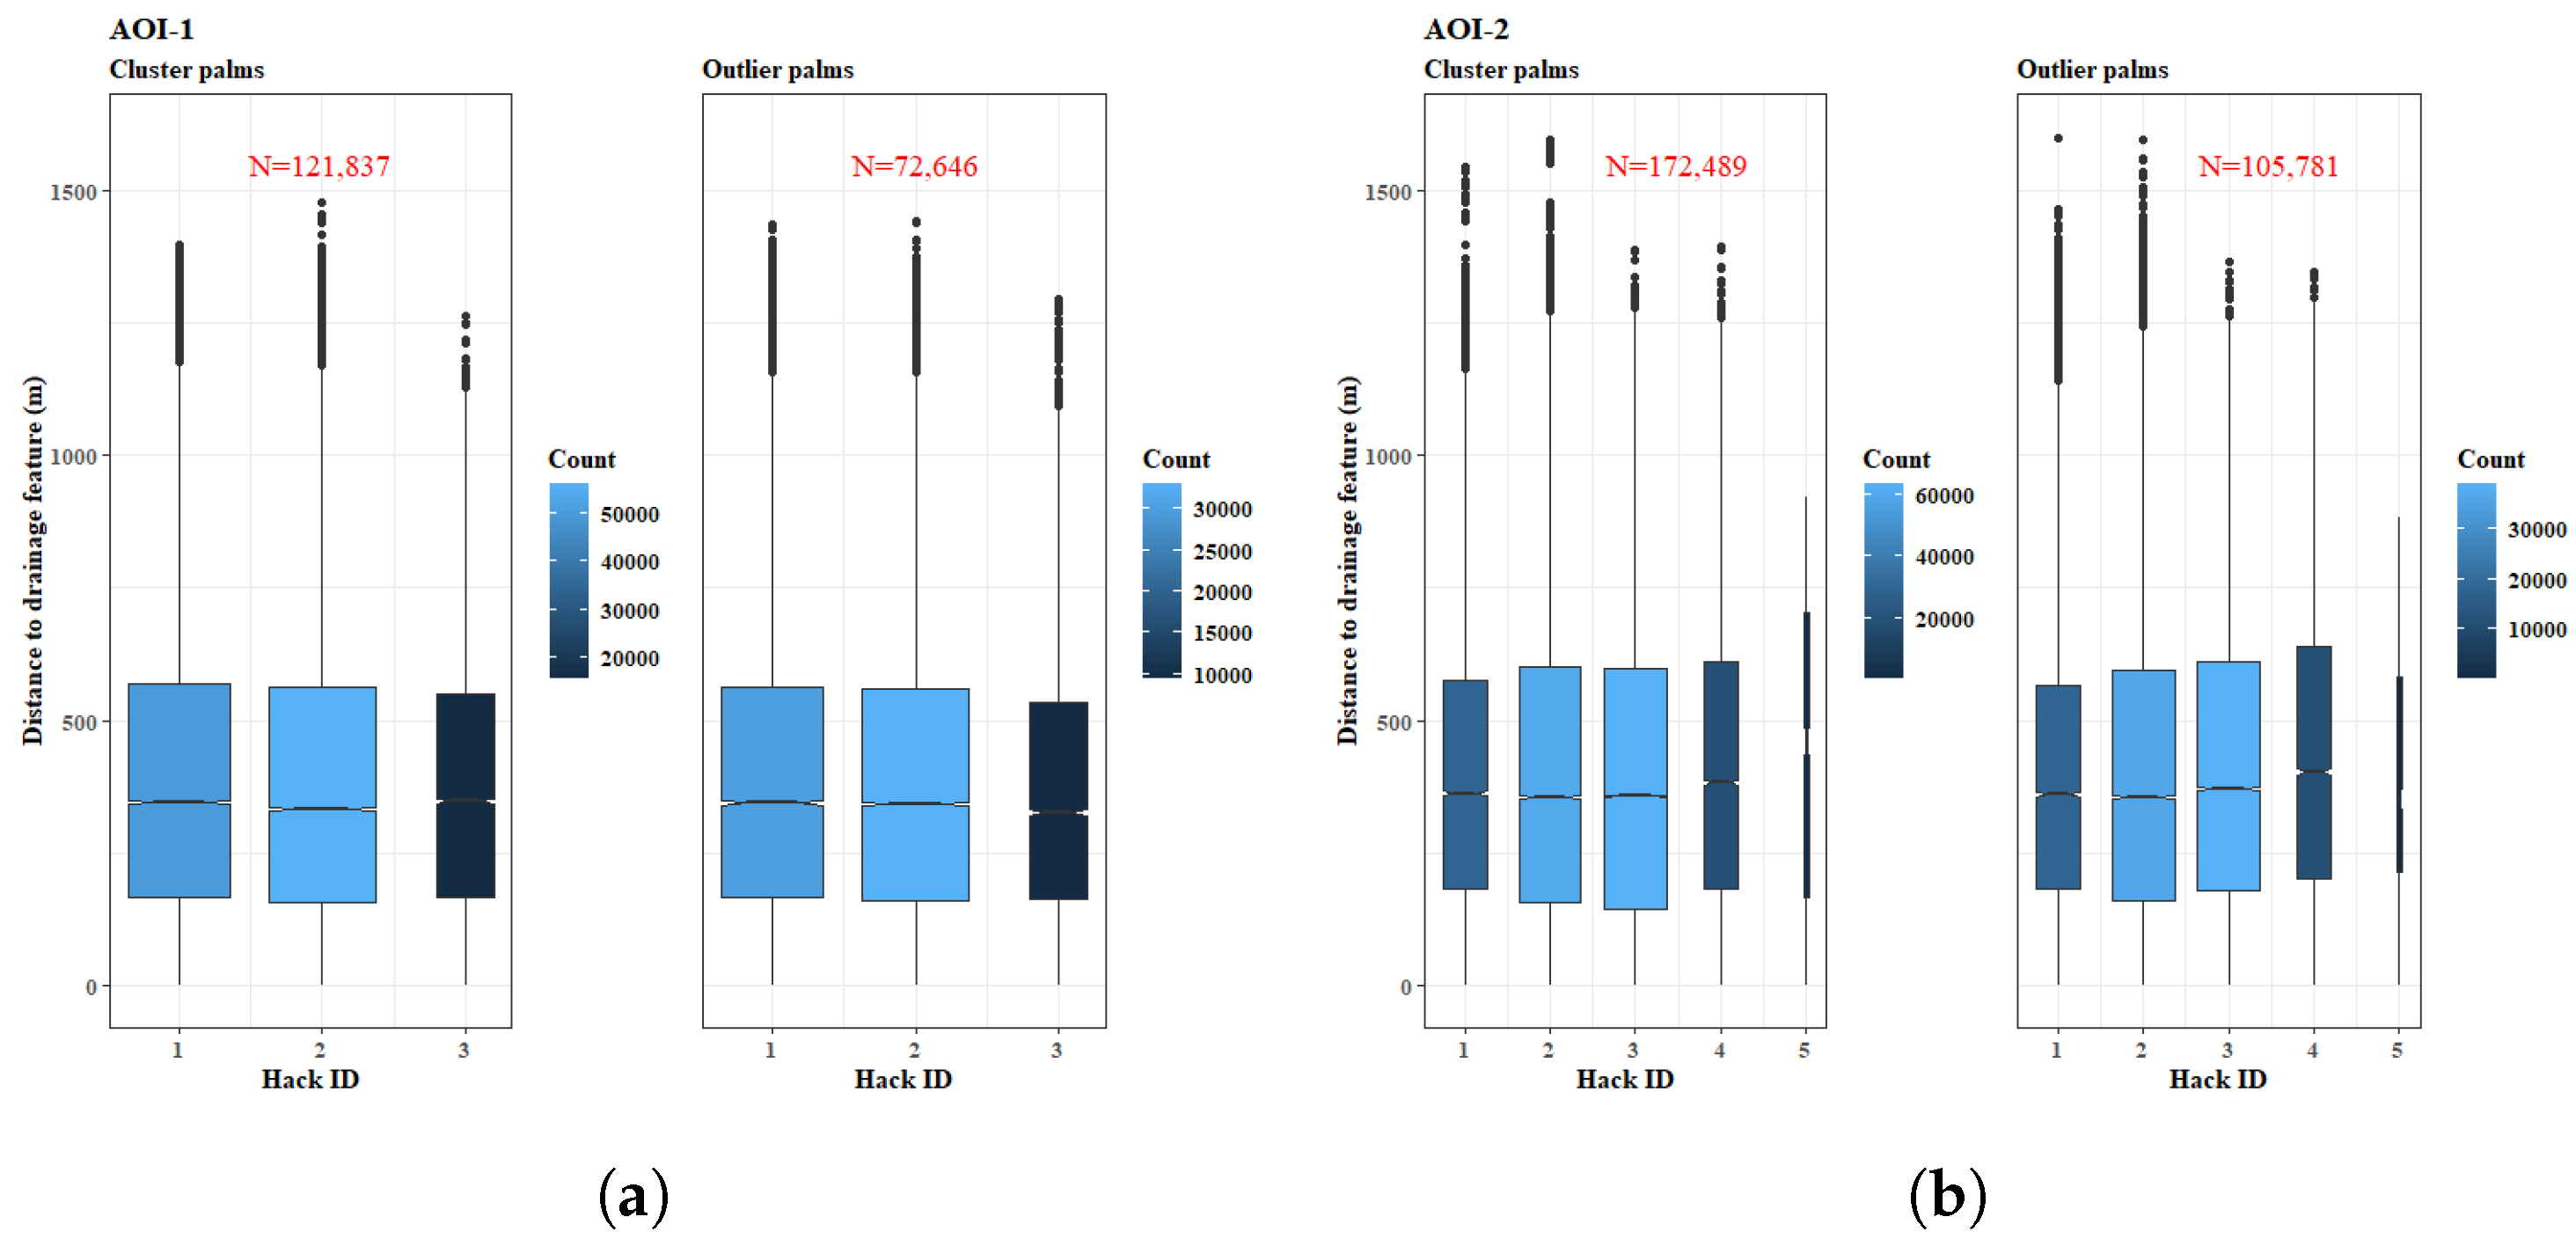
The Euclidean distance from drainage is also correlated with the flora assemblage, including palms, within the Amazon [57], and the influence of flood-prone versus upland terrain on palm communities has also been corroborated [12,33,56,58,59,60,61]. Due to the conflicting nature of the responses of the coefficients, β , to the distance from drainage between AOI-1 and AOI-2, further description of this phenomenon is warranted. There is very little difference in the median distance from drainage between the cluster and outlier palms in either AOI; in both, it is approximately 350 m (Figure 13).
However, given the large scale of the scenes (approximately 20 by 18 km for AOI-1 and 30 by 22 km for AOI-2), it is highly notable that 50% of all palms are seen within 350 m of a drainage feature and 75% are seen within approximately 500 m. This observation is evidence that on the macroscale, drainage channels function as significant accumulators in the distribution of the palm community. The observed negative coefficient associated with drainage channels in AOI-2 is believed to be the result of seasonal flooding events that impact the growth dynamics of canopy-emergent palms proximate to drainage channels. We hypothesize that a greater topographic relief and the presence of the Marudi Mountains in AOI-2 act as an amplifier of rainfall runoff, in contrast to AOI-1, which contains generally flatter terrain that provides less of a gravity drive for flood generation. These flood processes are likely to alter the properties of the near-channel soil [56], which could result in markedly different covariate responses, as seen in AOI-2 compared to AOI-1.
Furthermore, evidence is seen within the data alone, where an approximately 600 m zone near the Parabara River was found to be virtually devoid of palms that could be detected from satellite imagery (Figure 14). Salm et al. [10], however, show results which indicate that palm density increases in the vicinity of a floodplain. This can be explained in this study as there simply being a decrease in palm size within the floodplain, making these palms undetectable on satellite imagery.
A potential first next phase for this research is the application of the HAND model [62] in order to properly delineate upland from flood-prone or flooded terrain, which would better describe the discrepancies seen in the β coefficients for the drainage channels in AOI-1 and AOI-2. This would also serve to support the hypothesis from the logistic model, as does the observation of a lack of canopy-emergent palms surrounding the Parabara River, that the higher magnitude drainage channels in AOI-2 are more flood-prone compared to those in AOI-1. Other suggestions include subdividing areas into ecological zones for further analysis, possibly by the clustering of environmental parameters. In a smaller-scale area of interest, palm canopy diameters measured from satellite imagery may be of use for pattern or autocorrelation analysis.

5. Conclusions

Palm remote sensing can offer advantages over traditional ground survey methods, such as the coverage of large areas and shorter analysis times. Its limitations, as discussed here, include an inability to detect subcanopy palms and an inability to differentiate between varying species. Due to this, the spatial point pattern analysis methods traditionally used by ecologists, such as Gibbs point process models, are not applicable. In this study, we have addressed this challenge by applying a generalized cluster identification algorithm, Hierarchical Density-Based Spatial Clustering of Applications with Noise (HDBSCAN), and cross-validating the results with several point pattern analysis methods commonly used by ecologists: the quadrat test for complete spatial randomness, Morista Index, Ripley’ L-function, and the pair correlation function. Finally, a logistic regression model was generated that shows that topography, soil characteristics, and the presence of drainage channels collectively influence palm location, which is corroborated by prior ground survey studies. Of the palms detected through remote sensing, 62% are classified as being within clusters, as determined by the HDBSCAN algorithm, and the cluster geometries delineated by HDBSCAN are comparable to those identified through traditional SPPA methods. The environmental factors influencing palm clusters and outliers, as determined by logistic regression, exhibit qualitative similarities to those identified in conventional ground-based palm surveys. Furthermore, proximity to drainage features is proposed to significantly influence palm distribution, a finding that is similarly indicated by ground-based palm surveys. These findings are promising indicators for prospective research aiming to integrate remote flora identification techniques with traditional ground-based data collection studies.

Supplementary Materials

The following supporting information can be downloaded at https://www.mdpi.com/article/10.3390/rs17050784/s1, Figure S1: Results of quadrat count test for AOI-1; Figure S2: Results of quadrat count test for AOI-2; Figure S3: Morista Index plots for each ZOI in AOI-1; Figure S4: Morista Index plots for each ZOI in AOI-2; Figure S5: AOI-1 inhomogeneous Ripley’s L-function; Figure S6: AOI-2 inhomogeneous Ripley’s L-function; Figure S7: AOI-1 inhomogeneous pair-correlation function; Figure S8: AOI-2 inhomogeneous pair-correlation function.

Author Contributions

M.J.D. conceived the concept, contributed to the analysis and lead the authorship. A.R.C. contributed to the data, funding, and editing. All authors have read and agreed to the published version of the manuscript.

Funding

This research was completed with the support of National Science Foundation (NSF) grant # 2047940.

Data Availability Statement

The original contributions presented in the study are included in the article; further inquiries can be directed to the corresponding author.

Conflicts of Interest

The authors declare no conflicts of interest.

References

  1. Macía, M.J.; Armesilla, P.J.; Cámara-Leret, R.; Paniagua-Zambrana, N.; Villalba, S.; Balslev, H.; Pardo-de Santayana, M. Palm Uses in Northwestern South America: A Quantitative Review. Bot. Rev. 2011, 77, 462–570. [Google Scholar] [CrossRef]
  2. Ozanne, C.M.P.; Cabral, C.; Shaw, P.J. Variation in Indigenous Forest Resource Use in Central Guyana. PLoS ONE 2014, 9, e102952. [Google Scholar] [CrossRef]
  3. Cummings, A.R.; Read, J.M. Drawing on traditional knowledge to identify and describe ecosystem services associated with Northern Amazon’s multiple-use plants. Int. J. Biodivers. Sci. Ecosyst. Serv. Manag. 2016, 12, 39–56. [Google Scholar] [CrossRef]
  4. Silva, J.Z.D.; Reis, M.S.D. Consumption of Euterpe edulis fruit by wildlife: Implications for conservation and management of the Southern Brazilian Atlantic Forest. An. Acad. Bras. Ciências 2019, 91, e20180537. [Google Scholar] [CrossRef]
  5. Valencia, R.; Foster, R.B.; Villa, G.; Condit, R.; Svenning, J.C.; Hernández, C.; Romoleroux, K.; Losos, E.; Magård, E.; Balslev, H. Tree species distributions and local habitat variation in the Amazon: Large forest plot in eastern Ecuador. J. Ecol. 2004, 92, 214–229. [Google Scholar] [CrossRef]
  6. Dalling, J.W.; Schnitzer, S.A.; Baldeck, C.; Harms, K.E.; John, R.; Mangan, S.A.; Lobo, E.; Yavitt, J.B.; Hubbell, S.P. Resource-based habitat associations in a neotropical liana community. J. Ecol. 2012, 100, 1174–1182. [Google Scholar] [CrossRef]
  7. Giroldo, A.B.; Nascimento, A.R.T.; Silva, P.P.F.; Pinho Júnior, G.V. Population structure and density of Attalea phalerata Mart. ex Spreng. (Arecaceae) in a semideciduous forest. Rev. Árvore 2012, 36, 637–645. [Google Scholar] [CrossRef]
  8. Baldeck, C.A.; Harms, K.E.; Yavitt, J.B.; John, R.; Turner, B.L.; Valencia, R.; Navarrete, H.; Davies, S.J.; Chuyong, G.B.; Kenfack, D.; et al. Soil resources and topography shape local tree community structure in tropical forests. Proc. R. Soc. B Biol. Sci. 2013, 280, 20122532. [Google Scholar] [CrossRef] [PubMed]
  9. Rodrigues, L.; Cintra, R.; Castilho, C.; Pereira, O.; Pimentel, T. Influences of forest structure and landscape features on spatial variation in species composition in a palm community in central Amazonia. J. Trop. Ecol. 2014, 30, 565–578. [Google Scholar] [CrossRef]
  10. Salm, R.; Prates, A.; Simões, N.R.; Feder, L. Palm community transitions along a topographic gradient from floodplain to terra firme in the eastern Amazon. Acta Amaz. 2015, 45, 65–74. [Google Scholar] [CrossRef]
  11. Jucker, T.; Bongalov, B.; Burslem, D.F.R.P.; Nilus, R.; Dalponte, M.; Lewis, S.L.; Phillips, O.L.; Qie, L.; Coomes, D.A. Topography shapes the structure, composition and function of tropical forest landscapes. Ecol. Lett. 2018, 21, 989–1000. [Google Scholar] [CrossRef] [PubMed]
  12. Muscarella, R.; Bacon, C.D.; Faurby, S.; Antonelli, A.; Kristiansen, S.M.; Svenning, J.C.; Balslev, H. Soil fertility and flood regime are correlated with phylogenetic structure of Amazonian palm communities. Ann. Bot. 2019, 123, 641–655. [Google Scholar] [CrossRef] [PubMed]
  13. Zuleta, D.; Russo, S.E.; Barona, A.; Barreto-Silva, J.S.; Cardenas, D.; Castaño, N.; Davies, S.J.; Detto, M.; Sua, S.; Turner, B.L.; et al. Importance of topography for tree species habitat distributions in a terra firme forest in the Colombian Amazon. Plant Soil 2020, 450, 133–149. [Google Scholar] [CrossRef]
  14. Duque, A.; Cavelier, J.; Posada, A. Strategies of Tree Occupation at a Local Scale in terra firme Forests in the Colombian Amazon. Biotropica 2003, 35, 20–27. [Google Scholar] [CrossRef]
  15. Kristiansen, T.; Svenning, J.C.; Pedersen, D.; Eiserhardt, W.L.; Grández, C.; Balslev, H. Local and regional palm (Arecaceae) species richness patterns and their cross-scale determinants in the western Amazon. J. Ecol. 2011, 99, 1001–1015. [Google Scholar] [CrossRef]
  16. Réjou-Méchain, M.; Flores, O.; Bourland, N.; Doucet, J.L.; Fétéké, R.F.; Pasquier, A.; Hardy, O.J. Spatial aggregation of tropical trees at multiple spatial scales. J. Ecol. 2011, 99, 1373–1381. [Google Scholar] [CrossRef]
  17. Law, R.; Illian, J.; Burslem, D.F.R.P.; Gratzer, G.; Gunatilleke, C.V.S.; Gunatilleke, I.A.U.N. Ecological information from spatial patterns of plants: Insights from point process theory. J. Ecol. 2009, 97, 616–628. [Google Scholar] [CrossRef]
  18. Ben-Said, M. Spatial point-pattern analysis as a powerful tool in identifying pattern-process relationships in plant ecology: An updated review. Ecol. Process. 2021, 10, 56. [Google Scholar] [CrossRef]
  19. Ripley, B.D. Modelling Spatial Patterns. J. R. Stat. Soc. Ser. B (Methodol.) 1977, 39, 172–212. [Google Scholar] [CrossRef]
  20. Besag, J. Discussion on Dr Ripley’s Paper. J. R. Stat. Soc. Ser. B Stat. Methodol. 1977, 39, 193–195. [Google Scholar] [CrossRef]
  21. Stoyan, D.; Stoyan, H. Fractals, Random Shapes and Point Fields. Methods of Geometrical Statistics; John Wiley & Sons: Chichester, UK, 1994. [Google Scholar]
  22. Wiegand, T.; Moloney, K.A. Rings, circles, and null-models for point pattern analysis in ecology. Oikos 2004, 104, 209–229. [Google Scholar] [CrossRef]
  23. Velázquez, E.; Martínez, I.; Getzin, S.; Moloney, K.A.; Wiegand, T. An evaluation of the state of spatial point pattern analysis in ecology. Ecography 2016, 39, 1042–1055. [Google Scholar] [CrossRef]
  24. Ferreira, M.P.; Almeida, D.R.A.d.; Papa, D.d.A.; Minervino, J.B.S.; Veras, H.F.P.; Formighieri, A.; Santos, C.A.N.; Ferreira, M.A.D.; Figueiredo, E.O.; Ferreira, E.J.L. Individual tree detection and species classification of Amazonian palms using UAV images and deep learning. For. Ecol. Manag. 2020, 475, 118397. [Google Scholar] [CrossRef]
  25. Wagner, F.H.; Dalagnol, R.; Tagle Casapia, X.; Streher, A.S.; Phillips, O.L.; Gloor, E.; Aragão, L.E.O.C. Regional Mapping and Spatial Distribution Analysis of Canopy Palms in an Amazon Forest Using Deep Learning and VHR Images. Remote Sens. 2020, 12, 2225. [Google Scholar] [CrossRef]
  26. Arce, L.S.D.; Osco, L.P.; Arruda, M.d.S.d.; Furuya, D.E.G.; Ramos, A.P.M.; Aoki, C.; Pott, A.; Fatholahi, S.; Li, J.; Araújo, F.F.d.; et al. Mauritia flexuosa palm trees airborne mapping with deep convolutional neural network. Sci. Rep. 2021, 11, 19619. [Google Scholar] [CrossRef] [PubMed]
  27. Cui, K.; Shao, Z.; Larsen, G.; Pauca, V.; Alqahtani, S.; Segurado, D.; Pinheiro, J.; Wang, M.; Lutz, D.; Plemmons, R.; et al. PalmProbNet: A Probabilistic Approach to Understanding Palm Distributions in Ecuadorian Tropical Forest via Transfer Learning. In Proceedings of the 2024 ACM Southeast Conference, Marietta, GA, USA, 18–20 April 2024. [Google Scholar]
  28. Jensen, J.R. Remote Sensing of the Environment: An Earth Resource Perspective, 2nd ed.; Pearson Education Inc.: Boston, MA, USA, 2007. [Google Scholar]
  29. Jawak, S.D.; Luis, A.J. A Comprehensive Evaluation of PAN-Sharpening Algorithms Coupled with Resampling Methods for Image Synthesis of Very High Resolution Remotely Sensed Satellite Data. Adv. Remote Sens. 2013, 2, 332–344. [Google Scholar] [CrossRef]
  30. Tobler, W. Measuring spatial resolution. In Proceedings of the Proceedings, Land Resources Information Systems Conference, Beijing, China, 25–28 May 1987; pp. 12–16. [Google Scholar]
  31. Asner, G.P. Biophysical and Biochemical Sources of Variability in Canopy Reflectance. Remote Sens. Environ. 1998, 64, 234–253. [Google Scholar] [CrossRef]
  32. Ferreira, M.P.; Zortea, M.; Zanotta, D.C.; Shimabukuro, Y.E.; De Souza Filho, C.R. Mapping tree species in tropical seasonal semi-deciduous forests with hyperspectral and multispectral data. Remote Sens. Environ. 2016, 179, 66–78. [Google Scholar] [CrossRef]
  33. Granville, J.J. Life forms and growth strategies of Guianan palms as related to their ecology. Bull. L’institut Français D’études Andin. 1992, 21, 533–548. [Google Scholar] [CrossRef]
  34. Drouillard, M.J.; Cummings, A.R. Regional-Scale Detection of Palms Using VHR Satellite Imagery and Deep Learning in the Guyanese Rainforest. Remote Sens. 2024, 16, 4642. [Google Scholar] [CrossRef]
  35. Valeriano, M.M.; Kuplich, T.M.; Storino, M.; Amaral, B.D.; Mendes, J.N.; Lima, D.J. Modeling small watersheds in Brazilian Amazonia with shuttle radar topographic mission-90m data. Comput. Geosci. 2006, 32, 1169–1181. [Google Scholar] [CrossRef]
  36. Hack, J.T. Studies of Longitudinal Stream Profiles in Virginia and Maryland; Series: Professional Paper; US Government Printing Office: Washington, DC, USA, 1957; Volume 294.
  37. Poggio, L.; de Sousa, L.M.; Batjes, N.H.; Heuvelink, G.B.M.; Kempen, B.; Ribeiro, E.; Rossiter, D. SoilGrids 2.0: Producing soil information for the globe with quantified spatial uncertainty. Soil 2021, 7, 217–240. [Google Scholar] [CrossRef]
  38. Turek, M.E.; Poggio, L.; Batjes, N.H.; Armindo, R.A.; De Jong Van Lier, Q.; De Sousa, L.; Heuvelink, G.B. Global mapping of volumetric water retention at 100, 330 and 15 000 cm suction using the WoSIS database. Int. Soil Water Conserv. Res. 2023, 11, 225–239. [Google Scholar] [CrossRef]
  39. Normand, S.; Vormisto, J.; Svenning, J.C.; Grández, C.; Balslev, H. Geographical and Environmental Controls of Palm Beta Diversity in Paleo-Riverine Terrace Forests in Amazonian Peru. Plant Ecol. 2006, 186, 161–176. [Google Scholar] [CrossRef]
  40. Baddeley, A.; Turner, R. Modelling Spatial Point Patterns in R. In Case Studies in Spatial Point Process Modeling; Baddeley, A., Gregori, P., Mateu, J., Stoica, R., Stoyan, D., Eds.; Series Title: Lecture Notes in Statistics; Springer: New York, NY, USA, 2006; Volume 185, pp. 23–74. [Google Scholar] [CrossRef]
  41. Cressie, N.; Read, T.R.C. Multinomial Goodness-of-Fit Tests. J. R. Stat. Soc. Ser. B (Methodol.) 1984, 46, 440–464. [Google Scholar] [CrossRef]
  42. Morista, M. Measuring of dispersion of individuals and analysis of the distributional patterns. Jpn. J. Ecol. 1961, 11, 252. [Google Scholar] [CrossRef]
  43. Baddeley, A.J.; Møller, J.; Waagepetersen, R. Non- and semi-parametric estimation of interaction in inhomogeneous point patterns. Stat. Neerl. 2000, 54, 329–350. [Google Scholar] [CrossRef]
  44. Pommerening, A.; Stoyan, D. Edge-correction needs in estimating indices of spatial forest structure. Can. J. For. Res. 2006, 36, 1723–1739. [Google Scholar] [CrossRef]
  45. Ohser, J. On estimators for the reduced second moment measure of point processes. Ser. Stat. 1983, 14, 63–71. [Google Scholar] [CrossRef]
  46. Campello, R.J.G.B.; Moulavi, D.; Zimek, A.; Sander, J. Hierarchical Density Estimates for Data Clustering, Visualization, and Outlier Detection. ACM Trans. Knowl. Discov. Data 2015, 10, 1–51. [Google Scholar] [CrossRef]
  47. Rui, X.; Wunsch, D. Survey of clustering algorithms. IEEE Trans. Neural Netw. 2005, 16, 645–678. [Google Scholar] [CrossRef]
  48. Chadoeuf, J.; Goulard, M.; Pellerin, S. A Gibbs point process on a finite series of circles:the insertion of the primary roots of maize around the stem. J. Appl. Stat. 1993, 20, 177–185. [Google Scholar] [CrossRef]
  49. Stoyan, D. Statistical Inference for a Gibbs Point Process of Mutually Non-Intersecting Discs. Biom. J. 1989, 31, 153–161. [Google Scholar] [CrossRef]
  50. Agterberg, F.P. Automatic contouring of geological maps to detect target areas for mineral exploration. J. Int. Assoc. Math. Geol. 1974, 6, 373–395. [Google Scholar] [CrossRef]
  51. McFadden, D. Conditional Logit Analysis of Qualitative Choice Behavior; Academic Press: Cambridge, MA, USA, 1974. [Google Scholar]
  52. Hensher, D.A.; Stopher, P.R. (Eds.) Behavioural Travel Modelling; Routledge: London, UK, 2021. [Google Scholar] [CrossRef]
  53. Lobo, J.M.; Jiménez-Valverde, A.; Real, R. AUC: A misleading measure of the performance of predictive distribution models. Glob. Ecol. Biogeogr. 2008, 17, 145–151. [Google Scholar] [CrossRef]
  54. Balslev, H.; Kahn, F.; Millan, B.; Svenning, J.C.; Kristiansen, T.; Borchsenius, F.; Pedersen, D.; Eiserhardt, W.L. Species Diversity and Growth Forms in Tropical American Palm Communities. Bot. Rev. 2011, 77, 381–425. [Google Scholar] [CrossRef]
  55. Eiserhardt, W.L.; Svenning, J.C.; Kissling, W.D.; Balslev, H. Geographical ecology of the palms (Arecaceae): Determinants of diversity and distributions across spatial scales. Ann. Bot. 2011, 108, 1391–1416. [Google Scholar] [CrossRef]
  56. Kristiansen, T.; Svenning, J.C.; Eiserhardt, W.L.; Pedersen, D.; Brix, H.; Munch Kristiansen, S.; Knadel, M.; Grández, C.; Balslev, H. Environment versus dispersal in the assembly of western Amazonian palm communities. J. Biogeogr. 2012, 39, 1318–1332. [Google Scholar] [CrossRef]
  57. Schietti, J.; Emilio, T.; Rennó, C.D.; Drucker, D.P.; Costa, F.R.; Nogueira, A.; Baccaro, F.B.; Figueiredo, F.; Castilho, C.V.; Kinupp, V.; et al. Vertical distance from drainage drives floristic composition changes in an Amazonian rainforest. Plant Ecol. Divers. 2014, 7, 241–253. [Google Scholar] [CrossRef]
  58. Granville, J.J. Phytogeographical Characteristics of the Guianan Forests. Taxon 1988, 37, 578–594. [Google Scholar] [CrossRef]
  59. Balslev, H.; Eiserhardt, W.; Kristiansen, T.; Pedersen, D.; Grandez, C. Palms and Palm Communities in the Upper Ucayali River Valley-a Little-Known Region in the Amazon Basin. Palms 2010, 54, 1–16. [Google Scholar]
  60. Smith, N. Palms and People in the Amazon; Geobotany Studies; Springer International Publishing: Cham, Switzerland, 2015. [Google Scholar] [CrossRef]
  61. Brum, H.D.; Souza, A.F. Flood disturbance and shade stress shape the population structure of açaí palm Euterpe precatoria, the most abundant Amazon species. Botany 2020, 98, 147–160. [Google Scholar] [CrossRef]
  62. Rennó, C.D.; Nobre, A.D.; Cuartas, L.A.; Soares, J.V.; Hodnett, M.G.; Tomasella, J.; Waterloo, M.J. HAND, a new terrain descriptor using SRTM-DEM: Mapping terra-firme rainforest environments in Amazonia. Remote Sens. Environ. 2008, 112, 3469–3481. [Google Scholar] [CrossRef]
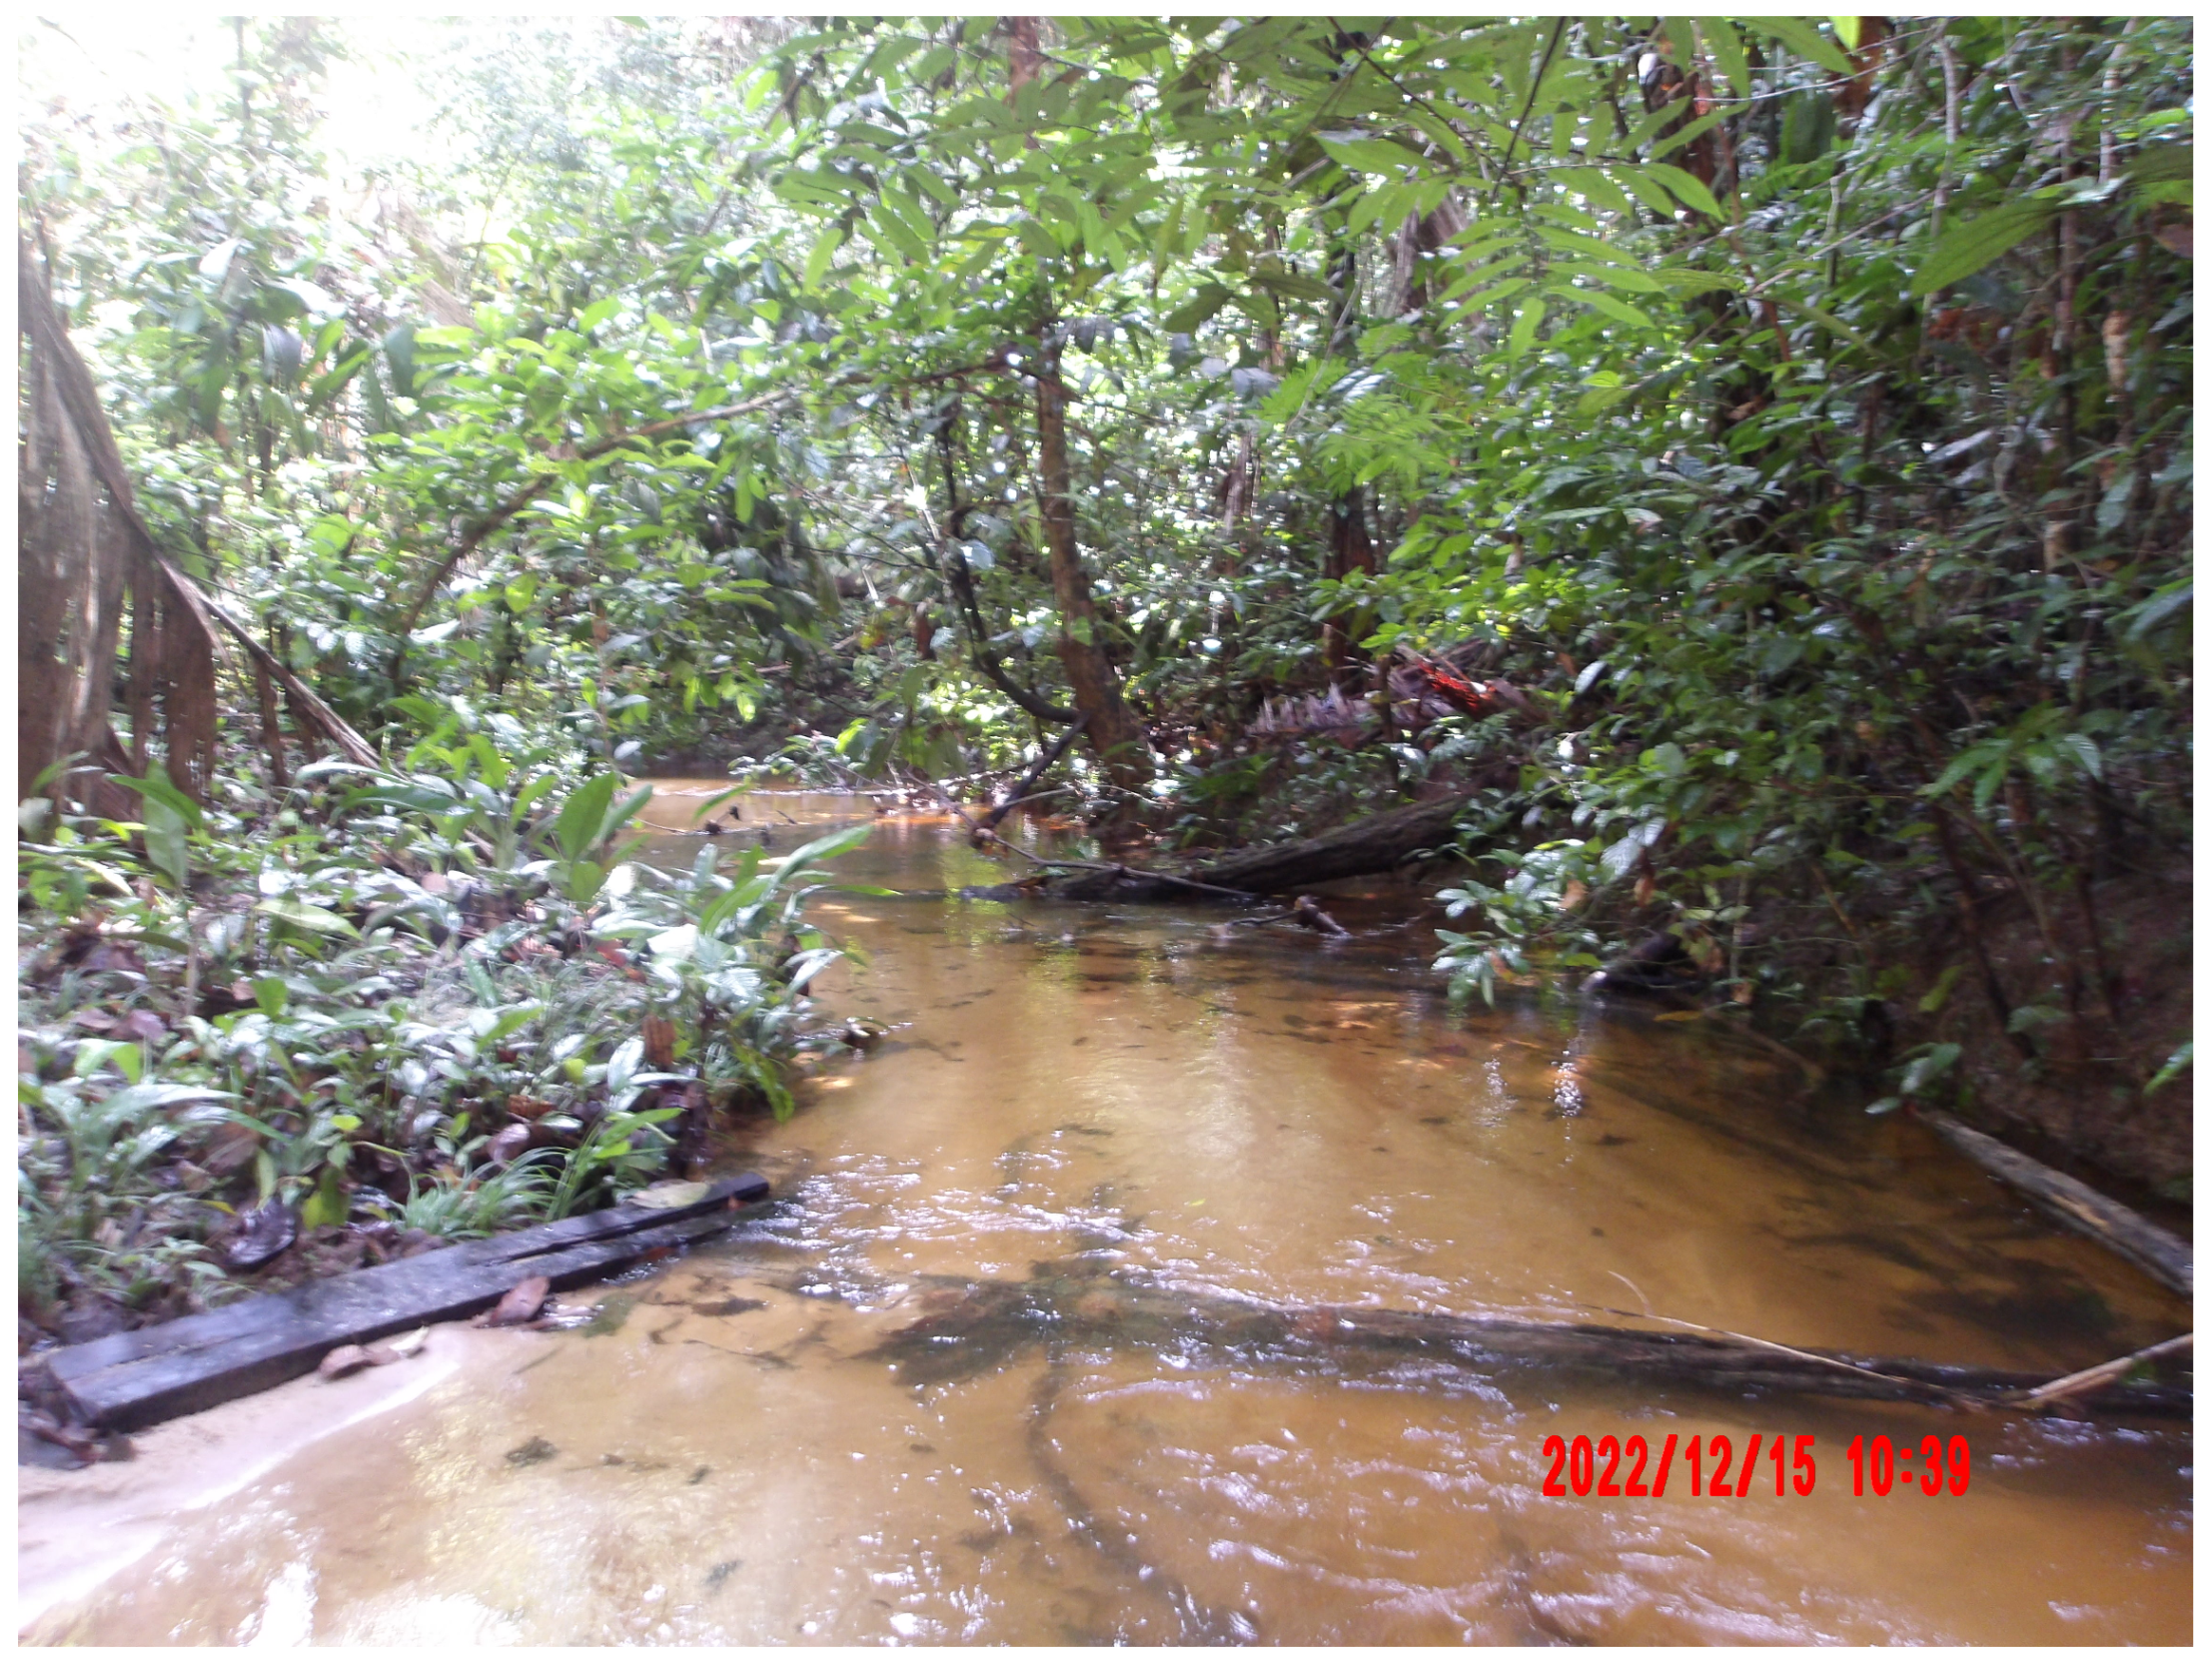
Figure 1. Example of a subcanopy waterway in the Guyanese rainforest. Photo taken by M. Drouillard, December 2022.
Remotesensing 17 00784 g001
Figure 2. Graphical demonstration of comparison between traditional SPPA of scales of interaction and cluster geometry.
Remotesensing 17 00784 g002
Figure 3. Topography and heat map of locations of palm clusters in AOI-1. The number of clustered palms is 121,837. Outlier palm locations are not accounted for in the heat map, but are often commingled in the vicinity of the clustered palms. Zones of interest for detailed analysis are shown using blue boxes and are 1 by 1 km square. The basemap image is a 30 m digital elevation model. Drainage features were derived utilizing a conventional geospatial hydrology workflow and were inferred using the elevation model.
Remotesensing 17 00784 g003
Figure 4. Topography and heat map of the locations of clustered palms in AOI-2. The number of clustered palms is 172,489. Outlier palm locations are not accounted for in the heat map, but are often commingled in the vicinity of the clustered palms. Zones of interest for detailed analysis are shown using blue boxes and are 1 by 1 km square. The basemap image is a 30 m digital elevation model. Drainage features were derived utilizing a conventional geospatial hydrology workflow and were inferred using the elevation model, with the exception of the Parabara River, which is discernible in satellite imagery.
Remotesensing 17 00784 g004
Figure 5. HDBSCAN-generated cluster-diagnostic metrics for AOI-1 (a) and AOI-2 (b). An exemplar feature is the most representative feature of a cluster based upon the underlying statistics; across all cluster size ranges, the proportion of exemplars is linear and approximately 20% of the total number of palms in the cluster. The density of the clusters is computed as the number of palms in a given cluster divided by the area of the cluster’s minimum bounding geometry polygon, in hectares.
Remotesensing 17 00784 g005
Figure 6. Example Morista Index plots from AOI-1 (a) and AOI-2 (b) with the summary and distribution of HDBSCAN clusters for comparison. The Freedman–Diaconis algorithm was used for histogram breaks due to differing cluster counts per ZOI. Where the Morista Index demonstrates variability in the locus of its aggregation scales, the HDBSCAN’s cluster size distribution correspondingly conforms, extending into the broader spatial scale in its tail-end. See Supplementary Figures S3 and S4 for Morista Index plots of all ZOI.
Remotesensing 17 00784 g006
Figure 7. Significantaggregation distances derived from the envelope of 99 simulations of the inhomogeneous L-function, compared against the l e n g t h 2 obtained from the largest cluster geometry within each ZOI. See Supplementary Figures S5 and S6 for L-function plots of all ZOI.
Remotesensing 17 00784 g007
Figure 8. Peak probability distribution distances from inhomogeneous pair correlation function vs. distribution and mean of HDBSCAN clusters’ nearest neighbor distances. See Supplementary Tables S7 and S8 for pair correlation function plots of all ZOI.
Remotesensing 17 00784 g008
Figure 9. AOI-1: The impacts of environmental predictors on point process intensity (interpreted as aggregation) at an individual level. The x-axis is in units of the independent variable, and the y-axis is the estimated intensity of the point pattern process as a function of the variable. The greatest peaks indicate the variable values where environmental predictors are inferred to have the greatest influence. Notably, the pH of soil water demonstrates very narrow peaks of variably influenced pattern intensity.
Remotesensing 17 00784 g009
Figure 10. AOI-2: The impacts of environmental predictors on point process intensity (interpreted as aggregation) at an individual level. The x-axis is in units of the independent variable, and the y-axis is the estimated intensity of the point pattern process as a function of the variable. The greatest peaks indicate the variable values where environmental predictors are inferred to have the greatest influence. Within AOI-2, the pH of soil water demonstrates similar narrow peaks of intensity to those in AOI-1, and the distance to drainage channels appears to have limited influence on point pattern intensity.
Remotesensing 17 00784 g010
Figure 11. ROC plots with AUC values for AOI-1 (top) and AOI2- (bottom). The observed AUC is the value of the actual model, while the theoretical AUC is the expected value of the model.
Remotesensing 17 00784 g011
Figure 12. Comparison of coefficient magnitudes. Top row: AOI-1 cluster (left) and outlier (right) models. Bottom row: AOI-2 cluster (left) and outlier (right) models.
Remotesensing 17 00784 g012
Figure 13. Comparison of the linear distance between individual palms in both the cluster and outlier sets versus the linear distance to the nearest drainage feature. (a): AOI-1 cluster and outlier palms; (b): AOI-2 cluster and outlier palms. Box plots are grouped by their Hack magnitude value (1 is the drainage feature with the highest magnitude, 5 is the lowest). Color shading and box widths are indicative of the overall number of palm features in each group. The overall number of features in each subdivision is annotated in red.
Remotesensing 17 00784 g013
Figure 14. AOI-2, with an example of the Parabara River flood zone. From north to south, the distance devoid of palms is approximately 600 m. The DEM shows this to be a shallow basin surrounding the river; in the satellite image, it is heavily vegetated, yet no palms are detected in this location.
Remotesensing 17 00784 g014
Table 1. Beta coefficients, standard error, and level of significance results from logistic models of palm cluster and outlier features in AOI-1 (top) and AOI-2 (bottom). The McFadden R2 is 0.22 for both models in AOI-1, and 0.24 for both in AOI-2.
AOI-1 Cluster ModelAOI-1 Outlier Model
EstimateStd. Errorz valuePr(>|z|)EstimateStd. Errorz valuePr(>|z|)
CEC0.18650.006031.14***0.30910.006249.92***
Drain_Dist−0.04060.0053−7.61***−0.09510.0056−17.04***
Elevation0.06930.006610.43***−0.00570.0070−0.81
Nitrogen0.02910.00714.09***−0.00860.0073−1.17
pH_Wat−0.19220.0067−28.83***−0.27090.0071−38.27***
Sand0.06050.005411.24***0.02140.00563.85***
Slope−0.16700.0069−24.27***−0.07170.0069−10.35***
Vwat0.07600.006811.10***0.09900.007213.67***
AOI-2 Cluster ModelAOI-2 Outlier Model
EstimateStd. Errorz valuePr(>|z|)EstimateStd. Errorz valuePr(>|z|)
CEC−0.02550.0040−6.33***−0.01340.0042−3.21**
Dep_Dist0.03300.00408.27***0.02950.00417.16***
Elevation−0.39110.0078−50.44***−0.14770.0070−20.98***
Nitr-0.07070.0045−15.84***−0.07990.0048−16.79***
pH_Wat0.05440.004611.88***−0.09390.0049−19.12***
Sand0.06350.004613.69***0.15140.004831.47***
Slope−0.02640.0049−5.41***−0.09930.0052−19.10***
Vwat0.00320.00460.69 −0.05040.0048−10.59***
Significance: 0.001 “***”; 0.01 “**”; >0.05 “ ”.
Disclaimer/Publisher’s Note: The statements, opinions and data contained in all publications are solely those of the individual author(s) and contributor(s) and not of MDPI and/or the editor(s). MDPI and/or the editor(s) disclaim responsibility for any injury to people or property resulting from any ideas, methods, instructions or products referred to in the content.