Technical Note

A Robust Digital Elevation Model-Based Registration Method for Mini-RF/Mini-SAR Images

1
National Key Laboratory of Microwave Imaging Technology, Aerospace Information Research Institute, Chinese Academy of Sciences, Beijing 100190, China
2
School of Electronic, Electrical and Communication Engineering, University of Chinese Academy of Sciences, Beijing 100049, China
3
Planetary Remote Sensing Laboratory, Department of Land Surveying and Geo-Informatics, The Hong Kong Polytechnic University, Hong Kong, China
*
Author to whom correspondence should be addressed.
Remote Sens. 2025, 17(4), 613; https://doi.org/10.3390/rs17040613
Submission received: 23 December 2024 / Revised: 7 February 2025 / Accepted: 10 February 2025 / Published: 11 February 2025
(This article belongs to the Section Engineering Remote Sensing)

Abstract

:
SAR data from the lunar spaceborne Reconnaissance Orbiter’s (LRO) Mini-RF and Chandrayaan-1’s Mini-SAR provide valuable insights into the properties of the lunar surface. However, public lunar SAR data products are not properly registered and are limited by localization issues. Existing registration methods for Earth SAR have proven to be inadequate in their robustness for lunar data registration. And current research on methods for lunar SAR has not yet focused on producing globally registered datasets. To solve these problems, this article introduces a robust automatic registration method tailored for S-band Level-1 Mini-RF and Mini-SAR data with the assistance of lunar DEM. A simulated SAR image based on real lunar DEM data is first generated to assist the registration work, and then an offset calculation approach based on normalized cross-correlation (NCC) and specific processing, including background removal, is proposed to achieve the registration between the simulated image, and the real image. When applying Mini-RF images and Mini-SAR images, high robustness and good accuracy are exhibited, which produces fully registered datasets. After processing using the proposed method, the average error between Mini-RF images and DEM references was reduced from approximately 3000 m to about 100 m. To further explore the additional improvement of the proposed method, the registered lunar SAR datasets are used for further analysis, including a review of the circular polarization ratio (CPR) characteristics of anomalous craters.

1. Introduction

Synthetic aperture radar (SAR) data from the Lunar Reconnaissance Orbiter’s Mini-RF [1] and Chandrayaan-1’s Mini-SAR [2] are invaluable for investigating the surface and shallow subsurface properties of the Moon, leveraging their penetration capabilities. Both Mini-RF and Mini-SAR employ advanced wideband hybrid polarization technology, transmitting right circularly polarized waves and receiving horizontally and vertically polarized waves. This setup enables the measurement of Stokes parameters for the reflected signals from the lunar surface [3], supporting the generation of a more accurate circular polarization ratio (CPR) and polarization decomposition characteristics. These parameters are crucial for multi-source data analysis and fusion.
Before such analyses can be conducted, precise image registration, which means the spatial matching of two images, is a fundamental prerequisite in the geolocation of remote-sensing data [4]. The calibrated and mapped Mini-SAR/Mini-RF images (Level-2 data) released by NASA on the Planetary Data System (PDS) have gone through a map projection and orthorectification process with DEM data. Though these procedures eliminate the majority of location errors from the terrain, the final processed SAR data cannot be aligned with data from other instruments on the same spacecraft and exhibits significant geometric distortion. This phenomenon indicates that additional registration work is required in data processing.
The correction of the above localization errors can be modeled as a heterogeneous image registration problem between SAR and optical/DEM data. The SAR-optical alignment is especially tricky due to radiometric and geometric differences. SAR and optical/DEM images from the same area differ in spatial resolution, spatial alignment, satellite type, and temporal dimensions [5]. These existing issues pose challenges to SAR-optical/DEM registration methods.
According to Sourabh Paul’s systematic review of current remote sensing image registration methods [6] and their application in SAR images [5], the solution to SAR-optical/DEM image registration can be broadly categorized into intensity-based and feature-based approaches, depending on the specific method employed.
(1)
Intensity-based registration methods, or so-called area-based methods, include the normalized cross-correlation (NCC) method [7] and the mutual information (MI) method [8,9], which rely on calculating image similarity measures within specific regions to achieve alignment. These methods directly compare pixel intensities between images, making them suitable for scenarios with minimal radiometric or geometric differences. Intensity-based registration methods have fewer requirements for the quality and similarity of the two images, but they can only register errors with rigid transformation, including translation and rotation.
(2)
Handcrafted feature-based registration methods focus on identifying distinct points in images where grayscale values exhibit significant variation across multiple directions. These “features” form the basis for alignment. A critical aspect of these methods, exemplified by SAR-SIFT and PSO-SIFT techniques [10,11], is the robust extraction and description of feature points. Regarding recent studies, Stefan proposed BRISK [12], a novel method for key point detection, description, and matching, with an adaptive, high-quality performance and a dramatically lower computational cost. Pablo introduced a novel multiscale 2D feature detection and description algorithm in nonlinear scale spaces, which is named KAZE features [13], to reduce the effect of blurring and noise. The precondition of feature extraction is that two images must have a certain degree of structural similarity and richness of certain specific structures, such as corner points [14], edges [15], polygonal regions, and rapid gradient changes. Taking cases of earth SAR images as an example, images of forests and rural areas contain few corner points and polygonal regions, and thus, the presented handcrafted methods can produce more stable results in urban areas than rural areas.
(3)
Deep learning feature-based registration methods. Recently, neural networks have been used to extract features automatically from the heterogeneous image pair, as opposed to the traditional feature methods mentioned above. Merkle et al. [16] proposed the first notable example of a Siamese machine-learning architecture to perform SAR-optical image registration. Zhou et al. [17] extracted multi-orientated gradient features using CFOG descriptors to depict the structure properties of images. Deep learning-based methods can bridge the radiometric differences between optical and SAR images to extract common features. But achieving satisfactory results requires a large amount of data for model pre-training and training.
Generally, intensity/area-based registration methods offer the best algorithm efficiency and versatility but are limited in the types of transformations they can correct. The two types of feature-based methods above could handle more complex image transformations but impose higher requirements on image similarity and quality. Intensity-based methods are typically used for processing large-scale data with simple deformations, while feature-based methods are generally preferred for the fine registration of small-scale datasets. Given the large data volume, extensive coverage, and relatively simple transformation types in this study, intensity-based methods best meet the research requirements.
For lunar SAR data such as Mini-RF and Mini-SAR, the registration process faces additional challenges due to the inherent quality issues of lunar remote-sensing datasets and characteristics of lunar terrain. In certain regions, such as mid-to-low latitudes and parts of the North Pole, the low Signal-to-Noise Ratio (SNR) in Mini-RF images can result in the loss of features, compromising registration accuracy. This issue is particularly pronounced at the image edges, where the regions lie on the margins of the beam pattern and are only partially illuminated. At the same time, Lunar SAR images lack corner points, have blurred edge information, and exhibit a greater information gap with reference images such as optical or DEM data compared to terrestrial SAR images. These differences may result in feature points extracted by traditional feature extraction methods lacking valid information, thus affecting the matching process.
Moreover, Mini-RF instruments have relatively low resolutions, with 30 m/pixel in zoom mode (after multi-view processing). The reference basemaps, such as Wide-Angle Camera (WAC) images and the SELENE and LRO Digital Elevation Model (SLDEM), also have lower resolutions compared to similar Earth-based products. Although the Narrow-Angle Camera (NAC) offers a higher resolution of 0.5–2 m/pixel, it cannot serve as the reference basemap due to Permanent Shadow Regions (PSRs) and orbital errors in the LRO mission [18,19].
Because of these limitations, conventional registration methods developed for Earth SAR images are not directly applicable to lunar images. It is not just the issue of heterogeneous image registration; the differences in image quality and lunar landform structure characteristics also result in the poor performance of Earth SAR image registration methods. And deep learning methods face the challenge of insufficient pre-trained models and training data. To address these challenges, new registration methods need to be proposed to adapt lunar datasets [20].
For the application of remote sensing image registration methods on the Moon, there have already been some studies and attempts. Referring to the existing research work, the LRO QuickMap [21] provides a registered mosaic of Mini-RF data for the lunar South and North Poles. But this mosaic provides no comparable registration results for the mid- and low-latitude regions. Fassett [22] proposed a registration and map-projection process for calibrated Level-1 data based on correlation techniques to mitigate topographic effects in Mini-RF S-band observations. While this process has been demonstrated to be effective for images with large-scale features, its performance on images with mainly smaller-scale objects, such as secondary craters, remains inconsistent.
To solve the problems of existing approaches and produce precisely registered SAR images, this article introduces a DEM-based registration method to correct along-track and cross-track offsets in Mini-RF Level-1 data (calibrated images). This method was inspired by Fassett’s research on Level-1 data [22,23] and GAMMA’s data processing techniques [24], using the Digital Elevation Model (DEM) on lunar terrain for simulation and normalized cross-correlation for registration. A scattering model with input as the local incidence angle was used to generate the simulated image. An image enhancement method of background elimination was also applied to address the issue of significant differences in information between images and improve registration performance. And an offset calculation approach based on NCC was applied to achieve the registration between the simulated image and the real image. The proposed method offers a robust and effective solution for data registration across all latitudes.
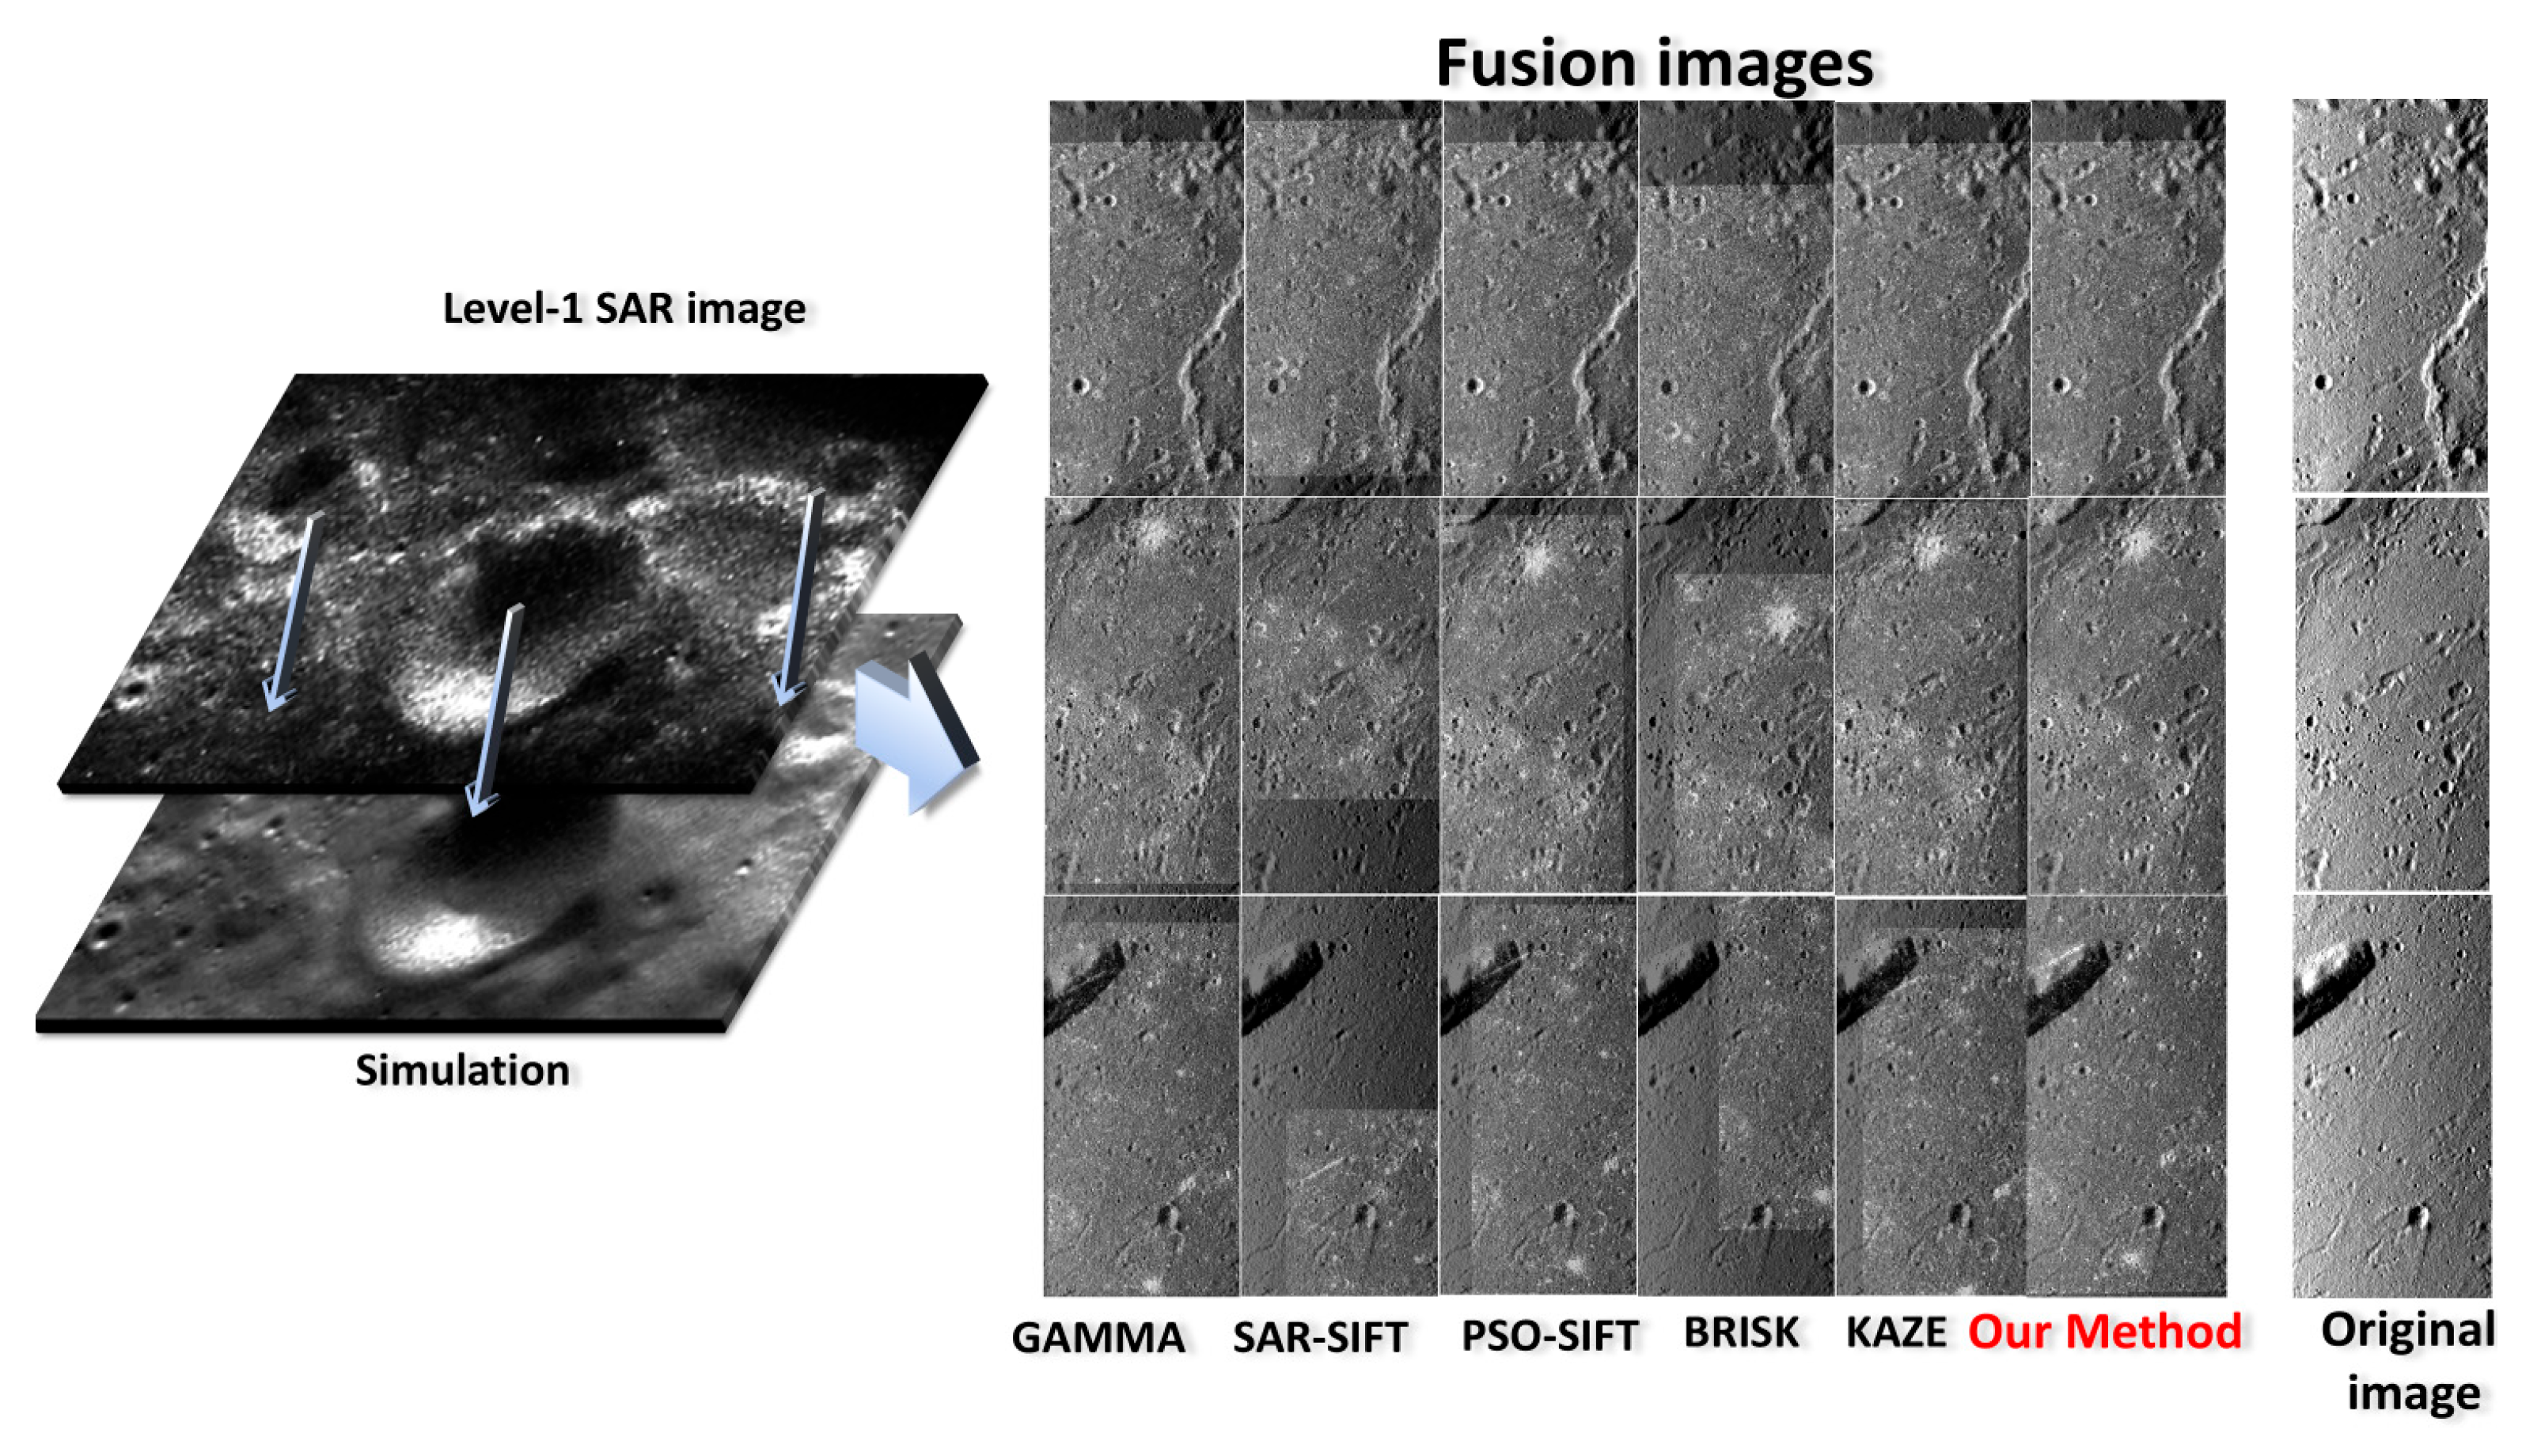
The proposed method was applied to the entire Mini-RF S-band dataset (6584 images after excluding data with equipment malfunctions) and the Mini-SAR S-band dataset (735 images after similar exclusions). The accuracy and performance of the registration method were evaluated on a global scale, and its robustness was verified by comparisons with Level 2 data processed with other methods.
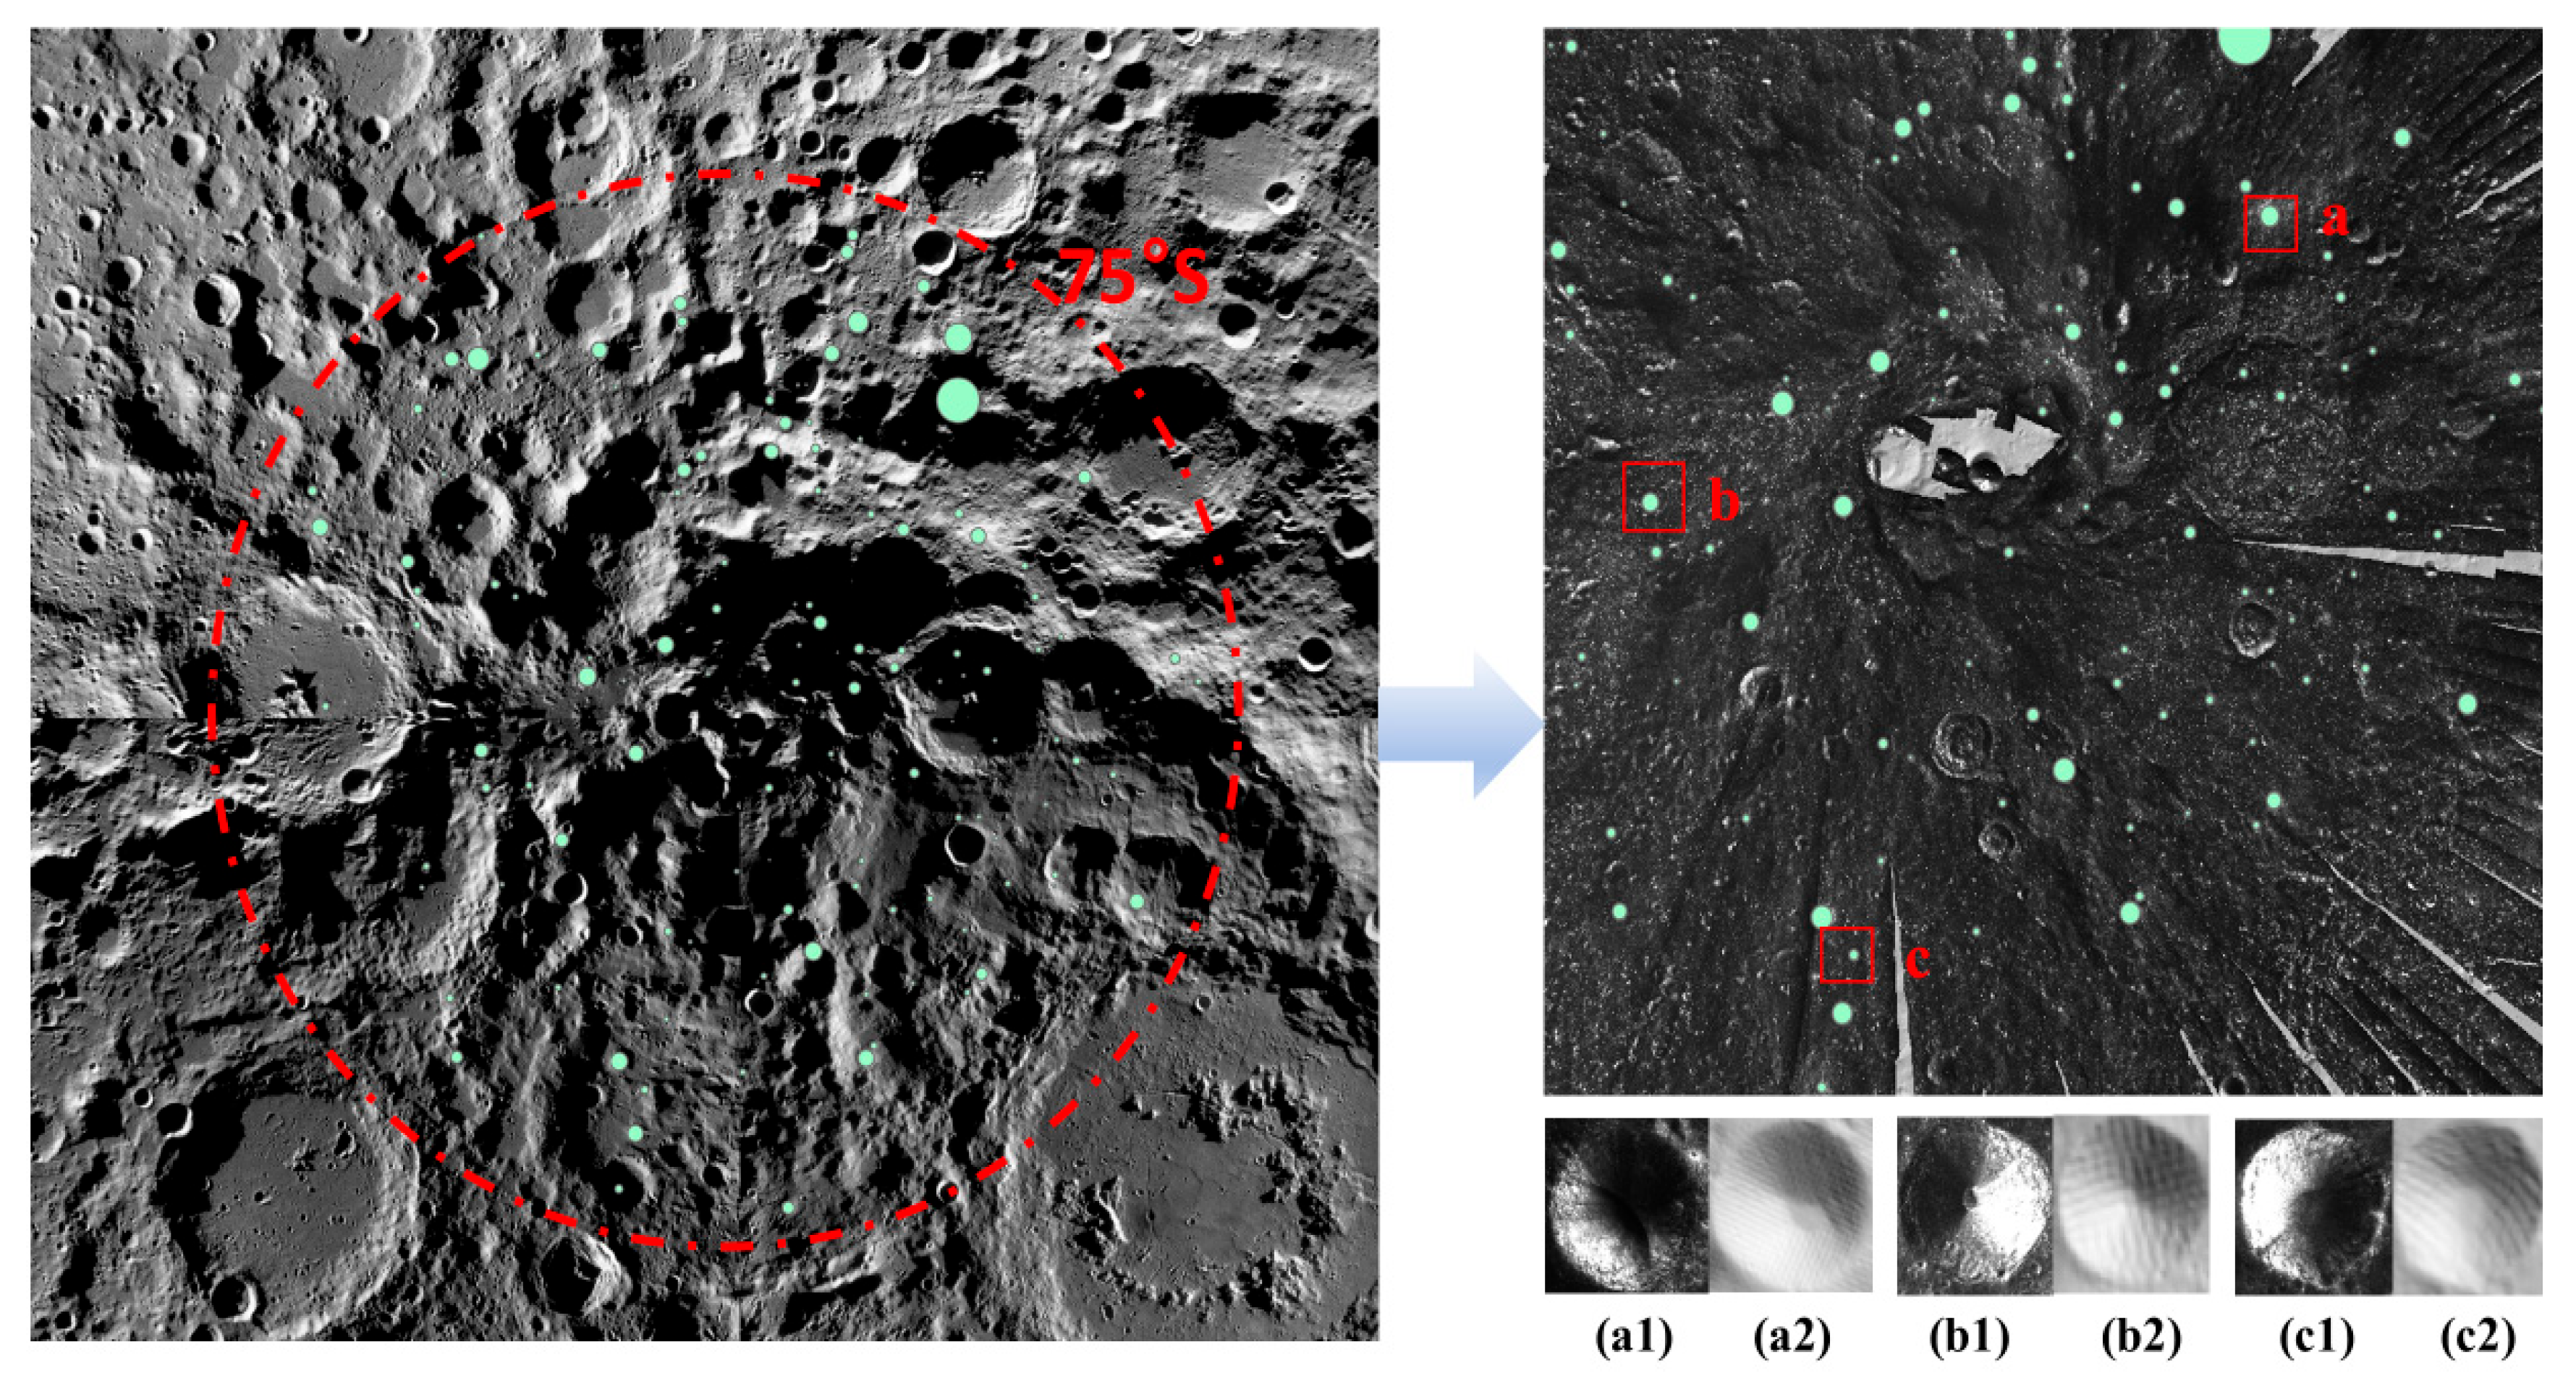
After completing the accuracy assessment, the registered full-moon SAR datasets were completed. The registered data were further utilized for the circular polarization ratio (CPR) analysis of anomalous craters in the lunar South Pole. The results demonstrate that the improved registration process significantly impacts CPR analysis, enabling the correction of average CPR statistics for geological targets such as craters, thereby enhancing the reliability of the interpretations.
This article is divided into five main parts: Introduction (Section 1), Dataset (Section 2), Methodology (Section 3), Experiment Results and Discussion (Section 4) and Conclusions (Section 5). In the Dataset part (Section 2), the source and characteristics of the remote-sensing datasets used in the experiment are introduced. In the Methodology part (Section 3), the basic framework and theories of the proposed method are discussed. The Experiment Results and Discussion section (Section 4) mainly discusses the validation process of the algorithm’s effectiveness, robustness, and the results of data analysis.

2. Dataset

2.1. Lunar SAR Data

Mini-RF operates as a hybrid polarimetric SAR at S-band (12.6 cm) and X-band (4.2 cm), functioning in the following two modes: baseline and zoom. Its observations cover approximately 67% of the lunar surface, including nearly complete coverage of the North and South Poles [3]. Mini-SAR is a single-frequency (S-band) hybrid polarimetric SAR operating in a baseline mode with a range/azimuth resolution of 150 m, focusing on the South Pole region of the Moon [25].
For Mini-RF data, this study focused on S-band zoom mode data with a resolution of 15 × 30 m (azimuth/range) because of their stable data quality and wide coverage, while X-band data have quality problems in radar imaging. After multi-view processing, the actual resolution of the image was 30 × 30 m.
For Mini-SAR data, this study focused on 150 m/pixel S-band data. As a technological precursor to Mini-RF, the processing and analyzing method of Mini-SAR data is basically the same as Mini-RF.

2.2. LOLA DEM/SLDEM

The LOLA Digital Elevation Model (LOLA DEM) is the Digital Elevation Model produced by LRO’s Lunar Orbiter Laser Altimeter (LOLA) [26]. LOLA is a time-of-flight laser altimeter operating at a firing rate of 28 Hz. And LOLA DEM has a vertical resolution of ~3 to 4 m and a horizontal resolution related to the local latitude. The horizontal resolution can reach 30 m/pixel between 75° and 90°. But in low-latitude regions, there is a noticeable decrease in the information content and clarity of the images. The SELENE and LRO Digital Elevation Model (SLDEM) is an improved DEM covering latitudes within ±60°. Co-registered SELENE Terrain Camera (TC) data are used to estimate and correct orbital and pointing geolocation errors from LOLA altimetric profiles [27].
In the research, a mosaic is generated with LOLA DEM 60 m/pixel >60°/<−60° data and SLDEM 60 m/pixel data, which is proven to be a stable full-moon DEM for correlation registration. This mosaic is applied to produce hillshade images, which serve as registration references rather than WAC/NAC data because optical images do not contain enough information on permanently shadowed regions (PSRs) in polar areas.

3. Methodology

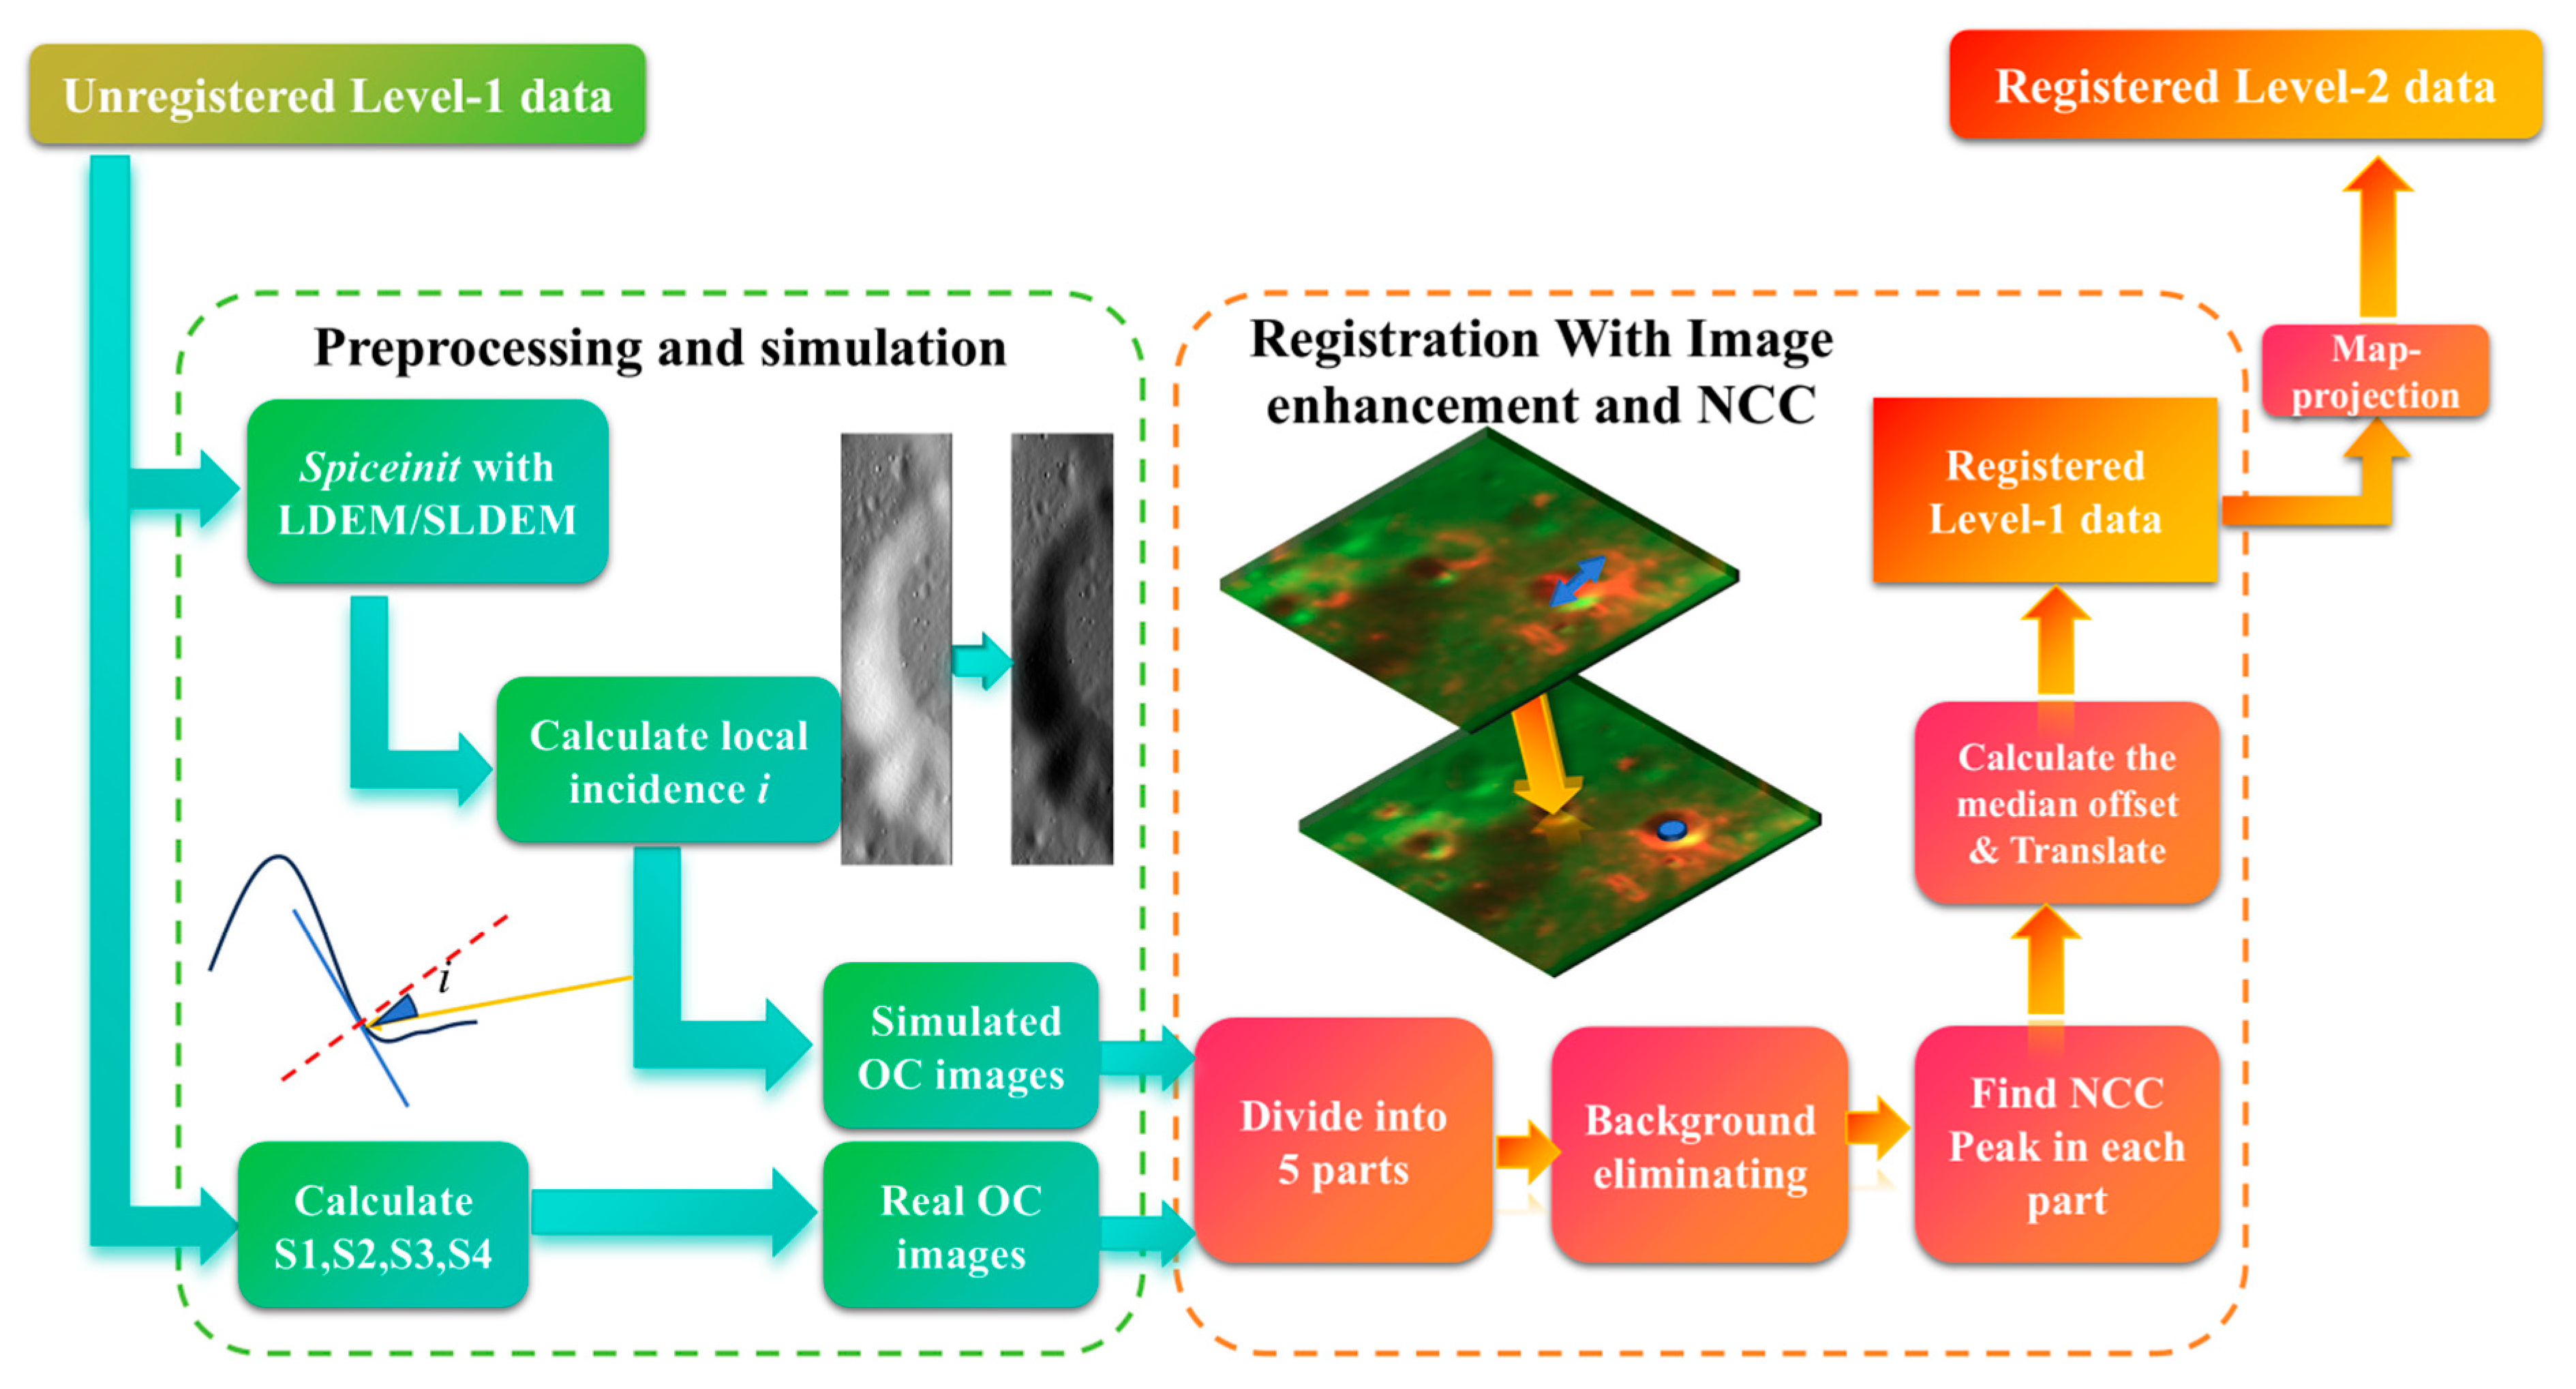
In order to realize the registration of SAR images to lunar maps, the proposed method is structured into two key parts: (1) preprocessing and simulation, which includes Stokes parameter computation and simulated image generation, and (2) registration with image enhancement and NCC, which involves image dividing, image enhancement focusing on background eliminating, and estimating the offset with co-registration, as illustrated in Figure 1.
These stages in Figure 1 collectively address the challenges in the lunar SAR data registration, ensuring improved alignment and reliability and obtaining the registered Level-1 lunar SAR data. To produce registered Level-2 data, the third step includes orthorectification and map projection and is implemented through the existing R-D positioning algorithm. After the above steps, the final registered Level-2 data product is completed.

3.1. Preprocession and Simulated Image Generation

The preprocessing step mainly follows the instructions provided by USGS, with several additional steps included in the workflow, including the generation of real/simulated OC images.
Using hybrid polarimetric echoes from Mini-RF and Mini-SAR, the Stokes parameters can be derived to describe the polarization states of the waves received. The four Stokes parameters S1, S2, S3, and S4 can be expressed as demonstrated in (1). ERH and ERV represent the horizontally and vertically polarized complex components from the right circularly polarized signal transmitted. And   E R V * indicates the conjugate of ERV in the complex domain.
S 1 S 2 S 3 S 4 = E R H 2 + E R V 2 E R H 2 E R V 2 2 R e E R H E R V * 2 I m E R H E R V *
With the Stokes parameters, same-sense ( σ S C ) and opposite-sense ( σ O C ) circular echoes and the circular polarization ratio (CPR) can also be calculated as shown in (2).
C P R = σ S C σ O C = S 1 S 4 S 1 + S 4
The OC component better reflects the variations in scattering intensity caused by terrain changes. As a result, the OC component of the SAR image is calculated for use in subsequent processes. Then, the reversed R-D model is applied to produce the back-projection of the LDEM and SLDEM data within the SAR image’s coverage area with orbital information [28].
λ R 2 f d = v x x x s + v y y y s + v z z z s R 2 = x x s 2   +   y y s 2   +   z z s 2
The R-D location model is shown in Function (3). R/ f d represents the coordinate of the ground point in the range-Doppler field. x s / y s / z s represents the coordinate of the satellite, while x / y / z represents the ground point in the geocentric coordinate system. The z information is usually provided by the DEM. By solving the equation for an approximate solution, the precise mapping relationship from the SAR image domain to the geocentric coordinate system can be obtained. And the reversed relationship can generate the DEM image in the SAR image domain. With the local DEM data, the local incidence angle, i, which is the angle between the incident wave and the vertical direction of the local terrain slope (shown in Figure 1) for the radar imaging range is derived from the back-projection.
After preprocessing, the simulation step generates a simulated SAR image to serve as a registration reference. The OC component is selected as the reference because it contains richer information about terrain variations. To perform the registration, a simulated SAR image must first be prepared. Thompson’s backscattering model for 13 cm radar waves is employed to create these radar image simulations [29]. The formula used to relate the local incidence angle i (in degrees) to the simulated backscattering intensity is shown in Equation (4). σ s i m 13 c m represents the final simulation result of the OC component, which consists of the low-angle specular component σ o c 1 13 c m and the high-angle specular component σ o c 2 13 c m .
σ s i m 13 c m = σ o c 1 13 c m + σ o c 2 13 c m σ o c 1 13 c m i = 10 0.3 0.07 i σ o c 2 13 c m i = 10 1.6 c o s 1.5 i
After the simulation step, the simulated OC image is used as the fixed reference for registration. It is necessary to mention that up-sampling or high-definition (HD) enhancement is not included in this process, as experiments have shown that up-sampling does not provide reliable improvements in registration accuracy. Instead, it only leads to an exponential increase in computational complexity.

3.2. Image Enhancement and Correlation Registration

Before proceeding to the registration step, it is necessary to determine the registration method. The choice of method depends on the transformation model of the offset. Assuming that the back-projection and simulation processes accurately capture the correct incidence direction, the offset between the real SAR image and the simulated image can be represented as a rigid transformation characterized by an along-track offset (δy) and a cross-track offset (δx).
After transformation analysis, since there is no distortion or rotation between the two images, the correlation coefficient is chosen as the metric to calculate the offset because it is more efficient and not dependent on specific image texture information, such as corner points, edges, and gradient variation.
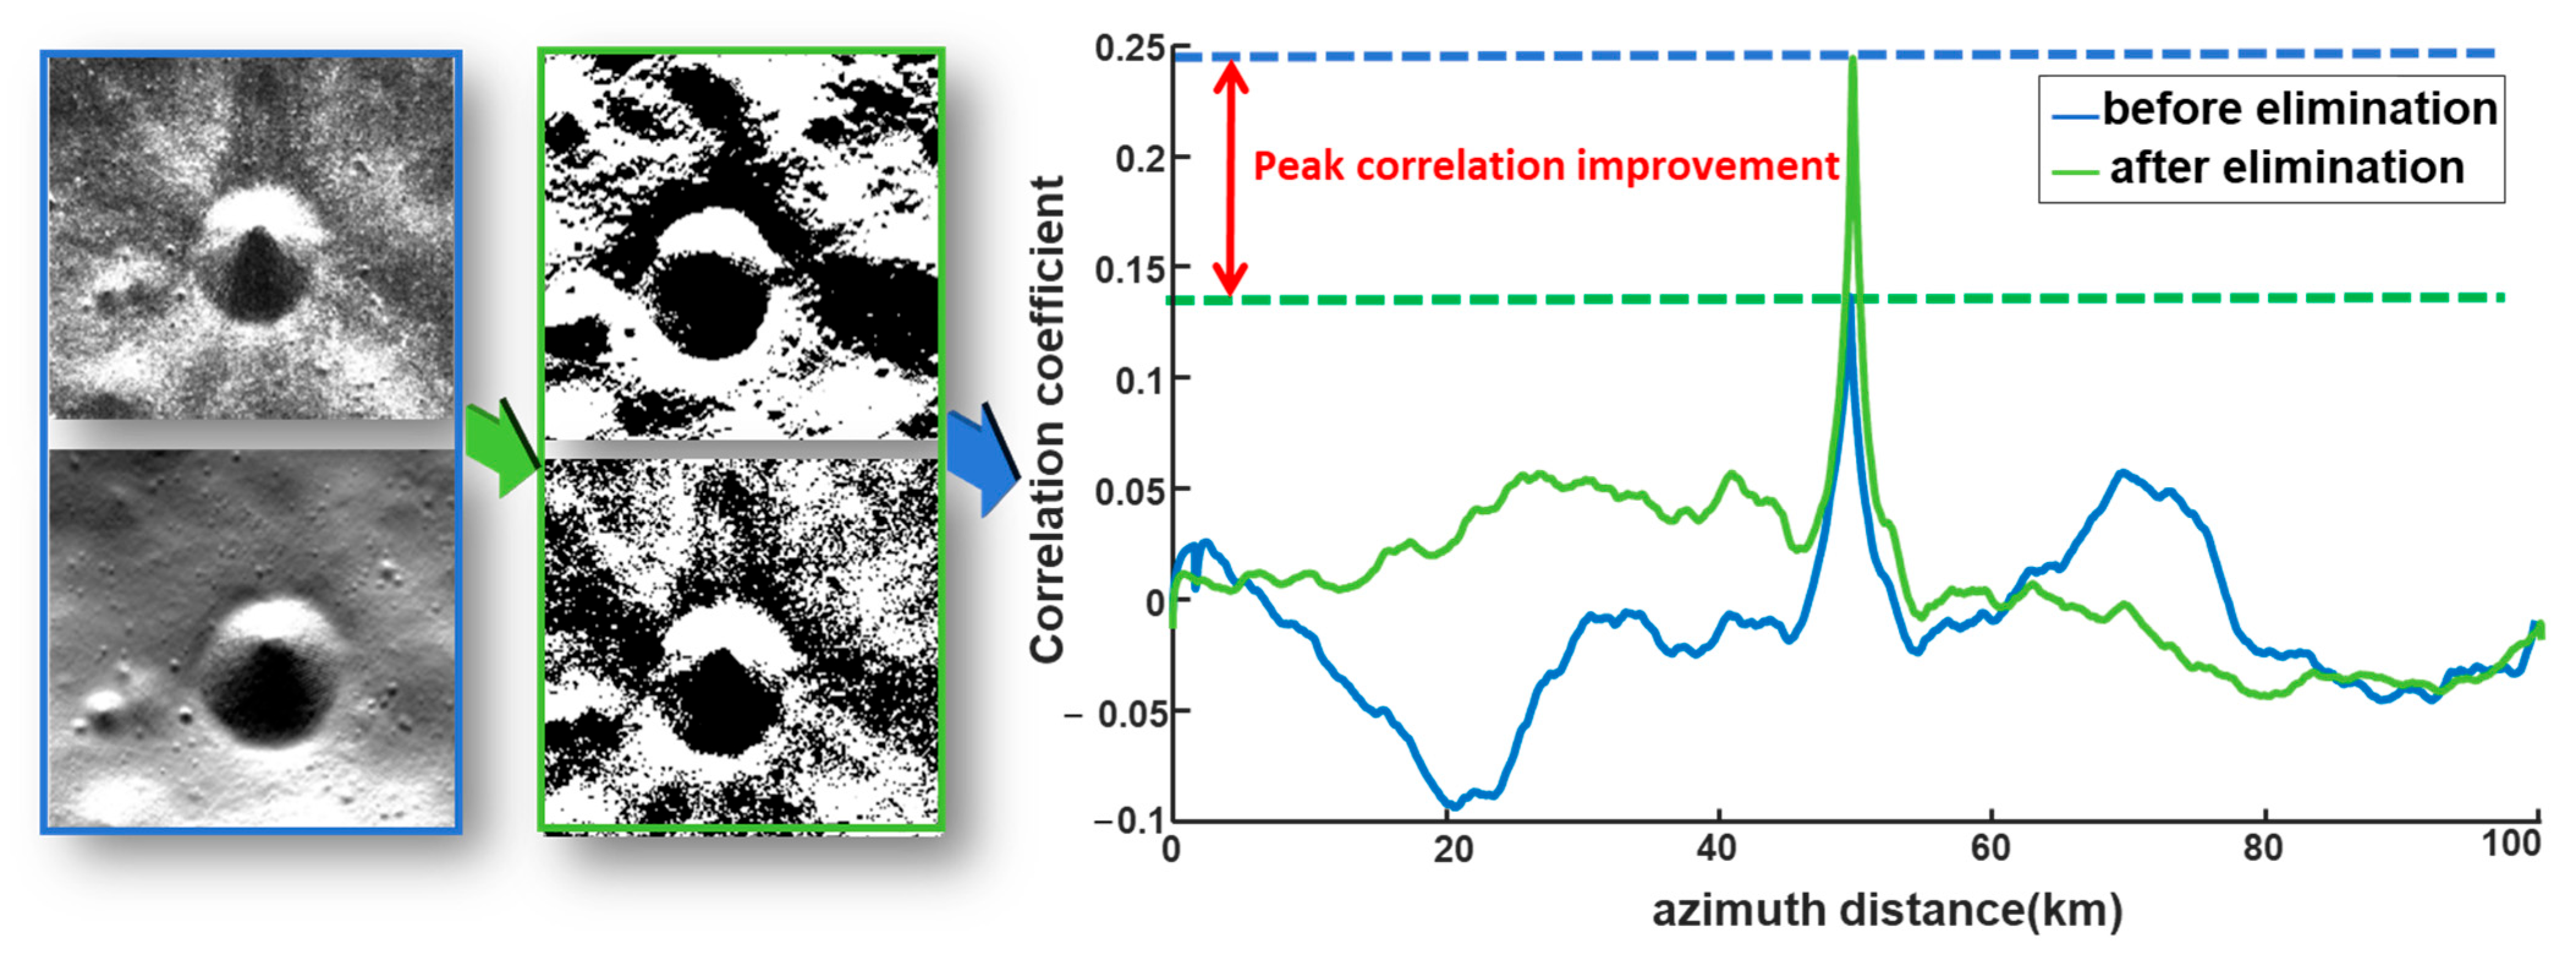
Before applying the registration method, specific image enhancement techniques are performed on the fixed and reference images to improve the final registration performance. Since the two images differ in background and texture in certain areas, image enhancement is necessary to increase the correlation between the real OC image and the simulated one.
As shown in Equation (5), the image is first multiplied by a mask ( M ), which is designed to cover the no-data regions of the real SAR image to exclude the no-data region in the simulated image and reduce computational load. To enhance edge features, such as crater rims and linear structures, a background elimination procedure inspired by the image pyramid method [30] is applied to reduce the influence of the local background. This process involves down-sampling the image, followed by up-sampling it back to its original resolution, effectively performing a low-pass filtering operation to generate a background image (   A b a c k ). The background image is then subtracted from the original image ( A ) to produce an enhanced foreground image (   A f o r e ). As illustrated in Figure 2, the improvement achieved by removing the image background is significant. The peak correlation response is enhanced by approximately 66% after background elimination.
In this procedure, the down-sampling ratio affects the final performance of the correlation and is related to the local texture information of the image. To select the best ratio for the method, 20 views of sample images are chosen to undergo background elimination with a ratio of 5:1, 10:1, 20:1, and 50:1. The average correlation peak response improvement is shown in Table 1. According to the result, 10:1 is chosen because this rate is the most stable and effective in performance. To further prove this conclusion, 100 views of Mini-RF data from the North Pole, 100 from the South Pole, and 150 from the mid-latitude area were selected to examine the matching rate of SAR data from different regions of the Moon. As shown in Table 2, as the down-sampling ratio increases, the performance of the image enhancement in mid-latitude regions rapidly declines. This phenomenon exists because an excessively high down-sampling ratio may amplify the impact of striping noise, causing a sharp decline in the enhancement’s performance in mid-latitude regions. The ratio of 10:1 is the most stable in its performance for the three kinds of areas mentioned above.
A f o r e = A A b a c k M
After the enhancement step, correlation-based registration is applied. For Mini-RF data, the fixed and moving images are first divided into five equally sized sections. The position of the peak correlation ([xp, yp]) between the original enhanced image and the simulated image is then calculated. The offsets ([δx, δy]) are determined by subtracting the center of the correlation image from [xp, yp].
Offsets are calculated for all five sections, and any results exceeding 10 km (330 pixels) are deemed invalid and discarded. The median of the remaining valid offsets is selected as the overall offset for the entire image. Finally, the translate function in ISIS is used to eliminate the calculated offset.
For Mini-SAR data, the overall scheme is similar to that of Mini-RF, with the following differences. Due to Mini-SAR’s relatively low resolution of 150 m/pixel, the effective information for registration primarily pertains to large-scale structures. To preserve the integrity of these structures, the images are divided into three sections instead of five. Additionally, the background elimination step is omitted.
After the registration, the co-registered Level-1 image is mapped by the function cam2map from ISIS [28]. The map product could be used to generate products for analysis.

4. Experiment Results and Discussion

4.1. Efficiency, Accuracy and Robustness Analysis

Before validating the performance on a large dataset of projected images, it is essential to first evaluate robustness and accuracy using valid registration methods applied to Level-1 data. This study primarily focused on the registration results of Mini-RF data due to its superior resolution and broader coverage. Moreover, Mini-RF data will be the primary focus for subsequent analyses in Section 4.3 rather than Mini-SAR.
The first 250 scenes from the Mini-RF dataset, selected chronologically, are used as the test dataset. Registration is performed between the original OC images and the simulated images using the proposed improved cross-correlation method, as well as the correlation method of GAMMA [24], which is widely used in Earth SAR image registration, and feature extraction methods such as SAR-SIFT, PSO-SIFT, BRISK, and KAZE. To reduce computational load, the images are down-sampled at a ratio of 1:10 during processing.
For efficiency analysis, the average processing time for a single image using the three methods implemented in MATLAB was first recorded. During the evaluation of the registration results, images that failed to be correctly registered by any of the three methods were excluded, and the mismatch rate was calculated. Subsequently, the average registration error of the successfully registered images was determined through manual inspection.
The registration results for Mini-RF data obtained using the six methods are presented in Figure 3 and summarized in Table 3. The performance of each registration method is shown by comparing the original simulated image. The more similar the fusion image is to the original one, the better the registration method performs.
As shown in Figure 3 and Table 3, the proposed method outperforms commonly used Earth remote sensing image registration methods in both its registration success rate and accuracy. The results also demonstrate that, compared to feature extraction methods, intensity-based registration methods are better suited for rigid error correction on lunar surface images, where terrain types are relatively uniform and repetitive. This confirms that the proposed algorithm is more effective in registering lunar SAR data.
After examination in a small dataset, the proposed method was applied to all 6847 views of Mini-RF S-band data and 857 views of Mini-SAR S-band data. During manual verification, 239 views of Mini-RF data with orbit numbers greater than 6939 were excluded due to the detection of technical errors before the orbiter’s final crash. Similarly, 122 views of Mini-SAR data with orbit numbers greater than 1919 were discarded for the same reason.
Additionally, mismatched views in Level-1 data were identified and included in the statistical analysis. The potential causes of these mismatches are discussed in detail in Appendix A.
To assess the accuracy of the registration method, registered Mini-RF S1 data from the North and South Poles, as well as nonpolar regions, were used to produce Level-2 products. Craters without secondary impacts were selected as reference objects for accuracy evaluation, as they exhibited stable morphological characteristics and were easily identifiable on both SAR and optical/DEM hillshade images.
As illustrated in Figure 4, such “standard craters” were manually identified by the research team, with 240 craters marked in the >75°S south polar area. The registration accuracy of the selected study area can represent the majority of lunar regions with high data coverage, such as the South Pole and North Pole regions. Statistical analysis of the distance errors for the centers of these craters (identified by the centers of circular marks) was conducted. Three craters were visually identified as mismatched in the geocoding domain. The remaining 237 craters were divided into two groups based on their diameters. The distribution of the reference targets is also shown in Figure 4, while the distance error results are presented in Figure 5.
As illustrated in Figure 5, based on the statistical results from all 237 craters, including 93 small craters with diameters <10 km and 144 larger ones with diameters >10 km, the average error is 185.38 m (six pixels). Separate statistical analyses reveal that the average distance error for the larger craters is 232.86 m (eight pixels), while the average error for the 93 smaller craters is 111.86 m (four pixels) in multi-view SAR images. During the manual marking process, it was observed that the rims of larger craters are difficult to distinguish in Mini-RF images, introducing a significant amount of error in positioning accuracy. As a result, smaller craters serve as more precise reference targets for registration accuracy. Using these more accurate targets, the estimated average error is 111.86 m (four pixels), suggesting that the proposed registration method exhibits stable and accurate performance on Mini-RF data.
To demonstrate the robustness of the new method, a comparative set of Mini-RF Level-2 data was generated following Fassett’s processing flow [22], and distance errors were analyzed based on the manual marking of crater centers. A total of 50 craters were marked, and the geographic homonyms were also marked on Level-2 data processed using the proposed method and optical data.
As Table 4 shows, for the proposed method, one crater was visually mismatched with optical data, while 20 of the 50 craters were mismatched using Fassett’s method. The average distance error for the remaining 30 craters was 176.57 m (6 pixels), showing no significant differences between the two methods. This result indicates that the proposed registration method significantly reduces the instability caused by image quality issues and improves the effectiveness and robustness of the registration process.

4.2. Registration Results of Mini-RF/Mini-SAR and Error Analysis

After removing the mismatched results and accuracy/robustness assessment, statistical analysis was performed based on the general offsets of each individual view to explore the relationship between the offsets corrected by the registration and the orbiter’s runtime, as reflected by the orbit number. The relationship between the offsets in the SAR image domain and the operation time is illustrated in Figure 6. By examining the variation trends of the distance errors, potential explanations for the sources of these errors can be summarized.
In Figure 6a, the offsets of Mini-SAR images exhibit a generally stable trend over time. Most offsets are concentrated within the range of −2850 m to −3000 m, corresponding to a uniform gap of one pixel in the original Mini-SAR images. This predictable gap arises because the preprocessing step does not incorporate super-resolution algorithms or up-sampling. While a small number of Mini-SAR images display larger fluctuations, none deviate beyond the range of −2500 m to −3200 m.
The offsets of Mini-RF images, as shown in Figure 6b, are in the opposite direction to those of Mini-SAR and exhibit a temporal trend ranging from 0 to 3000 m. Abrupt shifts in the offsets may reflect adjustments made to the SAR instrument at specific time points. Additionally, sudden rises and falls in offsets between adjacent orbit numbers suggest potential mismatches in the Level-2 data.
Apart from these abrupt variations, the offsets of Mini-RF images display a continuous linear upward trend overall. The slope (k) of this offset increase remains relatively consistent across different segments.
The variation trends of Mini-RF and Mini-SAR may indicate that the registration error in Level-1 data is attributed to deviations in the clock signal frequency between the orbiter and the Earth-based receiving station. Chandrayaan-1 likely went through smaller clock frequency deviations and had shorter on-orbit operation time, resulting in relatively stable offsets for Mini-SAR over time. In contrast, LRO’s longer operational period and potentially larger clock frequency deviations may have led to cumulative timing errors, producing clear linear changes in Mini-RF image offsets.

4.3. CPR Analysis of Anomalous Craters in the South Pole

To examine the impact of the proposed registration method on CPR analysis, this study generated west-looking and east-looking Stokes vector mosaic images for the lunar South Pole and calculated the CPR based on these mosaics. Using the registered CPR data, 535 craters listed in Fa’s classification [31] within the south polar region were reviewed with interior/exterior CPR analysis.
After filtering, 30 craters were excluded from the statistics because they were incomplete in the mosaic. The average CPR values for the interiors (within a 0 to 1 radius) and exteriors (within a 1 to 1.4 radius) of the craters were calculated separately. Craters with ΔCPR = CPRint − CPRext ≥ 0.1 were identified as anomalous, which are considered indicative of potential water ice distribution [32]. The statistical results for these anomalous craters were compared with Fa’s findings [31], which were based on unregistered Mini-RF polarimetric data. Fa concluded that registration deviations do not significantly impact the results for craters with diameters of 8–20 km. The potential effects of these deviations on CPR statistical outcomes are discussed.
A comparison and analysis of ΔCPR values was conducted using both east-looking and west-looking mosaic images. In the analysis, significant differences were observed between the average CPR values on the east-looking mosaic and Fa’s results. Further examination revealed that Fa’s work excluded more data with a relatively low SNR, leading to substantial differences in crater coverage compared to the newly generated mosaic using the proposed method. In contrast, the west-looking mosaic exhibited only minor coverage differences. Therefore, the discussion focuses on the average CPR values derived from the west-looking Mini-RF data. The number of anomalous craters in non-registered and registered data is shown in Table 5 and Table 6. A general deviation in average CPR values of 0.02–0.04 in both interior and exterior regions is summarized in Table 7, with the distribution of ΔCPR illustrated in Figure 7.
In Figure 7, it can be observed that after registration, 90 anomalous craters were detected compared to 39 detected before registration. Notably, for craters with diameters ≤8 km, 53 anomalous craters remained undetected in the non-registered data. Fa’s research primarily focused on craters with diameters ranging from 8 to 20 km, which mitigated most adverse effects of using non-registered data. These findings indicate that research on anomalous craters can delve deeper into the CPR patterns of smaller-scale craters and further investigate the relationship between anomalous CPR and water ice distribution.

5. Conclusions

This article primarily discusses the following content regarding the issue of SAR image registration around the Moon:
(1)
A robust registration method for Mini-RF and Mini-SAR Level-1 data is introduced, which greatly improves the issue of mismatching present in existing methods and demonstrates stability and reliability when processing full-moon data. In the analysis, the Level-2 data produced by the proposed method exhibit an accuracy within an error margin of ~110 m, which proves that this method could produce fine-registered data for the majority of lunar remote sensing research work.
(2)
The average CPR of anomalous craters in the South Pole is corrected with registered Stokes vector data. Though the deviation does not actually affect the analysis, it is able to produce more precise CPR data for studies on anomalous craters.
In future work, the researchers will further explore the robust matching features in SAR images and optical images to further eliminate the registration differences caused by factors such as terrain and achieve higher-precision registration.

Author Contributions

Conceptualization, Z.X., Y.G. and F.Z.; Methodology, Z.X. and P.L.; Programming, Z.X.; Theoretical support, T.M. and Y.D.; Data processing, Z.X. and M.L.; Writing—original draft preparation, Z.X., P.L. and F.Z., Funding acquisition, R.W. All authors have read and agreed to the published version of the manuscript.

Funding

This research was funded by the National Natural Science Foundation of China under Grant 12303065.

Data Availability Statement

The research data are available upon request to Zihan Xu (xuzihan181@mails.ucas.ac.cn).

Conflicts of Interest

The author Yao Gao was employed by Planetary Remote Sensing Laboratory, Department of Land Surveying and Geo-Informatics, The Hong Kong Polytechnic University. He participated in the early analysis of this study.

Appendix A

As Figure A1 shows, the mismatched data collected could be roughly categorized into two groups: the first group’s case (Figure A1a) shows that the quality of local DEM is relatively low, while the second group’s case (Figure A1b) show that the SAR image itself is defocused. Since there is no higher precision large-scale coverage DEM data available, the mismatched data can be manually registered or abandoned in terms of usage. The research team will gradually update the methods for organizing and processing mismatched data in the subsequent research.
Figure A1. The mismatching cases of Mini-RF data (excerpt from lsz_04472_1cd_xku_74n234_v1 and lsz_04866_1cd _xku_87n047_v1).
Remotesensing 17 00613 g0a1

References

  1. Chin, G.; Brylow, S.; Foote, M.; Garvin, J.; Kasper, J.; Keller, J.; Litvak, M.; Mitrofanov, I.; Paige, D.; Raney, K. Lunar reconnaissance orbiter overview: Theáinstrument suite and mission. Space Sci. Rev. 2007, 129, 391–419. [Google Scholar] [CrossRef]
  2. Goswami, J.; Annadurai, M. Chandrayaan-1: India’s first planetary science mission to the Moon. Curr. Sci. 2009, 96, 486–491. [Google Scholar]
  3. Nozette, S.; Spudis, P.; Bussey, B.; Jensen, R.; Raney, K.; Winters, H.; Lichtenberg, C.L.; Marinelli, W.; Crusan, J.; Gates, M.; et al. The Lunar Reconnaissance Orbiter Miniature Radio Frequency (Mini-RF) Technology Demonstration. Space Sci. Rev. 2010, 150, 285–302. [Google Scholar] [CrossRef]
  4. Schowengerdt, R.A. Remote Sensing: Models and Methods for Image Processing; Elsevier: Amsterdam, The Netherlands, 2006. [Google Scholar]
  5. Sommervold, O.; Gazzea, M.; Arghandeh, R. A survey on SAR and optical satellite image registration. Remote Sens. 2023, 15, 850. [Google Scholar] [CrossRef]
  6. Paul, S.; Pati, U.C. A comprehensive review on remote sensing image registration. Int. J. Remote Sens. 2021, 42, 5396–5432. [Google Scholar] [CrossRef]
  7. Li, D.; Zhang, Y. A fast offset estimation approach for InSAR image subpixel registration. IEEE Geosci. Remote Sens. Lett. 2011, 9, 267–271. [Google Scholar] [CrossRef]
  8. Suri, S. Automatic Image to Image Registration for Multimodal Remote Sensing Images; Technische Universität München: Munich, Germany, 2010. [Google Scholar]
  9. Paninski, L. Estimation of entropy and mutual information. Neural Comput. 2003, 15, 1191–1253. [Google Scholar] [CrossRef]
  10. Dellinger, F.; Delon, J.; Gousseau, Y.; Michel, J.; Tupin, F. SAR-SIFT: A SIFT-like algorithm for SAR images. IEEE Trans. Geosci. Remote Sens. 2014, 53, 453–466. [Google Scholar] [CrossRef]
  11. Ma, W.; Wen, Z.; Wu, Y.; Jiao, L.; Gong, M.; Zheng, Y.; Liu, L. Remote sensing image registration with modified SIFT and enhanced feature matching. IEEE Geosci. Remote Sens. Lett. 2016, 14, 3–7. [Google Scholar] [CrossRef]
  12. Leutenegger, S.; Chli, M.; Siegwart, R.Y. BRISK: Binary robust invariant scalable keypoints. In Proceedings of the 2011 International Conference on Computer Vision, Barcelona, Spain, 6–13 November 2011; pp. 2548–2555. [Google Scholar]
  13. Alcantarilla, P.F.; Bartoli, A.; Davison, A.J. KAZE features. In Proceedings, Pt VI 12, Proceedings of the Computer Vision–ECCV 2012: 12th European Conference on Computer Vision, Florence, Italy, 7–13 October 2012; Springer: Berlin/Heidelberg, Germany; pp. 214–227.
  14. Derpanis, K.G. The harris corner detector. York Univ. 2004, 2, 2. [Google Scholar]
  15. Rong, W.; Li, Z.; Zhang, W.; Sun, L. An improved CANNY edge detection algorithm. In Proceedings of the 2014 IEEE International Conference on Mechatronics and Automation, Tianjin, China, 3–6 August 2014; pp. 577–582. [Google Scholar]
  16. Fischer, P.; Dosovitskiy, A.; Brox, T. Descriptor matching with convolutional neural networks: A comparison to sift. arXiv 2014, arXiv:1405.5769. [Google Scholar]
  17. Zhou, L.; Ye, Y.; Tang, T.; Nan, K.; Qin, Y. Robust matching for SAR and optical images using multiscale convolutional gradient features. IEEE Geosci. Remote Sens. Lett. 2021, 19, 4014605. [Google Scholar] [CrossRef]
  18. Mazarico, E.; Rowlands, D.; Neumann, G.; Smith, D.; Torrence, M.; Lemoine, F.; Zuber, M. Orbit determination of the lunar reconnaissance orbiter. J. Geod. 2012, 86, 193–207. [Google Scholar] [CrossRef]
  19. Xie, B.; Liu, B.; Di, K.; Zhang, Y.; Wang, B.; Zhao, C. Analysis of the temporal and spatial characteristics of lunar reconnaissance orbiter’s orbit error based on multi-coverage narrow angle camera images. Geo-Spat. Inf. Sci. 2024, 1–14. [Google Scholar] [CrossRef]
  20. Liu, D.; Ye, Z.; Xu, Y.; Huang, R.; Xue, L.; Chen, H.; Wan, G.; Xie, H.; Tong, X. A Mismatch Removal Method Based on Global Constraint and Local Geometry Preservation for Lunar Orbiter Images. IEEE J. Sel. Top. Appl. Earth Obs. Remote Sens. 2024, 17, 10221–10236. [Google Scholar] [CrossRef]
  21. NASA. Available online: https://quickmap.lroc.asu.edu/ (accessed on 14 March 2024).
  22. Fassett, C.I.; Bramson, A.M.; Cahill, J.T.; Harris, C.P.; Morgan, G.A.; Neish, C.D.; Nypaver, C.A.; Patterson, G.W.; Rivera-Valentin, E.; Taylor, P.A.J.T.P.S.J. Improved Orthorectification and Empirical Reduction of Topographic Effects in Monostatic Mini-RF S-band Observations of the Moon. Planet. Sci. J. 2024, 5, 4. [Google Scholar] [CrossRef]
  23. Fassett, C.; Rivera-Valentin, E.; Patterson, G.; Cahill, J.; Morgan, G.; Neish, C.; Virkki, A.; Taylor, P.; Nolan, M.; Slade, M.J.L.C. Mini-RF S-Band Radar Observations of the Moon as a Function of Local Incidence Angle. LPI Contrib. 2023, 2806, 1564. [Google Scholar]
  24. GAMMA. SAR, InSAR, and DInSAR Processing with GAMMA Software; GAMMA Remote Sensing AG: Gümligen, Switzerland, 2008. [Google Scholar]
  25. Spudis, P.; Nozette, S.; Bussey, B.; Raney, K.; Winters, H.; Lichtenberg, C.L.; Marinelli, W.; Crusan, J.C.; Gates, M.M.J.C.S. Mini-SAR: An imaging radar experiment for the Chandrayaan-1 mission to the Moon. Curr. Sci. 2009, 96, 533–539. [Google Scholar]
  26. Barker, M.; Mazarico, E. Digital Elevation Models from LRO/LOLA. In Proceedings of the LSIC Workshop on Lunar Mapping for Precision Landing, Online, 2–4 March 2021. [Google Scholar]
  27. Barker, M.; Mazarico, E.; Neumann, G.; Zuber, M.; Haruyama, J.; Smith, D.J.I. A new lunar digital elevation model from the Lunar Orbiter Laser Altimeter and SELENE Terrain Camera. Icarus 2016, 273, 346–355. [Google Scholar] [CrossRef]
  28. USGS. ISIS (Integrated Software for Imagers and Spectrometers); USGS: Reston, VA, USA, 2024. [Google Scholar]
  29. Thompson, T.W.; Ustinov, E.A.; Heggy, E. Modeling radar scattering from icy lunar regoliths at 13 cm and 4 cm wavelengths. J. Geophys. Res. Planets 2011, 116, 3368. [Google Scholar] [CrossRef]
  30. Li, T.; Wang, J.; Yao, K. Subpixel image registration algorithm based on pyramid phase correlation and upsampling. Signal Image Video Process. 2022, 16, 1973–1979. [Google Scholar] [CrossRef]
  31. Fa, W.; Eke, V.R. Unravelling the mystery of lunar anomalous craters using radar and infrared observations. J. Geophys. Res. Planets 2018, 123, 2119–2137. [Google Scholar] [CrossRef]
  32. Fassett, C.I.; King, I.R.; Nypaver, C.A.; Thomson, B.J. Temporal evolution of S-band circular polarization ratios of kilometer-scale craters on the lunar maria. J. Geophys. Res. Planets 2018, 123, 3133–3143. [Google Scholar] [CrossRef]
Figure 1. Flowchart of the proposed registration method and examples of OC image simulation/registration results. The left part shows the example of generating simulated OC images from local incidence angle images. The right part shows an example of correcting the offset in Level-1 SAR images.
Remotesensing 17 00613 g001
Figure 2. Example of real SAR images and simulated images before eliminating background and after eliminating background, with the correlation coefficient comparison.
Remotesensing 17 00613 g002
Figure 3. Mini-RF data registration results of the proposed method and GAMMA’s correlation and feature extraction methods, shown by fusion images of real Level-1 SAR and simulated images.
Remotesensing 17 00613 g003
Figure 4. Distribution of standard craters in lunar South Pole and examples of standard craters in Mini-RF (a1,b1,c1) and DEM hillshade images (a2,b2,c2).
Remotesensing 17 00613 g004
Figure 5. Scatter plot of distance error (m); each point represents a crater target and its distance error. And separate histogram of distance error distribution in x/y direction of <10 km (in blue) and >10 km (in orange) targets.
Remotesensing 17 00613 g005
Figure 6. Normalized density scatterplot showing the relationship of offsets/distance errors in the SAR-image domain and operation time of Mini-SAR (a) and Mini-RF (b). ①②/①②③④ represent the concentrated distribution and variation trend of the offsets.
Remotesensing 17 00613 g006
Figure 7. Scatter plot of average ΔCPR in South Pole crater interior/exterior areas in the Mini-RF west-looking mosaic. The craters with a diameter <8 km were not included in Fa’s research. Craters with ΔCPR > 0.1 were identified as anomalous craters.
Remotesensing 17 00613 g007
Table 1. Average peak response improvement of different down-sample ratios.
RatioResponse Improvement (%)
1:535.814
1:1062.974
1:2059.146
1:5052.373
Table 2. General matching rate of different down-sample ratios in different latitude ranges.
Ratio\RegionSouth PoleNorth PoleMid Latitude
1:583%87%86%
1:10100%99%95.33%
1:20100%100%91.33%
1:5099%100%86.67%
Table 3. Effect of comparison between proposed and feature extraction methods.
MethodMismatching RateDistance Error (m)Computation Time (s)
Correlation7.9%158.846766.75081
SAR-SIFT38.8%230.941828.40512
PSO-SIFT10.0%99.1555240.13427
BRISK15.5%103.2543405.07820
KAZE8.6%87.8867267.02413
Proposed method0.8%85.947513.52456
Table 4. Effect of comparison between proposed method and Fassett’s method.
MethodMismatching RateAverage Distance Error
Fassett’s method40%176.57 m/6 pixels
Proposed method2%111.86 m/4 pixels
Table 5. Number of anomalous craters with diameter ranges of <8 km and >8 km in non-registered data.
Category\Diameter<8 km>8 km
Normal2118
Anomalous41056
Table 6. Number of anomalous craters with diameter ranges between <8 km and >8 km in registered data.
Category\Diameter<8 km>8 km
Normal7317
Anomalous35857
Table 7. Average CPR of 505 craters from non-registered Level-2 data and registered Level-2 data.
RegionNon-Registered CPRRegistered CPR
Interior0.54070.5877
Exterior0.51120.5360
Disclaimer/Publisher’s Note: The statements, opinions and data contained in all publications are solely those of the individual author(s) and contributor(s) and not of MDPI and/or the editor(s). MDPI and/or the editor(s) disclaim responsibility for any injury to people or property resulting from any ideas, methods, instructions or products referred to in the content.

