Article

Vertical Total Electron Content Enhancements and Their Global Distribution in Relation to Tectonic Plate Boundaries

by
Paweł Wielgosz
1,
Wojciech Jarmołowski
1,*,
Stanisław Mazur
2,
Beata Milanowska
1 and
Anna Krypiak-Gregorczyk
1
1
Faculty of Geoengineering, University of Warmia and Mazury in Olsztyn, Ul. Oczapowskiego 2, 10-719 Olsztyn, Poland
2
Institute of Geological Sciences, Polish Academy of Sciences, 31-002 Cracow, Poland
*
Author to whom correspondence should be addressed.
Remote Sens. 2025, 17(4), 614; https://doi.org/10.3390/rs17040614
Submission received: 16 December 2024 / Revised: 25 January 2025 / Accepted: 7 February 2025 / Published: 11 February 2025

Abstract

:
Atmospheric responses to earthquakes or volcanic eruptions have become an interesting topic and can potentially contribute to future forecasting of these events. Extensive anomalies of the total electron content (TEC) are most often linked with geomagnetic storms or Earth-dependent phenomena, like earthquakes, volcanic eruptions, or nuclear explosions. This study extends rarely discussed, but very frequent, interactions between tectonic plate boundaries and the ionosphere. Our investigations focus on the very frequent occurrence of TEC enhancements not exclusively linked with individual seismic phenomena but located over tectonic plate boundaries. The objective of this study is to provide a review of the global spatiotemporal distribution of TEC anomalies, facilitating the discussion of their potential relations with tectonic activity. We apply a Kriging-based UPC-IonSAT quarter-of-an-hour time resolution rapid global ionospheric map (UQRG) from the Polytechnic University of Catalonia (UPC) IonSAT group for the detection of relative vertical TEC (VTEC) changes. Our study describes global relative and normalized VTEC variations, which have spatial and temporal behaviours strongly indicating their relationship both with geomagnetic changes and the tectonic plate system. The variations in geomagnetic fields, including the storms, disturb the ionosphere and amplify TEC variations persisting for several hours over tectonic plate boundaries, mostly over the diverging ones. The seismic origin of the selected parts of these TEC enhancements and depletions and their link with tectonic plate edges are suspected from their duration, shape, and location. The changes in TEC originating from both sources can be observed separately or together, and therefore, there is an open question about the directions of the energy transfers. However, the importance of geomagnetic field lines seems to be probable, due to the frequent common occurrence of both types of TEC anomalies. This research also proves that permanent observation of global lithosphere–atmosphere–ionosphere coupling (LAIC) is also important in time periods without strong earthquake or volcanic events. The occurrence of TEC variations over diverging tectonic plate boundaries, sometimes combined with travelling anomalies of geomagnetic origin, can add to the studies on earthquake precursors and forecasting.

Graphical Abstract

1. Introduction

This study of global distribution of total electron content (TEC) variations is carried out with respect to tectonic plate boundaries, where a predominant number of seismic processes occur, and the electrical coupling with the ionosphere and radioactive gasses emission is probably the largest. The anomalies of TEC were already investigated in tens of studies in reference to the strong earthquakes or earthquake groups, without a focus on tectonic boundary course. To complement the cited studies, we make a brief review of the global spatiotemporal distribution of TEC anomalies. The observed distribution of increased TEC during different solar and geomagnetic conditions can facilitate the discussion on their suspected relations with tectonic activity. Therefore, Section 1.1 introduces the term and literature examples of previously studied TEC variations (enhancements and depletions), which are mainly related to geomagnetic and seismic processes. Such TEC enhancements and depletions are considered as positive and negative differences in the vertical TEC (dVTEC), respectively, in the experimental part of the work. Section 1.2 focuses on global ionospheric map (GIM) applications in the studies of TEC changes, which provide the basis for a global look at the problem. These studies also did not investigate the link with the network of tectonic plate boundaries. The geomagnetic and seismic sources of TEC variations are often studied together but can also be distinguished. Therefore, Section 1.3 points to apparent differences between these two sources using literature examples. The level of certainty in the assessment of the TEC enhancement source depends mainly on the diversity of the data applied, but the global view on TEC changes with the use of GIM substantially helps in this process. Section 1.4 attempts a very rough selection of the physical processes related to the coupling between the lithosphere and the ionosphere due to the seismic activity. The preliminary selection of a probable processes from the already well-established range of lithosphere–atmosphere–ionosphere coupling (LAIC) processes is based on TEC variations calculated from a good-quality GIM, which provides a global view on the locations, time evolution, and sizes of TEC variations with respect to tectonic plates and seismic and geomagnetic records.

1.1. Total Electron Content Variations Activated by Internal and External Sources

The TEC in the ionosphere represents the total number of electrons integrated between two points, e.g., the antenna on the ground or on the satellite and navigation satellite. It is measured along a tube of one square metre of cross section. The measured slant TEC (STEC) can be recalculated to vertical TEC (VTEC) using a selected geometrical model [1]. The gridded model providing a source of the data in this study uses VTEC, but in many cited references where VTEC anomalies are studied, the general TEC term is used for simplicity. The definitions of TEC enhancement or depletion are frequent in recent decades in the literature and denote the relative TEC changes occurring locally for several hours or a slightly longer time period. Generally, the origin of ionosphere perturbations comprises a very wide spectrum of internal (Earth-dependent) and external (Sun-dependent) processes, such as internal atmospheric waves or increased ionization processes from below, and magnetospheric, solar, and geomagnetic processes from above [2,3,4]. The processes affecting atmosphere and ionosphere from below belong to a wide group of interactions called LAIC [4,5]. The spatial and temporal frequency scales of the TEC changes are very wide, ranging from several tens of kilometres and minutes in the case of, e.g., internal atmospheric waves, to the changes in TEC having a size of thousands of kilometres and lasting for hours or days, which are typically related with solar activity and related geomagnetic variations. There are also examples of transient TEC anomalies caused by X-Class solar flares [6]. The changes in TEC investigated in this work are presumably related to tectonic plate boundaries and general seismic activity and are of medium spatiotemporal wavelengths, i.e., having a size of several hundreds to several thousands of kilometres and lasting for several hours to several days [7,8,9,10]. Different types of smaller seismically induced ionospheric perturbations have been thoroughly investigated in the literature, like, e.g., seismically induced ionospheric waves [11,12,13,14]. However, the current study focuses on larger-scale TEC relative changes, often called TEC enhancements. Aside from a wide scope of solar processes inducing different types of TEC variability [2], there are two phenomena changing hour-by-hour and triggering medium-term enhancements and depletions in the TEC, lasting for several hours, similarly to their source frequency. These sources are geomagnetic activity and seismicity, which are usually investigated separately in the literature. However, some authors [15,16] studied both sources together, looking for the correlation of their effects, also noticeable in the ionosphere. This study investigates them together, as high geomagnetic activity appears to be a kind of amplifier to seismic-related TEC changes, despite the complexity of disturbing signals.
TEC enhancements and depletions are predominantly analysed from the series of ground GNSS observations of ionosphere changes, or in a larger spatial scale from global ionosphere map (GIM), which typically provide a lower spatial resolution. The observation of TEC enhancements or depletions at GNSS stations with the use of GNSS signal series were applied usually in the context of detailed analysis of the temporal evolution of abnormal TEC change with respect to geomagnetic [17,18,19,20] and seismic sources [21,22,23,24]. Such studies were usually based on the observations of selected GNSS stations. Sometimes, if more stations were involved, aside from the study of temporal evolution, the authors also introduced a spatial recognition of TEC changes and its correlation with different sources and, in particular, with seismic activity [9,10,25]. Additionally, the spatial and temporal resolutions of raw GNSS observations are locally advantageous in comparison to GIMs resolution. The relatively small amplitudes of TEC differences are, in both cases, typically calculated with respect to some high-order reference trend. In the case of time series of GNSS observations, a polynomial trend [16,23,26], moving average [23,24] or spectral filtering [27], can be applied to extract high-order TEC signals. If we consider moving average for the determination of TEC differences, a several-day average is suitable to refer the changes [28,29], and 8–10 days is reasonable, because longer intervals can indicate significant periodicities in the TEC signal [30,31,32,33]. The previous studies proved that normalization is especially helpful to separate the variability of TEC depending on the latitude [29,34]. The normalization with the use of an absolute average value of GIM grids from 9 days that are the closest to the selected hour is also applied in the current study. The primary advantage of normalization is an elimination of the equatorial ionization anomaly (EIA) influence.

1.2. Global Ionosphere Maps in Studies of TEC Enhancements and Depletions

The GIMs are often based on more observational techniques than GNSS only (altimetry, DORIS, physical models) and have a global range [35]. A global look at TEC variability enables the study of TEC variations with respect to global processes like geomagnetism, weather, space weather, and also seismicity in the wider sense, i.e., as the activity principally related to the tectonic plate system and their boundaries. The analysis of GIMs for the purpose of detection of geomagnetically induced TEC variations was already shown many times. The study of TEC enhancements related to geomagnetic storm on 20 April 2018 was given by Sotomayor-Beltran [36]. His analysis was based on the centre for Orbit Determination in Europe (CODE) GIMs and applied non-normalized TEC differences showing the sensitivity of the TEC to changing geomagnetic conditions. Sotomayor-Beltran and Andrade-Arenas [28] applied the same GIM solution and methods in the analysis of a geomagnetic storm that occurred on 8 September 2017. An improved method of the investigation of geomagnetic conditions impact on TEC variations was proposed by Shinbori et al. [29], with regard to a storm that occurred on 27–28 September 2017. They used normalized ratio to depict TEC variations due to the geomagnetic storm. The normalization assured more independence from EIA in the equatorial area, where a higher ionization typically amplifies TEC anomalies. The work of Shinbori et al. [29] was based on the static GNSS observations from a large number of stations globally available. However, they did not refer to tectonic plate boundaries and earthquakes. Some other normalization of TEC differences can be found in [37], who used standard deviation of TEC changes for this purpose. Şentürk et al. [34] analysed the normalized TEC variation with respect to a moderate magnetic storm and selected earthquake, but they used CODE GIMs. Şentürk et al. [34] also did not refer to global seismicity or tectonic plate boundaries. We follow a normalized approach to TEC variation in the current study but working with a Kriging-based UPC-IonSAT quarter-of-an-hour time resolution rapid global ionospheric maps (UQRG) [38,39]. We demonstrate that the least-squares-interpolated GIM can reveal comparable features with respect to TEC variations at the stations, substantially reducing the effort of raw GNSS data processing. Shinbori et al. [29] discussed several specific phenomena that can compose TEC changes related to geomagnetic storms. Sun et al. [40] also searched for specific processes affecting the TEC in the time of increased geomagnetic activity. They used CODE GIMs and found some specific features in the region of the “Ring of Fire” around the Pacific Ocean. Their findings were very encouraging to the further research, and the issue of the “Ring of Fire” will also be discussed in the current study.
GIMs are of high applicability in the seismically driven TEC changes detection, as we observe an increasing number of research based on these data. Tariq et al. [7] presented an analysis based on CODE GIM and showed differential TEC clouds in the TEC unit (TECU), which are suspected as pre-earthquake signatures, due to the temporal correlation of spatial TEC changes with the evolution of different seismic events in the Asian region. Liu et al. [41] investigated Wenchuan earthquake in 2008 with the use of TEC differences from GIMs and compared TEC enhancements over the analysed regions to electron density (ED) profile variations observed by FORMOSAT/COSMIC satellites. Pulinets and Davidenko [42] referred to Wenchuan but also to the other earthquake events and compared TEC differences, disturbance storm time (Dst) index, earthquake magnitudes, observation of H+ ions from DEMETER satellite, and other data. They also used examples of different phenomena in addition to earthquakes, like volcano eruptions or nuclear tests to prove sensitivity of the ionosphere and usefulness of data combinations. The importance of a multi-platform approach to LAIC processes was also emphasized in [43]. Sotomayor-Beltran [44] presented pre-earthquake signatures in differential TEC from CODE GIM and the shape of the EIA at the time of M = 7.8 event in Ecuador in 2016. All four papers above are related to seismicity signatures in the TEC, and most of the papers mentioned in the previous paragraph, related to the geomagnetic impact on the TEC, do not use the normalization. Zhao et al. [45] referred to the abovementioned Wenchuan earthquake in 2008 and clearly showed the impact of geomagnetic index increase and seismic activity response with the use of normalized GIM TEC changes. Shah and Jin [46] also normalized IGS GIM TEC variations and gave clear proof of relative TEC enhancements’ correlation with the occurrence of earthquakes. The current work follows the GIM-processing scheme given in [29,45,46] and applies normalized TEC enhancements and depletions. This work investigates TEC relative changes calculated from the UQRG and refers to quiet and disturbed geomagnetic periods, based on the geomagnetic planetary K-index (Kp) [47]. Our analysis refers first of all to the network of tectonic plate boundaries and shows their strong apparent relationship to the TEC changes. The energy changes over the tectonic plate boundaries have already been studied locally from the DEMETER satellite data by Athanasiou et al. [48]. Hence, the current paper prepares some kind of basis for more insightful and local research.

1.3. TEC Variations During Geomagnetic Storms in Comparison to Seismically Driven TEC Enhancements

Strong TEC enhancements dependent on extraterrestrial factors can be generated by geomagnetic storms, and these TEC changes can impede the observation of seismic-related TEC variations, due to the complexity of the signals. However, there is still no certainty on the independence of geomagnetic variations and seismicity [16,49]. Gulyaeva and Arikan [37] found a significant difference in the number of earthquakes in times of geomagnetic storms in comparison to quiet space weather conditions. There are many examples of increases in geomagnetic indices before or at the time of strong earthquakes [15,22,34]. Such simultaneous occurrence of two phenomena can also be found in the current study, and geomagnetically driven TEC changes seem like an amplifier of seismic-related ones in some cases. Rajesh et al. [50] and Şentürk et al. [34] analysed ionospheric TEC responses to geomagnetic storms on the basis of GIM. These analyses used unnormalized TEC differences but showed well that the size of the geomagnetically disturbed TEC component is proportional to electron concentration, and it was easily noticeable that the largest part of the disturbed TEC was related to the position of the Sun and EIA. Ren et al. [51] applied the reductions based on solar and geomagnetic parameters in the forecast of TEC. Shinbori et al. [29], in turn, applied normalized TEC variations, largely eliminating the appearance of EIA in TEC changes. They detected geomagnetically dependent TEC changes at higher latitudes and also showed their easily observable spatiotemporal evolution with respect to the terrestrial coordinate system. This evolution is latitudinal, and it is especially pronounced in non-polar regions. However, in addition to these wandering anomalies, in times of strong seismic activity occurring together with geomagnetic storms, it is possible to find TEC anomalies, which remain over the same terrestrial position for many hours. Namgaladze et al. [52] showed GIM-based TEC differences and, in addition to the anomalies resulting from magnetosphere-ionosphere coupling, indicated TEC enhancements persisting over regions close to the epicentres of the earthquakes. Evidence of TEC anomalies with maxima persistent over fixed terrestrial locations can be found in [40,45,50]. Sun et al. [40] noticed the persistence of some TEC anomalies along the “Ring of Fire” but also found other TEC enhancement location preferences. The abovementioned papers link persisting TEC changes with selected earthquake epicentres and constitute a sufficient prompt to become interested in the observations of TEC variations based on GIMs, and their spatial assessment with respect to other seismic-related structures, e.g., tectonic plate boundaries.
The TEC enhancements connected to Earth-fixed locations are suspected to be related to places of possible higher ionization, conductivity, or radioactive gasses emanation, which naturally points to tectonic faults and related seismic sources [2]. Section 1.1 and Section 1.2 cite several papers on the precursory character of electric field changes, and hence, we know that TEC changes are not necessarily linked to the time of large earthquakes. This prompted us to focus on the tectonic plate boundaries as conductivity areas and suspected continuous generators of TEC variations.

1.4. Probable LAIC Models of TEC Enhancement Related to Seismicity

The LAIC processes related to seismicity were often investigated in the literature with a special focus on pre-seismic TEC and electron density (Ne) anomalies [2,7,23,26,53]. This is related to the need for earthquake forecasting, but it is also highly probable that a significant part of seismic-related physical and chemical processes taking place in the lithosphere precede strong earthquakes [2,16,42,54]. The issue of the exact temporal location of earthquake precursors is far from resolved and depends on the type of the process. Therefore, we prefer to consider possible mechanisms related to the observed TEC anomalies, linking only approximately their occurrence with the course of the seismic process. Another fact that justifies focusing on the process type is that the most popular compilations of LAIC processes consider their division with respect to the channel of energy propagation, where process evolution phases are not the main criterion [2,5,55].
The widest description of possible seismic-driven processes is provided by Pulinets and Boyarchuk [2], who describe the physics of seismo-ionospheric coupling and distinguish two channels of its propagation, i.e., a wave channel represented primarily by acoustic gravity waves (AGWs), an electric field channel characterised by radioactive particles emanation (mainly radon), and increased conductivity causing electric field anomalies. They suggest a small scale of anomalies associated with the former channel and a rather large scale of anomalies that arise due to the latter channel. They also provide a schematic diagram showing a certain complementarity of both propagation channels. Hayakawa and Molchanov [54] proposed a division of LAIC processes based on three propagation channels: (1) a chemical channel based on radon emanation, leading to increased conductivity and variations in plasma density, which corresponds to part of the electric field channel from [2]; (2) an acoustic channel corresponding to the wave channel from [2]; and (3) an electromagnetic channel with upward directed electromagnetic waves supplementing the electric field channel from the previously mentioned authors. Hayakawa at al. [5] added a fourth channel named the electrostatic channel, in which positive ionization holes are generated from the stressed ground. This phenomenon was also mentioned in the book by Pulinets and Boyarchuk [2] as contributing to electric field change. Liperovsky et al. [55] have also compiled the set of LAIC processes related to seismic sources, and they distinguish three types of them: (1) AGW model, (2) electric field modification (EFM) model, including positive charges considered by Hayakawa at al. [5] as the fourth channel, and (3) electromagnetic (EM) model.
The choice of process responsible for a given type of ionospheric anomaly can be only roughly suggested in this work, on the basis of spatiotemporal characteristics of the anomaly. In general, the AGW model cannot play a crucial role in the formation of large TEC anomalies along thousands of kilometres, but it is still possible that smaller TEC anomalies of several tens of kilometres can also be partially influenced by the AGW model [56]. The EM model can be potentially more likely for the large-scale Earth-fixed TEC enhancements presented in this study if we review the characteristics of the EM processes and their size in [55] or [2]. Additionally, the link between geomagnetic indices and seismicity observed by several researchers (e.g., [34]) suggests the inclusion of EM channel into the considerations. The EFM model includes large-scale and long-term processes, and it also probable from our point of view, as this channel generates an increased conductivity near the earthquake preparation zones. The detailed analysis of particular processes within the EFM model would need more types of global or at least regional spatiotemporal data of resolution not worse than GIM. However, the physical nature of the EFM model defines its sensitivity to zones of stress accumulation across the entire lithosphere, and therefore spatial recognition of global-scale ionospheric anomalies can potentially support the studies on EFM occurrence.
There are different types of tectonic structures found in the lithosphere, and the question arises whether the processes induced in different tectonic settings have different characteristics with respect to seismic–atmospheric LAIC processes. The descriptions of the processes available in [2,5,55], which are based on a significant number of experimental studies, do not indicate any key relationship between the LAIC processes and the type of tectonic structures being their source. This is because tectonic elements of various kinematics can produce similar physical effects, such as stress accumulation, increased conductivity, or enhanced fluid or gas circulation. Moreover, the newest analyses in [5,57,58,59] prove the similarity of the ionosphere responses to different types of sources and their tectonic settings and indicate a higher influence of various other factors on the ionospheric anomaly, such as the channel of wave propagation, the magnitude of the earthquake, or scale of related tectonic displacements.

2. Data and Methods

The GIM model developed by the Polytechnic University of Catalonia (UPC) IonSAT group is the main source of data in this study, which, as a composed advanced product, describes the global VTEC with unprecedented accuracy [60,61,62]. The GIM is named UQRG, and it is created from dual-frequency GNSS and other ancillary data with the use of the Kriging method [38,39]. UQRG has a typical spatial resolution of 5° in longitude and 2.5° in latitude and an increased temporal resolution of 15 min. The Kriging ensures a substantial advantage with respect to spherical harmonic-based models because it avoids aliasing of higher frequency VTEC information if the GIM grid is denser than that corresponding to a maximum spherical harmonic degree. The other disadvantages of spherical harmonic expansion are potential errors of higher-order harmonic coefficients and thus deformations of the models in sparse data locations. In such places, where an applied maximum harmonic degree is higher than data resolution, the error of coefficient determination can be large. The abovementioned two main drawbacks of selected spherical harmonic-based models have been examined before UQRG selection, using normalized differences (Equation (1)). Differential VTEC values have clearly shown more smoothness of spherical harmonic-based models in the regions of dense data, which gives the obvious advantage to UQRG in the search of moderate-scale VTEC disturbances over the tectonic plate boundaries.
The sensitivity of the ionosphere to different magnitudes of earthquakes was discussed by Perevalova et al. [63] and Jin et al. [64]. The resulting threshold was typically set to a magnitude around 6.5. However, as the other factors contribute to the scale of VTEC variations, like depth or vertical displacement, we decided to slightly increase the applied dataset by a decrease in the magnitude. This study deals with spatially larger-scale VTEC variations and also includes smaller earthquakes with a magnitude threshold set to M = 5.0. This choice is motivated by our preliminary observation of a possible relationship between moderate (M = 5.0–5.9) earthquakes with ionospheric anomalies over neighbouring tectonic plate boundaries [65,66]. There are thousands of such earthquakes annually. The number of strong earthquakes (M = 6.0–6.9) is in the range between 100 and 200 globally. The major earthquakes (M = 7.0–7.9) occur typically 10 to 25 times annually, and great earthquakes (M > 8.0) occur usually less frequently than 5 a year (source: USGS). The influence of major and great earthquakes on enhanced VTEC values was reported in [7,41,44], where local persisting VTEC anomalies have been shown as directly linked to the individual earthquakes. Although the link between the individual earthquakes and TEC anomalies is not always evident, nor studied here, we must set a depth threshold for the investigated earthquakes. Sunil et al. [67] analysed earthquakes having a depth range of 0–200 km and demonstrated that deeper earthquakes trigger much smaller ionospheric signatures. However, they concluded that a precise cutoff of focal depths irrelevant to ionospheric perturbations is still hard to achieve. Therefore, to avoid excluding potentially significant sources, we decided to set the threshold at 400 km, which is twice as deep.
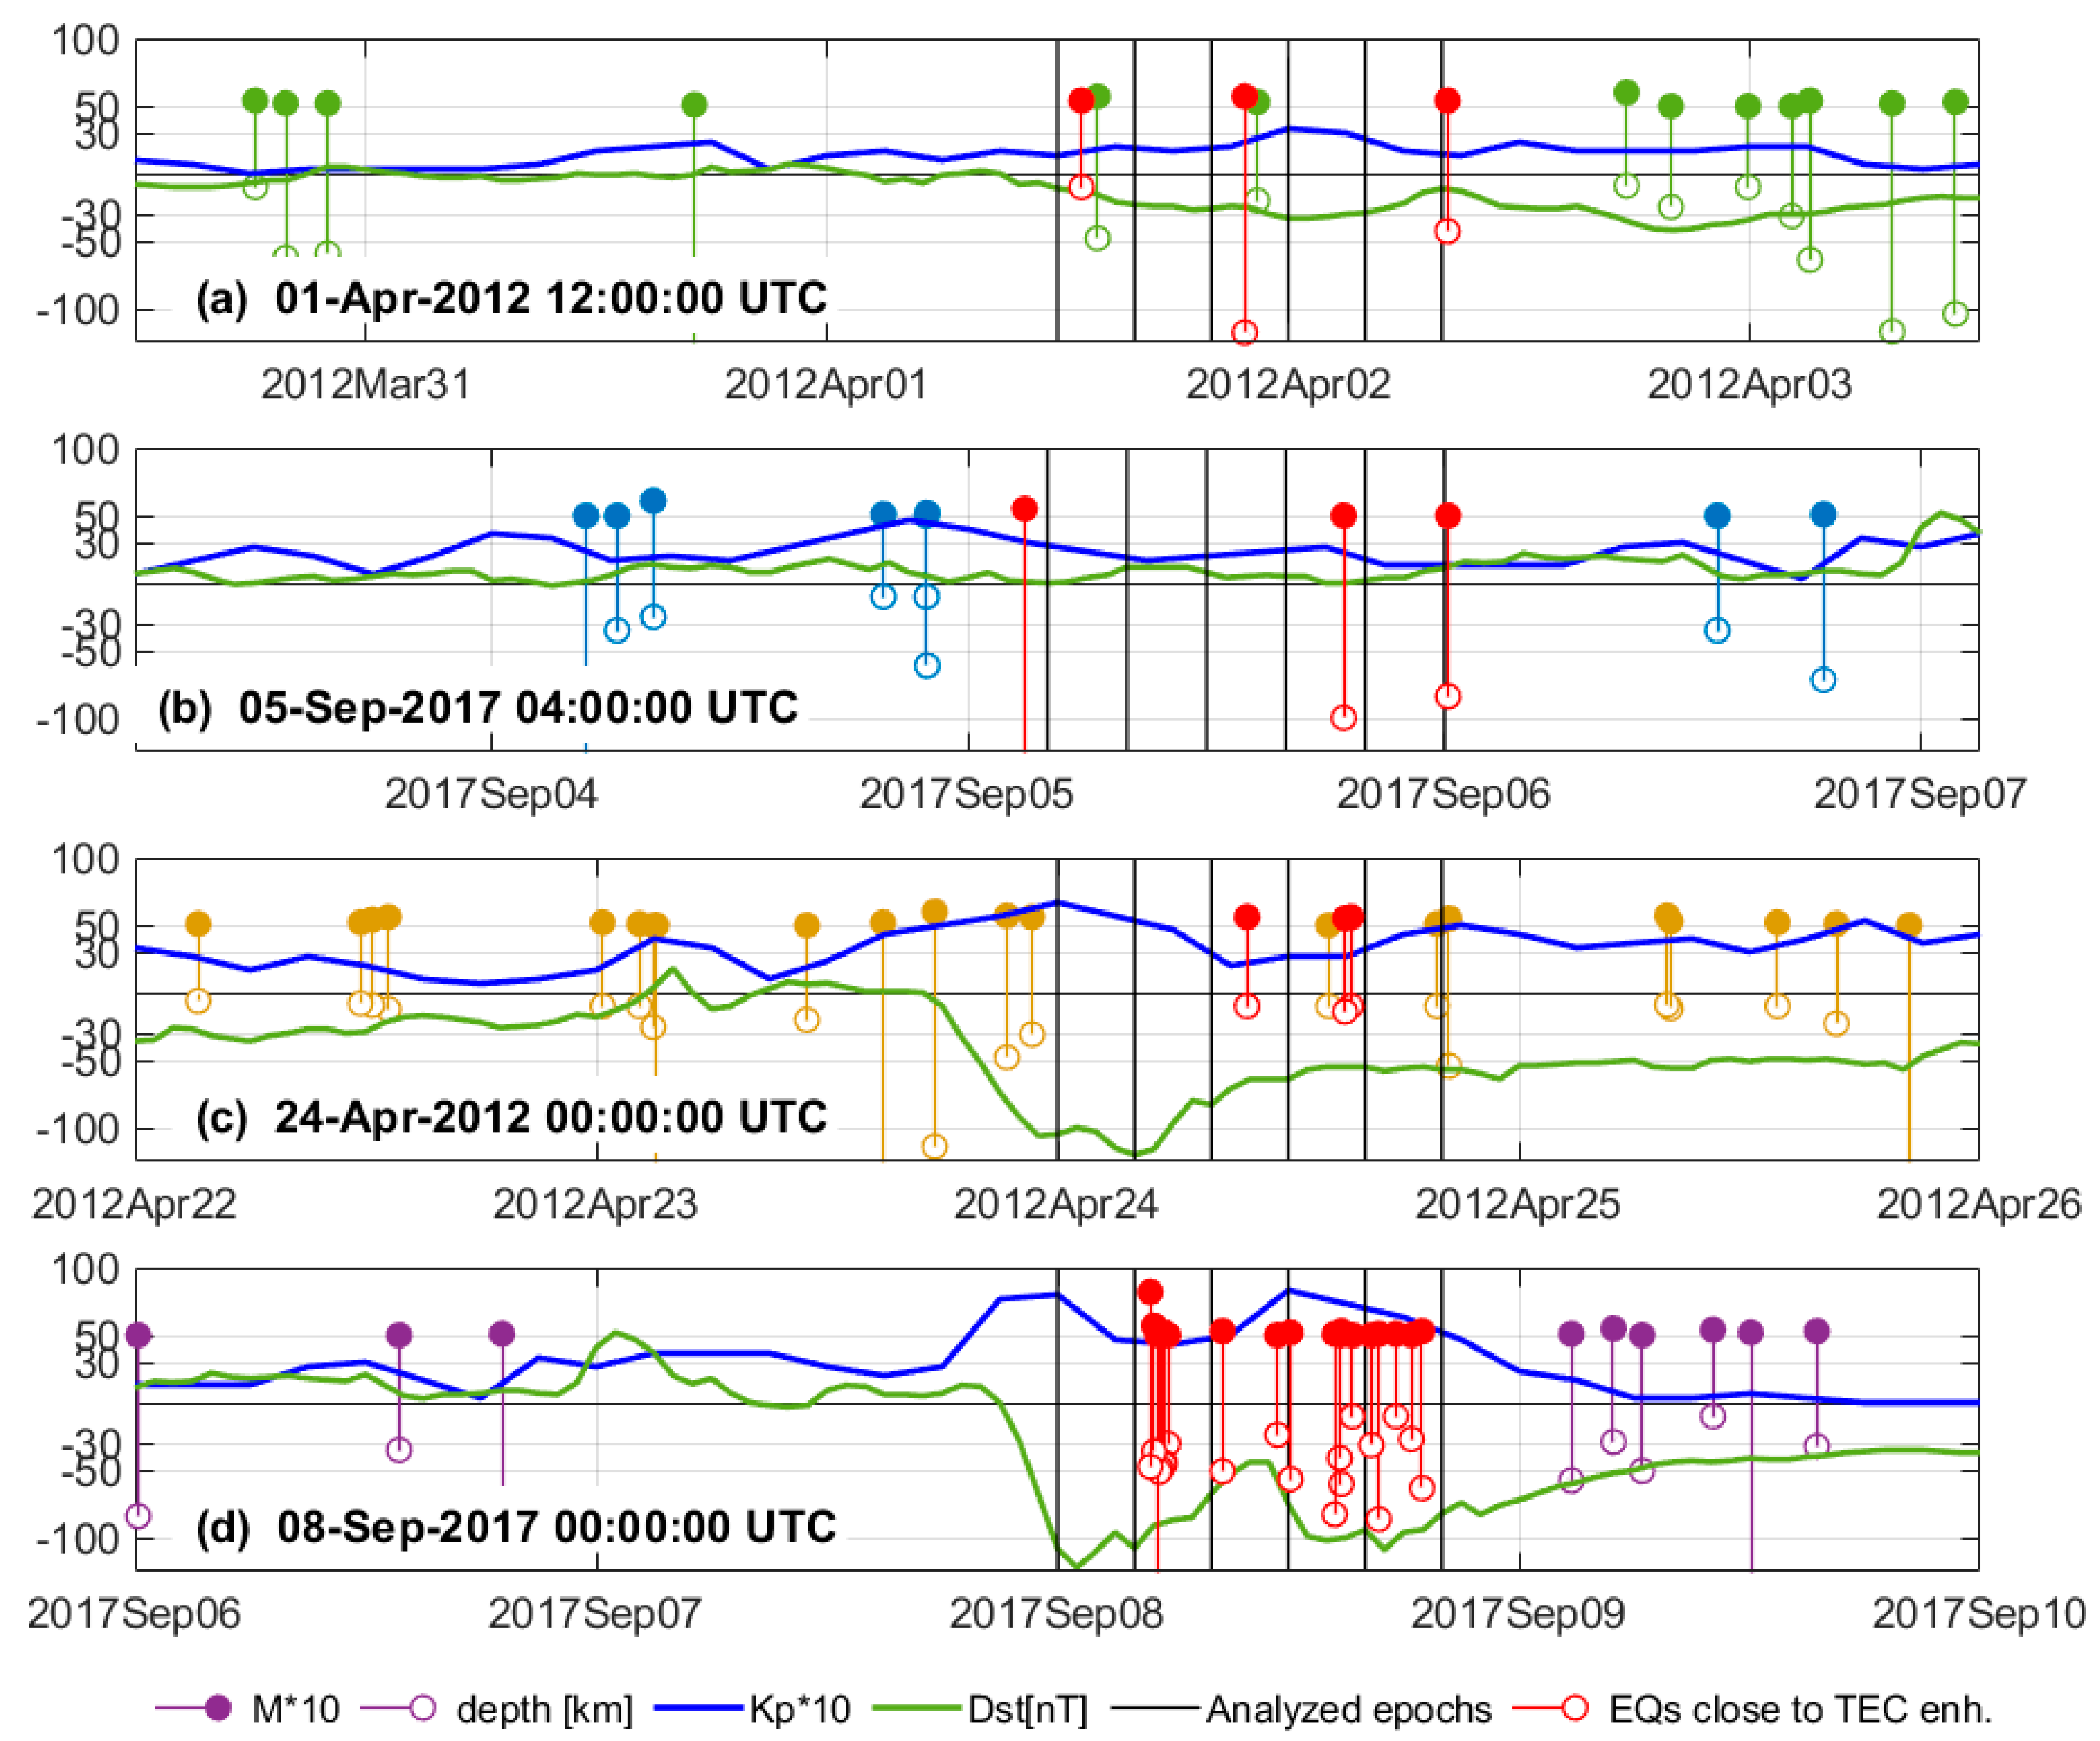
The current study does not connect VTEC anomalies directly with a particular earthquake but shows their general connection with seismically active zones. We demonstrate four selected sets of UQRG snapshots, two of which are collected during low Kp times, and two others during high Kp stormy times (Figure 1). The threshold between low and high Kp indices is set approximately to be around 4–5, which means that the examples of low geomagnetic activity have Kp ≤ 4 in this study. This is consistent with a typical classification, where Kp ≥ 5 indicates a minor geomagnetic storm, and such values are observed in the examples during high Kp. The UTC time spans of these selections are presented together with earthquakes and geomagnetic indices during two preceding and two following days in Figure 2a,b and Figure 2c,d, respectively. Additionally, one quiet and one stormy case are from year 2012, nearly at solar maximum (Figure 2a,c), whereas two remaining sets are from 2017, close to solar minimum (Figure 2b,d). Selected sets consist of six maps each. The maps are separated by a four-hour interval, which is sparser the original 15 min resolution of UQRG. This sparser interval is empirically selected as sufficient in the presentation of observed VTEC change evolution and its potential spacetime relation with close earthquakes. This study focuses on the VTEC anomalies, which repeat many times at similar characteristic geographical locations. The complementary dataset is the map of major and minor tectonic plate boundaries. Figure 1 presents major and minor tectonic plates and introduces their acronyms used elsewhere in the study, where smaller figures disabled displaying their labels. Figure 1 also presents locations of M ≥ 5.0 earthquakes, which occurred within four days, surrounding the starting epoch of each of the four selected time spans of VTEC enhancement observation. These earthquakes are in Figure 1 and Figure 2 and are denoted by different symbols corresponding to selected four cases.
Based on the four selected datasets composed of six UQRG epochs separated by four hours, a normalized VTEC anomaly ratio (dVTEC) was calculated, i.e.,
d V T E C e = V T E C e V T E C m V T E C m
where V T E C e denotes the analysed UQRG grid of values in epoch e, and V T E C m is an average calculated from 9 days (4 backward and 4 forward) at the UTC hour of analysed epoch e. This way of dVTEC calculation was already implemented in [29], but that research had a different focus, and the findings were different from those presented here. We will use the dVTEC term denoting normalized VTEC anomaly (enhancement or depletion) in the remaining part of the study, instead of the TEC enhancement or depletion terms. Figure 2 shows global M ≥ 5.0 earthquakes with their magnitudes and depths. Additionally, in Figure 2, geomagnetic Kp and Dst indices are given within the 4-day period around all four cases of six analysed UQRG epochs, indicated by black vertical lines. Figure 2 can give a rough view on the relationships between seismic and geomagnetic activity. Figure 2a,b introduce the selected earthquake and geomagnetic data during two time spans of the studied dVTEC demonstrated in Figure 3 and Figure 4, which occur during lower geomagnetic activity. These cases prove that geomagnetic storms are non-mandatory to see high dVTEC values appearing over the tectonic plate boundaries. Figure 2c,d introduce geomagnetic storms presented further in Figure 5 and Figure 6, which also show more extreme dVTEC values.

3. Results: VTEC Anomalies (dVTEC) Lasting Hours over Tectonic Plate Boundaries

The studies on TEC enhancements having potentially seismic origin prompted us to dVTEC analysis focused on tectonic plate boundaries. The aim is to provide a realistic review of high dVTEC appearance in the context of Earth-fixed and external triggering sources, i.e., considering solar, geomagnetic, or seismic character of these anomalies. The spatial coincidence, several-hour persistence, independence of the apparent Sun position, and, at the same time, a noticeable link with tectonic plate boundaries, as well as some indirect relationships to earthquakes can be viewed exclusively by the observation of entire GIMs within a several-day time period. Additionally, such a quantitative approach, simplified due to the compact format and size of GIM and useful time interval, is less laborious in comparison to the validation with some other independent data sources, e.g., satellite data or raw ground GNSS data. Of course, the study with raw satellite or ground data supplies much more details. However, the currently shown work proves that viewing large number of accurate GIMs is worth doing before employing larger datasets, as it reveals interesting global VTEC properties with good spatiotemporal resolution.
Tectonic plate boundaries with inclusion of minor tectonic plates are the basic background for dVTEC anomalies presented in the maps, together with global record of M ≥ 5.0 earthquakes. The UQRG maps are differenced and normalized in a way given by Equation (1), which is implemented to avoid predomination of EIA amongst the results. Some relationship to the earthquakes having various magnitudes can be found in the figures, but the more important observation is that these VTEC changes last for several hours over tectonic plate boundaries. Some of these plate boundaries are especially active in “holding” positive or negative dVTEC anomalies for several hours, and these places repeat in the presented maps. The maps include examples with different geomagnetic activity and different time of the day, which is intentional to show that studied anomalies also occur during low Kp index and far from the solar radiation. The discussion on the common location of dVTEC anomalies over individual tectonic plate boundaries will be referred to in Figure 1, but plate boundaries without names are also given in Figure 3, Figure 4, Figure 5 and Figure 6. Figure 1 includes acronyms of plate names, which will consecutively appear in the text. Figure 3, Figure 4, Figure 5 and Figure 6 present dVTEC together with M ≥ 5.0 earthquakes and corresponding Dobrovolsky radii calculated as equal to 100.43 M(km), where M is magnitude [69].

3.1. VTEC Enhancements and Depletions During Low Geomagnetic Activity

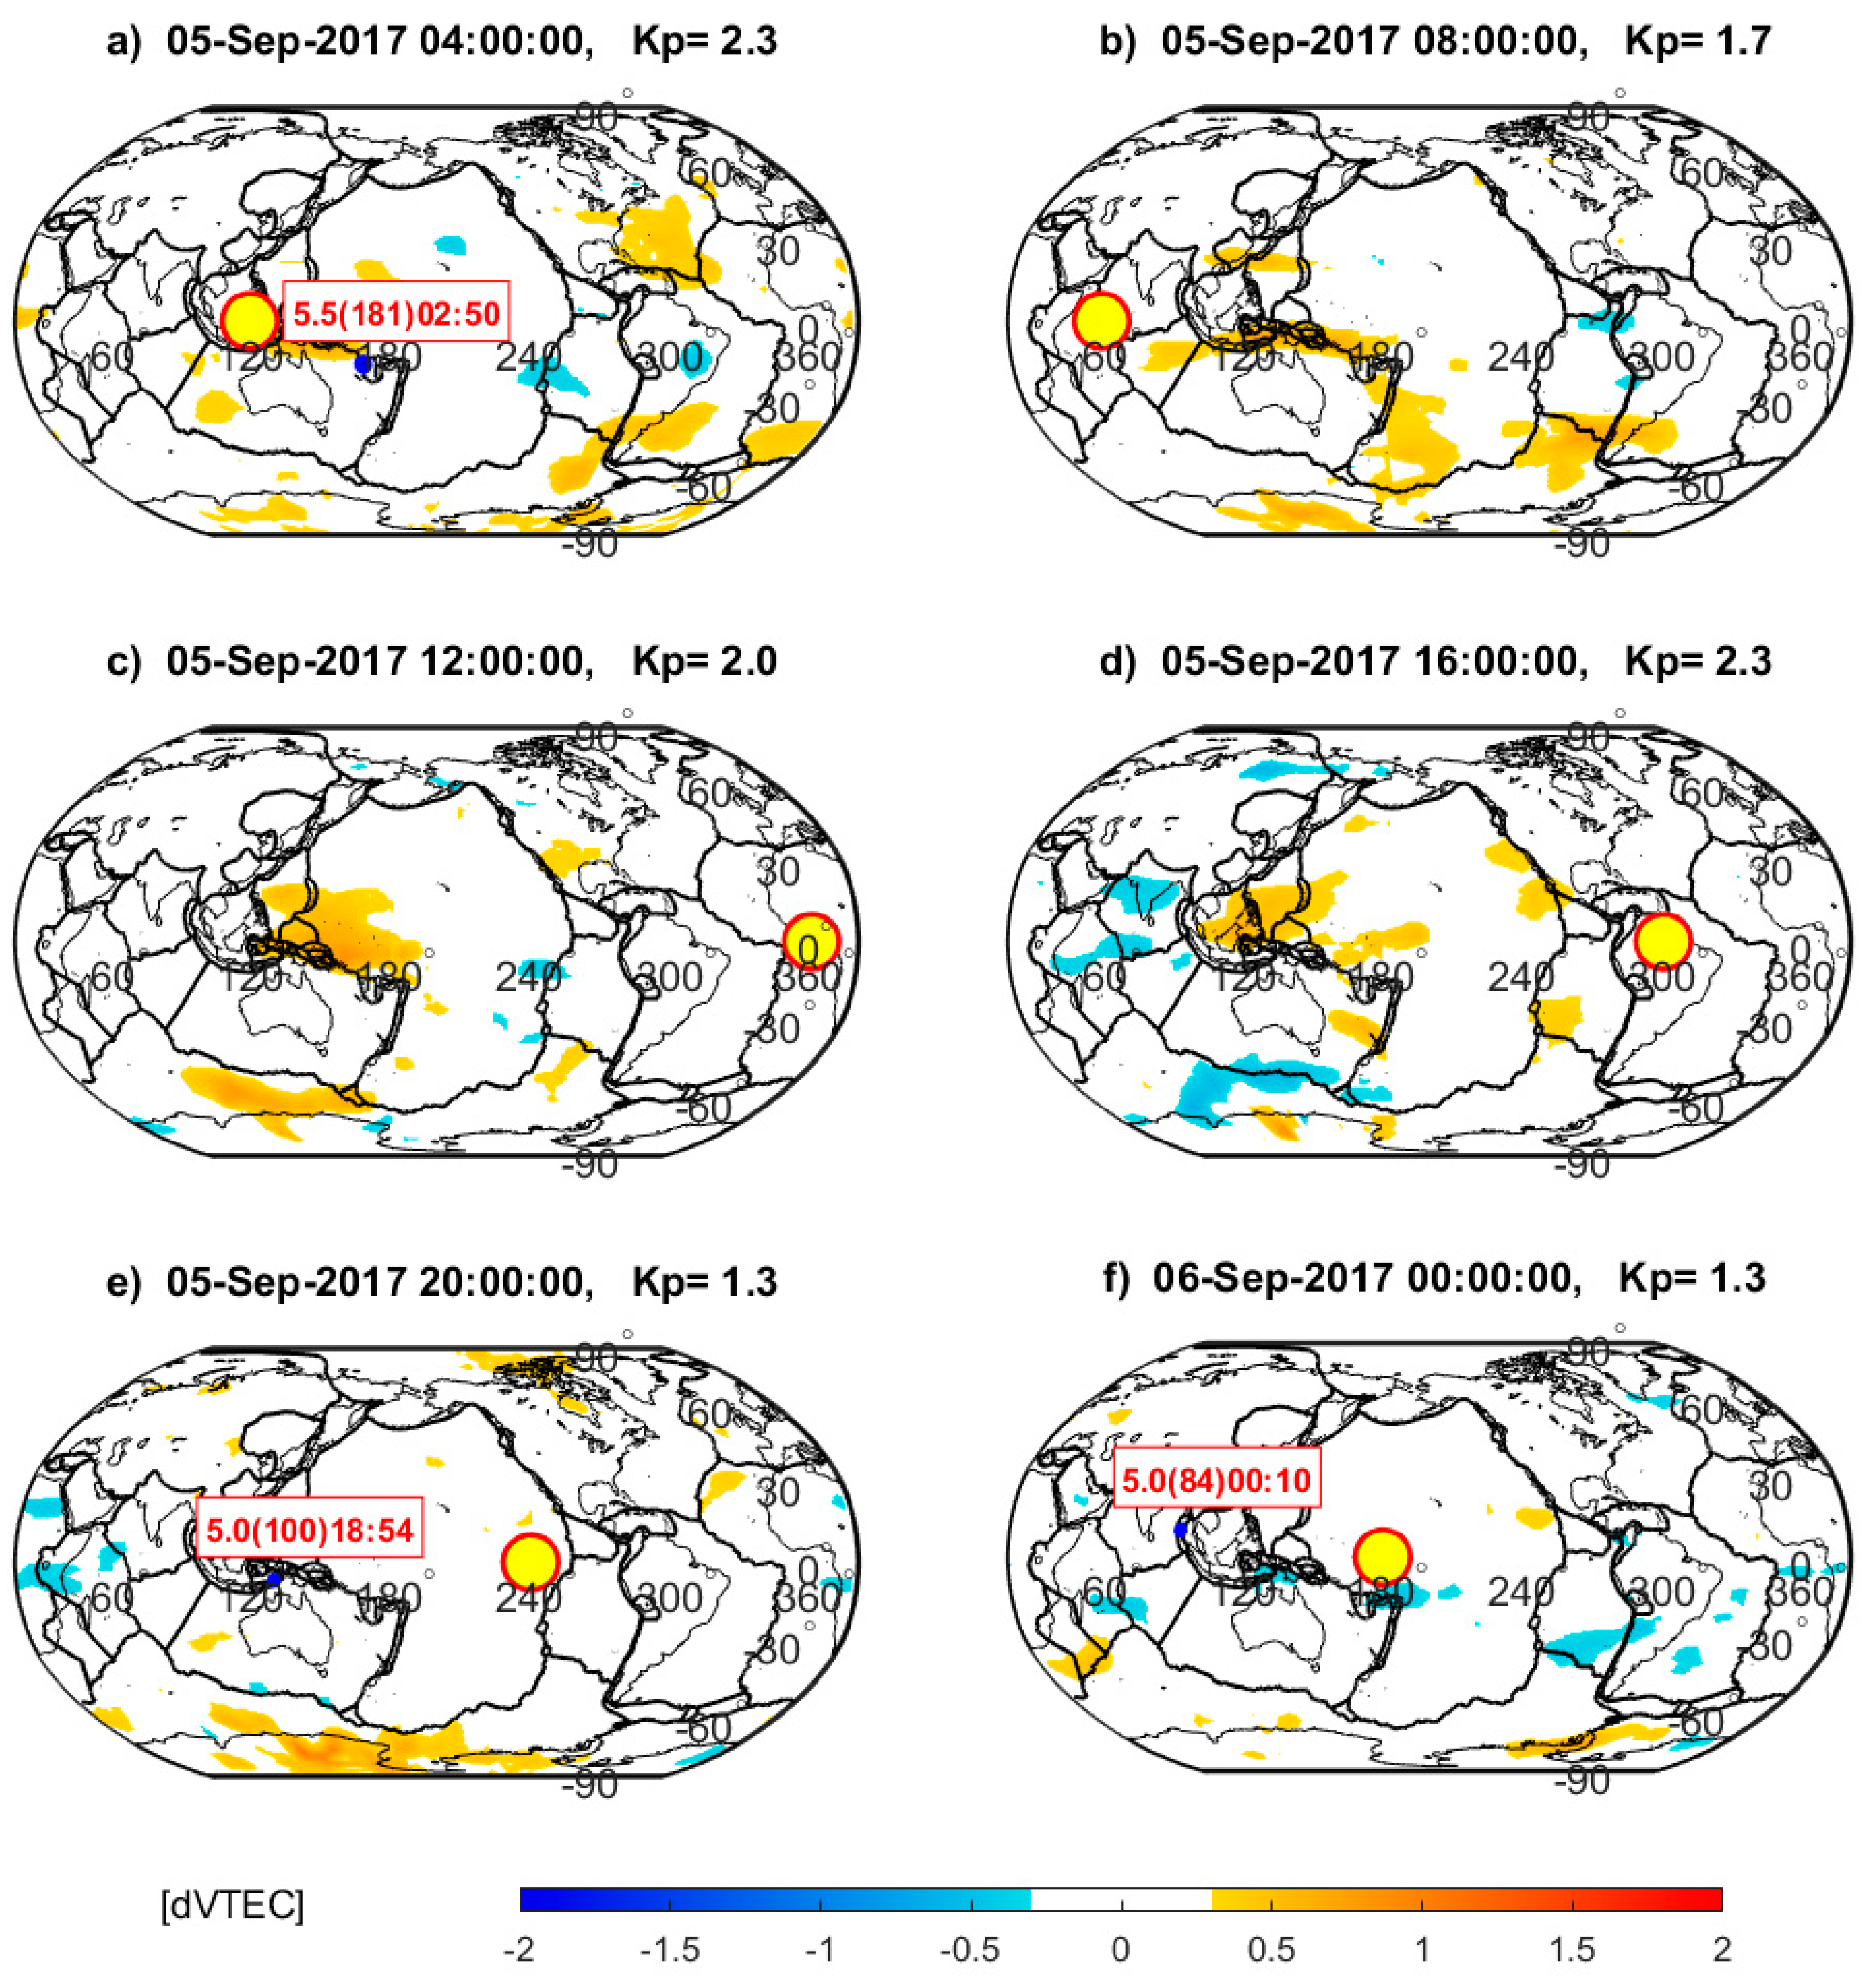
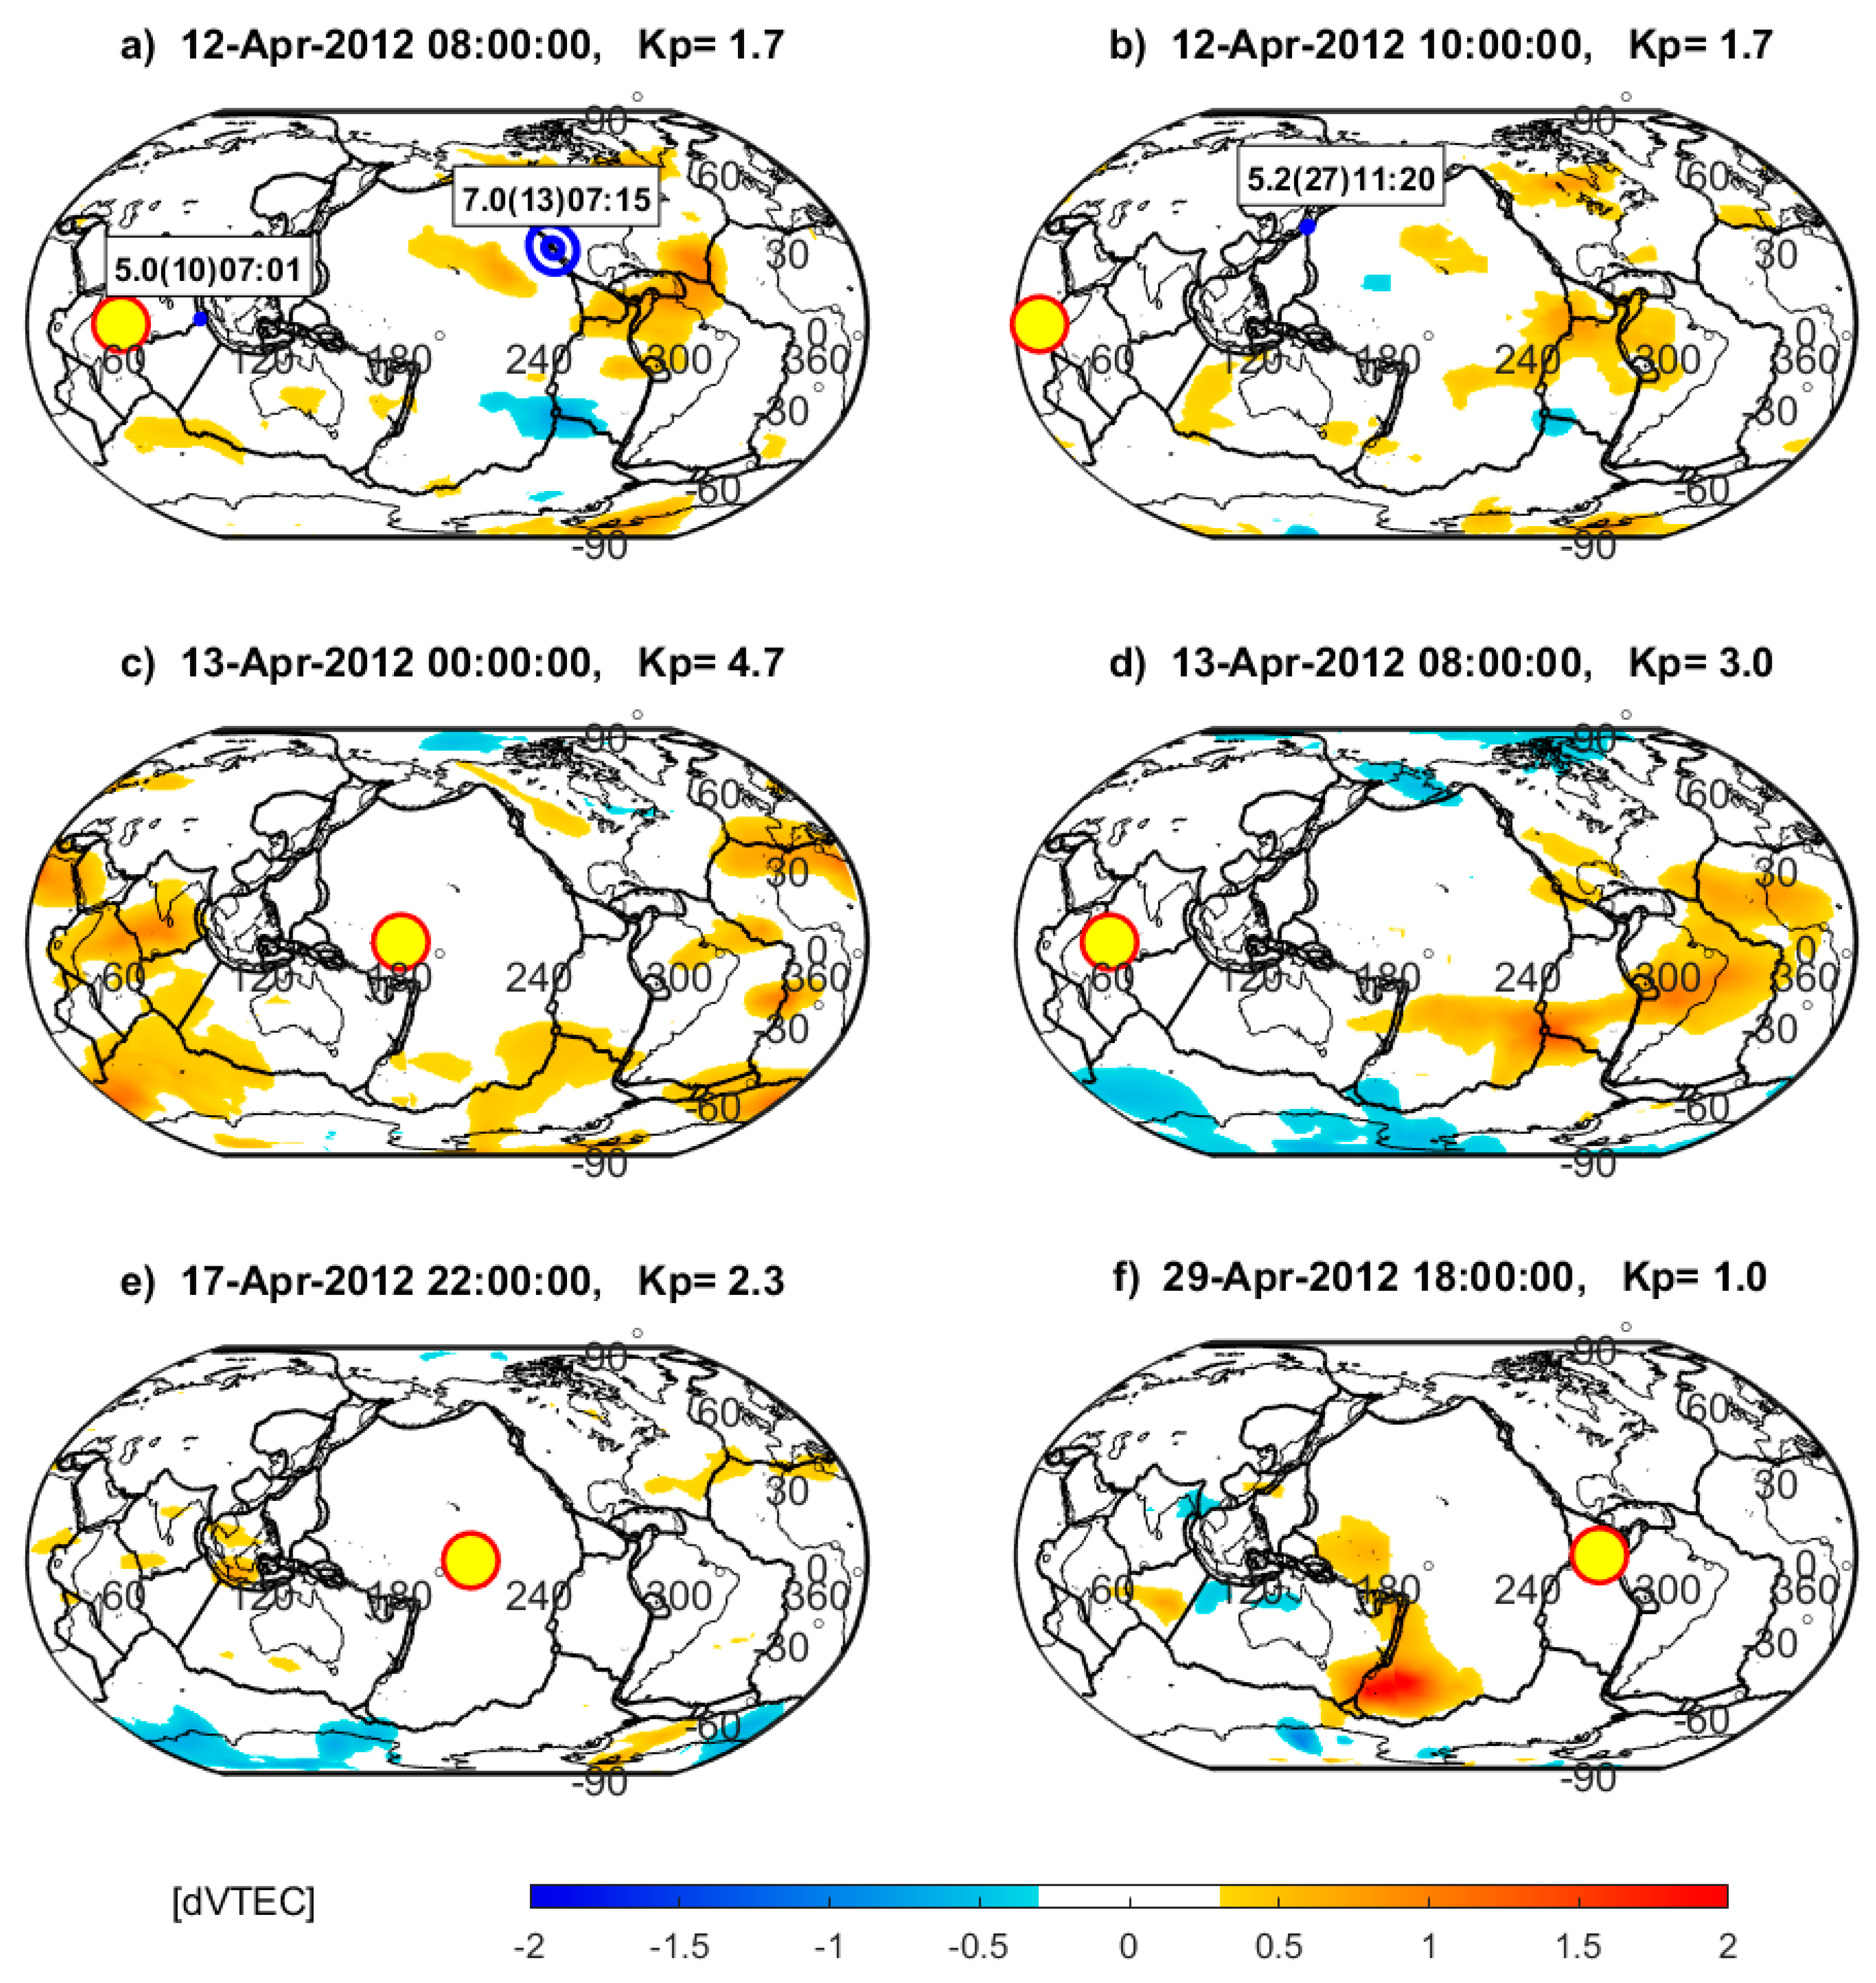
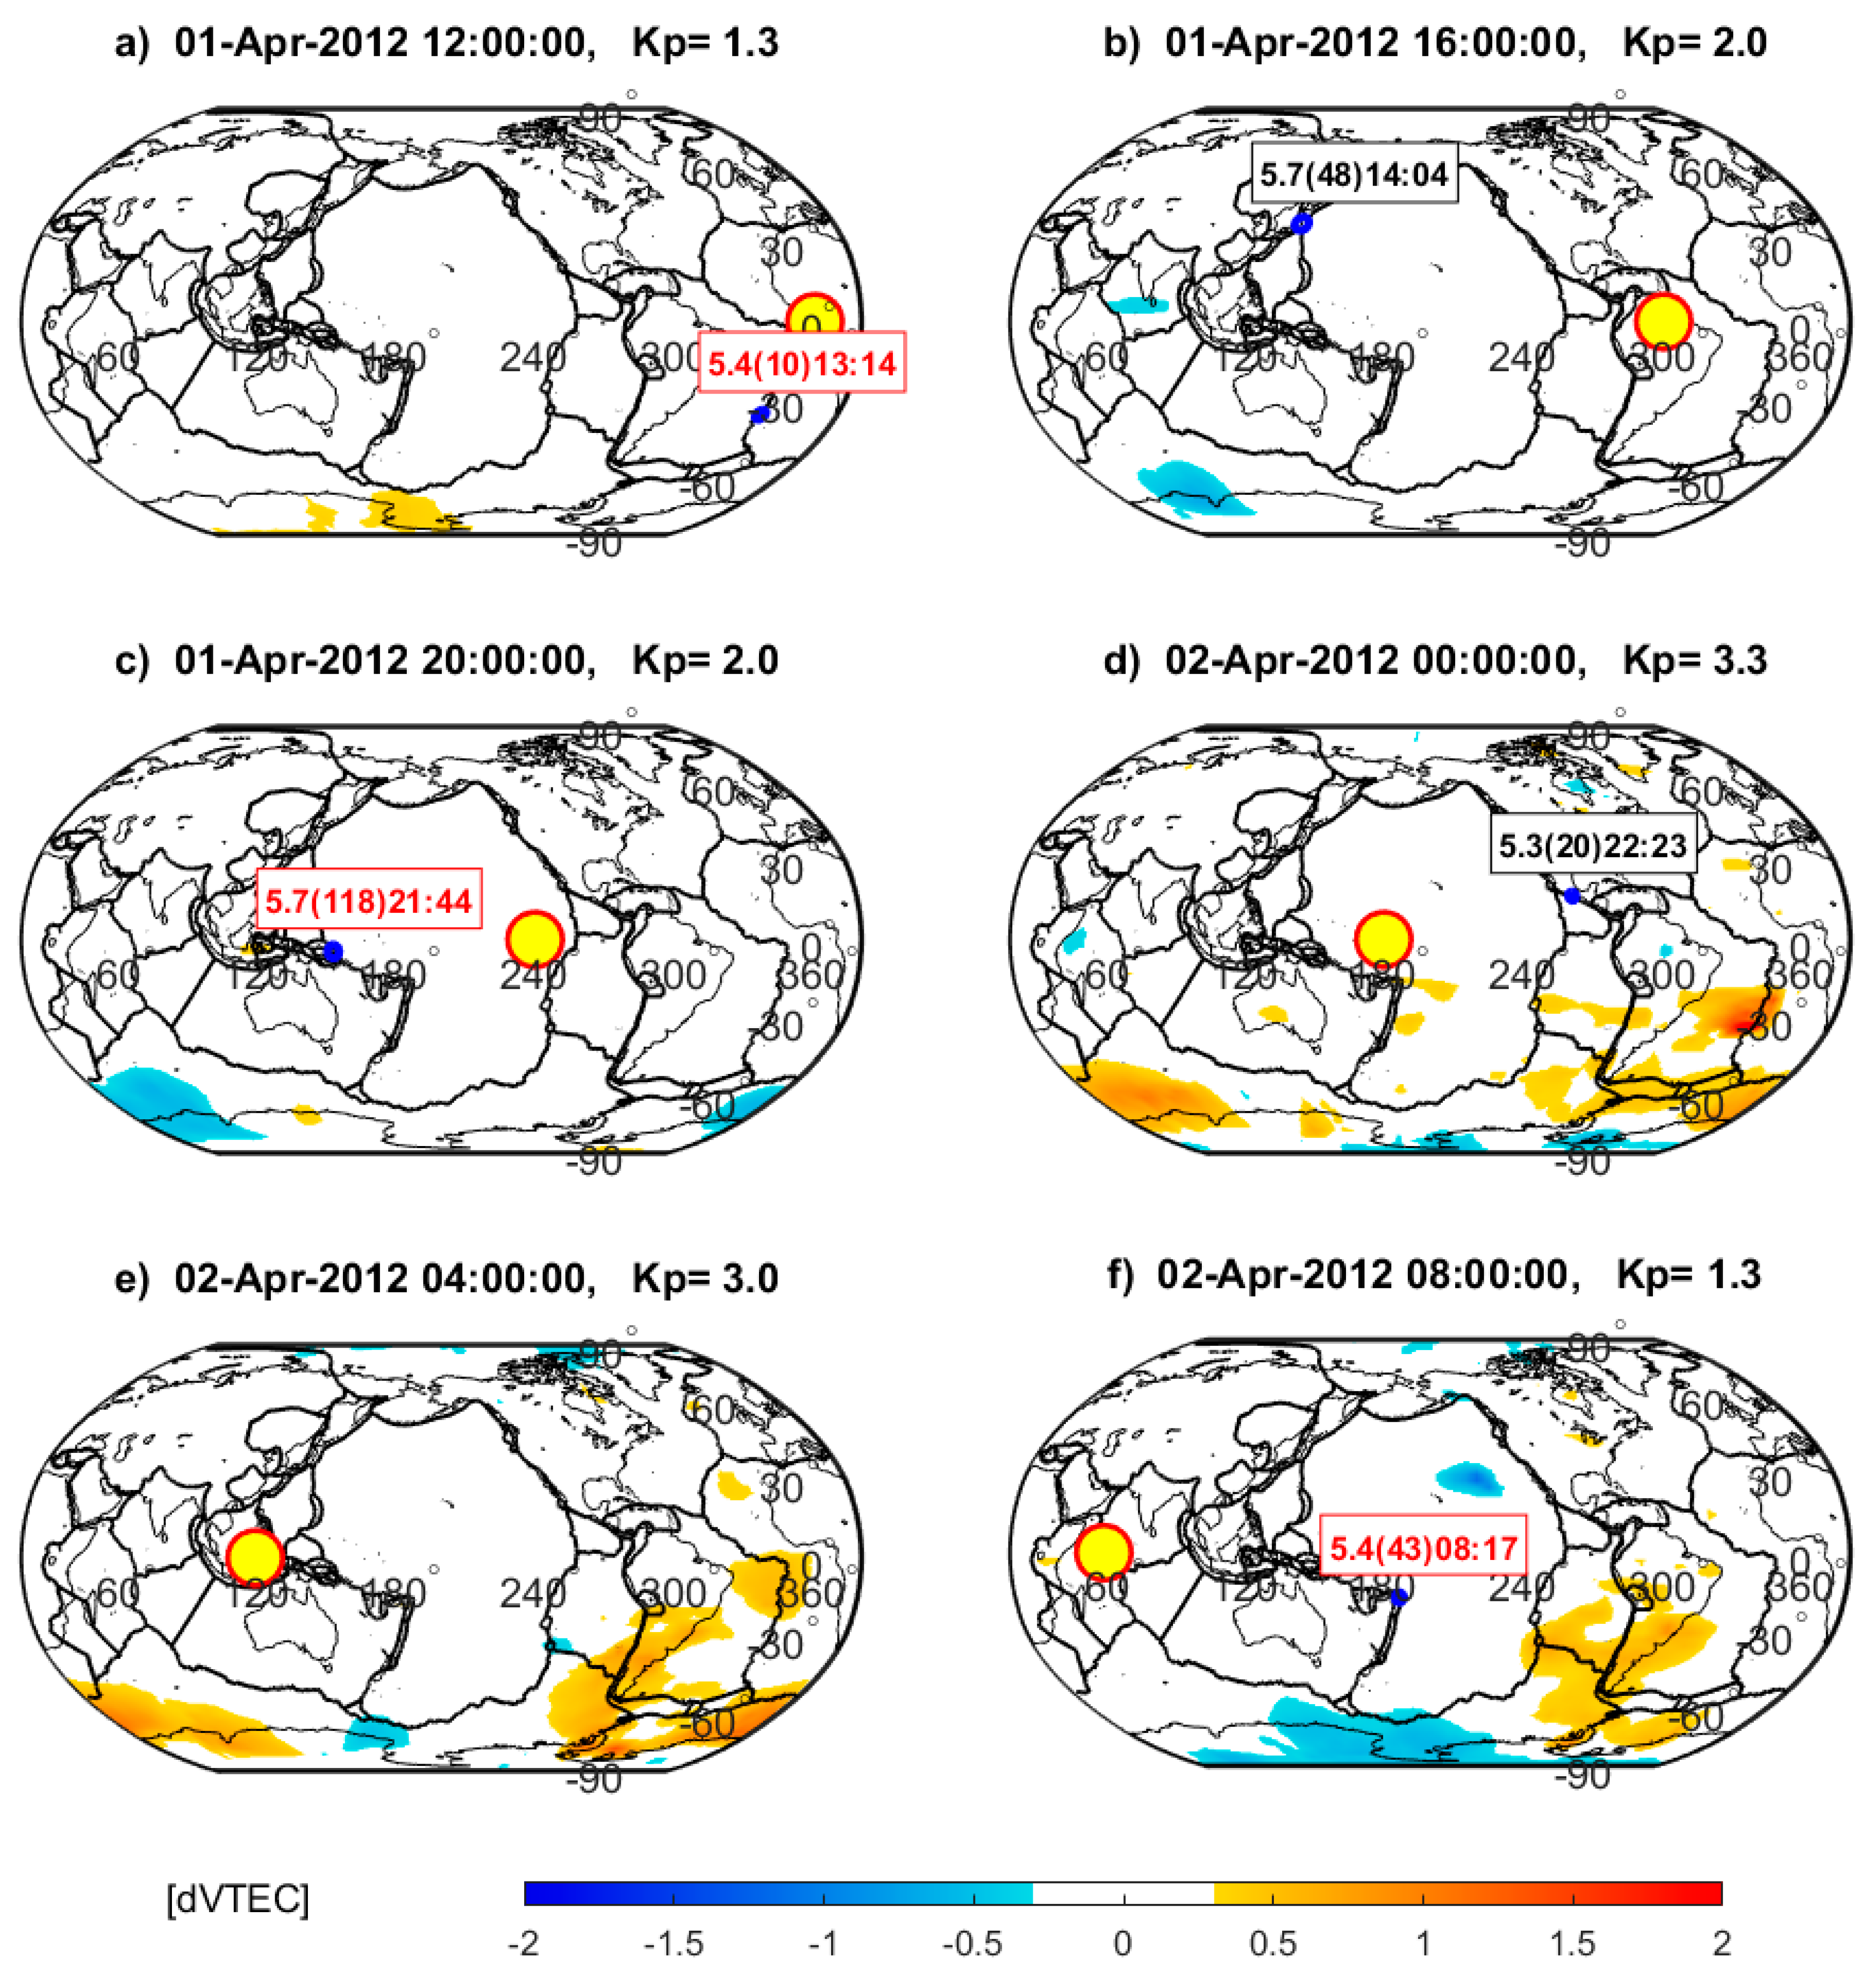
This section describes dVTEC extrema persisting for several hours over tectonic plate boundaries during average or low geomagnetic activity. Figure 3 demonstrates six snapshots with time interval of 4 h from April 2012, and Figure 4 gives similarly obtained six frames from September 2017. Figure 3a–c present almost no high dVTEC values but, instead, two important earthquakes potentially related with future dVTEC extrema. Figure 3a shows M = 5.4 earthquake at the boundary of the South American (SA) and African (AF) tectonic plates (see Figure 1 for acronyms and locations of tectonic plates), where strong dVTEC anomaly takes place 12 h later in Figure 3d. The highest peak of this anomaly is exactly centred over SA-AF plate boundary. At the same time, in Figure 3d, we can notice relatively spatially small dVTEC anomalies four hours after M = 5.7 earthquake at the complex boundary of Australian (AU) and Pacific (PA) plates including many minor plates (Figure 3c). Figure 3e,f show high dVTEC over the junction of several plates i.e.,: Nazca plate (NZ), Antarctic plate (AN), South American plate (SA), and Scotia plate (SC). The common shape and location of this strong dVTEC with tectonic plate boundaries is evident in Figure 3e,f. The position of the apparent Sun is far from this region during its whole observation period, and we can exclude its solar origin. The area of the NZ-AN-SA-SC plate junction will also be discussed later in Section 3.2, as it is the place of high positive dVTEC detected more than once in this study.
Figure 4a shows a high dVTEC over the same plate boundaries as previously (NZ-SA-AN-SC), but less extended geographically, and less similar to the shape of this tectonic plate junction. There are also other noticeable high dVTEC values in Figure 4a, i.e., one over the North American (NA) and Caribbean (CA) plate boundary extended to NA plate interior, one over the AN-AF boundary, and one over the AU-PA boundary appearing together with M = 5.5 earthquake (Figure 4a). Figure 4b demonstrates the same but stronger anomaly over the plate boundaries shown in Figure 4a (NZ-SA-AN-SC) and a second one over AU-PA, which is elongated and particularly similar in shape to this complex tectonic plate junction. The latter dVTEC anomaly in Figure 4b persists partially in Figure 4c, where we can also see high dVTEC close to the AN-AU plate boundary. The latter anomaly transforms into negative dVTEC in Figure 4d, whereas positive dVTEC remains still over AU-PA. Figure 4e shows small positive dVTEC over the NA-AF plate boundary near Azores, whereas Figure 4f presents negative dVTEC over AU-PA and AN-NZ. Figure 4e,f include two M = 5.0 earthquakes in the region neighbouring the positive dVTEC area, which are persistent during the previous 12 h over the AU-PA tectonic plate junction.

3.2. VTEC Enhancements and Depletions During Strong Geomagnetic Activity
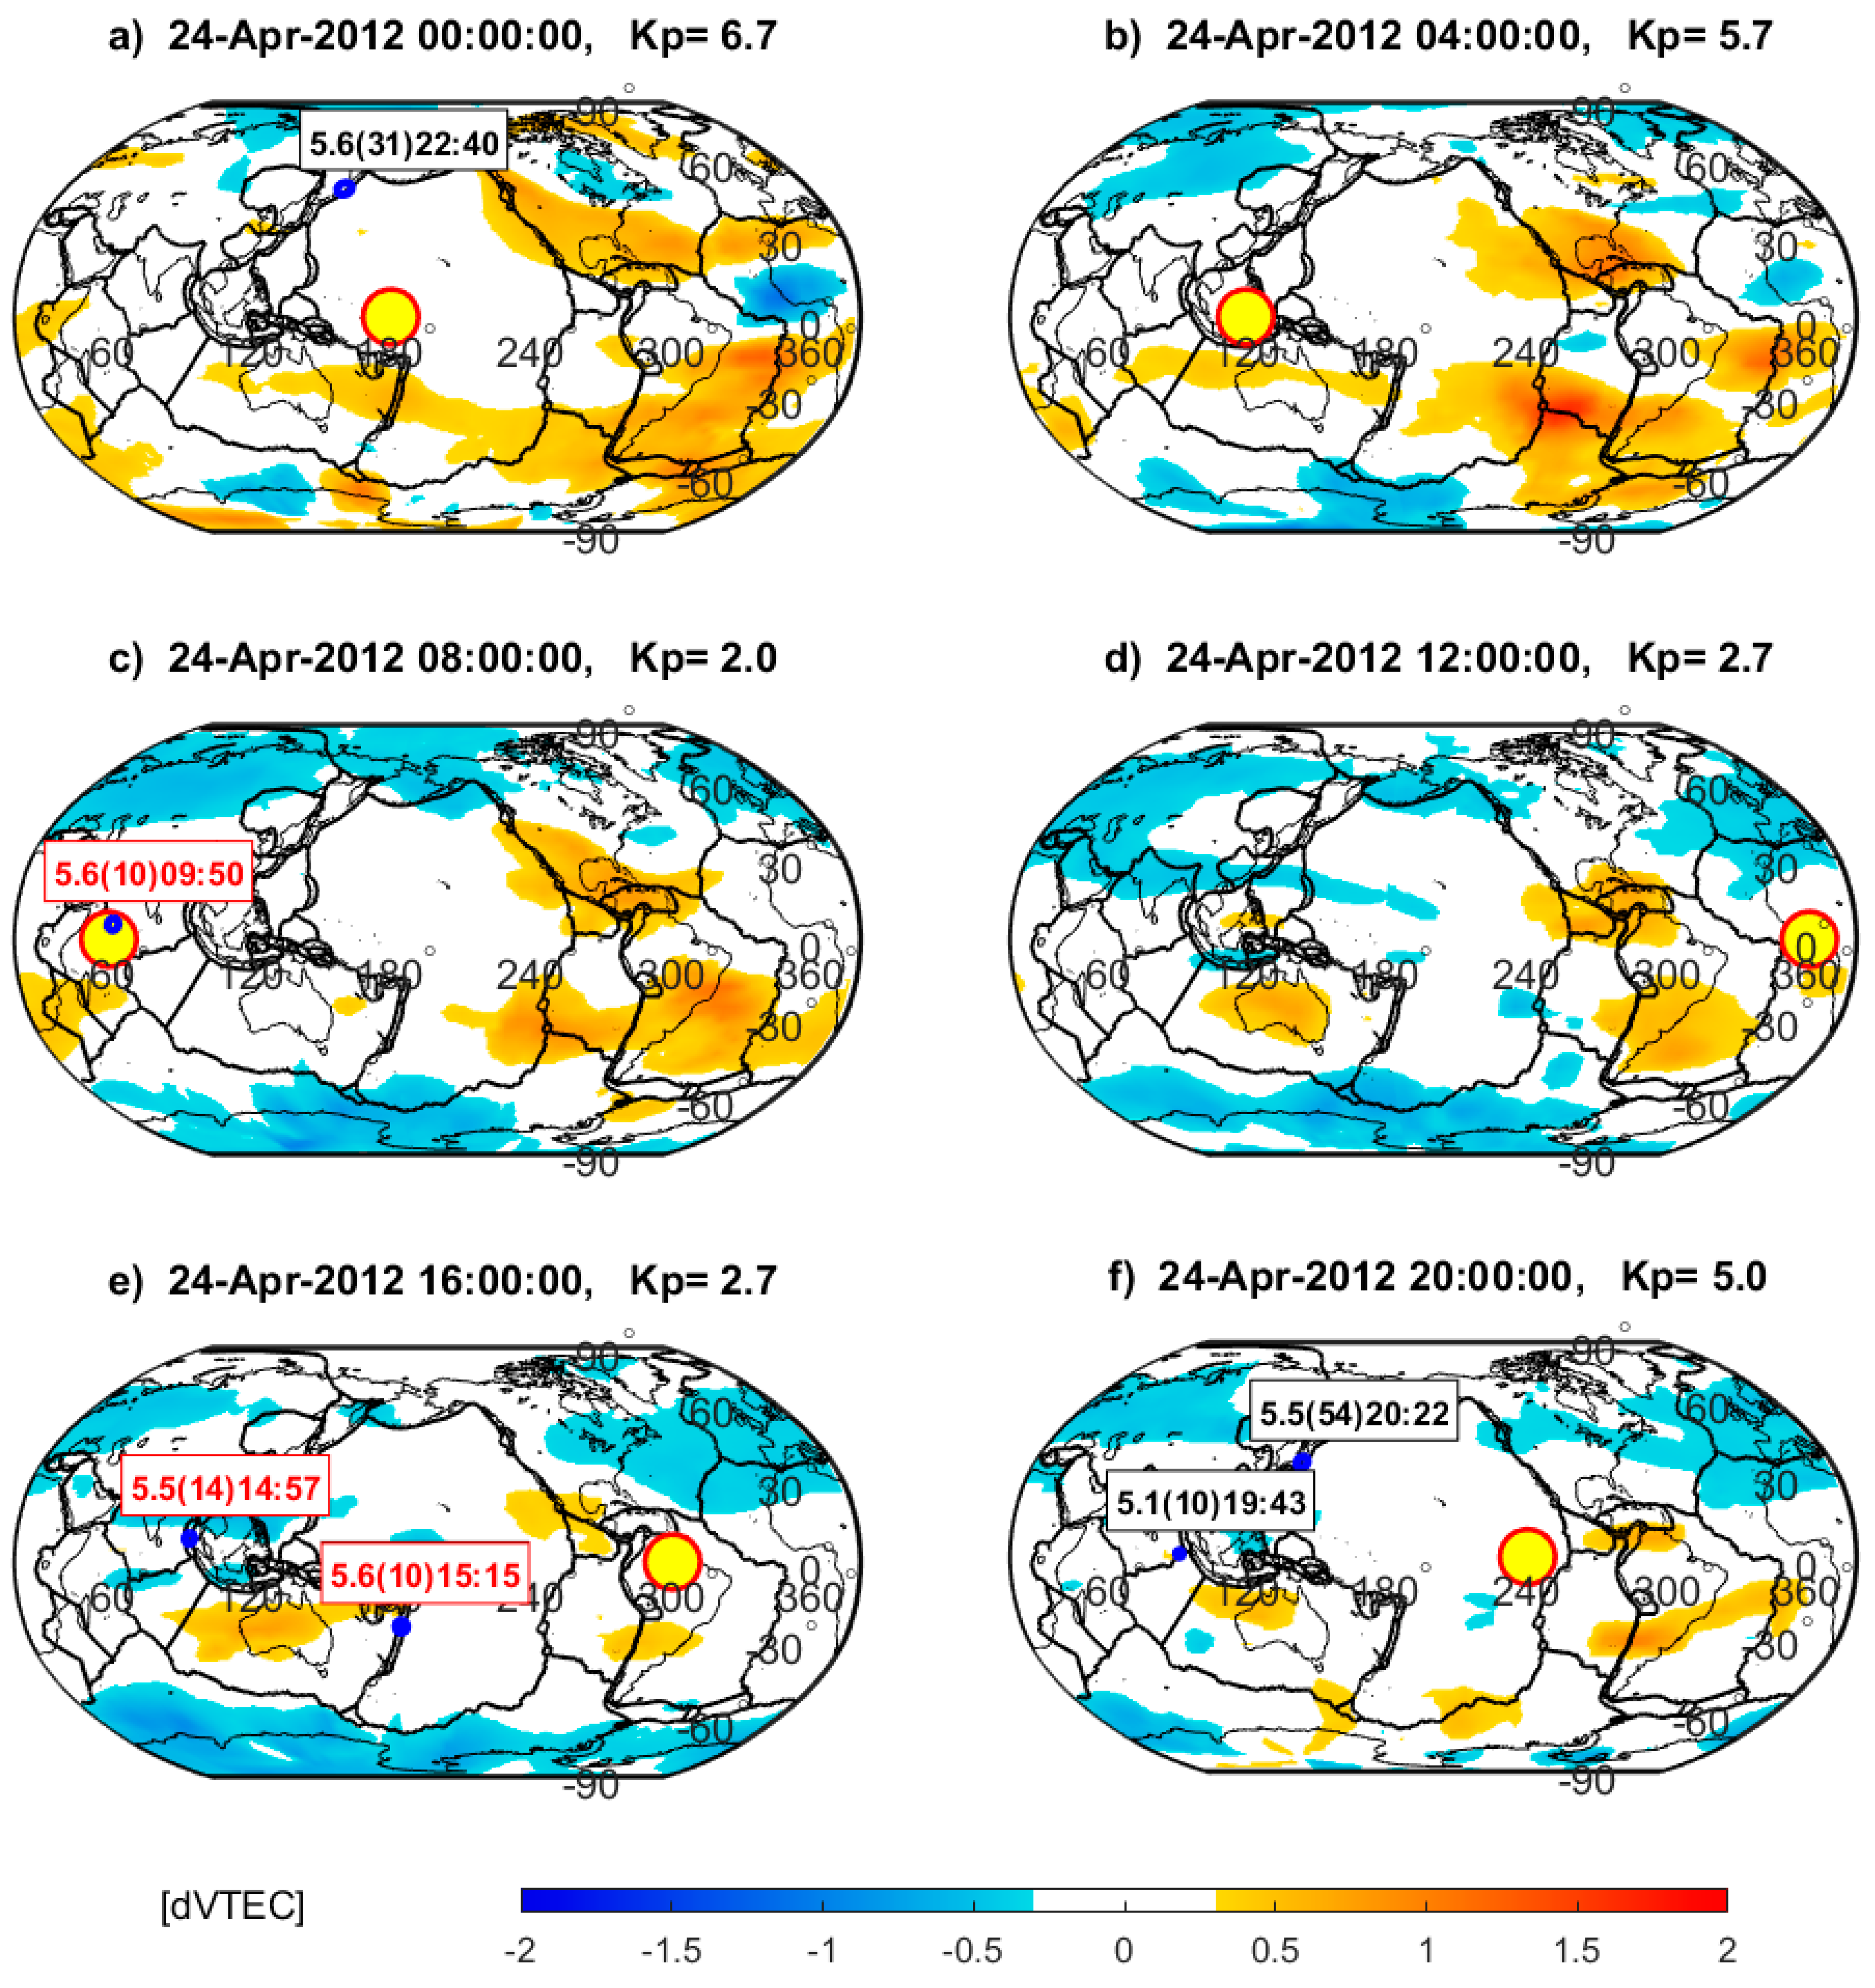
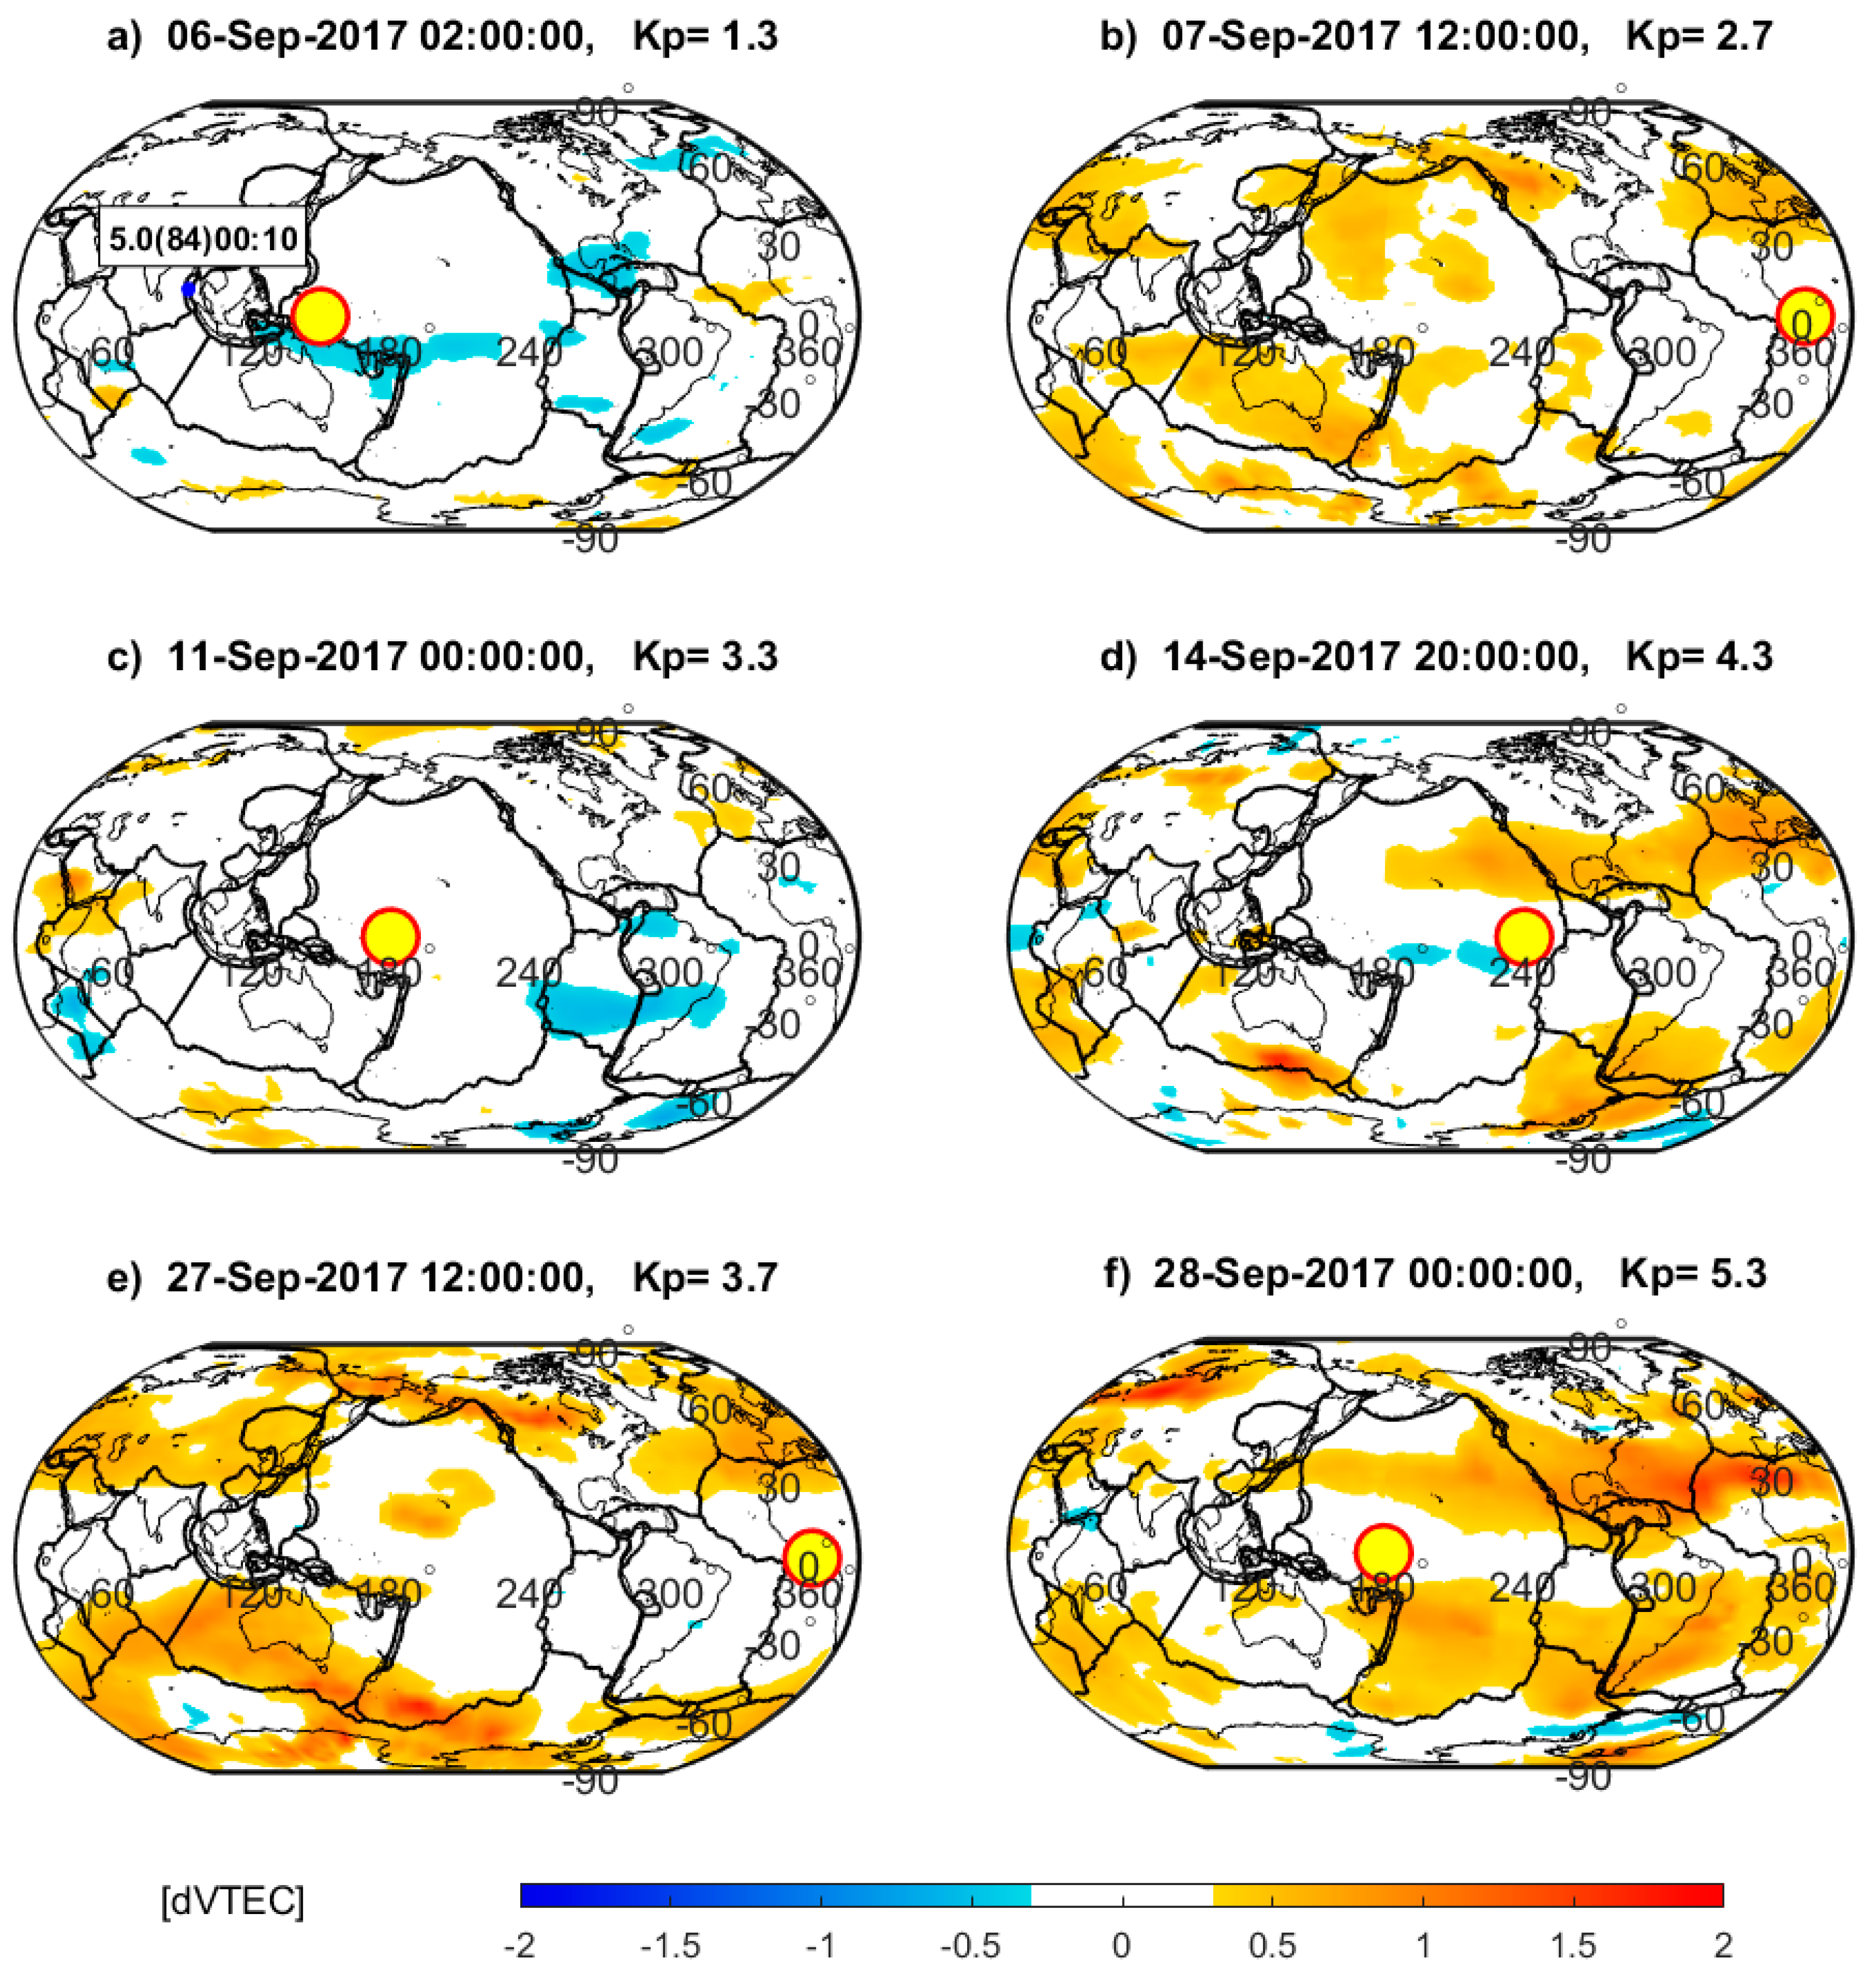
Geomagnetic storms transfer a lot of energy and generate changes in the magnetosphere and ionosphere. Although the magnitudes of dVTEC are larger at the time of geomagnetic storms in general, there are dVTEC anomalies, which are specific in terms of the location and duration. These positive and negative dVTEC anomalies are independent of the Sun radiation and last for many hours only over tectonic plate boundaries. Figure 5a–c include the high positive dVTEC located over the boundaries of the NZ-AN-SA-SC plates already known from Figure 3 and Figure 4, but now, it is stronger and extended more over the tectonic plate junction of NZ-AN-SA-SC-PA. Figure 5b,c also show well a strong positive dVTEC over the NA-CA tectonic boundary, which is extended to the NA-PA boundary. Figure 5b proves the link between dVTEC anomalies and tectonic plate boundaries not only by their shapes but also by their extrema located exactly over three tectonic plate junctions (NA-CA, NZ-AN-PA, and SA-AF). Figure 5d,e present the weakening of the abovementioned dVTEC anomalies but also a positive dVTEC over the AU plate interior and a negative dVTEC over the junction of the Eurasian (EU), AF, and NA tectonic plates. Figure 5f, aside from declining dVTEC in places shown in the previous subfigures of Figure 5, includes two small but clearly positive dVTECs over the AN-PA plate boundary. Figure 5e shows moderate earthquakes occurring frequently in the southeast Asia region.
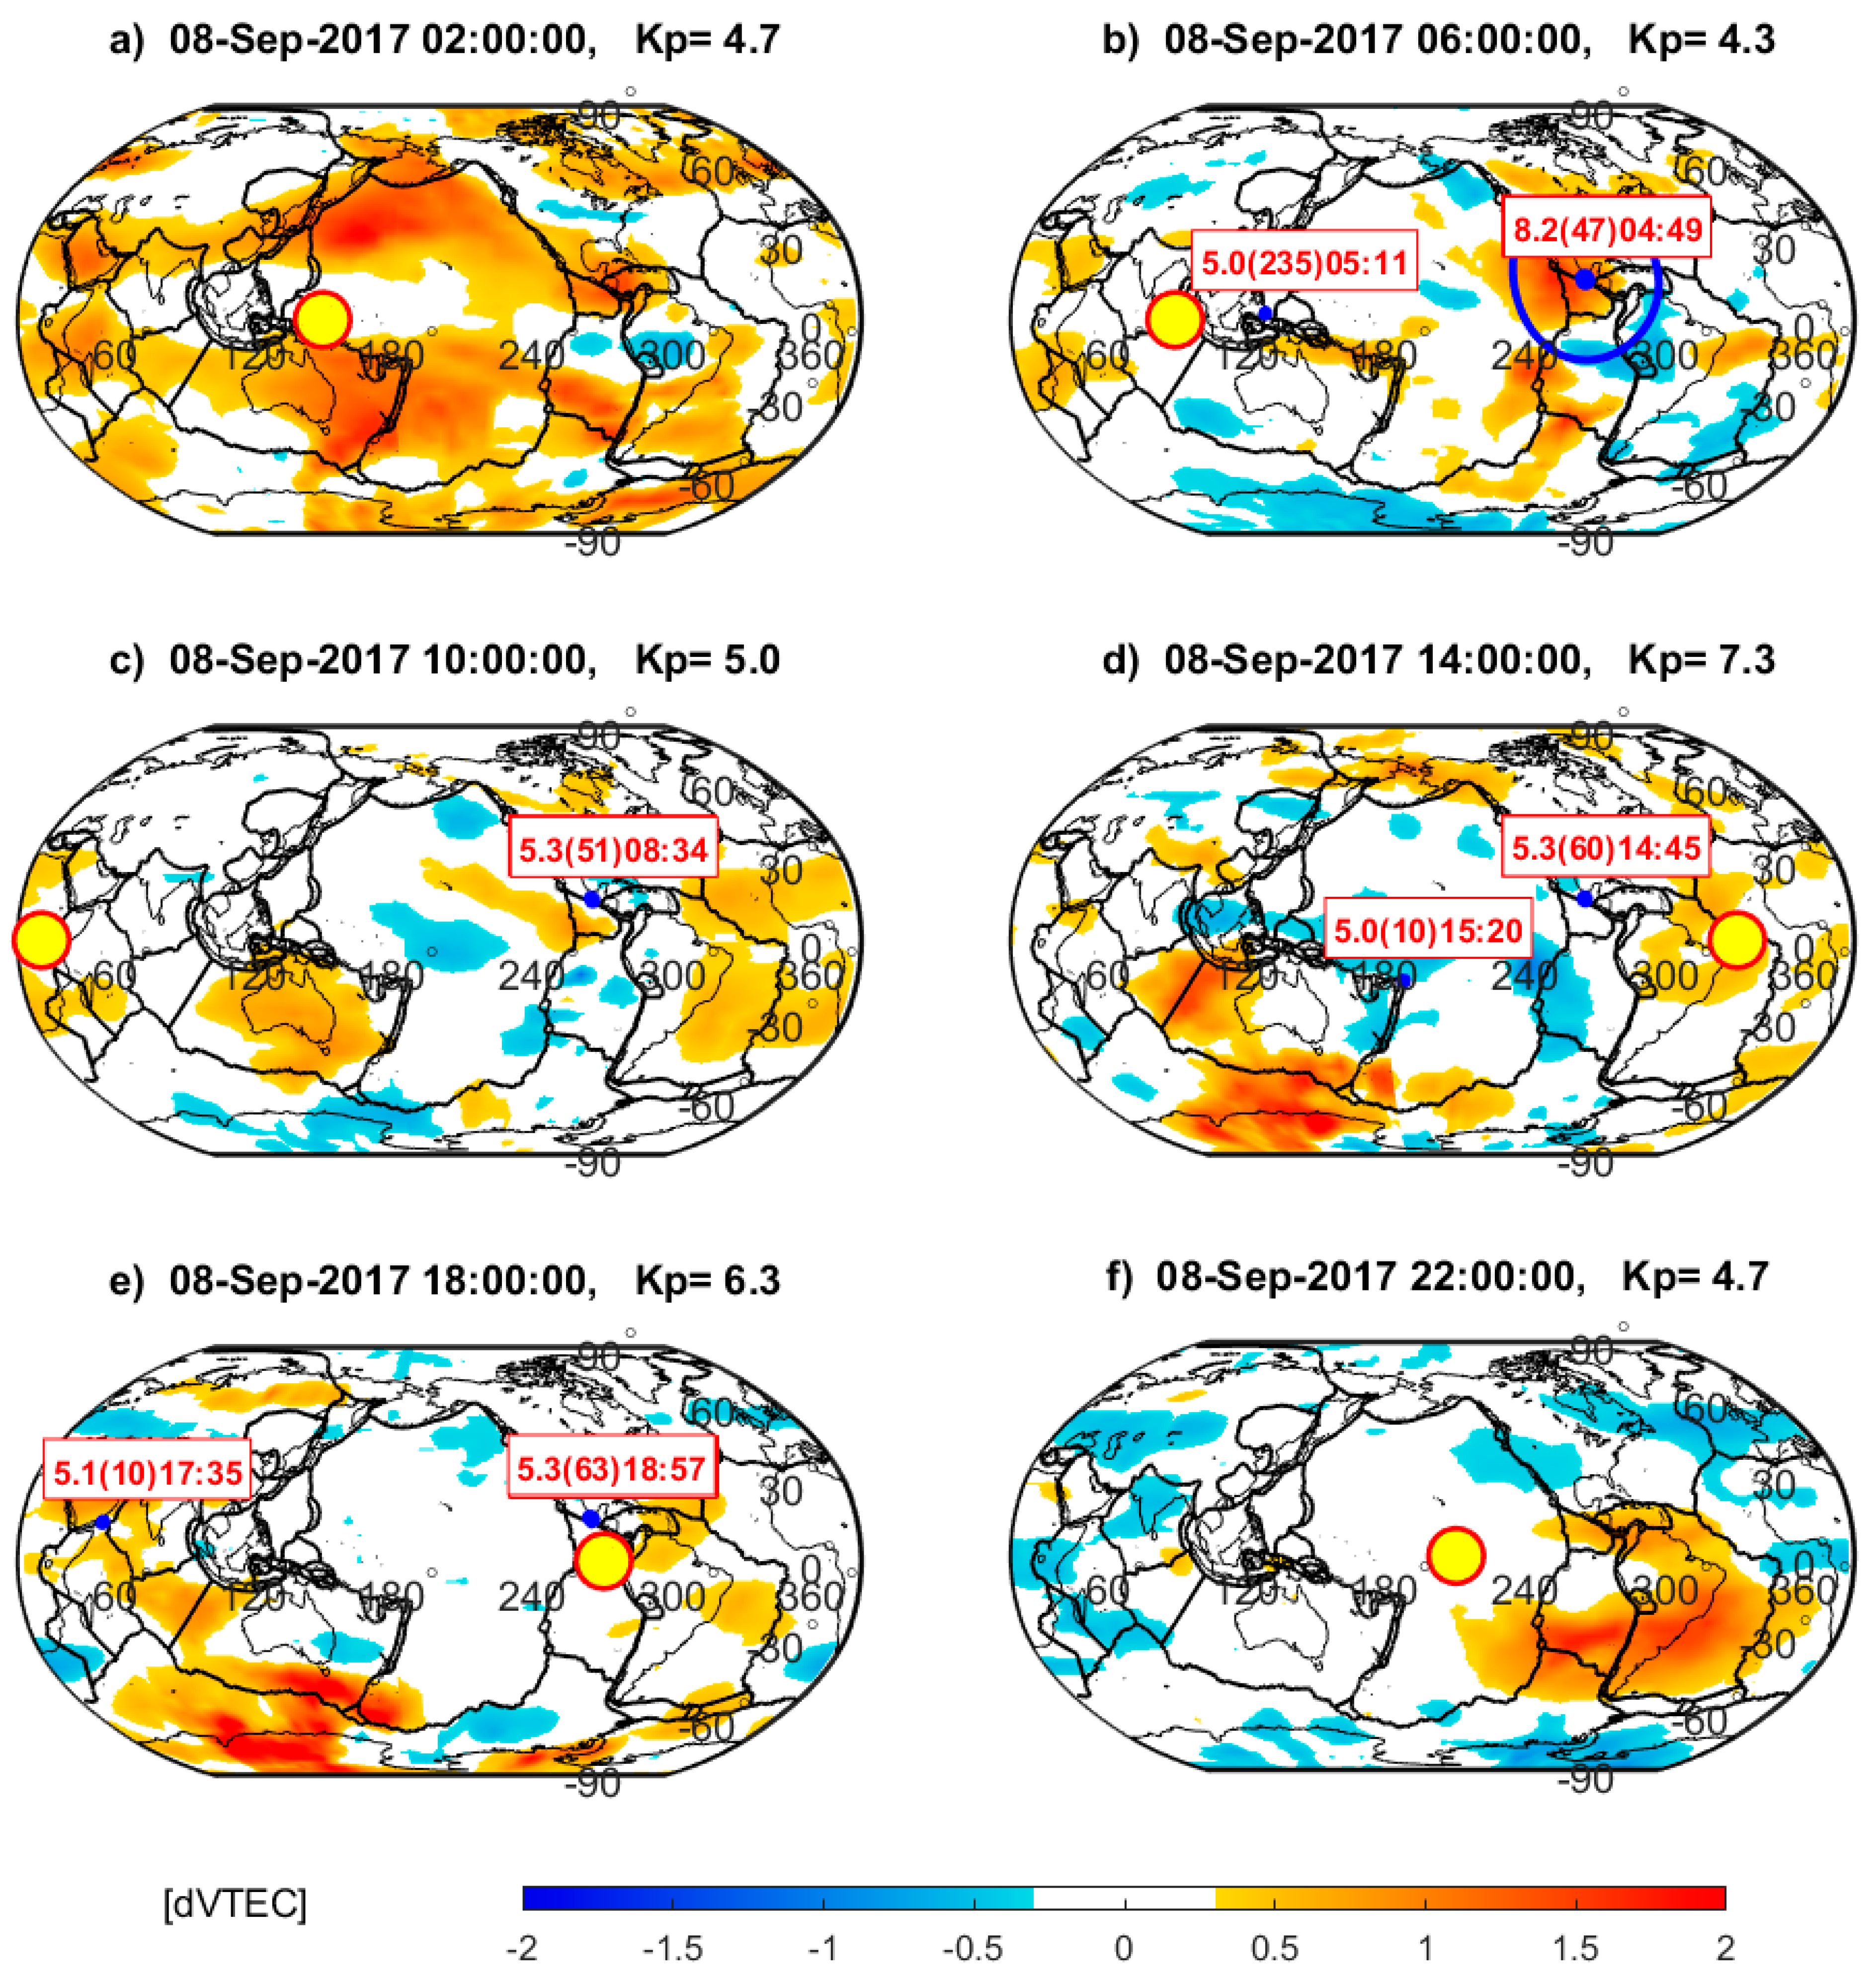
Figure 6 presents the strongest geomagnetic storm in this study, with Kp reaching 8o and the largest dVTEC. There are two dominant large dVTEC areas located on either side of the geomagnetic equator, occupying the region of the circum-Pacific plate boundaries, and leaving an empty place in the centre of the PA plate. However, a more detailed inspection of Figure 6a,b reveals three places of the highest dVTEC known from most of the previous figures, i.e., the PA-NZ-AN, CA-NA, and AU-PA plate boundaries. Figure 6a includes also a fourth evident maximum of dVTEC not presented before, i.e., the NA-PA-Okhotsk plate (OK) boundary. All these four regions have overall increased dVTEC anomalies with respect to the same locations in Figure 3 and Figure 4 due to the geomagnetic storm on 8 September 2017. The high dVTEC over CA-NA plate boundary coincides with the great earthquake in Figure 6b and then with the moderate earthquakes in Figure 6c,d, which are presumably its aftershocks. The high dVTEC over CA-NA extended to the Coco plate (CO) returns in Figure 6e,f, after some decline, as well as the anomaly over the PA-NZ-AN tectonic plate junction. Figure 6d,e present another dVTEC extrema over tectonic plate boundaries, i.e.,: AN-AU, and a relatively new boundary between the AU and Capricorn (CP) plates (Figure 6d). The most interesting observations are again the maxima of dVTEC and their several-hour persistence over tectonic plate boundaries, which sometimes repeat after several hours of disappearance. The geomagnetic storms induce the largest dVTEC anomalies, which evolve, travel longitudinally, and disappear. It is true that moderate geomagnetically driven dVTEC changes amplify stronger dVTEC over tectonic plate boundaries, but their maxima persist over the circum-Pacific plate boundaries for a much longer time (Figure 6).
Figure 3. Selected 20 h of dVTEC from the UQRG in a four-hour interval from 1 April 12:00 UTC to 2 April 8:00 UTC, 2012. Tectonic plate boundaries (black bold lines), earthquakes within ±2 h having M ≥ 5.0 (Dobrovolsky circles in blue), and apparent Sun position (yellow circle) are shown for reference. The labels of earthquakes include magnitude, depth in km in parenthesis, and time (UTC). Red labels indicate earthquakes located close in time and space to high dVTEC values (also indicated in red in Figure 2).
Remotesensing 17 00614 g003
Figure 4. Selected 20 h of dVTEC from the UQRG in a four-hour interval from 5 September 04:00 UTC to 6 September 00:00 UTC, 2017. Tectonic plate boundaries (black bold lines), earthquakes within ±2 h having M ≥ 5.0 (Dobrovolsky circles in blue), and apparent Sun position (yellow circle) are shown for reference. The labels of earthquakes include magnitude, depth in km in parenthesis, and time (UTC). Red labels indicate earthquakes located close in time and space to high dVTEC values (also indicated in red in Figure 2).
Remotesensing 17 00614 g004
Figure 5. Selected 20 h of dVTEC from the UQRG in a four-hour interval from 24 April 00:00 UTC to 24 April 20:00 UTC, 2012. Tectonic plate boundaries (black bold lines), earthquakes within ±2 h having M ≥ 5.0 (Dobrovolsky circles in blue) and apparent Sun position (yellow circle) are shown for reference. The labels of earthquakes include magnitude, depth in km in parenthesis, and time (UTC). Red labels indicate earthquakes located close in time and space to high dVTEC values (also indicated in red in Figure 2).
Remotesensing 17 00614 g005
Figure 6. Selected 20 h of dVTEC from the UQRG in a four-hour interval from 8 September 02:00 UTC to 8 September 22:00 UTC, 2017. Tectonic plate boundaries (black bold lines), earthquakes within ±2 h having M ≥ 5.0 (Dobrovolsky circles in blue), and apparent Sun position (yellow circle) are shown for reference. The labels of earthquakes include magnitude, depth in km in parenthesis, and time (UTC). Red labels indicate earthquakes located close in time and space to high dVTEC values (also indicated in red in Figure 2).
Remotesensing 17 00614 g006
In summary, the highest dVTEC extrema occupy the region of the circum-Pacific zones (Ring of Fire), but we should remember that Figure 3, Figure 4, Figure 5 and Figure 6 are centred at the meridian 140° W. Therefore, the eastern hemisphere especially needs a careful inspection with respect to dVTEC extrema locations, as they are distorted by the cartographic projection and less convenient for viewing here. Nevertheless, it is easy to recognize that high dVTEC values often persist for more than 8 h in the same locations regardless of the Sun and geomagnetic conditions. The maximum peaks of dVTEC precisely occupy tectonic plate boundaries, especially the circum-Pacific plate boundaries often described as the “Ring of Fire” due to associated volcanic activity. Additionally, strong geomagnetic activity induces large-scale global VTEC changes, but clear dVTEC extrema over tectonic plate boundaries can be found even at Kp = 1.0. A new observation related to earthquakes is such that extreme dVTEC values are observable not solely after or before strong earthquakes, but also smaller-scale seismic activity can play a role in the development of dVTEC anomalies. On the other hand, the concept of the relationship between geomagnetic activity and earthquakes is not contradicted here, as a great earthquake is seen in Figure 6b, together with a geomagnetic storm. However, the dVTEC extremum over the earthquake, additionally magnified by the geomagnetic storm, remains strong even when the other geomagnetically driven anomalies disappear in Figure 6b,c. Figure 6 indicates that when a geomagnetic storm occurs together with a large earthquake, the amplitudes of dVTEC look likely to be affected by both factors.

3.3. VTEC Enhancements Without M ≥ 5.0 Earthquakes Exhibiting Shapes of Tectonic Plate Boundaries

In the previous Section 3.1 and Section 3.2, we presented four examples of the temporal evolution of dVTEC during 20 h, covering a period during which the Earth rotates by 300°. This enables the observation of dVTEC at different positions with respect to the Sun and EIA. The six consecutive time epochs also give us another opportunity. Namely, by observing subsequent time epochs, we can approximately link some dVTEC extrema with M ≥ 5.0 earthquakes. In this section, we selected two sets of six frames, which include the most characteristic shapes of positive dVTEC extrema in April 2012 and September 2017. These anomalies are of course characteristic with respect to tectonic plate boundaries, and they are not related in time. According to our rule of showing the closest earthquakes in each frame, we also include earthquakes occurring up to 2 h before and after the time of selected GIM snapshots in Figure 7 and Figure 8. Figure 7 presents six additionally selected epochs in April 2012, when the Kp index had various values. The most specific shapes of dVTEC extrema occurring at different latitudes in Figure 7 are far from the EIA and have nothing in common with the geomagnetic equator. Their shapes, separation from EIA, and several-hour persistence (>8 h) over tectonic plate boundaries strongly suggest that their relationship with the geomagnetic field is transitional. Figure 7a shows positive dVTEC over the boundaries of SA, NZ, CO, CA, NA, AF, and AN plates that truly reflects the shape of their junction on the nightside. There is also major M = 7.0 earthquake in Mexico, which is, however, distant from this dVTEC anomaly. The same figure also includes the positive dVTEC anomaly over the AN-AU boundary and a depletion over the NZ-AN-PA junction. Figure 7b shows the continuation of positive high dVTEC over the SA-NZ-CO-CA-NA-AF-AN junction, which evolved to the PA plate. Figure 7b also presents an anomaly, for which there are sufficient arguments to evaluate it as geomagnetically triggered. This is the high positive VTEC anomaly over Canada, and it was previously observed by Sun et al. [40], who assessed it as Midlatitude Summer Nighttime Anomaly (MSNA). Such VTEC anomalies can also be found in Europe and Siberia [29], and besides the fact that their geomagnetic origin is undisputable, we also clearly see that their shape, location, and longitudinal travel distinguish them significantly from those located over tectonic plate boundaries. Figure 7b also includes high dVTEC values coincident in shape and located near the AU-CP boundary. Figure 7c presents high positive dVTEC over several tectonic plate boundaries, and they are as follows: AN-CP-AU junction, SA-AF and AN-NZ-PA boundaries, boundary between Indian (IN) and Somalian (SM) plates, neighbourhood of SC-AN boundary, and strong anomaly over the EU-AF boundary. Figure 7d presents high positive dVTEC over the boundaries: NZ-PA-AN and NA-AF-SA. These anomalies, already observed before, are placed over the mentioned plate boundaries at nighttime. Figure 7e shows a geographically small but very characteristic positive dVTEC anomaly over the EU-AF-NA triple junction and a second small one over the boundary between the AU and Sunda (SU) plates. Figure 7f depicts four high positive dVTEC areas located over the already known AU-PA-AN junction, which is rich in minor tectonic plates. This dVTEC maximum has a shape following tectonic plate boundaries, and it is extremely strong in its southern part, although the Kp index is very low.
Figure 8a presents two negative dVTEC extrema: At the AU-PA complex boundary and over the NA-CA-CO triple junction. Some other small dVTEC extrema over different tectonic plate boundaries are also noticeable (e.g., AF-SA). Figure 8b presents dVTEC disturbed over significant parts of the globe. However, the highest amplitudes of variations are quite precisely located over the NA-PA, EU-AF-NA, AN-PA, AU-PA, and OK-PA tectonic plate junctions. The dVTEC is also significantly increased over the AU plate, and we will refer to this issue further in the discussion. Figure 8c presents a dVTEC maximum over the Arabia (AR), Somalia (SM), and AF triple junction and depletion over the PA-NZ-AN junction. Figure 8d shows an extended positive dVTEC anomaly along the EU-AF-NA-CA-PA junctions and second over the SC plate. The third and strongest dVTEC maximum is located over the AU-AN boundary, and it is also present almost two weeks later in Figure 8e. Figure 8e also includes a high positive dVTEC over the EU-AF-PA triple junction, a continuation of the abovementioned AU-AN dVTEC anomaly along the AN tectonic plate edge to the west and east, the anomaly of geomagnetic–solar origin over Canada, and a dVTEC maximum over a Hawaii hot spot, noticeable also in Figure 7a. Figure 8f is taken 12 h after Figure 8e, so it presents the evolution of the same anomalies. In summary, in Figure 7 and Figure 8, we demonstrated several dVTEC anomalies having the shape of tectonic plate boundaries, which occurred with almost no close earthquakes within a ±2 h interval. Additionally, there are anomalies of different type: a geomagnetically driven anomaly over Canada, a positive dVTEC over Hawaii, and less frequent dVTEC extrema of smaller amplitudes over continental parts of tectonic plates (e.g., AU, SA). The largest in amplitude and the most frequent dVTEC anomalies occur over tectonic plate boundaries, but we will also refer to the other anomalies in the further discussion.

4. Discussion: Statistical Assessment of the Most Frequent Geographical Location of VTEC Enhancements and Links with Existing Studies of Other Kinds

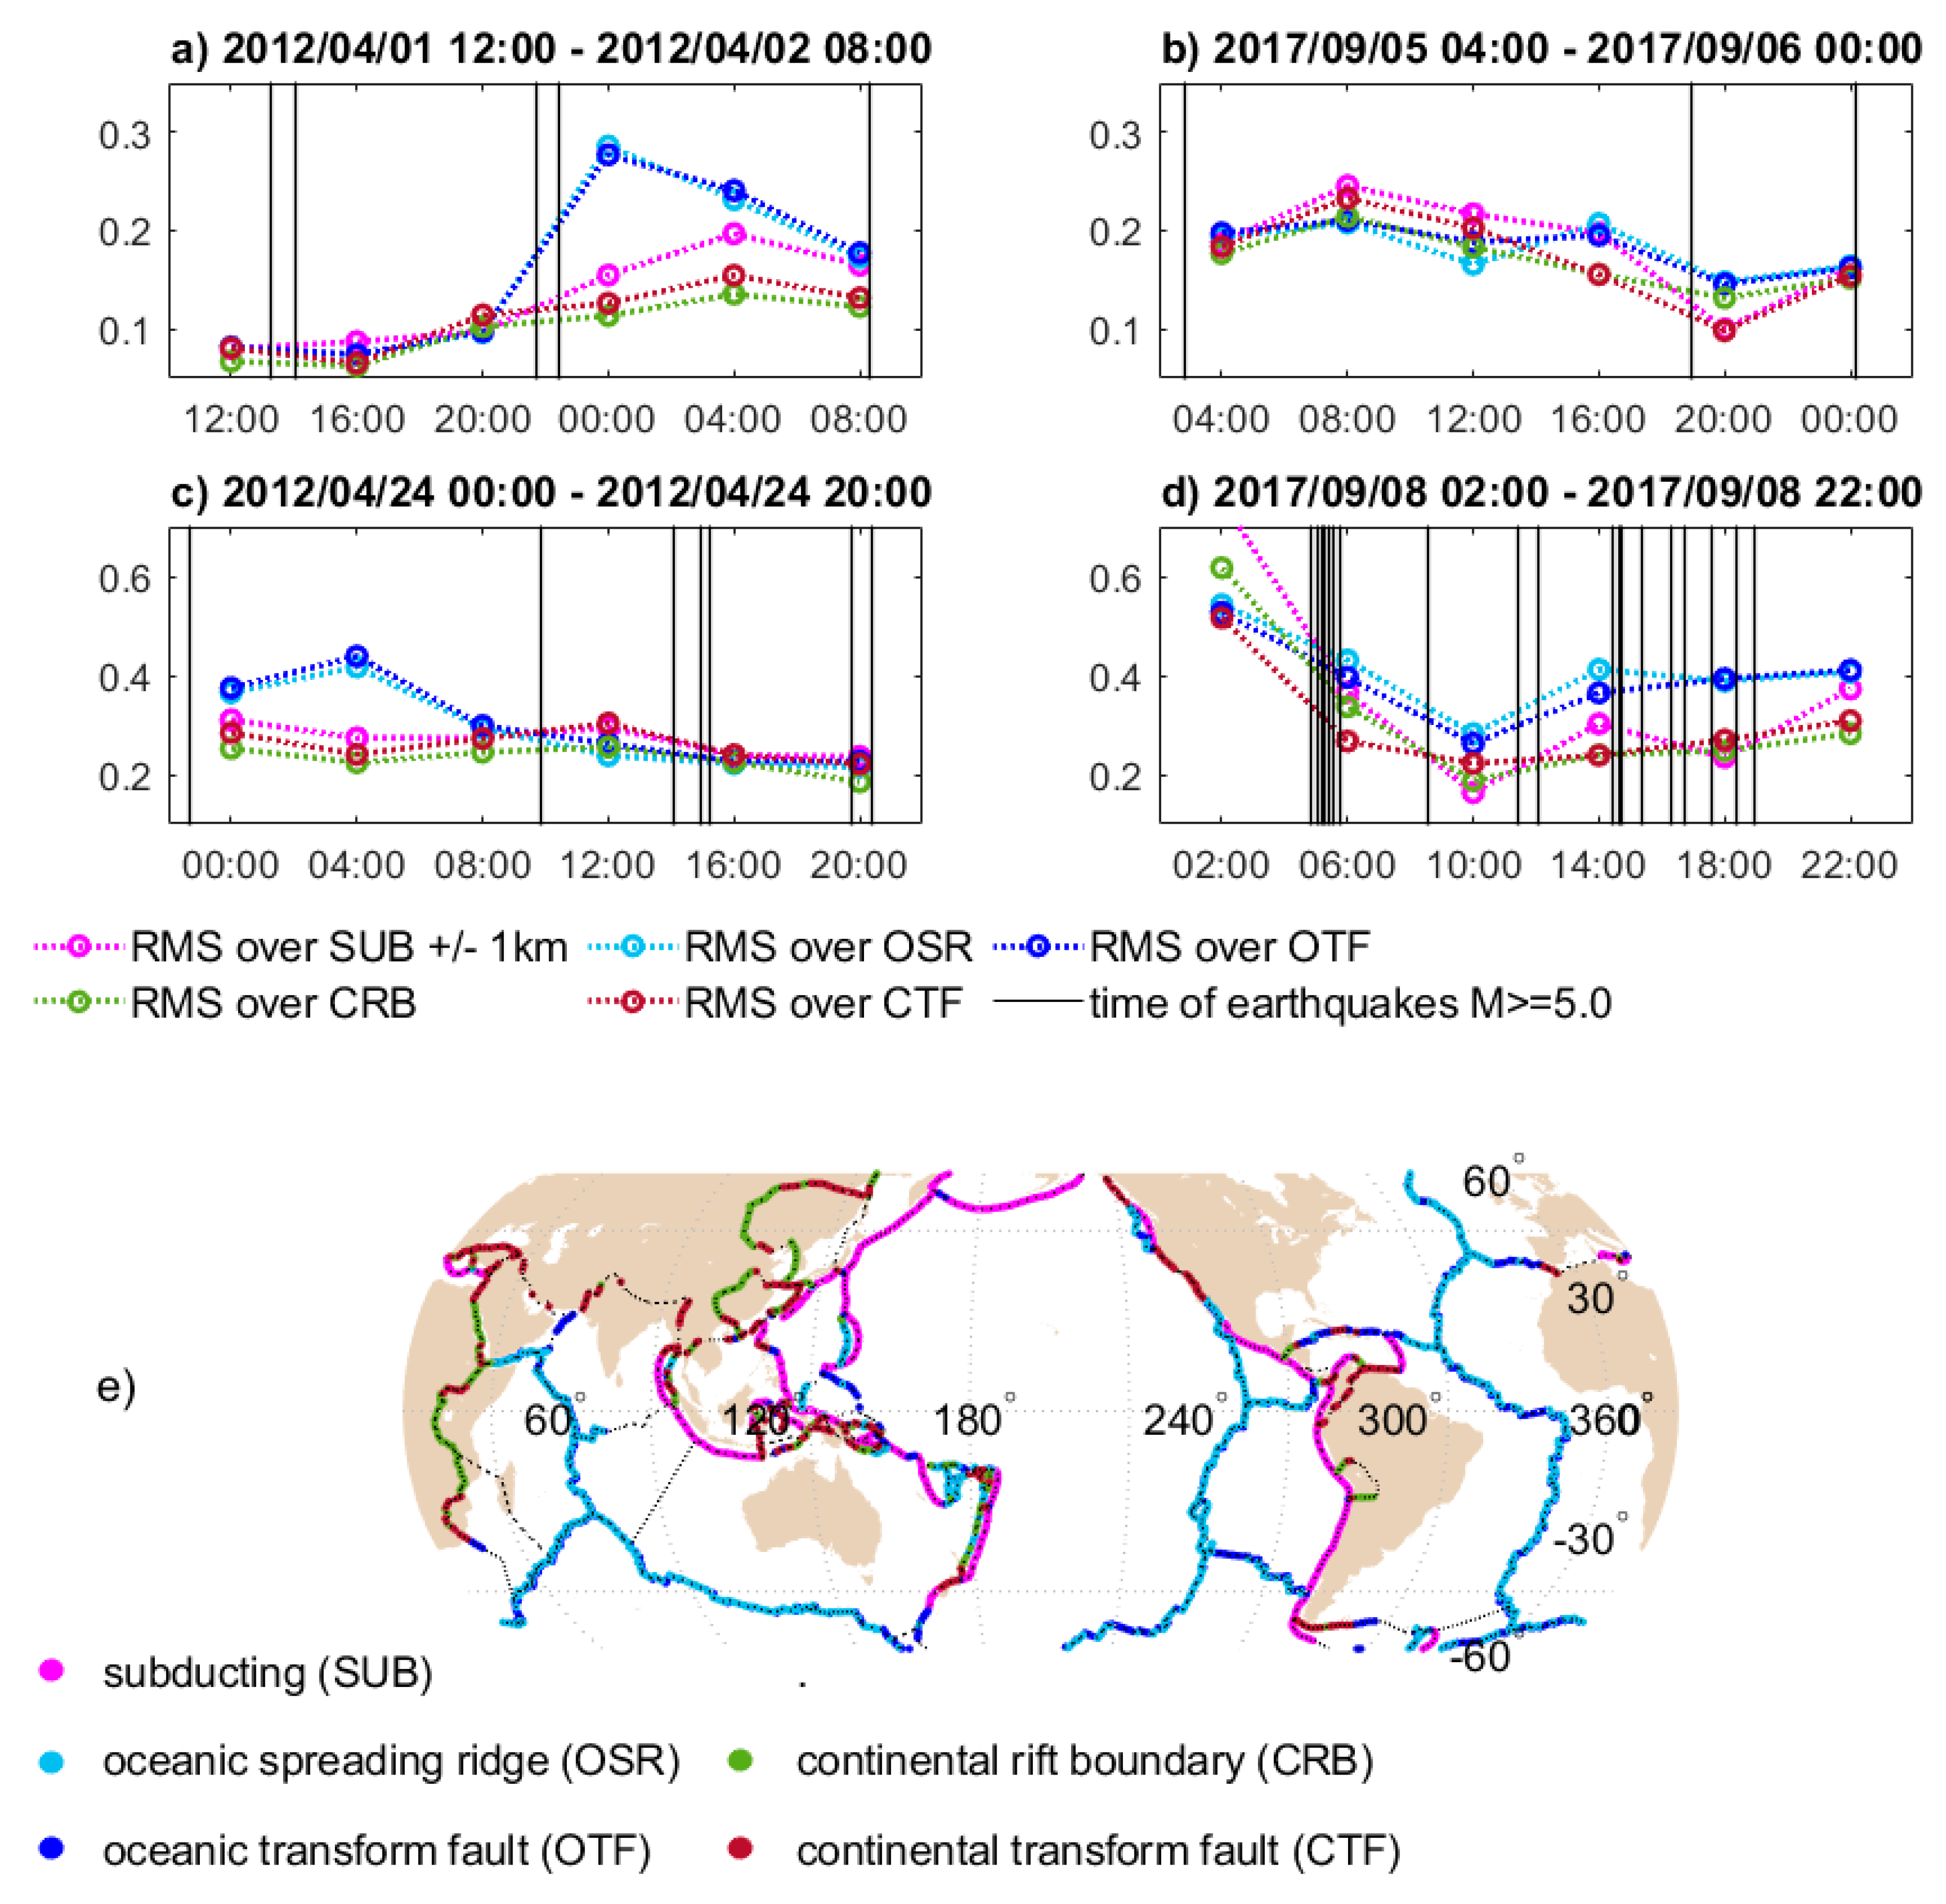
Staying focused on the main objective of this study, which is the spatial correlation of Earth-fixed dVTEC extrema with tectonic plate boundaries, we can summarize the observations using a statistical measure. We have defined selected tectonic plate junctions as places of frequent dVTEC extrema occurrence. The moderate dVTEC ≥ 0.3 in Figure 3, Figure 4, Figure 5, Figure 6, Figure 7 and Figure 8 can be sometimes found also in the middle of selected tectonic plates, but the highest values of dVTEC always occupy areas just over the tectonic boundaries. Thus, we decided to select, as a statistical measure, the RMS from these map pixels, which are the closest to selected types of tectonic boundaries in Figure 3, Figure 4, Figure 5 and Figure 6. We skip, this time, the results from Figure 7 and Figure 8, as there is significant selectiveness and no continuity over the time to show. Before the RMS calculation, we selected the nodes of dVTEC maps, which are within 1° margin from five types of tectonic boundaries [68], which are the most frequent in terms of their length with respect to all tectonic plate boundaries (Figure 9e). We calculated the distances from the dVTEC map nodes to the subducting boundaries (SUBs), oceanic spreading ridges (OSRs), oceanic transform faults (OTFs), continental rift boundaries (CRBs), and continental transform faults (CTFs) and selected the closest ones where the spherical distance is smaller than 1°. In fact, dVTEC anomalies are often extended far away from tectonic plate junctions. However, we observed that dVTEC maxima predominantly occupy tectonic plate junctions, and some selected places are visited more often than the others by the high anomalies. We excluded convergent plate boundaries due to their short sections and nested geographical locations overlaying with the five abovementioned boundary types. The extended dVTEC anomalies over short, nested boundaries would provide an overestimated RMS. Additionally, being aware of strong geomagnetic impact in the polar region, we excluded high latitudes over 60°. The exclusion of polar regions was also justified by the fact that there are almost no tectonic plate boundaries over 60° latitude. The RMS has been calculated from the closest grid nodes to selected boundary types, from all time epochs of Figure 3, Figure 4, Figure 5 and Figure 6, and shown continuously in Figure 9a–d. The highest number of extreme RMS of dVTEC in Figure 9a–d belongs to blue (OTF) and light blue (OSR) plots. The RMS over oceanic spreading ridges and oceanic transform faults is the largest just at the time of generally large dVTEC increases, i.e., Figure 3d–f and RMS in Figure 9a, Figure 5a–c and RMS in Figure 9c, but also Figure 6b–f and RMS in Figure 9d. There are only two exceptions, but both are self-explainable. Figure 9b presents RMS over OTF and OSR boundaries comparable to that over the other tectonic boundaries, but Figure 4 presents a moderate number of rather low dVTEC anomalies, with the most pronounced one above the AU-PA boundary, where SUBs are surrounded by diverging boundaries like OSRs. The second exception is the highest RMS over SUBs at 2:00 AM in Figure 9d, corresponding to dVTEC map in Figure 6a. This is the case for a high Kp and extensive dVETC anomalies generated by the strong geomagnetic storm, which contribute much to the entire state of the ionosphere. However, it must be noted that this state quickly became calmer, and dVTEC is again the highest over the OSR and OTF boundaries (Figure 6b–f and Figure 9d).
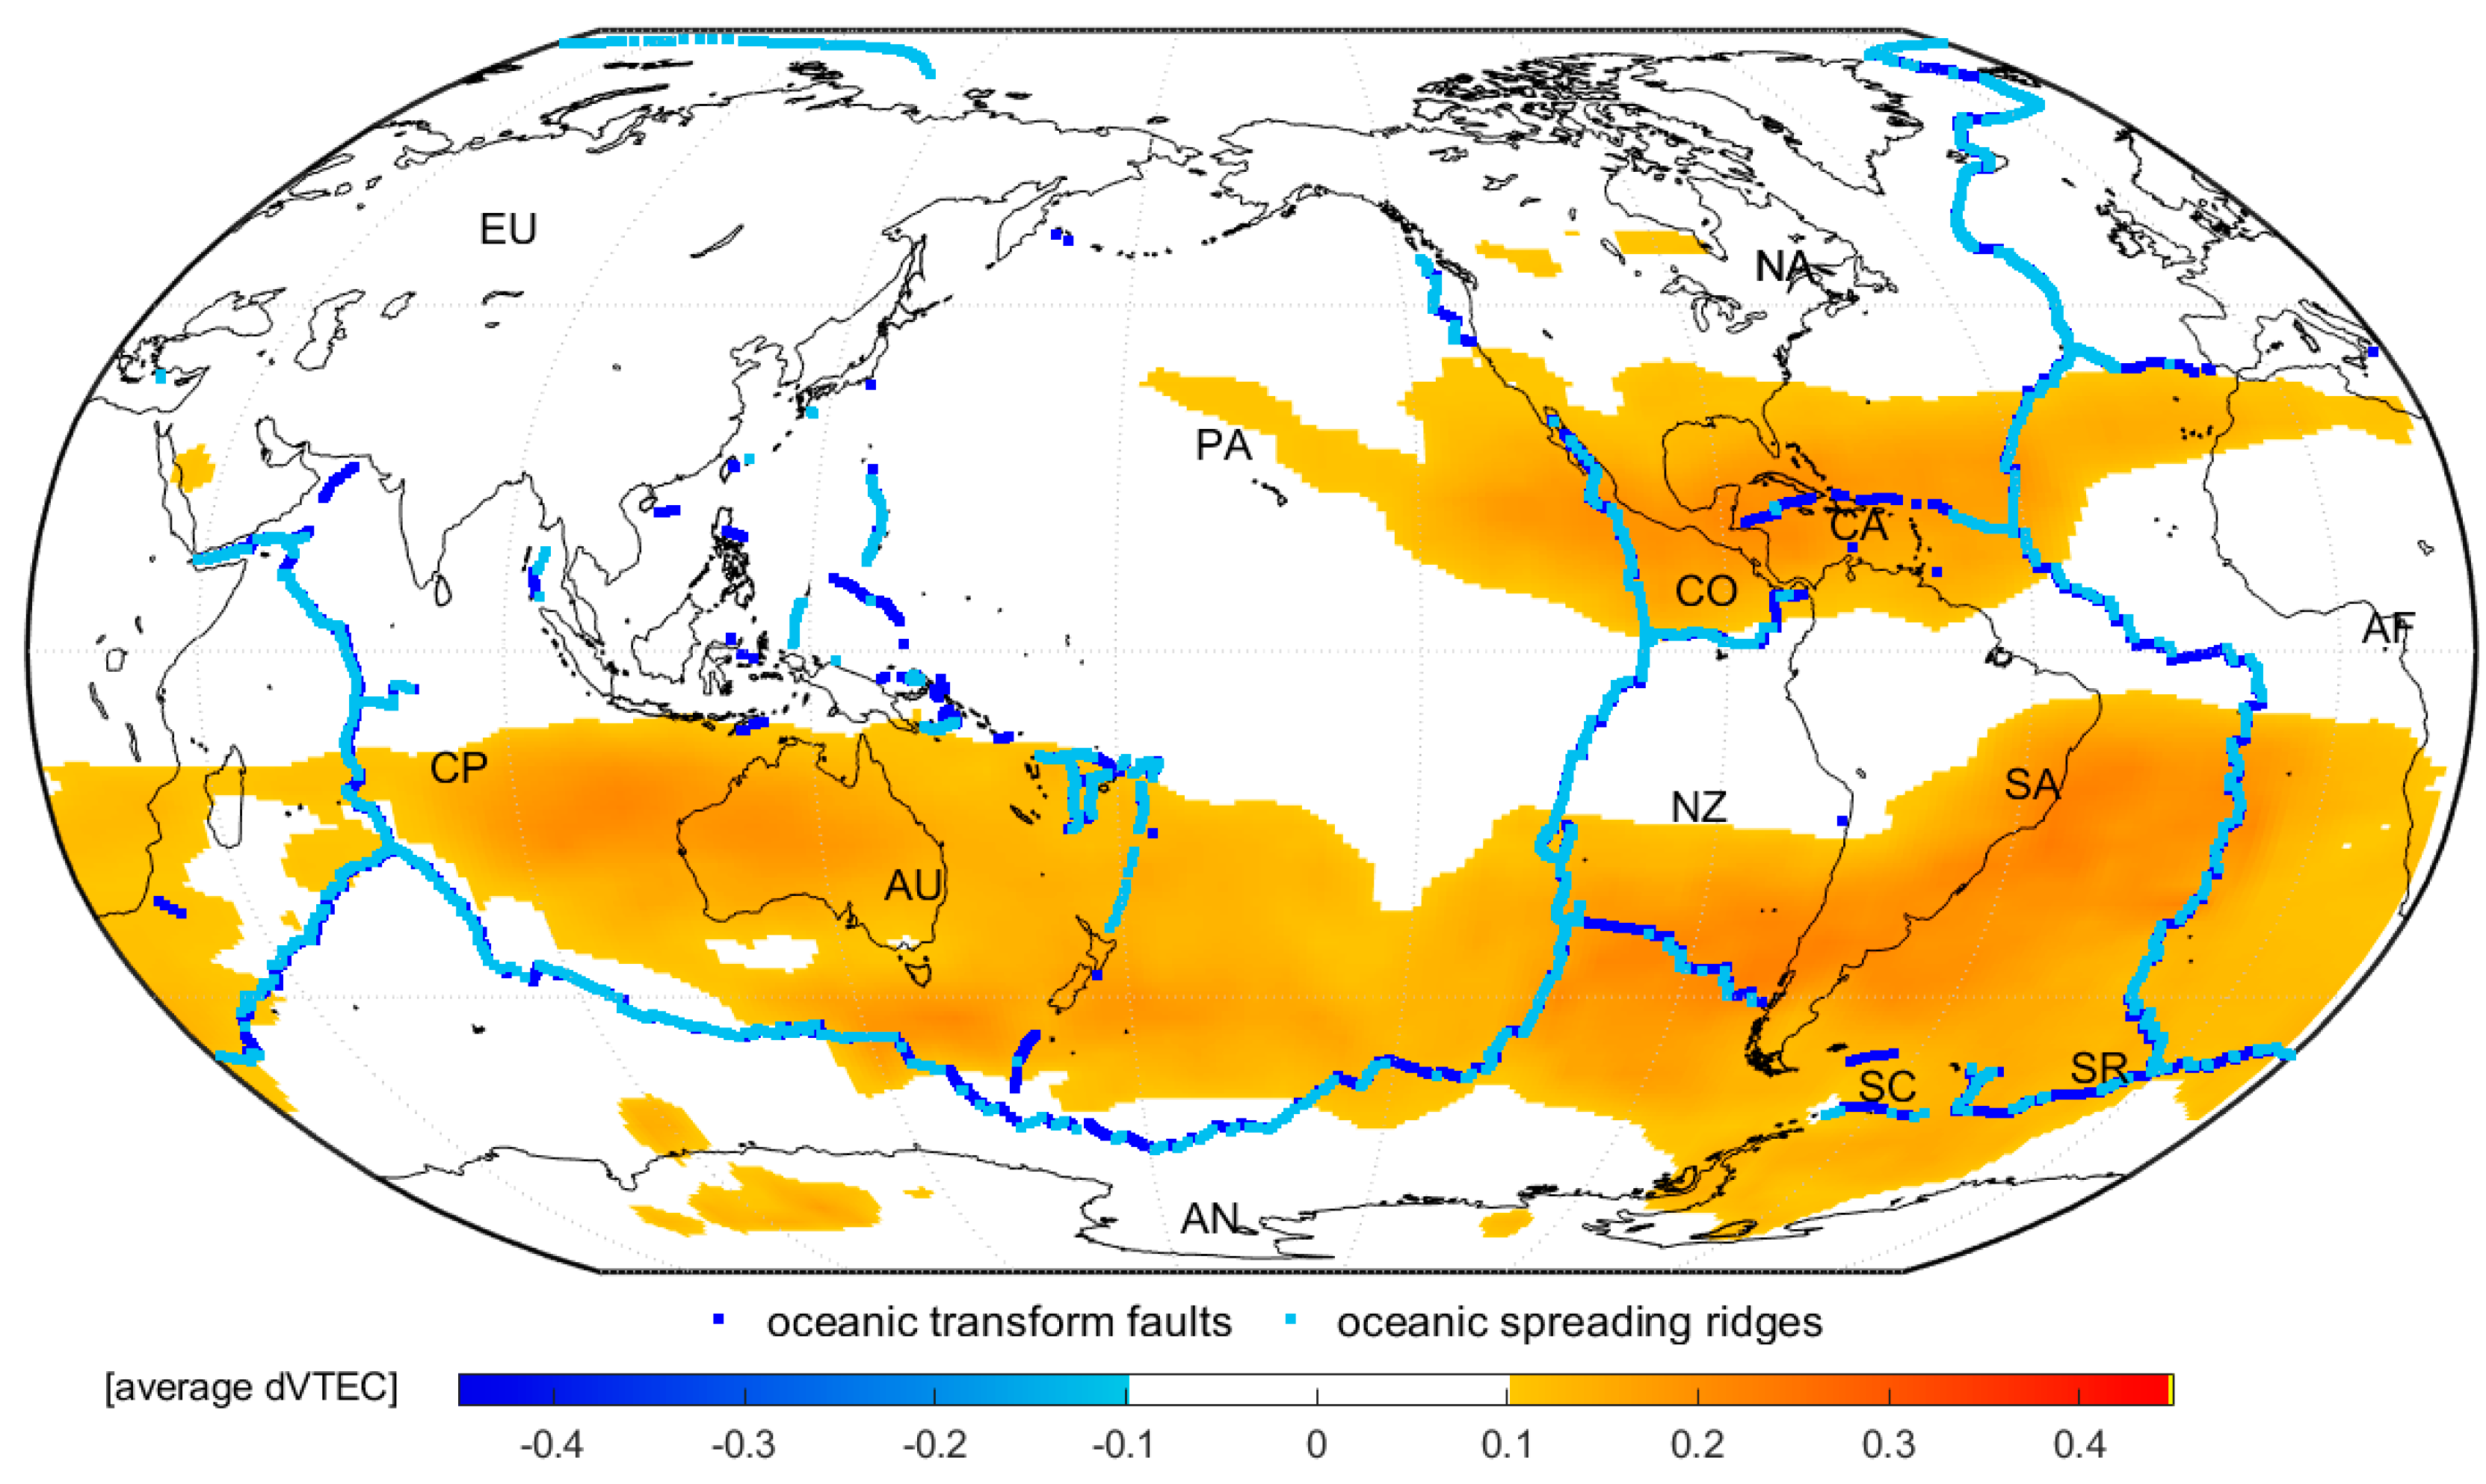
In order to strengthen and even extend the conclusions from the previous paragraph, another statistical measure has been calculated, based on averaging of dVTEC from Figure 3, Figure 4, Figure 5, Figure 6, Figure 7 and Figure 8. We include the data from Figure 7 and Figure 8 now, as we do not need temporal continuation this time, but instead, we want to extend the data sample. The averaging of dVTEC highlights the location of their most frequent occurrence. Figure 10 presents an average of all dVTEC grids from Figure 3, Figure 4, Figure 5, Figure 6, Figure 7 and Figure 8, where the coloured part highlights the anomalies over the empirically selected threshold ±0.1 TECU. The OSR and OTF boundaries are roughly underlined with light blue and blue lines to highlight the previously observed specific dVTEC property. The geographical location of the statistical occurrence of the highest dVTEC is geographically apparently related with geomagnetic field lines and OSR/OTF tectonic plate boundaries, which confirms findings from Figure 9. Figure 10, by the use of the dVTEC average, indicates those tectonic plate boundaries, which are most frequently visited in Figure 3, Figure 4, Figure 5, Figure 6, Figure 7 and Figure 8 by the highest dVTEC. These boundaries/junctions are roughly SA-AF (OTF-OSR), SC-SA (OTF-CTF), AN-NZ-PA (OTF-OSR), NA-CA (OTF-OSR-CTF), CO-PA (OTF-OSR), AU-PA (all 5 types), AU-AN (OTF-OSR), AU-CP (OTF-OSR), and EU-AF-NA (OTF-OSR). This list is preliminary and general and can also be incomplete, due to the initial character of this finding. However, this list roughly indicates tectonic plate boundaries affected by the strongest dVTEC, and it is worth noticing that the majority of these boundaries are oceanic spreading ridges (OSRs) or oceanic transforming faults (OTFs). The subducting plate boundaries, at first look, seem to play a minor role in the locations of the highest dVTEC values.
The observations in Figure 10 also confirm some minor additional frequent locations of a large dVTEC, which were already observed and slightly discussed in Section 3.3. Figure 10 weakly exhibits the footprint of the so-called MSNA observed in Figure 7a–c, elongated higher dVTEC signature near Hawaii islands, and high dVTEC values over two plate interiors, namely the AU plate and SA plate. It should be pointed out that the Hawaii hot spot is strongly suspected as taking part in the generation of VTEC anomalies (Figure 7a,b and Figure 8e). Regarding the anomaly called MSNA by Sun [40], based on the high latitudes of its occurrence and considerations by Shinbori et al. [29], we can draw the conclusion of its solar–geomagnetic origin. Even if detailed processes of its creation are under consideration by the researchers, a rough conclusion on its extraterrestrial origin and probable relation with the direction of geomagnetic field lines is sufficient for the purpose of the actual study.
The occurrence of high dVTEC values over diverging or transforming tectonic plate boundaries, but also their frequent presence over the AU and SA plates and the Hawaii archipelago, prompted us to approximately look at global conductivity patterns of the Earth’s subsurface structure. A global study by Alekseev et al. [70] describes the conductivity model slices at different depths. The rough assessment of conductivity patterns given in [70] indicates diverging and transforming oceanic tectonic boundaries as places of a higher conductivity at the selected depths, in comparison to the remaining ocean areas (Figures 6 and 7 in [70]). At the increased depths, the conductivity of OSR/OTF boundaries can be larger in comparison to the surrounding oceans. Its increase is linked with rock-melting processes, higher temperature, and the presence of specific chemical compounds in the oceanic ridges [71,72]. The Australian continent is also characterized by a higher conductivity at selected depths with respect to the other lands. Additionally, selected figures from Alekseev et al. [70] also indicate more conductive regions near South America. In another interesting study, Ouzounov and Khachikyan [73] indicated magnetically conjugated sites in the northern and southern hemisphere connected by geomagnetic field lines in their Figure 8. These places in the southern hemisphere are situated almost entirely along the AN plate boundary. Additionally, Ouzounov and Khachikyan [73] showed that the AN-NZ tectonic boundary is conjugated with the CA-NA boundary. The other places indicated as characteristic in the northern hemisphere by Ouzounov and Khachikyan [73] in their Figure 8 are also characteristic in comparison to our study, as they are co-located with repeatedly occurring high dVTEC patterns, e.g., in our Figure 6a or Figure 8e. The footprints of geomagnetic lines presented in [73] are in accordance with the shape of high dVTEC patterns after geomagnetic storms in this study (Figure 6a and Figure 8e,f), which suggests a solar–geomagnetic origin of some part of dVTEC patterns. However, the most frequent places of dVTEC are located in Figure 10, roughly over the places of higher conductivity indicated in [70]. Moreover, the fields of the strongest average dVTEC in Figure 10 are pinned to several permanent places at highly conductive diverging plate boundaries. All this makes the link of the highest dVTEC values with tectonic processes more probable. The remaining question is if we see two coupled processes in Figure 3, Figure 4, Figure 5, Figure 6, Figure 7 and Figure 8 or two separate processes driven by external and internal (lithospheric) sources, respectively.

5. Conclusions

The UQRG, having an advantage based on Kriging, ensured a very good determination of dVTEC anomaly shapes. The normalization of differences proved to be particularly useful here, which largely eliminated the effect of EIA in the results. The highest normalized dVTEC values are mostly spatially connected with diverging and transforming oceanic boundaries in terms of location, size, and shape. These OTF and OSR plate boundaries are described as relatively more conductive places over the oceans by Alekseev et al. [70]. The dVTEC and its changes in all these places are, in many cases, amplified by the high Kp-index, but the travelling disturbances disappear when Kp becomes lower, whereas extreme dVTEC values remain tied to tectonic plate boundaries. The OSR and OTF boundaries visited by the highest dVTEC values are located predominantly along the conjugated places of geomagnetic line footprints shown by Ouzounov and Khachikyan [73]. The high dVTEC values located over tectonic plate junctions are the largest in most of the cases during high Kp index occurrence. The amplification of dVTEC values located over the tectonic plate junctions during geomagnetic storms raises a question about the existence of a link between the geomagnetic storms and these anomalies. If there are two separate components of VTEC anomalies, one must be generated from the lithosphere, as the shapes of TEC anomalies follow the plate boundaries. Otherwise, the amplified anomalies could suggest a coupling between geomagnetic field modifications and seismicity studied by many researchers [73,74,75]. The observed shapes and frequent locations of high dVTEC maintain both options possible, and we cannot solve this issue from the VTEC alone, because it is an integral over the ionosphere. Therefore, the implementation of other ancillary data [76] and GIMs from longer time spans can be necessary to discuss a potential link between the diverging tectonic plate junctions and external energy transported to the lithosphere along the geomagnetic field lines. On the other hand, in the case of the two phenomena simultaneously appearing, the analysis over a time unit performed without spatial analysis or reversely can be unsatisfactory.
The link between high geomagnetic activity and earthquake probability is under consideration by many researchers [15,16,27]. This study does not contradict the aforementioned relationship but also reveals that without large earthquakes or high geomagnetic indices, we can also find dVTEC extrema located over tectonic plate boundaries or triple junctions. This observation links more the TEC anomalies with a general continuous seismic activity. In summary, the several-hour persistence of the dVTEC extrema over tectonic plate boundaries and their shapes similar to these boundaries suggest their relationship to the processes typical of tectonic structures, i.e., radon emanation, increased conductivity at tectonic plate junctions, and the electric field transfer in general. The sizes of dVTEC anomalies are also in favour of the EFM and EM channels of the seismic LAIC model, but further investigation with the inclusion of other observations from selected areas is necessary. Regardless of the LAIC channel generating high dVTEC values, the indicated diverging plate junctions are suspected to play a significant role in the lithosphere–ionosphere energy transfer.

Author Contributions

P.W.: conceptualization, supervision, funding acquisition, and writing—review and editing. W.J.: investigation, software, methodology and writing—original draft, visualization. S.M.: methodology, investigation, writing—review and editing. B.M.: resources, writing—review and editing, formal analysis. A.K.-G.: resources, writing—review and editing, project administration. All authors have read and agreed to the published version of the manuscript.

Funding

The research was supported by the National Science Centre (NCN) of Poland in the frame of Research Grant no. 2021/41/B/ST10/03954.

Data Availability Statement

The authors wish to thank the UPC IonSAT for UQRG GIMs available at https://cddis.nasa.gov/archive/gnss/products/ionosphere/ (accessed on 1 January 2022). The earthquake series are downloaded from the service of United States Geological Survey available at: https://earthquake.usgs.gov/earthquakes/search/ (accessed on 1 January 2022). Dst indices are downloaded from the Data Analysis Center for Geomagnetism and Space Magnetism, Graduate School of Science, Kyoto available at: http://wdc.kugi.kyoto-u.ac.jp/dstdir/ (accessed on 1 January 2022). Kp indices are obtained from the service of NOAA Space Weather Prediction Center in Boulder available at: https://www.swpc.noaa.gov/products/planetary-k-index (accessed on 1 January 2022). Tectonic plate boundaries are downloaded from data webpage: https://github.com/lcx366/PlateTectonic (accessed on 1 January 2022).

Acknowledgments

The authors wish to thank the UPC IonSAT for UQRG GIMs. The authors wish to thank the four anonymous reviewers for their very constructive comments.

Conflicts of Interest

The authors declare no conflict of interest.

Abbreviations

AGWacoustic gravity wave
CODECentre for Orbit Determination in Europe
CRBcontinental rift boundary
CTFcontinental transform fault
EFMelectric field modification
EIAequatorial ionization anomaly
EMelectromagnetic
GIMglobal ionospheric map
GNSSglobal navigation satellite system
LAIClithosphere–atmosphere–ionosphere coupling
MSNAMidlatitude Summer Nighttime Anomaly
OSRoceanic spreading ridge
OTFoceanic transform fault
STECslant total electron content
SUBsubducting boundary
TECtotal electron content
UQRGUPC-IonSAT quarter-of-an-hour time resolution rapid global ionospheric map
UPCPolytechnic University of Catalonia
UTCuniversal time coordinated
VTECvertical total electron content
Abbreviations of tectonic plates
AFAfrican (tectonic plate)
ANAntarctic
ARArabic
AUAustralian
CACaribbean
COCoco
CPCapricorn
EUEurasian
INIndian
NANorth American
NZNazca
OKOkhotsk
PAPacific
SASouth American
SCScotia
SMSomalian
SUSunda

References

  1. Mannucci, A.; Wilson, B.; Yuan, D.; Ho, C.; Lindqwister, U.; Runge, T. A global mapping technique for GPS-derived ionospheric total electron content measurements. Radio Sci. 1998, 33, 565–582. [Google Scholar] [CrossRef]
  2. Pulinets, S.; Boyarchuk, K. Ionospheric Precursors of Earthquakes; Springer: Berlin/Heidelberg, Germany, 2005; 315p. [Google Scholar] [CrossRef]
  3. Bychkov, V.; Golubkov, G.; Nikitin, A. The Atmosphere and Ionosphere; Springer Science+Business Media B.V.: Dordrecht, The Netherlands, 2013; 288p. [Google Scholar] [CrossRef]
  4. Jin, S.; Jin, R.; Liu, X. GNSS Atmospheric Seismology: Theory, Observations and Modeling; Springer: Singapore, 2019; 315p. [Google Scholar] [CrossRef]
  5. Hayakawa, M.; Izutsu, J.; Schekotov, A.; Yang, S.-S.; Solovieva, M.; Budilova, E. Lithosphere–Atmosphere–Ionosphere Coupling Effects Based on Multiparameter Precursor Observations for February–March 2021 Earthquakes (M~7) in the Offshore of Tohoku Area of Japan. Geosciences 2021, 11, 481. [Google Scholar] [CrossRef]
  6. Urias, C.L.; Vazquez-Becerra, G.E.; Nayak, K.; López-Montes, R. Analysis of Ionospheric Disturbances during X-Class Solar Flares (2021–2022) Using GNSS Data and Wavelet Analysis. Remote Sens. 2023, 15, 4626. [Google Scholar] [CrossRef]
  7. Tariq, M.A.; Shah, M.; Hernández-Pajares, M.; Iqbal, T. Pre-earthquake ionospheric anomalies before three major earthquakes by GPS-TEC and GIM-TEC data during 2015–2017. Adv. Space Res. 2019, 63, 2088–2099. [Google Scholar] [CrossRef]
  8. Ghimire, B.D.; Chapagain, N.P. Ionospheric Anomalies Due to Nepal Earthquake-2015 as Observed from GPS-TEC Data. Geomagn. Aeron. 2022, 62, 460–473. [Google Scholar] [CrossRef]
  9. Nayak, K.; Romero-Andrade, R.; Sharma, G.; Zavala, J.L.C.; Urias, C.L.; Soto, M.E.T.; Aggarwal, S.P. A combined approach using b-value and ionospheric GPS-TEC for large earthquake precursor detection: A case study for the Colima earthquake of 7.7 Mw, Mexico. Acta Geod. Geophys. 2023, 58, 515–538. [Google Scholar] [CrossRef]
  10. Sharma, G.; Nayak, K.; Romero-Andrade, R.; Mohammed Aslam, M.A.; Sarma, K.K.; Aggarwal, S.P. Low Ionosphere Density Above the Earthquake Epicentre Region of Mw 7.2, El Mayor–Cucapah Earthquake Evident from Dense CORS Data. J. Indian. Soc. Remote Sens. 2024, 52, 543–555. [Google Scholar] [CrossRef]
  11. Occhipinti, G.; Rolland, L.; Lognonné, P.; Watada, S. From Sumatra 2004 to Tohoku-Oki 2011: The systematic GPS detection of the ionospheric signature induced by tsunamigenic earthquakes. J. Geophys. Res. Space Phys. 2013, 118, 3626–3636. [Google Scholar] [CrossRef]
  12. Chou, M.-Y.; Cherniak, I.; Lin, C.C.H.; Pedatella, N.M. The persistent ionospheric responses over Japan after the impact of the 2011 Tohoku earthquake. Space Weather 2020, 18, e2019SW002302. [Google Scholar] [CrossRef]
  13. Jin, S.G.; Jin, R.; Li, J.H. Pattern and evolution of seismo-ionospheric disturbances following the 2011 Tohoku earthquakes from GPS observations. J. Geophys. Res. Space Phys. 2014, 119, 7914–7927. [Google Scholar] [CrossRef]
  14. Jarmołowski, W.; Belehaki, A.; Hernández Pajares, M.; Schmidt, M.; Goss, A.; Wielgosz, P.; Yang, H.; Krypiak-Gregorczyk, A.; Tsagouri, I.; Paouris, E.; et al. Combining Swarm Langmuir probe observations, LEO-POD-based and ground-based GNSS receivers and ionosondes for prompt detection of ionospheric earthquake and tsunami signatures: Case study of 2015 Chile-Illapel event. J. Space Weather Space Clim. 2021, 11, 58. [Google Scholar] [CrossRef]
  15. Urata, N.; Duma, G.; Freund, F. Geomagnetic Kp Index and Earthquakes. Open J. Earthq. Res. 2018, 7, 39–52. [Google Scholar] [CrossRef]
  16. Enomoto, Y.; Heki, K.; Yamabe, T.; Sugiura, S.; Kondo, H. A Possible Causal Mechanism of Geomagnetic Variations as Observed Immediately before and after the 2011 Tohoku-Oki Earthquake. Open J. Earthq. Res. 2020, 9, 33–49. [Google Scholar] [CrossRef]
  17. Chakraborty, M.; Kumar, S.; De, B.K.; Guha, A. Effects of geomagnetic storm on low latitude ionospheric total electron content: A case study from Indian sector. J. Earth Syst. Sci. 2015, 124, 1115–1126. [Google Scholar] [CrossRef]
  18. Arikan, F.; Yarici, A. Spectral investigation of traveling ionospheric disturbances: IONOLAB-FFT. Geod. Geodyn. 2017, 8, 297–304. [Google Scholar] [CrossRef]
  19. Choi, B.K.; Lee, S.J.; Park, J.U. Monitoring the ionospheric total electron content variations over the Korean Peninsula using a GPS network during geomagnetic storms. Earth Planets Space 2011, 63, 469–476. [Google Scholar] [CrossRef]
  20. Shim, J.S.; Tsagouri, I.; Goncharenko, L.; Rastaetter, L.; Kuznetsova, M.; Bilitza, D.; Codrescu, M.; Coster, A.J.; Solomon, S.C.; Fedrizzi, M.; et al. Validation of ionospheric specifications during geomagnetic storms: TEC and foF2 during the 2013 March storm event. Space Weather 2018, 16, 1686–1701. [Google Scholar] [CrossRef]
  21. Heki, K. Ionospheric electron enhancement preceding the 2011 Tohoku-Oki earthquake. Geophys. Res. Lett. 2011, 38, L17312. [Google Scholar] [CrossRef]
  22. Heki, K.; Enomoto, Y. Preseismic ionospheric electron enhancements revisited. J. Geophys. Res. Space Phys. 2013, 118, 6618–6626. [Google Scholar] [CrossRef]
  23. Kamogawa, M.; Kakinami, Y. Is an ionospheric electron enhancement preceding the 2011 Tohoku-Oki earthquake a precursor? J. Geophys. Res. Space Phys. 2013, 118, 1751–1754. [Google Scholar] [CrossRef]
  24. Ikuta, R.; Hisada, T.; Karakama, G.; Kuwano, O. Stochastic evaluation of pre-earthquake TEC enhancements. J. Geophys. Res. Space Phys. 2020, 125, e2020JA027899. [Google Scholar] [CrossRef]
  25. Nayak, K.; Romero-Andrade, R.; Sharma, G.; López-Urías, C.; Trejo-Soto, M.E.; Vidal-Vega, A.I. Evaluating Ionospheric Total Electron Content (TEC) Variations as Precursors to Seismic Activity: Insights from the 2024 Noto Peninsula and Nichinan Earthquakes of Japan. Atmosphere 2024, 15, 1492. [Google Scholar] [CrossRef]
  26. He, L.; Heki, K. Threedimensional distribution of ionospheric anomalies prior to three large earthquakes in Chile. Geophys. Res. Lett. 2016, 43, 7287–7293. [Google Scholar] [CrossRef]
  27. Oikonomou, C.; Haralambous, H.; Pulinets, S.; Khadka, A.; Paudel, S.R.; Barta, V.; Muslim, B.; Kourtidis, K.; Karagioras, A.; Inyurt, S. Investigation of Pre-Earthquake Ionospheric and Atmospheric Disturbances for Three Large Earthquakes in Mexico. Geosciences 2021, 11, 16. [Google Scholar] [CrossRef]
  28. Sotomayor-Beltran, C.; Andrade-Arenas, L. Emergence of a localized total electron content enhancement during the severe geomagnetic storm of 8 September 2017. Ann. Geophys. 2019, 37, 153–161. [Google Scholar] [CrossRef]
  29. Shinbori, A.; Otsuka, Y.; Sori, T.; Tsugawa, T.; Nishioka, M. Temporal and spatial variations of total electron content enhancements during a geomagnetic storm on 27 and 28 September 2017. J. Geophys. Res. Space Phys. 2020, 125, e2019JA026873. [Google Scholar] [CrossRef]
  30. Ma, L.H.; Han, Y.B.; Yin, Z.Q. Periodicities in Global Mean TEC from GNSS Observations. Earth Moon Planets 2009, 105, 3–10. [Google Scholar] [CrossRef]
  31. Guo, J.; Li, W.; Liu, X.; Kong, Q.; Zhao, C.; Guo, B. Temporal-Spatial Variation of Global GPS-Derived Total Electron Content, 1999–2013. PLoS ONE 2015, 10, e0133378. [Google Scholar] [CrossRef]
  32. Moses, M.; Panda, S.K.; Dodo, J.D.; Ojigi, L.M.; Lawal, K. Assessment of long-term impact of solar activity on the ionosphere over an African equatorial GNSS station. Earth Sci. Inform. 2022, 15, 2109–2117. [Google Scholar] [CrossRef]
  33. Feng, J.; Zhang, Y.; Li, W.; Han, B.; Zhao, Z.; Zhang, T.; Huang, R. Analysis of ionospheric TEC response to solar and geomagnetic activities at different solar activity stages. Adv. Space Res. 2023, 71, 2225–2239. [Google Scholar] [CrossRef]
  34. Şentürk, E.; Inyurt, S.; Sertçelik, I. Ionospheric anomalies associated with the Mw 7.3 Iran–Iraq border earthquake and a moderate magnetic storm. Ann. Geophys. 2020, 38, 1031–1043. [Google Scholar] [CrossRef]
  35. Dettmering, D.; Limberger, M.; Schmidt, M. Using DORIS measurements for modeling the vertical total electron content of the Earth’s ionosphere. J. Geod. 2014, 88, 1131–1143. [Google Scholar] [CrossRef]
  36. Sotomayor-Beltran, C. Localized Increment and Decrement in the Total Electron Content of the Ionosphere as a Response to the April 20, 2018, Geomagnetic Storm. Int. J. Geophys. 2018, 2018, 1986306. [Google Scholar] [CrossRef]
  37. Gulyaeva, T.; Arikan, F. Statistical discrimination of global post-seismic ionosphere effects under geomagnetic quiet and storm conditions. Geomat. Nat. Hazards Risk 2017, 8, 509–524. [Google Scholar] [CrossRef]
  38. Orùs, R.; Hernández-Pajares, M.; Juan, J.M.; Sanz, J. Improvement of global ionospheric VTEC maps by using kriging interpolation technique. J. Atmos. Sol. Terr. Phys. 2005, 67, 1598–1609. [Google Scholar] [CrossRef]
  39. Orùs, R.; Cander, L.R.; Hernández-Pajares, M. Testing regional vertical electron content maps over Europe during 17–21 January 2005 sudden weather event. Radio Sci. 2007, 42, RS3004. [Google Scholar] [CrossRef]
  40. Sun, Y.Y. GNSS brings us back on the ground from ionosphere. Geosci. Lett. 2019, 6, 14. [Google Scholar] [CrossRef]
  41. Liu, J.Y.; Chen, Y.I.; Chen, C.H.; Liu, C.Y.; Chen, C.Y.; Nishihashi, M.; Li, J.Z.; Xia, Y.Q.; Oyama, K.I.; Hattori, K.; et al. Seismoionospheric GPS total electron content anomalies observed before the 12 May 2008 Mw7.9 Wenchuan earthquake. J. Geophys. Res. 2009, 114, A04320. [Google Scholar] [CrossRef]
  42. Pulinets, S.; Davidenko, D. Ionospheric precursors of earthquakes and Global Electric Circuit. Adv. Space Res. 2014, 53, 709–723. [Google Scholar] [CrossRef]
  43. Akhoondzadeh, M. Investigation of the LAIC mechanism of the Haiti earthquake (August 14, 2021) using CSES-01 satellite observations and other earthquake precursors. Adv. Space Res. 2024, 73, 672–684. [Google Scholar] [CrossRef]
  44. Sotomayor-Beltran, C. Ionospheric anomalies preceding the lowlatitude earthquake that occurred on April 16, 2016 in Ecuador. J. Atmos. Sol. Terr. Phys. 2019, 182, 61–66. [Google Scholar] [CrossRef]
  45. Zhao, B.; Yu, T.; Wang, M.; Wan, W.; Lei, J.; Liu, L.; Ning, B. Is an unusual large enhancement of ionospheric electron density linked with the 2008 great Wenchuan earthquake? J. Geophys. Res. 2008, 113, A11304. [Google Scholar] [CrossRef]
  46. Shah, M.; Jin, S.G. Statistical characteristics of seismo-ionospheric GPS TEC disturbances prior to global Mw ≥ 5.0 earthquakes (1998–2014). J. Geodyn. 2015, 92, 42–49. [Google Scholar] [CrossRef]
  47. Matzka, J.; Stolle, C.; Yamazaki, Y.; Bronkalla, O.; Morschhauser, A. The geomagnetic Kp index and derived indices of geomagnetic activity. Space Weather 2021, 19, e2020SW002641. [Google Scholar] [CrossRef]
  48. Athanasiou, M.A.; Anagnostopoulos, G.C.; David, C.N.; Machairidis, G.G. The Ultra Low Frequency Electromagnetic Radiation Observed in the Topside Ionosphere Above Boundaries of Tectonic Plates. Res. Geophys. 2014, 4, 31–39. [Google Scholar] [CrossRef]
  49. Zeigarnik, V.A.; Bogomolov, L.M.; Novikov, V.A. Electromagnetic Earthquake Triggering: Field Observations, Laboratory Experiments, and Physical Mechanisms—A Review. Izv. Phys. Solid Earth 2022, 58, 30–58. [Google Scholar] [CrossRef]
  50. Rajesh, P.K.; Lin, C.H.; Lin, C.Y.; Chen, C.H.; Liu, J.Y.; Matsuo, T.; Chen, S.P.; Yeh, W.H.; Huang, C.Y. Extreme positive ionosphere storm triggered by a minor magnetic storm in deep solar minimum revealed by FORMOSAT-7/COSMIC-2 and GNSS observations. J. Geophys. Res. Space Phys. 2021, 126, e2020JA028261. [Google Scholar] [CrossRef]
  51. Ren, X.; Yang, P.; Mei, D.; Liu, H.; Xu, G.; Dong, Y. Global ionospheric TEC forecasting for geomagnetic storm time using a deep learning-based multi-model ensemble method. Space Weather 2023, 21, e2022SW003231. [Google Scholar] [CrossRef]
  52. Namgaladze, A.A.; Förster, M.; Prokhorov, B.E.; Zolotov, O.V. Electromagnetic Drivers in the Upper Atmosphere: Observations and Modeling. In The Atmosphere and Ionosphere. Physics of Earth and Space Environments; Bychkov, V., Golubkov, G., Nikitin, A., Eds.; Springer: Dordrecht, The Netherlands, 2013. [Google Scholar] [CrossRef]
  53. He, L.; Heki, K. Ionospheric anomalies immediately before Mw7.0–8.0 earthquakes. J. Geophys. Res. Space Phys. 2017, 122, 8659–8678. [Google Scholar] [CrossRef]
  54. Hayakawa, M.; Molchanov, O. Summary report of NASDA’s earthquake remote sensing frontier project. Phys. Chem. Earth 2004, 29 Pt A/B/C, 617–625. [Google Scholar] [CrossRef]
  55. Liperovsky, V.A.; Pokhotelov, O.A.; Meister, C.V.; Liperovskaya, E.V. Physical models of coupling in the lithosphere-atmosphere-ionosphere system before earthquakes. Geomagn. Aeron. 2008, 48, 795–806. [Google Scholar] [CrossRef]
  56. Astafyeva, E. Ionospheric detection of natural hazards. Rev. Geophys. 2019, 57, 1265–1288. [Google Scholar] [CrossRef]
  57. Astafyeva, E.; Rolland, L.M.; Sladen, A. Strike-slip earthquakes can also be detected in the ionosphere. Earth Planet Sci. Lett. 2014, 405, 180–193. [Google Scholar] [CrossRef]
  58. Rolland, L.M.; Lognonné, P.; Astafyeva, E.; Kherani, E.A.; Kobayashi, N.; Mann, M.; Munekane, H. The resonant response of the ionosphere imaged after the 2011 off the Pacific coast of Tohoku Earthquake. Earth Planets Space 2011, 63, 853–857. [Google Scholar] [CrossRef]
  59. Afraimovich, E.L.; Ding, F.; Kiryushkin, V.V.; Astafyeva, E.I.; Jin, S.; Sankov, V.A. TEC response to the 2008 Wenchuan Earthquake in comparison with other strong earthquakes. Int. J. Remote Sens. 2010, 31, 3601–3613. [Google Scholar] [CrossRef]
  60. Hernández-Pajares, M.; Lyu, H.; Aragón-Àngel, À.; Monte-Moreno, E.; Liu, J.; An, J.; Jiang, H. Polar electron content from GPS data-based global ionospheric maps: Assessment, case studies, and climatology. J. Geophys. Res. Space Phys. 2020, 125, e2019JA027677. [Google Scholar] [CrossRef]
  61. Jarmołowski, W.; Ren, X.; Wielgosz, P.; Krypiak-Gregorczyk, A. On the advantage of stochastic methods in the modeling of ionospheric total electron content: Southeast Asia case study. Meas. Sci. Technol. 2019, 30, 044008. [Google Scholar] [CrossRef]
  62. Milanowska, B.; Wielgosz, P.; Krypiak-Gregorczyk, A.; Jarmołowski, W. Accuracy of Global Ionosphere Maps in Relation to Their Time Interval. Remote Sens. 2021, 13, 3552. [Google Scholar] [CrossRef]
  63. Perevalova, N.P.; Sankov, V.A.; Astafyeva, E.I.; Zhupityaeva, A.S. Threshold magnitude for ionospheric TEC response to earthquakes. J. Atmos. Sol. Terr. Phys. 2014, 108, 77–90. [Google Scholar] [CrossRef]
  64. Jin, S.G.; Occhipinti, G.; Jin, R. GNSS ionospheric seismology: Recent observations evidences and characteristics. Earth-Sci. Rev. 2015, 147, 54–64. [Google Scholar] [CrossRef]
  65. Jarmołowski, W.; Wielgosz, P.; Hernández-Pajares, M.; Yang, H.; Milanowska, B.; Krypiak-Gregorczyk, A.; Monte-Moreno, E.; García-Rigo, A.; Graffigna, V.; Haagmans, R. The Correlation between Ionospheric Electron Density Variations Derived from Swarm Satellite Observations and Seismic Activity at the Australian–Pacific Tectonic Plate Boundary. Remote Sens. 2023, 15, 5557. [Google Scholar] [CrossRef]
  66. Jarmołowski, W.; Belehaki, A.; Wielgosz, P. Sensitivity of Band-Pass Filtered In Situ Low-Earth Orbit and Ground-Based Ionosphere Observations to Lithosphere–Atmosphere–Ionosphere Coupling Over the Aegean Sea: Spectral Analysis of Two-Year Ionospheric Data Series. Sensors 2024, 24, 7795. [Google Scholar] [CrossRef] [PubMed]
  67. Sunil, A.S.; Bagiya, M.S.; Bletery, Q.; Ramesh, D.S. Association of ionospheric signatures to various tectonic parameters during moderate to large magnitude earthquakes: Case study. J. Geophys. Res. Space Phys. 2021, 126, e2020JA028709. [Google Scholar] [CrossRef]
  68. Bird, P. An updated digital model of plate boundaries. Geochem. Geophys. Geosystems 2003, 4, 1027. [Google Scholar] [CrossRef]
  69. Dobrovolsky, I.P.; Zubkov, S.I.; Miachkin, V.I. Estimation of the size of earthquake preparation zones. Pure Appl. Geophys. 1979, 117, 1025–1044. [Google Scholar] [CrossRef]
  70. Alekseev, D.; Kuvshinov, A.; Palshin, N. Compilation of 3D global conductivity model of the Earth for space weather applications. Earth Planet Space 2015, 67, 108. [Google Scholar] [CrossRef]
  71. Chen, C.; Kuvshinov, A.; Kruglyakov, M.; Munch, F.; Rigaud, R. Constraining the crustal and mantle conductivity structures beneath Islands by a joint inversion of multi-source magnetic transfer functions. J. Geophys. Res. Solid Earth 2023, 128, e2022JB024106. [Google Scholar] [CrossRef]
  72. Lin, W.; Yang, B.; Han, B.; Hu, X. A Review of Subsurface Electrical Conductivity Anomalies in Magnetotelluric Imaging. Sensors 2023, 23, 1803. [Google Scholar] [CrossRef]
  73. Ouzounov, D.; Khachikyan, G. Studying the Impact of the Geospace Environment on Solar Lithosphere Coupling and Earthquake Activity. Remote Sens. 2024, 16, 24. [Google Scholar] [CrossRef]
  74. Anagnostopoulos, G. On the Origin of ULF Magnetic Waves Before the Taiwan Chi-Chi 1999 Earthquake. Front. Earth Sci. 2021, 9, 730162. [Google Scholar] [CrossRef]
  75. Marchitelli, V.; Harabaglia, P.; Troise, C.; De Natale, G. On the correlation between solar activity and large earthquakes worldwide. Sci. Rep. 2020, 10, 11495. [Google Scholar] [CrossRef] [PubMed]
  76. Pulinets, S.; Ouzounov, D. The Possibility of Earthquake Forecasting. Learning from Nature; IOP Publishing: Bristol, UK, 2018. [Google Scholar] [CrossRef]
Figure 1. Major and minor tectonic plates [68], together with M ≥ 5.0 earthquakes, from two days before to two days after starting epoch of each selected 20 h GIM VTEC sample.
Remotesensing 17 00614 g001
Figure 2. Series of global earthquakes with M ≥ 5.0 together with Kp and Dst indices. A period of two days backward and two days forward from the first of the selected observational epochs (vertical black lines) is shown. Figures (a,b) refer to lower geomagnetic activity and (c,d) to enhanced geomagnetic activity. The time is in UTC. The units of vertical axis are as follows: magnitude × 10, depth in km, Kp × 10, Dst in nT. The earthquakes in red are indicated as potentially linked to extreme dVTEC in Figure 3, Figure 4, Figure 5 and Figure 6.
Remotesensing 17 00614 g002
Figure 7. Selected epochs of dVTEC from UQRG, which are particularly similar to tectonic plate boundaries in April 2012. Tectonic plate boundaries (black bold lines), earthquakes within ±2 h having M ≥ 5.0 (Dobrovolsky circles in blue), and apparent Sun position (yellow circle) are shown for reference. The labels of earthquakes include magnitude, depth in km in parenthesis, and time (UTC).
Remotesensing 17 00614 g007
Figure 8. Selected epochs of dVTEC from UQRG, which are particularly similar to tectonic plate boundaries in September 2017. Tectonic plate boundaries (black bold lines), earthquakes within ±2 h having M ≥ 5.0 (Dobrovolsky circles in blue), and apparent Sun position (yellow circle) are shown for reference. The labels of earthquakes include magnitude, depth in km in parenthesis, and time (UTC).
Remotesensing 17 00614 g008
Figure 9. (e) RMS of dVTEC within 1° margin from five types of tectonic plate boundaries calculated after exclusion of high latitudes (φ ≤ 60°). Blue curves show RMS over OTF boundaries, light blue—OSR, magenta—SUB, green—CRB, and brown—CTF. The order of data samples and subfigures corresponds to the order in Figure 2 and to the order of Figure 3, Figure 4, Figure 5 and Figure 6.
Remotesensing 17 00614 g009
Figure 10. Averaged dVTEC from UQRG summarizing most frequent locations of VTEC anomalies occurring in Figure 3, Figure 4, Figure 5, Figure 6, Figure 7 and Figure 8.
Remotesensing 17 00614 g010
Disclaimer/Publisher’s Note: The statements, opinions and data contained in all publications are solely those of the individual author(s) and contributor(s) and not of MDPI and/or the editor(s). MDPI and/or the editor(s) disclaim responsibility for any injury to people or property resulting from any ideas, methods, instructions or products referred to in the content.