Abstract
Citrus cultivation represents one of the major economic pillars of the Valencian Community (Spain). Frost events pose a significant threat to these plantations, resulting in substantial economic losses. This study aims to assess the frequency and intensity of frost occurrences in the region from 2004 to 2023, using Meteosat Second Generation satellite imagery. These images provide daily land surface temperature data at 15 min intervals. Frost days were defined as those when temperatures fell below −2.3 °C, the threshold at which orange fruits become susceptible to damage, with different temperature thresholds applied to estimate varying levels of crop damage. Frost duration was also analyzed to classify event intensity and its potential impact on citrus crops. Annual comparisons revealed a decline in both the severity and frequency of frosts, particularly in cases of “moderate” and “intense” damage, supporting forecasts of increased regional aridity and suggesting new opportunities for expanding citrus cultivation to higher altitudes. When compared with farmers’ records, this study’s methodology proves effective in assessing frost impact and offers potential use for winter crop insurance. Validation was conducted using in situ data from the Spanish National Meteorological Agency (AEMET).
1. Introduction
It has been widely demonstrated that climate change is negatively affecting food security, biodiversity, and ecosystem health [1,2]. In this context, permanent crops are particularly vulnerable [3], with certain groups, such as fruit growers, experiencing the most significant losses [4,5]. These subjects are at the highest risk because they heavily depend on natural resources and have limited adaptive capacity [6]. Therefore, it is essential to implement adaptation and mitigation strategies to enhance their resilience to adverse events, which are expected to increase in frequency and intensity in the coming decades [7].
Recent studies [8,9,10] have shown that climate variations, including changes in temperature and precipitation, directly affect the quality and yield of citrus fruits. Generally, citrus trees adapt well to various climates, but their growth is constrained by low temperatures and frosts, which can be a limiting factor for agricultural production in arid and semi-arid climates, such as those in certain Mediterranean regions [11,12]. Although climate warming is reducing the frequency of frost events, vegetation is increasingly exposed to frost due to the extension of the growing season [13,14]. For instance, abnormally warm temperatures in late winter or early spring can lead to a false spring, where crops begin their annual growth earlier than usual, increasing the risk of damage from subsequent frost events [3,15,16]. Additionally, climate change is making late spring frosts more frequent, which is particularly problematic as they can affect trees during flowering, a stage when plants are most vulnerable, thereby hindering proper fruit development [17].
Frost is commonly defined as the lowering of air to below the freezing point, which is 0 °C [13,18]. However, in the context of citrus agriculture, frosts are considered impactful when the land surface temperature (LST) detected by satellite drops to −2.3 °C or below [19]. It has been clearly proved that at these temperatures, the tissues of the orange fruits can be permanently damaged, resulting in lower yields in future seasons and a decrease in fruit quality [12,20,21,22,23]. Low temperatures also damage citrus fruits by triggering the formation of ice crystals within their cells, leading to the rupture of the juice sacs inside the fruit, causing it to dry out [12,24]. Farmers and investors are therefore strongly impacted economically by such climatic events, as a single night of freezing temperatures can lead to the complete loss of the crop [25].
In the last years, the use of remote sensing (RS) technologies for frost monitoring has advanced significantly, becoming an indispensable tool for accurate and timely assessment of agricultural conditions during and after frost events [16,26]. The second-generation METEOSAT (MSG) satellites, operated by EUMETSAT, are particularly effective for this purpose. These satellites are equipped with the spinning enhanced visible and infrared imager (SEVIRI), which captures data across 12 spectral bands, ranging from visible to thermal infrared, with spatial resolutions of 1 km for visible bands and 3 km for infrared bands [27]. Other satellites, such as the Landsat constellation, while offering higher spatial resolution that could allow for more detailed monitoring of cultivated soil, face limitations such as revisit times spanning several days or even weeks, making them less suitable for our purposes. MSG’s high temporal resolution, capturing images every 15 min, enables continuous monitoring of Earth conditions.
In this regard, we emphasize the need for public RS data with both high spatial and temporal resolution, such as that anticipated from the upcoming ESA LSTM mission [28], which is expected to have a resolution of 50 m and a daily revisit time. The ability to monitor temperature fluctuations in near real-time with improved spatial resolution will allow farmers to better implement preventive measures, such as activating frost protection systems, to mitigate crop damage [29].
Agricultural strategies to combat the effects of frost are crucial for enhancing the resilience of crops sensitive to low temperatures, such as citrus [25]. Among the most effective active techniques are the use of vegetative covers and sprinkler irrigation [30], which help form a protective layer around the plants, reducing potential frost damage, and the use of heaters and wind machines [31,32,33], which aim to prevent excessive temperature drops in the fields. While these techniques are effective, they require precise implementation and constant weather monitoring to be truly useful and are not always economically feasible [3]. Passive methods, such as proper site and species selection and adequate pruning, can offer sufficient benefits to avoid the need for active methods and are generally less costly [18].
In this context, having precise and up-to-date knowledge of the territory and the frost risk affecting the area is essential to help farmers improve their adaptive capacities and resilience, reducing their vulnerability to adverse climatic events [22,34,35]. We focused on citrus crops, given their significant economic and nutritional value [36,37], as well as their widespread global consumption. Consequently, we decided to monitor the frequency and intensity of frosts over the past 20 years in the Valencian Community, a region where the citrus agricultural sector is highly developed, representing more than half of Spain’s total citrus cultivated area [8], and positioning Spain as the world’s sixth-largest producer of fresh citrus [38]. To achieve this goal, we propose a practical remote sensing method to quantify the extent of frost damage, using the minimum temperature reached and the duration of the frost as key indicators.
2. Materials and Methods
2.1. Study Area
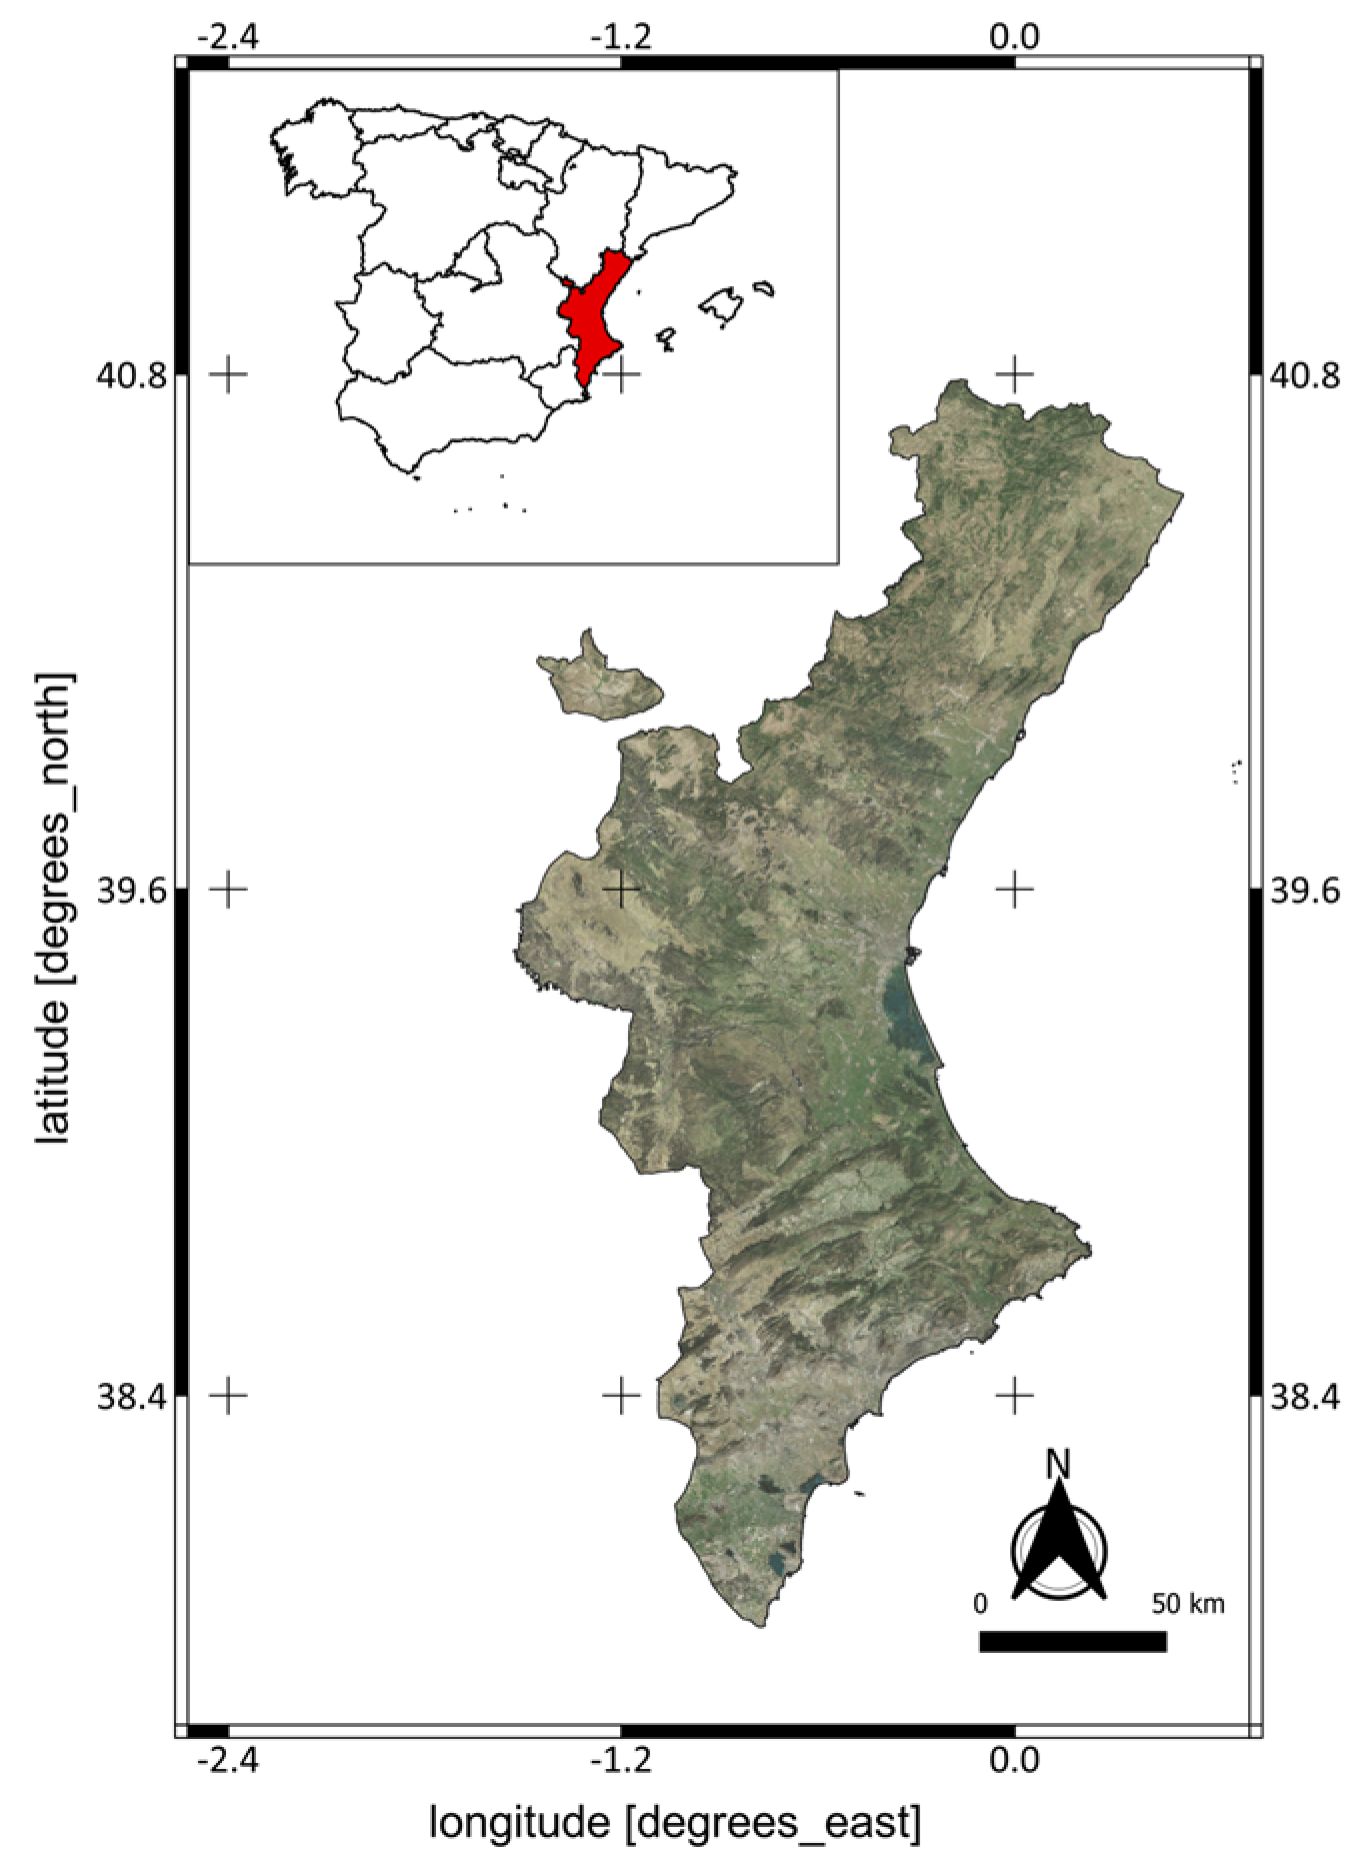
The Valencian Community (Figure 1) is a coastal region in the eastern part of the Iberian Peninsula with 23,255 km2, situated between 39° north latitude and 0° west longitude, overlooking the Mediterranean Sea. Its topography, characterized by the absence of significant mountain ranges, combined with its Mediterranean climate, featuring hot, humid summers, and relatively mild winters, creates an ideal environment for various types of cultivation, particularly citrus fruits, with oranges being the most prominent.

Figure 1.
Satellite view of the study area, with a detailed inset of the Iberian Peninsula in the upper-left corner.
Given the importance of citrus cultivation in the region, we deemed it suitable for studying the trends, intensity, and frequency of frosts over the past 20 years, as well as the damage they cause. Despite the near absence of elevations exceeding 1000 m, frosts are common during the coldest months, even at near-sea level. Consequently, it is crucial to monitor these environmental adversities in the region, to assess potential damages and implement protective measures to safeguard the local economy.
2.2. Input Data
To study the occurrence of frosts in the Valencian Community, we utilized MSG images collected from 2004 until 2023. This satellite constellation captures images of the study area every 15 min; however, we opted to consider only one image per hour to streamline the dataset while maintaining high representability.
In total, 85,208 images were processed, comprising 24 images for each day (the first image obtained per hour) for the months of January, February, March, April, November, and December across the entire study period. We focused on these months because they are when frost occurrences are most likely and can potentially damage the plantations. All images were sourced from the open-access service Satellite Application Facility on Land Surface Analysis (LSA SAF; https://lsa-saf.eumetsat.int/en/data/products/, accessed on 1 September 2023).
From these images, we selected the MSG LST band of the MLST product, which provides information on LST at a spatial resolution of 3 km. This product is already provided with clouds masked. We decided not to perform downscaling to enhance spatial resolution, as is sometimes undertaken in monitoring frost in cultivated fields [16]. We determined that such downscaling would introduce significant errors when applied to the large volume of images in our study and would not serve our purpose of monitoring frosts at a regional level.
The 3 km spatial resolution of MSG may present certain challenges when detecting frost events in heterogeneous landscapes. This resolution may mask localized variations in land surface temperature (LST) caused by microclimatic factors such as topography, vegetation cover, or land use. Consequently, frost events occurring in smaller, isolated regions, such as valleys or shaded zones, might not be fully captured. However, MSG was selected due to its high temporal resolution and the large number of images it provides within a single day, which is essential for studying temporal dynamics.
Although there are many variables that can influence the frost process and other important factors, such as precipitation, which also need to be considered, as mentioned in the introduction, the decision to conduct the analysis using only temperature data was primarily due to the large dataset involved. When determining the focus of the study, we concluded that hourly temperature data spanning 20 years would yield more relevant results, which was not the case for precipitation data.
Regarding phenology, the increase in temperatures has, in some cases, led to a longer growing season [13,14]. When analyzing this over an extended period, it became unfeasible because the temperatures in the later years of our study period were significantly higher than in the earlier years. For this reason, we focused solely on the perspective of temperature and how it should be considered in the study and planning of citrus cultivation.
For this reason, this study is primarily based on a thermal perspective, as analyzing 20 years of temperature data allows us to observe the temperature increase over the period and how this influences the primary variable for frost events, which is sub-zero temperatures.
2.3. Workflow
First, the LST data obtained from the satellite were compared with those recorded by the AEMET “Villafranca” meteorological station, located in the Castellón region (latitude: 42°16′43″N; longitude: 1°45′3″W), to verify the representativeness of the satellite data. AEMET stations collect hourly values of temperature, wind speed, wind direction, gust speed, gust direction, precipitation, pressure, pressure trend, and humidity. In this case, we used the air temperature values. The comparison was performed using data from January, February, March, April, November, and December of 2023. This meteorological station was chosen for the comparison because it is one of the few in the region situated in a relatively homogeneous area, allowing for an accurate comparison with data obtained from a 1 × 1 km pixel.
Although we were comparing air temperature with soil temperature, due to the lack of other available in situ data and the notable difference in spatial resolution, which inevitably generates an error, we thought it was useful to carry out the comparison anyway, even though we were aware of the differences existing between the datasets.
Due to the scarcity of easily applicable methodologies that are understandable to farmers and do not require a large amount of diverse input data [39], we have decided to develop a new, simplified methodology based on satellite-measured LST to detect possible frost damages. The collected images were analyzed to extract data on the frequency and duration of frosts. To account for the varying impacts on flowers, fruits, tree trunks, and stems, we established three critical temperature thresholds based on existing literature [40,41,42]. The thresholds chosen are −2.3 °C, −4 °C, and −9 °C, the latter being the temperature at which permanent damage to the tree structure, particularly the branches, is most likely to occur [25]. Although there is no consensus on the exact critical temperatures at which damage occur, due to the multitude of factors that influence the process, we selected these thresholds as they seem to provide a reasonable guideline according to the available literature.
Since the duration of frost also plays a crucial role in determining the extent of damage to a plantation [18], we established four consecutive duration thresholds to assess the potential impact on the plants: 3 to 6 h, 6 to 12 h, 12 to 24 h, and more than 24 h. Generally, a brief frost lasting fewer than two hours may not cause significant damage if the frost is mild, as citrus crops are adapted to short periods of cold and can regain vigor as temperatures rise [12]. Once again, due to the lack of precise data on frost duration’s impact on plantations, these limits were selected as a reference based on literature.
We developed a classification system for frost intensity levels by arbitrarily combining these parameters. Four categories of damage were established: light damage, moderate damage, severe damage, and permanent damage. These categories are represented in Table 1 using a range of colors.

Table 1.
Damage levels used for image classification, with a color legend explanation at the bottom. The rows indicate the different temperature thresholds, while the columns represent the time thresholds. The different levels of damage are indicated by colors (light blue = light damage; green = moderate damage; orange = intense damage; red = permanent damage).
However, it is important to note that this classification is indicative and does not account for factors that are crucial but difficult to monitor via satellite. These parameters include the difference between plant and air temperature, the phenological phase and hardening of the plant, or the crop species, all of which influence the extent of frost damage [18,24]. These factors must be evaluated on a case-by-case basis [25], along with other relevant parameters essential for determining the frost’s effects on the crop, such as relative humidity and wind.
Using the established methodology, each month of the years under consideration was classified accordingly. The methodology was initially applied to the pixel where “Villafranca” is located and, after a temperature analysis, extended to the entire community.
To more accurately account for the frequency and intensity of frosts in the Valencian Community over time, we developed damage intensity maps. Each frost category was assigned a specific “weight” value to reflect the severity of damage: 1 for light, 2 for moderate, 3 for severe, and 4 for permanent damage. These values correspond to the increasing intensity of frost impact on plants. The value for each frost category was then multiplied by the number of frost events (the number of times it occurred throughout the period) at each level within the selected time interval. The total intensity for each pixel was calculated by summing the values across all frost categories, resulting in an overall intensity measure (Equation (1)).
Before applying the methodology to the entire community, a temperature analysis was conducted across the Valencian Community. Initially, thermal anomaly maps were generated for each year to identify which years were warmer or colder.
The LST data were then analyzed using the Mann–Kendall Test to identify any significant differences within the dataset between different years. Additionally, the period from 2004 to 2013 was compared with 2014 to 2023, and the average of the years from 2004 to 2022 was compared with 2023.
Afterward, the methodology was applied to the entire community, first by generating a map of minimum damage occurrences. This provided a spatial overview of the problem, allowing us to identify the areas of the community where the effect is most pronounced. Subsequently, following Equation (1), damage intensity maps were generated for each month and year. The Mann–Kendall Test was then applied to analyze the individual trend for each month over the entire period from 2003 to 2024.
Damage intensity maps were also generated for each year. In this case, considering the seasonality of the data, it was deemed appropriate to use the seasonal Kendall test to analyze trends. This test accounts for temperature differences between each month and their trends over the years to determine if there were significant differences in the overall trends. All the statistical analyses performed were chosen because they do not require the assumptions of homoscedasticity and normal distribution of the data to be met, while still maintaining a high degree of reliability.
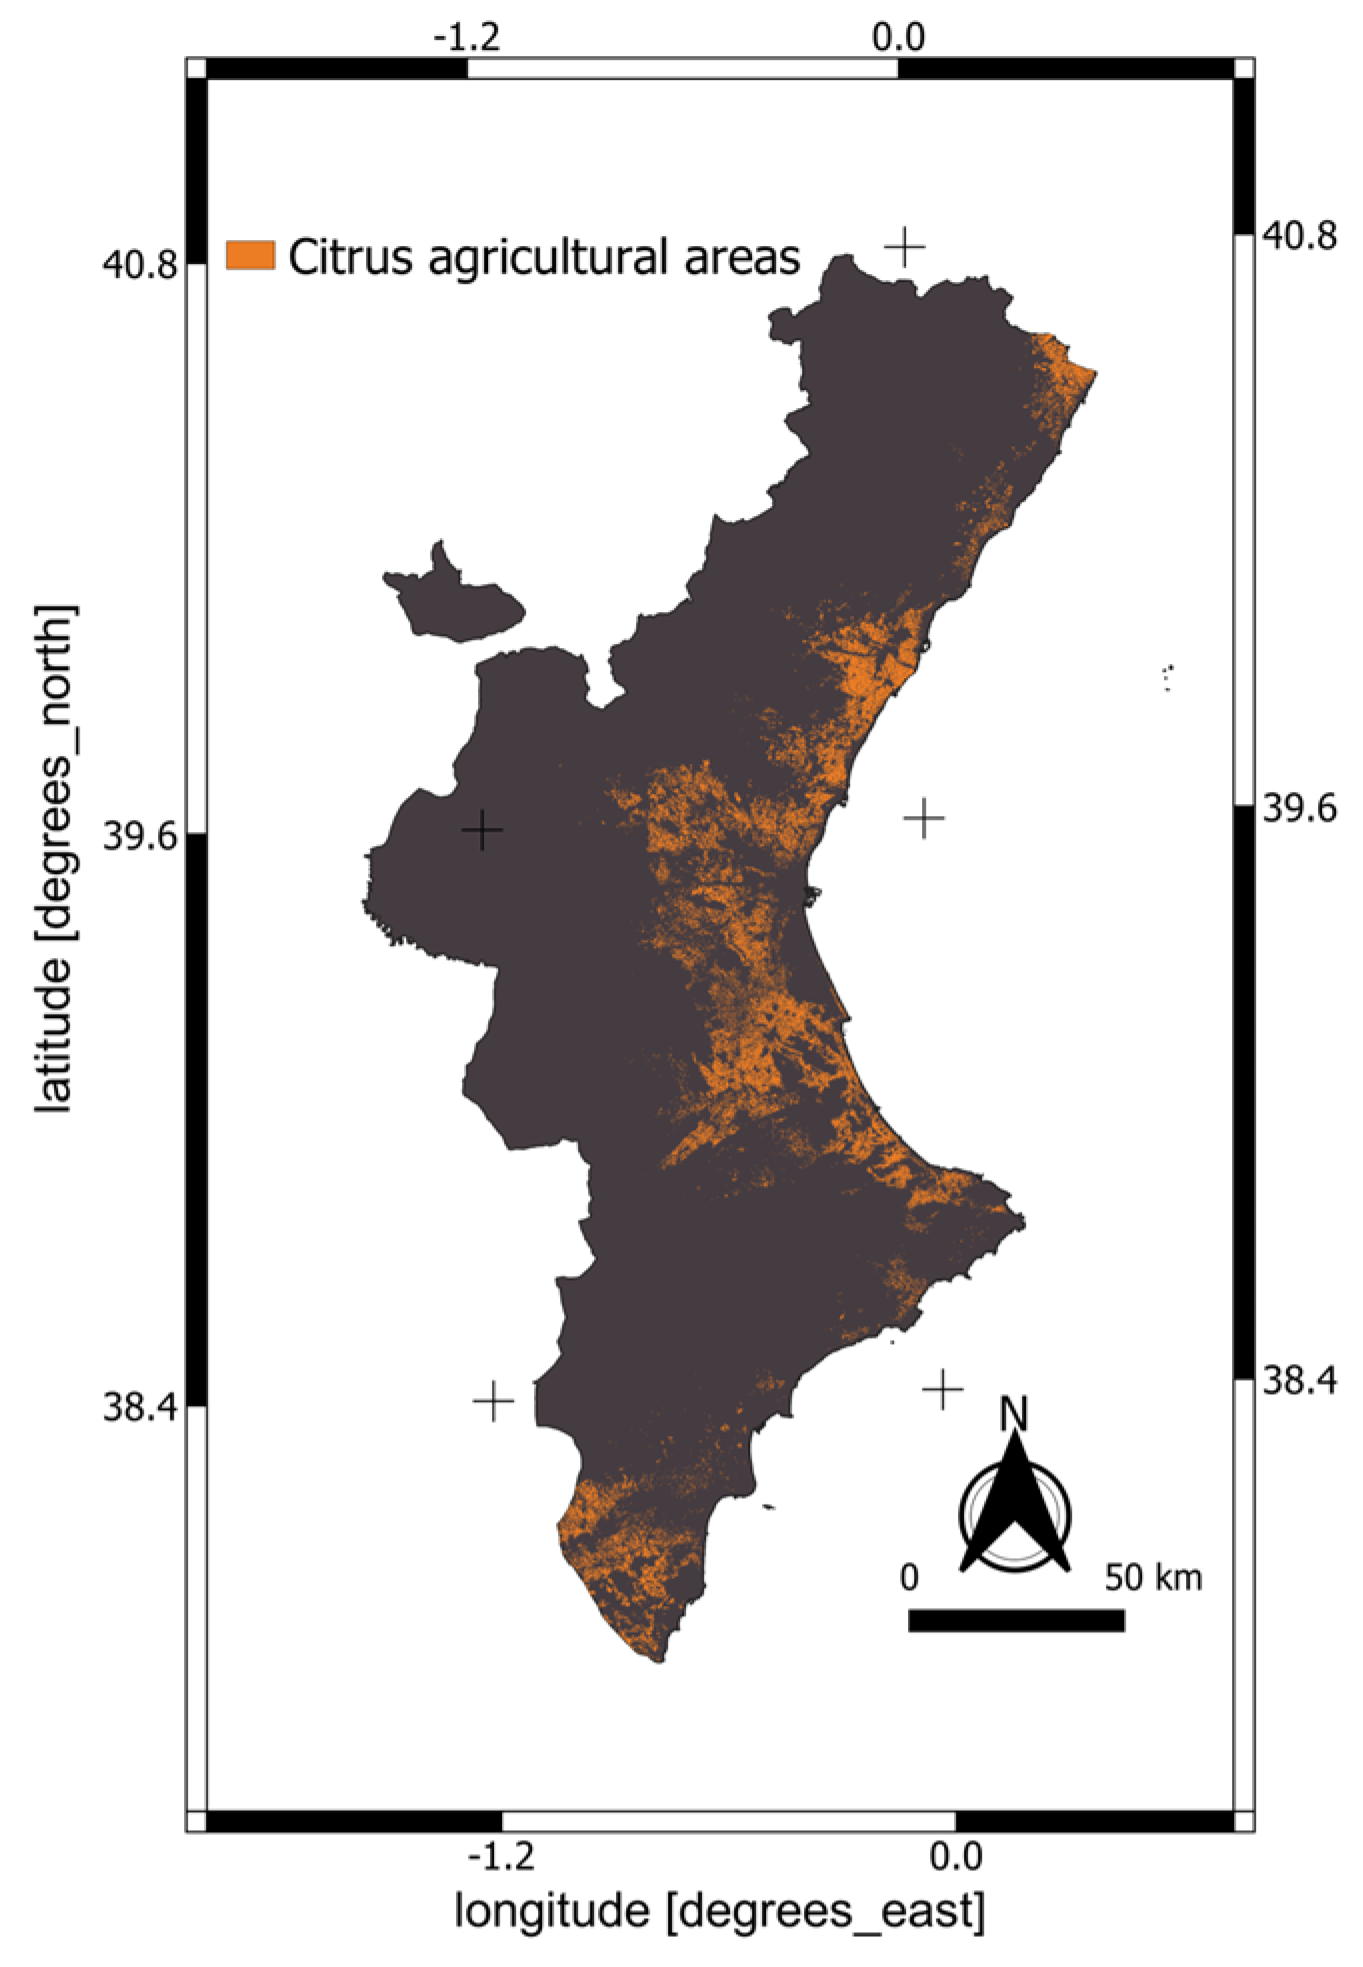
To verify whether the citrus crops in the region are indeed affected by frost, we compared our results with the distribution map of citrus agricultural areas provided by the “Centro de Descargas” of the Spanish National Geographical Information Centre (https://centrodedescargas.cnig.es/CentroDescargas/home, accessed on 1 September 2023). This map (https://datawrapper.dwcdn.net/ijvLp/1/, accessed on 1 September 2023) was derived from data from the Valencian Community Ministry of Agriculture, Fisheries, and Food, updated to 2022 (Figure 2), and has a spatial resolution of 10 m, covering the Valencian Community.

Figure 2.
Citrus map of the Valencian Community provided by the Spanish National Geographical Information Centre.
We also examined the relationship between frost damage and elevation by comparing the frost map with the Digital Elevation Model of the Valencian Community, also provided by the “Centro de Descargas” of the Spanish National Geographical Information Centre. This elevation product has a resolution of 200 m and is updated to 2009 (Figure 3). All analyses were conducted using Python, version 3.12. To enable a comparison with the generated intensity maps, the citrus map has been rescaled to the same resolution as the intensity maps.
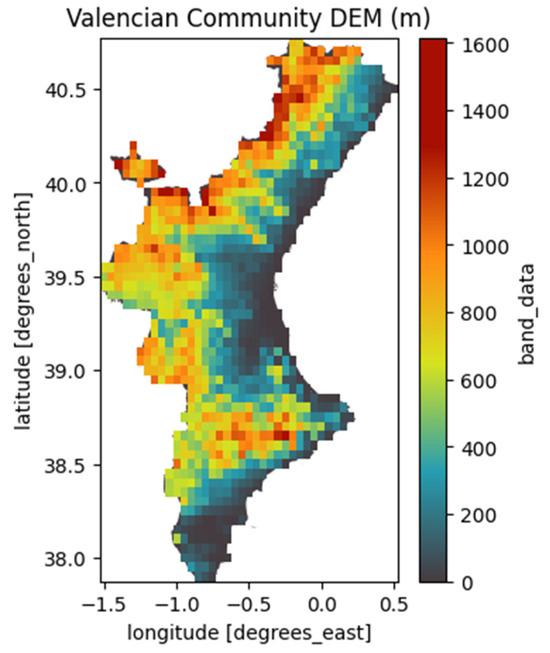
Figure 3.
Digital elevation model of the Valencian Community provided by the Spanish National Geographical Information Centre, rescaled to the same spatial resolution as the MSG images.
Finally, we validated the proposed methodology for classifying frosts by reviewing relevant articles and publications that confirmed the presence of damage to orange crops in the areas and periods identified by our study.
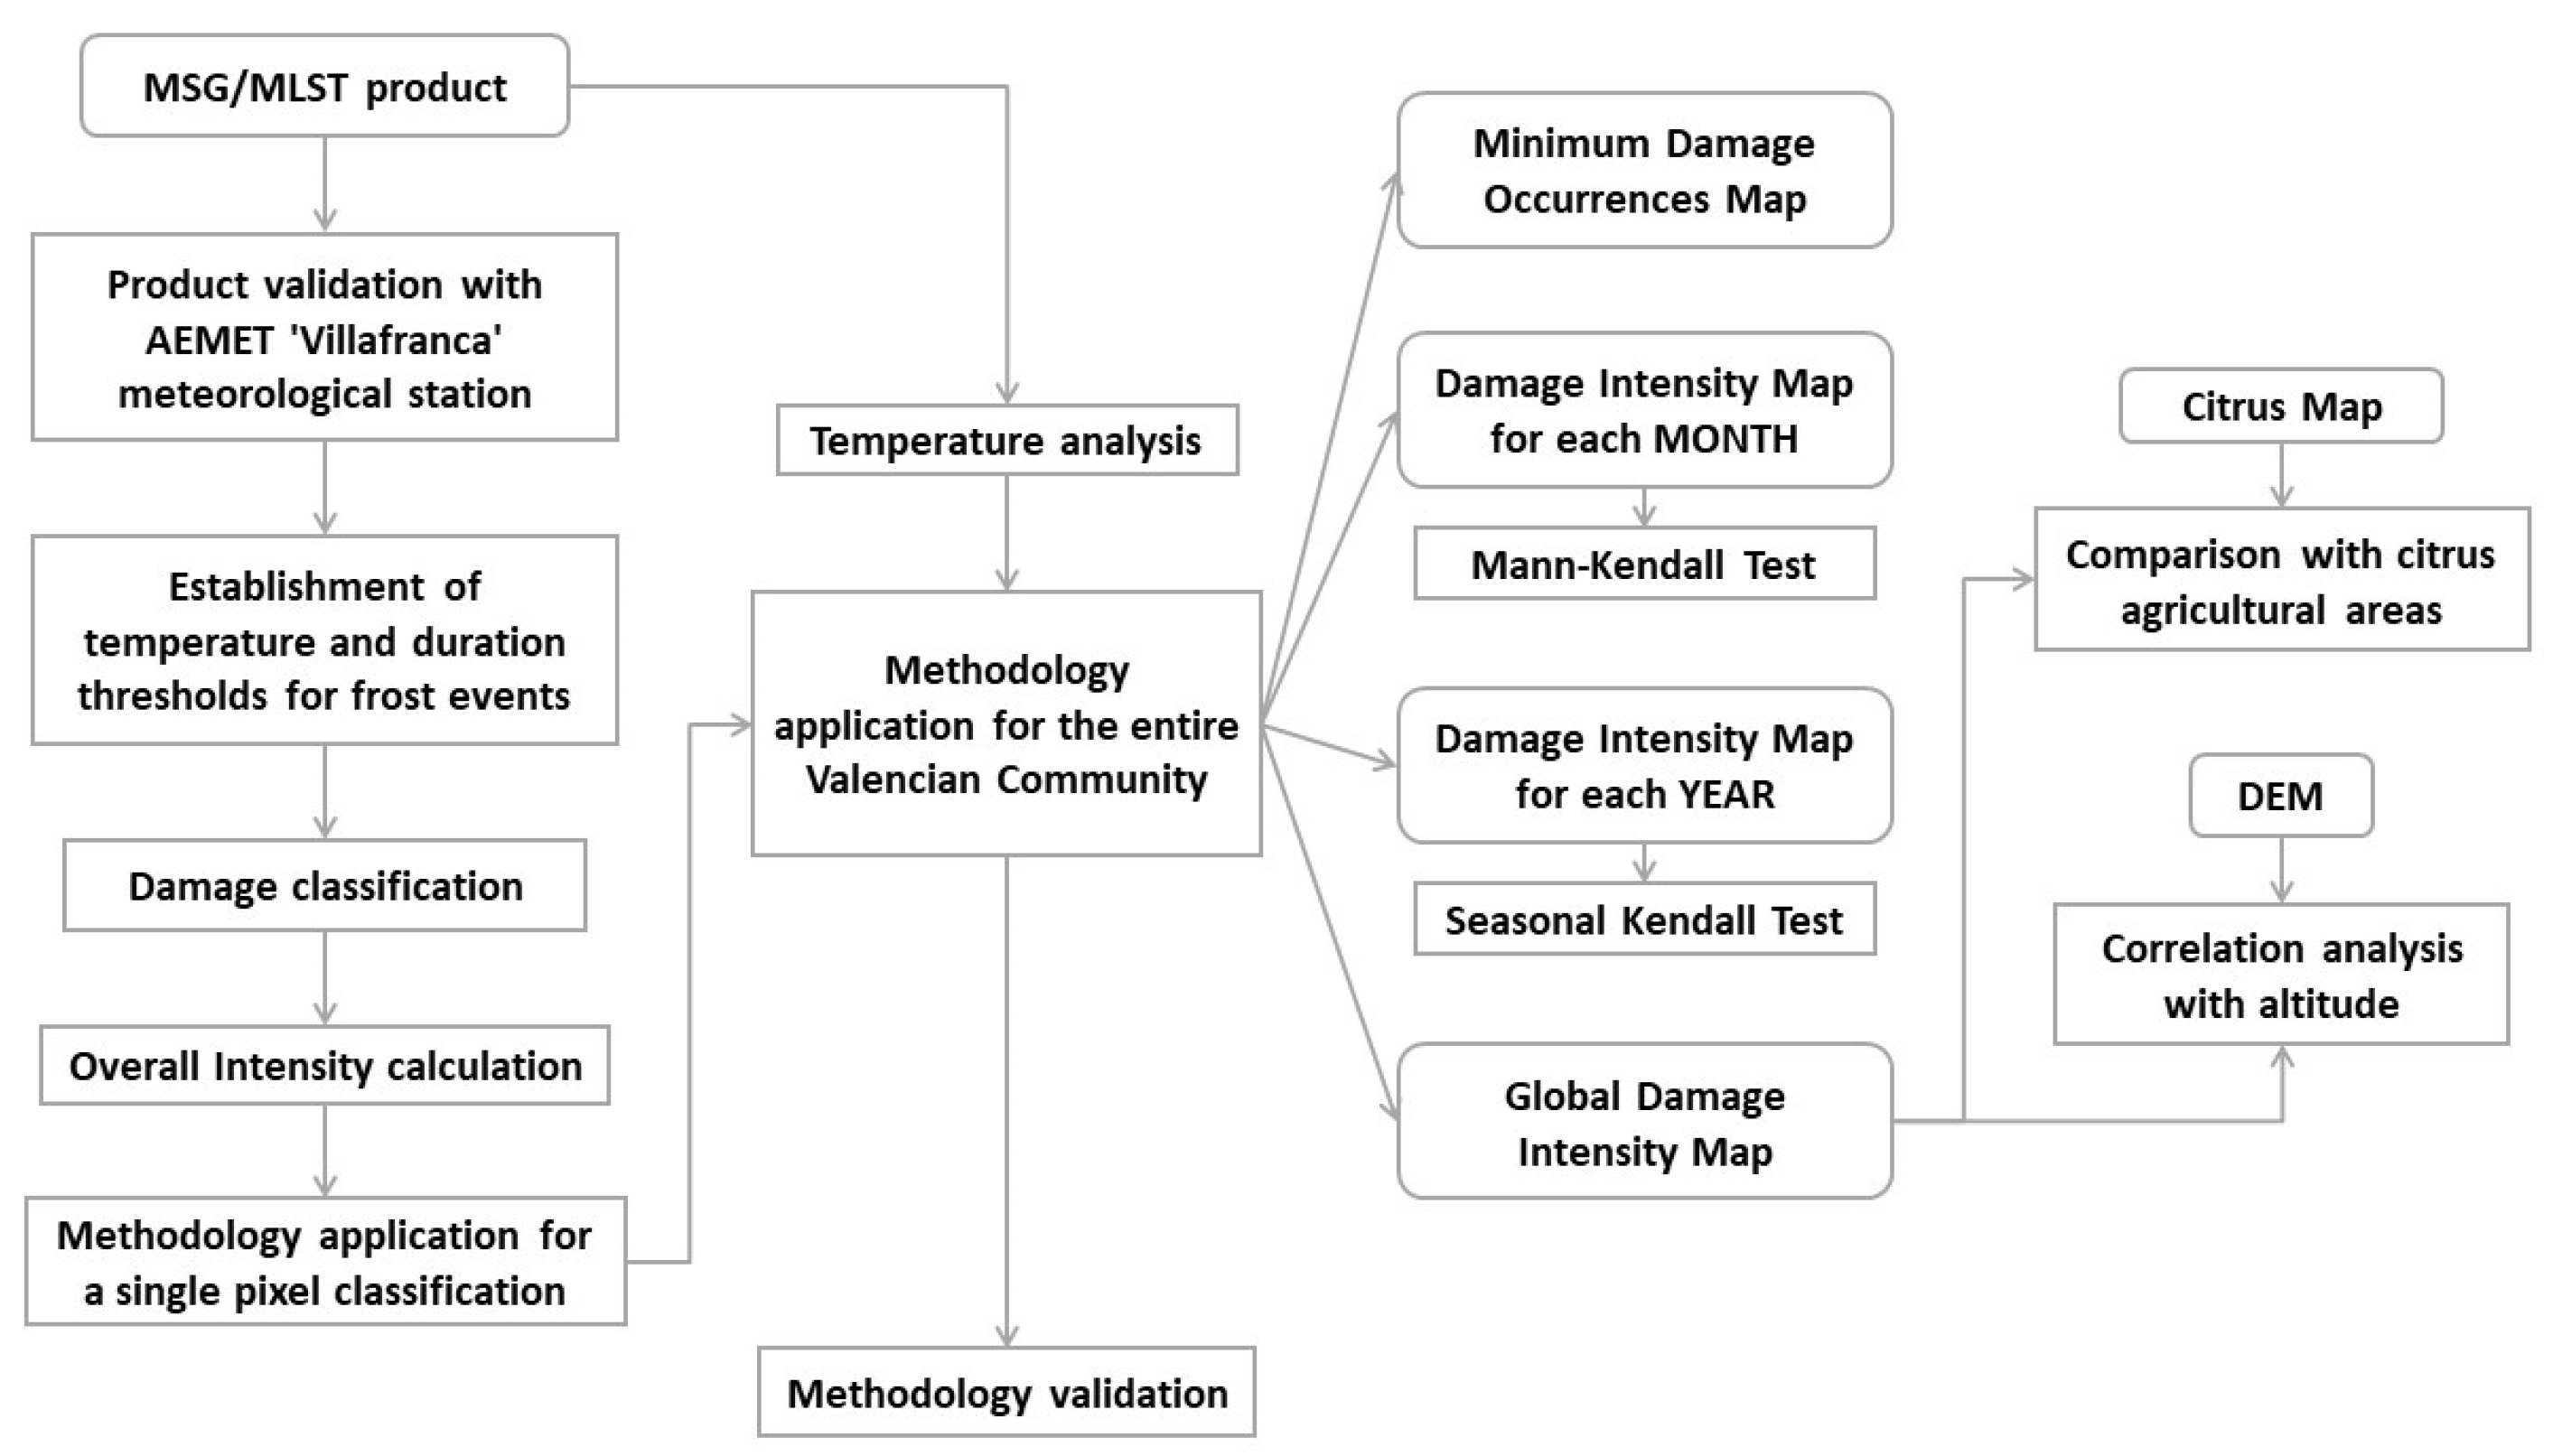
With this methodology (Figure 4), we can estimate Frost Intensity and Damage in Orange Groves, and thanks to the availability of 20 years of data, we can analyze the areas where this effect would no longer occur.

Figure 4.
Flowchart of the methodology applied in this work.
3. Results
3.1. LST Evaluation
First, the LST data obtained from the MSG satellite were validated by comparing them with the air temperature values recorded by the AEMET “Villafranca” station for the year 2023, resulting in an R2 of 0.62 and an RMSE of 3.97 °C (Figure 5). However, by selecting only the data values corresponding to nighttime hours (defined as between 00:00 and 06:00), when the air temperature and surface temperature are more similar, the R² improves to 0.91 and the RMSE to 1.5 °C.
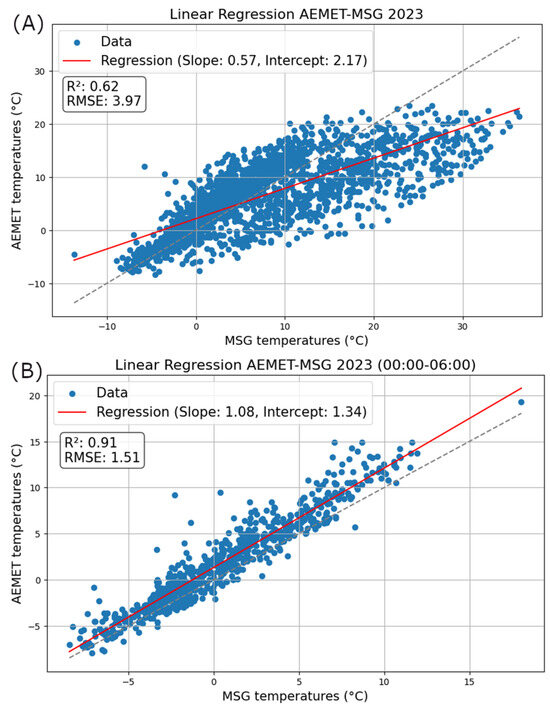
Figure 5.
Linear correlation graphs between Meteosat LST data and air temperature data from the Villafranca weather station for the year 2023 for all data (A) and only for the night hours (from 00:00 to 06:00) (B).
3.2. Methodology Application on a Single Pixel
Once it was verified that the recorded LST was consistent with the in situ data, the proposed methodology was applied at the Villafranca station. Table 2 shows the level of damage recorded over the entire time series (2004–2023), indicating the number of times temperatures fell below the defined limits and within the specified time intervals. In this area, a total of 386 occurrences of “Light Damage”, 119 occurrences of “Moderate Damage”, 35 occurrences of “Intense Damage”, and 0 occurrences of the highest level of damage, “Permanent Damage”, were recorded.
Table 2.
Total number of frost occurrences divided according to the different levels of damage—defined by us—occurring in Villafranca from 2004 to 2023. The different levels of damage are indicated by colors (light blue = light damage; green = moderate damage; orange = intense damage; red = permanent damage).
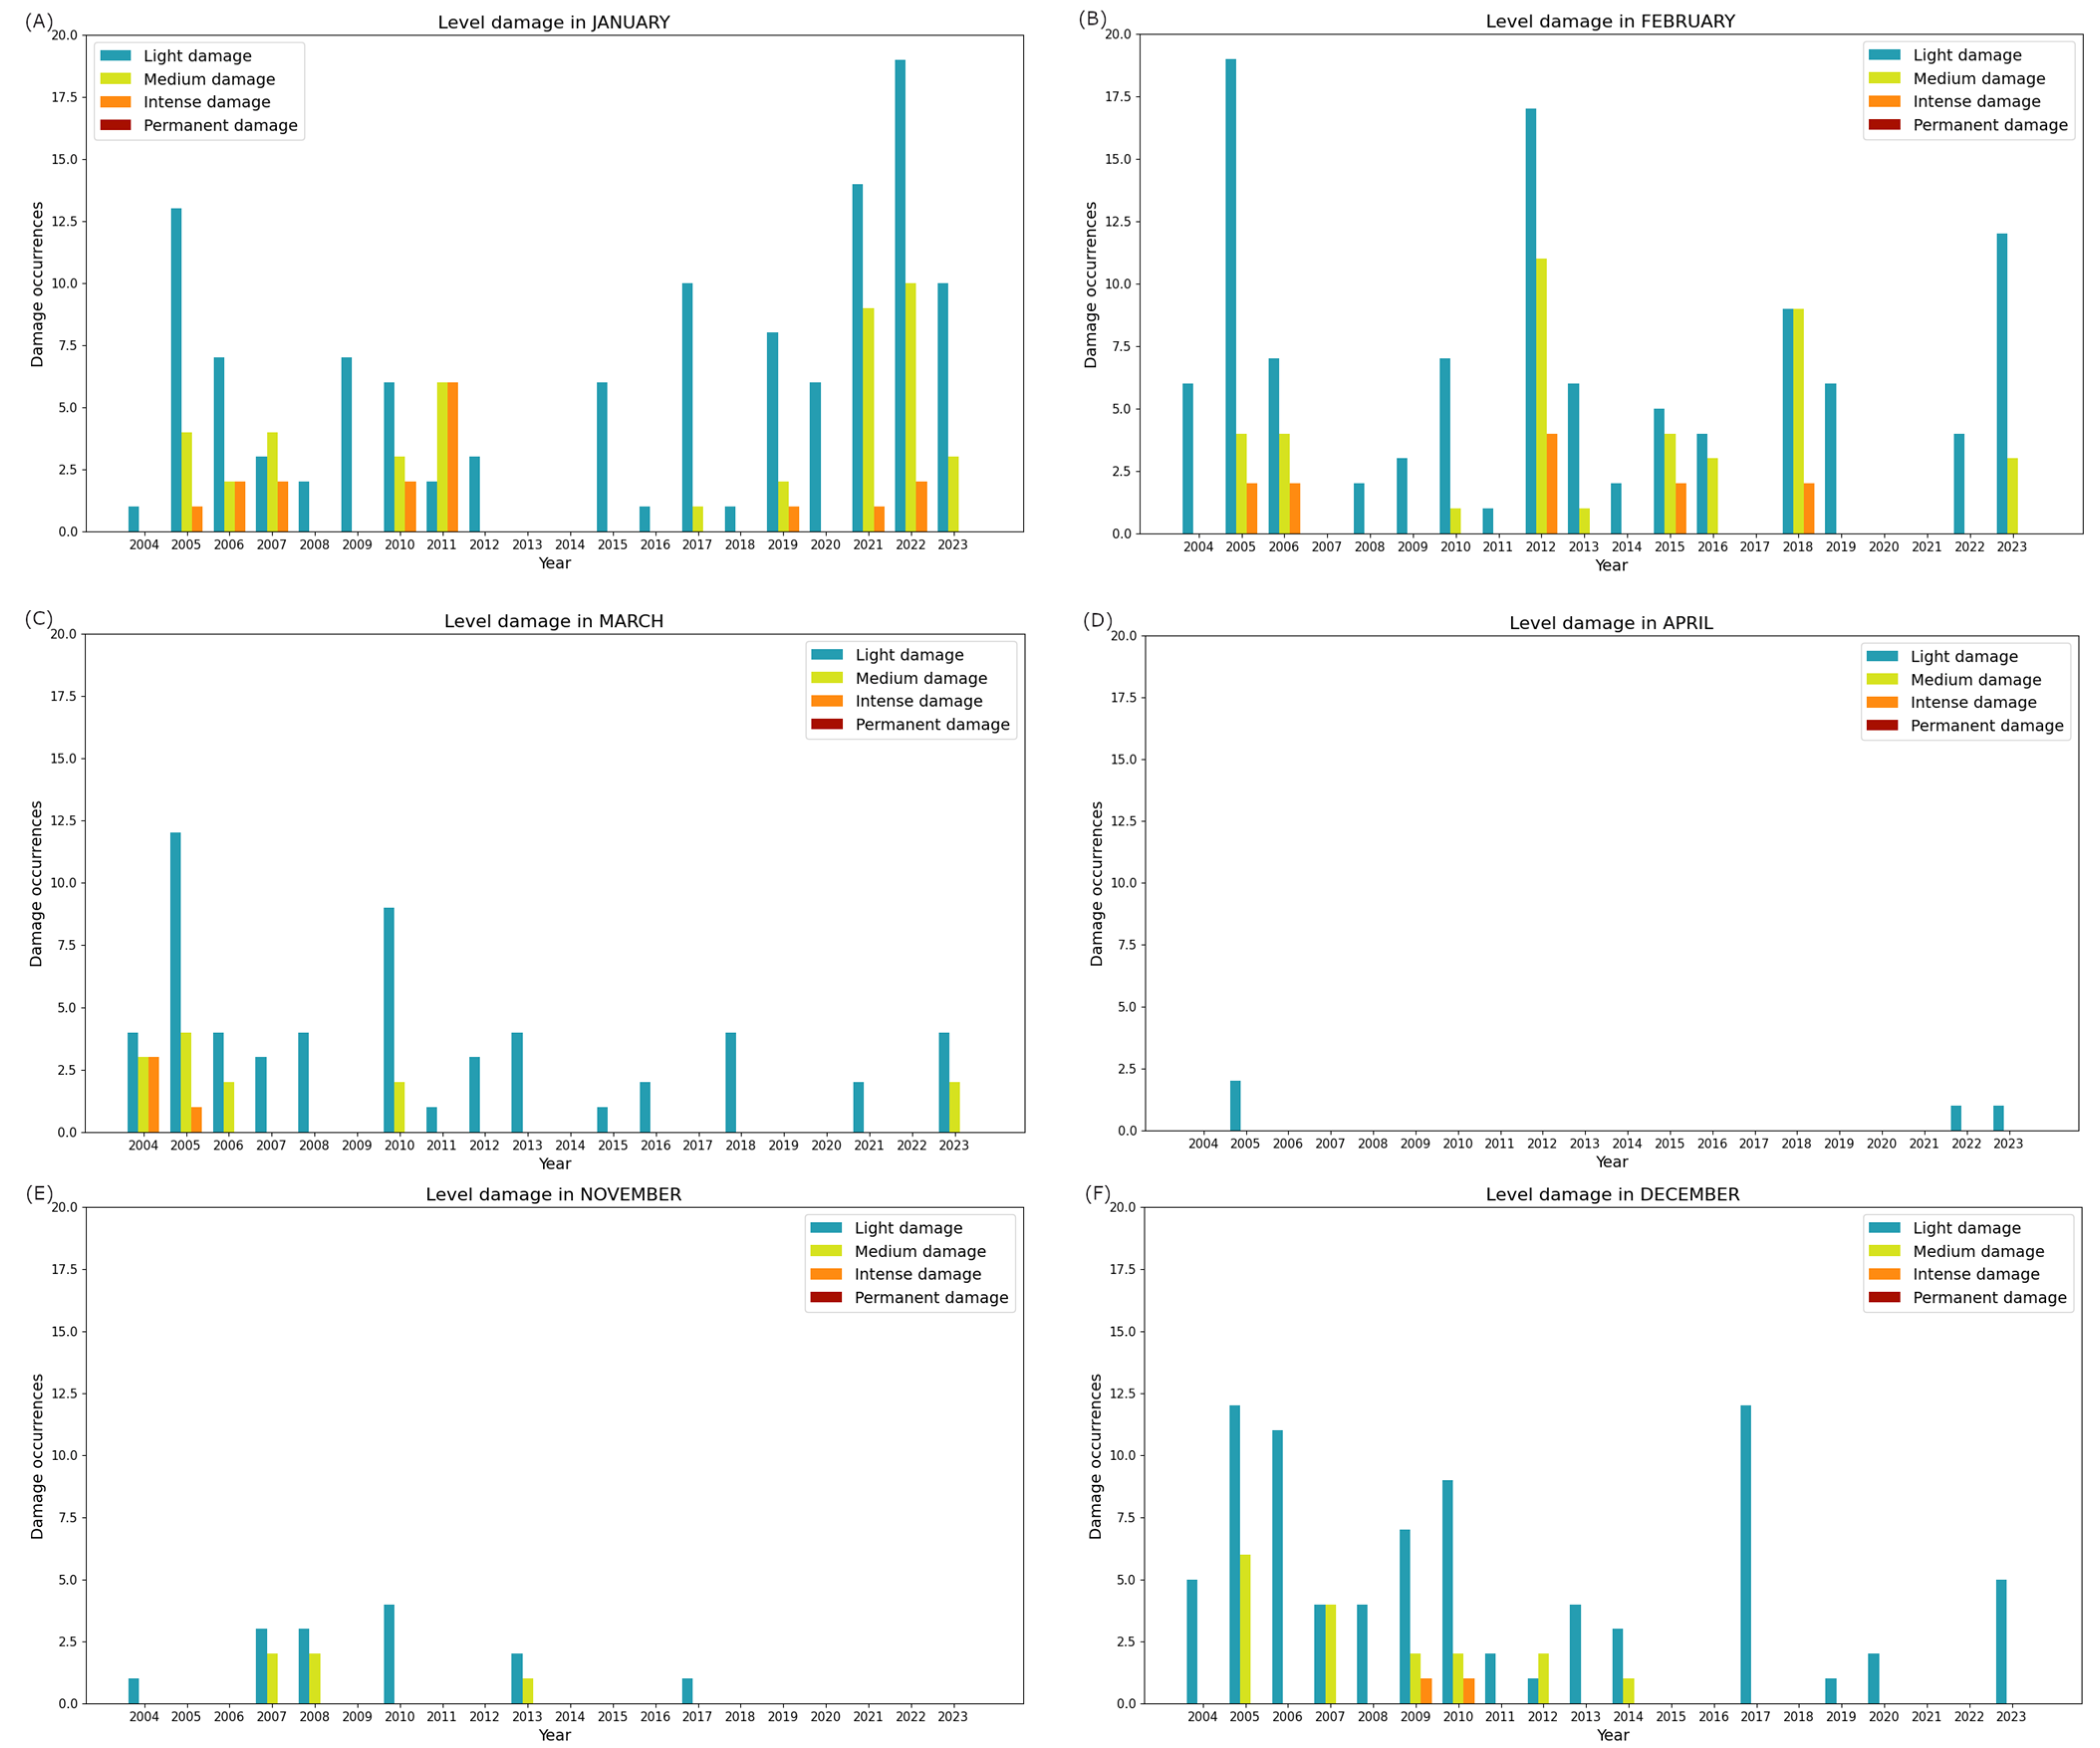
Additionally, the level of damage was analyzed for each year and for each month (Figure 6). It was observed that in April, no frost episodes occurred during the study period, except in some specific years. In the cases of November, December, and March, frost damage decreased compared to the historical series, with some years experiencing no frost occurrences. However, in January and February, a consistent level of damage was recorded throughout the data series.
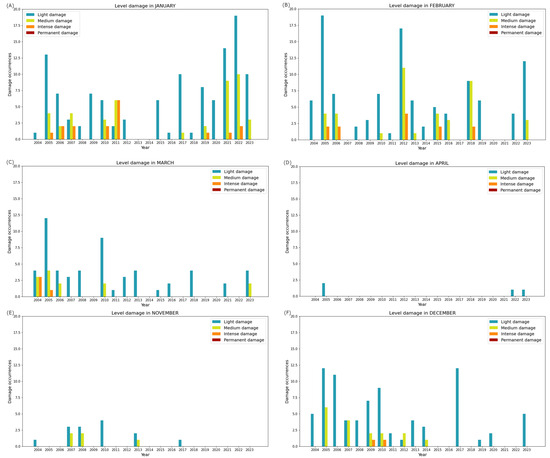
Figure 6.
Bar graph illustrating the total number of frost occurrences recorded in the Villafranca area during the study period (2004–2023). The frosts are categorized by the extent of the damage produced, which is depicted through different colors. The figure consists of six subfigures, labeled (A–F), representing each month: January, February, March, April, November, and December, respectively.
3.3. LST Analysis on the Entire Valencian Community
Afterward, the methodology was extended to the entire Valencian Community. Initially, an analysis of the LST was conducted for the study period, and anomalies were calculated for each year. The resulting maps are presented in Appendix A, Figure A1. It can be observed that 2005 and 2010 were cold years, while 2014, 2019, and 2023 (Figure 7) were warm years compared to the 20-year average.
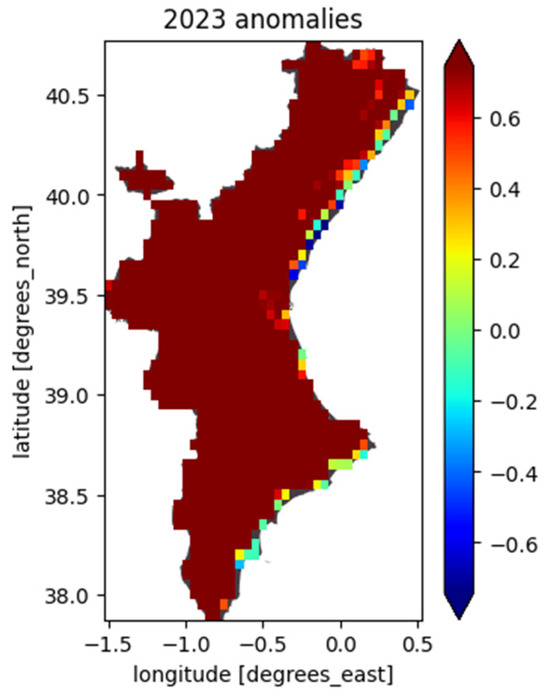
Figure 7.
Temperature anomaly map for the Valencian Community in 2023, with the entire study period (2004–2023) displayed in Appendix A, Figure A1.
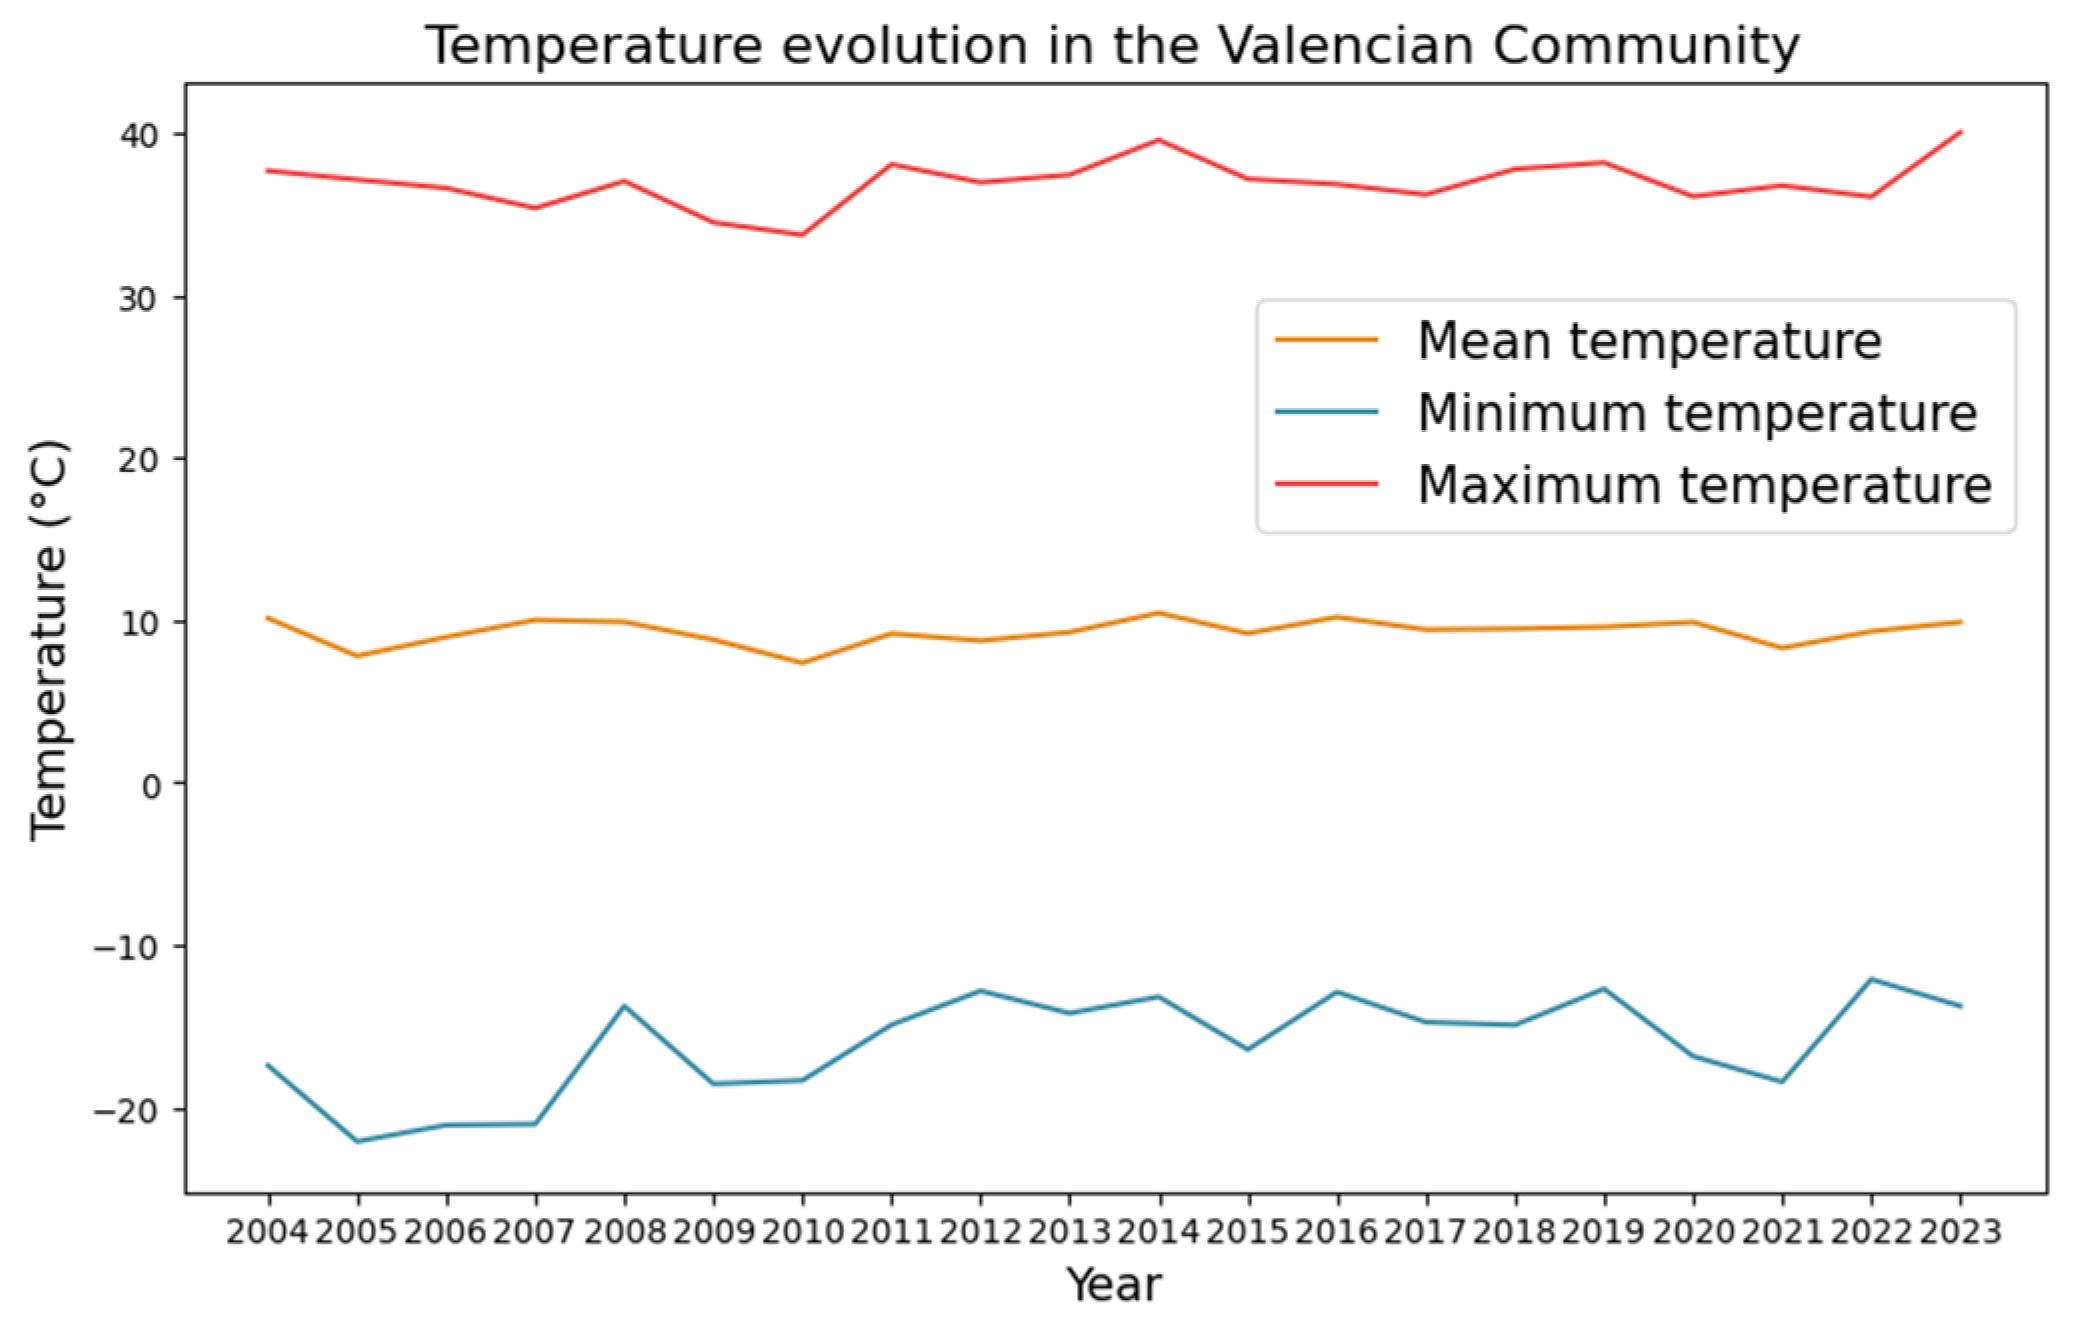
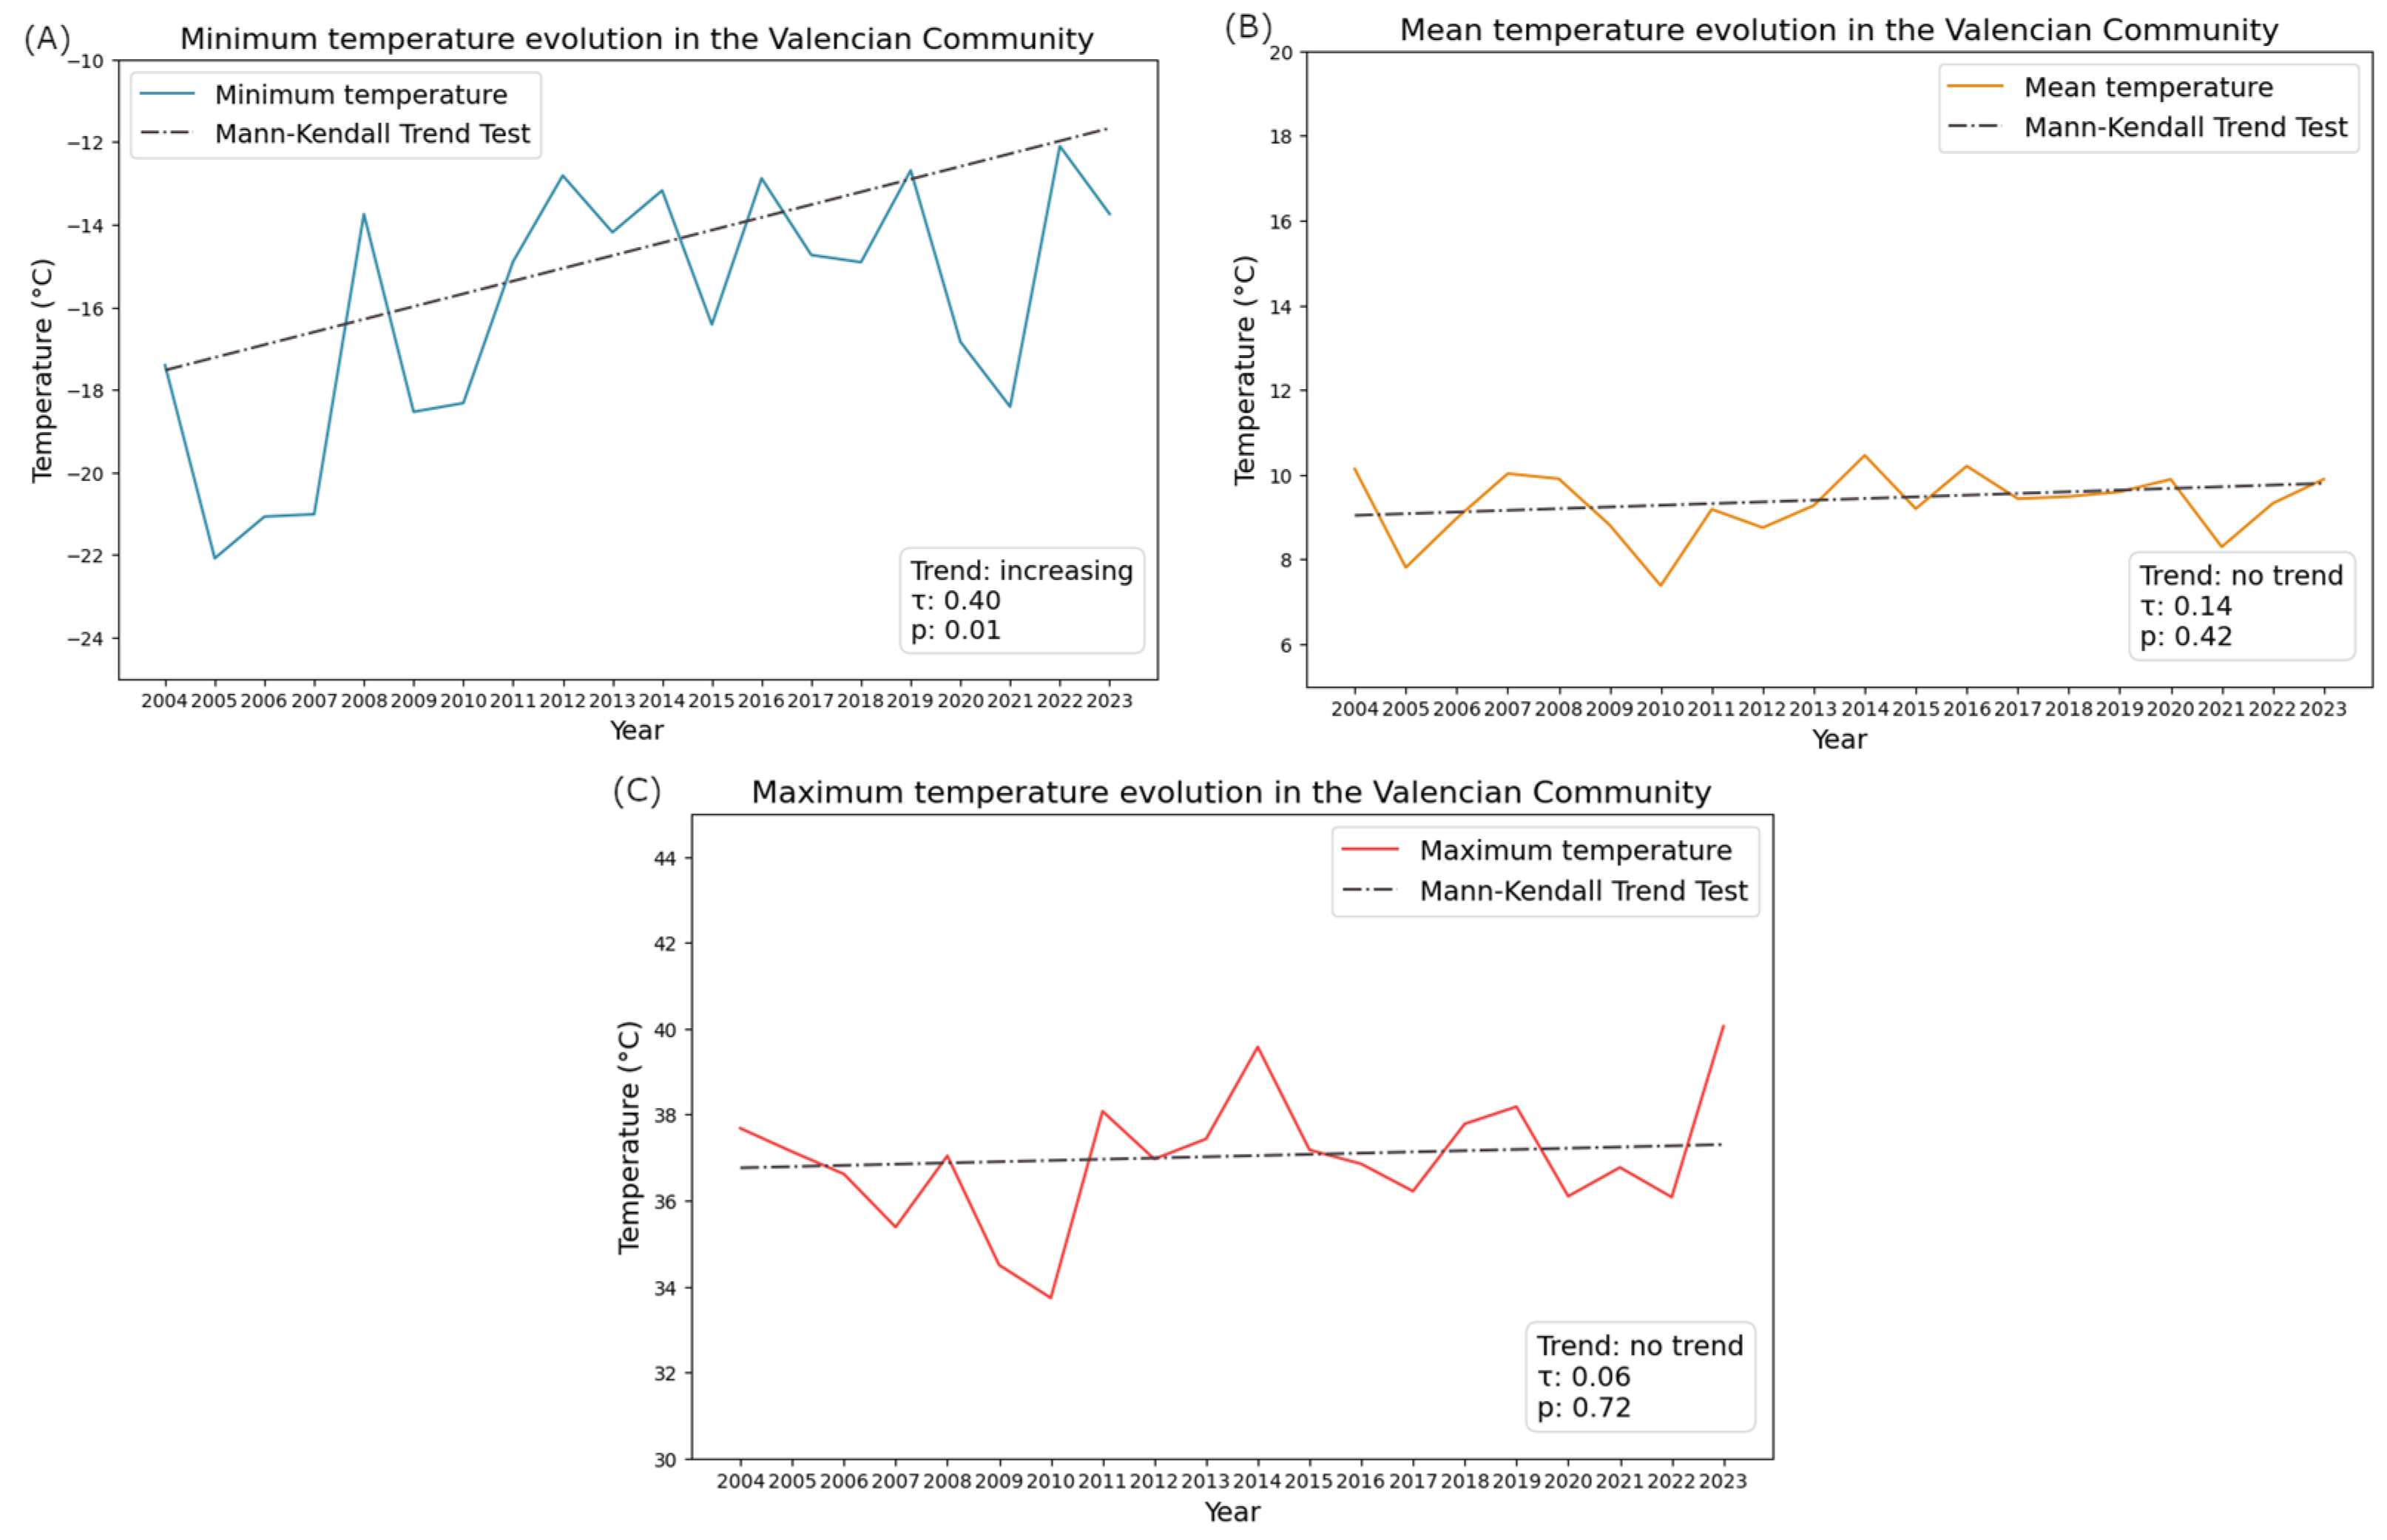
Figure 8 provides a detailed view of the evolution of minimum, mean, and maximum temperatures throughout the entire time series. At first glance, no clear conclusions can be drawn, so the Mann–Kendall trend test was applied to identify potential trends. For this analysis, the annual average of each respective temperature (minimum, mean, and maximum) was used. The test results indicate that the minimum temperature has significantly increased (p < 0.05) (Figure 9), with a “tau” value of 0.40, while the mean and maximum temperatures did not show significant differences.

Figure 8.
Evolution of the annual average minimum, mean, and maximum land surface temperature in the Valencian Community from 2004 to 2023.
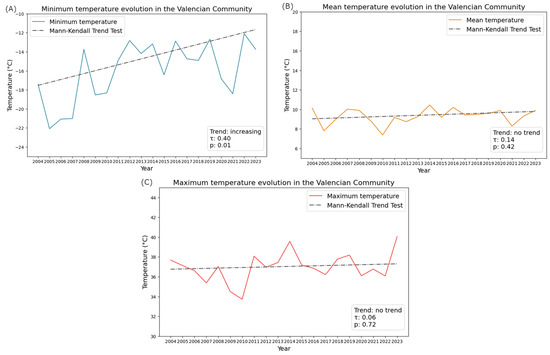
Figure 9.
Evolution of the annual average minimum (A), mean (B), and maximum (C) land surface temperature in the Valencian Community from 2004 to 2023. The figures include the results of the Mann–Kendall trend test and its corresponding regression line.
To account for the seasonality of the data, the seasonal Kendall trend test was also conducted. This test considers the differences between months and their trends over the years. The results indicate an upward trend in minimum, mean, and maximum temperatures, with “tau” values of 0.21, 0.27, and 0.16, respectively.
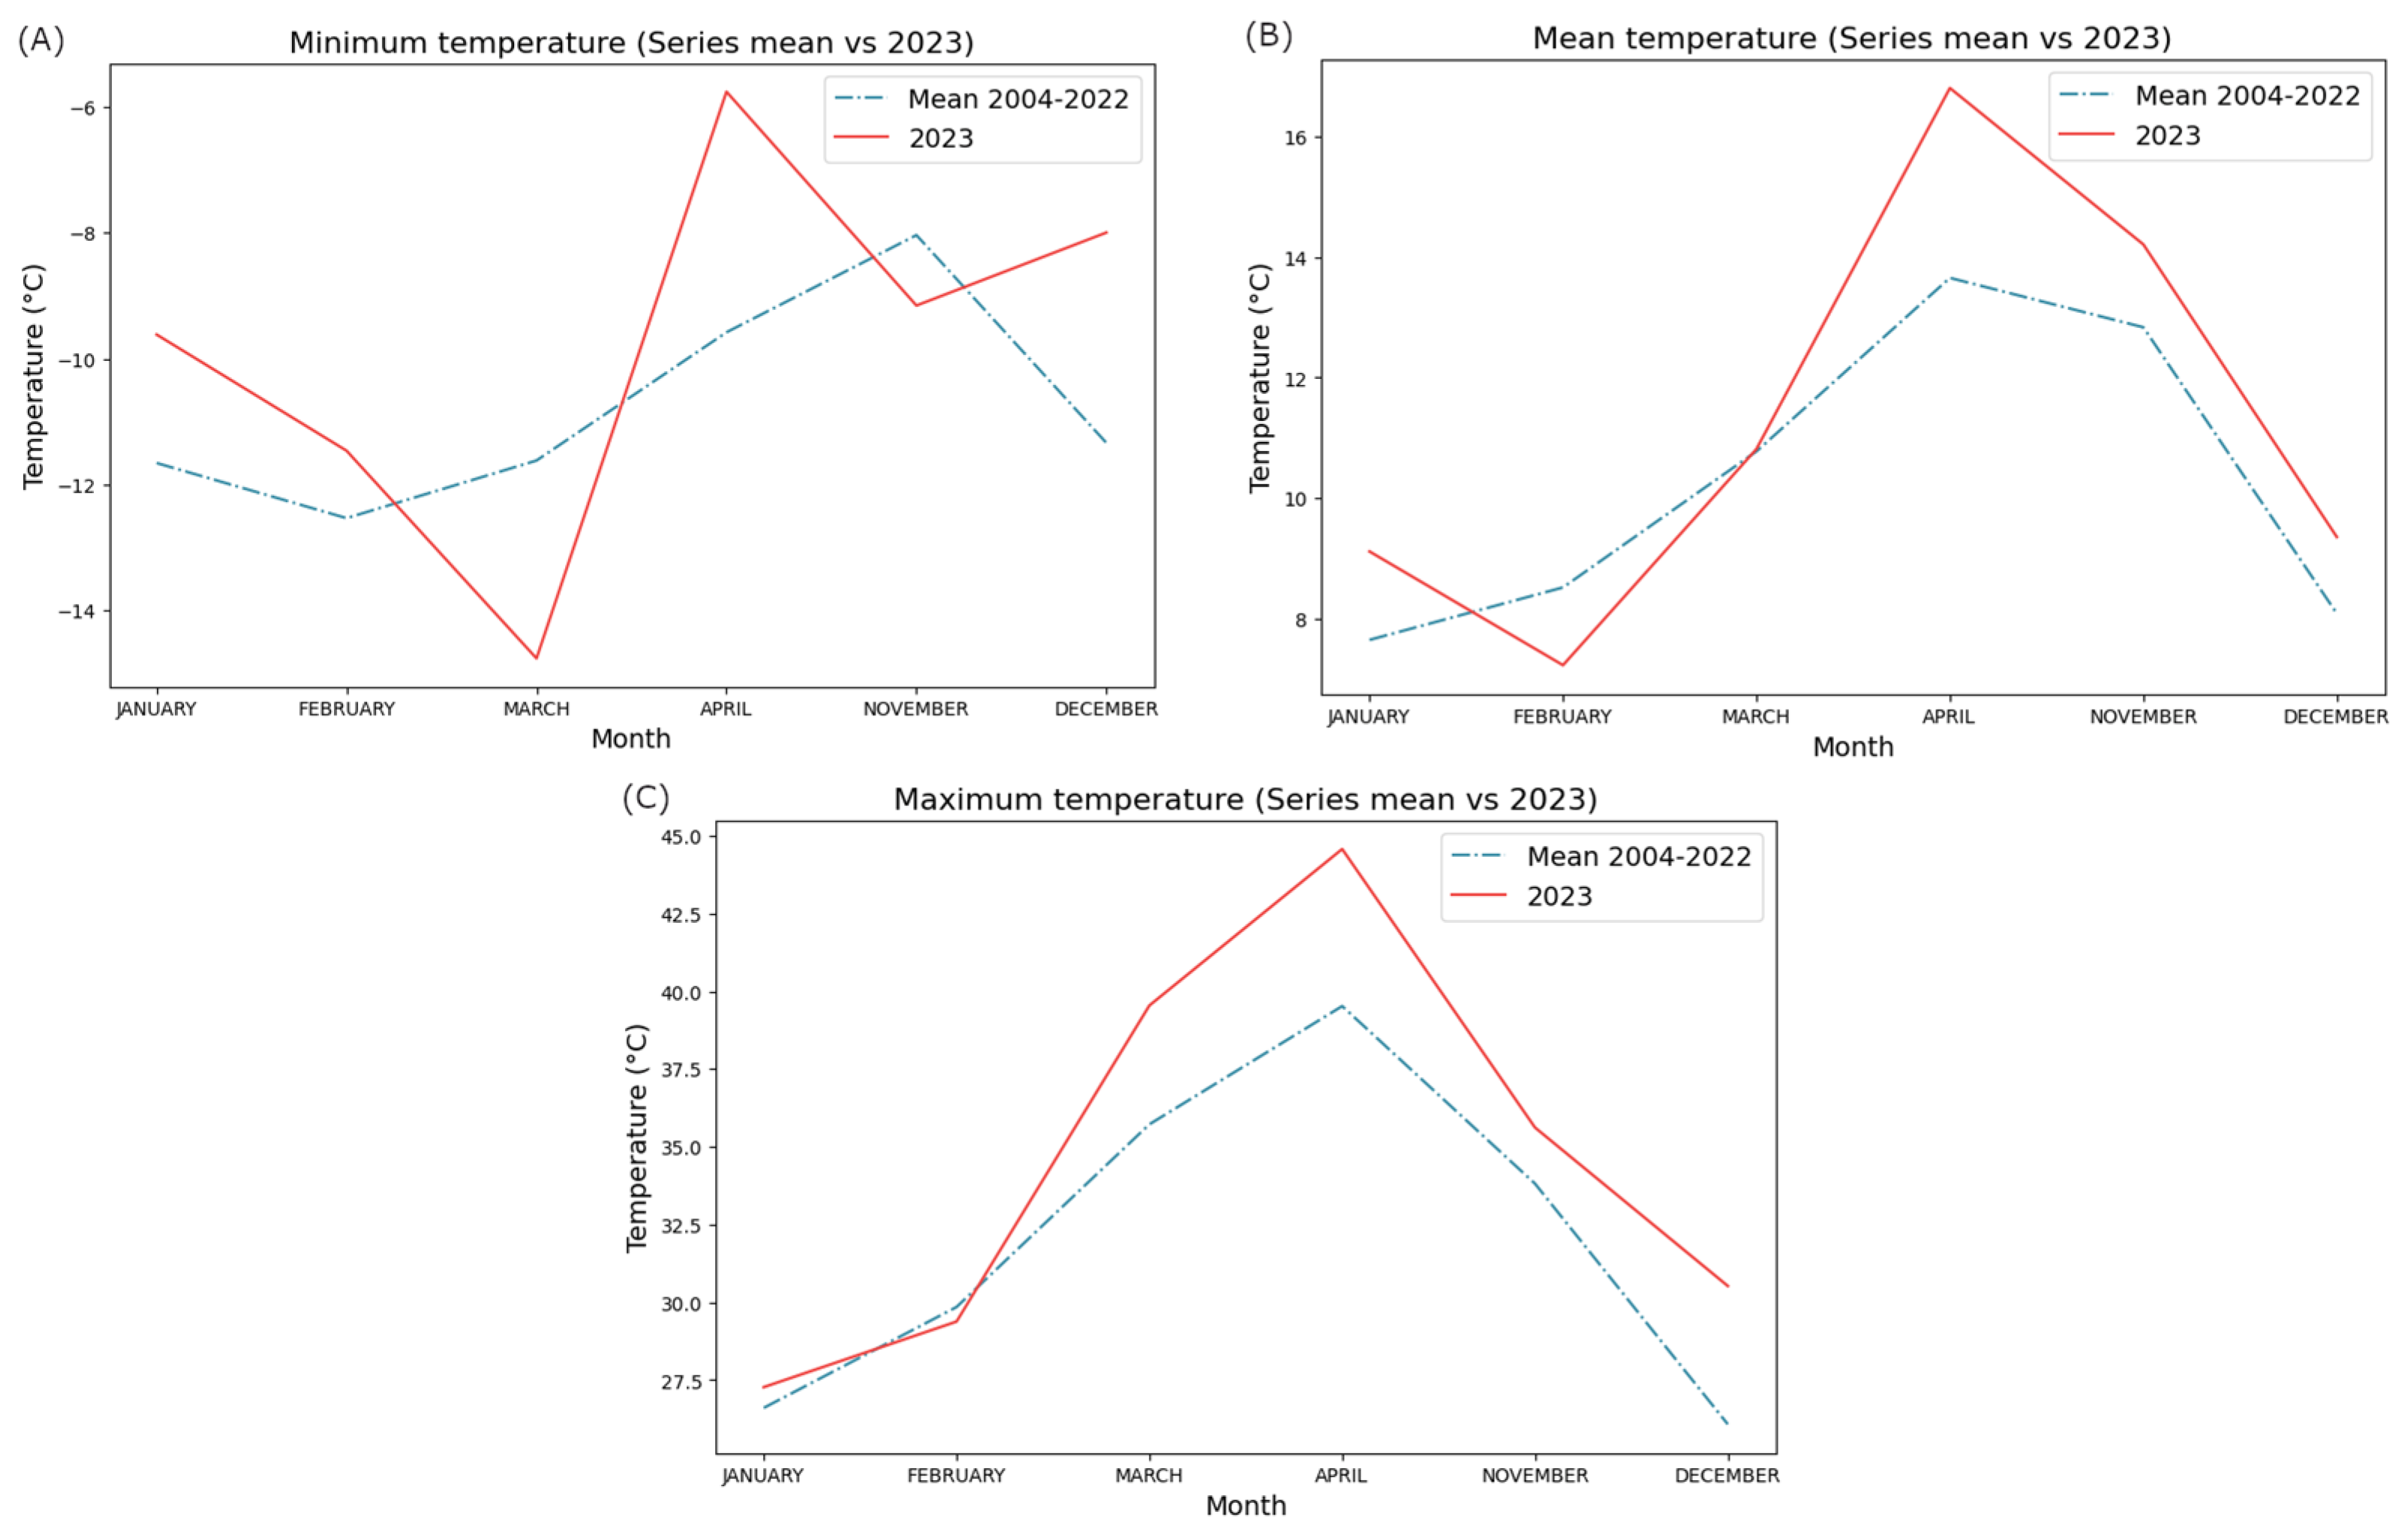
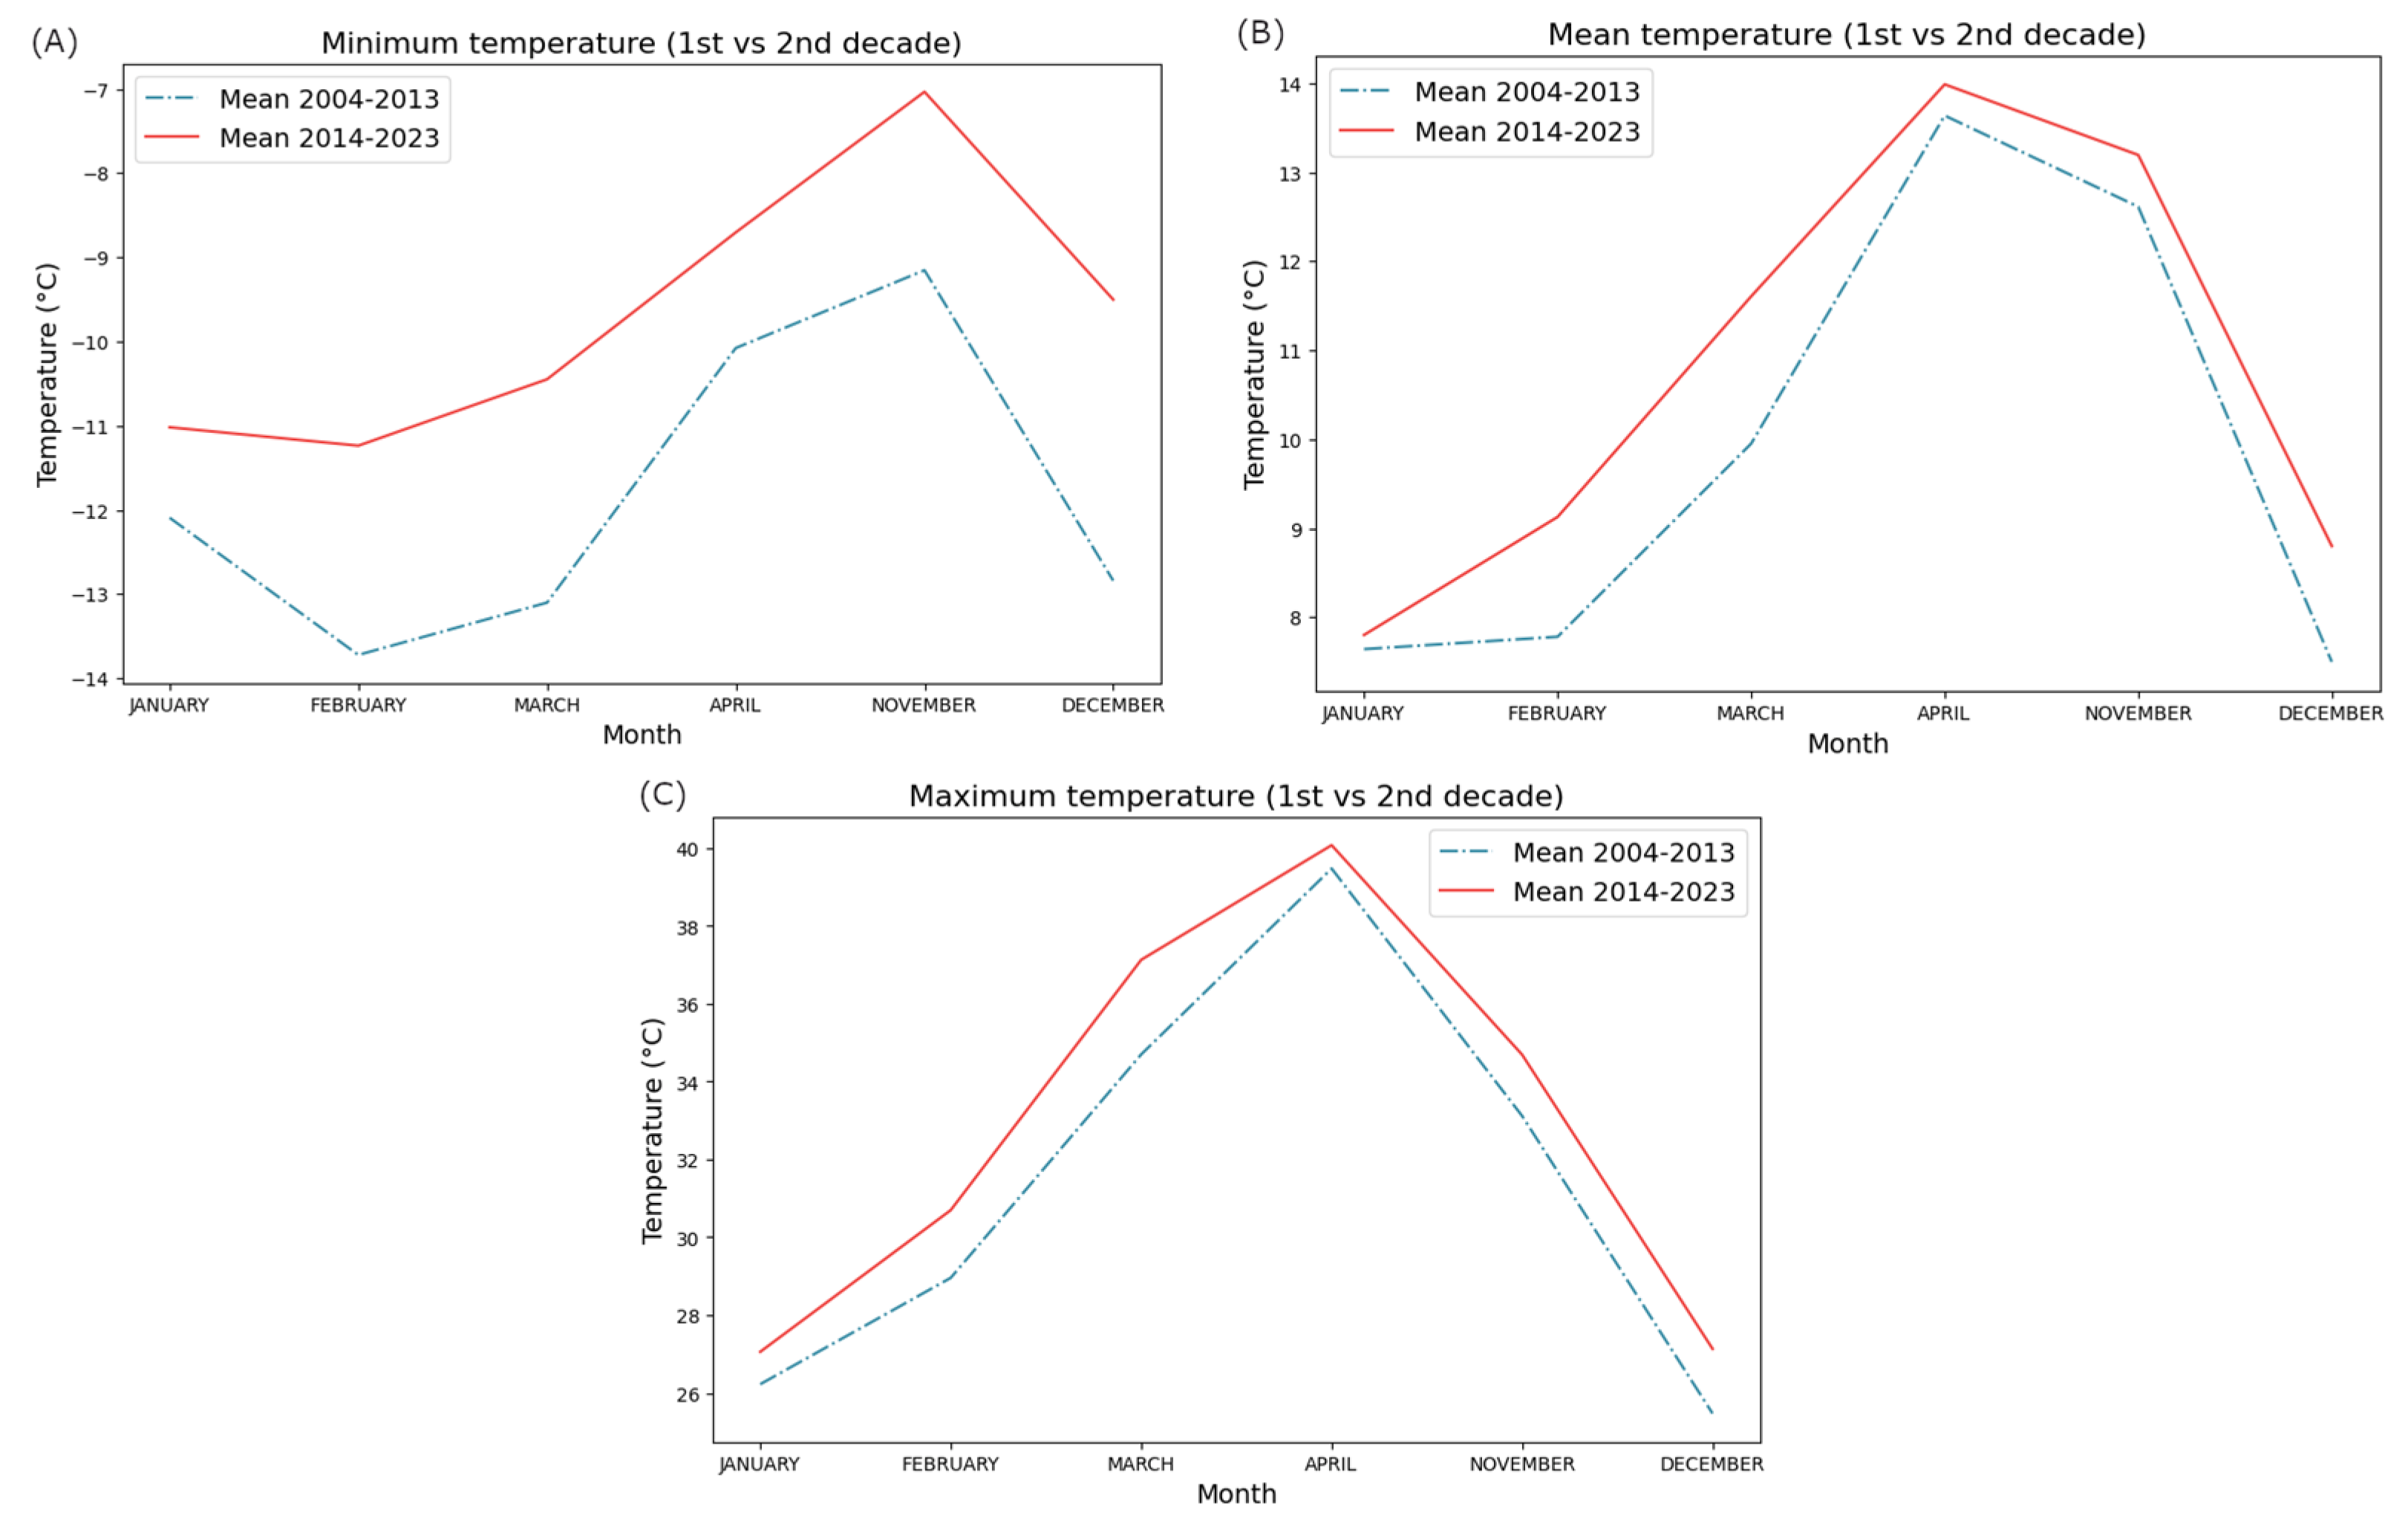
The temperature anomalies for 2023 were then compared to the rest of the time series for minimum, mean, and maximum temperatures (Figure 10). It was observed that in all three cases, the temperatures were higher for most months, confirming that 2023 was an exceptionally warm year. Additionally, a comparison between the decades 2004–2013 and 2014–2023 (Figure 11) revealed that temperatures were consistently higher in the latter decade across all cases.
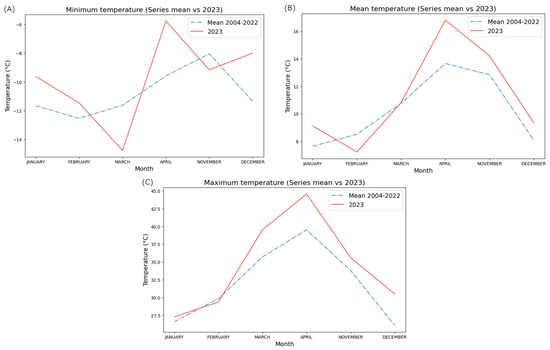
Figure 10.
Comparison of the minimum (A), mean (B), and maximum (C) land surface temperatures measured in 2023, with the average minimum, mean, and maximum temperatures from 2004 to 2022 across the Valencian Community.
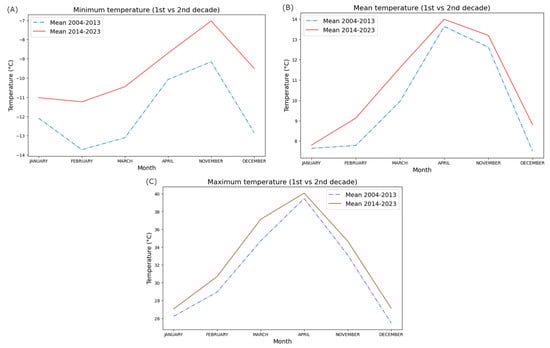
Figure 11.
Comparison of the average minimum (A), mean (B), and maximum (C) land surface temperatures measured in the first decade (2004–2013) with those measured in the second decade (2014–2023) of the study period, across the Valencian Community.
3.4. Methodology Application on the Entire Valencian Community
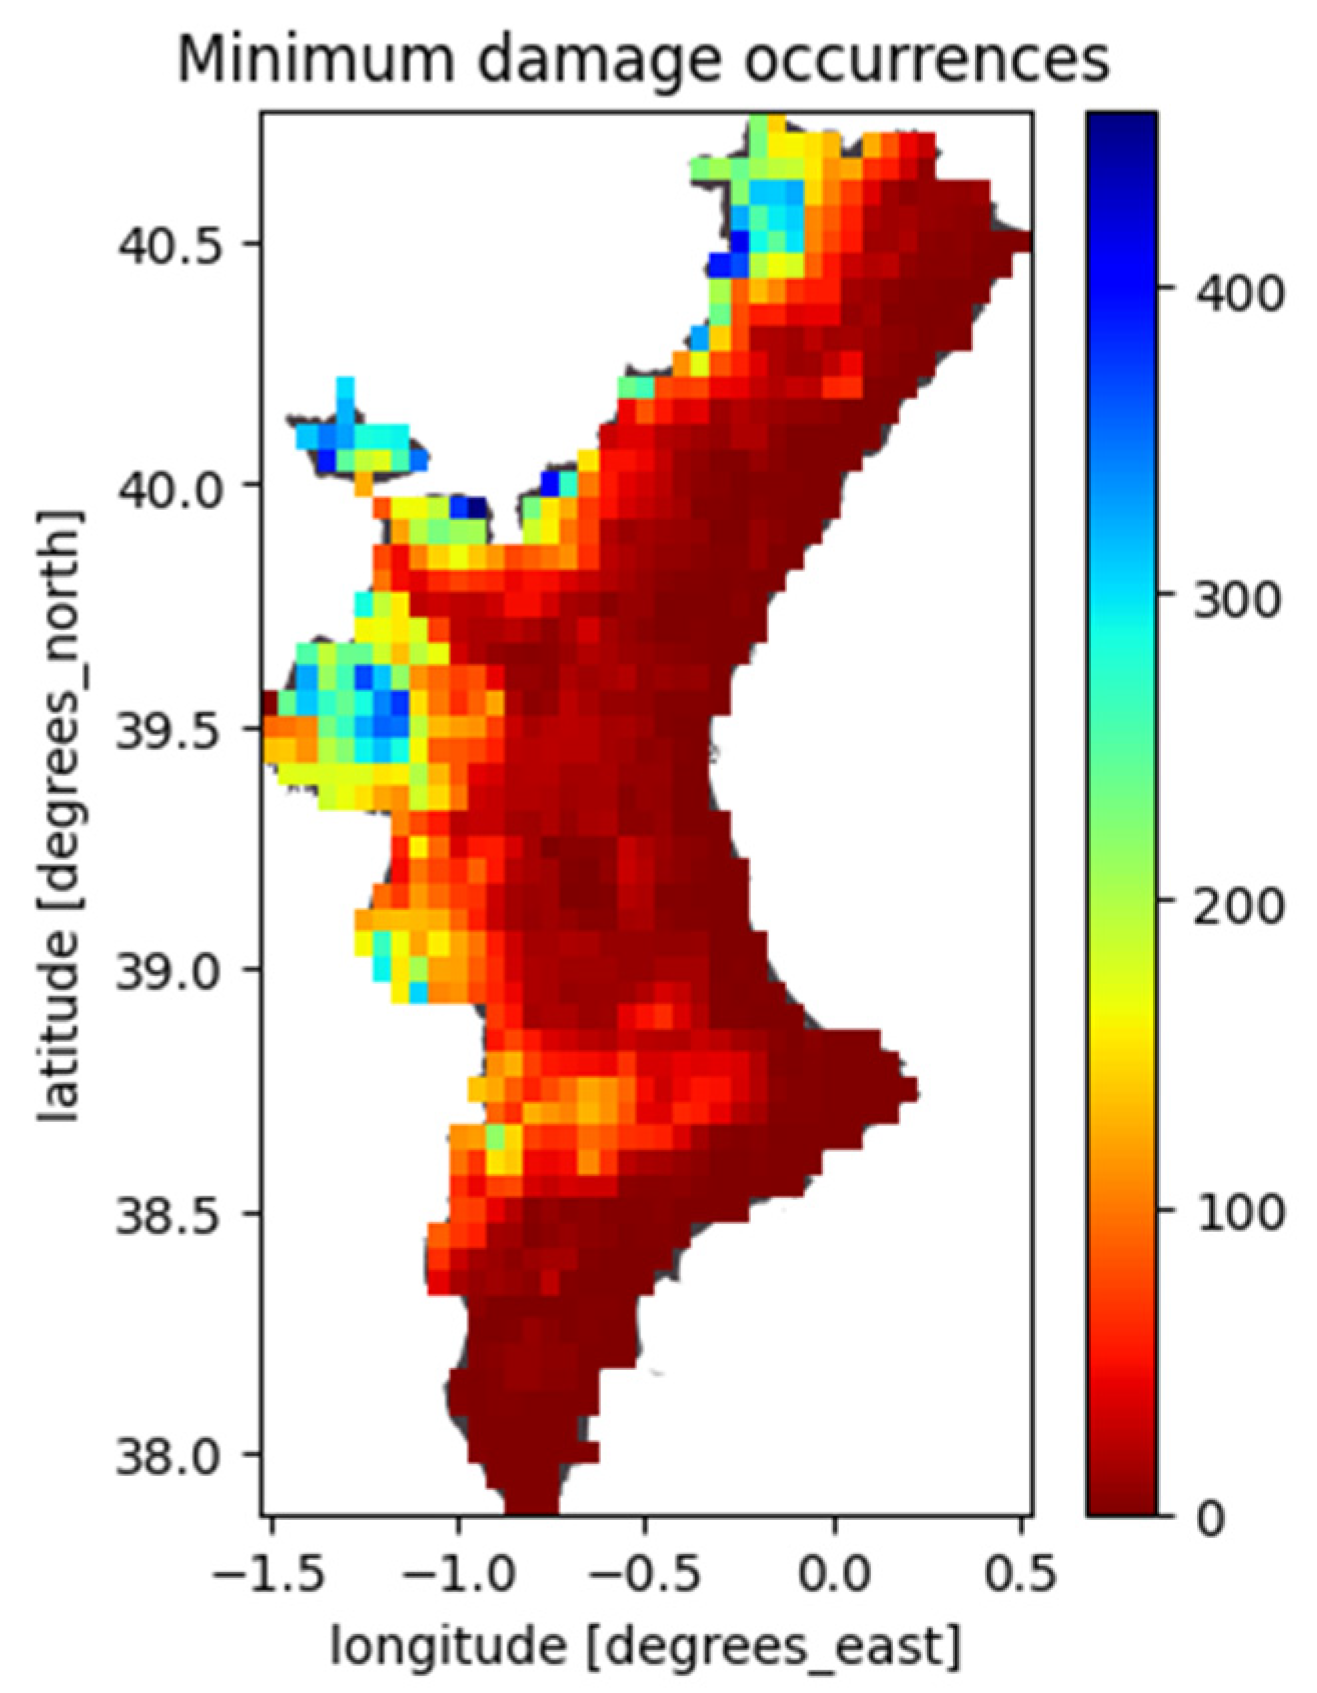
Subsequently, we determined the number of times each pixel’s temperature fell below the first threshold of −2.3 °C for more than 3 h (the minimum damage threshold according to our methodology) throughout the study period (Figure 12). This value represents the maximum number of occurrences where crops could have sustained damage over the past 20 years and allows us to assess which areas of the Valencian Community are most at risk for frost damage. It is observed that the region of the Community where these occurrences are most frequent is in the northwest, with some areas exceeding 400 occurrences in total. In contrast, along the coast, such a pronounced effect is not detected. In terms of coverage, frost events have been recorded in 87.7% of the Community extent over the last two decades.

Figure 12.
Map of the occurrence of the minimum damage detectable with the methodology proposed in this paper during the period 2004–2023 across the Valencian Community.
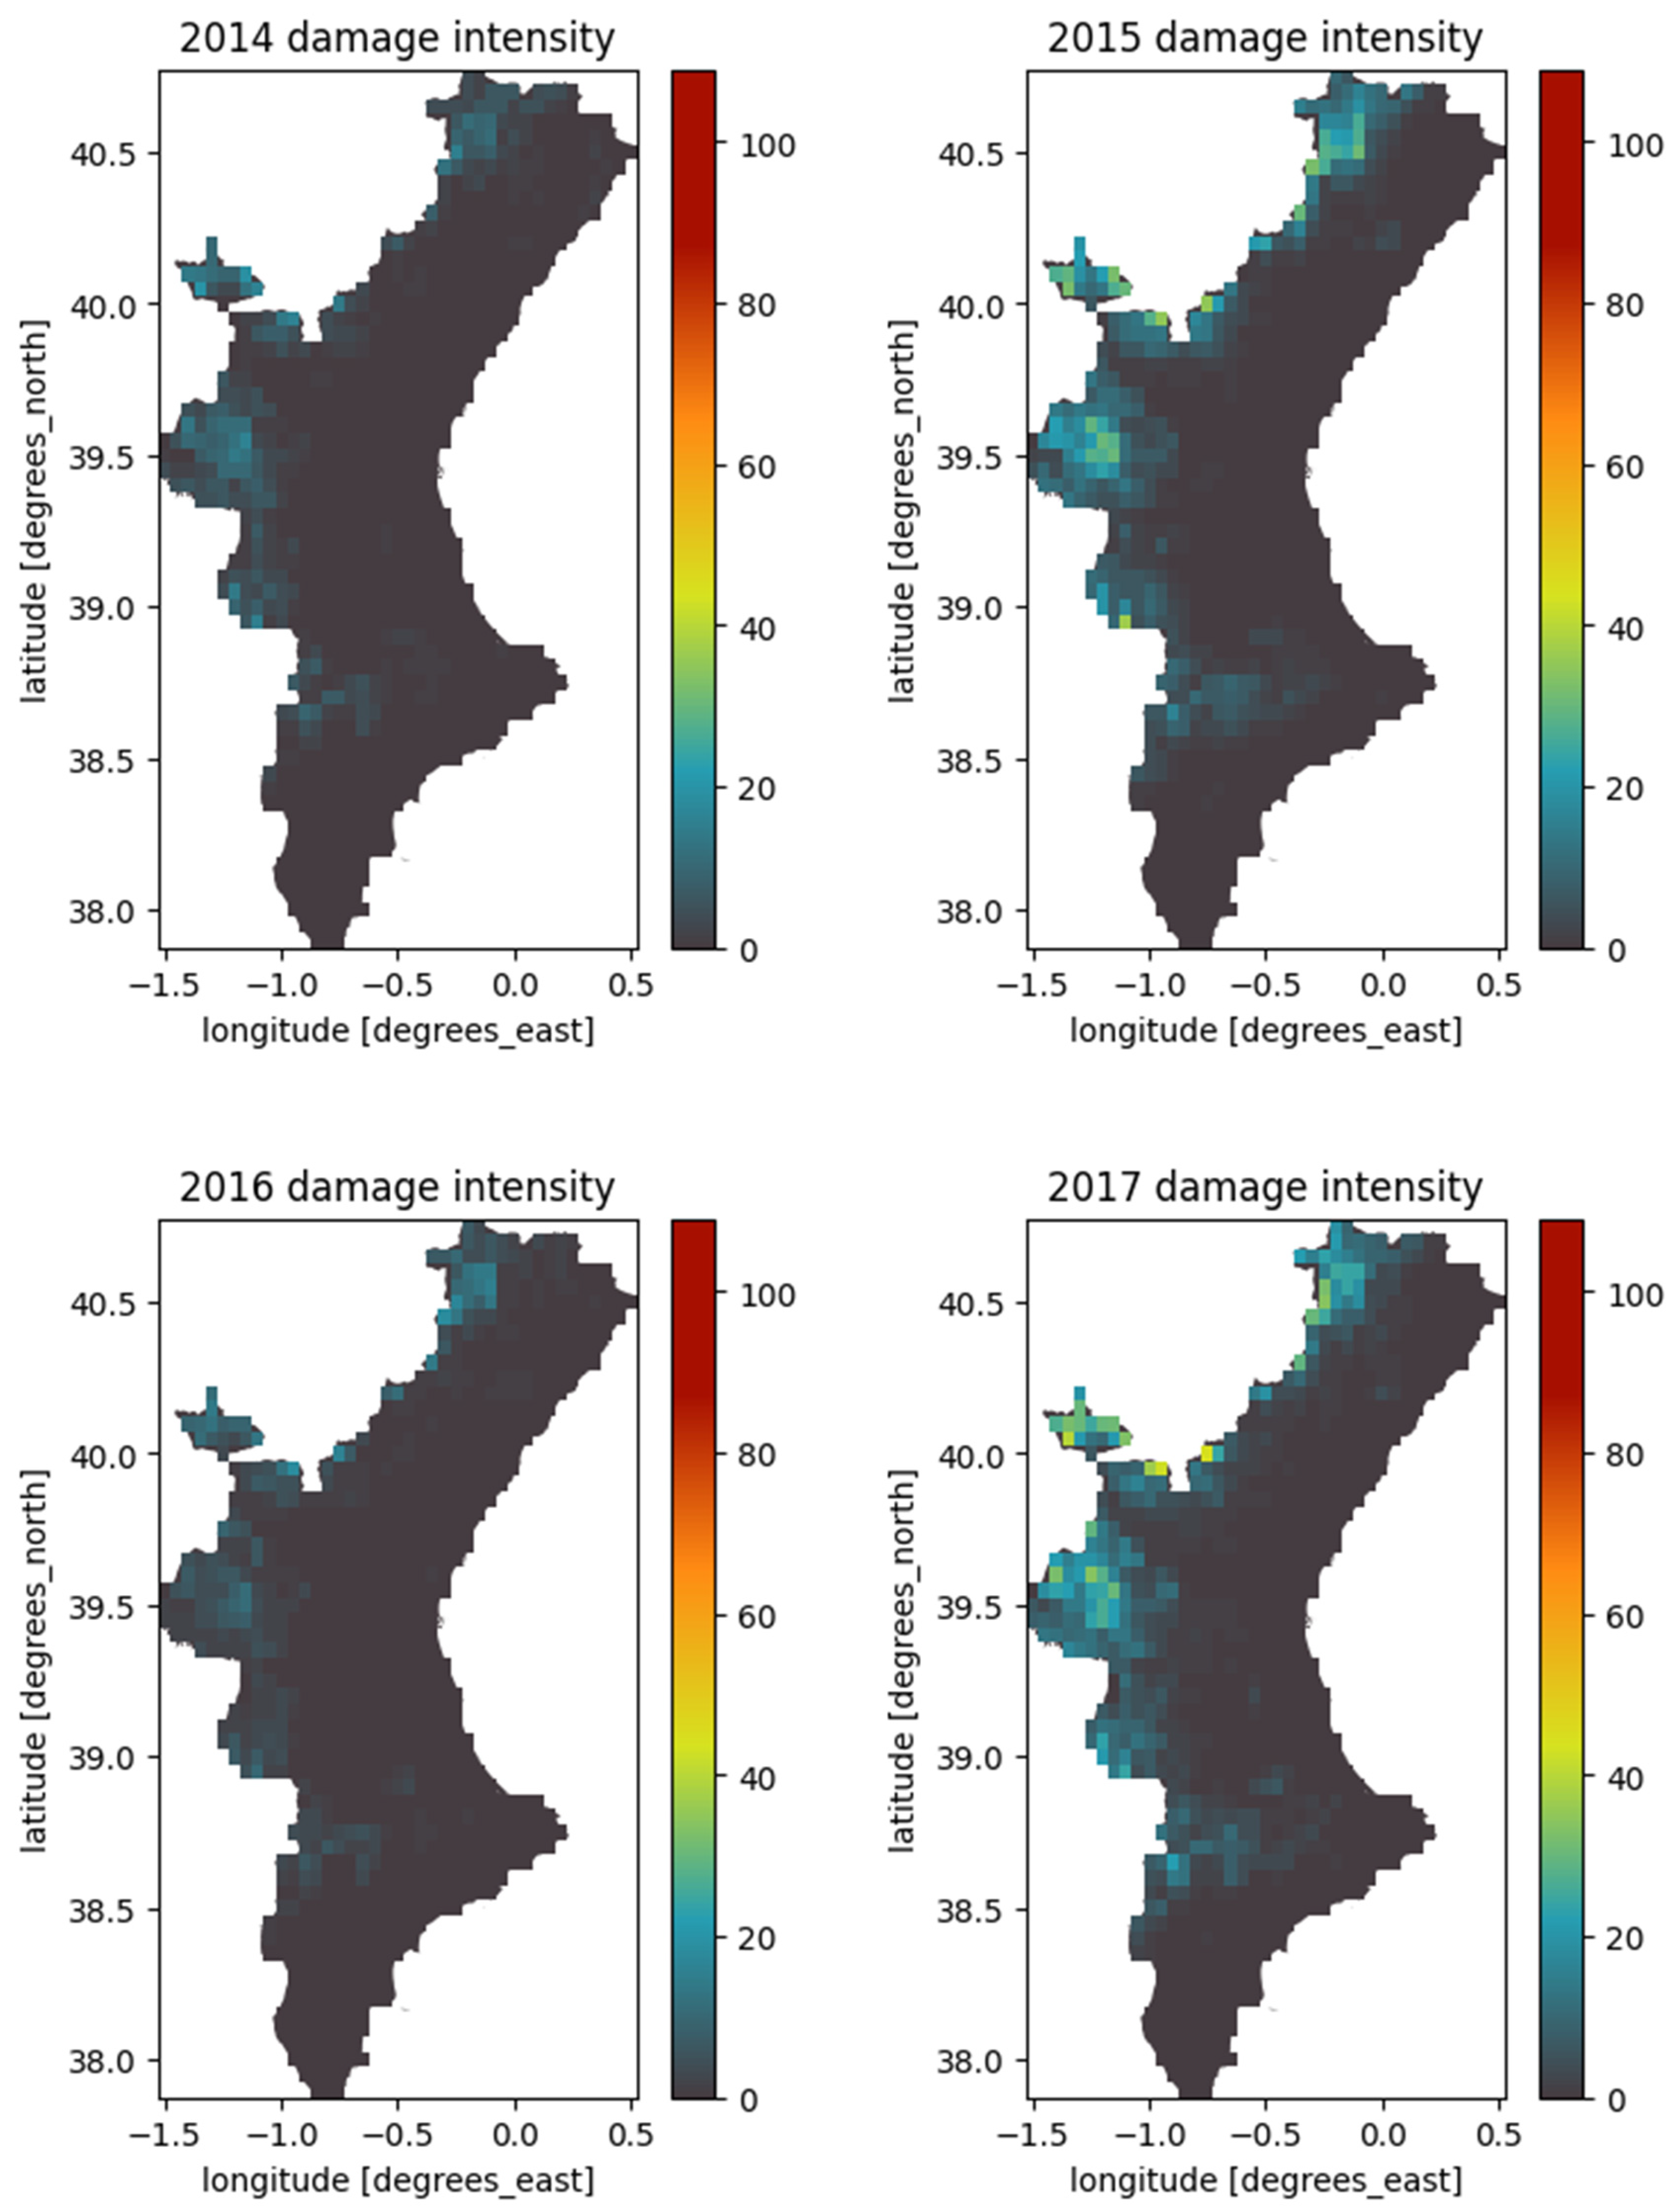
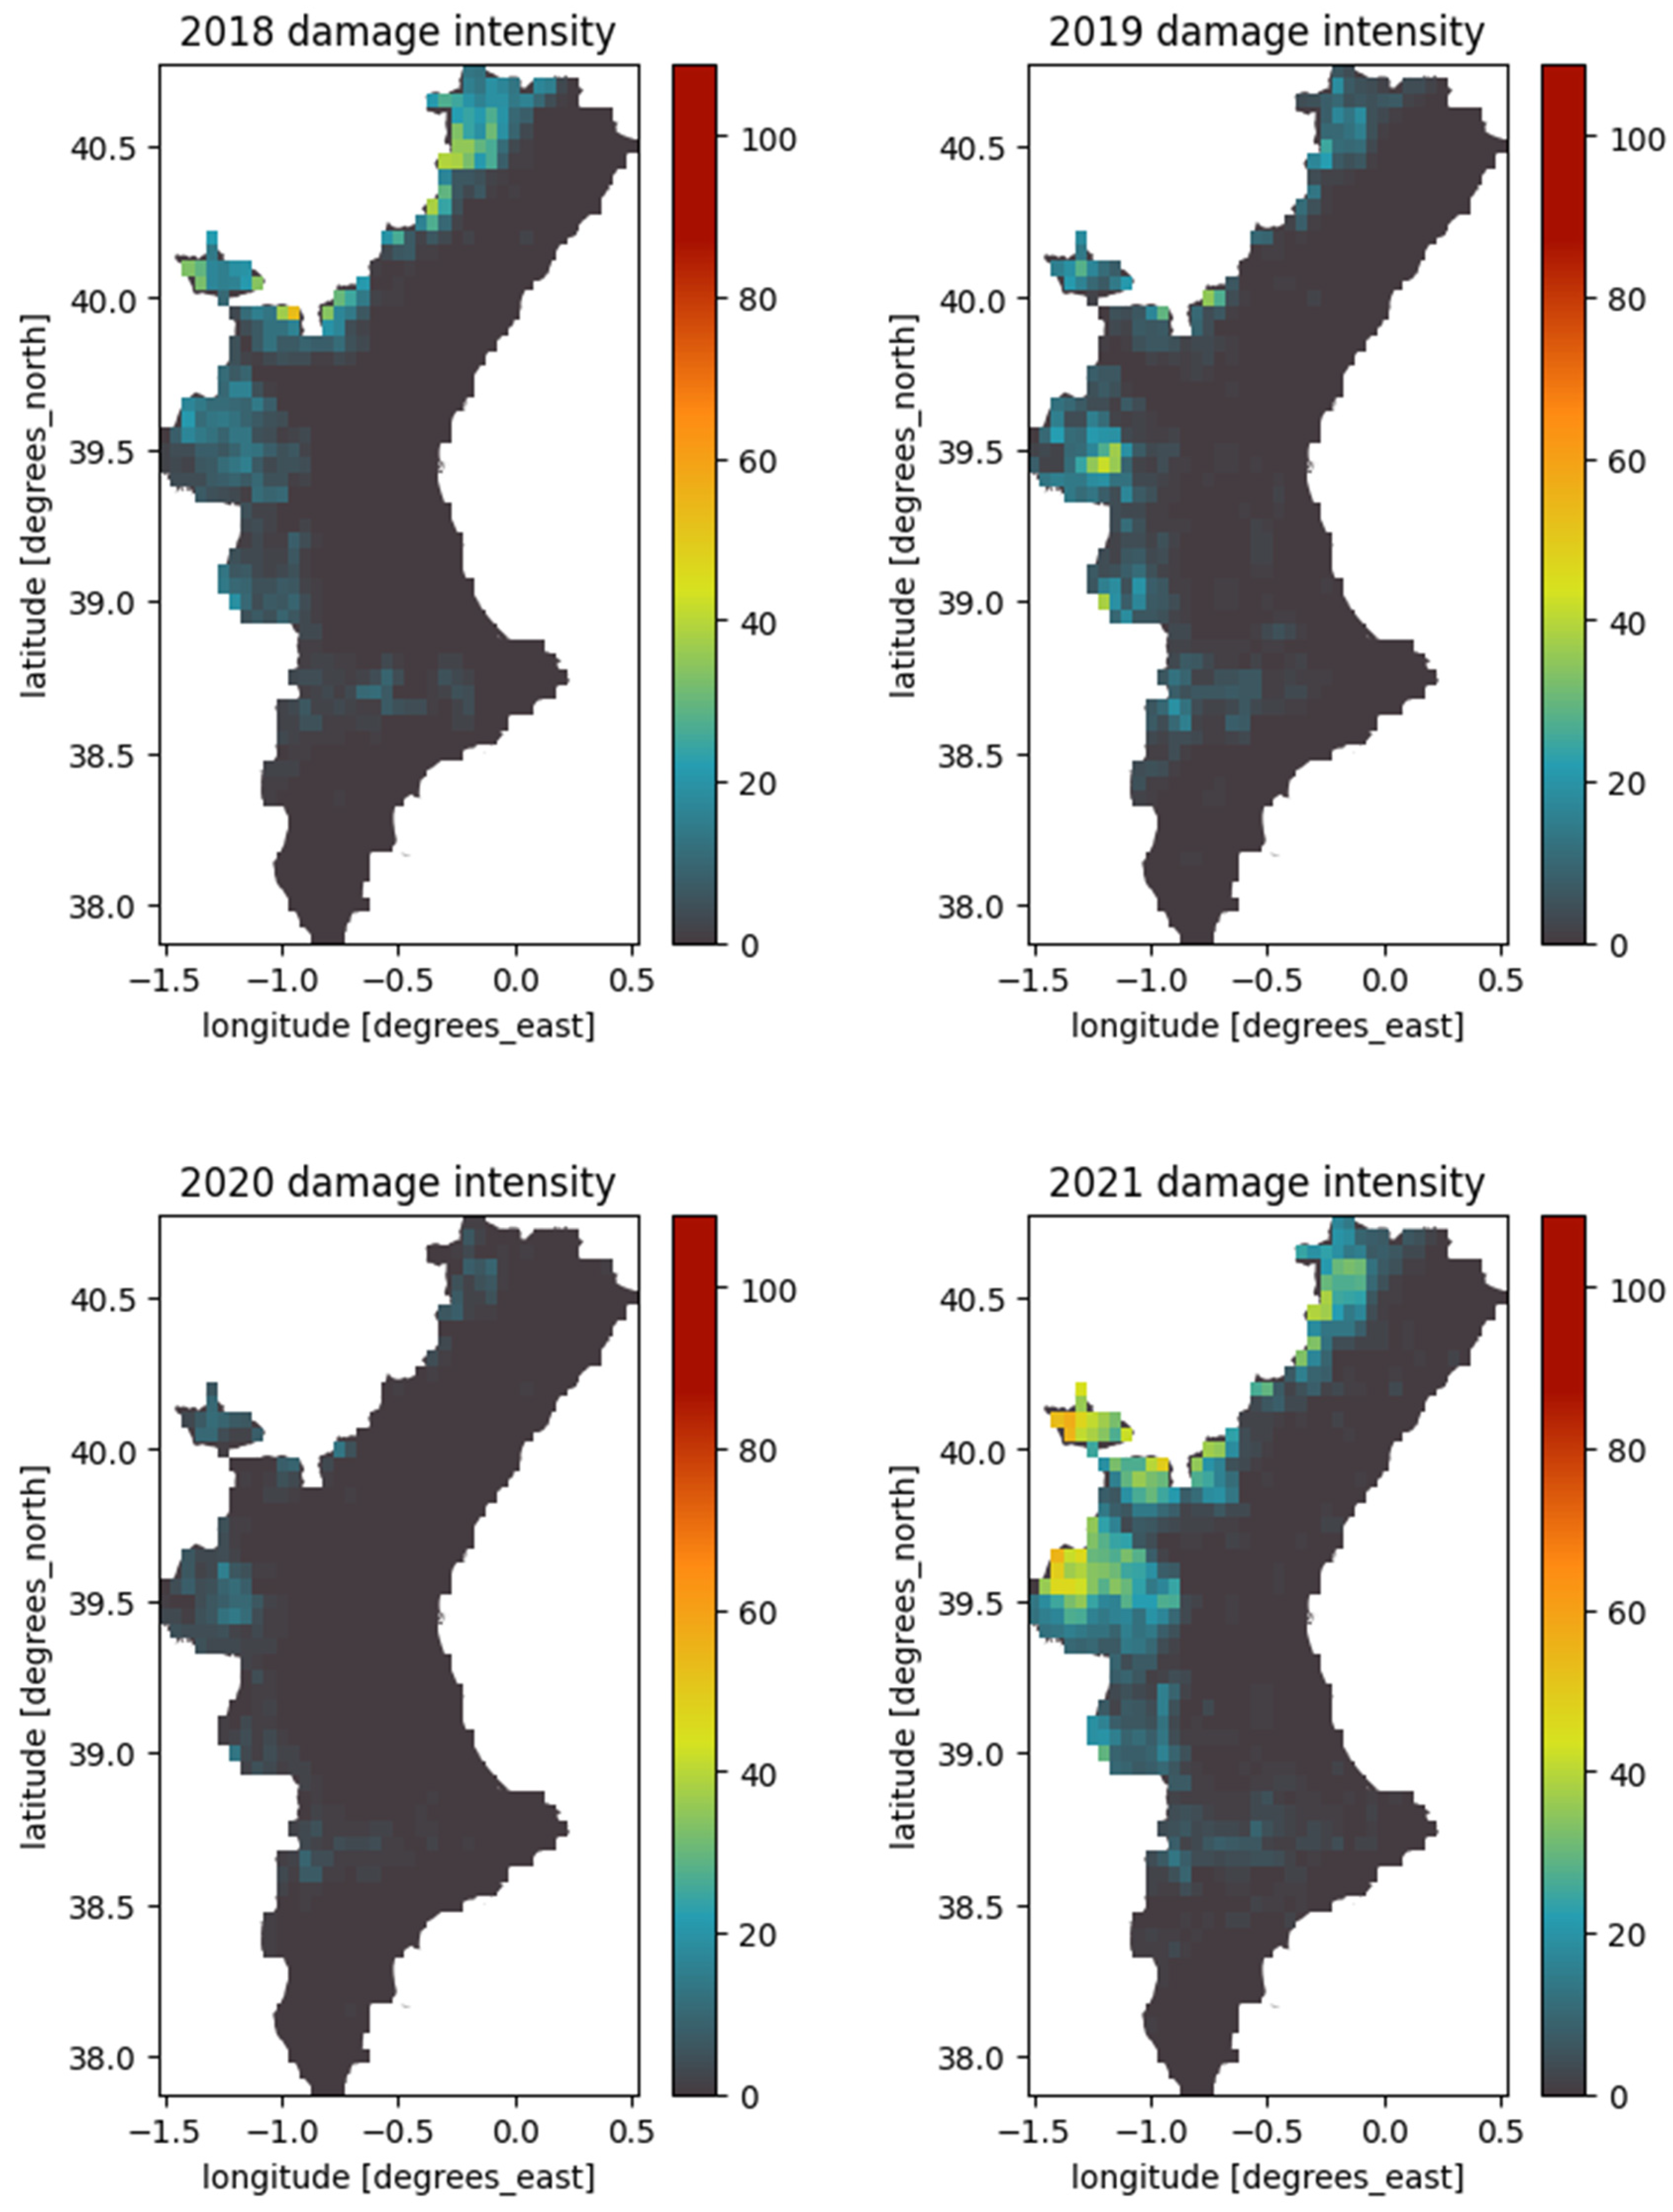
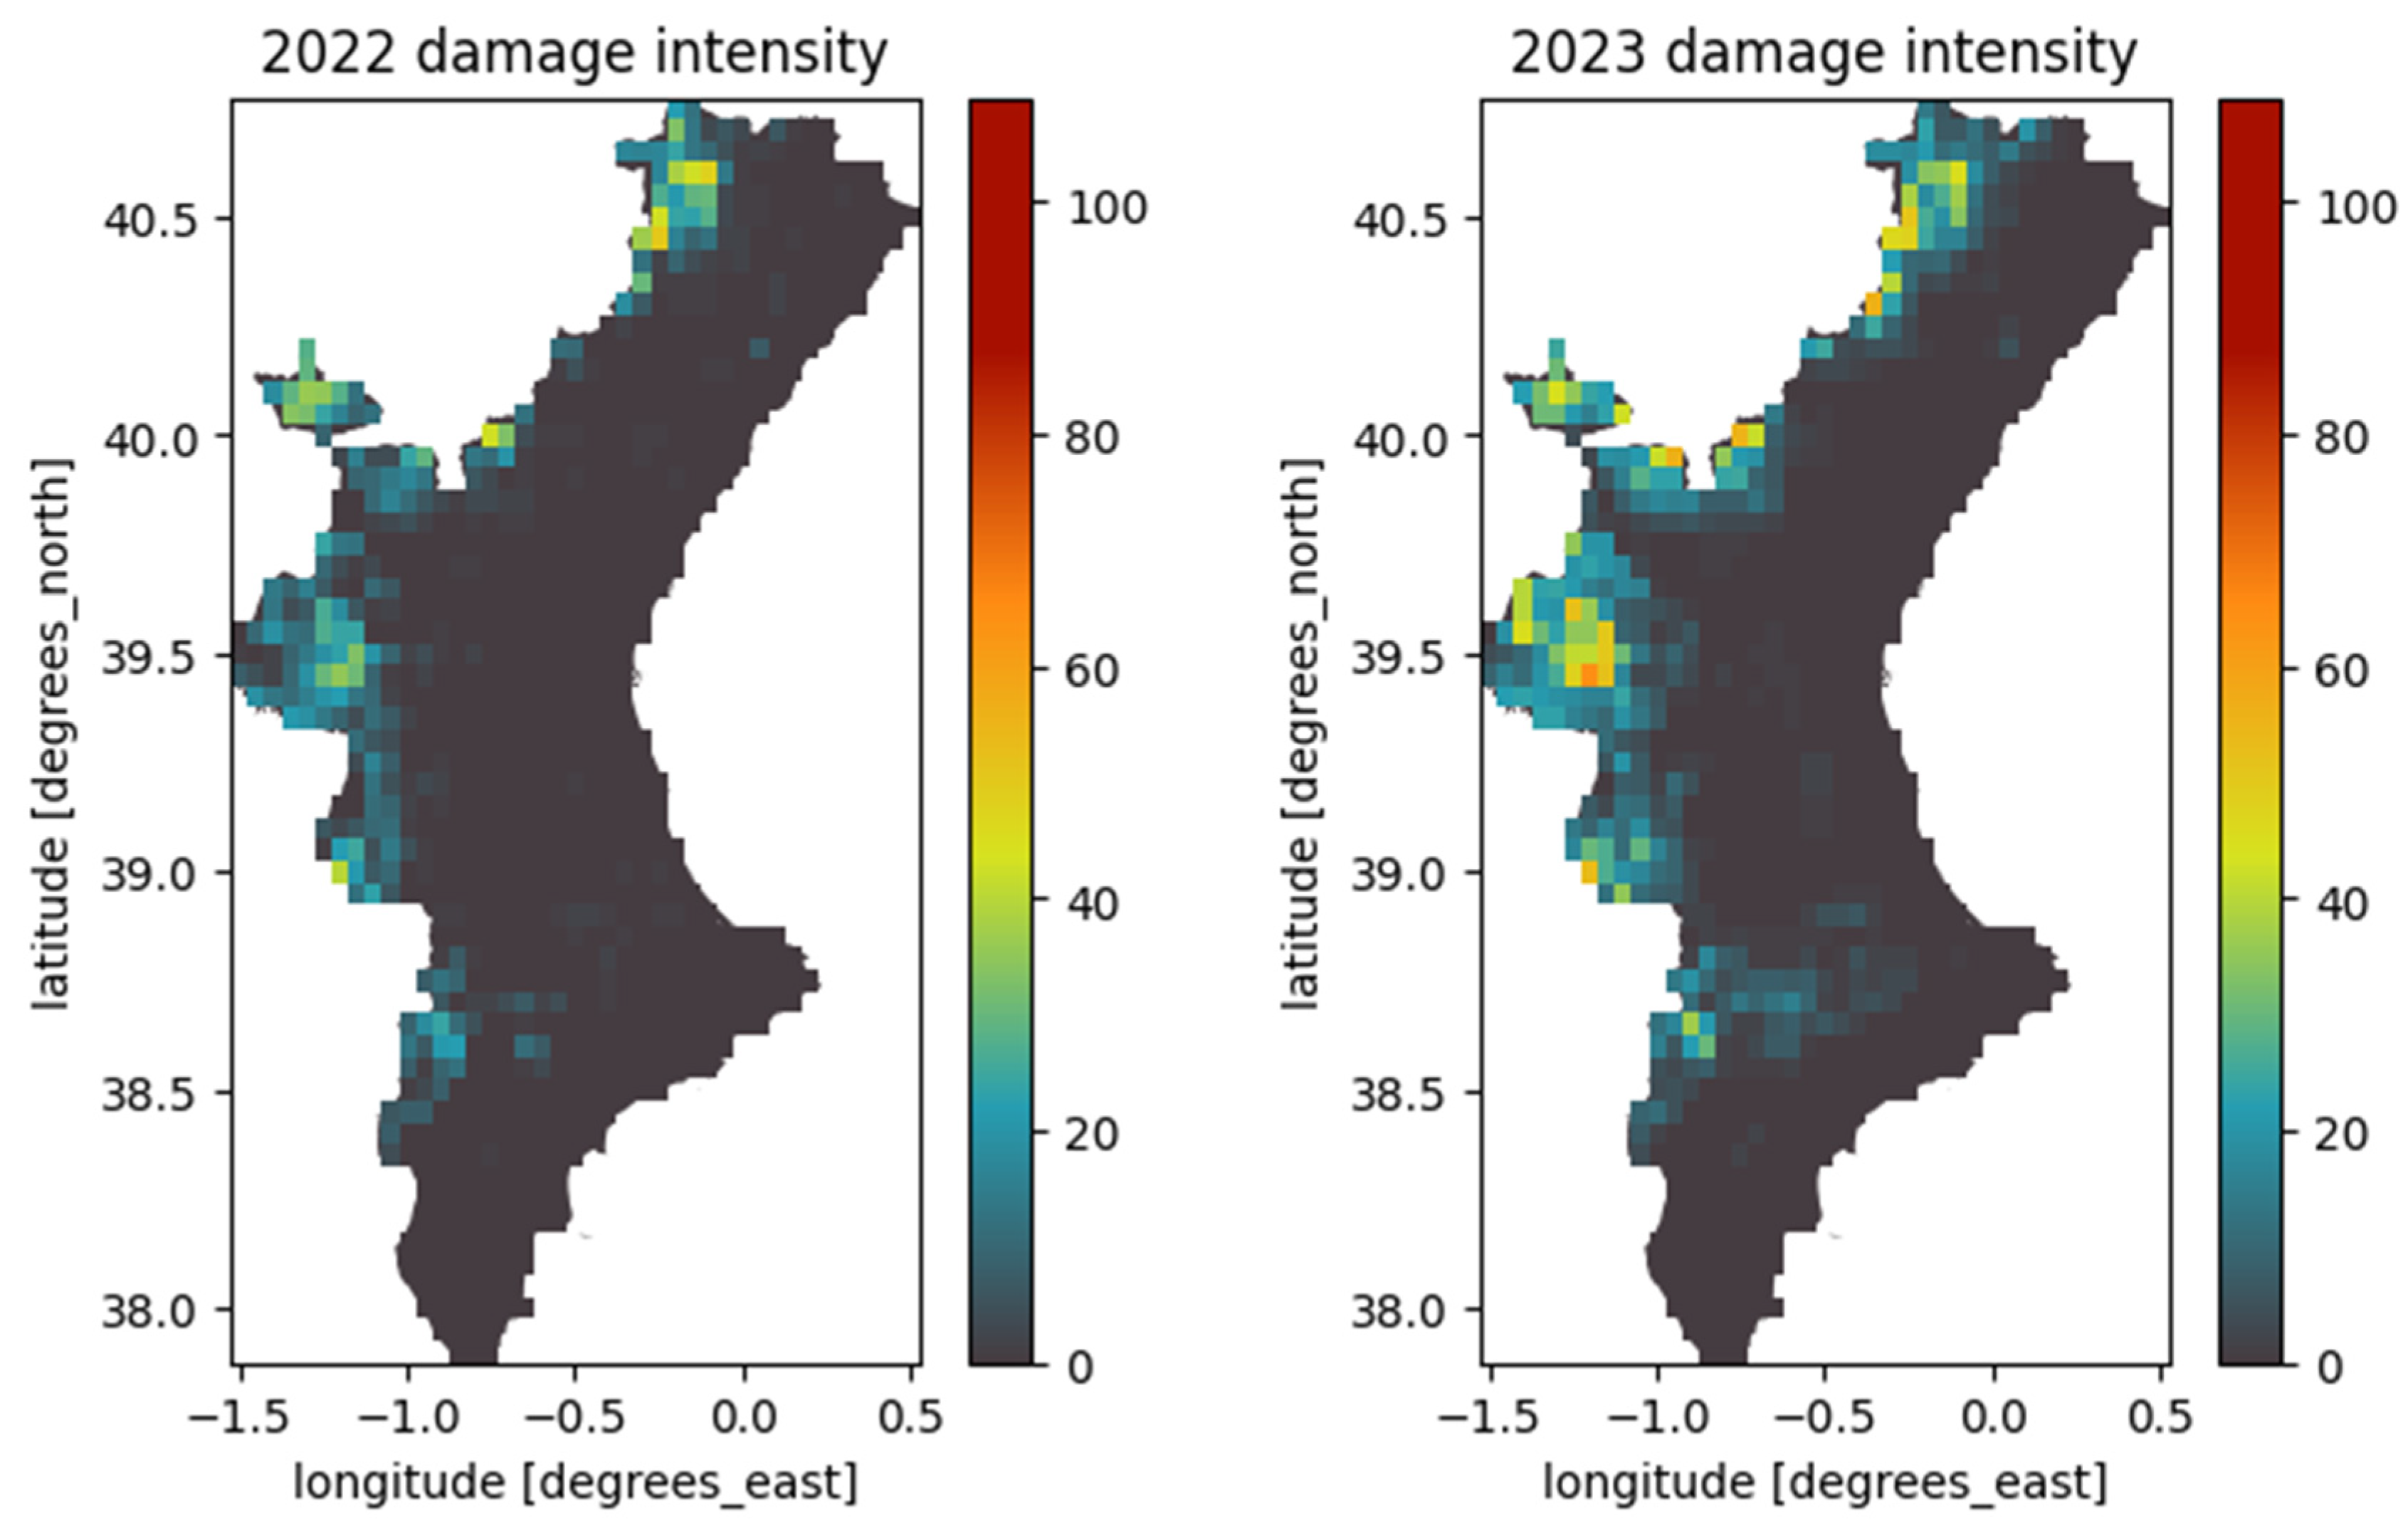
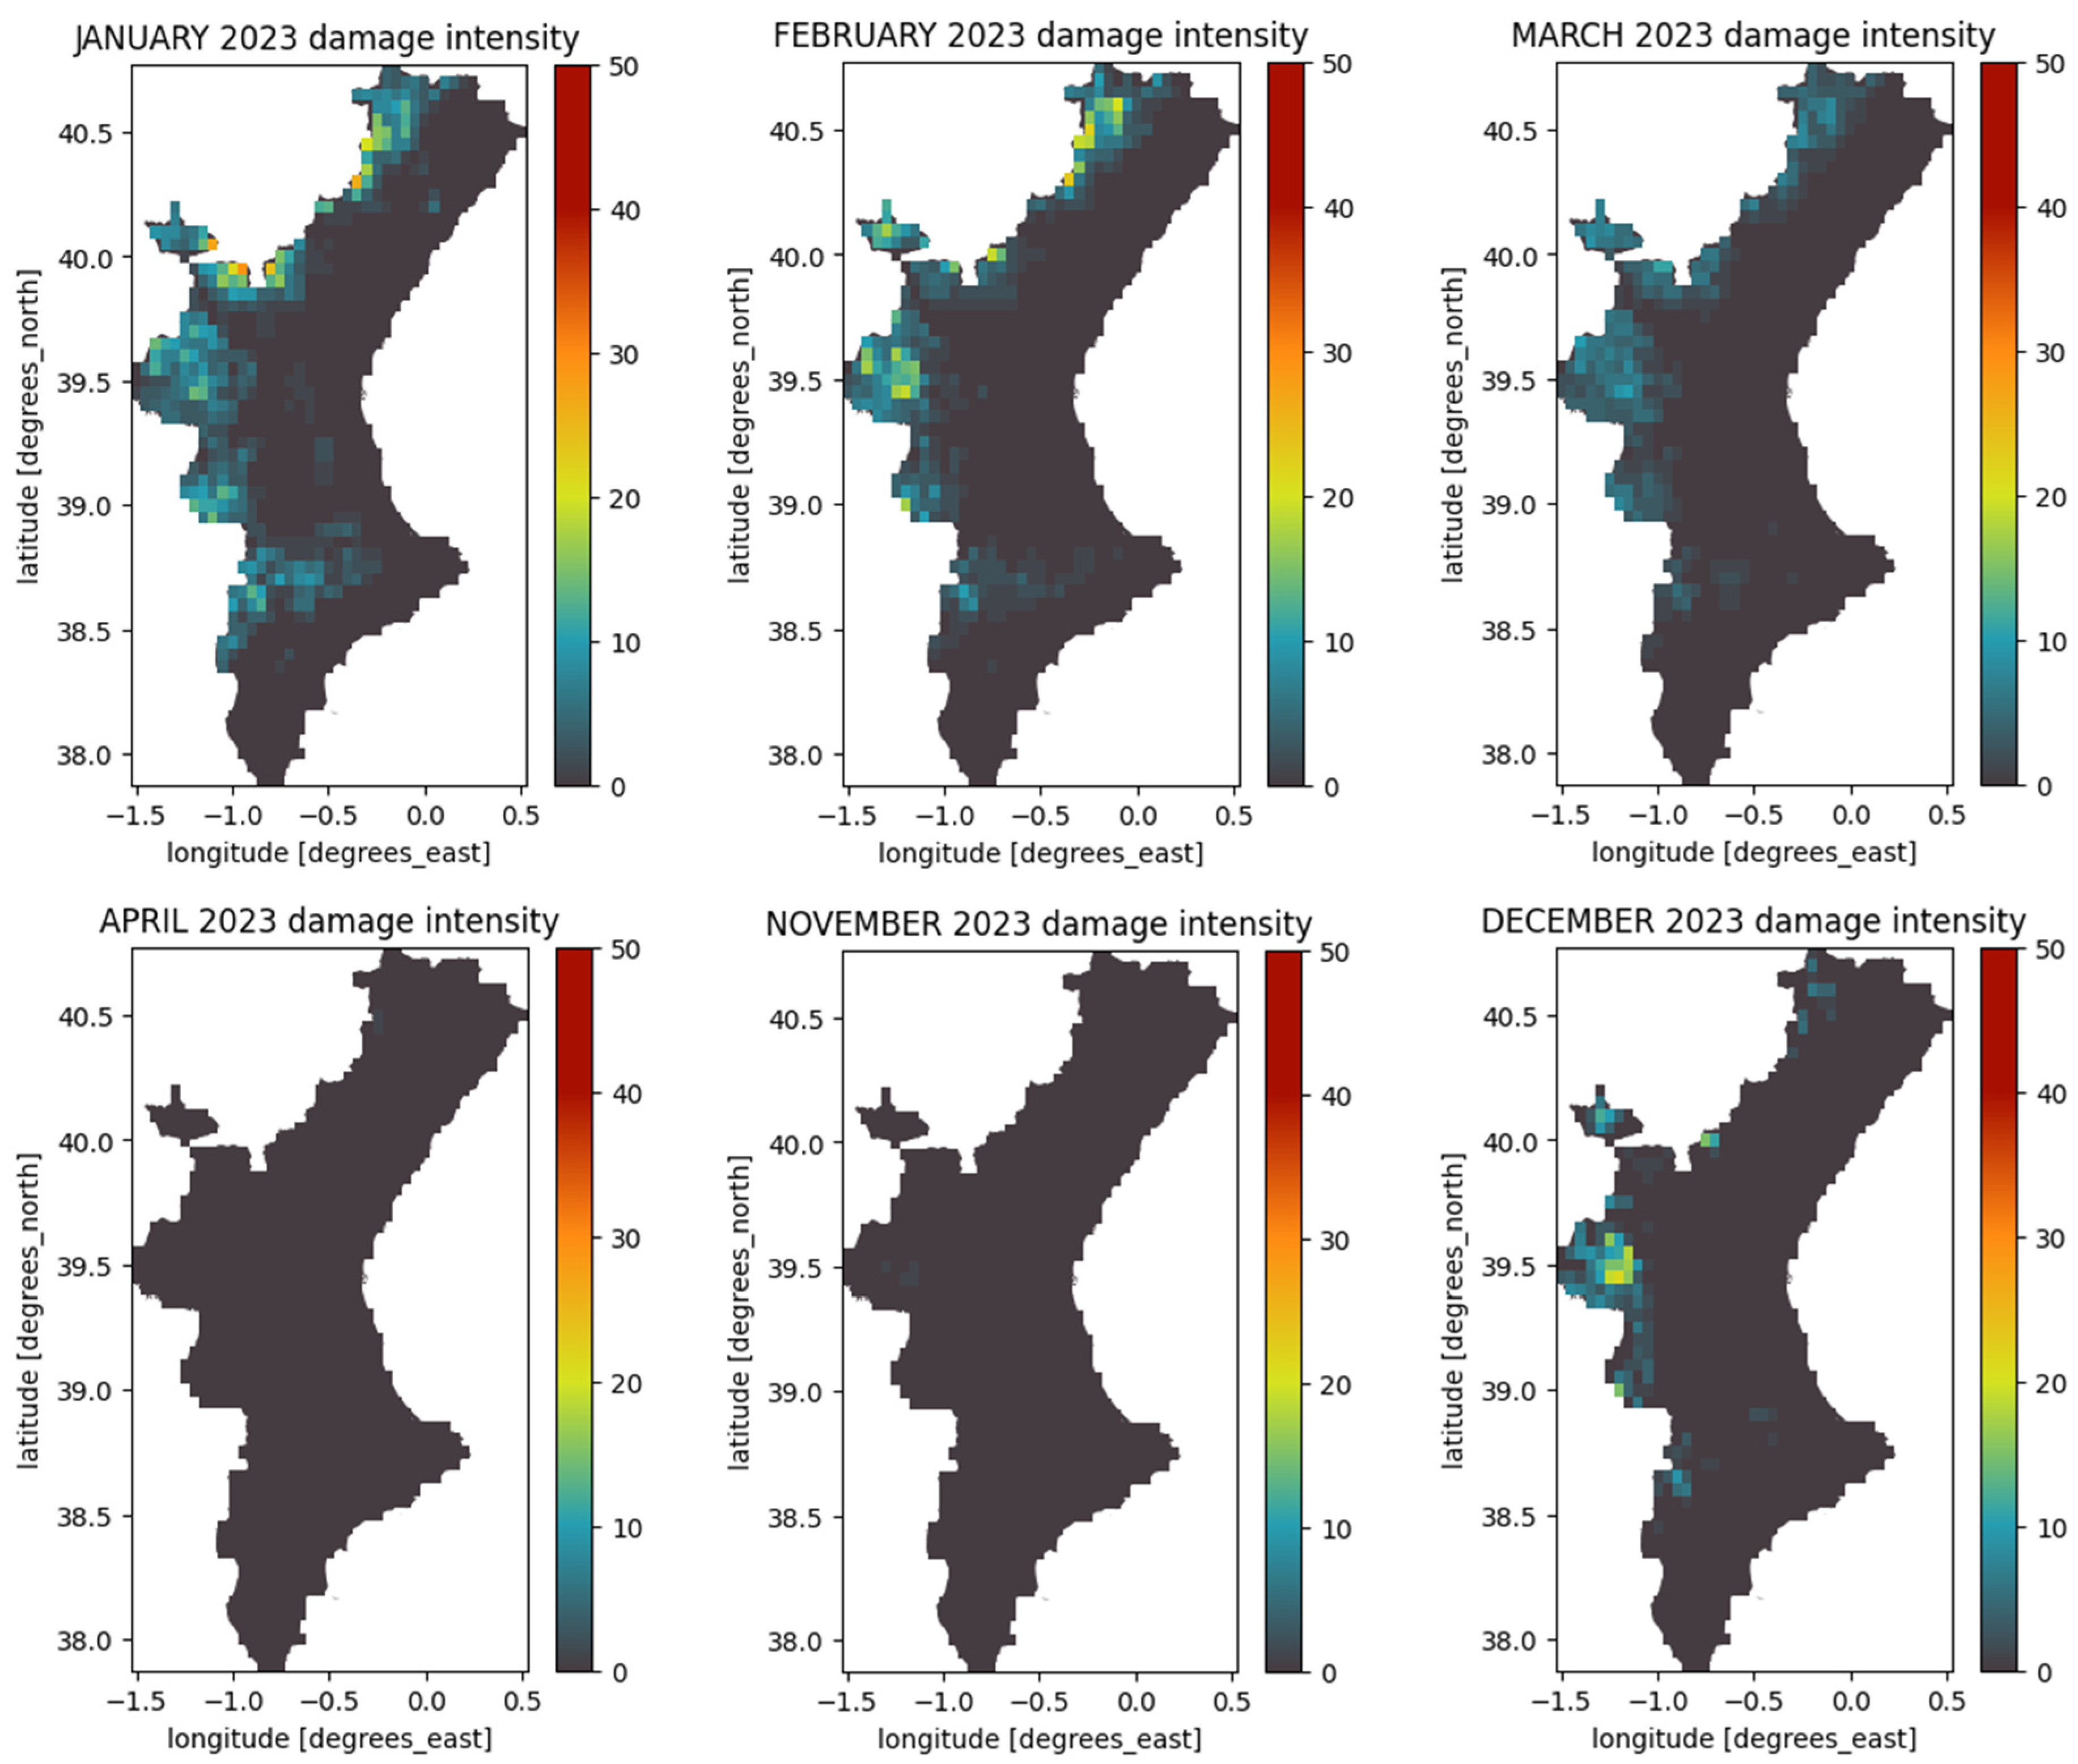
To analyze this effect in detail, damage intensity maps were generated for each year and each month (Figure 13; Appendix A, Figure A2) using the methodology previously described (Equation (1)). Starting with January, we observe medium-to-high-intensity damage present in all years, particularly in the northwestern areas. Some years show higher total intensity than others, with 2011 and 2021 leading the list. Additionally, 2011 and 2005 stand out as the years when frost occurred across almost the entire Community, except for a narrow strip of land along the coast. In contrast, in 2004, 2008, 2014, 2016, and 2018, the frost damage is practically insignificant throughout the study area.
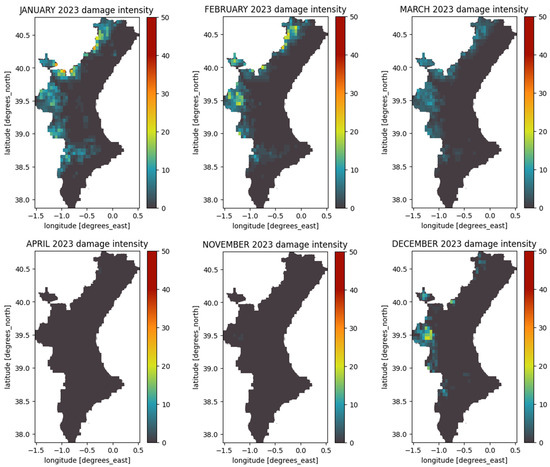
Figure 13.
Damage intensity maps for the Valencian Community in January, February, March, April, November, and December of 2023, with the entire study period (2004–2023) displayed in Appendix A, Figure A2.
For February and March, we notice that in most years, frost intensity has been low or even negligible. The only exceptions are February 2012, which experienced fairly high intensity, and March 2004 and 2005, which had low intensity (between 5 and 20). It is also noteworthy that some intensity, though low, was recorded in March 2023, a phenomenon not observed in the previous 12 years.
April is a special case as no significant damage intensity was recorded in any of the years considered. Therefore, in this context, it can be excluded as a month in which frosts occur and pose a risk to vegetation.
Moving on to November, we see that while some years in the first decade of the study (2004–2013) show significant damage intensity, almost no years in the second decade (2014–2023) do. Finally, December shows a similar pattern, although the intensities are slightly higher in the second decade.
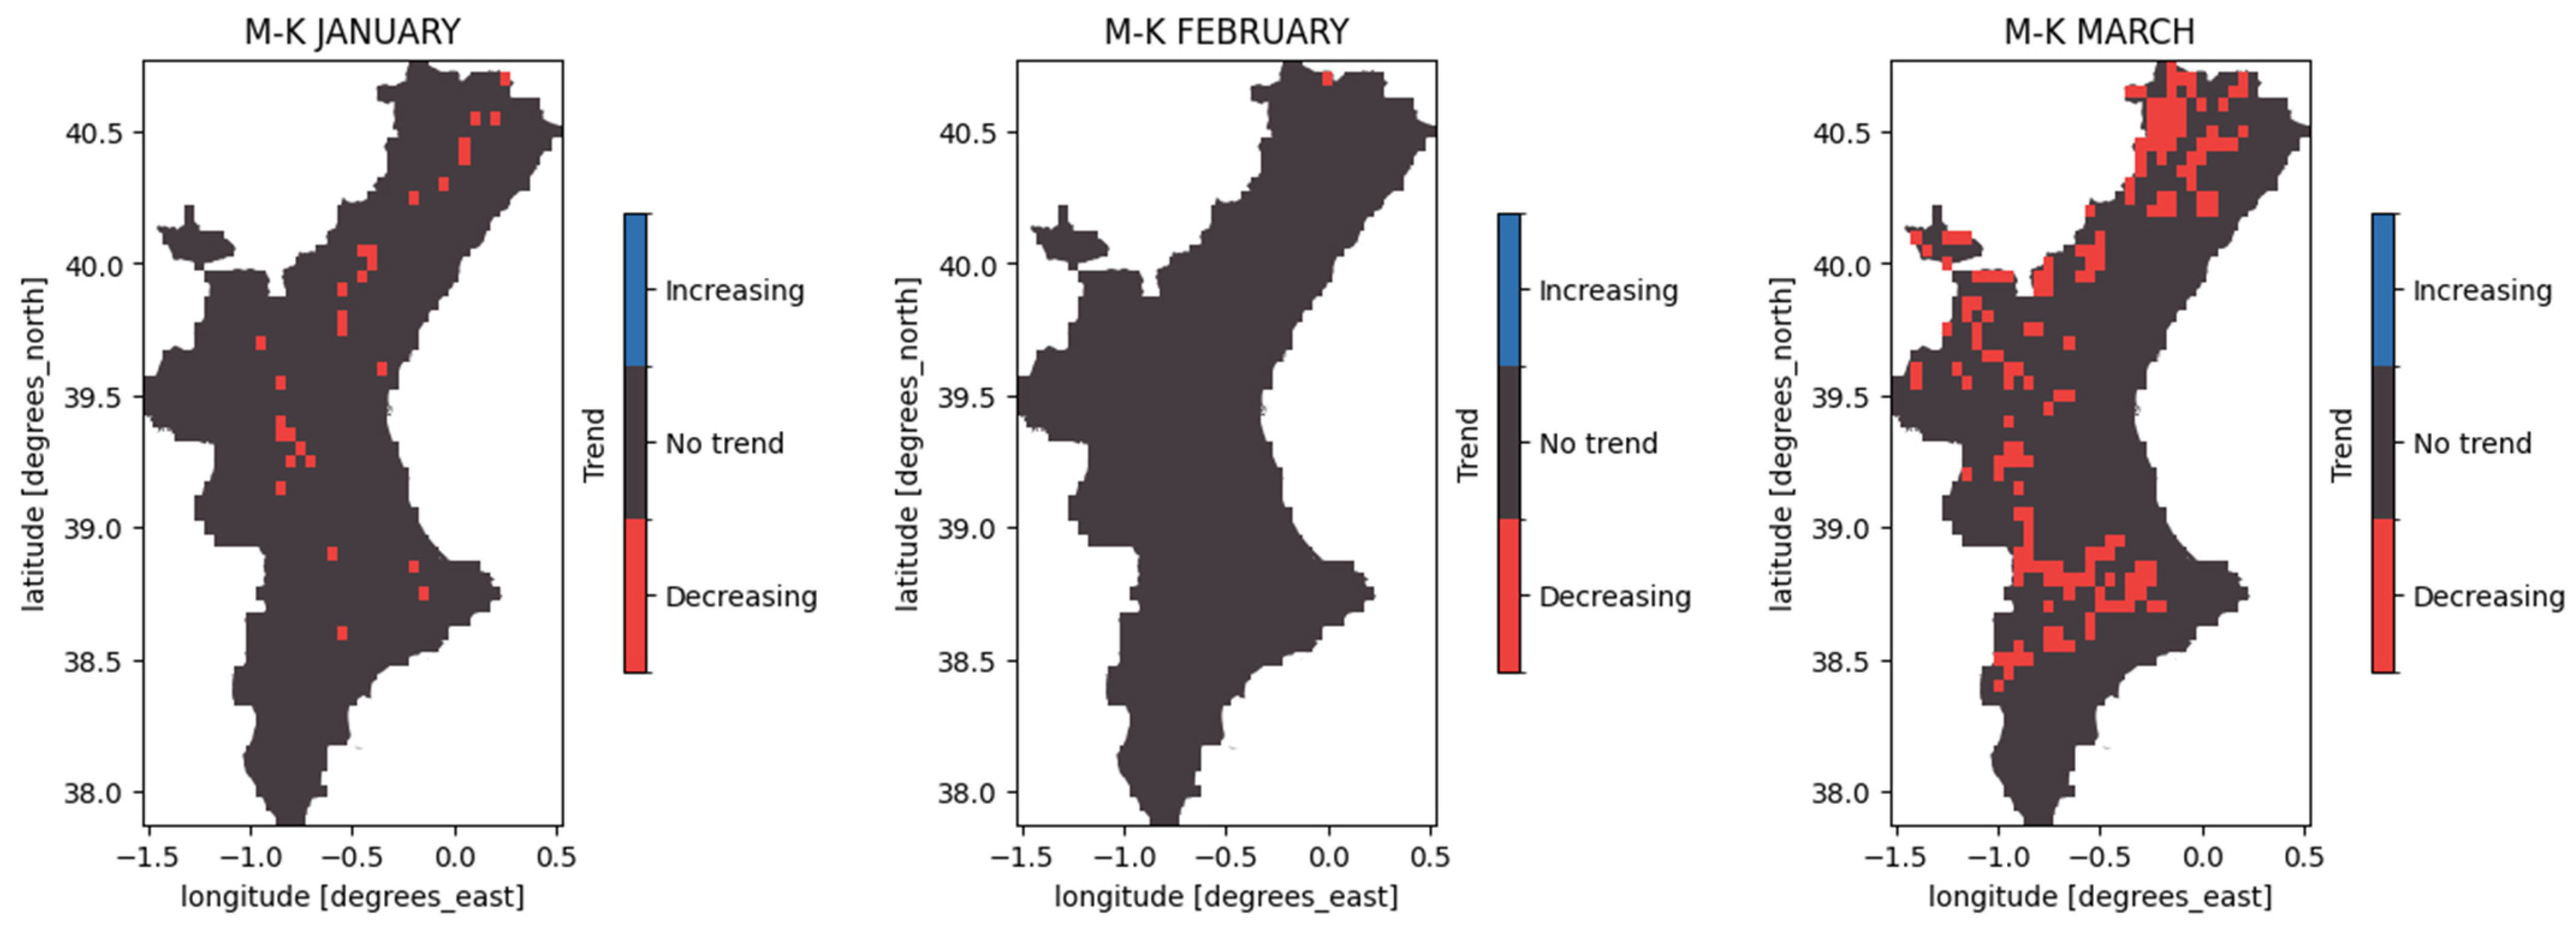
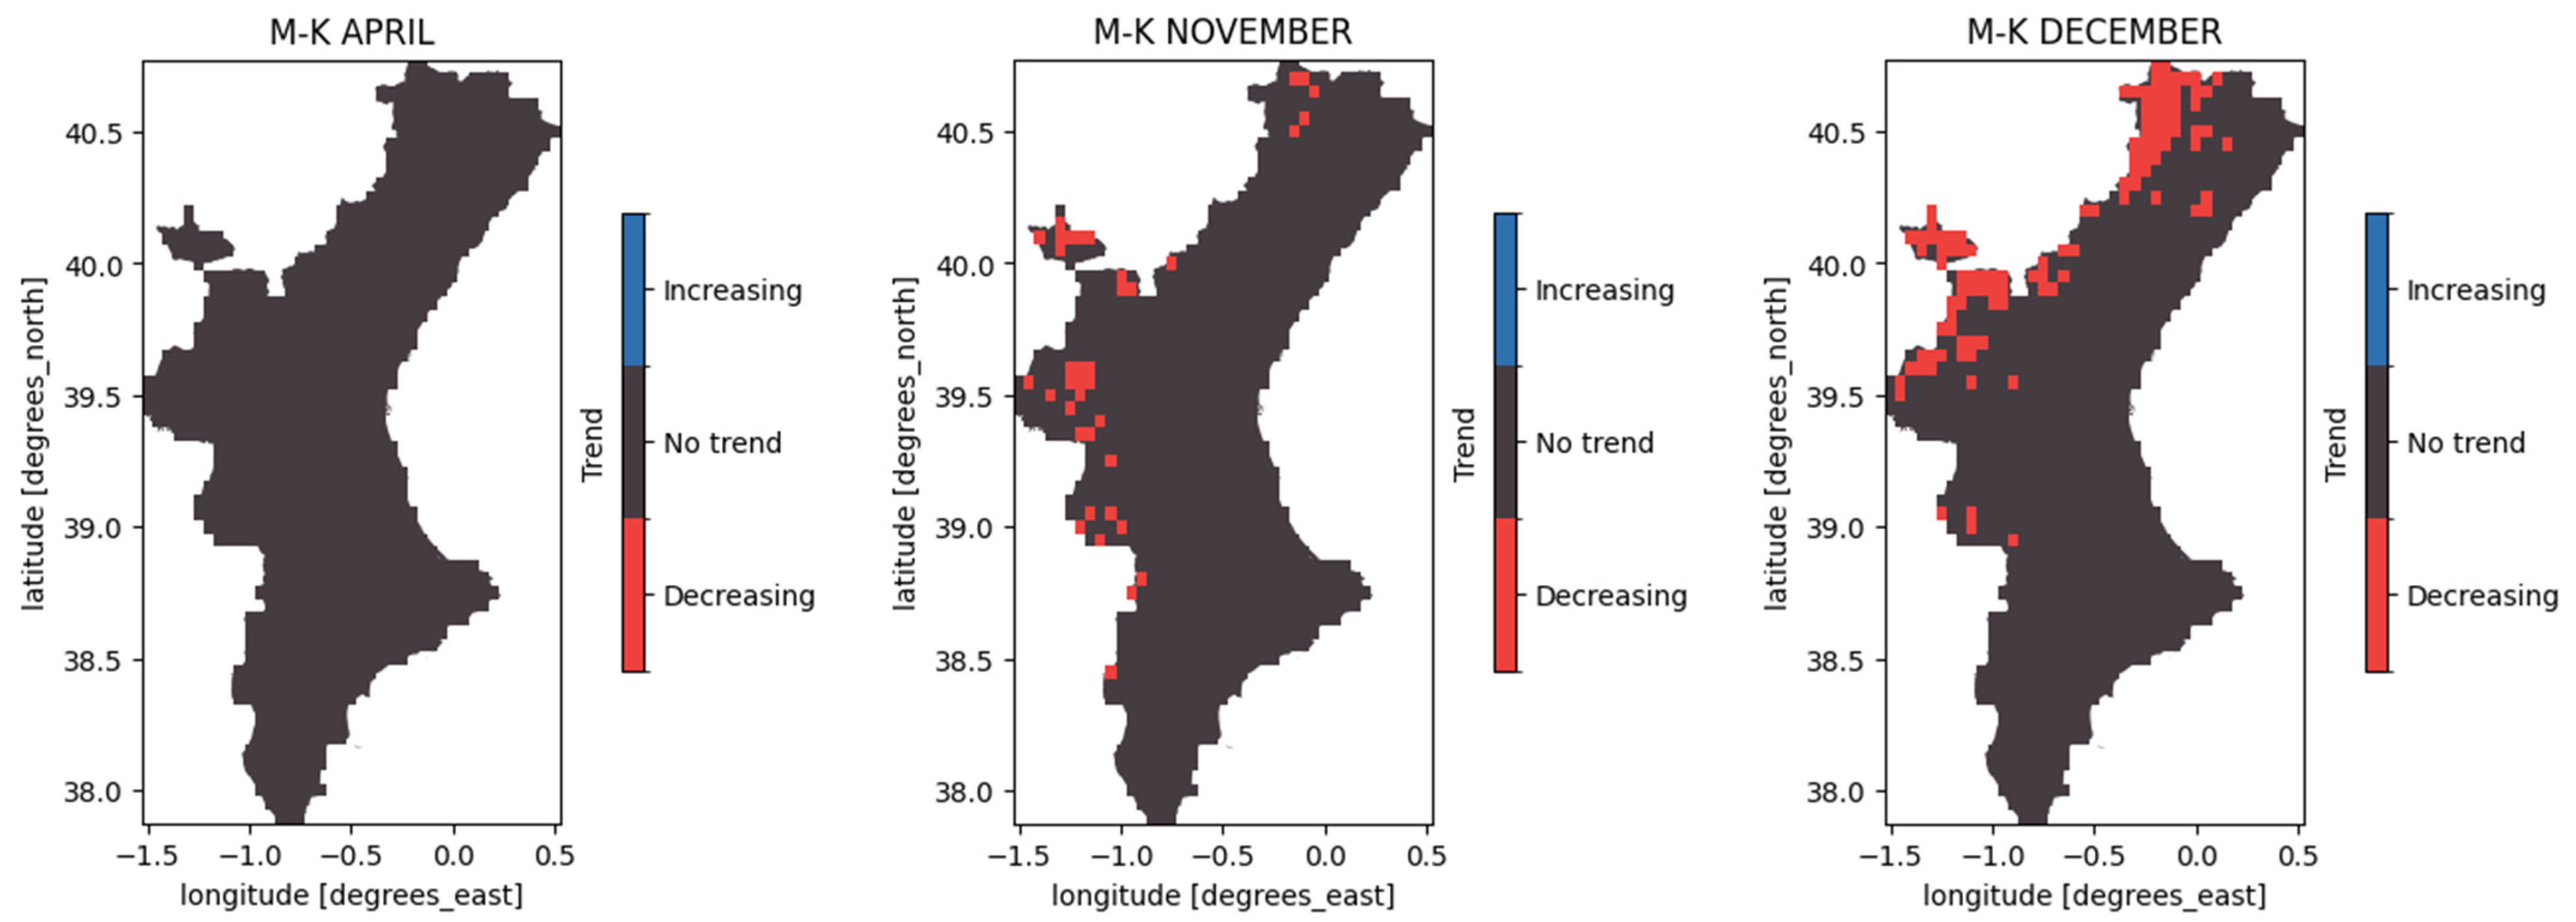
To identify potential trends, the Mann–Kendall test was conducted on each monthly image (Figure 14). The months that exhibit a clear and consistent downward trend are March and December. In contrast, January, February, and November show a decreasing trend only in certain limited areas. No trend was observed in April, which aligns with previous data indicating the absence of significant damage during that month throughout the study period.
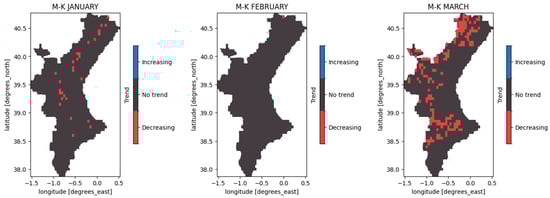

Figure 14.
Result maps of the Mann–Kendall test conducted for the months of January, February, March, April, November, and December during the period 2004–2023, in the Valencian Community area.
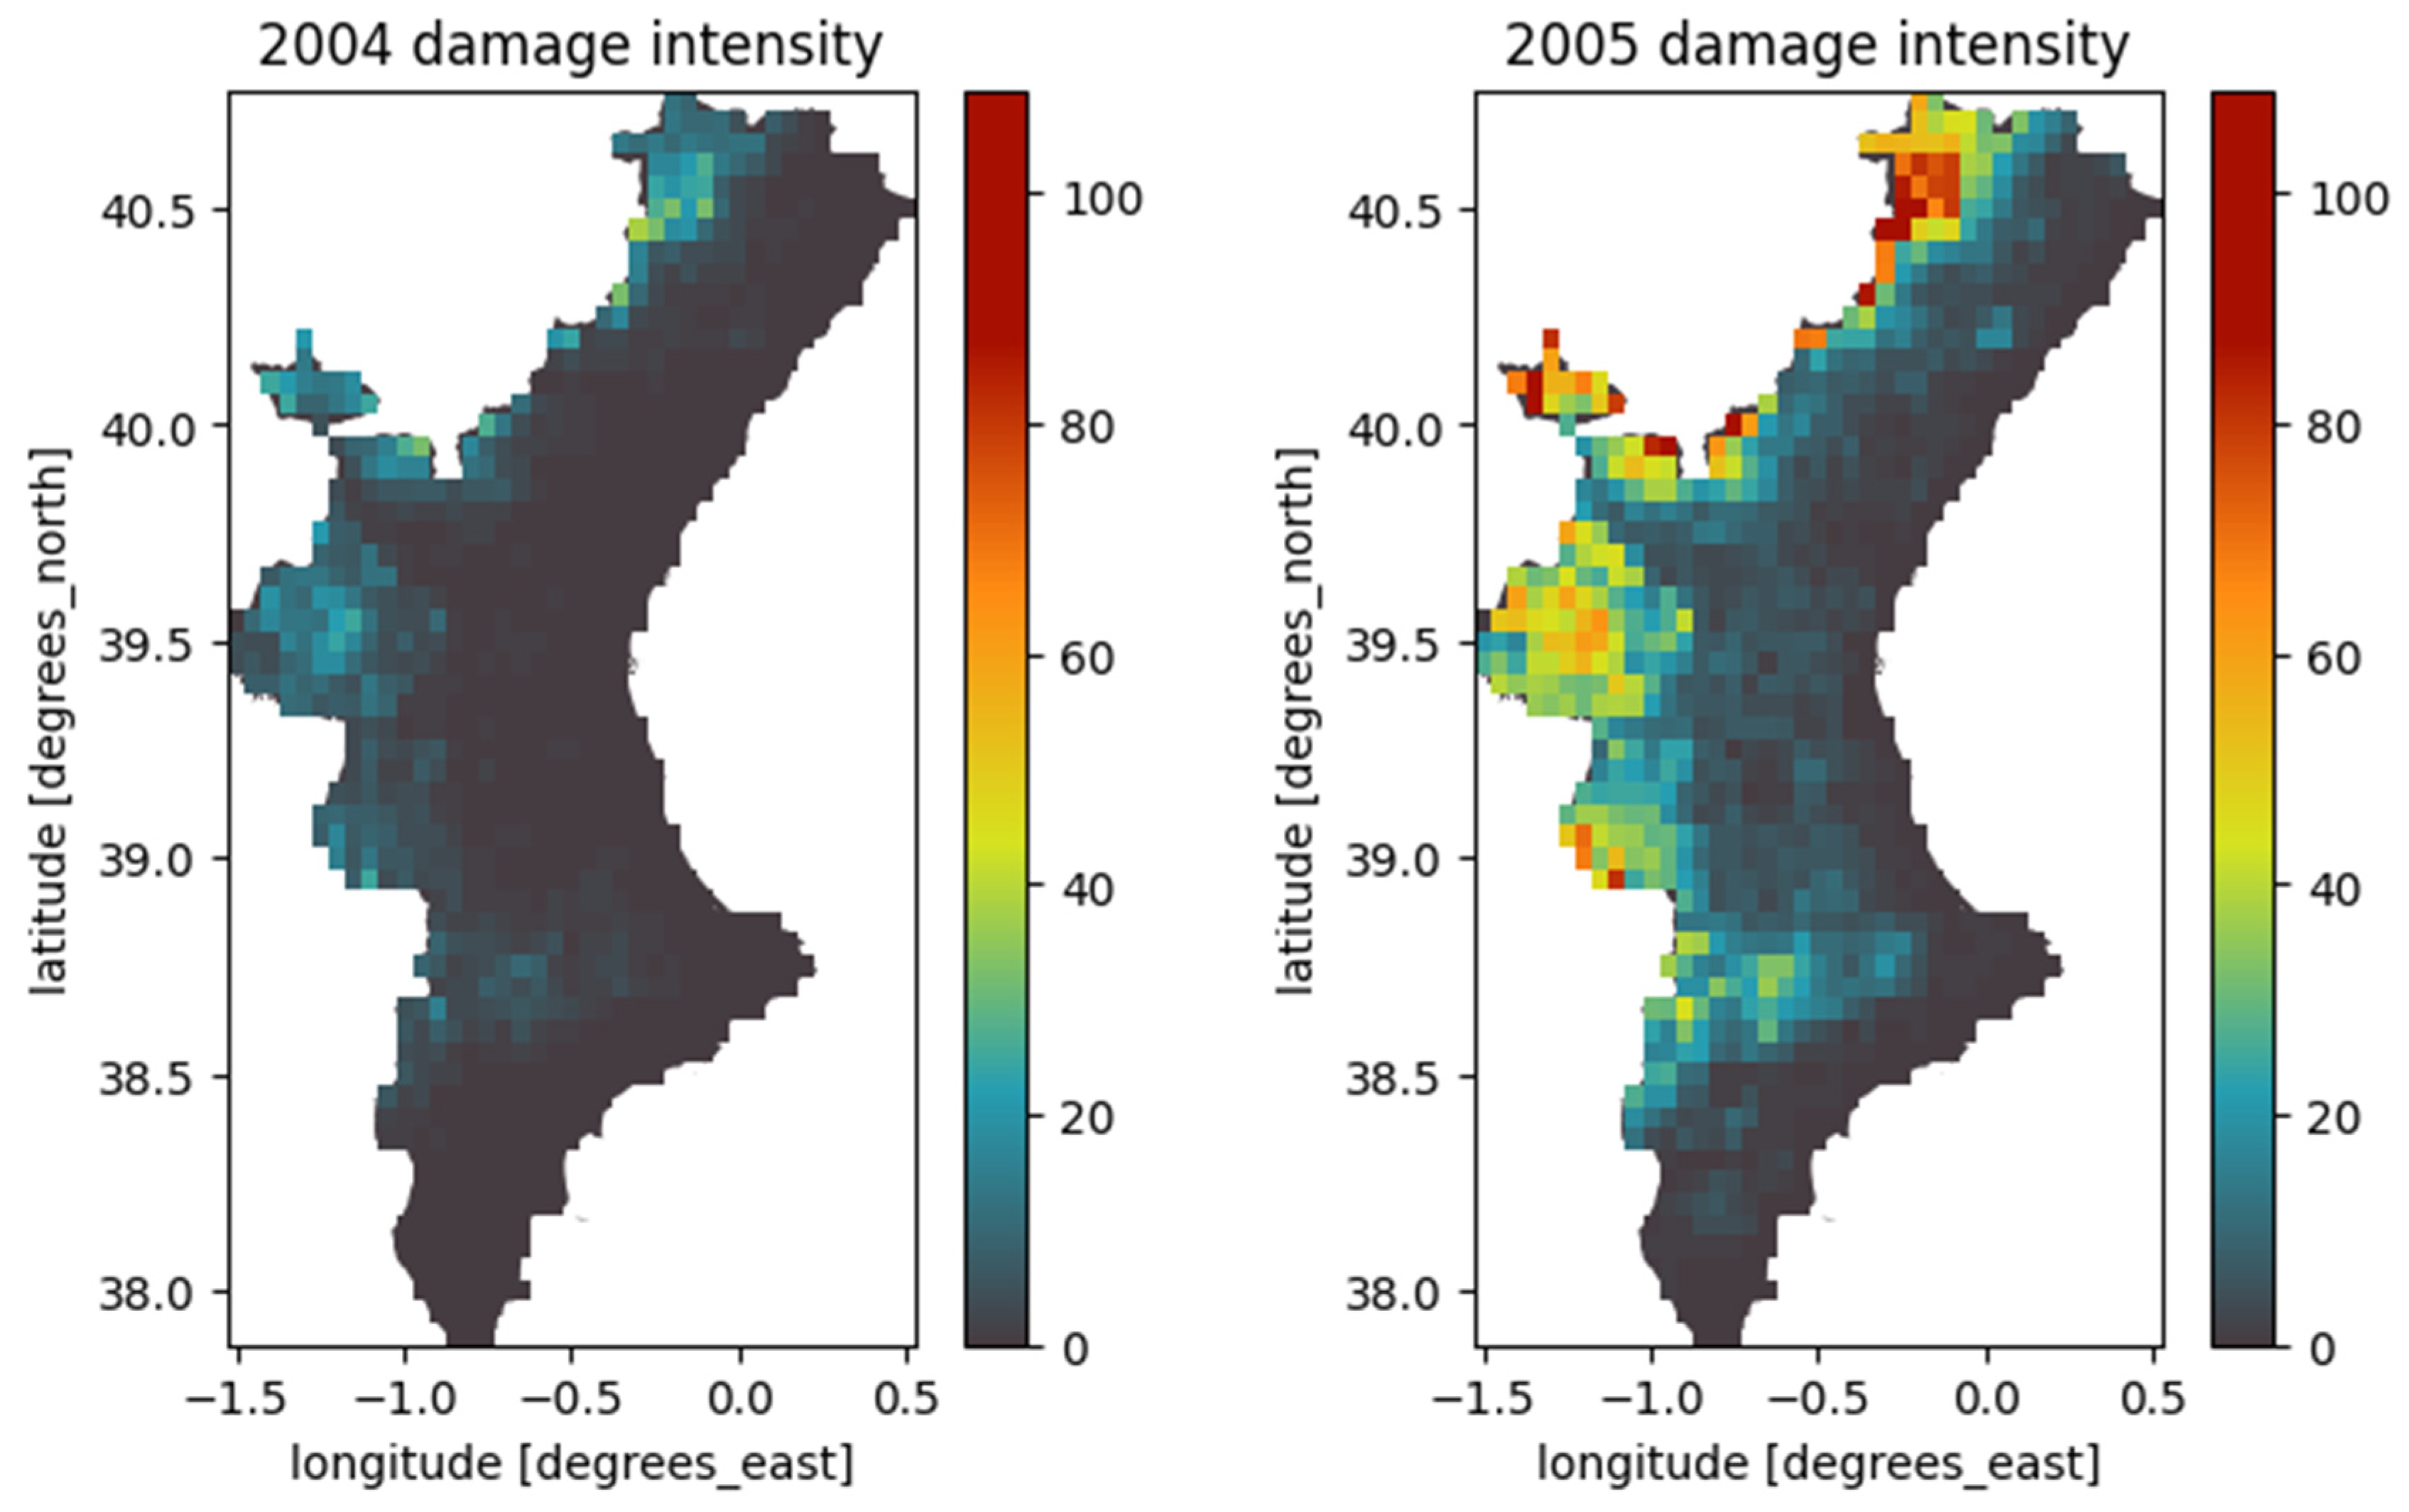
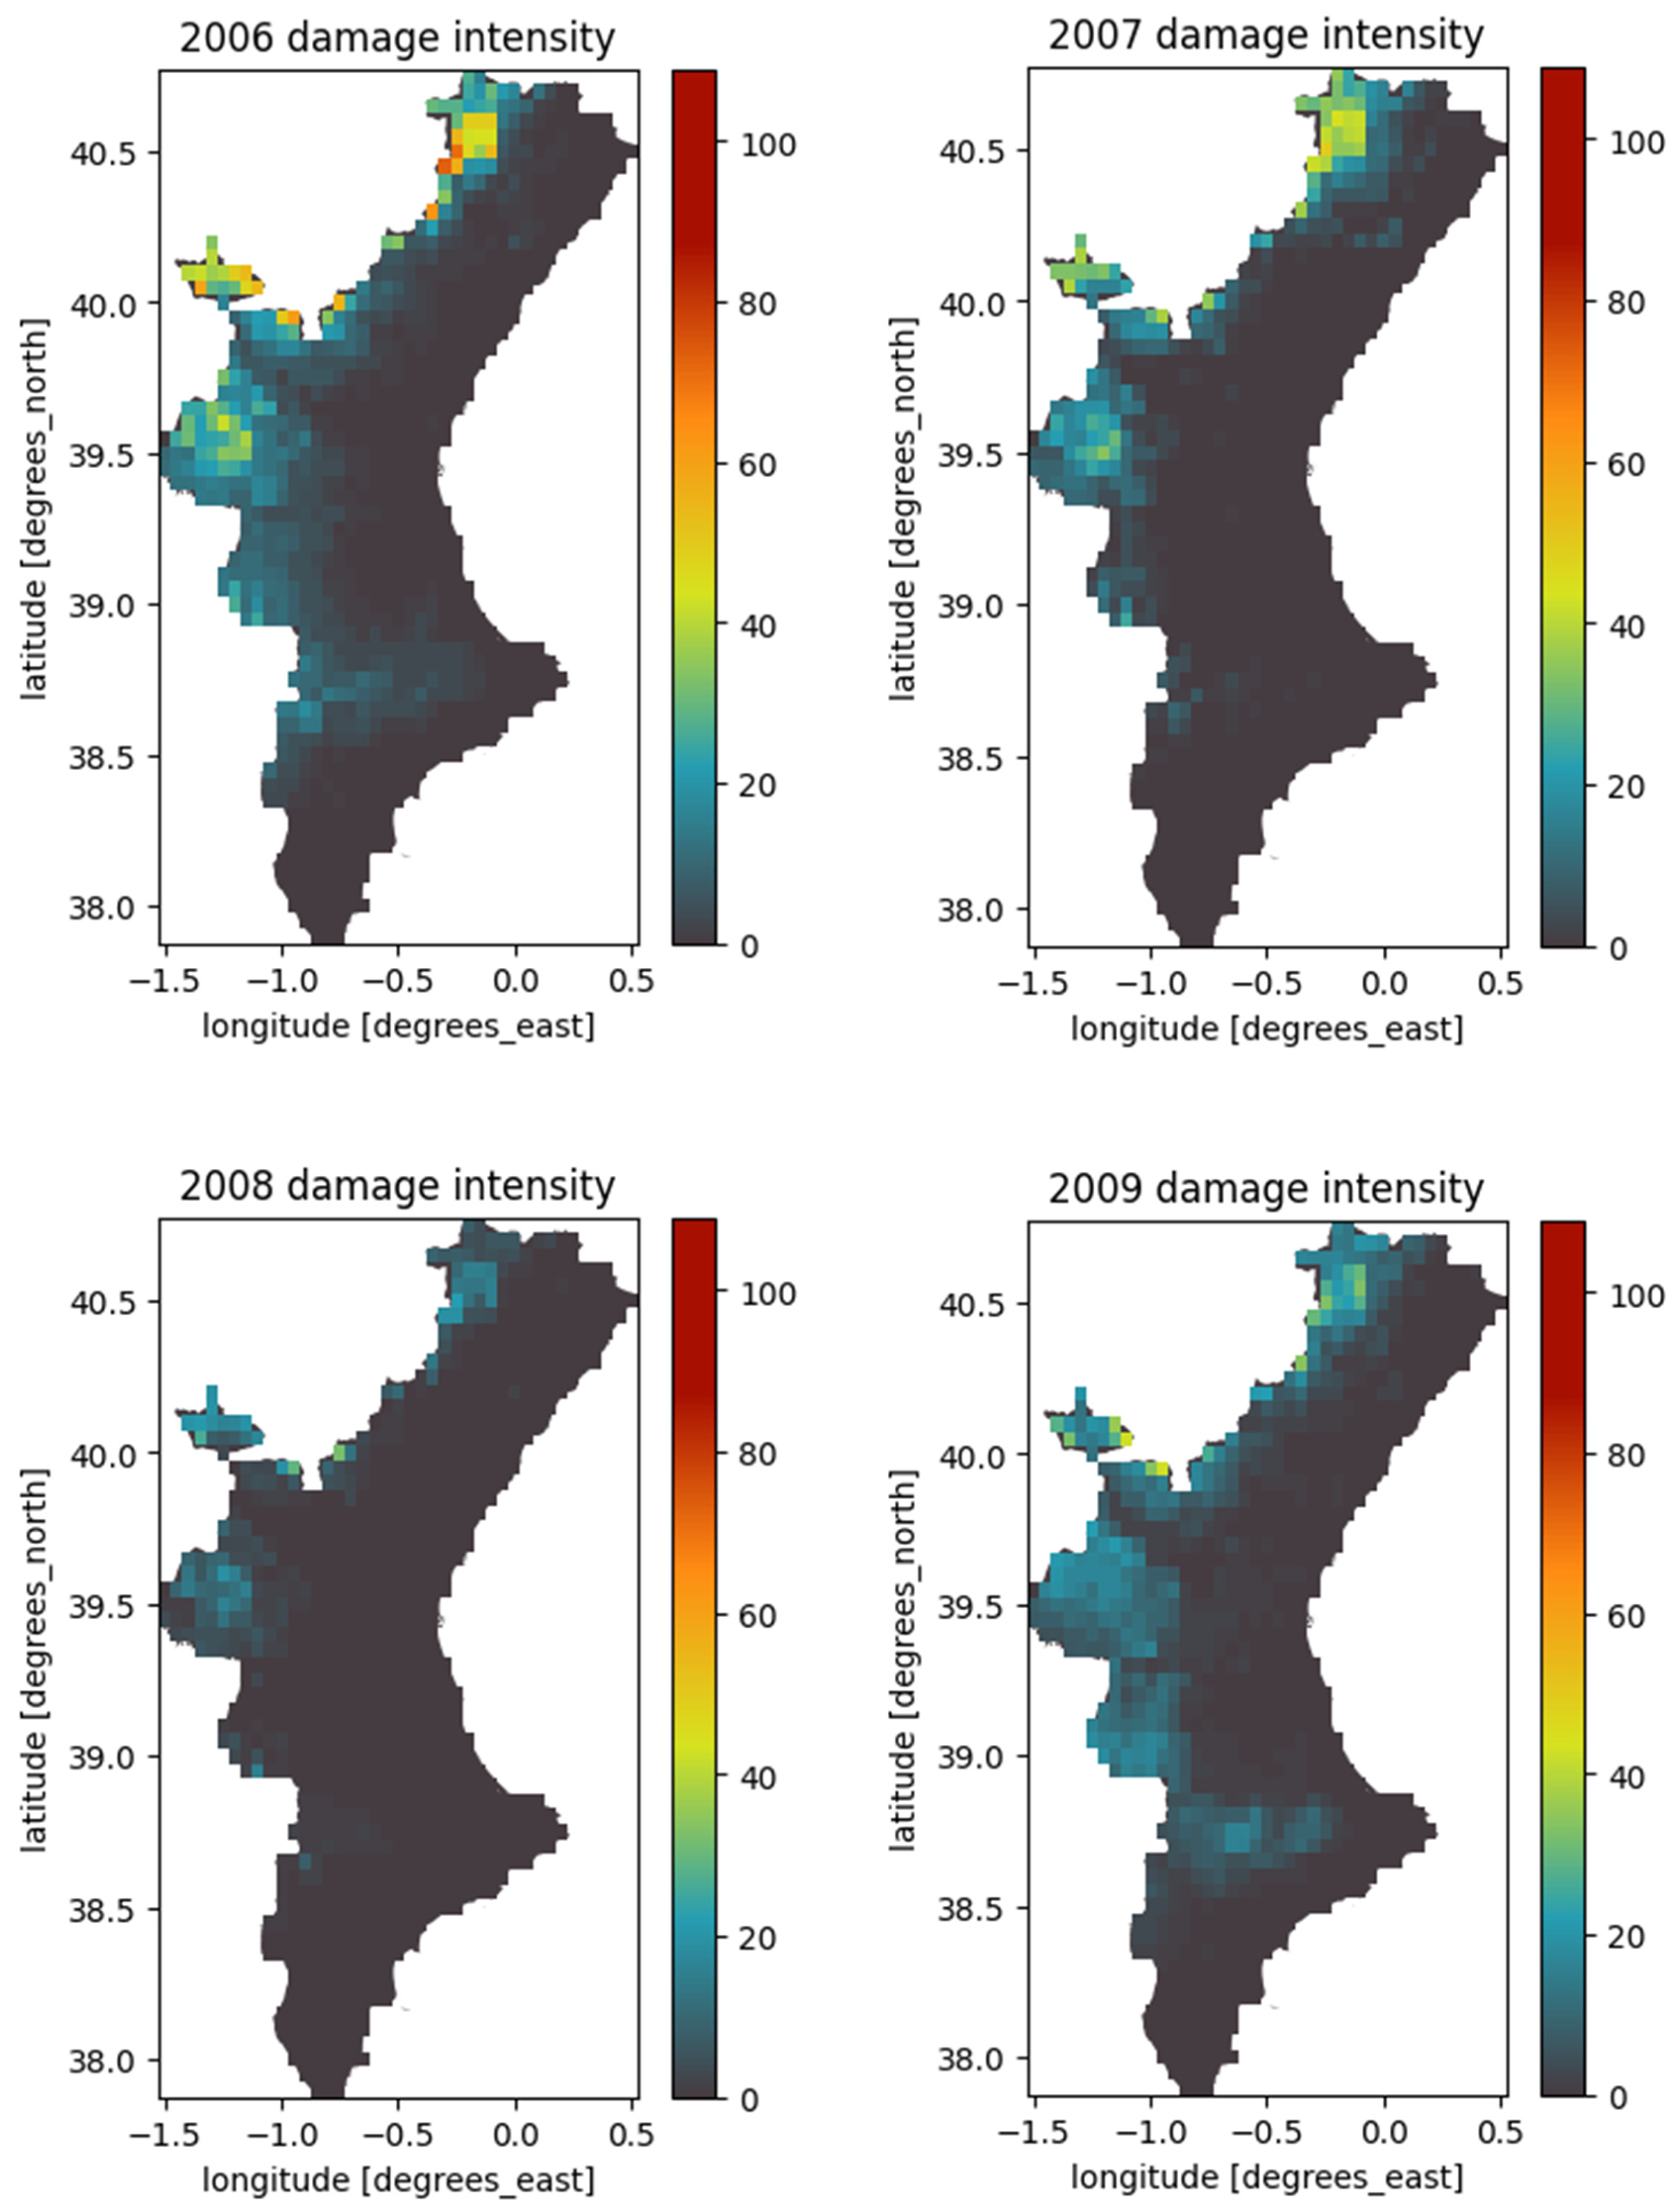
To analyze the global trend over the time series, annual frost damage intensity maps were calculated (Figure 15; Appendix A, Figure A3). It was observed that the years with the highest frost intensity were 2005, 2010, and 2012. Additionally, it was noted once again that the damage intensity was higher during the first decade of the study compared to the second.
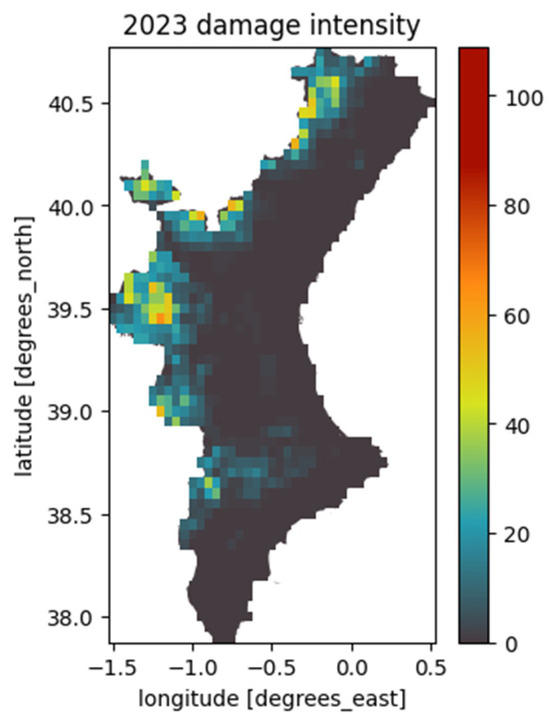
Figure 15.
Damage intensity map for the Valencian Community in 2023, with the entire study period (2004–2023) displayed in Appendix A, Figure A3.
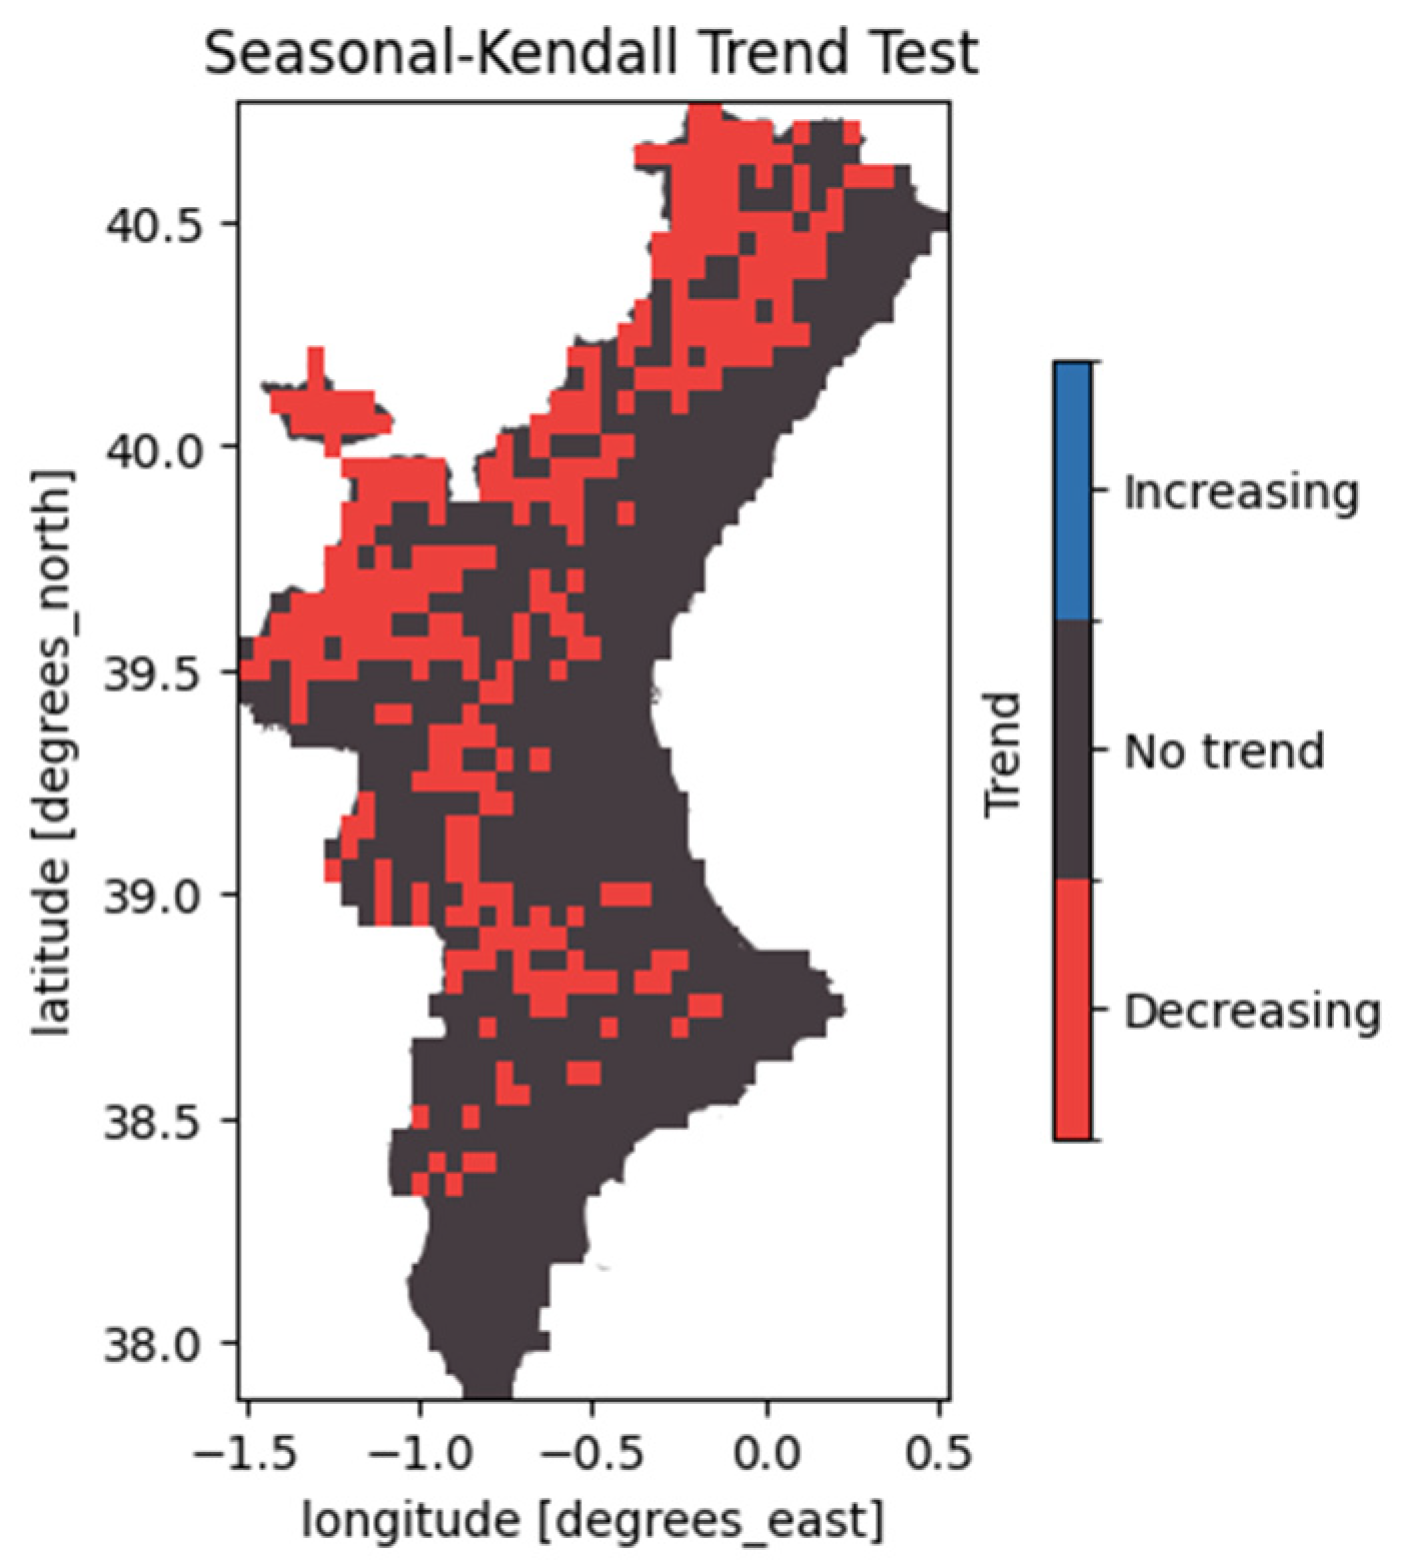
The Kendall seasonal trend test was applied to the entire dataset of damage intensity to observe the overall trend over time. The results (Figure 16) illustrate the areas of the Valencian Community where the annual damage intensity has changed, taking into account the seasonality of the data. It was observed that across much of the region, there has been a decreasing trend in the intensity of damage caused by low temperatures, with the exception of the coastal zone, where no such damage was recorded. In other words, it was found that in 36.21% of cases where a minimum level of damage intensity was observed, this intensity shows a decreasing trend over the past 20 years.

Figure 16.
Result map of the seasonal Kendall trend test conducted on the overall frost damage intensity data for the study period (2004–2023) in the Valencian Community.
A more detailed analysis was also conducted to distinguish between a negative trend in areas where the overall intensity during the study period was low and a negative trend in areas where the intensity was high and thus posed a significant threat to vegetation. Table 3 presents the percentage that has a decreasing trend in vegetation damage intensity due to low temperatures, categorized by initial intensity levels. The data reveal that in areas of the community with an intensity greater than 100, frost occurrences have decreased in 64.43% of cases, in 84.21% of cases for intensities greater than 200, and in 93% of cases for intensities greater than 300.
Table 3.
Areas with the presence of damage intensity and the percentages with a decreasing trend based on the intensity levels throughout the study period (2004–2023) in the Valencian Community.
3.5. Comparison with Citrus Agricultural Areas
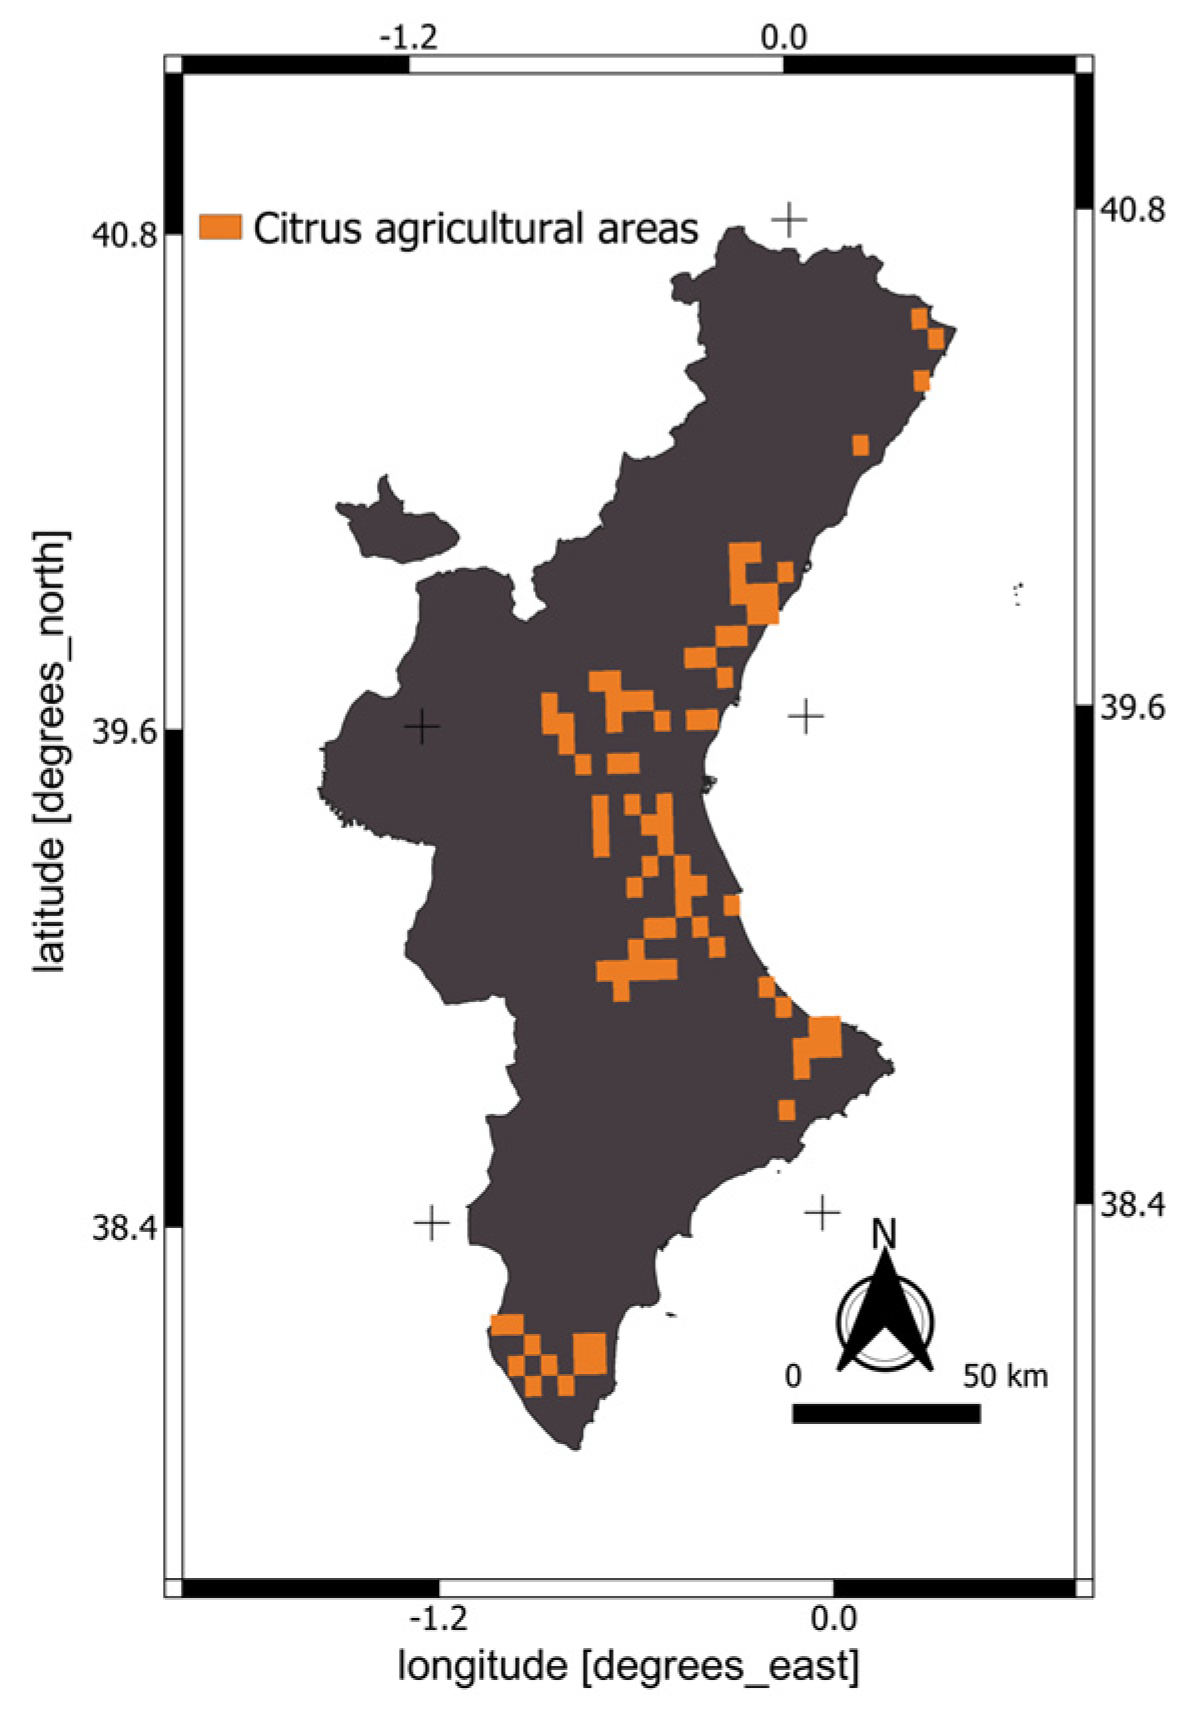
Once the areas most affected by frosts were identified and their trends over recent years were analyzed, we aimed to determine whether these frosts indeed impact the regions where citrus fruits are cultivated and thus pose a risk to growers. To this end, we compared the frost damage intensity map with the citrus cultivation area map provided by the Spanish National Geographical Information Centre. In Figure 17, the citrus map of the Valencian Community is shown, rescaled to the same spatial resolution as the MSG images. Analyzing the frost trends over the study period in these citrus areas, we can see that the citrus areas correspond to regions in the community (central and coastal areas) where no trend is detected.

Figure 17.
Citrus map of the Valencian Community provided by the Spanish National Geographical Information Centre, rescaled to the same spatial resolution as the MSG images.
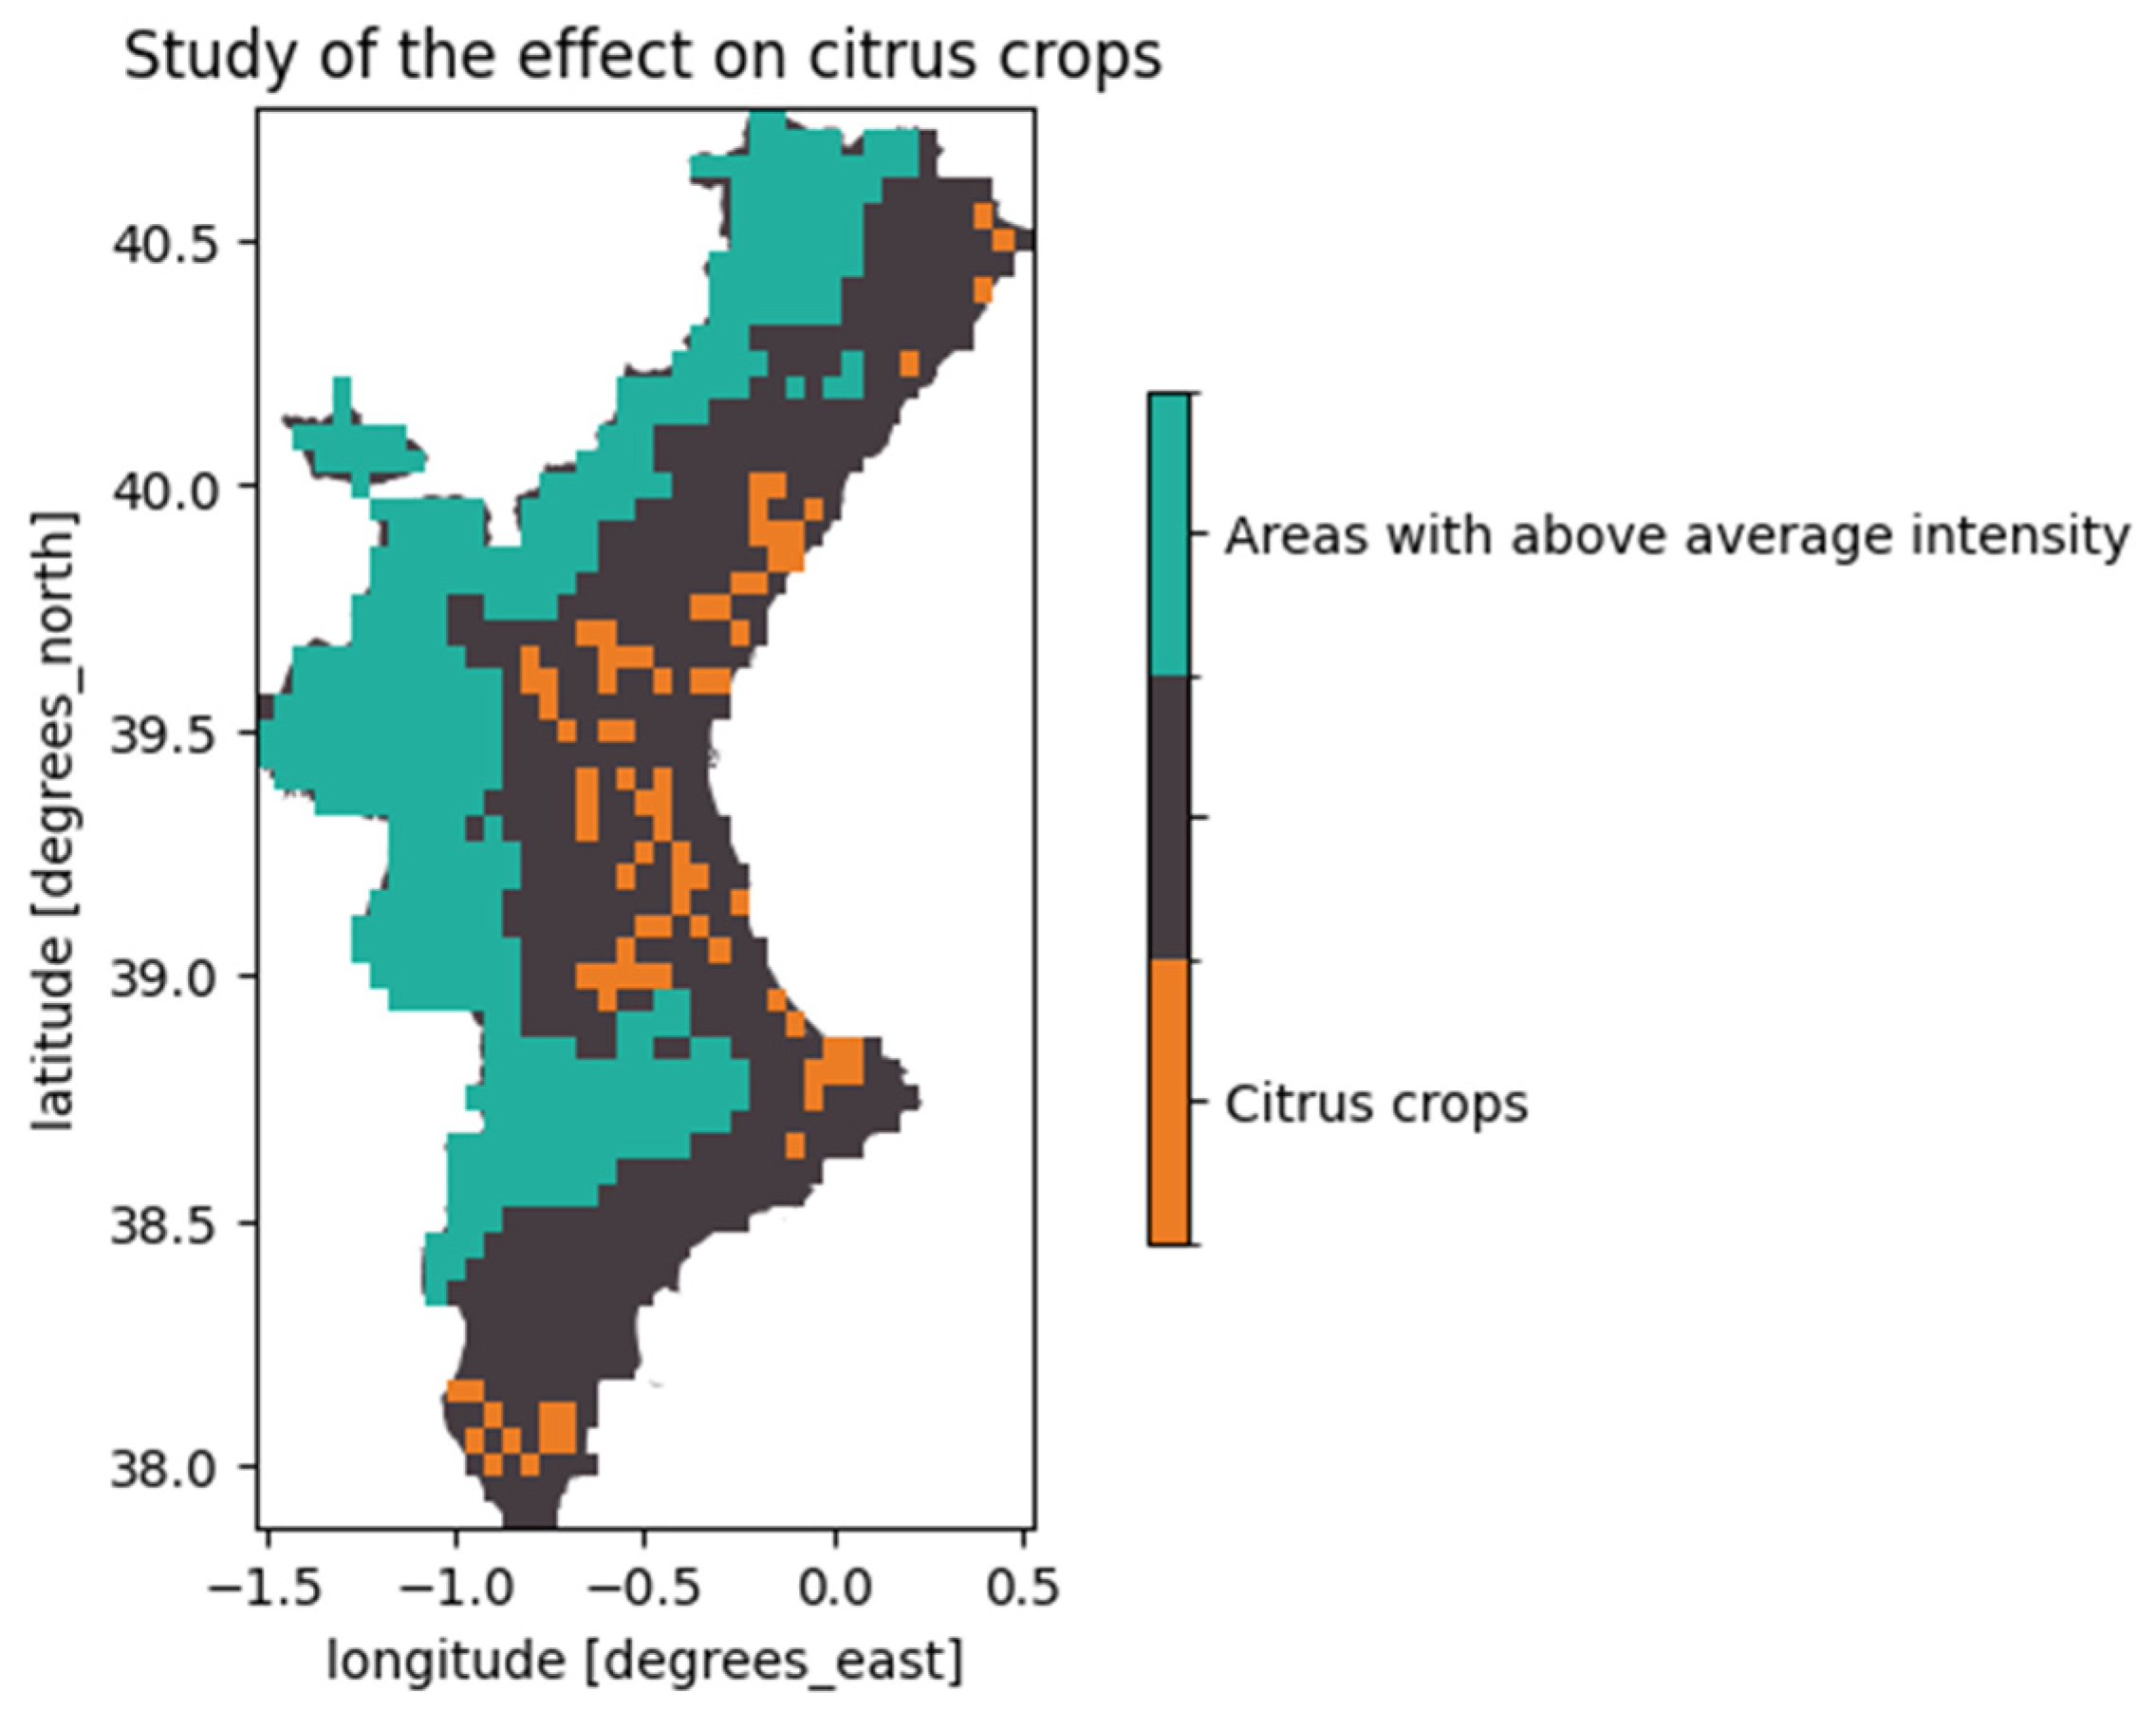
However, when we select only the points where frost intensity is above the average for the study period, we find that these areas do not overlap with those where citrus fruits are cultivated (Figure 18).

Figure 18.
Overlay map of areas where above average intensity frosts occurs, and areas cultivated with citrus in the Valencian Community.
3.6. Correlation Analysis with Altitude
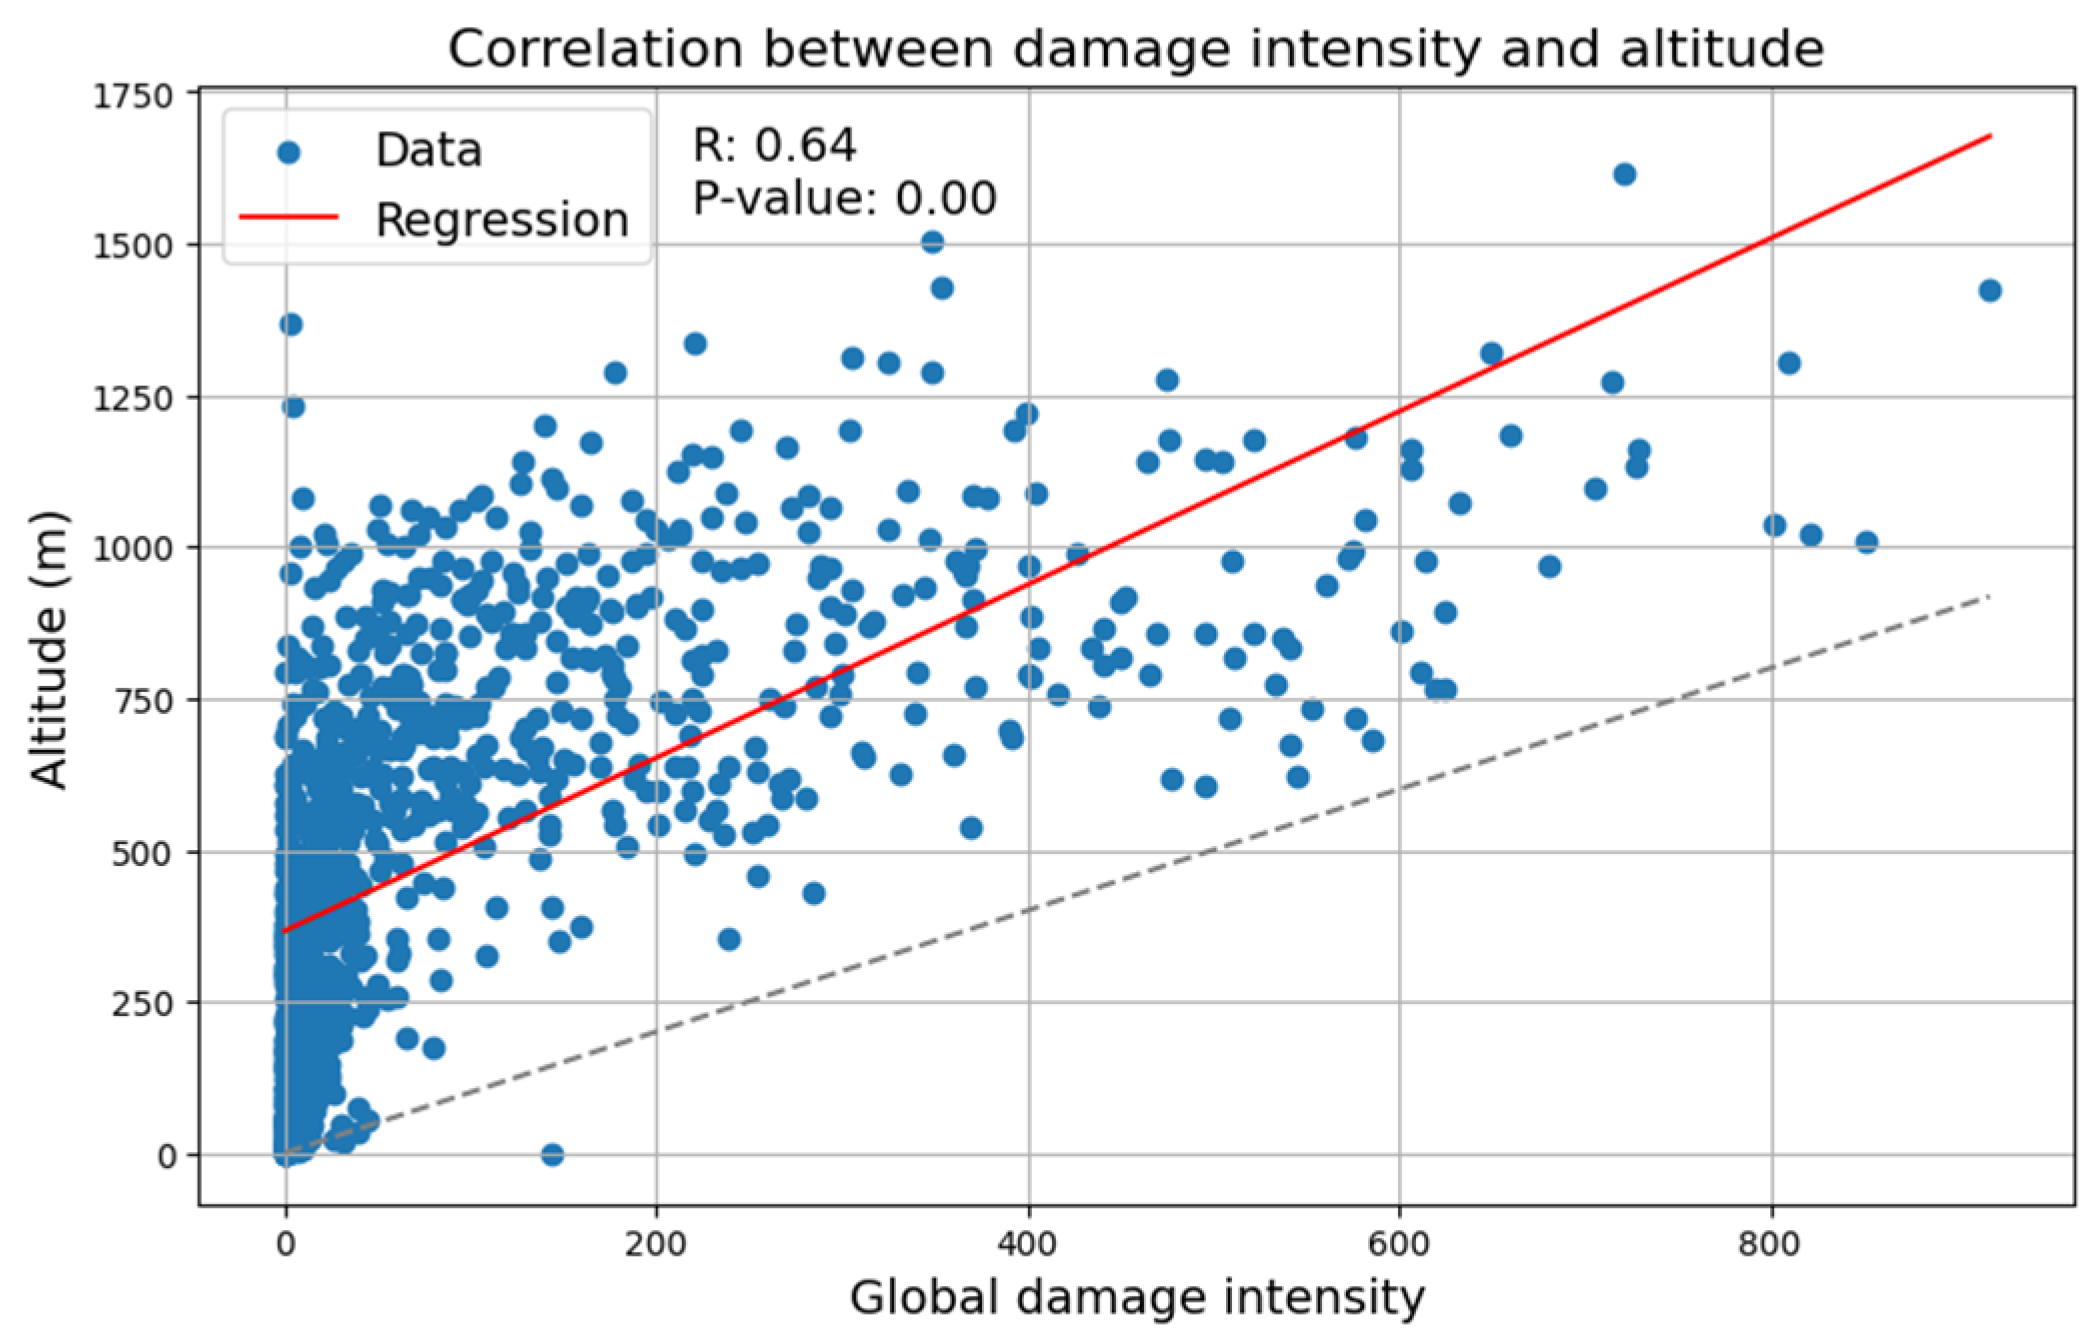
Finally, to better understand the relationship between frost occurrence and its spatial distribution, a comparison was made between the overall damage intensity map (Figure 19) and altitude (Figure 3). The linear regression line obtained reveals a significant correlation (p < 0.05), with an R-value of 0.64 (Figure 20).

Figure 19.
Global damage intensity map for the Valencian Community during the period 2004–2023.

Figure 20.
Linear correlation graph between the overall frost damage intensity registered over the study period (2004–2023) in the Valencian Community and altitude.
4. Discussion
In this paper, we present a new methodology to assess frost damage using RS technology. To analyze this phenomenon, we used LST data collected by the MSG satellite over the past 20 years, focusing on the months most prone to frost: January, February, March, April, November, and December. To ensure that the LST recorded by the satellite accurately represented the actual temperature of the area, we conducted a correlation analysis between the satellite data and in situ measurements provided by AEMET for the Villafranca station. The results show a high level of reliability, with strong R² values and low RMSE, particularly during nighttime hours. This result is significant because, outside of these hours, the temperature is generally too high for frost to occur or cause damage to the crops. Therefore, the fact that the validation demonstrates the reliability of our data, especially during the night, ensures a strong analytical capability [43].
This result confirms the high reliability of our methodology, which was then used to study frost events in the Villafranca area. From this study, we can observe that although frosts are relatively frequent in this region, it is rare for them to cause severe or lasting damage. Additionally, the temporal analysis reveals how the distribution and intensity of frost events have changed over the past decades, with a notable decrease in frost risk during March, November, and December.
We then extended our analysis to the entire region, examining the entire LST time series. The data shows that certain years were particularly cold (2005 and 2010), while others were notably warm (2014, 2019, 2023). We also observe that warm years have recently become more frequent than cold ones, with an increasing trend, as also highlighted by the temperature study conducted by the Agencia Estatal de Meteorología (AEMET) for the Valencian Community. According to this study, the years identified by us as warm are classified as very warm (2014), warm (2019), and extremely warm (2023). Conversely, the cold years (2005 and 2010) are classified as very cold. This consistency provides further validation of the quality of the satellite data, confirming the effectiveness of this system in detecting LST.
These results are further confirmed by data found in governmental statistic sources [44] and publications, such as Imbert’s article [45], which highlights the significant losses sustained by the citrus industry in the region due to severe frosts in 2005 and 2010. In this way, we were able to verify that not only does our methodology effectively detect frosts, but also that these events have indeed caused damage to the crops, making them a matter of concern for the agricultural sector.
When analyzing the results from the seasonal Kendall trend test, we observe a clear upward trend in mean, maximum, and minimum temperatures over the study period, consistent with the predicted aridification of the region due to climate change. This finding is particularly significant in our study, as rising temperatures can ultimately lead to a decrease in frost events and less frost damage to vegetation. These observations are supported by the comparison of temperatures between the decades 2004–2013 and 2014–2023, which indicates that minimum, mean, and maximum temperatures have increased significantly in the last decade.
Subsequently, we conducted a damage intensity analysis using the methodology we developed, applied to the various months and years within the study period. The results indicate that the months with the most significant damage align with the winter months, specifically January and February, with January showing the highest frequency of frost events. Additionally, we observed that in all months, damage intensity was higher during the first part of the study period, which aligns with the earlier temperature analysis. These findings are further supported by the results of the Mann–Kendall test, which reflect a decrease in vegetation damage over the last decade, particularly during March and December, due to rising temperatures linked to climate change. Annual damage intensity analysis confirms that 2005 and 2010 were among the coldest years, consistent with thermal anomaly data and AEMET’s findings. Moreover, we see that this damage is primarily concentrated in inland areas, where the absence of the sea’s moderating influence leads to frost events with relatively high damage intensity.
Overall, there is a clear downward trend in frost intensity throughout the study period, particularly in areas with high overall intensity, indicating that severe and prolonged frost events have become increasingly rare, giving way to less intense frosts.
Following this, we examined the relationship between frost-prone areas and citrus cultivation zones within the Valencian Community by overlaying the distribution maps. The map obtained reveals that while there are some overlapping areas, the majority of citrus-growing regions do not experience severe frost. This reflects how farmers strongly consider frost risk when deciding which crops to plant, as this phenomenon can cause significant damage to yields, leading to substantial economic losses. As mentioned earlier, this study is mainly focused on a thermal perspective. If the study were to be extrapolated to a specific field or area, additional variables would need to be incorporated, such as phenology, precipitation data, or higher spatial resolution imagery, among others.
In conclusion, we examined the relationship between frost occurrence and altitude using Pearson linear correlation analysis. The results indicate a strong correlation between these two variables, showing that more severe frosts generally occur at higher elevations.
5. Conclusions
Climate change poses a significant challenge that we will need to address in the coming years, particularly for highly vulnerable activities such as agriculture. To ensure effective resource management in response to these challenges, it is essential to have precise local-level information to guide decision-making [13].
In this context, our work provides several key conclusions:
- Satellite-derived LST data, in this case from MSG, prove to be a useful and reliable tool for monitoring frost events;
- In the Valencian Community, there has been a decrease in frost occurrences over the past decade, particularly with regard to intense frost events;
- Citrus cultivation areas seem to be increasingly less exposed to frost risk in the study area, even at higher elevations above sea level.
The demonstrated decrease in the intensity and frequency of frost events can be beneficial for the region’s citrus growers as it reduces the likelihood of plant damage and subsequent economic losses. Additionally, it lowers the costs associated with frost prevention and mitigation efforts, such as irrigation expenses [3], also allowing for water conservation, a resource that is becoming increasingly scarce in the context of climate change.
Considering this downward trend and recognizing that citrus crops are also threatened by excessively high temperatures, we recommend using the maps produced in this study to assess potential new sites for citrus cultivation that were previously too risky due to frost exposure. A similar approach was employed by Zabihi et al. [22] for a region in Iran.
Growing citrus fruits at higher elevations could help mitigate risks from heat waves, severe aridity, flooding, and excessive salinity, which are becoming more prevalent in this region due to global warming. These conditions, especially when combined, can severely influence plant health, leading to reduced productivity and fruit quality [8]. Furthermore, it has been demonstrated that higher altitudes and high soil moisture content are among the factors that mitigate the risk of frost, as they increase the plant’s resistance [18,42].
Nonetheless, it is always advisable to consider various perspectives during the decision-making process [46], such as those of local farmers who are among the best experts on regional challenges [47]. Moreover, factors beyond altitude, such as slope, wind, and relative humidity, should also be taken into account.
The methodology proposed in this work could also be applied to assess damage levels for insurance purposes, similar to the approach used by Lou et al. [48] in China and Ramón-Morte et al. [49] in the province of Alicante (Spain). This is an effective strategy for protecting agricultural economies from adverse climatic events like frosts [31]. Additionally, it could be valuable for future studies in other regions, such as in the development of risk maps, or for different economically significant crops prone to frost damage, such as wine grapes [50].
Author Contributions
The conceptualization, project administration, and funding acquisition were spearheaded by J.A.S., while V.C. and S.G. handled data curation and methodology. The initial drafting of the manuscript was collaboratively conducted by V.C., S.G. and Á.S.-G. All authors have read and agreed to the published version of the manuscript.
Funding
This research was funded by the European Union and the Government of the Valencian Community, which co-financed the project “Estimación de Indicadores Medioambientales en la Comunidad VALENciana usando datos de SATélite (VALENSAT)”, under the INVESTIGO 2022 funding plan (INVEST/2022/411). The Government of the Valencian Community also funded the project "Indicadores medioambientales y fenómenos adversos en la Comunidad Valenciana usando datos de satélite," under the PROMETEO 2023 funding plan (CIPROM/2023/42). Additionally, it received funding from the Spanish Ministry of Science and Innovation through the PID2020-112494RB-I00 IPL-LSTM project.
Data Availability Statement
Data are contained within the article.
Acknowledgments
We extend our sincere gratitude to EUMETSAT, the Spanish National Geographical Information Centre, and AEMET for their invaluable data, which played a crucial role in supporting the research presented in this paper.
Conflicts of Interest
The authors declare no conflicts of interest. The funders had no role in the design of the study; in the collection, analyses, or interpretation of data; in the writing of the manuscript; or in the decision to publish the results.
Appendix A

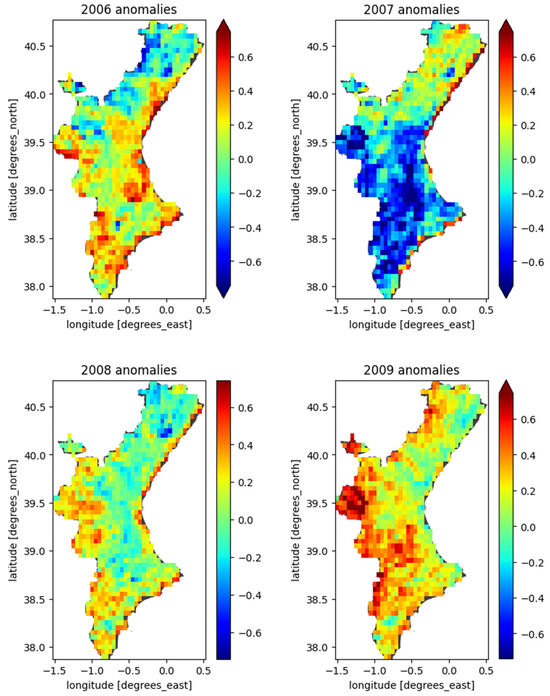
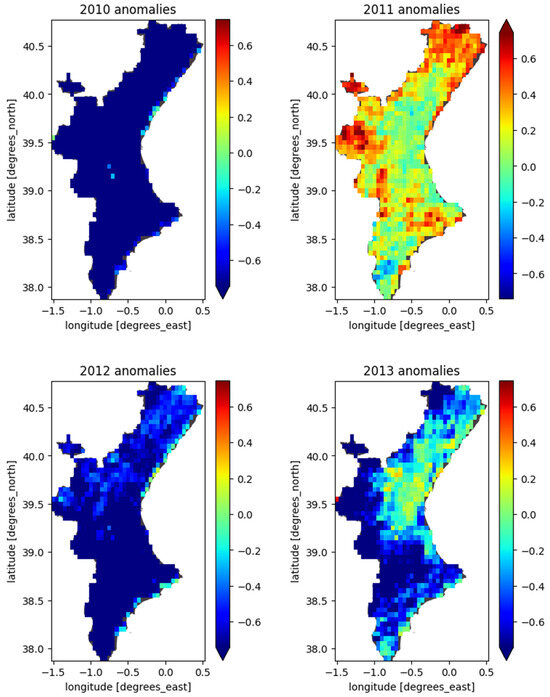
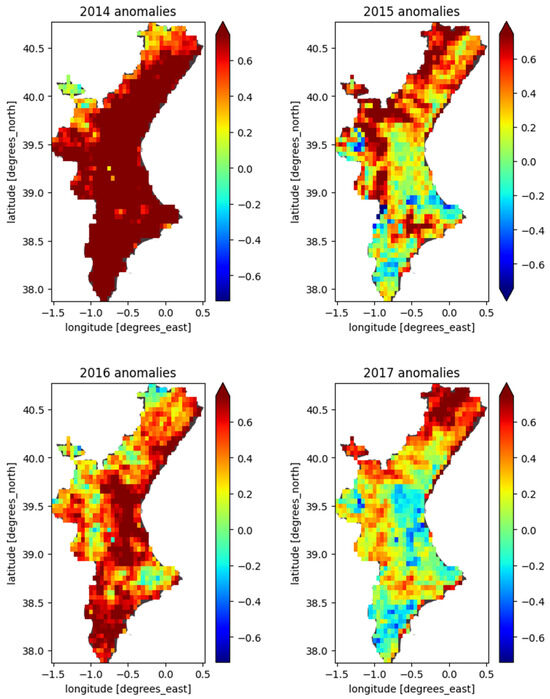


Figure A1.
Temperature anomaly maps for the Valencian Community for each year in the entire study period (2004–2023).
Figure A1.
Temperature anomaly maps for the Valencian Community for each year in the entire study period (2004–2023).
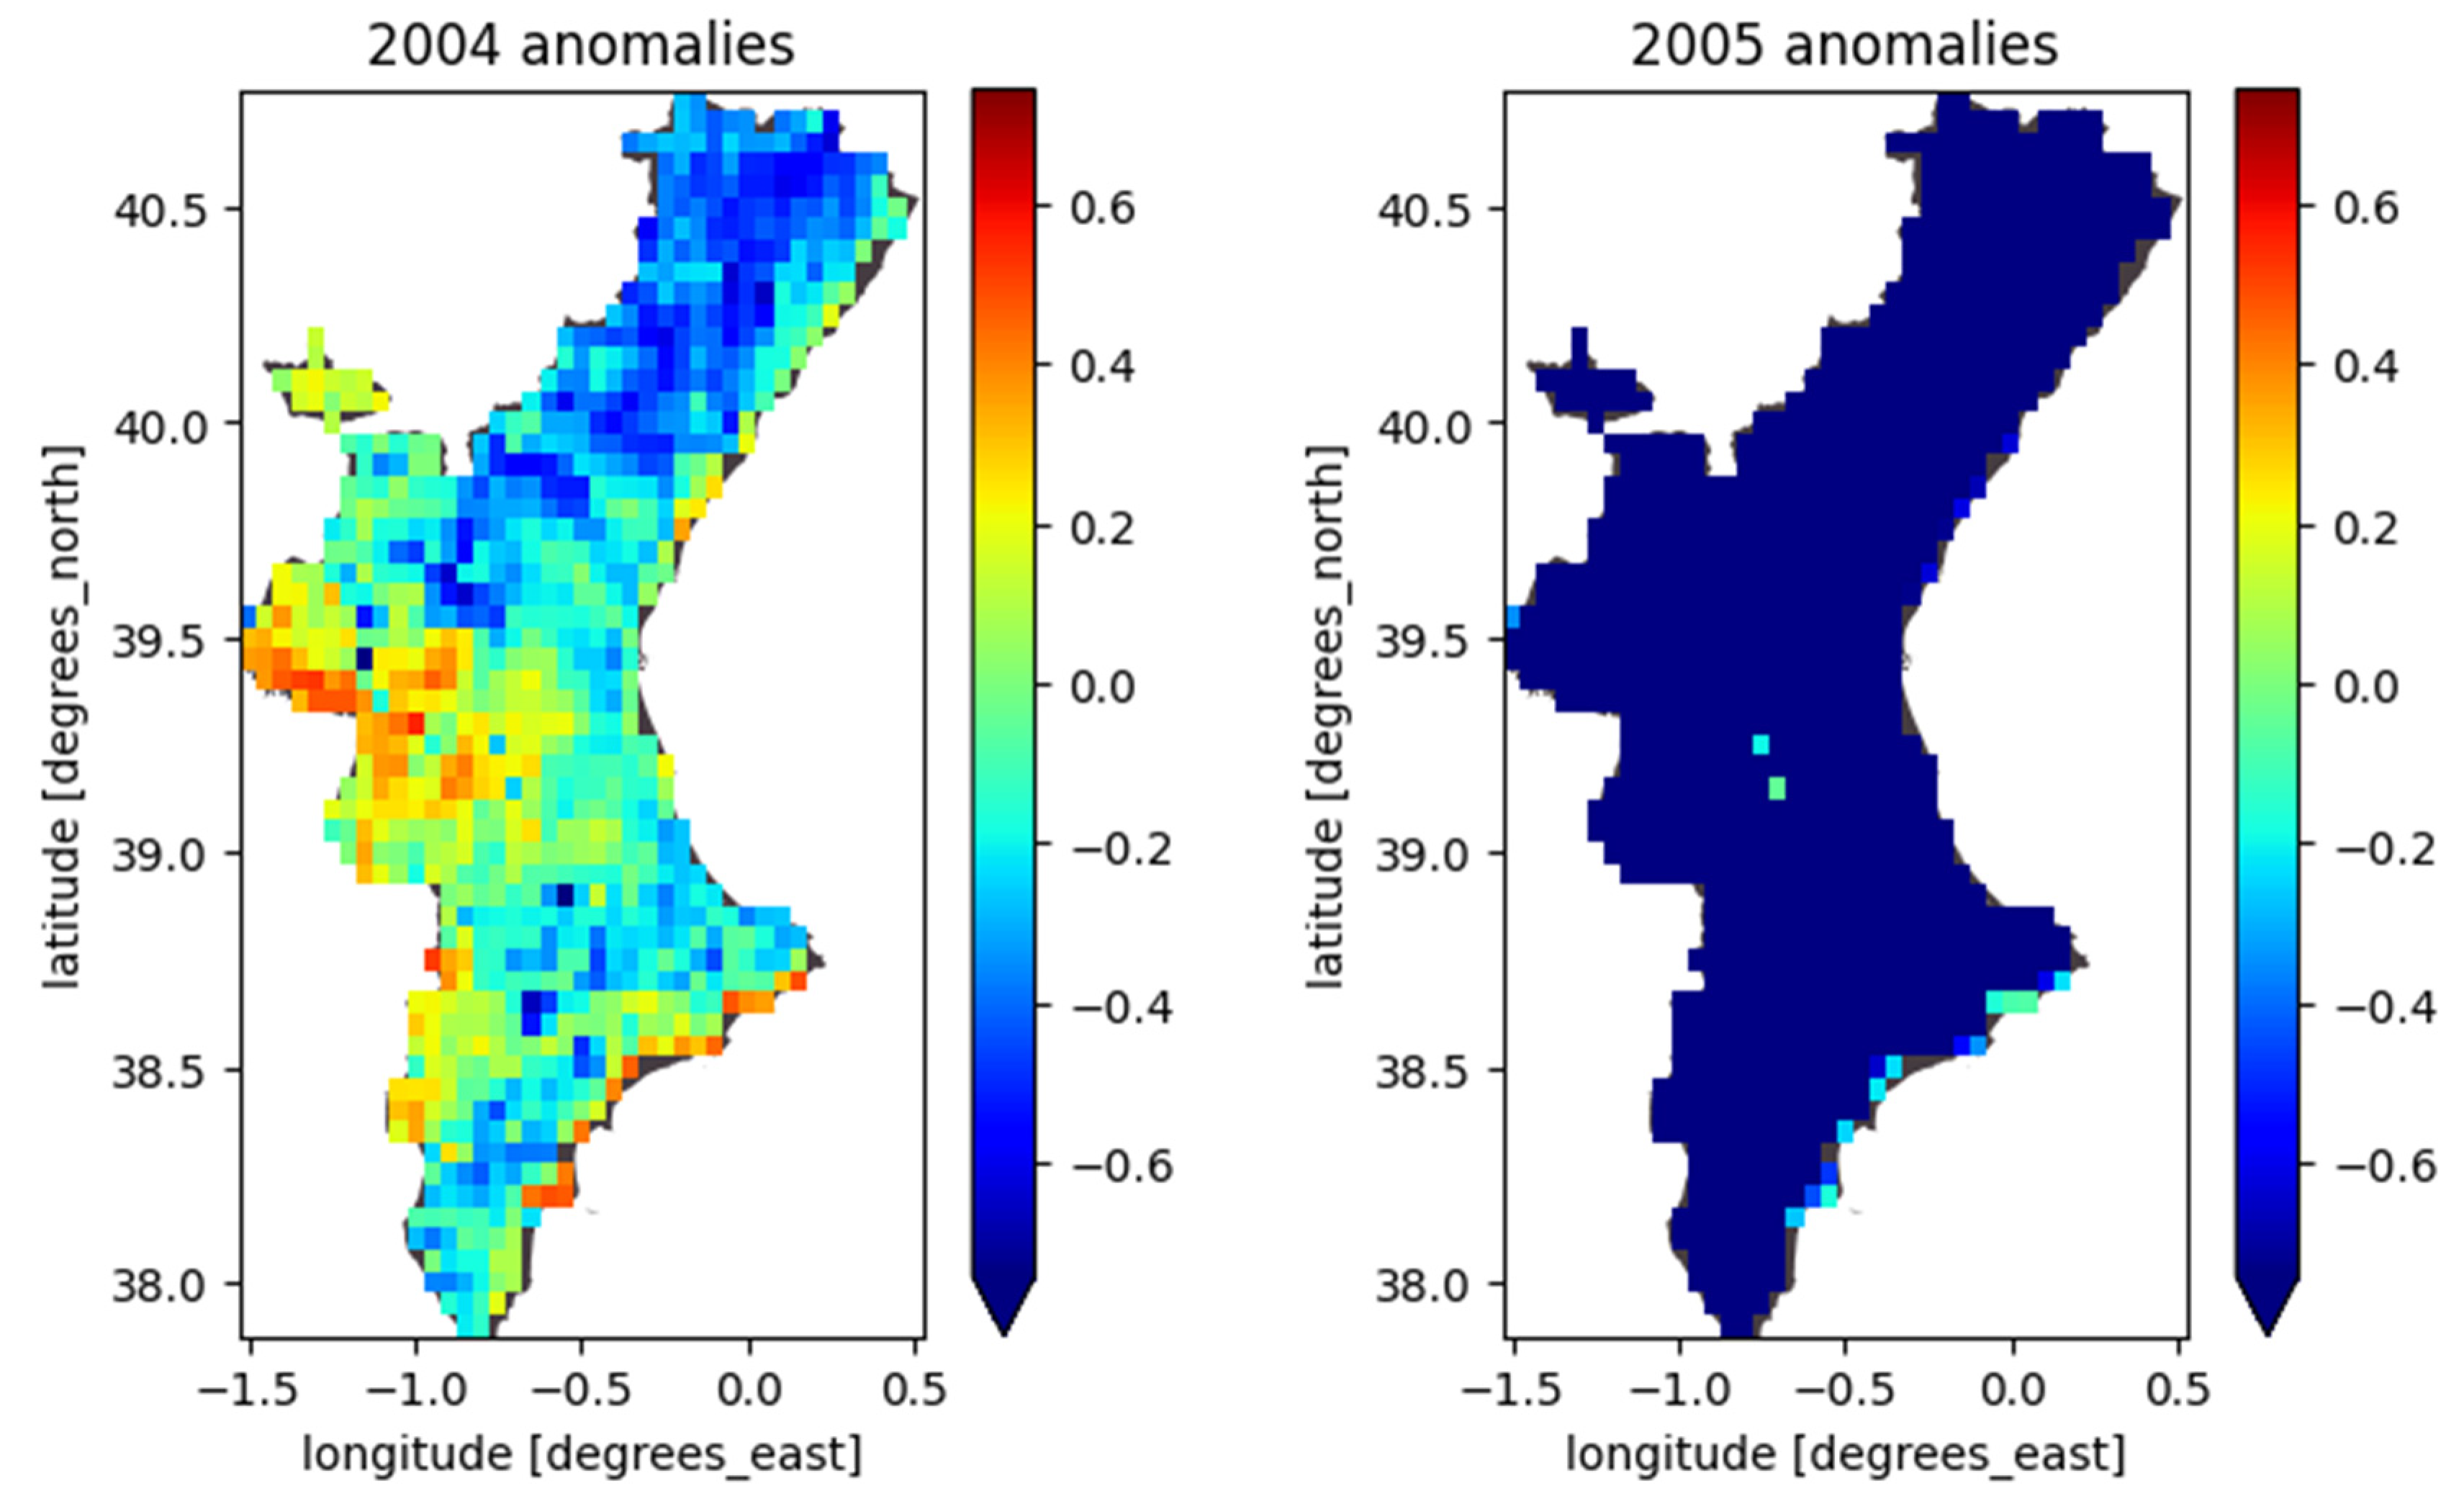
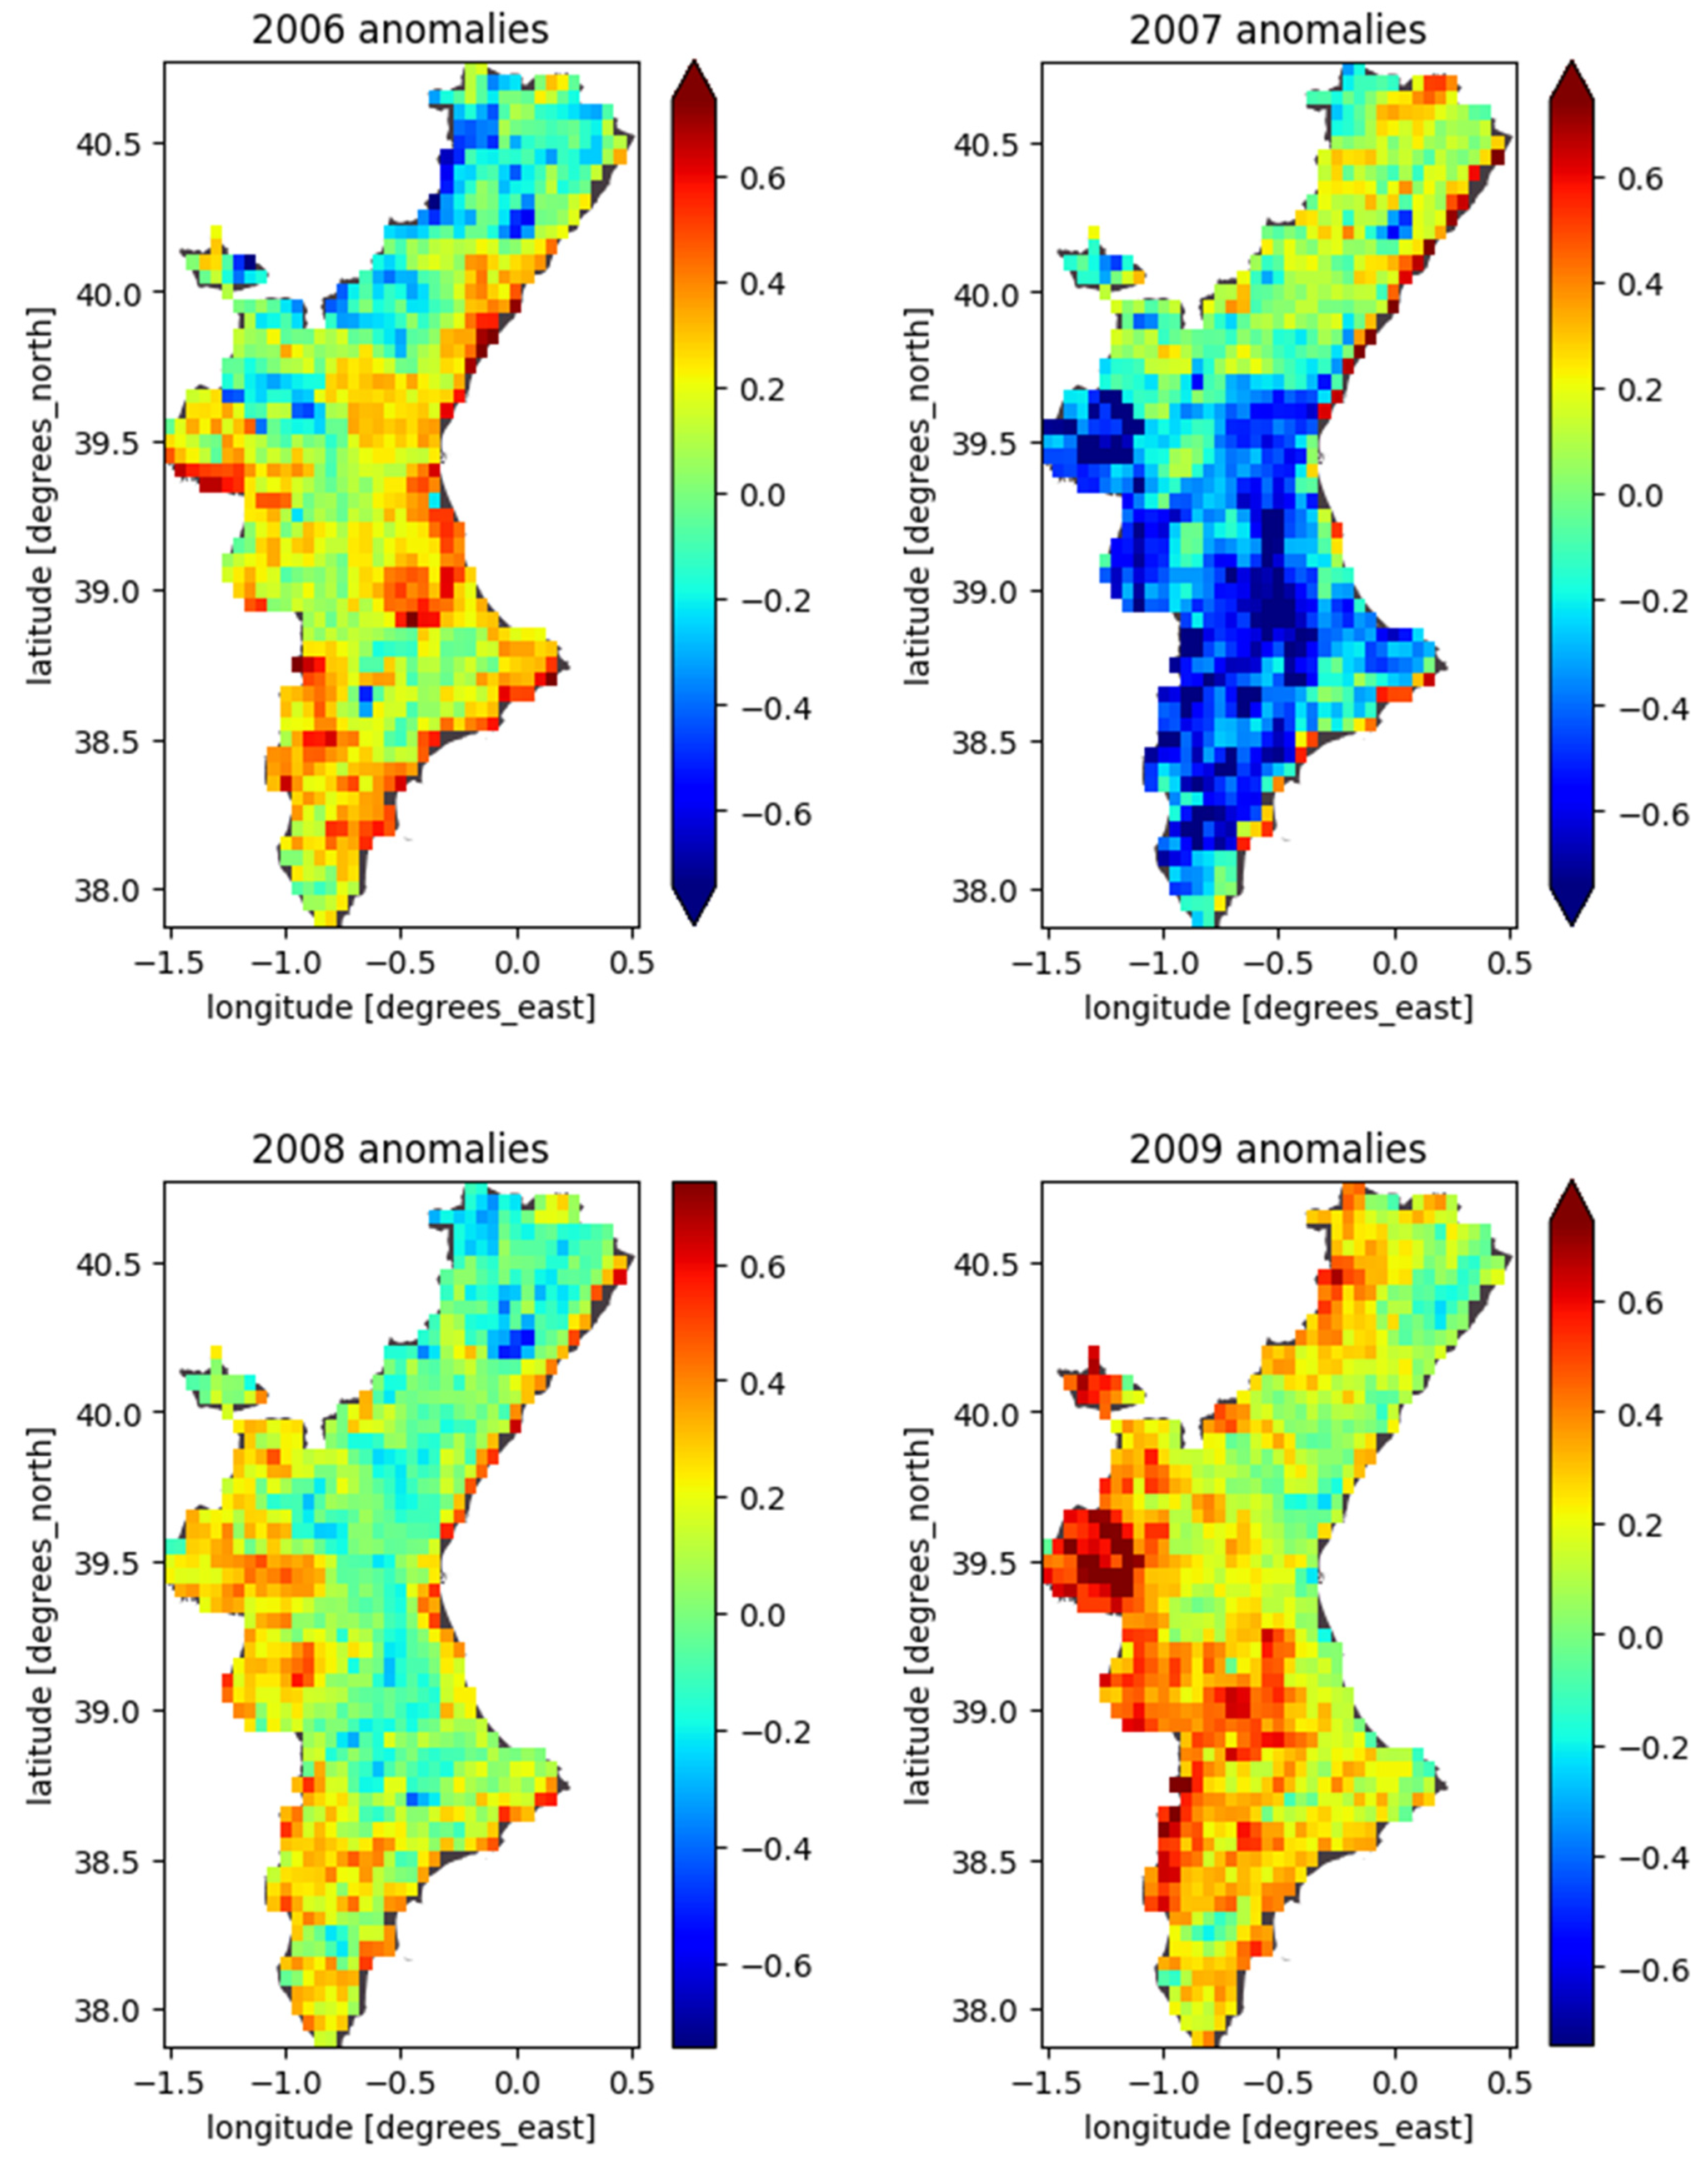

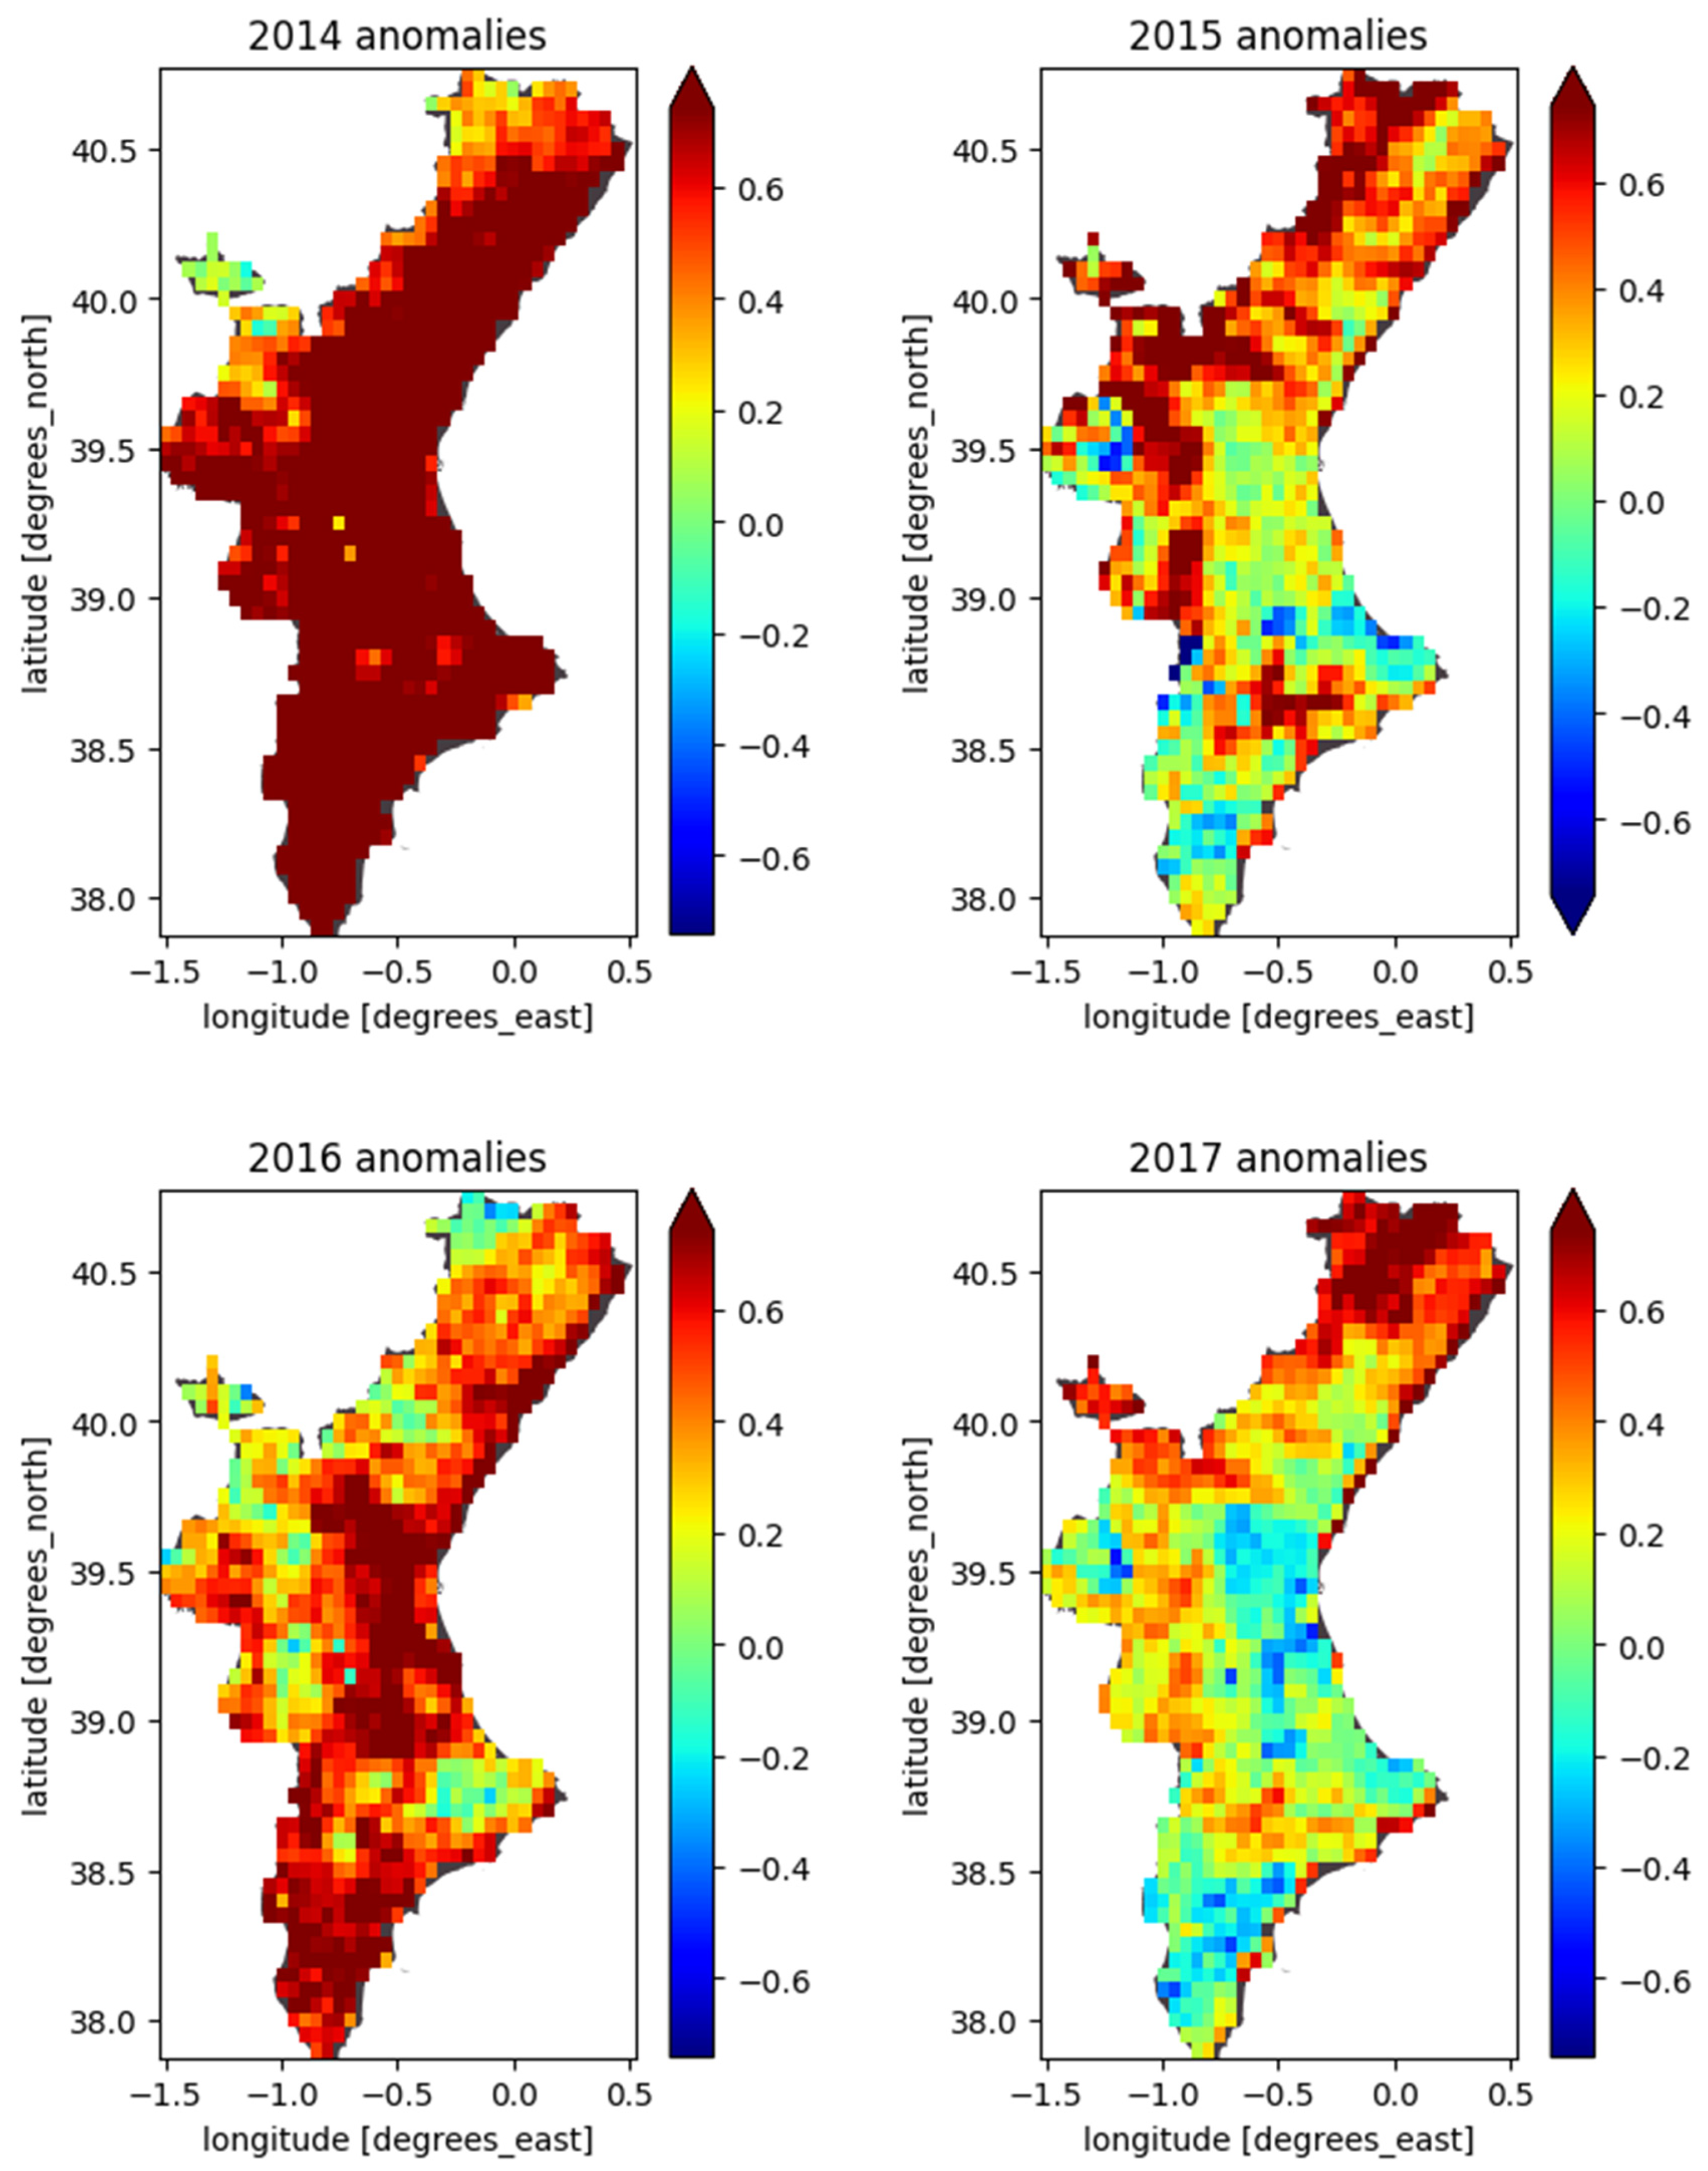
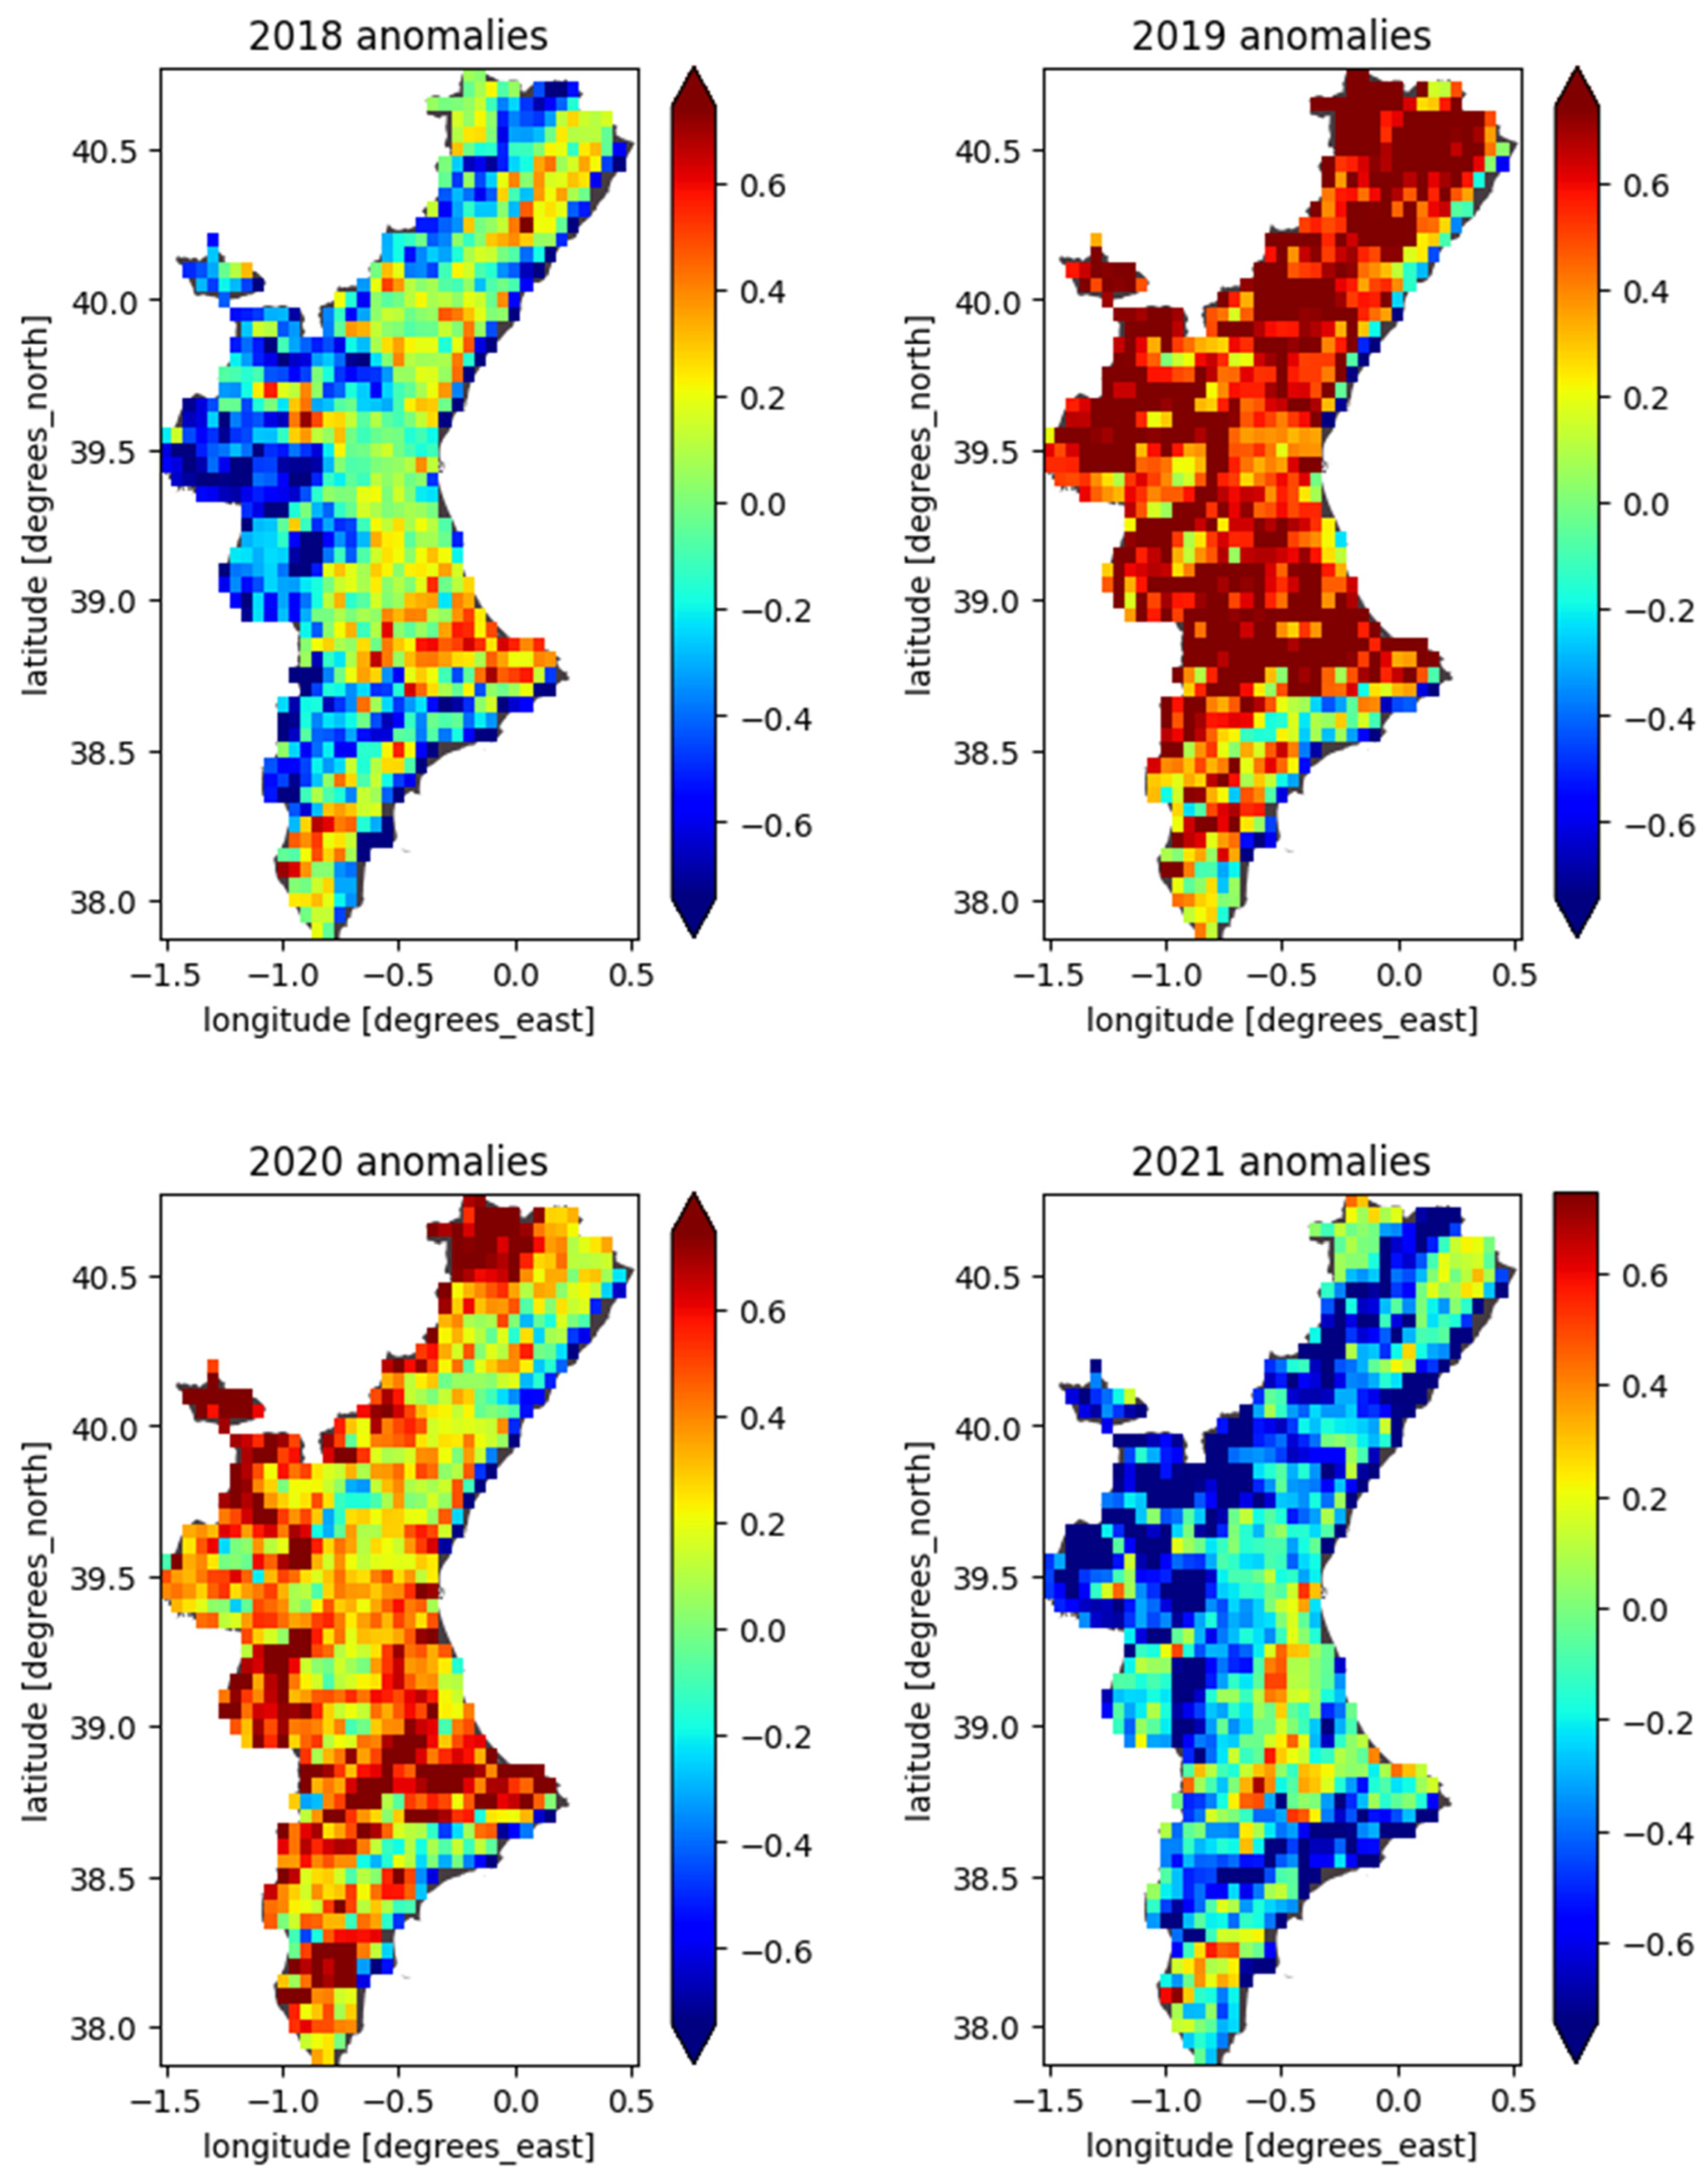
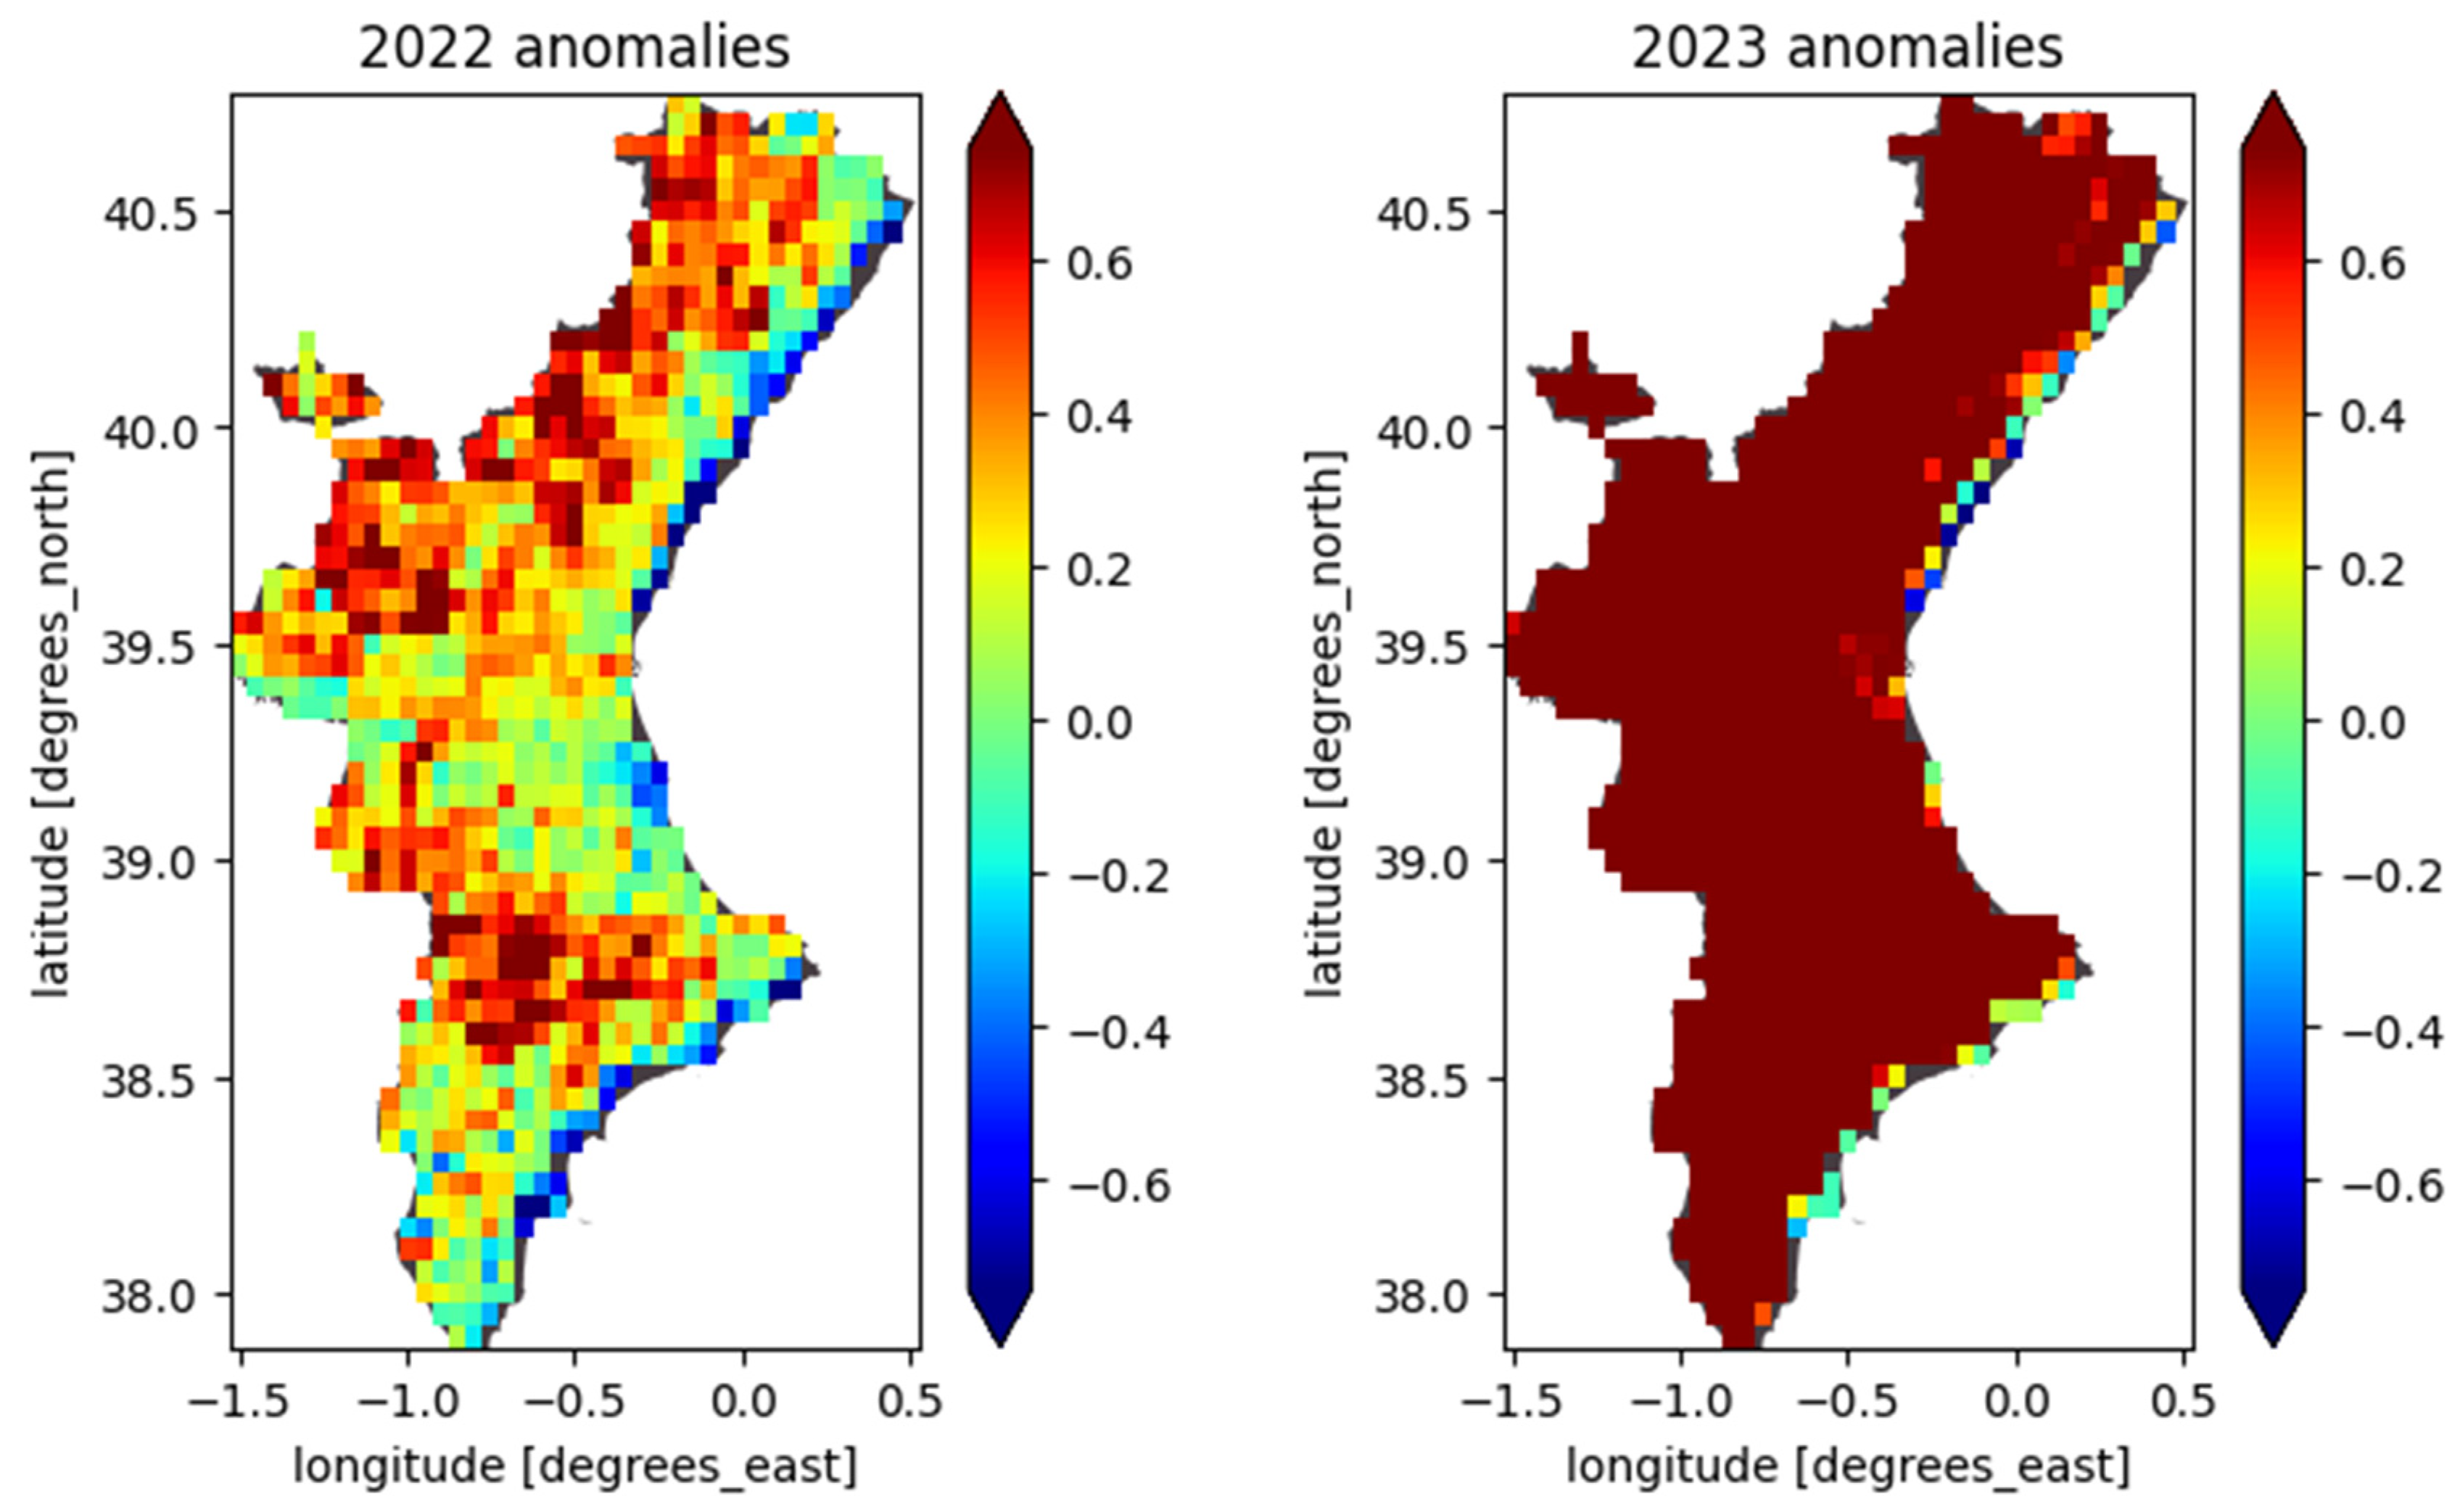
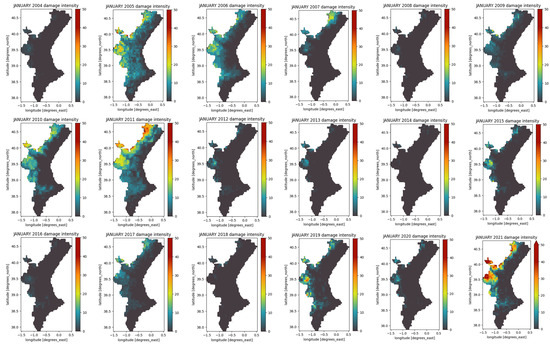
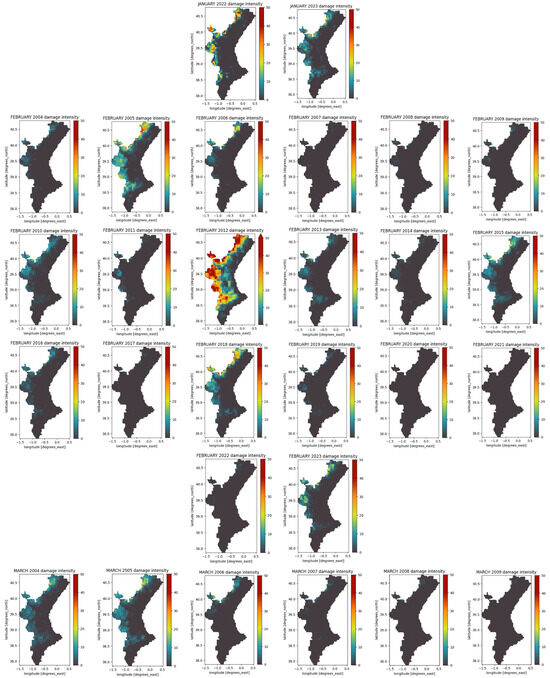
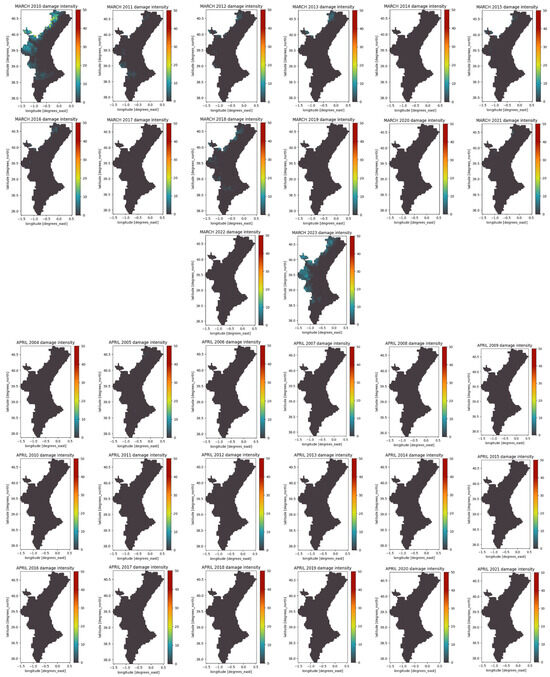

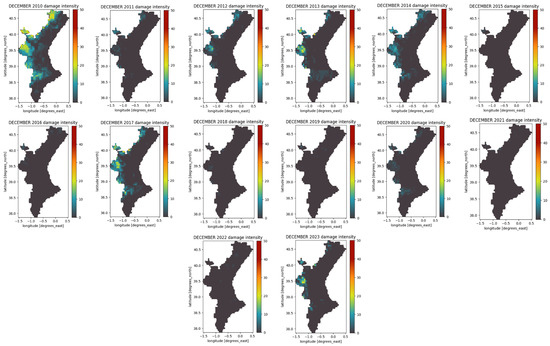
Figure A2.
Damage intensity maps for the Valencian Community in January, February, March, April, November, and December for each year in the entire study period (2004–2023).
Figure A2.
Damage intensity maps for the Valencian Community in January, February, March, April, November, and December for each year in the entire study period (2004–2023).
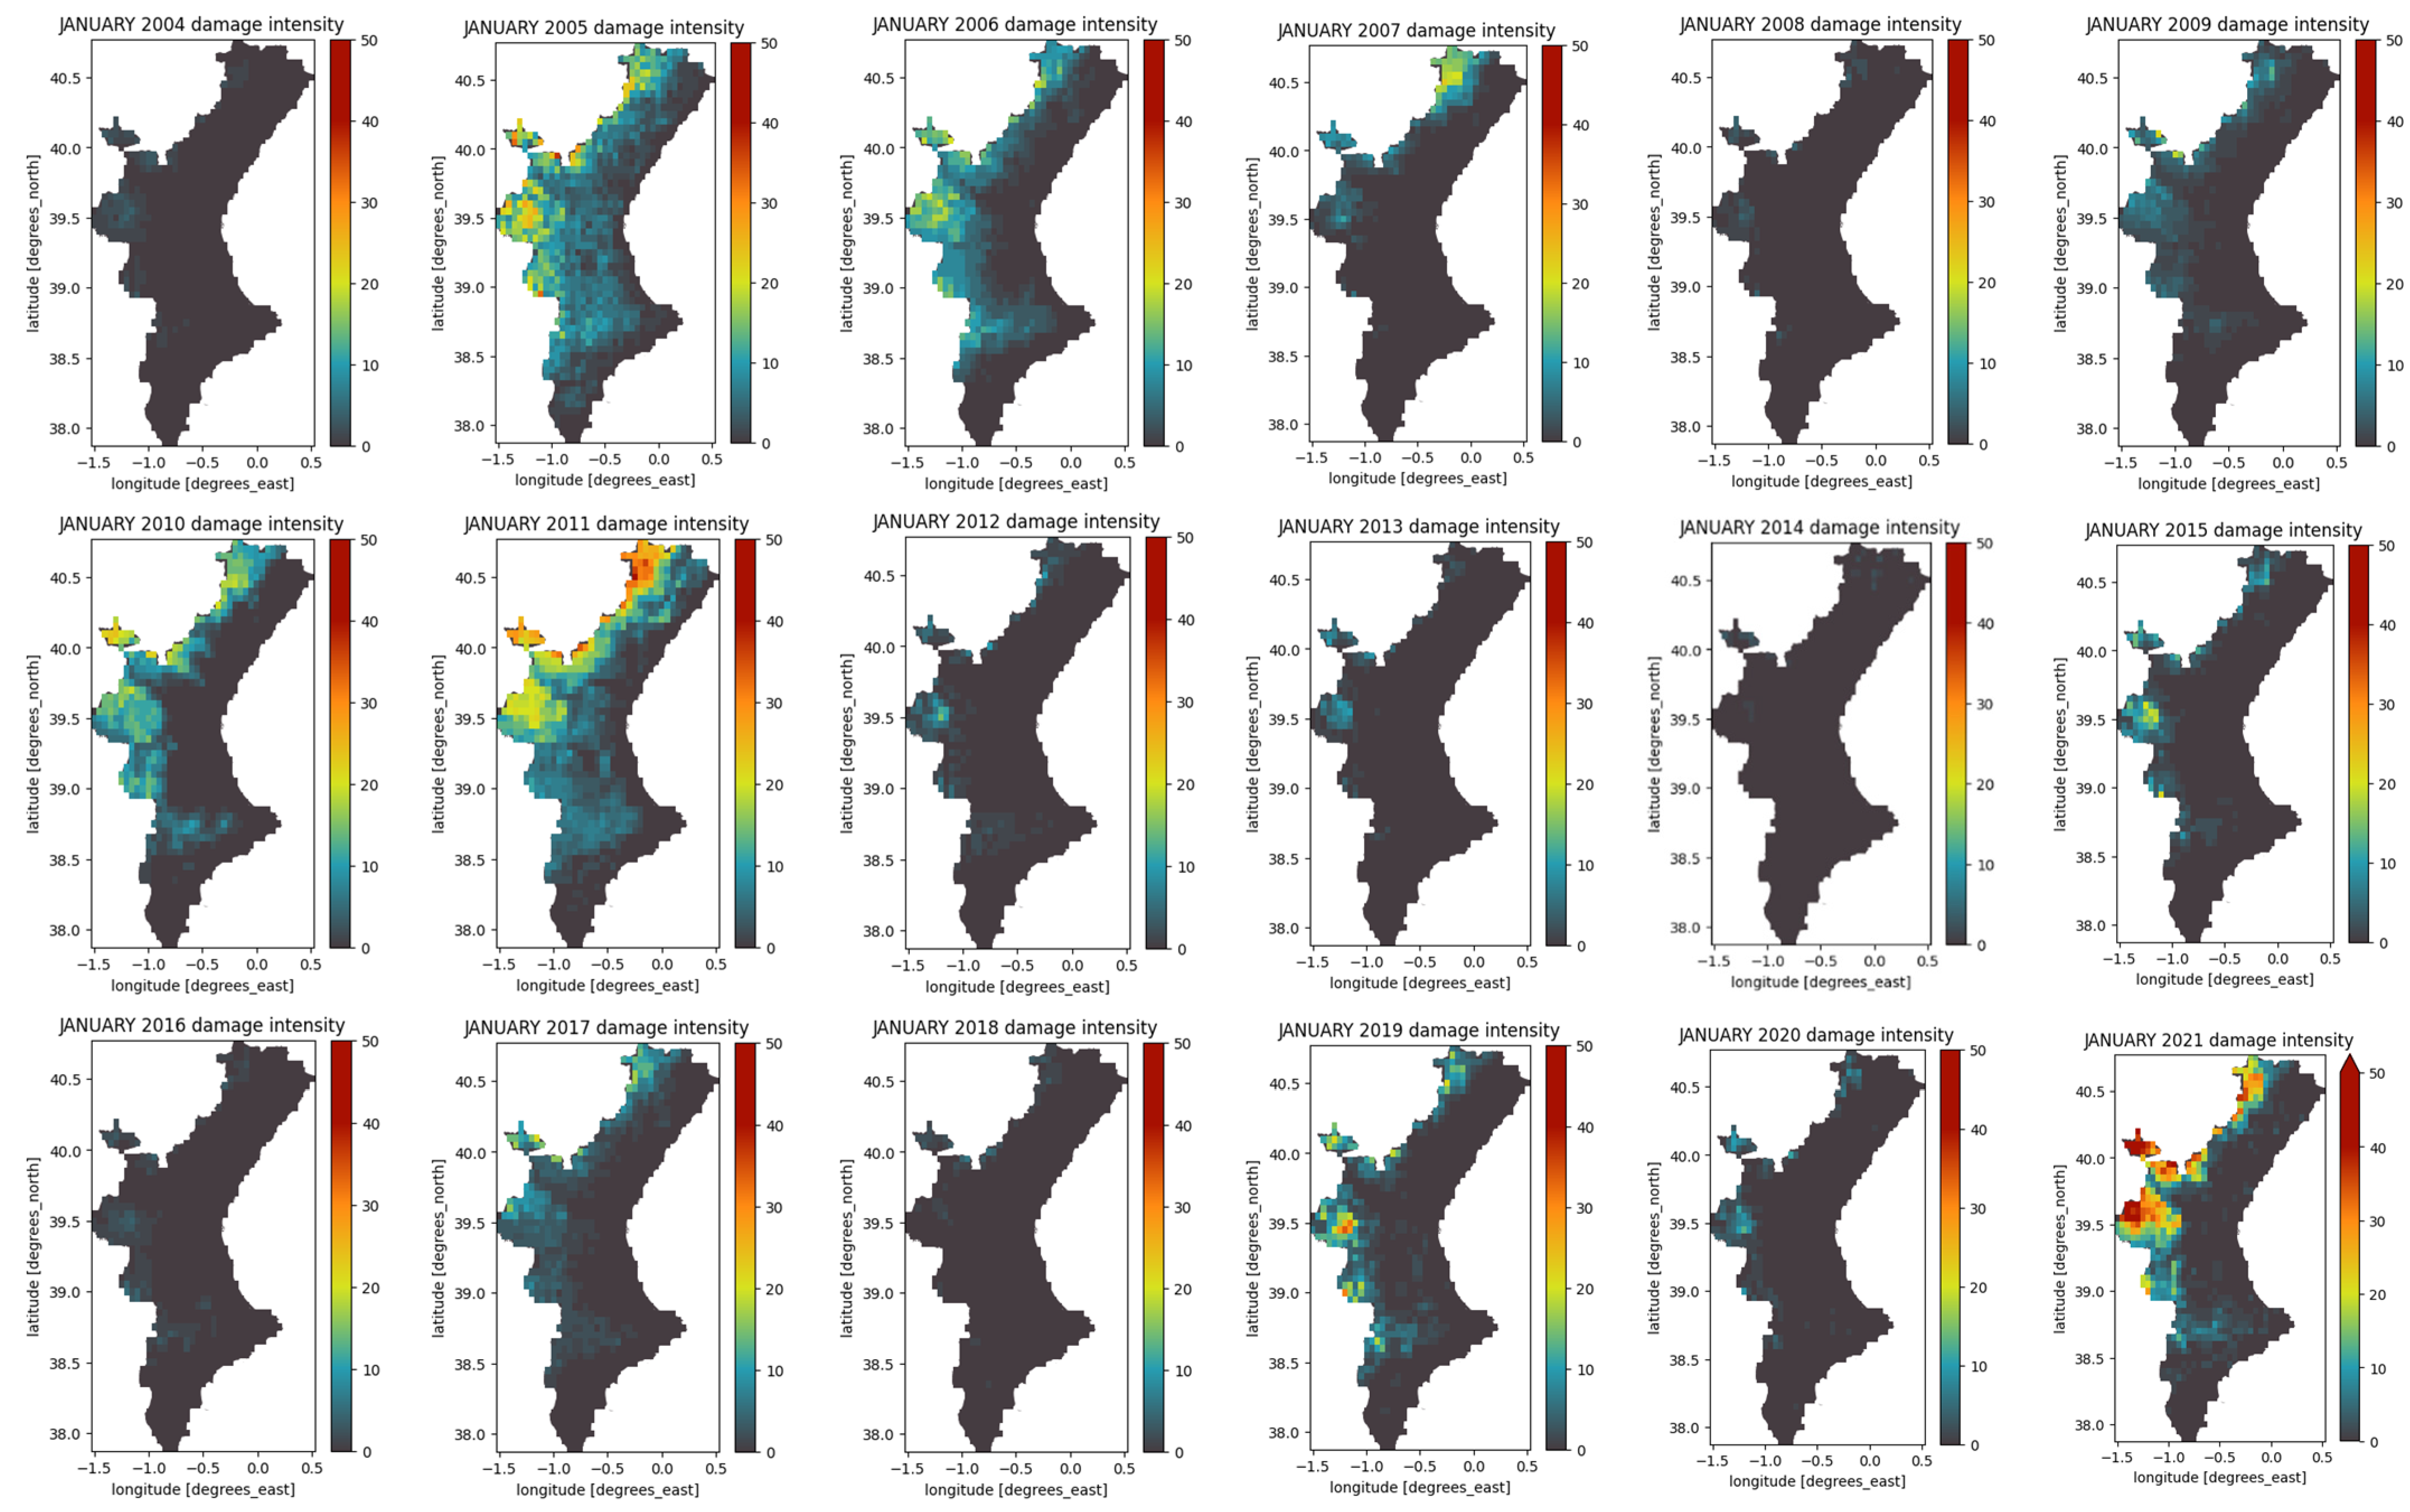
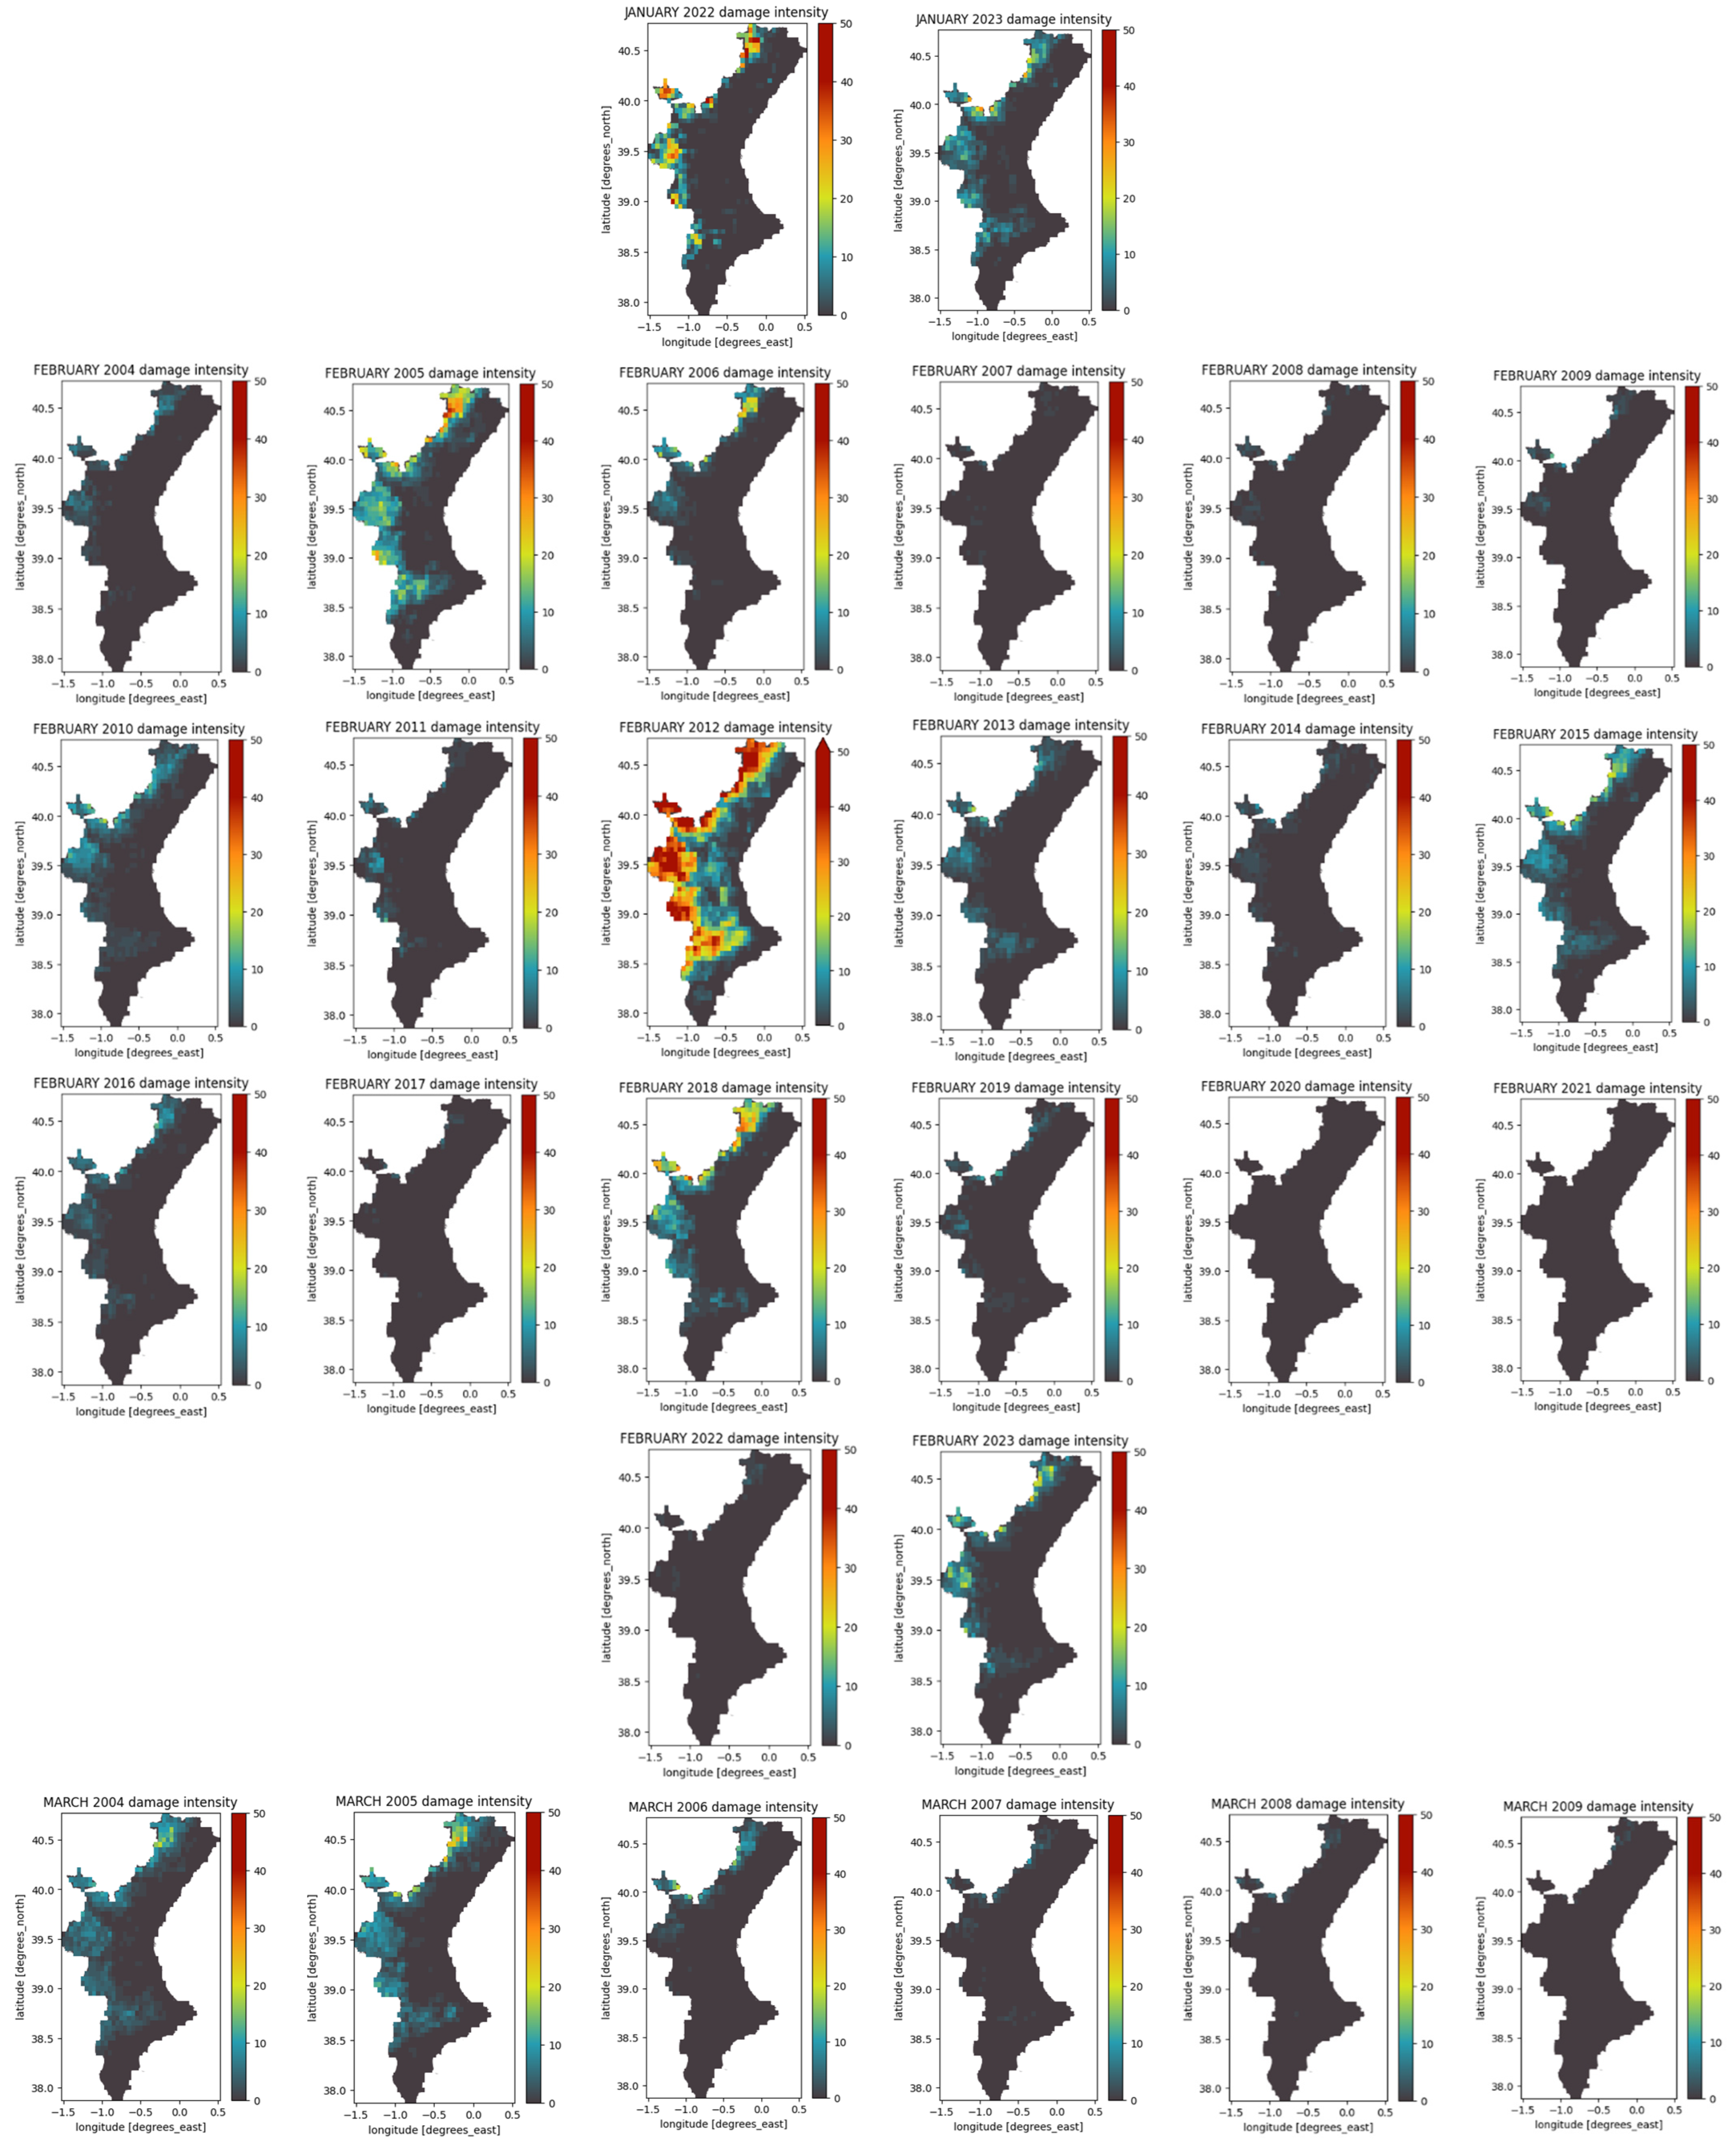
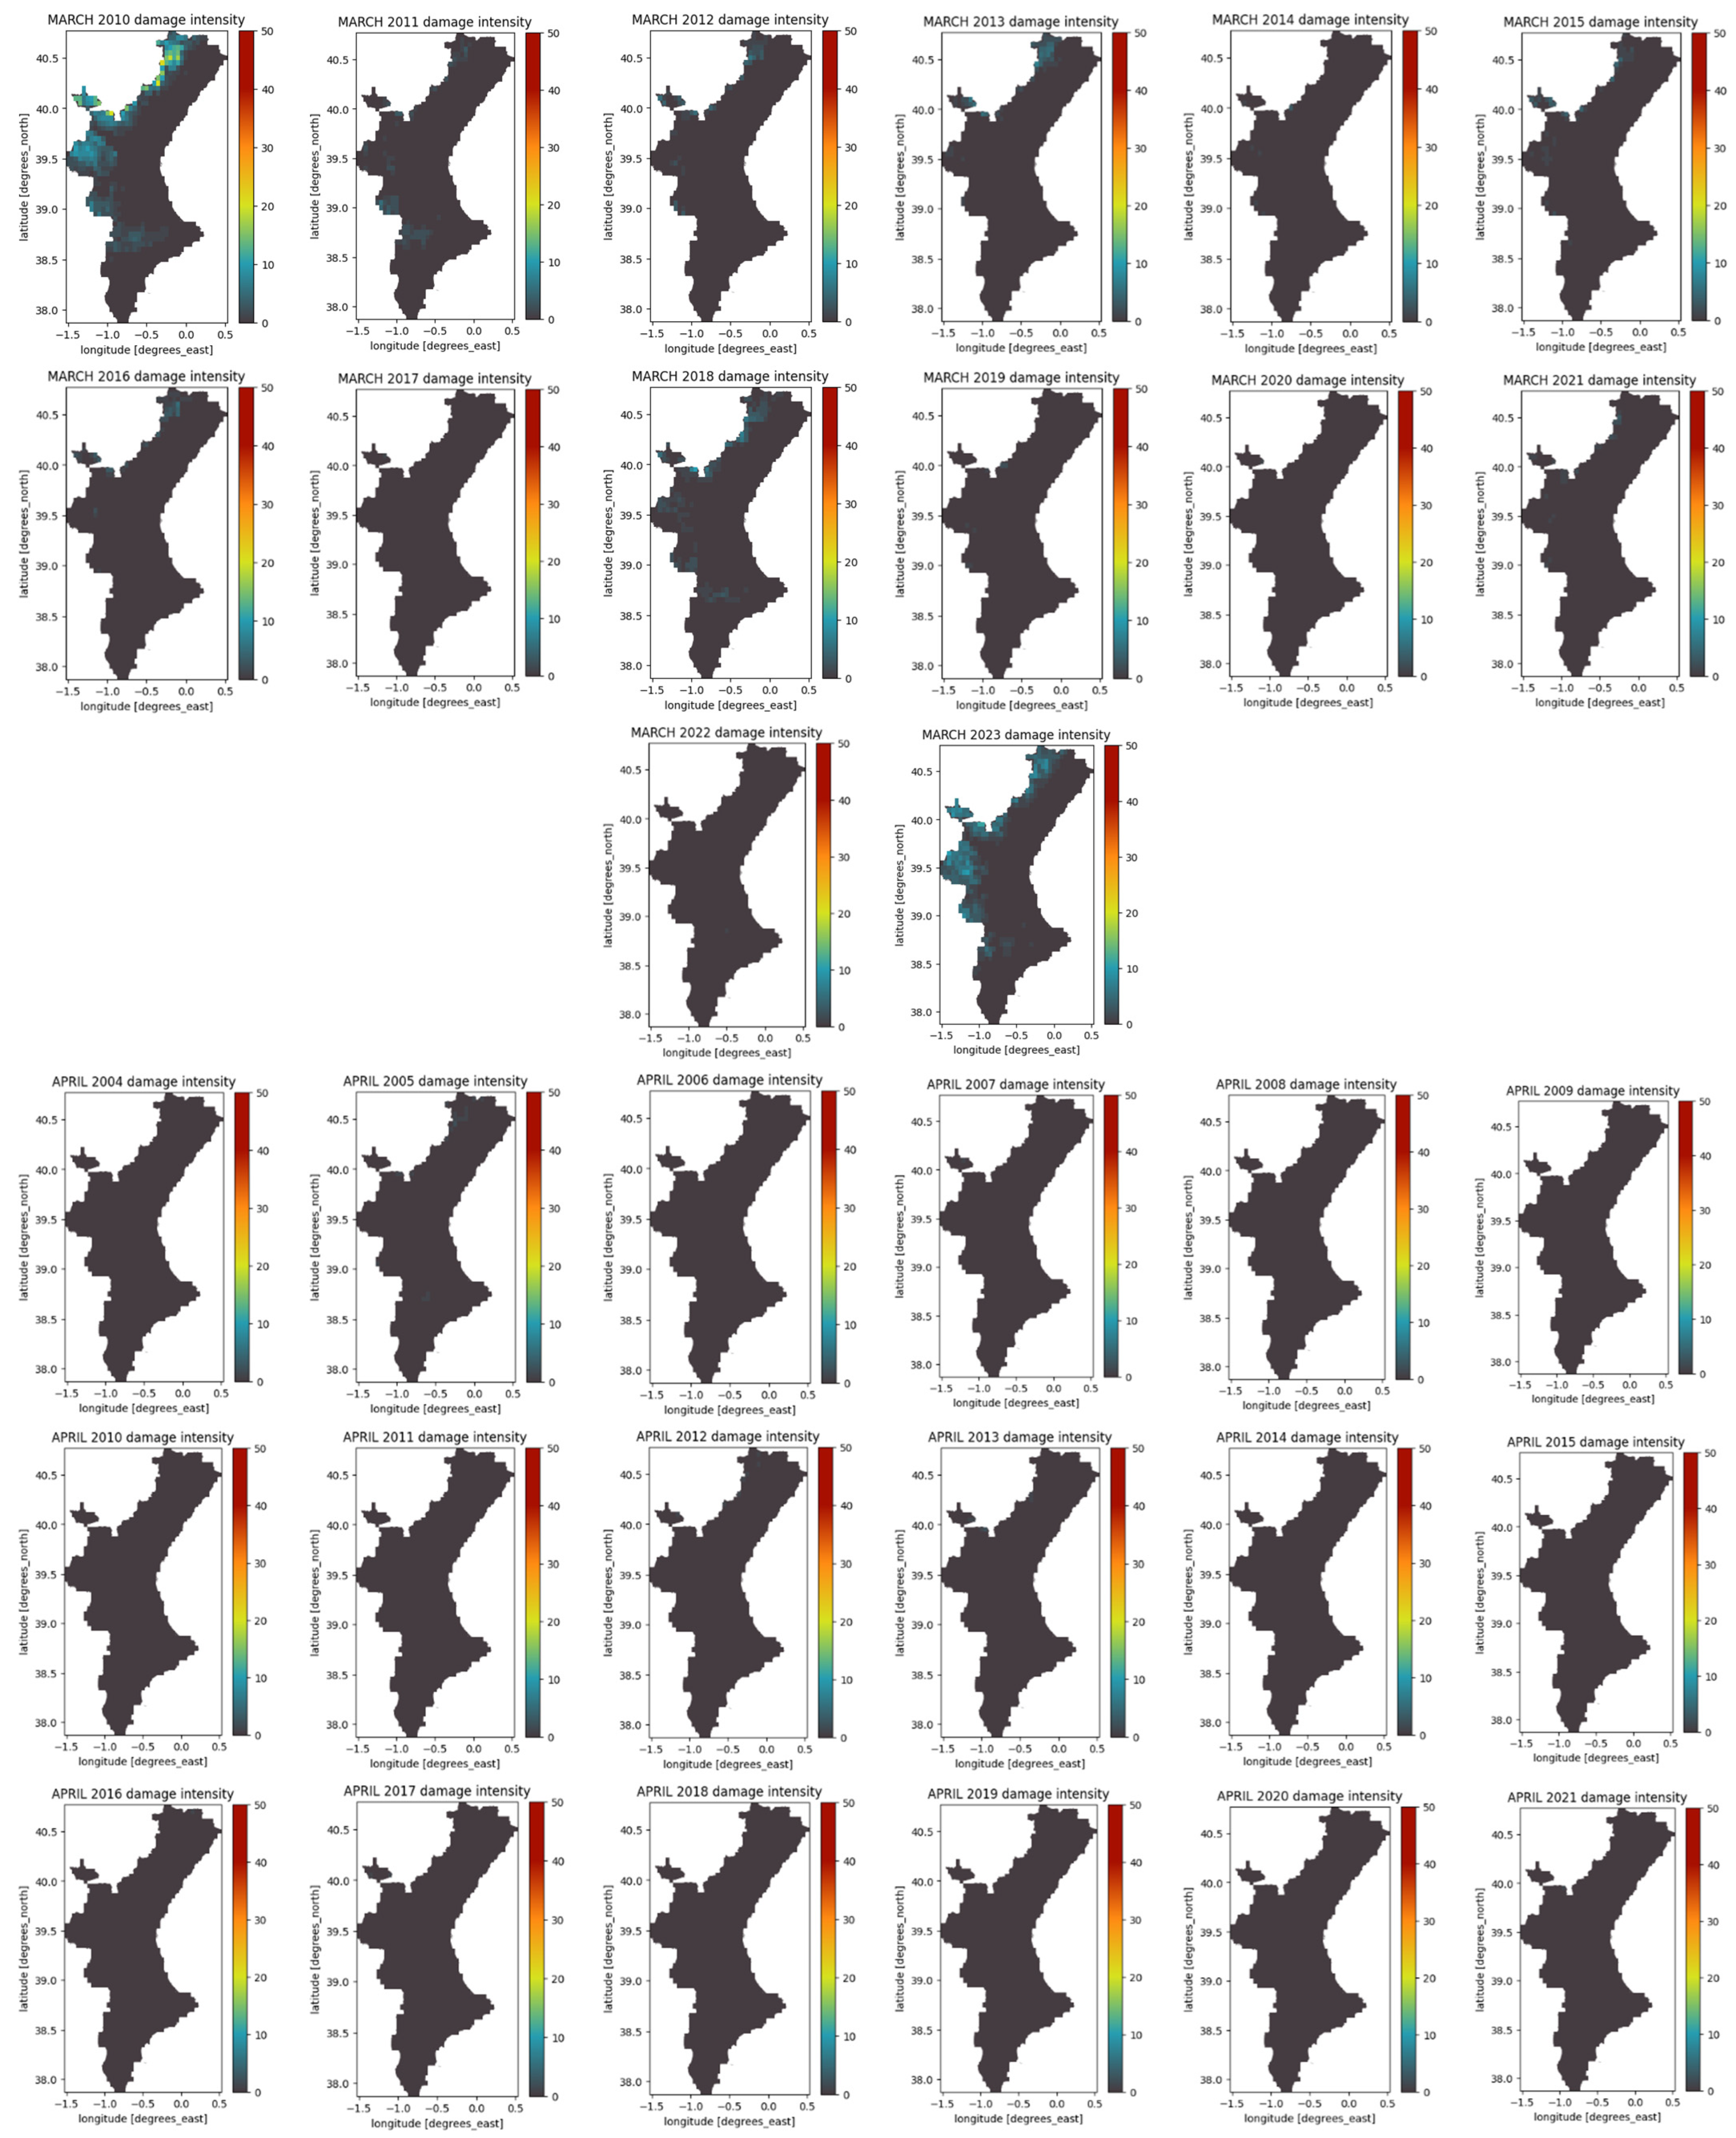
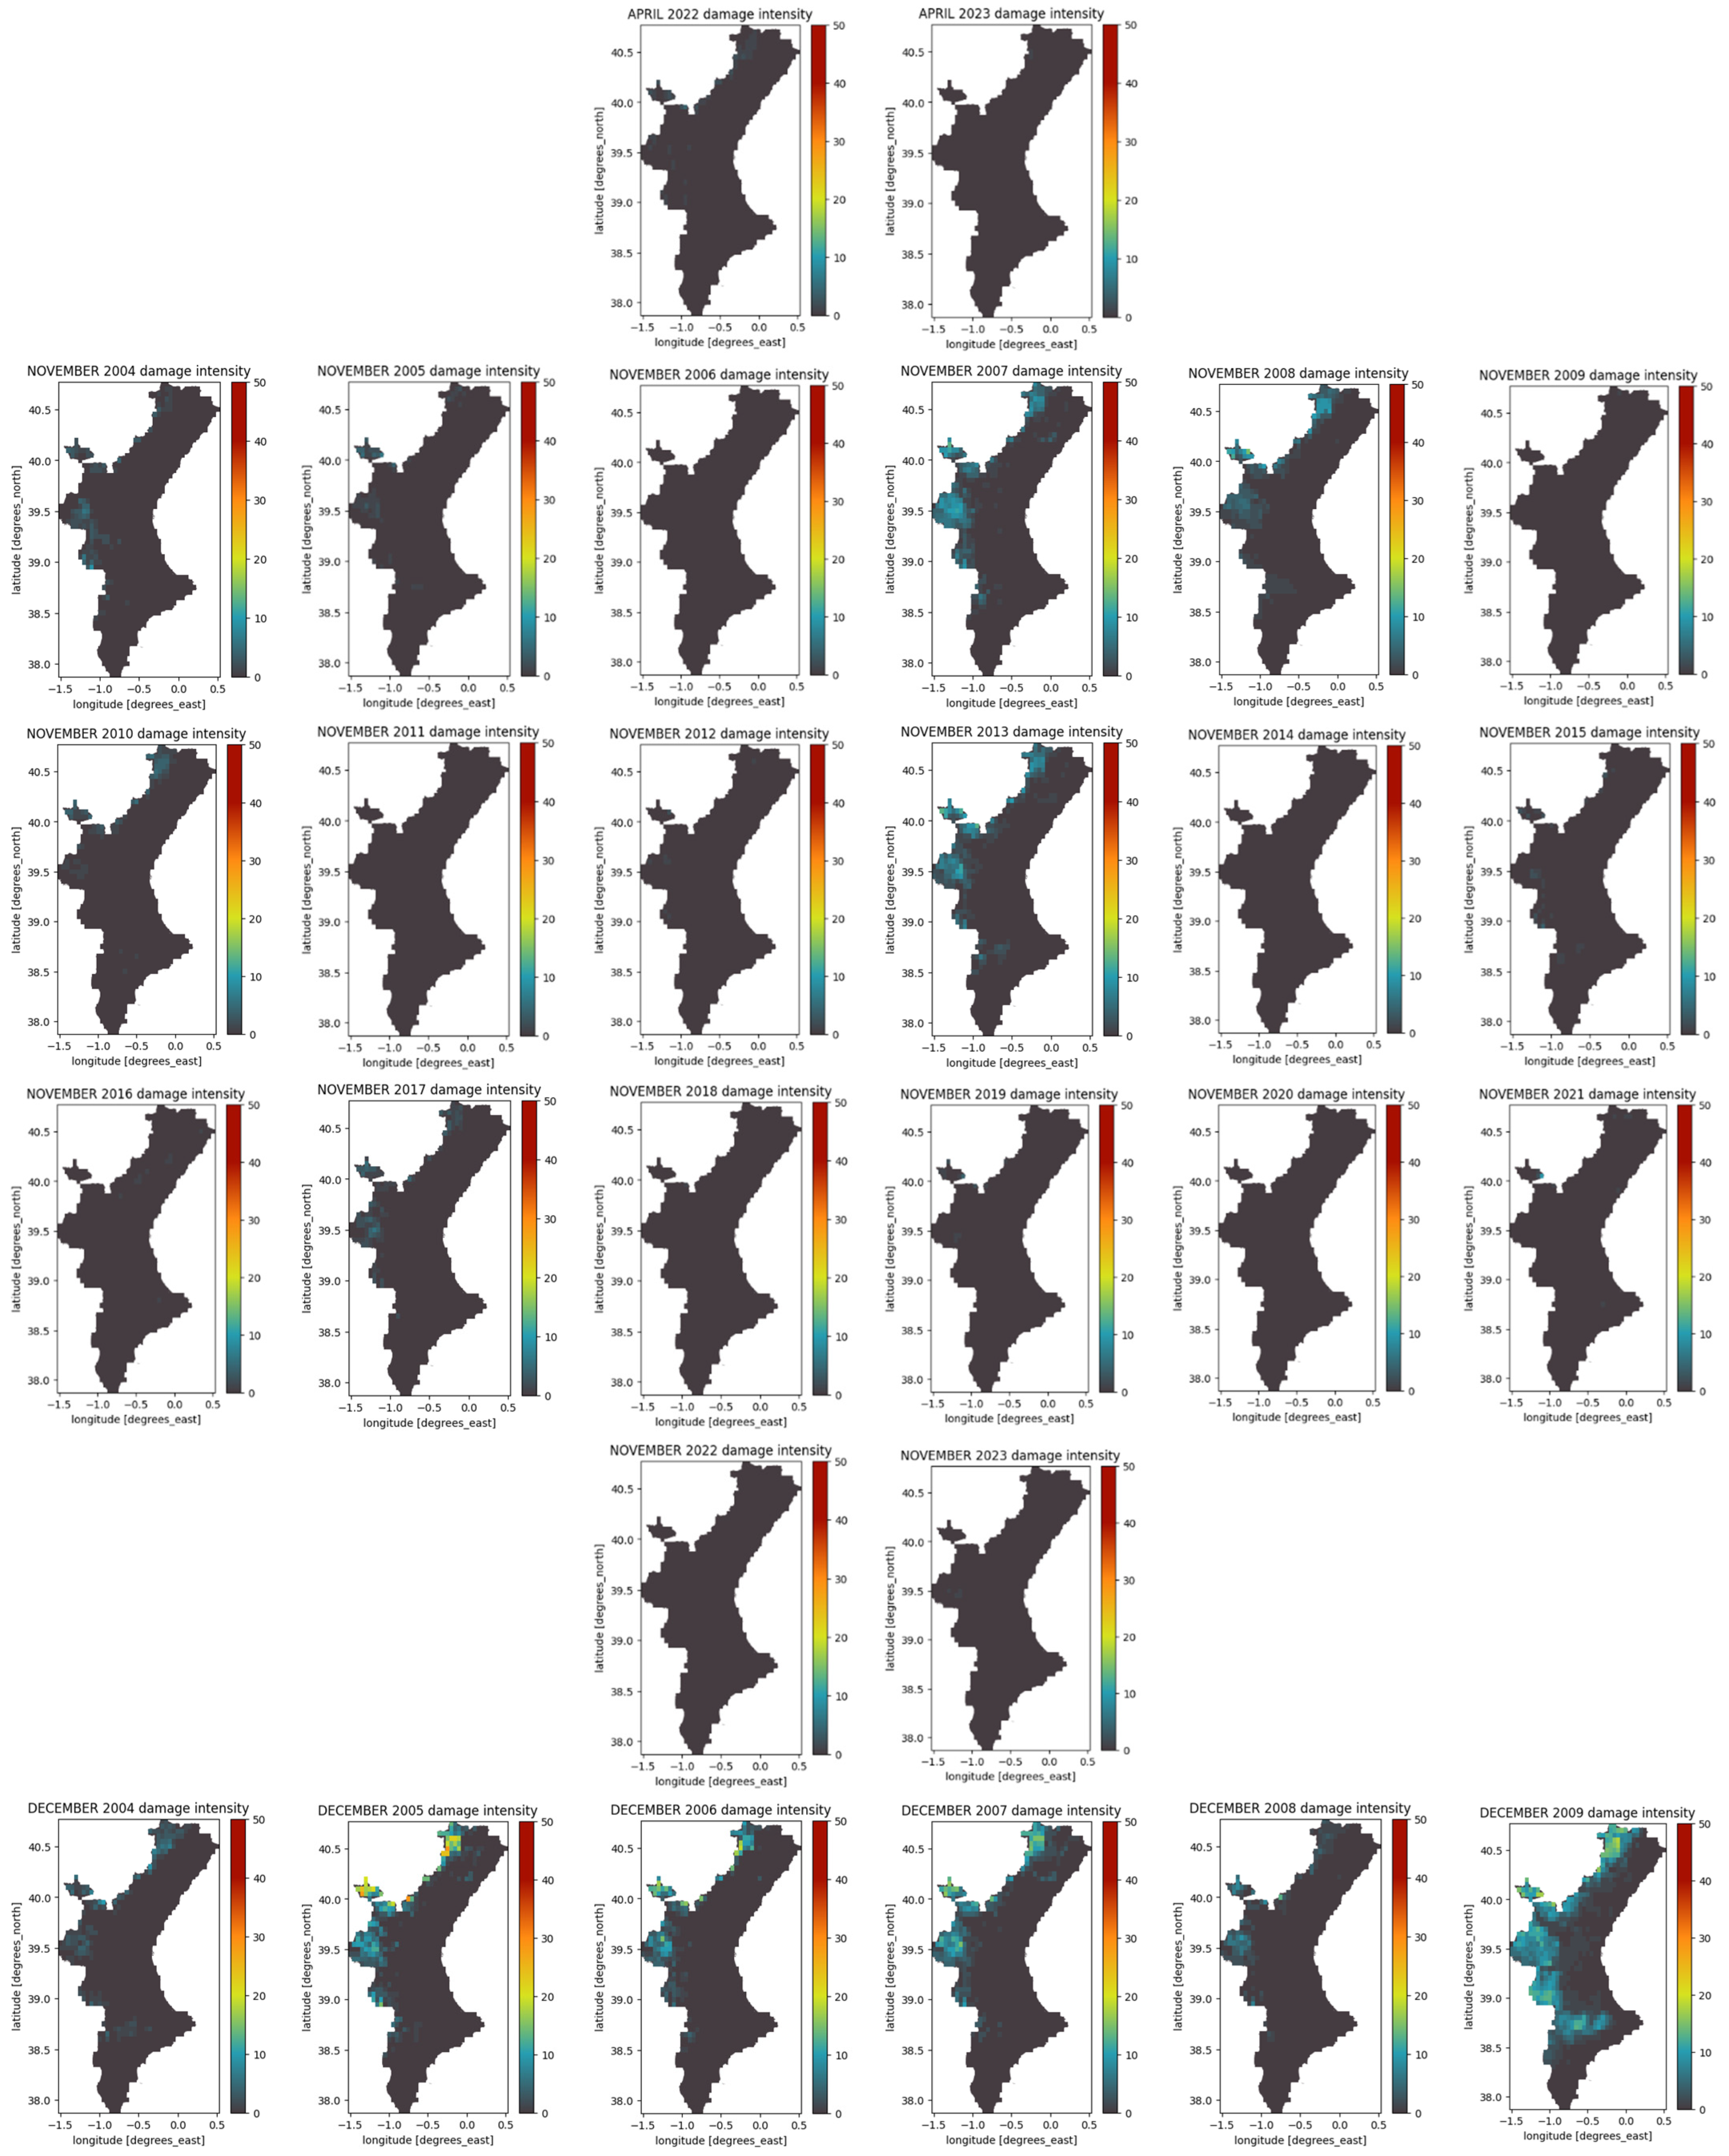
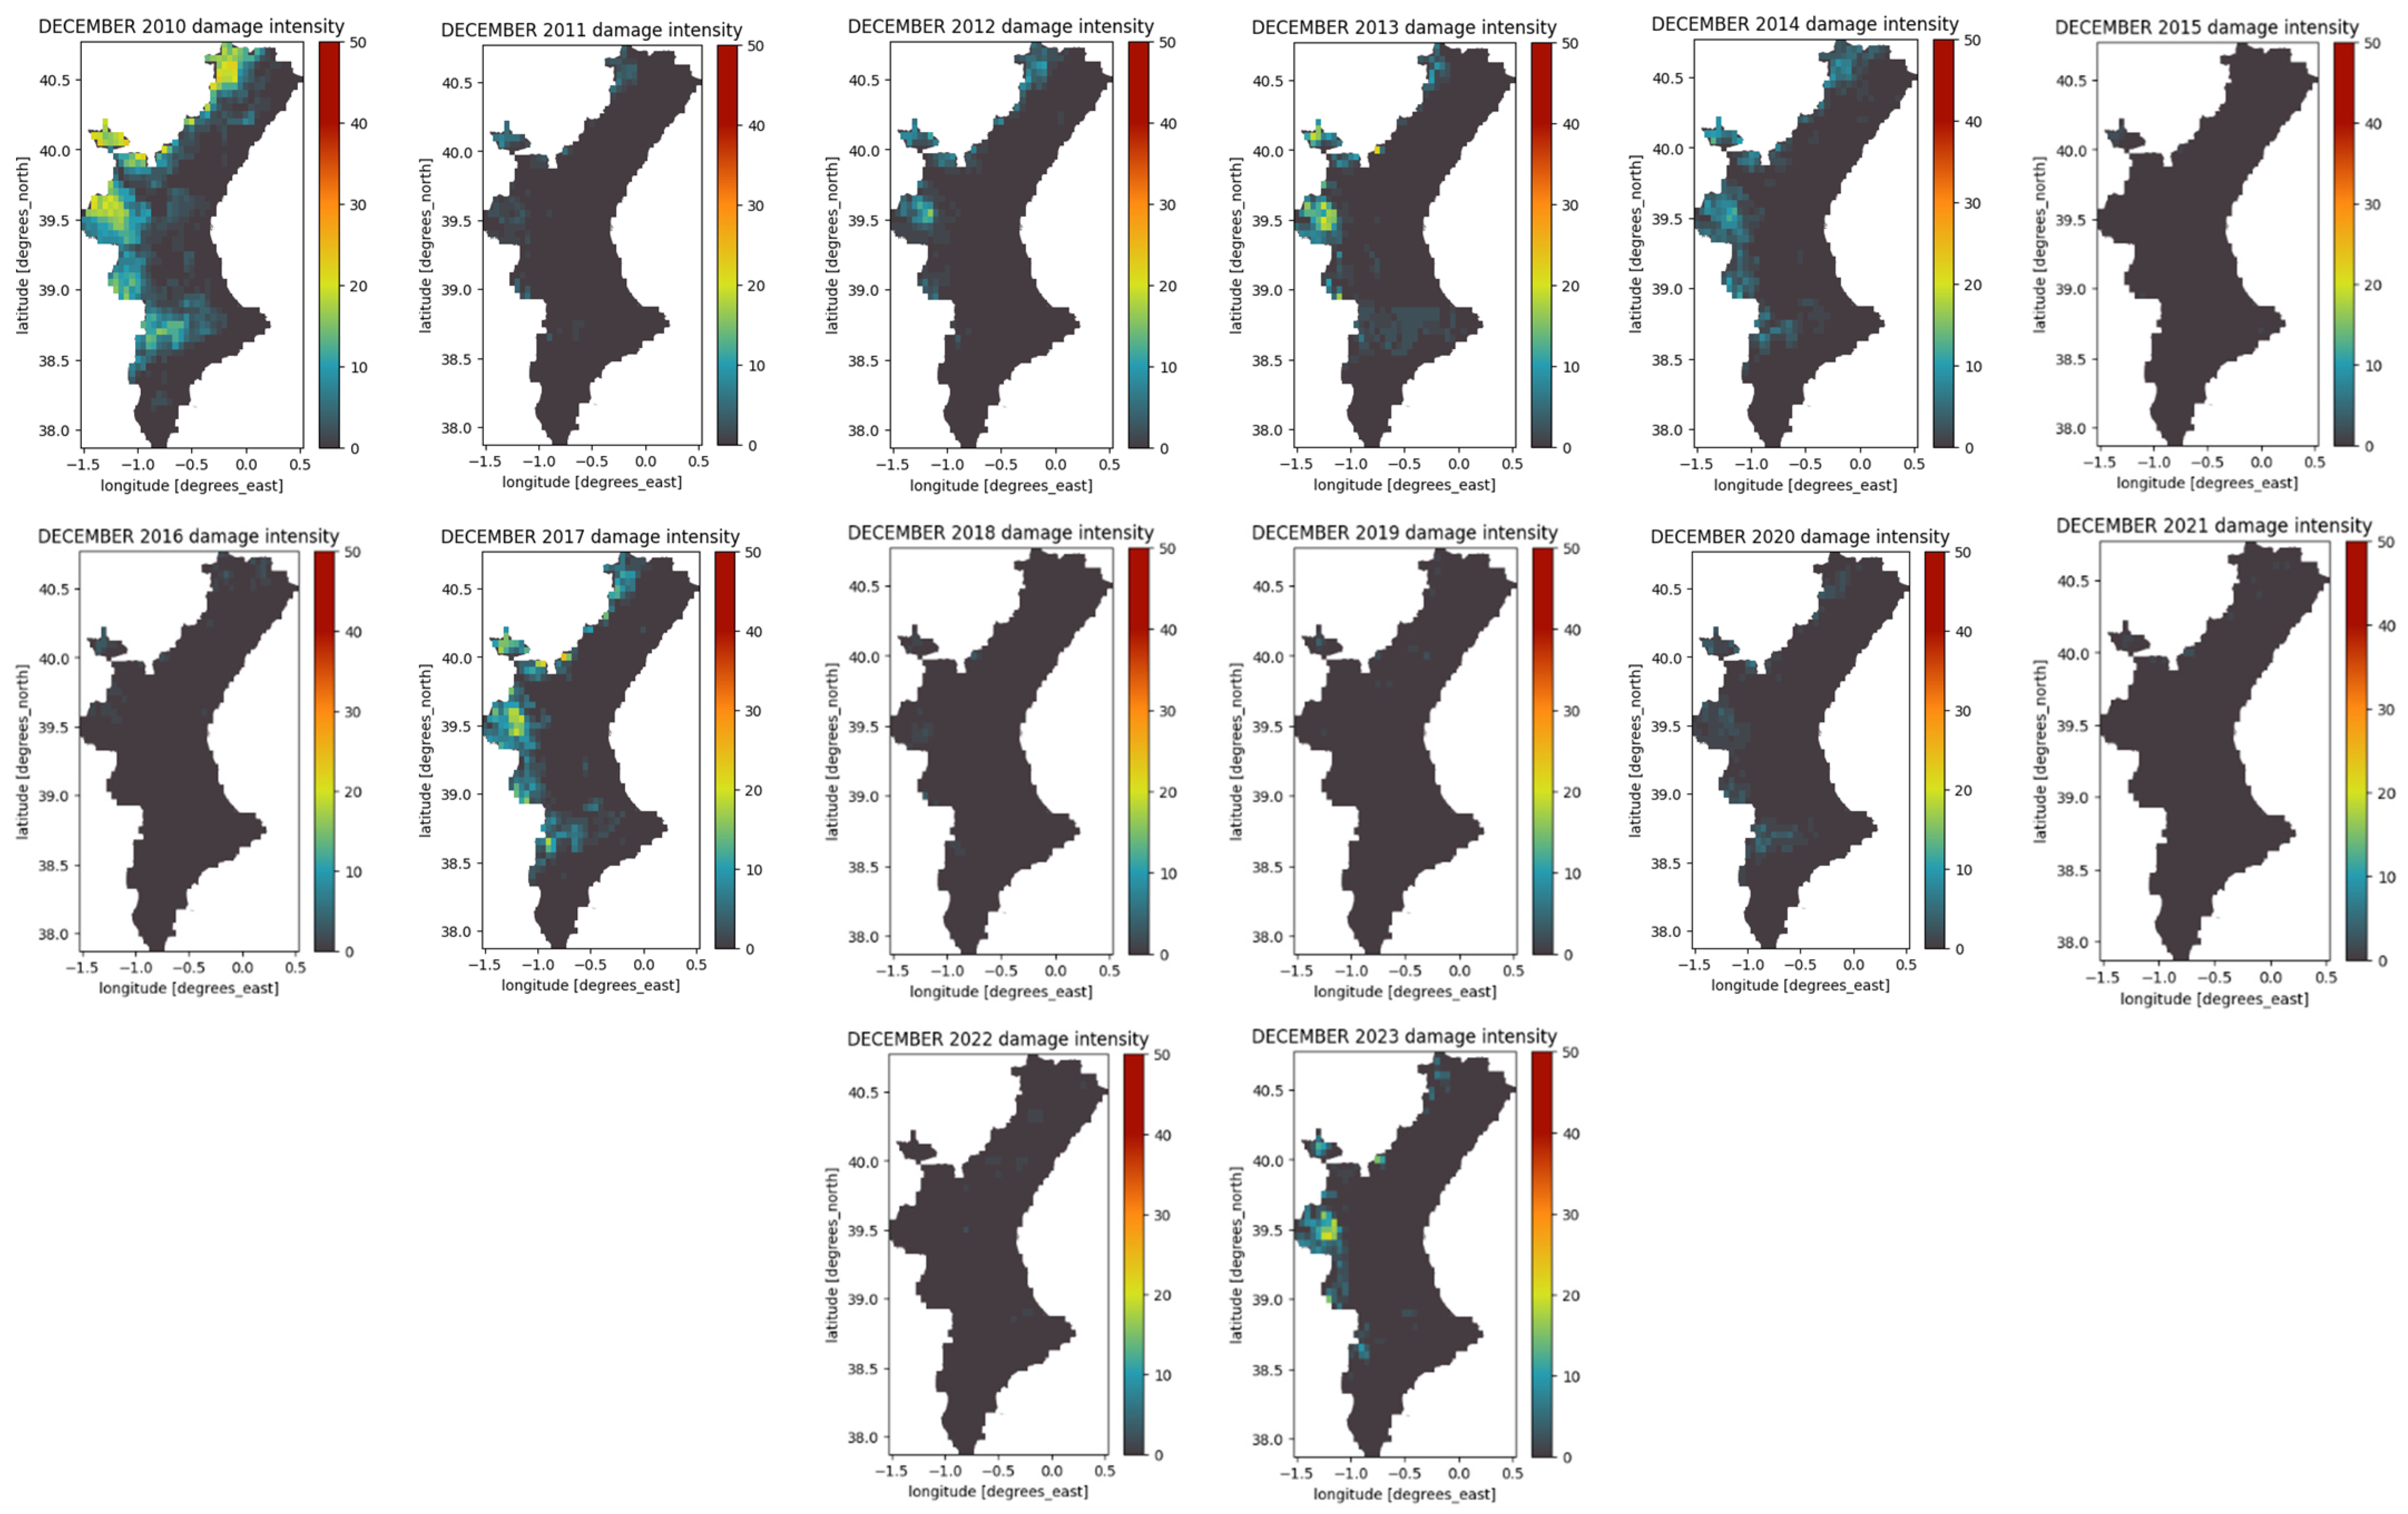
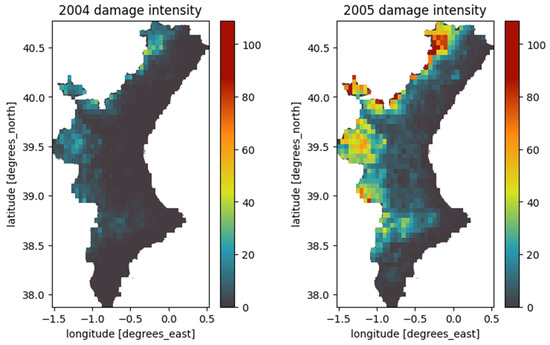
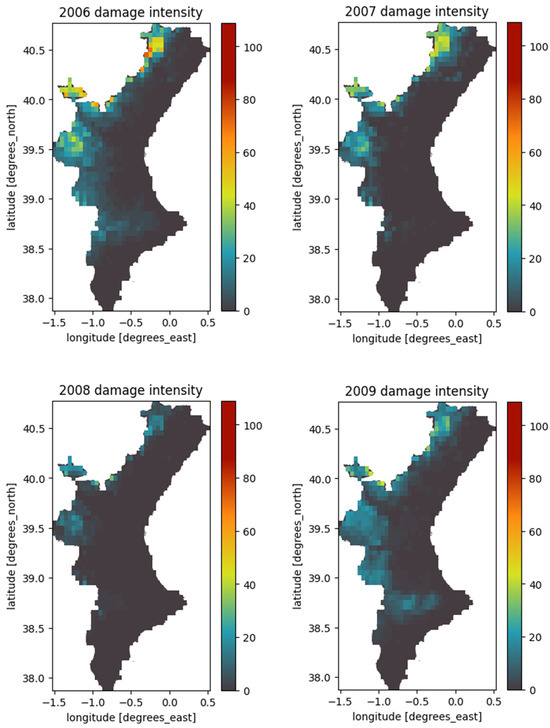
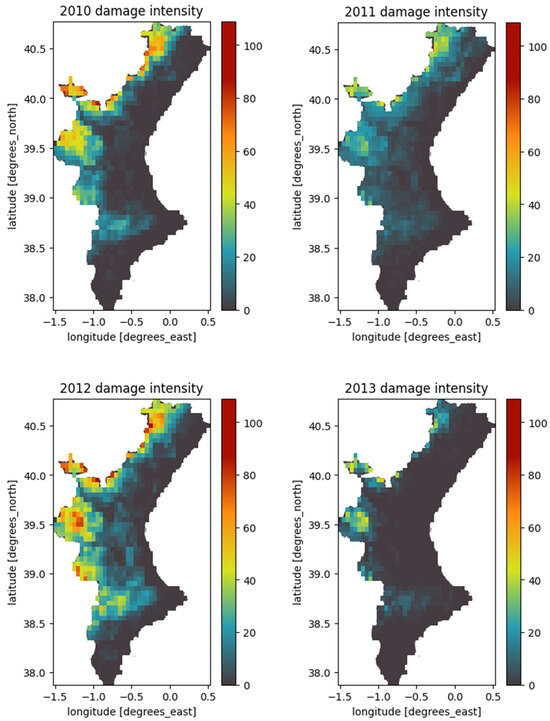


Figure A3.
Damage intensity maps for the Valencian Community for each year in the entire study period (2004–2023).
Figure A3.
Damage intensity maps for the Valencian Community for each year in the entire study period (2004–2023).

References
- Calvin, K.; Dasgupta, D.; Krinner, G.; Mukherji, A.; Thorne, P.W.; Trisos, C.; Romero, J.; Aldunce, P.; Barrett, K.; Blanco, G.; et al. IPCC, 2023: Climate Change 2023: Synthesis Report. Contribution of Working Groups I, II and III to the Sixth Assessment Report of the Intergovernmental Panel on Climate Change; Core Writing Team, Lee, H., Romero, J., Eds.; IPCC: Geneva, Switzerland, 2023. [Google Scholar] [CrossRef]
- Sobrino, J.A.; García-Monteiro, S.; Julien, Y. An analysis of the Lake Surface Water Temperature evolution of the world’s largest lakes during the years 2003-2020 using MODIS data. Recent Adv. Remote Sens. 2024, 1–9. [Google Scholar] [CrossRef]
- Parker, L.; Pathak, T.; Ostoja, S. Climate change reduces frost exposure for high-value California orchard crops. Sci. Total Environ. 2020, 762, 143971. [Google Scholar] [CrossRef] [PubMed]
- Olesen, J.; Trnka, M.; Kersebaum, K.; Skjelvåg, A.; Seguin, B.; Peltonen-Sainio, P.; Rossi, F.; Kozyra, J.; Micale, F. Impacts and adaptation of European crop production systems to climate change. Eur. J. Agron. 2010, 34, 96–112. [Google Scholar] [CrossRef]
- Fares, A.; Bayabil, H.K.; Zekri, M.; Mattos-Jr, D.; Awal, R. Potential climate change impacts on citrus water requirement across major producing areas in the world. J. Water Clim. Chang. 2017, 8, 576–592. [Google Scholar] [CrossRef]
- Makuvaro, V.; Walker, S.; Masere, T.P.; Dimes, J. Smallholder farmer perceived effects of climate change on agricultural productivity and adaptation strategies. J. Arid Environ. 2018, 152, 75–82. [Google Scholar] [CrossRef]
- Generalitat Valenciana. Estrategia Valenciana de Cambio Climático y Energía 2030. 2023. Available online: https://mediambient.gva.es/documents/163279113/168560465/Estrategia+Valenciana+de+Cambio+Clim%C3%A1tico++y+Energ%C3%ADa.pdf (accessed on 9 September 2024).
- Balfagón, D.; Arbona, V.; Gómez-Cadenas, A. El futuro de los cítricos: Impacto del cambio climático en la citricultura. Metode Sci. Stud. J. 2021, 12, 123–129. [Google Scholar] [CrossRef]
- Wang, S.; Xie, W.; Yan, X. Effects of future climate change on citrus quality and yield in China. Sustainability 2022, 14, 9366. [Google Scholar] [CrossRef]
- Karamidehkordi, E.; Sadati, S.a.H.; Tajvar, Y.; Mirmousavi, S.H. Climate change vulnerability and resilience strategies for citrus farmers. Environ. Sustain. Indic. 2023, 20, 100317. [Google Scholar] [CrossRef]
- Maracchi, G.; Sirotenko, O.; Bindi, M. Impacts of present and future climate variability on agriculture and forestry in the temperate regions: Europe. In Increasing Climate Variability and Change; Springer: Dordrecht, The Netherlands, 2005; pp. 117–135. [Google Scholar] [CrossRef]
- Alhader, M.M.; Hafez, M.S. The effect of some climatic variables and frosts waves on citrus crops. Al-Adab J. 2021, 138, 51–66. [Google Scholar] [CrossRef]
- Deng, G.; Zhang, H.; Yang, L.; Zhao, J.; Guo, X.; Ying, H.; Rihan, W.; Guo, D. Estimating Frost during Growing Season and Its Impact on the Velocity of Vegetation Greenup and Withering in Northeast China. Remote Sens. 2020, 12, 1355. [Google Scholar] [CrossRef]
- Liu, Q.; Piao, S.; Janssens, I.A.; Fu, Y.; Peng, S.; Lian, X.; Ciais, P.; Myneni, R.B.; Peñuelas, J.; Wang, T. Extension of the growing season increases vegetation exposure to frost. Nat. Commun. 2018, 9, 426. [Google Scholar] [CrossRef] [PubMed]
- Gu, L.; Hanson, P.J.; Mac Post, W.; Kaiser, D.P.; Yang, B.; Nemani, R.; Pallardy, S.G.; Meyers, T. The 2007 eastern US spring freeze: Increased cold damage in a warming world? BioScience 2008, 58, 253–262. [Google Scholar] [CrossRef]
- Li, W.; Huang, J.; Yang, L.; Chen, Y.; Fang, Y.; Jin, H.; Sun, H.; Huang, R. A practical remote sensing monitoring framework for late frost damage in wine grapes using Multi-Source satellite data. Remote Sens. 2021, 13, 3231. [Google Scholar] [CrossRef]
- Sakai, A.; Larcher, W. Frost Survival of Plants: Responses and Adaptation to Freezing Stress. 1987. Available online: https://link.springer.com/book/10.1007/978-3-642-71745-1 (accessed on 6 February 2025).
- Snyder, R.L.; Melo-Abreu, J. Frost Protection: Fundamentals, Practice and Economics; FAO Environment and Natural Resources Service Series No. 10; FAO: Rome, Italy, 2005; Volume 1, Available online: http://hdl.handle.net/10400.5/4727 (accessed on 6 February 2025).
- Caselles, V.; Sobrino, J. Determination of frosts in orange groves from NOAA-9 AVHRR data. Remote Sens. Environ. 1989, 29, 135–146. [Google Scholar] [CrossRef]
- Peterson, A.G.; Abatzoglou, J.T. Observed changes in false springs over the contiguous United States. Geophys. Res. Lett. 2014, 41, 2156–2162. [Google Scholar] [CrossRef]
- Allstadt, A.J.; Vavrus, S.J.; Heglund, P.J.; Pidgeon, A.M.; Thogmartin, W.E.; Radeloff, V.C. Spring plant phenology and false springs in the conterminous US during the 21st century. Environ. Res. Lett. 2015, 10, 104008. [Google Scholar] [CrossRef]
- Zabihi, H.; Vogeler, I.; Amin, Z.M.; Gourabi, B.R. Mapping the sensitivity of citrus crops to freeze stress using a geographical information system in Ramsar, Iran. Weather Clim. Extrem. 2016, 14, 17–23. [Google Scholar] [CrossRef]
- Reyes, J.J.; Elias, E. Spatio-temporal variation of crop loss in the United States from 2001 to 2016. Environ. Res. Lett. 2019, 14, 074017. [Google Scholar] [CrossRef]
- Geisel, P.M.; Unruh, C.L. Frost Protection for Citrus and Other Subtropicals (Publication 8100). University of California, Division of Agriculture and Natural Resources. 2003. Available online: https://escholarship.org/uc/item/5hh528qp (accessed on 6 February 2025).
- Fernández, C.F.; Castillo, I.P.; Lidón, A.G. Las Heladas en la Zona Citrícola de la Huerta Murciana; Serie Técnica Y De Estudio; Consejería De Agricultura, Agua Y Medio Ambiente: Murcia, Spain, 2003; Available online: https://www.carm.es/web/pagina?IDCONTENIDO=8358&IDTIPO=246&RASTRO=c498$m1259,20561 (accessed on 6 February 2025).
- Wang, S.; Chen, J.; Rao, Y.; Liu, L.; Wang, W.; Dong, Q. Response of winter wheat to spring frost from a remote sensing perspective: Damage estimation and influential factors. ISPRS J. Photogramm. Remote Sens. 2020, 168, 221–235. [Google Scholar] [CrossRef]
- Schmetz, J.; Pili, P.; Tjemkes, S.; Just, D.; Kerkmann, J.; Rota, S.; Ratier, A. An introduction to Meteosat Second Generation (MSG). Bull. Am. Meteorol. Soc. 2002, 83, 977–992. [Google Scholar] [CrossRef]
- Bernard, F.; Manolis, I.; Barat, I.; Alamañac, A.B.; Taboada, M.S.; Mingorance, P.; Ciapponi, A.; Cardone, T.; Nunez, I.F.; Garcia, A.; et al. The Copernicus land surface temperature monitoring (LSTM) mission: Design, technology and status. In Proceedings of the Sensors, Systems, and Next-Generation Satellites XXVII, Amsterdam, The Netherlands, 3–7 September 2023; Volume 12729, pp. 41–55. [Google Scholar] [CrossRef]
- Atzberger, C. Advances in remote sensing of agriculture: Context description, existing operational monitoring systems and major information needs. Remote Sens. 2013, 5, 949–981. [Google Scholar] [CrossRef]
- Pan, Q.; Lu, Y.; Hu, H.; Hu, Y. Review and research prospects on sprinkler irrigation frost protection for horticultural crops. Sci. Hortic. 2024, 326, 112775. [Google Scholar] [CrossRef]
- Venner, R.; Blank, S.C. Reducing Citrus Revenue Losses from Frost Damage: Wind Machines and Crop Insurance; Giannini Foundation Information Series, 95–1; Giannini Foundation of Agricultural Economics, University of California, Davis, Giannini Foundation: Berkeley, CA, USA, 1995; Available online: https://ideas.repec.org/p/ags/dgiais/251898.html (accessed on 6 February 2025).
- Ribeiro, A.C.; De Melo-Abreu, J.P.; Snyder, R.L. Apple orchard frost protection with wind machine operation. Agric. For. Meteorol. 2006, 141, 71–81. [Google Scholar] [CrossRef]
- Balawejder, M.; Matłok, N.; Piechowiak, T.; Puchalski, C. Flame Heat Sources as a Sustainable Method of Protecting Fruit Orchards against Frost in Poland. Sustainability 2024, 16, 2386. [Google Scholar] [CrossRef]
- Murray, V.; Ebi, K.L. IPCC Special Report on Managing the Risks of Extreme Events and Disasters to Advance Climate Change Adaptation (SREX). J. Epidemiol. Community Health 2012, 66, 759–760. [Google Scholar] [CrossRef] [PubMed]
- Generalitat Valenciana. Valencian Climate Change and Energy Strategy 2030. 2018. Available online: https://mediambient.gva.es/es/web/cambio-climatico/2020-2030 (accessed on 9 September 2024).
- Codoñer-Franch, P.; Valls-Bellés, V. Citrus as functional foods. Curr. Top. Nutraceutical Res. 2010, 8, 173–184. Available online: https://www.cabdirect.org/abstracts/20113371292.html (accessed on 23 September 2024).
- Zhong, G.; Nicolosi, E. Citrus origin, diffusion, and economic importance. In Compendium of Plant Genomes; Springer: Cham, Switzerland, 2020; pp. 5–21. [Google Scholar] [CrossRef]
- FAO. CITRUS FRUIT FRESH AND PROCESSED: Statistical Bulletin 2020. Citrus Fruit Statistical Compendium 2020. Rome. 2021. Available online: https://openknowledge.fao.org/server/api/core/bitstreams/4760a5b5-f3b2-41c7-8713-ccdb1a5f8c08/content (accessed on 23 September 2024).
- Da Silveira, F.; Da Silva, S.L.C.; Machado, F.M.; Barbedo, J.G.A.; Amaral, F.G. Farmers’ perception of the barriers that hinder the implementation of agriculture 4.0. Agric. Syst. 2023, 208, 103656. [Google Scholar] [CrossRef]
- Whiteman, T.M. Freezing Points of Fruits, Vegetables and Florist Stocks; U.S. Dept. of Agriculture, Agricultural Marketing Service, Marketing Research Division: Washington, DC, USA, 1957. [Google Scholar] [CrossRef]
- Conesa, N.A.; Nicolás, N.J.M.; Manera, N.F.J.; Porras, N.I. Frost damage in lemon orchards in the province of Murcia. Acta Hortic. 2015, 1065, 1417–1422. [Google Scholar] [CrossRef]
- Micheloud, N.G.; Castro, D.C.; Favaro, M.A.; Buyatti, M.A.; Pilatti, R.A.; Gariglio, N.F. Respuesta de Diferentes Variedades de Cítricos a los Daños Causados por Fuertes Heladas en la Región Central de Santa Fe. Rev. De La Fac. De Cienc. Agrar. UNCUYO 2017, 48, 43–56. Available online: https://revistas.uncu.edu.ar/ojs3/index.php/RFCA/article/view/3157 (accessed on 6 February 2025).
- Lobell, D.B.; Cahill, K.N.; Field, C.B. Historical effects of temperature and precipitation on California crop yields. Clim. Change 2007, 81, 187–203. [Google Scholar] [CrossRef]
- Ministerio de Agricultura, Pesca y Alimentación. Anuario de Estadística 2010. 2010. Available online: https://www.mapa.gob.es/es/estadistica/temas/ (accessed on 26 February 2024).
- Imbert, E. Citrus, Review of the 2004/2005 Season: Blowing Cold. Fruitrop (English Ed.). 2005. Available online: https://agritrop.cirad.fr/529612/ (accessed on 6 February 2025).
- Clarke, B. Report: Farmers and scientists. Sci. Commun. 2003, 25, 198–203. [Google Scholar] [CrossRef]
- Loboguerrero, A.M.; Boshell, F.; León, G.; Martinez-Baron, D.; Giraldo, D.; Mejía, L.R.; Díaz, E.; Cock, J. Bridging the gap between climate science and farmers in Colombia. Clim. Risk Manag. 2018, 22, 67–81. [Google Scholar] [CrossRef]
- Lou, W.; Qiu, X.; Wu, L.; Ni, H.; Tang, Q.; Mao, Y. Scheme of Weather-Based Indemnity indices for insuring against freeze damage to citrus orchards in Zhejiang, China. Agric. Sci. China 2009, 8, 1321–1331. [Google Scholar] [CrossRef]
- Ramón-Morte, A.; Moreno, D.P.; Moltó-Mantero, E. Mapping frost risk in fruit trees using GIS-based analysis: A case study in the province of Alicante (Spain). GeoFocus Int. Rev. Geogr. Inf. Sci. Technol. 2024, 33, 129–155. [Google Scholar] [CrossRef]
- Molitor, D.; Caffarra, A.; Sinigoj, P.; Pertot, I.; Hoffmann, L.; Junk, J. Late frost damage risk for viticulture under future climate conditions: A case study for the Luxembourgish winegrowing region. Aust. J. Grape Wine Res. 2013, 20, 160–168. [Google Scholar] [CrossRef]
Disclaimer/Publisher’s Note: The statements, opinions, and data contained in all publications are solely those of the individual author(s) and contributor(s) and not of MDPI and/or the editor(s). MDPI and/or the editor(s) disclaim responsibility for any injury to people or property resulting from any ideas, methods, instructions, or products referred to in the content. |


Disclaimer/Publisher’s Note: The statements, opinions and data contained in all publications are solely those of the individual author(s) and contributor(s) and not of MDPI and/or the editor(s). MDPI and/or the editor(s) disclaim responsibility for any injury to people or property resulting from any ideas, methods, instructions or products referred to in the content. |
© 2025 by the authors. Licensee MDPI, Basel, Switzerland. This article is an open access article distributed under the terms and conditions of the Creative Commons Attribution (CC BY) license (https://creativecommons.org/licenses/by/4.0/).