Article

Perturbation Matters: A Novel Approach for Semi-Supervised Remote Sensing Imagery Change Detection

by
Daifeng Peng
1,2,*,
Min Liu
1 and
Haiyan Guan
1
1
School of Remote Sensing & Geomatics Engineering, Nanjing University of Information Science and Technology, Nanjing 210044, China
2
Technology Innovation Center for Integrated Applications in Remote Sensing and Navigation, Ministry of Natural Resources, Nanjing 210044, China
*
Author to whom correspondence should be addressed.
Remote Sens. 2025, 17(4), 576; https://doi.org/10.3390/rs17040576
Submission received: 11 December 2024 / Revised: 1 February 2025 / Accepted: 6 February 2025 / Published: 8 February 2025
(This article belongs to the Special Issue Advances in 3D Reconstruction with High-Resolution Satellite Data)

Abstract

:
Due to the challenge of acquiring abundant labeled samples, semi-supervised change detection (SSCD) approaches are becoming increasingly popular in tackling CD tasks with limited labeled data. Despite their success, these methods tend to come with complex network architectures or cumbersome training procedures, which also ignore the domain gap between the labeled data and unlabeled data. Differently, we hypothesize that diverse perturbations are more favorable to exploit the potential of unlabeled data. In light of this spirit, we propose a novel SSCD approach based on Weak–strong Augmentation and Class-balanced Sampling (WACS-SemiCD). Specifically, we adopt a simple mean-teacher architecture to deal with labeled branch and unlabeled branch separately, where supervised learning is conducted on the labeled branch, while weak–strong consistency learning (e.g., sample perturbations’ consistency and feature perturbations’ consistency) is imposed for the unlabeled. To improve domain generalization capacity, an adaptive CutMix augmentation is proposed to inject the knowledge from the labeled data into the unlabeled data. A class-balanced sampling strategy is further introduced to mitigate class imbalance issues in CD. Particularly, our proposed WACS-SemiCD achieves competitive SSCD performance on three publicly available CD datasets under different labeled settings. Comprehensive experimental results and systematic analysis underscore the advantages and effectiveness of our proposed WACS-SemiCD.

Graphical Abstract

1. Introduction

Change detection is focused on identifying alterations on the Earth’s surface through the comparison of co-registered images captured at identical locations but different dates. Thanks to its benefits of broad coverage, brief revisit intervals and high spatial-spectral resolution, remote sensing change detection (RSCD) methods have seen extensive application across numerous fields such as natural resources investigation, urban sprawl monitoring and ecosystem evaluation [1,2,3]. The development of RSCD mainly follows the routine of machine learning, ranging from feature-level comparison to object-level classification [4,5]. More recently, with the surge in deep learning and the proliferation of remote sensing (RS) big data, deep learning-based change detection (DLCD) has increasingly gained attention due to its automatic hierarchical feature representation capacity and powerful end-to-end modeling ability. Consequently, DLCD has swiftly become the predominant approach in the field of change detection (CD), achieving tremendous advantages that traditional CD methods cannot match.
In spite of their success, DLCD methods are often featured with complex network architectures and huge network parameters. Therefore, training such networks necessitates large amounts of labeled data, which are challenging and labor-intensive to acquire, especially when it comes to multi-temporal remote sensing images. Particularly, compared with the difficult-to-obtain labeled data, unlabeled data are easily available in the RS big data era. In such contexts, semi-supervised change detection (SSCD) is becoming popular, which is capable of improving model generalization capacity by exploiting the potential of extensive unlabeled data and restricted labeled data. By introducing semi-supervised learning techniques from computer vision, the previous few years have seen a tremendous surge of success and progress in the field of SSCD, ranging from adversarial learning to pseudo label learning and consistency learning. However, these approaches are usually characterized by additional training procedures or complex network components, which inevitably leads to huge computational cost and reduced deployment flexibility in real-world scenarios. In addition, the domain gap between the labeled data and unlabeled is usually ignored, leading to unstable SSCD performance.
To overcome these limitations, we delve deep into the sample augmentation and perturbation strategies and put forth a straightforward yet powerful SSCD method based on Weak–strong Augmentation and Class-balanced Sampling (WACS-SemiCD). To be specific, our proposed WACS-SemiCD basically follows the classic routine of weak-to-strong consistency learning with a mean-teacher architecture, which consists of a supervised component and an unsupervised component. Within the supervised branch, labeled data are directly fed into the student network, and a straightforward cross-entropy loss is calculated based on labeled predictions and their true labels. Differently, the unsupervised branch aims to tackle the unlabeled data, and one weak view is fed into the teacher network to produce pseudo labels, while two strong views are fed into the student network. Based on the filtered pseudo labels using a fixed threshold, two cross-entropy losses are further employed by using the two student outputs. Specially, an adaptive CutMix strategy is introduced, which facilitates distilling valuable insights from the labeled data while simultaneously mitigating the discrepancies between the labeled and unlabeled domains. Feature-level perturbation is further included to expand the perturbation space and improve SSCD performance. In addition, a simple class-balanced sampling (CBS) strategy is employed to tackle the class imbalance issue. A comprehensive comparison between the supervised baseline and our proposed WACS-SemiCD is presented in Figure 1. We can conclude that our proposed WACS-SemiCD is capable of significantly improving SSCD performance under different labeled settings across different scenarios.
The contributions of this article are three-fold:
Instead of introducing additional training procedures or complex network components, we propose a simple weak–strong consistency learning strategy based on sample-level perturbations, feature-level perturbations and transformation perturbations, which can be trained in an end-to-end manner efficiently.
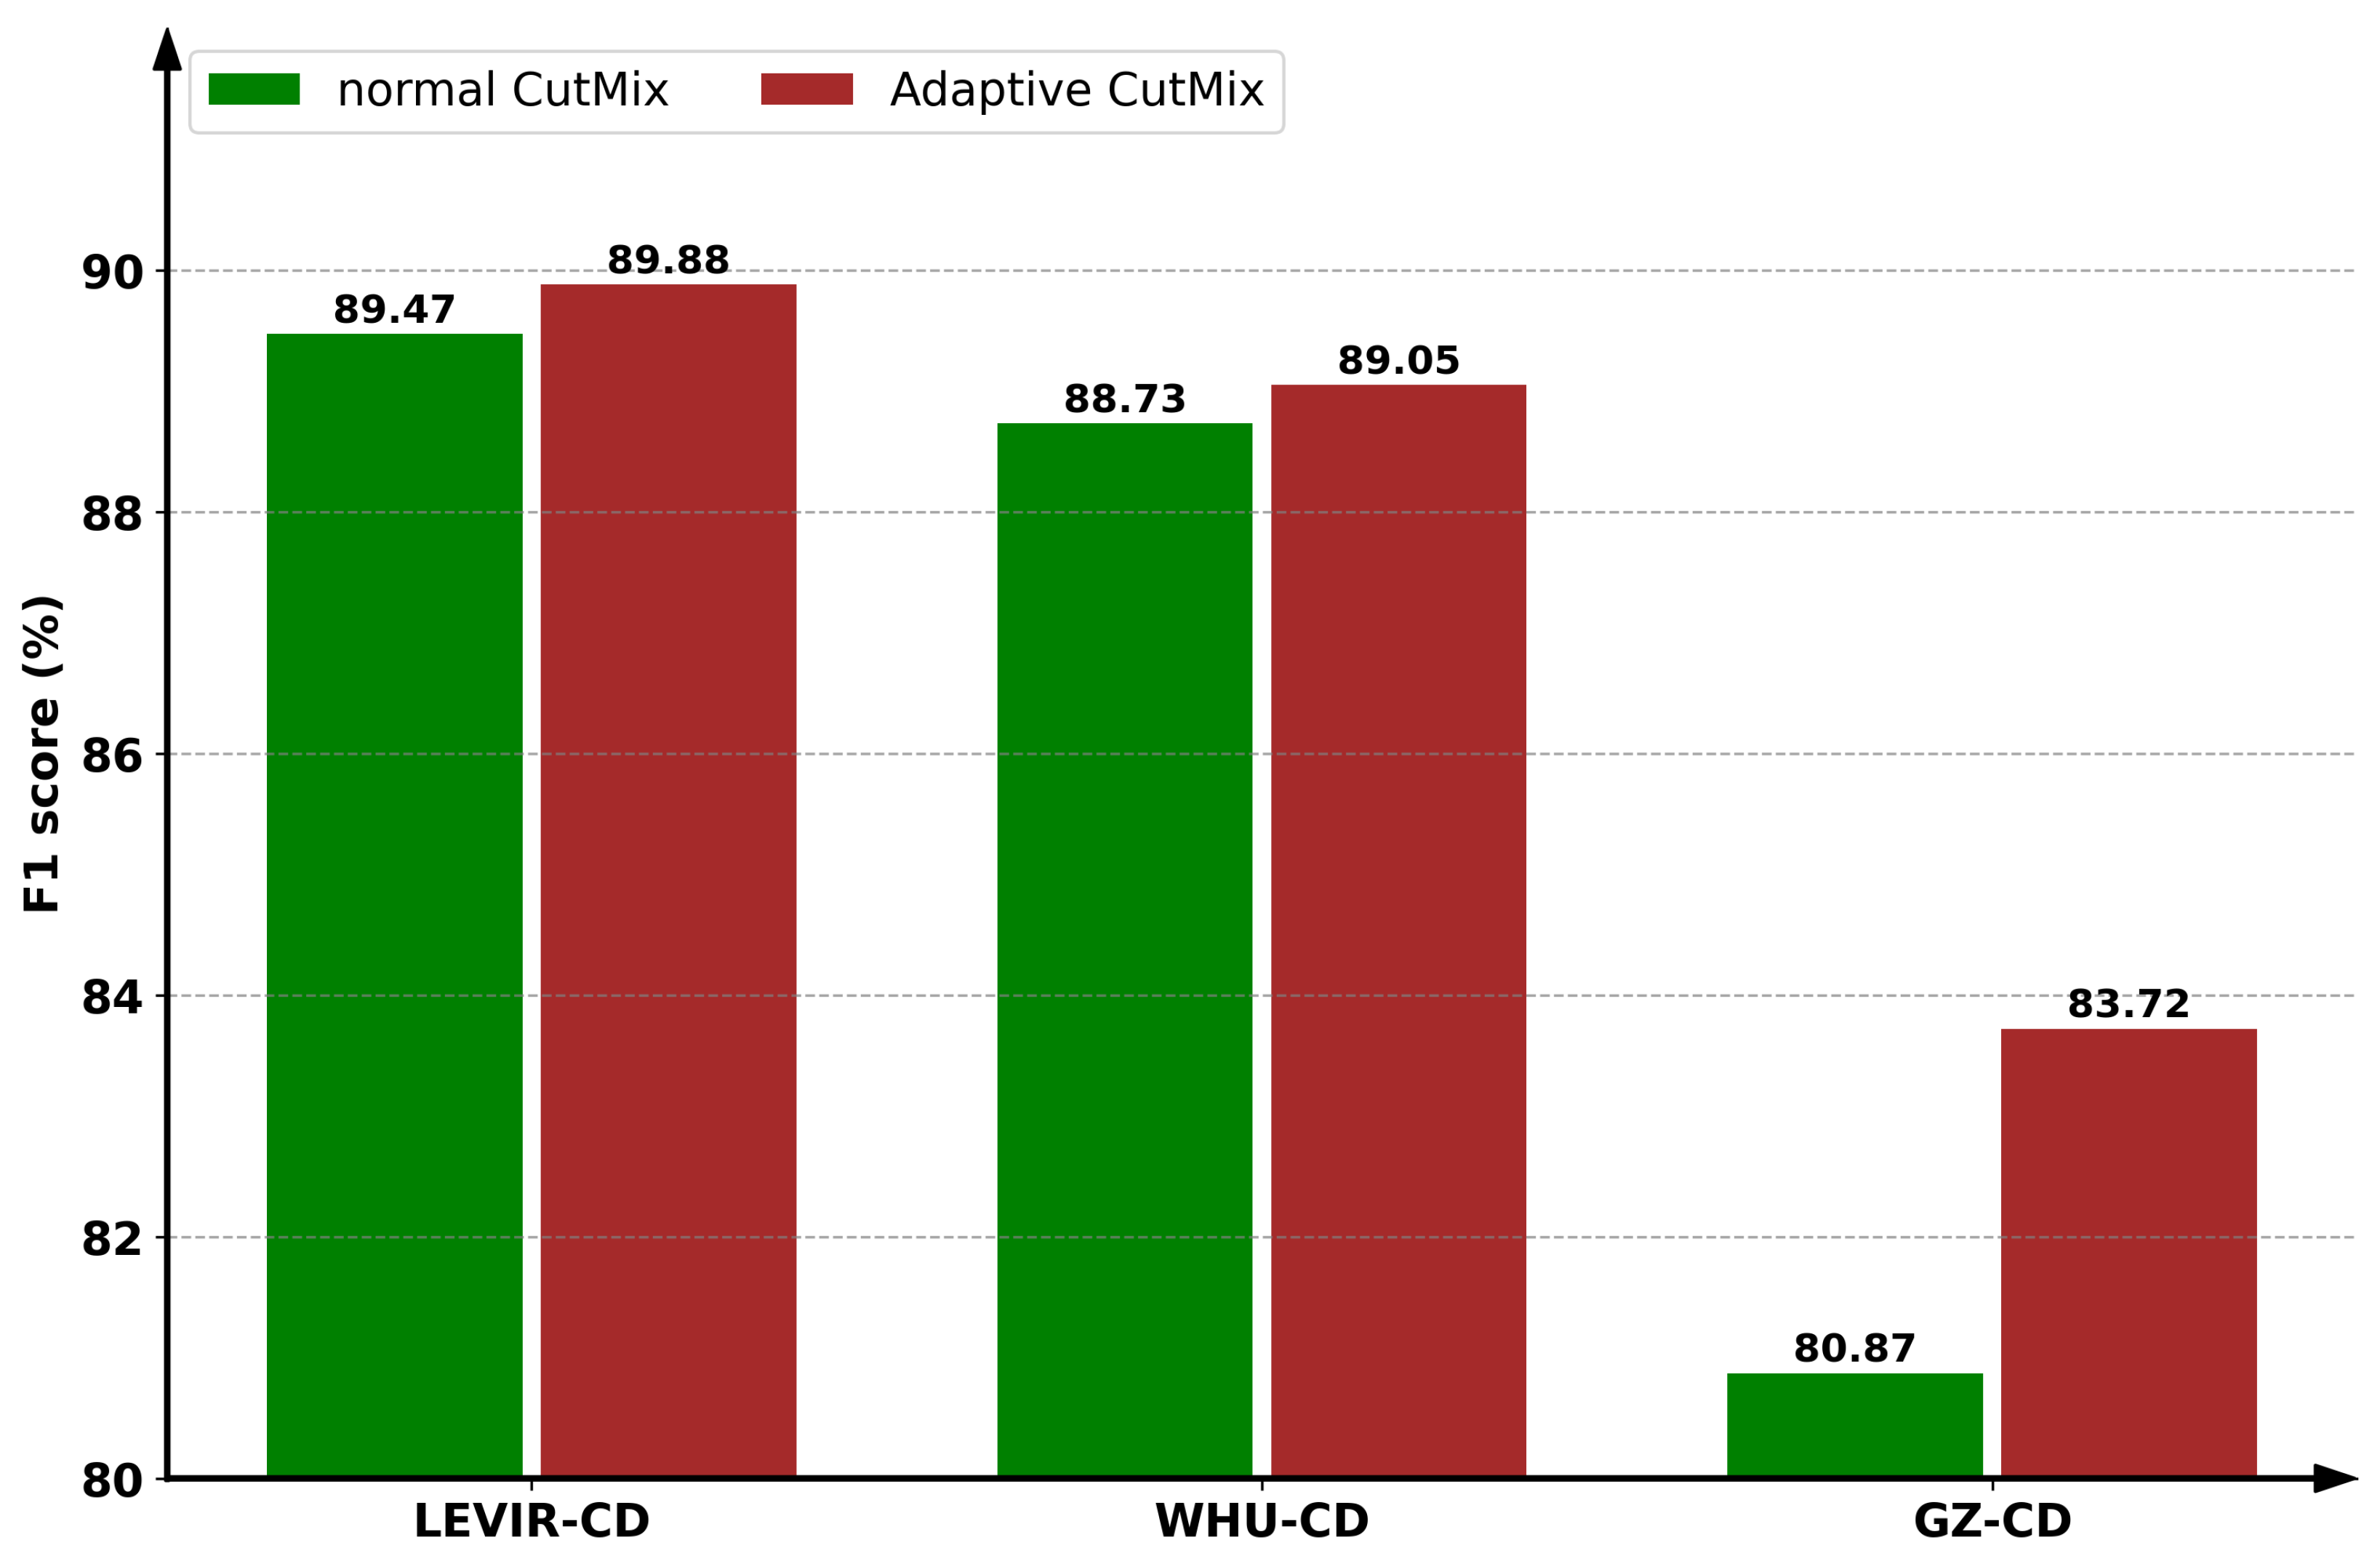
An adaptive CutMix strategy is proposed to inject labeled information into the unlabeled, which aims to mitigate the domain gap and improve model generalization capacity on cross-domain scenarios. We further propose a simple yet effective class-balanced sampling approach, which is capable of addressing class imbalance issues in CD with little computational overhead.
Extensive experiments and analysis have been carried out on three publicly available CD datasets. In contrast to alternative approaches, our proposed WACS-SemiCD consistently outperforms other methods across various labeled settings and cross-dataset scenarios, demonstrating its effectiveness and robustness. The code is available at https://github.com/daifeng2016/WACS-SemiCD (accessed on 5 February 2025).
The remainder of this article is structured as follows. Section 2 provides a brief overview of related research. Section 3 outlines the detailed description of the proposed WACS-SemiCD. Comprehensive experimental results and analysis are presented in Section 4. Finally, Section 5 draws the conclusions of this paper.

2. Related Work

2.1. Fully Supervised CD

Deep neural networks have exceptional non-linear modeling ability, making it easy to train a fully supervised CD (FSCD) network based on plenty of bi-temporal images and their actual ground truth. Consequently, the past decade has witnessed a surge of FSCD networks, which are capable of detecting object changes with high accuracy and high degrees of automation. Particularly, the development of FSCD is mainly driven by the innovation of network architectures. In the early stage, due to its strong capacity to represent visual information, convolutional neural networks (CNNs), especially fully convolutional networks (FCNs), are widely used to deal with the CD task. Particularly, Daudt et al. [6] introduced three FCN-based CD networks (FC-EF, FC-Siam-conc and FC-Siam-diff) for the first time, which have become a benchmark and significantly inspired subsequent designs of FSCD networks. Note that such FSCD networks basically follow an encoder–decoder pipeline, which inevitably leads to detailed information missing due to successive pooling operations in the encoder. To address this issue, more complicated backbones such as UNet++ and HRNet are widely introduced to enhance multi-scale feature representation ability [7,8,9]. Additionally, it is challenging to differentiate true changes against the background due to the interference of background noise such as seasonal changes, shadow, illumination, materials, etc. In this regard, a large number of attention mechanism models are introduced to highlight changed areas while suppressing background noise by learning attention weights, including channel attention [10,11], spatial attention [12,13] and mixed attention [14,15,16]. However, CNNs struggle to capture long-range spatial dependencies because of the constraints of their receptive fields. To overcome this drawback, Transformer models, which possess global receptive fields innately, have been widely introduced to effectively capture global contextual information. Some classic examples are ChangeFormer [17], FTNet [18] and SwinSUNet [19]. It is worth noting that compared with CNN architectures, which excel at local information modeling, Transformer architectures tend to overlook local features and require much higher computational cost. Therefore, it is reasonable to bring together the advantages of both architectures. In such a context, many CNN–Transformer-based FSCD networks are proposed to improve CD performance and efficiency, including BIT [20], ConvTransNet [21] and ACAHNet [22]. More recently, Mamba architectures have achieved great success in vision tasks due to their stronger global information modeling ability, lower computational complexity and higher scalability over Transformer architectures. In such a context, Mamba-based CD models have been developed to further improve CD performance, including ChangeMamba [23], CDMamba [24] and M-CD [25].
Despite the remarkable success of the aforementioned FSCD methods, substantial amounts of labeled data are necessary, which can be challenging to acquire for the RSCD task. Therefore, enhancing model performance by leveraging the potential of freely accessible unlabeled data is essential.

2.2. Semi-Supervised CD

Semi-supervised learning (SSL) aims to enhance the model generalization capacity with limited labeled data and a substantial amount of unlabeled data. Due to the difficulty of acquiring sufficient labeled data for CD, it is necessary to tap into the potential of easily available unlabeled data by using advanced SSL techniques. In the literature, many efforts have been made to improve SSCD performance. In the early stage, SSCD is mostly employed on individual image pairs by introducing specialized classifiers, such as the semi-supervised support vector machine (S3VM) classifier [26] and Gaussian process (GP) classifier [27]. Due to the ability of learning discriminative features, metric learning is also widely used for SSCD [28]. However, such methods fail to work in real-world scenarios with large amounts of unlabeled images.
To overcome this limitation, three strategies are mostly employed, namely, adversarial learning, consistency learning and pseudo label learning. In adversarial learning, Generative Adversarial Networks (GANs) are applied to generate new samples [29] or enforce distribution consistency constraints [30]. It is worth noting that GAN-based methods often suffer from training instability, leading to difficulties in model convergence or high-quality image generation. On the contrary, consistency learning is more flexible and stable, which works on the basis that the output will remain unchanged when conducting small data perturbations, feature perturbations or model perturbations. For instance, Bandara et al. [31] introduced small random perturbation to bi-temporal difference maps, where consistency constraints were then applied between the perturbed outputs and the original outputs. Han et al. [32] proposed a CD network with coarse-to-fine refinement modules, where consistency regularization is further used to improve SSCD performance. Note that the strength of consistency constraints should be carefully designed, where too-strong constraints may lead to the over-fitting effect, while too-weak constraints may not provide sufficient consistency information.
Differently, pseudo label learning aims to generate reliable labels for the unlabeled data, thus providing effective supervision signals. In general, pseudo labels can be produced in an offline mode [33] or online mode [34]. In the former case, a pretrained model is obtained by training using only the labeled data; pseudo labels are then generated by selecting high-confidence predictions. As a result, CD performance can be improved by fine-tuning with the augmented samples. In [35], a two-stage training paradigm is proposed for SSCD, which consists of reliable set generation and fine-tuning with the augmented dataset. In a similar work, Yuan et al. [36] proposed to leverage cross-supervision from CNN and Transformer networks, and a new filter algorithm was further proposed to select high-quality pseudo labels. In particular, for typical ground objects such as buildings, it is easy to synthesize pseudo labels with single-temporal images and object masks [37,38]. However, such strategies will inevitably lead to additional training procedures and huge computational costs, which also make it impossible to achieve joint optimization. To overcome these drawbacks, online pseudo label generation methods have been extensively studied. In such a context, the mean-teacher model is widely introduced, where a frozen teacher model is employed to produce pseudo labels, while a trainable student model is then applied for online fine-tuning [39]. For example, Yang et al. [40] proposed an ensemble cross pseudo supervision (ECPS) strategy to merge outputs from several student models to enhance pseudo label quality. More recently, consistency constraints and pseudo label learning have often been combined to achieve better SSCD performance [41,42].
However, in existing semi-supervised CD methods, complex training procedures or network components are often needed, and the domain gap between labeled data and unlabeled data is usually ignored, leading to huge training costs and unstable SSCD performance. Instead, we propose to exploit the potential of unlabeled data by combining weak–strong consistency learning and class-balanced sampling, which is light-weighted and can be trained in an end-to-end manner efficiently. The domain gap can also be mitigated by employing an adaptive CutMix strategy.

2.3. Class Imbalance in CD

The CD task often encounters severe class imbalance issues, where the proportion of changed pixels (e.g., foreground regions) is considerably smaller relative to the unchanged pixels (e.g., background regions). Consequently, the network’s optimization emphasis is unavoidably directed towards the background regions. To address this limitation, many efforts are made in the literature. One possible solution is to enhance the CD dataset by synthesizing enough changed samples. Along this line, Chen et al. [37] introduced an Instance-level change Augmentation (IAug) approach, which consists of complex building generation through generative adversarial training and the style transfer process. Similarly, in [43], conditional adversarial training is employed to synthesize building CD samples, and a channel attention module is further included to boost CD performance on imbalanced datasets. Instead of generating images directly, pseudo bi-temporal images and labels could be generated with much lower computational complexity. For instance, Quan et al. [44] proposed to generate pseudo labels through randomly masking buildings. Zhang et al. [45] further proposed a pseudo bi-temporal image generation approach by considering the domain gap between data sources, where an unpaired image prototype contrast module (UIPCM) is used to enrich the diversity of the changed samples. Differently, without the need to generate any bi-temporal images and labels, a foreground-balanced sampling strategy is capable of overcoming class imbalance issues through enlarging the sampling frequency of the changed pixels [46,47]. In [48,49], a hard sample mining strategy is also introduced to enhance the model’s ability to detect changed regions.
Meanwhile, class imbalance issues can be mitigated by designing novel loss functions. In such a context, the changed pixels are assigned a higher weight, while the unchanged pixels are assigned a smaller weight, thus enforcing the network to pay more attention to the changed areas. In the literature, many such loss functions have been proposed, such as weighted cross-entropy loss [50,51], focus loss [52,53], weighted contrastive loss [54,55] and weighted consistency loss [41,42]. Additionally, the network architecture can also be refined to focus more on the foreground areas [56].

3. Proposed WACS-SemiCD

3.1. Architecture Overview

In SSCD settings, the dataset D usually contains M labeled images D L = { ( x i l , y i l ) } i = 1 M and N unlabeled images D U = { ( x i u ) } i = 1 N . The overall architecture of our proposed WACS-SemiCD follows the classic mean-teacher design. As presented in Figure 2, it consists of a student network G s ( x ; θ s ) parameterized by θ s and a teacher network G t ( x ; θ t ) parameterized by θ t . Note that the student and teacher networks share the same network configuration, which is a simple Siamese CD network based on DeepLabv3+ with pretrained ResNet50 as the backbone. During the training stage, the teacher network with frozen parameters aims to produce synthetic labels for the unlabeled data, whose parameters are optimized by using exponential moving averaging (EMA) of the student parameters in each iteration:
θ t = α θ t + ( 1 α ) θ s
where α is a momentum coefficient, which is fixed at 0.99. Meanwhile, the student network is optimized by minimizing the losses from both supervised component L l for the labeled instances and unsupervised component L u for the unlabeled instances, namely:
L = L l + L u
For the supervised loss, a simple cross-entropy loss is adopted by using a predicted change map p i l and their true label y i l :
L l = 1 M i = 1 M c e ( p i l , y i l ) = 1 M i = 1 M y i l log ( p i l )
On the other hand, for the unsupervised loss L u , weak–strong consistency will be used to fully exploit the information from unlabeled data.

3.2. Siamese CD Network

For the benefit of fast mean-teacher network training, we adopt a classic Siamese CD network, which consists of two parallel encoders E and a decoder G , as illustrated in Figure 2. The encoders aim to separately extract deep features across multiple scales from input image pairs. At the end of the encoder, feature difference is calculated to integrate bi-temporal insights effectively. Then, an atrous spatial pyramid pooling (ASPP) module is introduced to aggregate multi-scale contexts. Finally, a simple up-sampling layer and a softmax classifier layer are applied to produce the final change map. For bi-temporal input images x 1 , x 2 , the process can be defined as:
f 1 = E ( x 1 ) , f 2 = E ( x 2 )
y = δ ( U ( A S P P ( | f 1 f 2 | ) ) )
where δ ( . ) refers to the softmax layer, U ( . ) refers to the up-sampling layer and A S P P ( . ) refers to the ASPP module. Note that the ResNet50 network pretrained on ImageNet is adopted as the backbone of the encoder, which facilitates improved feature representation and fast network convergence.
Figure 2. A flowchart of the proposed method.
Remotesensing 17 00576 g002

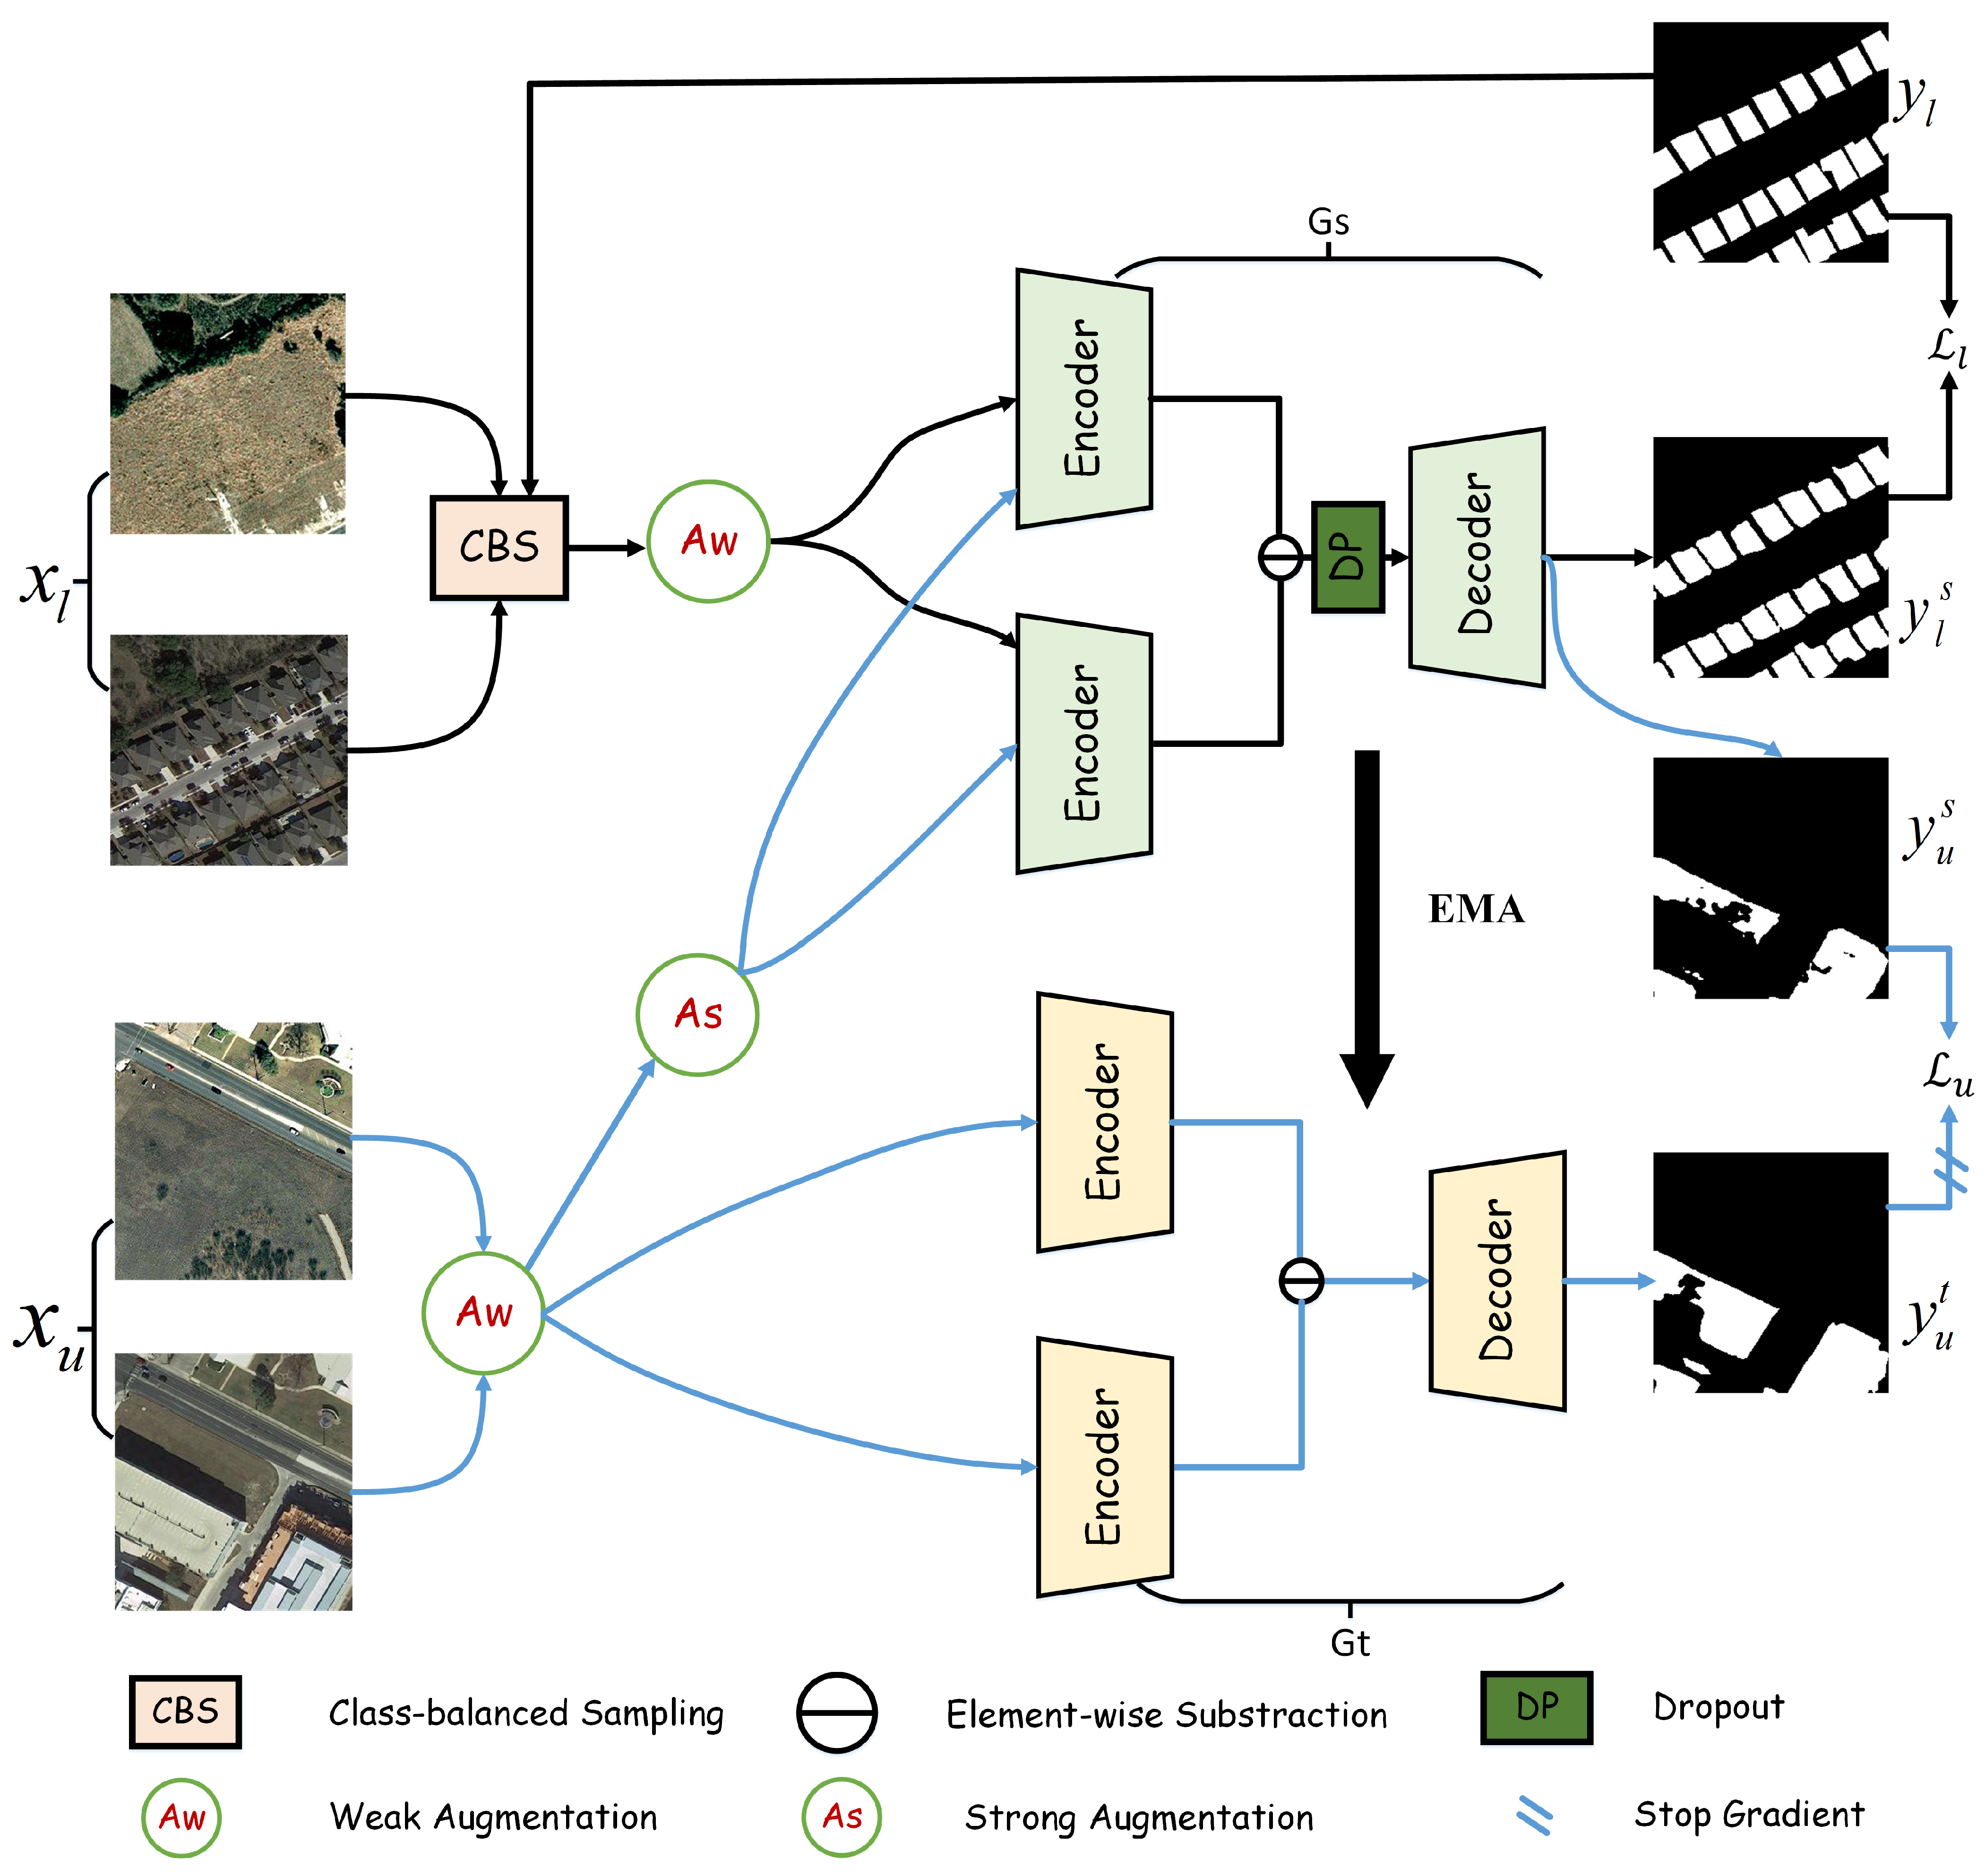
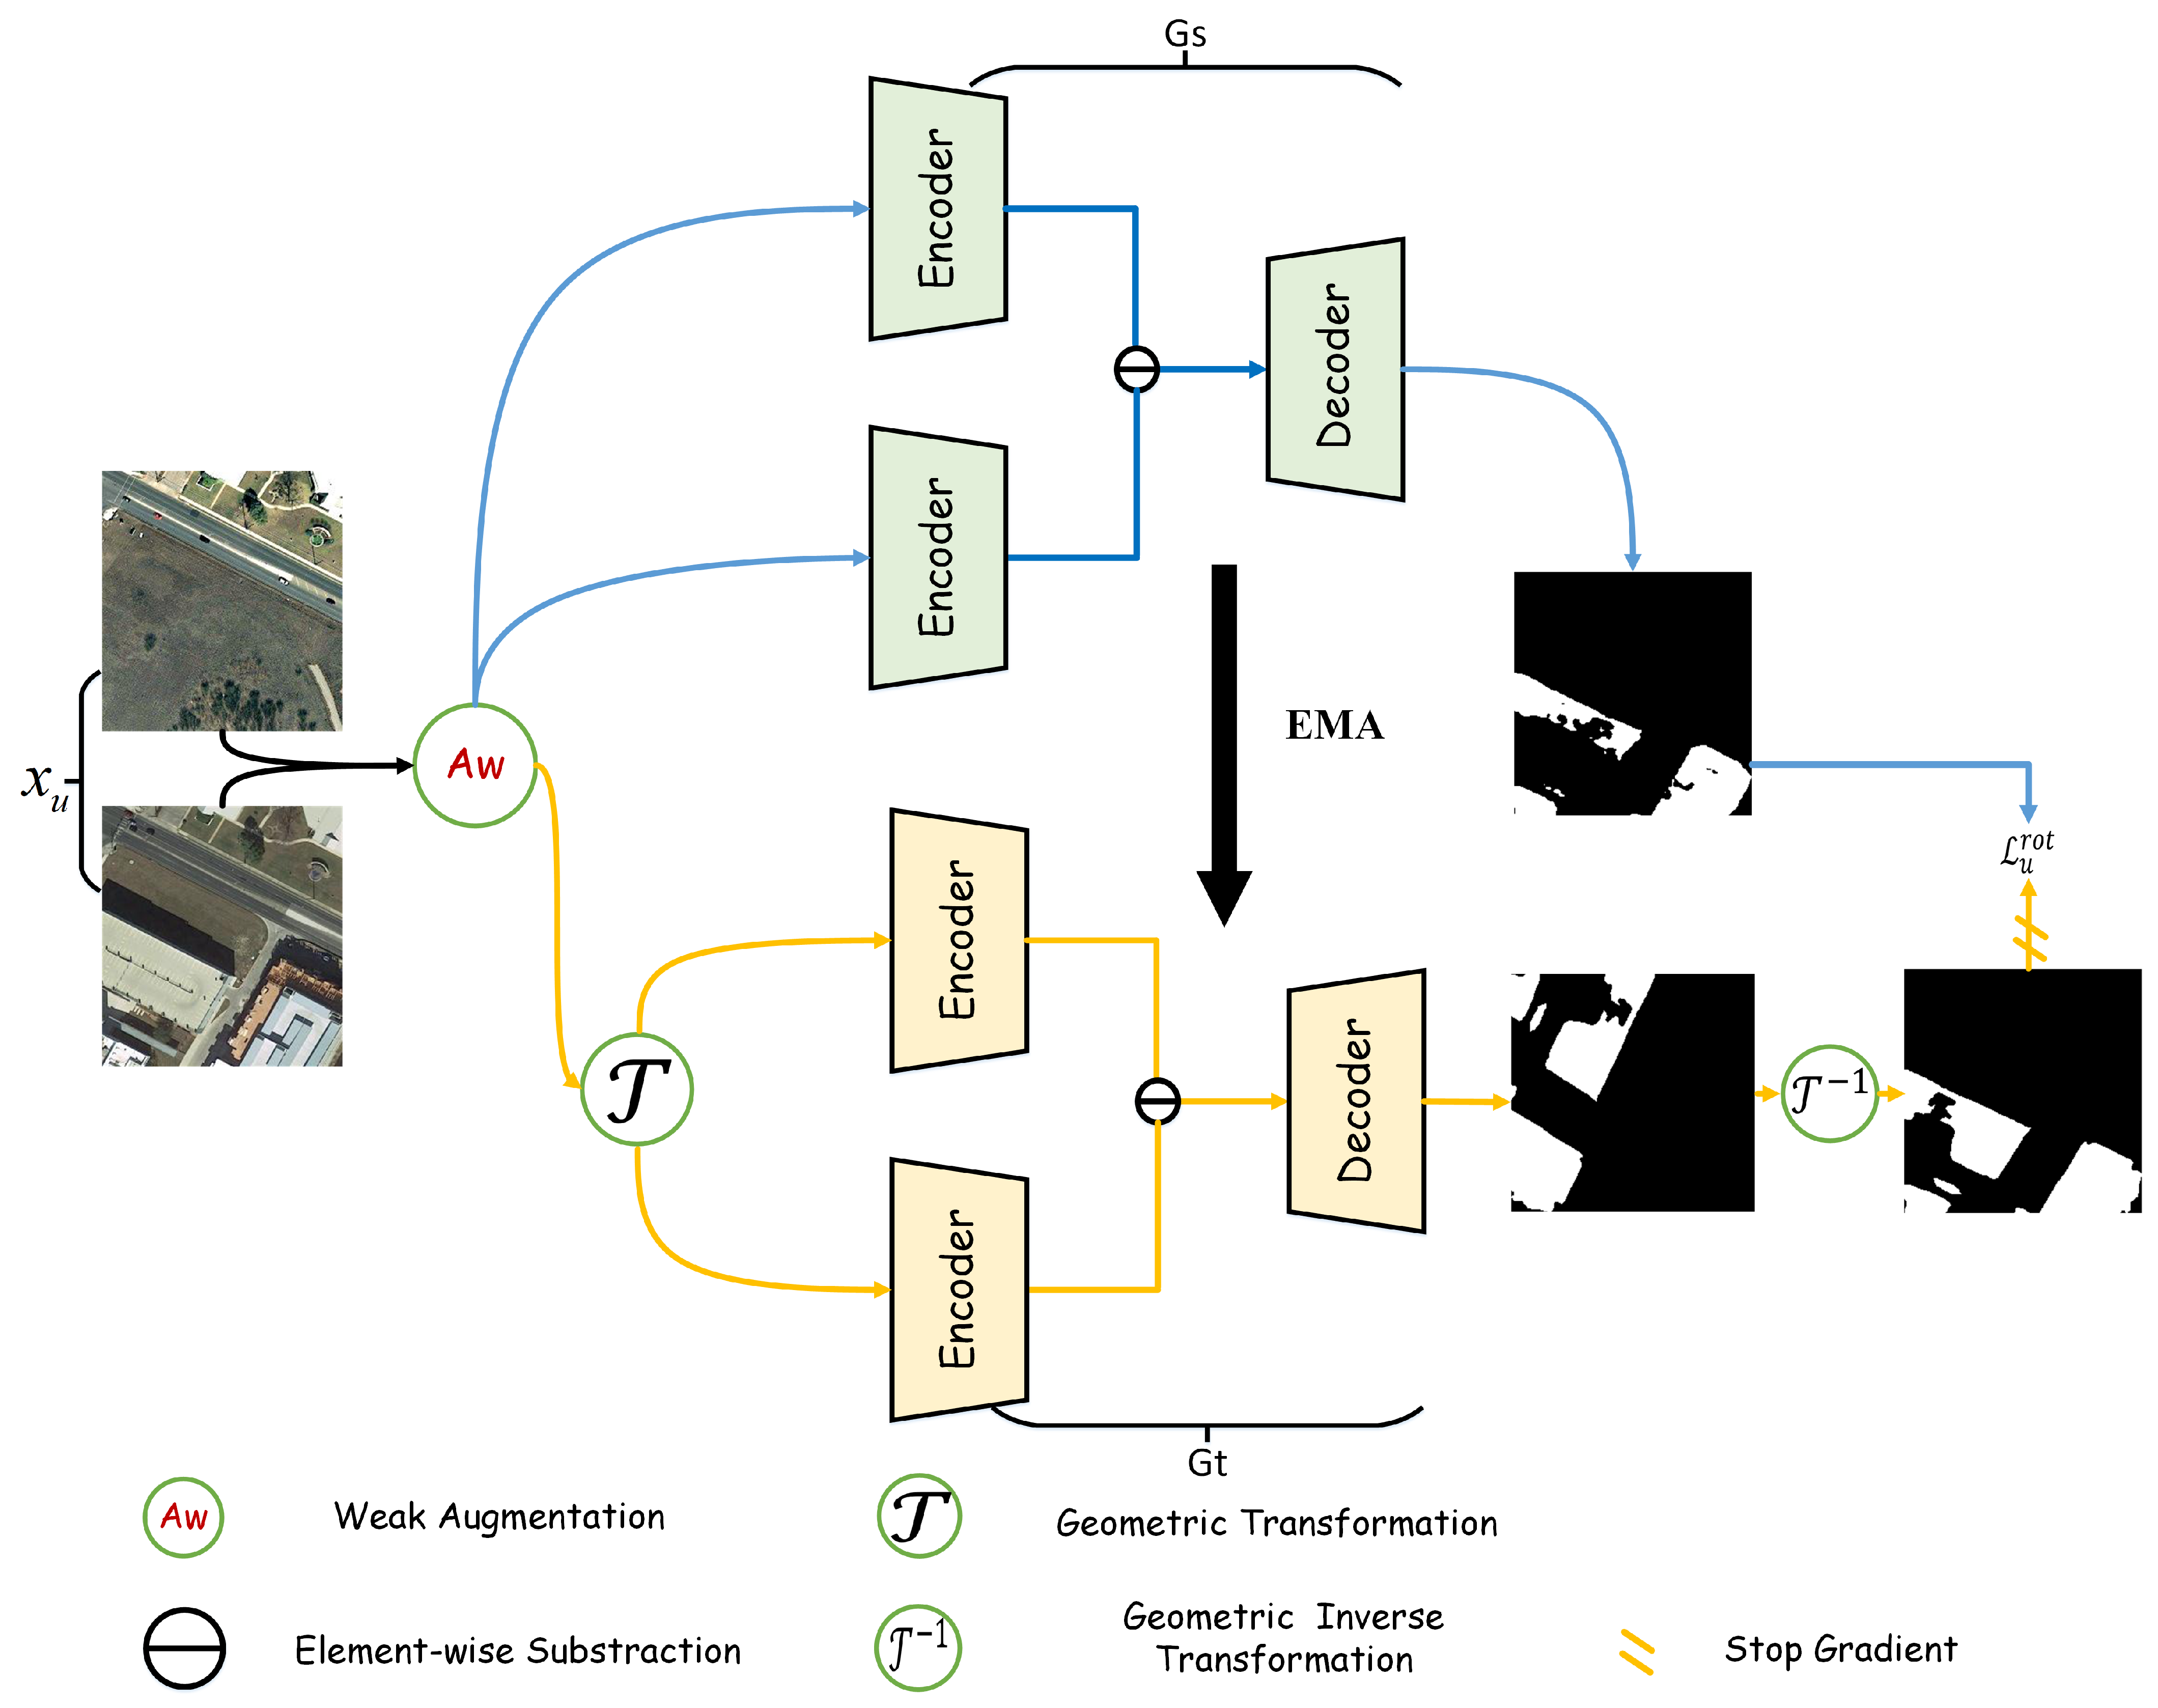
3.3. Weak–Strong Consistency Learning

To take full advantages of the possibilities offered by unlabeled data, we propose to introduce an extensive weak–strong consistency learning strategy, including weak-to-strong consistency, feature-level perturbation consistency and transformation perturbation consistency.
Weak-to-strong consistency. It works under the assumption that the output of the weakly perturbed images could serve as the pseudo labels for the strongly perturbed images. In our test, we use Random Crop, Random Flip as the weak augmentation operations A w , while we employ Random ColorJittor, Random Blur, Adaptive CutMix as the strong augmentation operations. Inspired by [57], we also use two strong views supervised by one weak view, where a weak augmentation view of the unlabeled data will be fed into the teacher network to generate pseudo labels, while two strong augmentation views of the unlabeled data will be fed into the student network to produce different predictions, which will be supervised by the pseudo labels. Note that such a strategy implicitly imposes contrastive learning to improve SSCD performance. Assuming A s 1 and A s 2 denote the two different strong augmentation operations, the corresponding weak predictions p u w and strong predictions p u s 1 and p u s 2 can be defined as:
p u w = G t ( A w ( x u ) )
p u s 1 = G s ( A s 1 ( A w ( x u ) ) )
p u s 2 = G s ( A s 2 ( A w ( x u ) ) )
Meanwhile, the corresponding pseudo label y u w can be generated based on the weak predictions p u w :
y u w = a r g m a x ( p u w )
Based on the above predictions, two pseudo label supervised losses L u s 1 and L u s 2 can be calculated as:
L u s 1 = 1 N c e ( p u s 1 , y u w ) I ( p u w > τ )
L u s 2 = 1 N c e ( p u s 2 , y u w ) I ( p u w > τ )
where I ( . ) is an indicator function and τ is a fixed threshold to exclude labels with low confidence. In particular, CutMix is proven to be an effective strong augmentation strategy to improve SSL performance, which imposes random copy–paste between unlabeled images and updates their pseudo labels simultaneously. However, such a strategy relies heavily on the accuracy of the synthetic labels and easily leads to confirmation bias. To tackle this issue, we propose an Adaptive CutMix (AdaCut) strategy, which progressively integrates specific insights from the labeled instances into the unlabeled. Given the labeled images and their true labels ( x l , y l ) and unlabeled images and their pseudo labels ( x u , y u w ) , the AdaCut process can be defined as:
x u m i x = M x u + ( 1 M ) x l
y u m i x = M y u w + ( 1 M ) y l
where M denotes the mask for mixing, which is generated by combining the randomly generated mask M 0 and the bounding box mask M l from y l through a union operation, namely, M = M 0 M l . Through such an adaptive CutMix strategy, the insights from the labeled data can be more effectively propagated to the unlabeled data, and the domain gap between them can also be better mitigated. It is worth noting that we also apply naive CutMix between different unlabeled images with a certain probability so as to fully leverage the information from unlabeled data. In such a way, both intra-domain and inter-domain information can be utilized to further improve SSCD performance.
Feature-level perturbation consistency. In addition to weak-to-strong image-level perturbation, strong feature-level perturbation is further introduced to achieve a complementary effect. It is applied by simply including the dropout operation at the end of the encoder. The corresponding predictions p u f p can be defined as:
p u f p = G ( D P ( E ( x u ) ) )
where D P ( . ) denotes the dropout operation. Then, a cross-entropy loss can be employed:
L u f p = 1 N c e ( p u f p , y u w ) I ( p u w > τ )
Transformation perturbation consistency. Transformation nonequivariance is a common issue for CNN-based networks. To overcome this limitation and enhance the regularization effect, we introduce transformation perturbation consistency for the unlabeled data. To be specific, we randomly rotate the input unlabeled images before they are fed into the teacher network, while images without rotation are directly fed into the student network. Then, an L2 loss is imposed on the output predictions from the teacher network and student network. The whole process is illustrated in Figure 3, where the transformation perturbation consistency loss L u r o t can be defined as:
L u r o t = 1 N T 1 ( G t ( T ( A w ( x u ) ) ) ) G s ( A w ( x u ) 2 2
where T ( . ) and T 1 ( . ) are the rotation transformation operation and its inverse form.

3.4. Class-Balanced Sampling

Due to the large proportionate difference between changed and unchanged pixels, the class imbalance issue exists widely for CD tasks. Previous works tackle this issue mainly by introducing additional modules, additional images or dynamic weights. These approaches, though effective, produce much additional computational overhead. Instead, we propose a simple yet effective class-balanced sampling (CBS) strategy without an increase in computational consumption. The rationale is that the images with more changed pixels should be sampled more times so as to facilitate network training and mitigate class imbalance. Specially, the changed ratio of each labeled image is calculated first, based on which sampling ratio is calculated to generate a new data list for the training pipeline. The algorithm of CBS is illustrated in detail in Algorithm 1.
Algorithm 1 Process of class-balanced sampling
Input: labeled samples { ( x i l , y i l ) } i = 1 M
Output: sample ratio s i , i = 1 , 2 , , M
  • i Calculate changed ratio r i of each labeled image based on y i l
  • ii Calculate median value of changed ratio, r m e d = m e d i a n ( r i )
  • iii Calculate sampled ratio of each labeled image, s i = m a x ( 1 , r i / r m e d )

3.5. Overall Loss Functions

Based on the supervised loss for the labeled data and the three different consistency losses for the unlabeled data, the overall loss functions are defined as:
L = L l + λ u ( L u s 1 + L u s 2 2 + L u f p + λ r o t L u r o t )
where λ u is the weight adjustment parameter for unsupervised loss. Specially, λ r o t = e 5 ( 1 t / t m a x ) 2 , with t and t m a x being the current iteration and maximum iteration.

4. Experiments

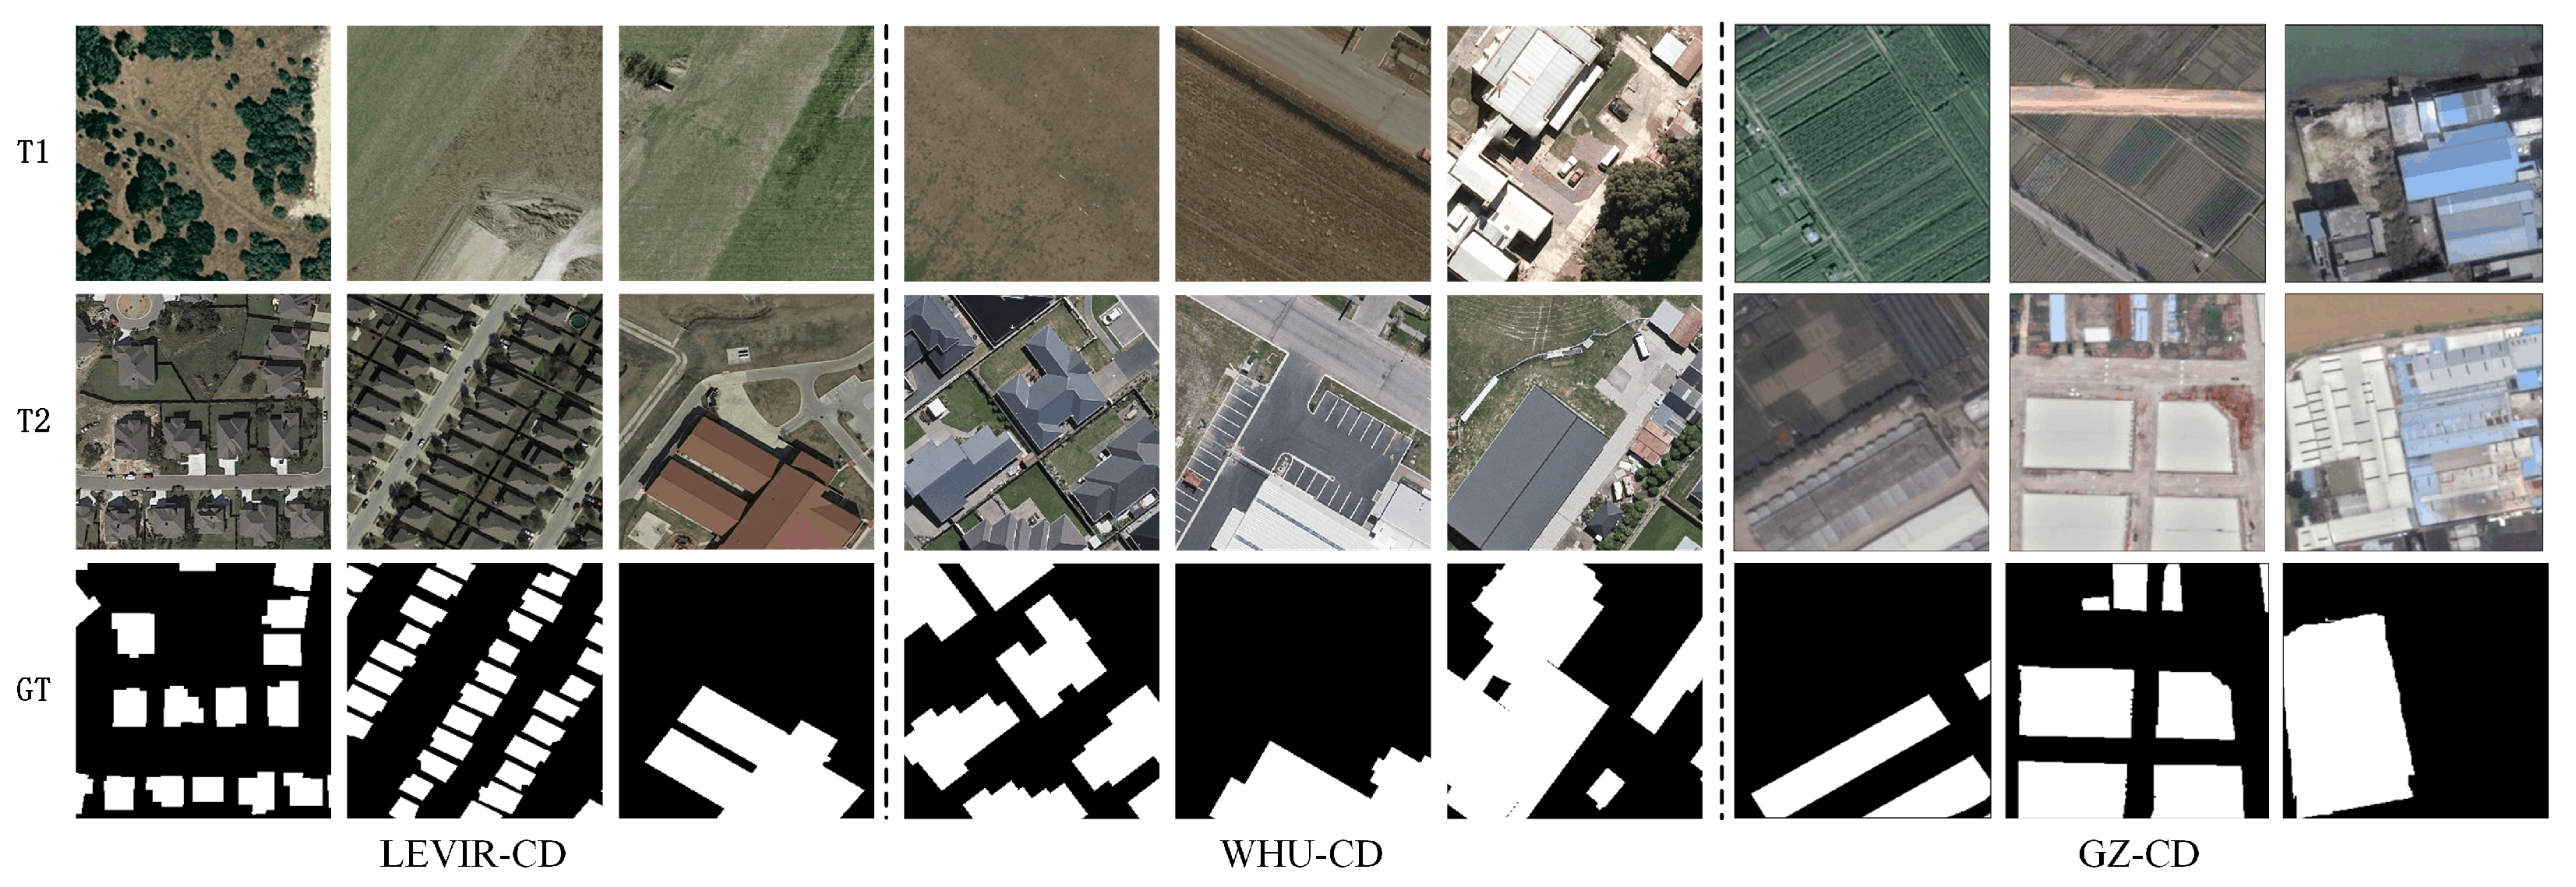
4.1. Dataset Descriptions

To validate the effectiveness of WACS-SemiCD, three very high-resolution (VHR) remote sensing image CD datasets are employed, namely, the LEVIR-CD dataset [16], WHU-CD dataset [58] and GZ-CD dataset [30]. A selection of example images from different datasets are displayed in Figure 4.
LEVIR-CD Dataset. It contains 637 bi-temporal images obtained through Google Earth, with RGB bands and a size of 1024 × 1024 pixels at 0.5 m per pixel. It mainly highlights changes in building structures, including additions and removals. The buildings range from villas and tall apartment buildings to small garages and expansive warehouses. Owing to GPU memory restrictions, the images are cropped into 256 × 256 non-overlapping image clips, yielding a total of 7120 training images, 1024 validation images and 2048 test images.
WHU-CD Dataset. This dataset illustrates the building changes in the New Zealand region before and after an earthquake, comprising a set of aerial images with RGB bands from 2012 to 2016. The images include 12,796 buildings of diverse sizes, spanning a region of 20.5 km2 with image dimensions of 32,507 × 15,354 pixels at a 0.3 m resolution per pixel. To facilitate GPU training, the images are segmented into blocks of 256 × 256 pixels, which are subsequently randomly distributed into training sets, validation sets and testing sets in a ratio of 8:1:1.
GZ-CD Dataset. This dataset encompasses 19 VHR image pairs with RGB bands that capture seasonal variations across a suburb area of Guangzhou, China. The images, acquired through Google Earth from 2006 to 2019, boast a spatial resolution of 0.55 m and vary in size from 1006 × 1168 pixels to 4936 × 5224 pixels. The primary changes observed are buildings of various uses. For GPU training convenience, these images are cut into tiles of 256 × 256 pixels and subsequently randomly allocated to training sets, validation sets and testing sets in a ratio of 8:1:1.

4.2. Training Details

The proposed approach is executed using the PyTorch framework, supported by a workstation equipped with a single NVIDIA RTX 3090 GPU and 24 GB of RAM. During the training stage, an AdamW optimizer is utilized with a base learning rate of 1 × 10 4 and a weight decay of 1 × 10 4 , where the learning rate is reduced by a polynomial scheduler. The batch size is set to 4, and the number of epochs is 80 for all three datasets. Furthermore, the labeled data ratio is fixed at {5%, 10%, 20%, 40%} for all datasets. We use Random Crop, Random Flip as the weak augmentations, while Random ColorJittor, Random Blur, Adaptive CutMix are the strong augmentations. In Equation (17), we set the weight parameter λ u = 1 .

4.3. Comparative Methods and Evaluation Metrics

To validate the superiority of WACS-SemiCD, five SOTA SSCD methods are compared and analyzed:
(1)
Semi-supervised semantic segmentation GAN (S4GAN) [59], which utilizes adversarial learning with a feature matching loss to enforce feature consistency between labeled and unlabeled images. A self-training step is added to further boost network performance.
(2)
SemiCD [31], where small perturbations of the difference map are used to enforce model predictions’ consistency on unlabeled images. Note that SemiCD includes two training phases: a supervised phase for labeled data and an unsupervised phase for unlabeled data.
(3)
UniMatch [57], where feature perturbation and unified dual-stream perturbations are proposed to enforce weak-to-strong consistency.
(4)
Ensemble cross pseudo supervision (ECPS) [40], where a crosswise model ensemble strategy is used to enhance pseudo label quality and improve CD performance with limited labeled data.
(5)
Coarse-to-fine semi-supervised change detection (C2F-SemiCD) [32], where changed features are extracted through coarse-to-fine feature fusion and a mean-teacher network is further employed for a semi-supervised update.
For quantitative evaluation, three metrics—F1-score (F1), Intersection over Union (IoU) and Kappa coefficient (Kappa)—are computed using the true labels and the predictions, which are detailed as follows.
P = TP TP + FP
R = TP TP + FN
F 1 = 2 × P × R P + R
IoU = TP TP + FP + FN
OA = TP + TN TP + FP + TN + FN
PRE = ( TP + FN ) × ( TP + FP ) ( TP + TN + FP + FN ) 2 + ( TN + FP ) × ( TN + FN ) ( TP + TN + FP + FN ) 2
Kappa = OA PRE 1 PRE
where TP and TN signify the count of pixels accurately identified as changed and unchanged, respectively. FP indicates the count of unchanged pixels incorrectly classified as changed, and FN denotes the count of changed pixels incorrectly classified as unchanged. It is crucial to understand that a higher F1-score, IoU and Kappa indicate superior CD performance.

4.4. Results

4.4.1. Parameter Setting

Within the loss functions as specified in Equations (10), (11) and (15), a fixed threshold τ has to be determined to filter out uncertain labels, which is vital for the loss calculation. To verify its influence, a series of τ values are set. To be specific, τ is sampled from a pool of {0.75, 0.80, 0.85, 0.90, 0.95}, and the corresponding CD accuracy on three CD datasets is calculated in terms of F1-score, as presented in Figure 5. One can observe that when τ is set to be a lower value of 0.75, all three datasets achieve a poor F1-score. This is due to the reason that less uncertain regions are filtered out for the pseudo label, which brings about much noise in the calculation of the loss function. On the other hand, when the value of τ gradually increases, more uncertain regions will be erased, leading to finer pseudo labels with less noise. As a result, the network is optimized with a more accurate supervision signal, and the CD performance observes an obvious gain in the F1-score. It is worth noting that a decline trend is observed for the WHU-CD and GZ-CD datasets with a further increase in τ . This may be because the quality of the pseudo label is already high, with a τ value of 0.9 and 0.85, while a larger τ will filter out certain regions in the pseudo label. To achieve better performance, τ is set to be 0.95, 0.9 and 0.85 for the LEVIR-CD dataset, WHU-CD dataset and GZ-CD dataset, respectively.

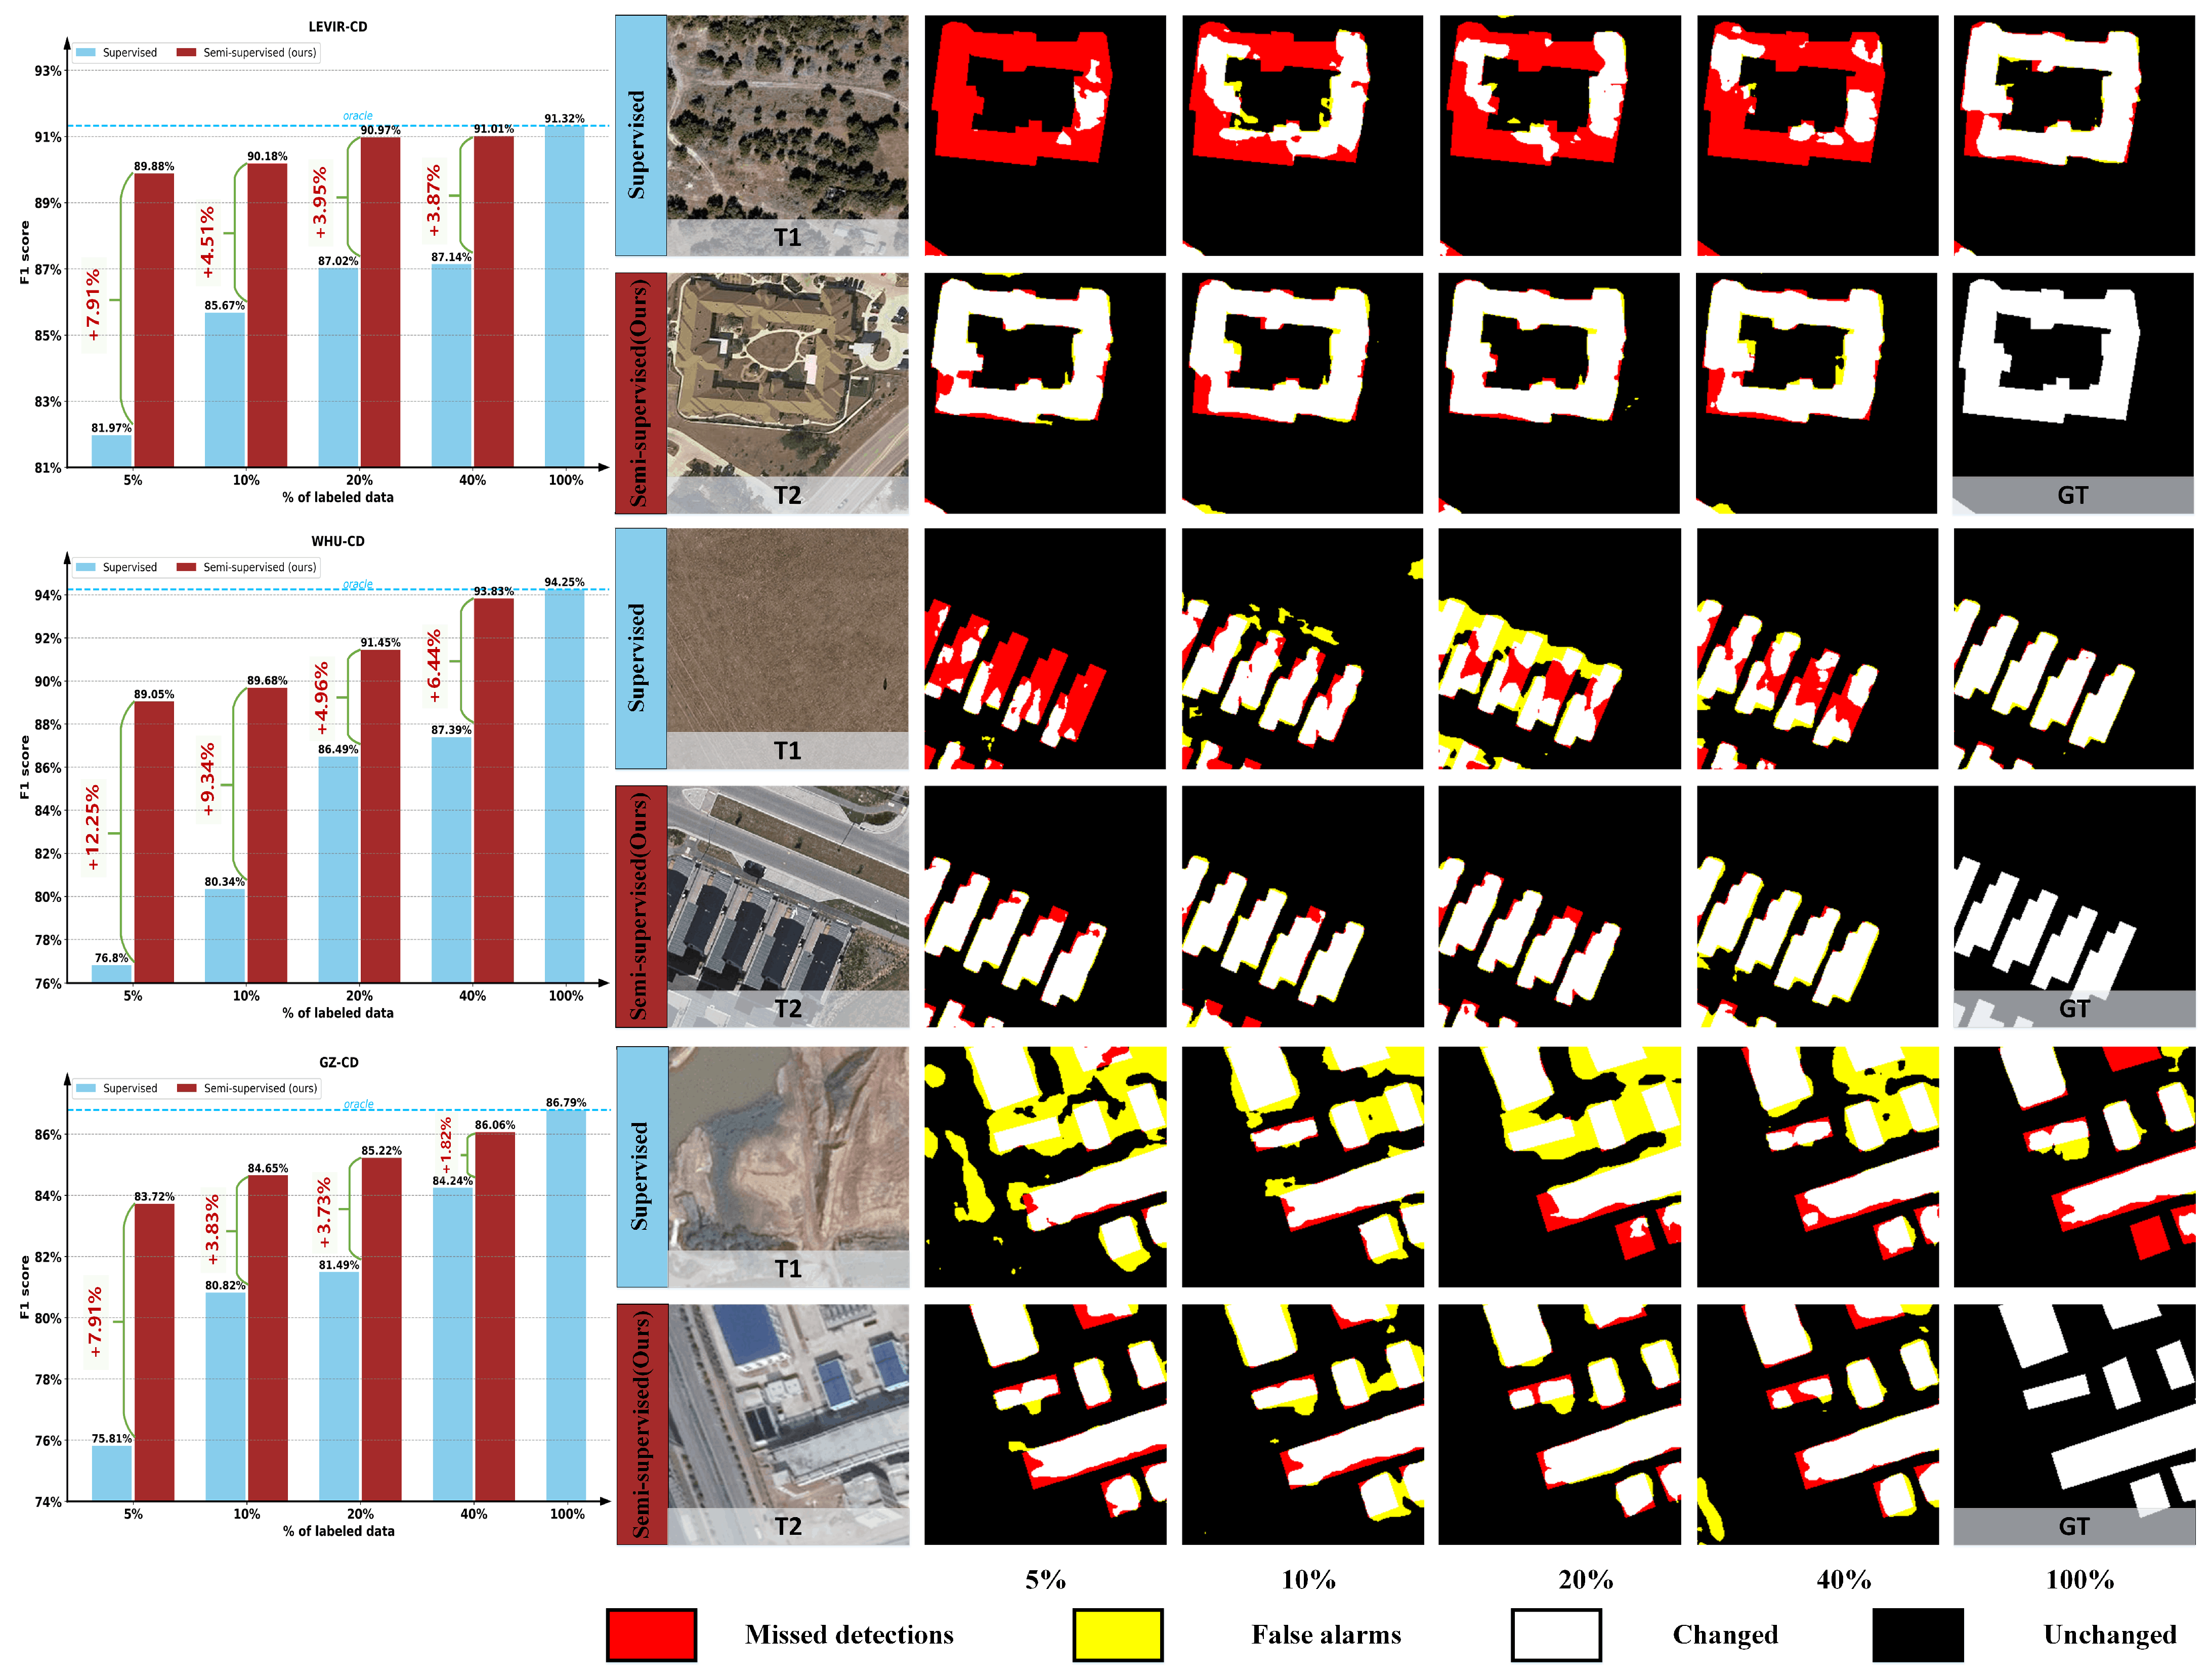
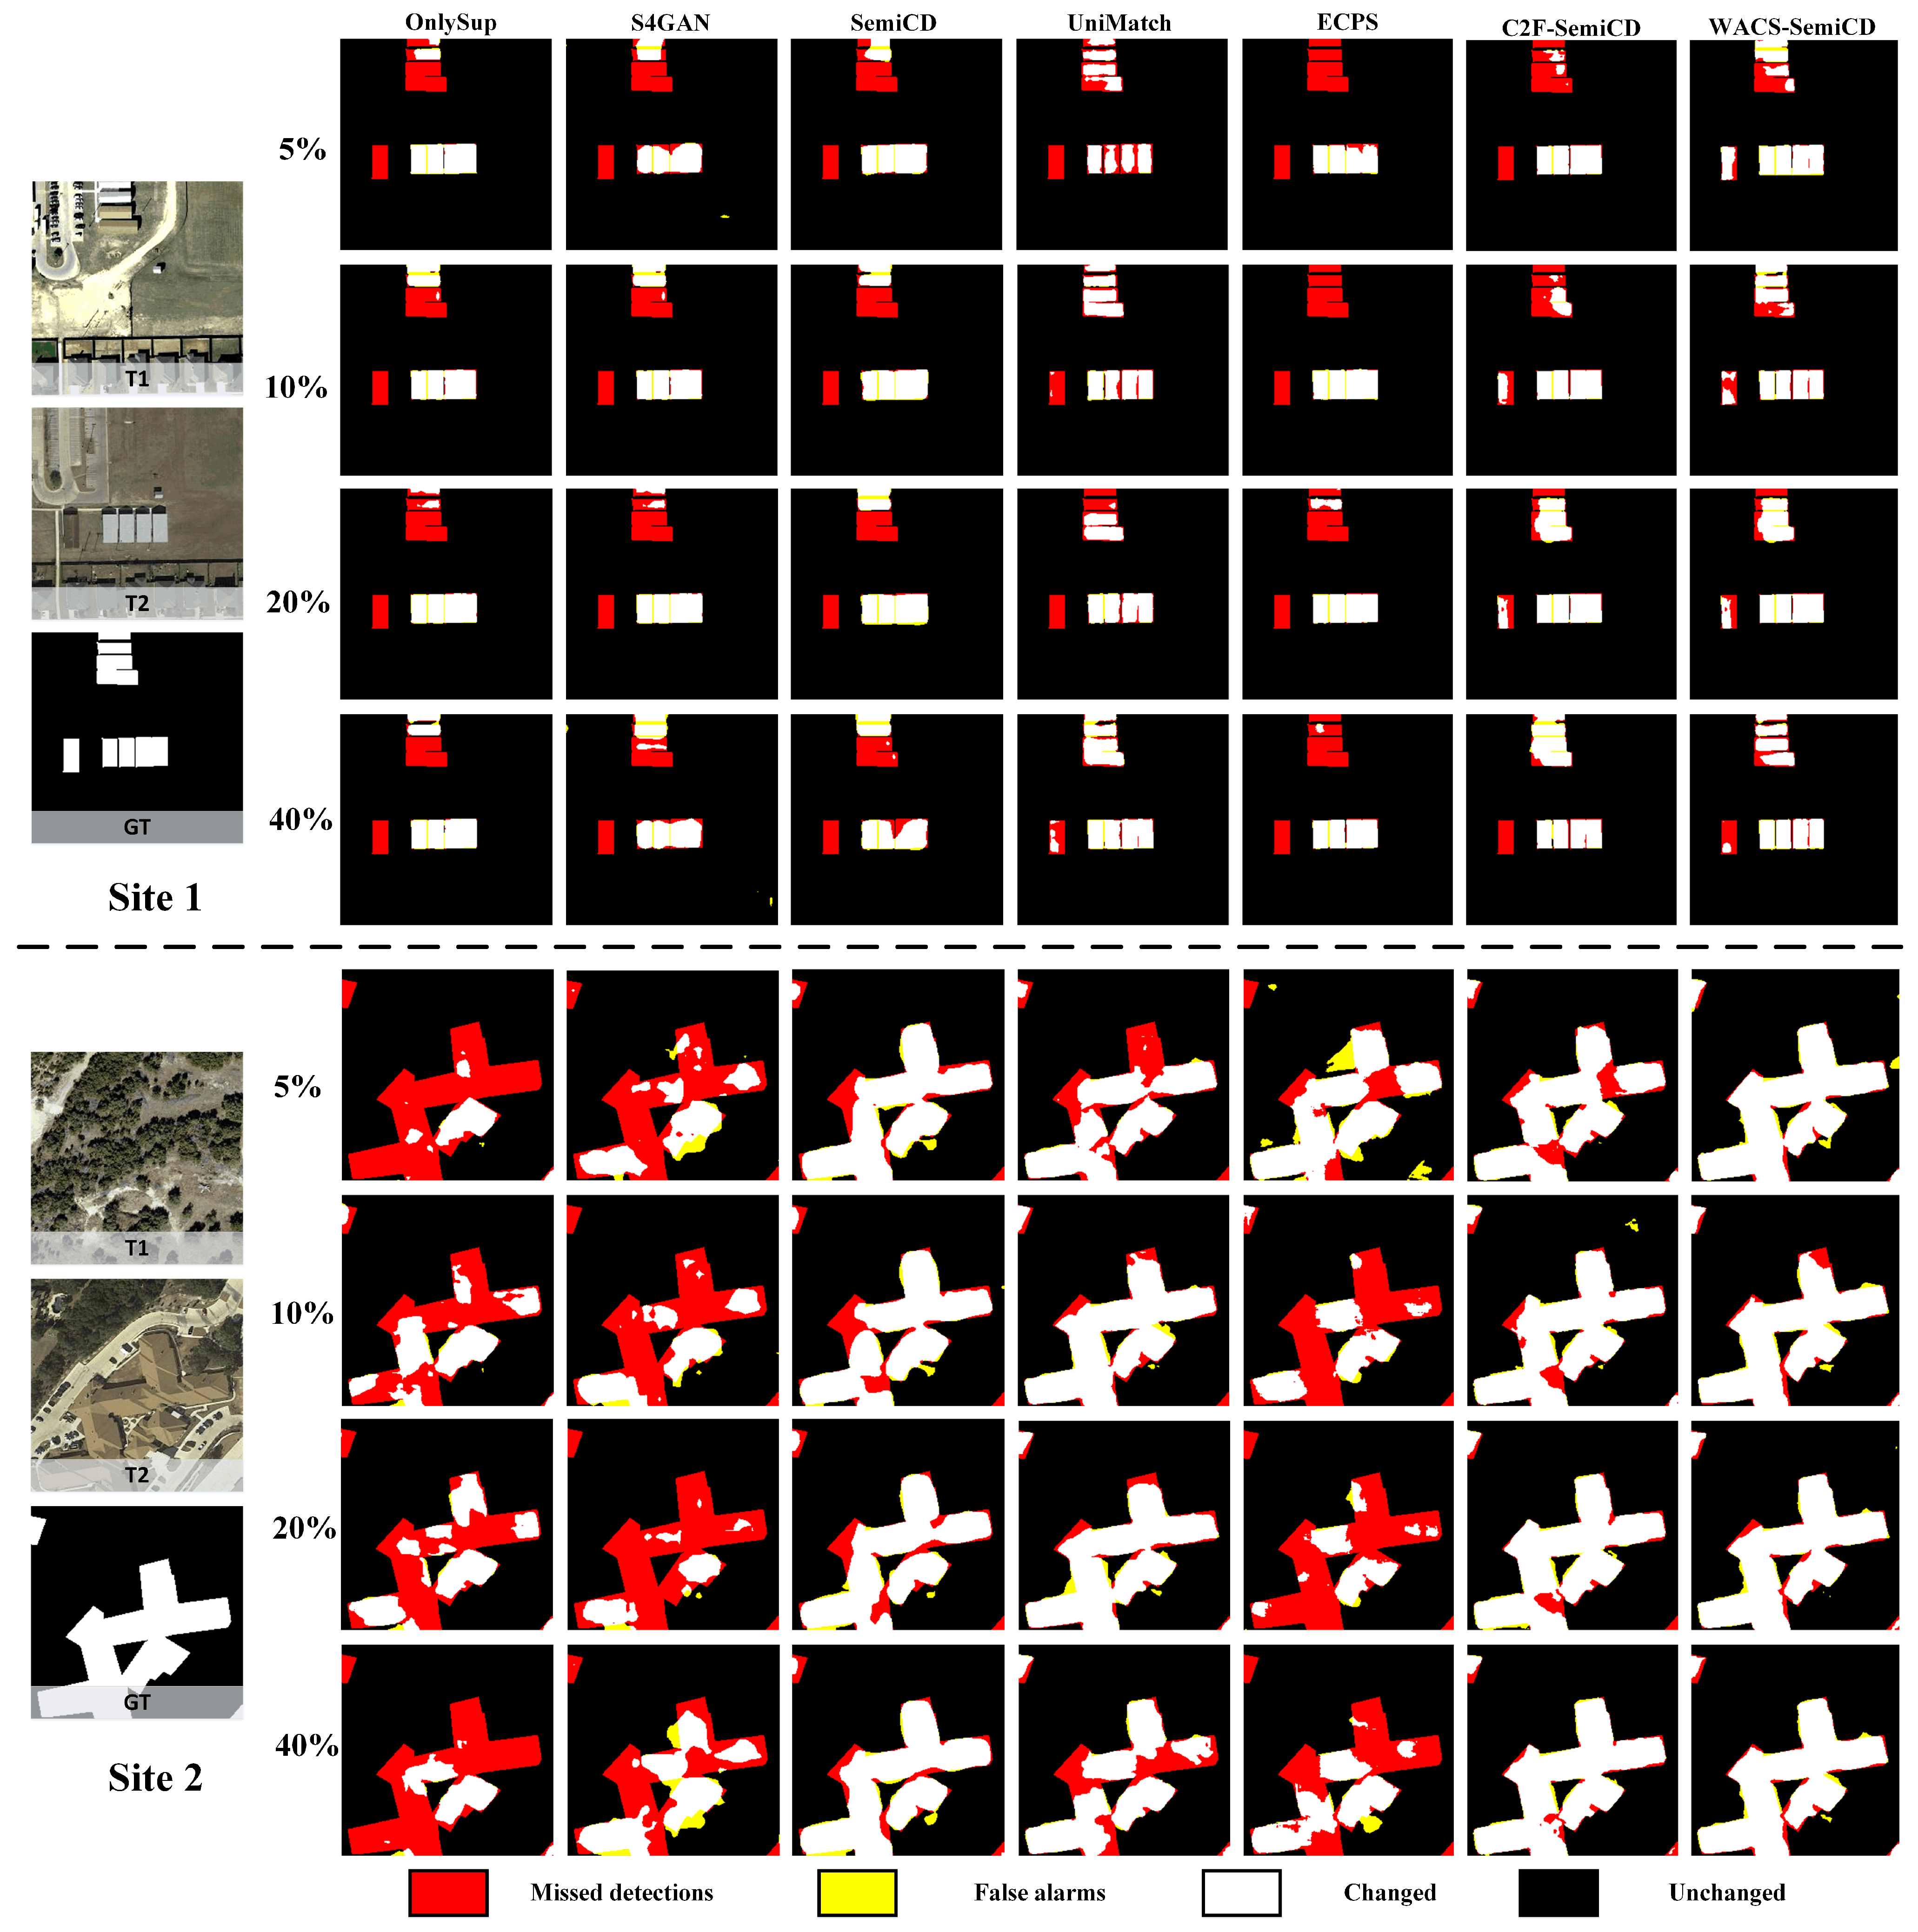
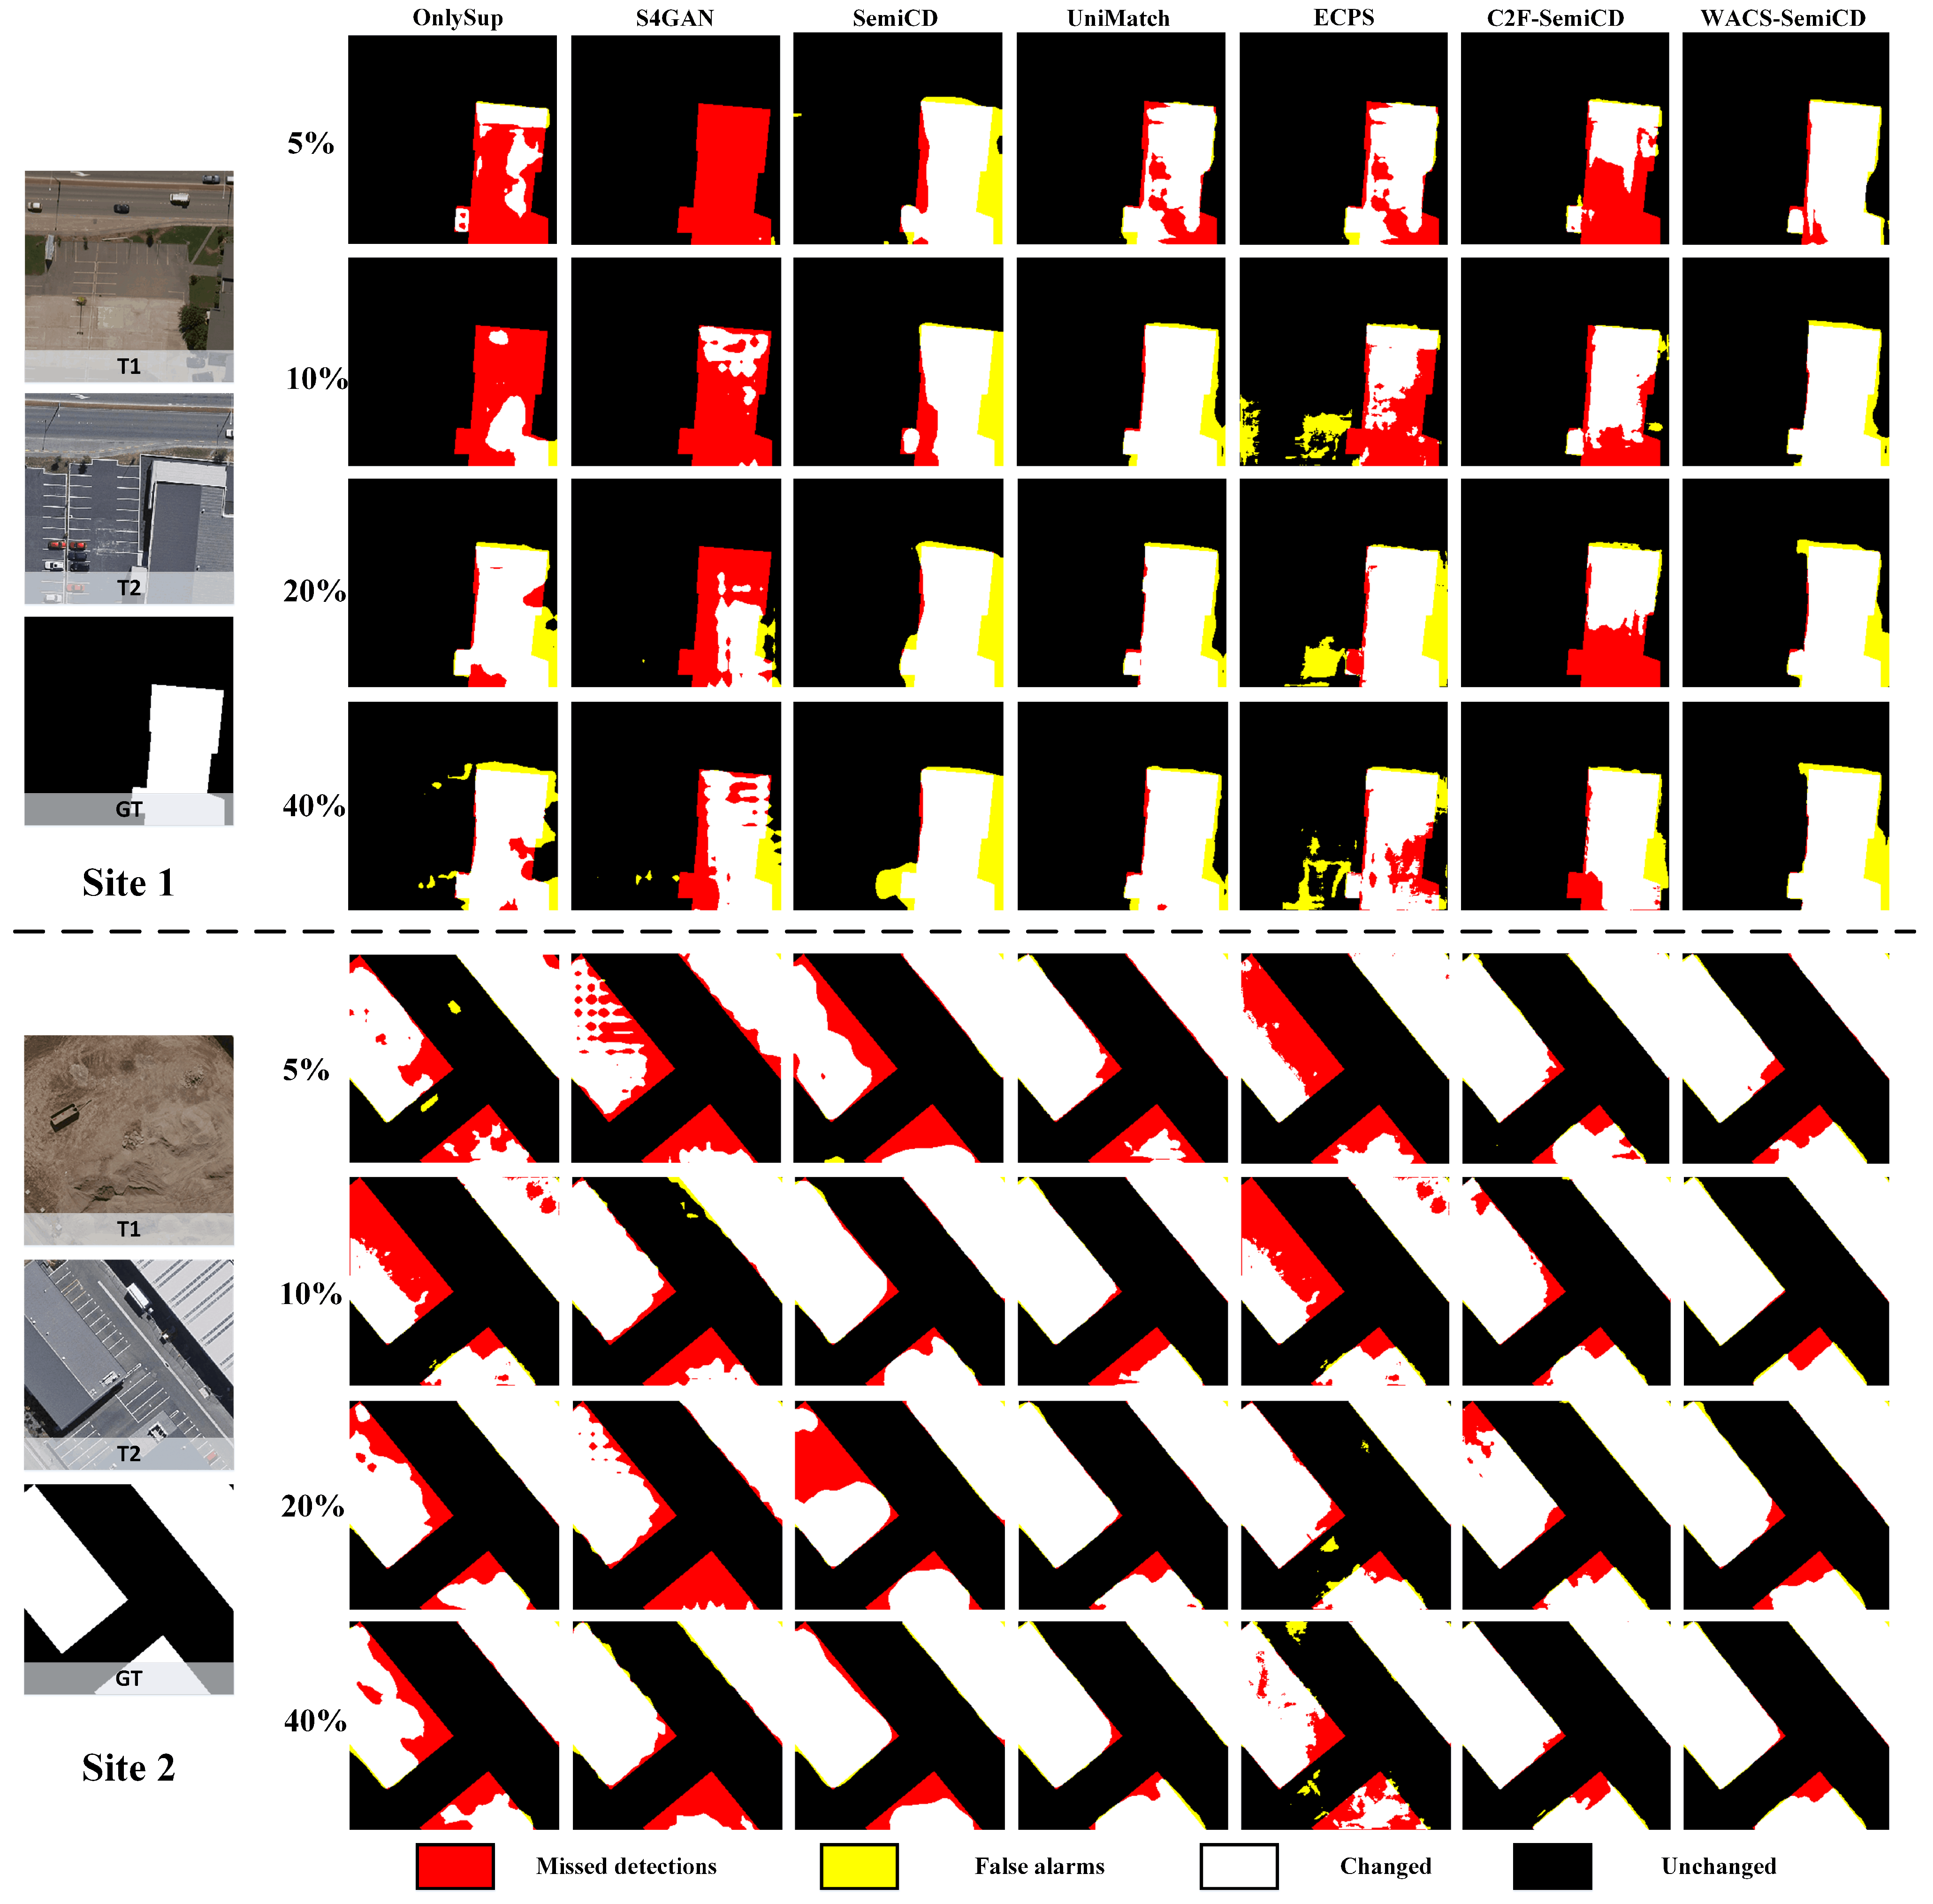
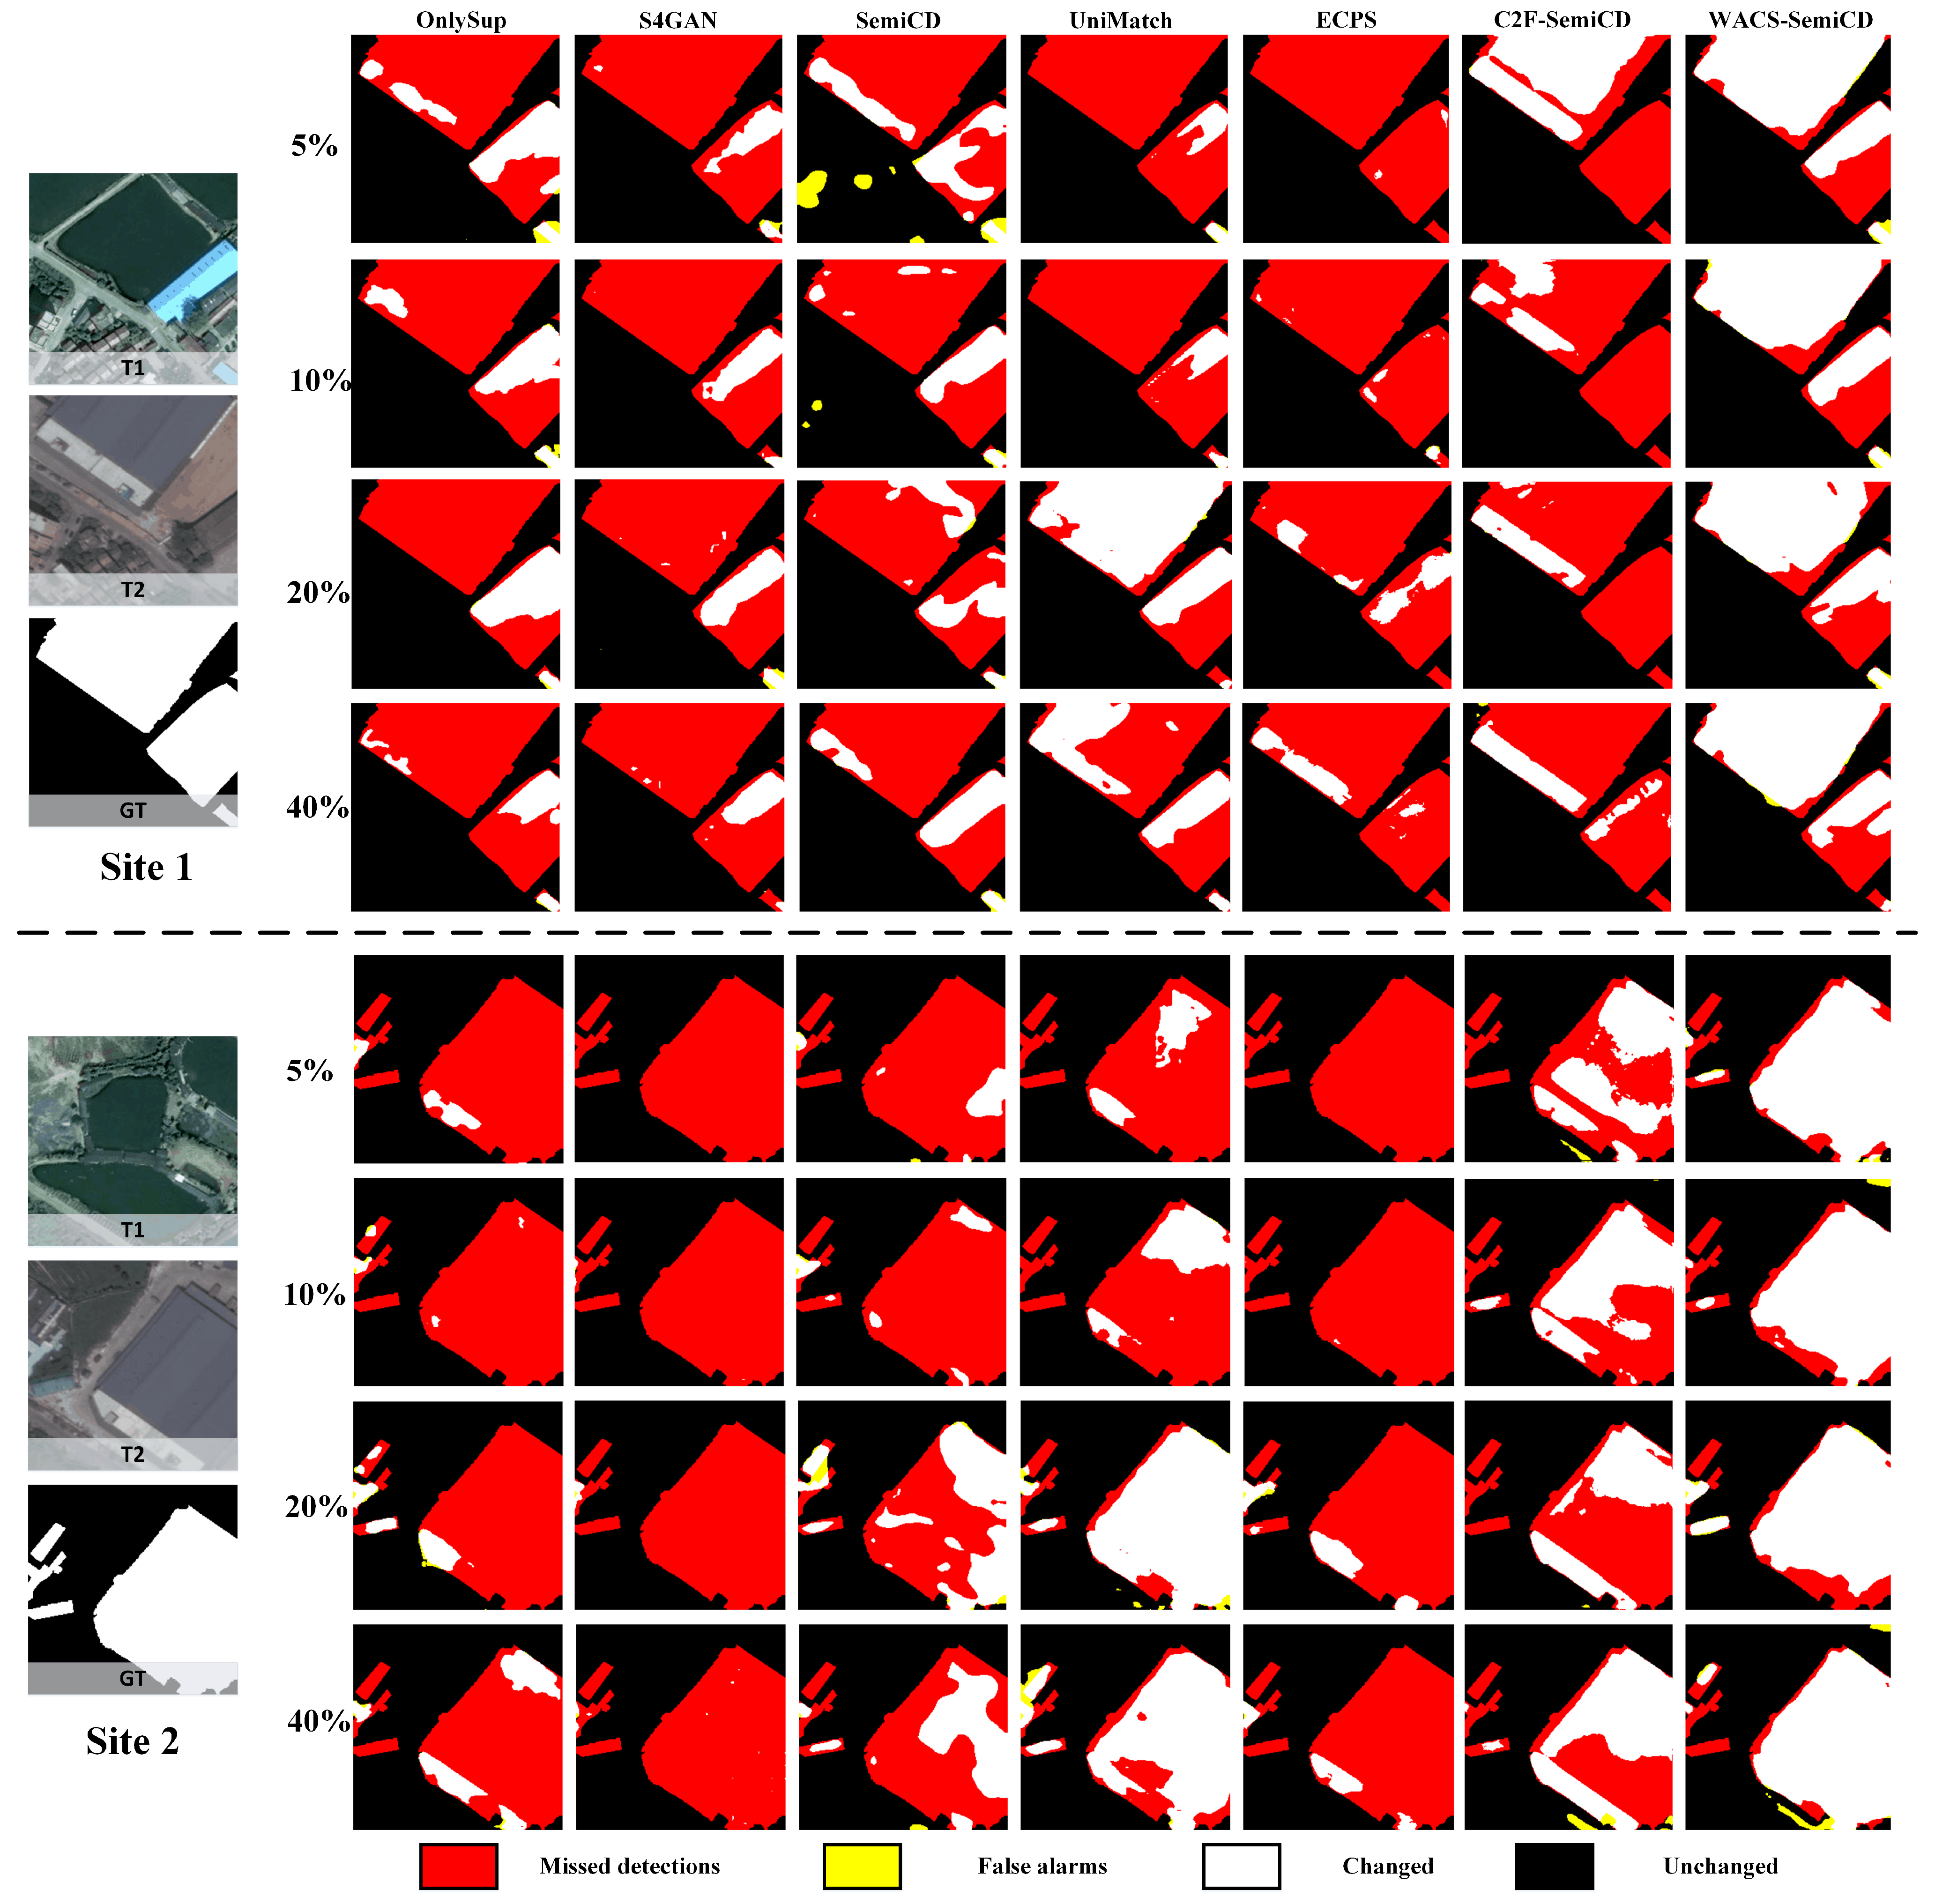
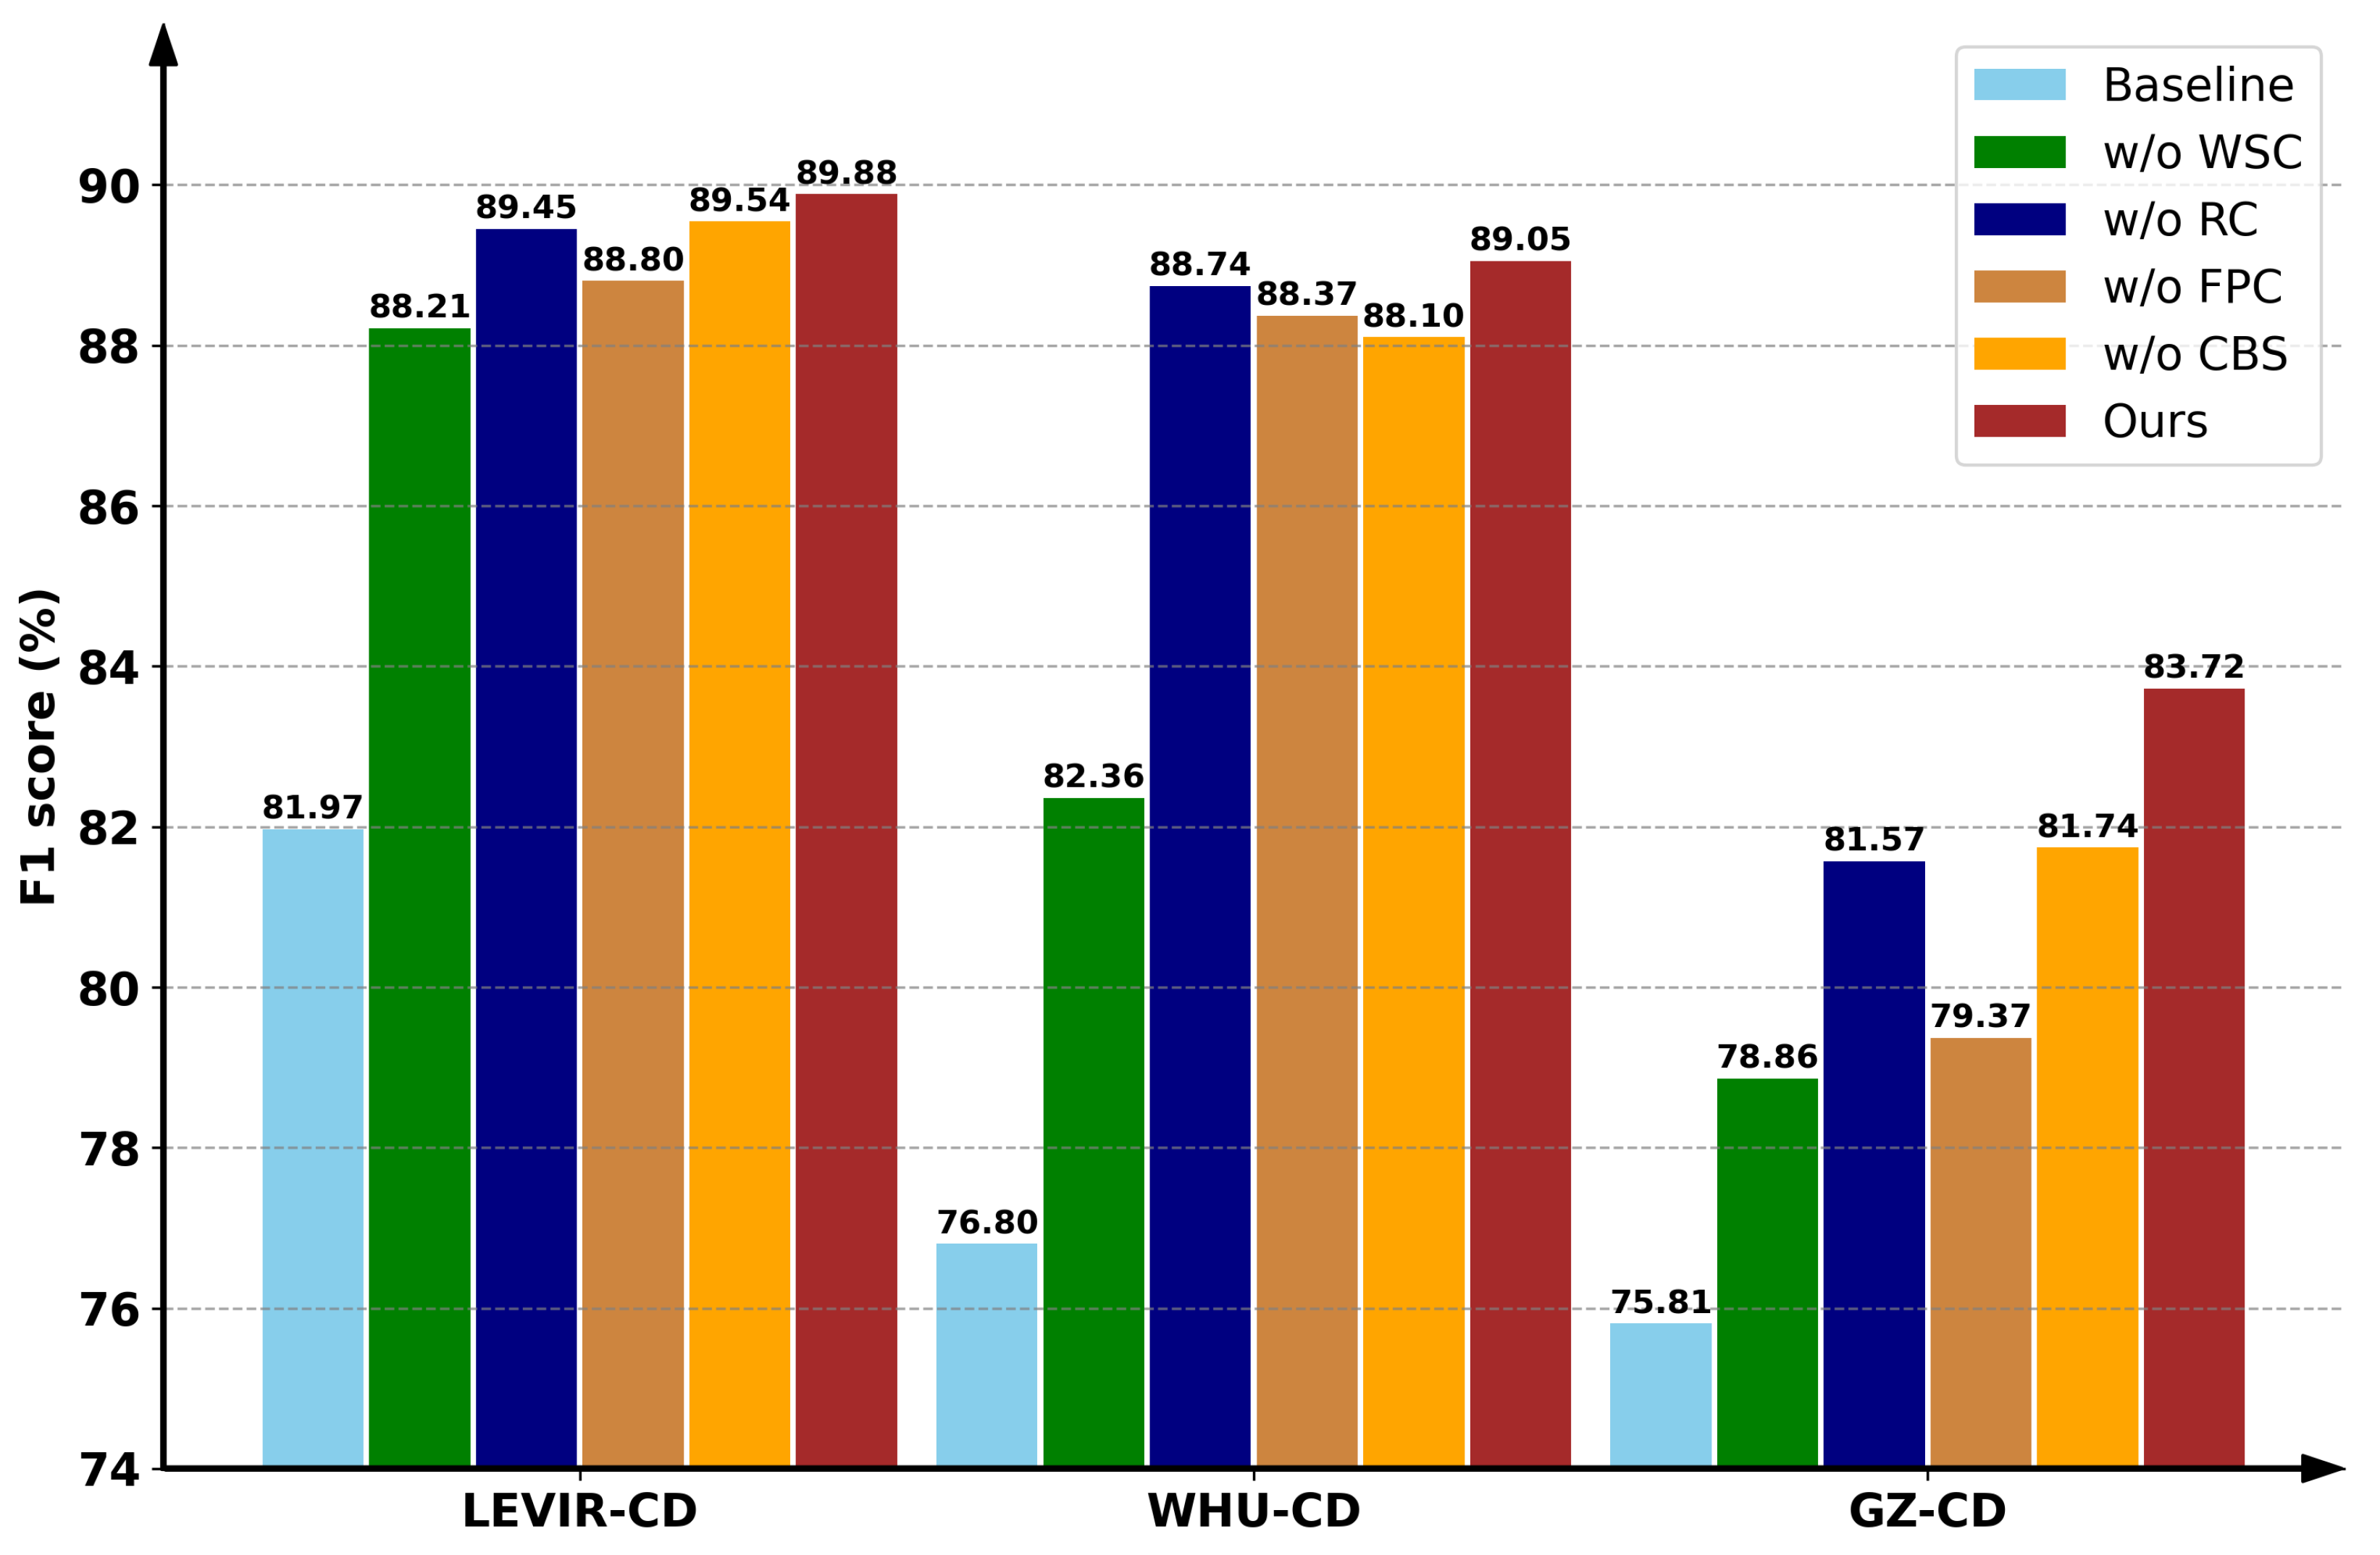
4.4.2. Performance Analysis

To validate the efficacy of our WACS-SemiCD, detailed experimental findings are analyzed and discussed for different CD datasets.
LEVIR-CD Dataset. For visual comparison, two typical sites are chosen, and the corresponding SSCD results of various methods at varying labeled ratios are depicted in Figure 6. We can observe that there are numerous missed detections in the baseline method of Only-Sup. Due to the unstable training effect of adversarial networks, S4GAN observes even worse visual performance against the baseline. When including unlabeled information by using other semi-supervised techniques (Columns 3–5 of Figure 6), the missed detections can be mitigated to varying degrees. In contrast, C2F-SemiCD and our proposed WACS-SemiCD (Columns 6–7 of Figure 6) obtain much better visual results with the smallest number of missed detections and false alarms. Particularly, compared with other methods, WACS-SemiCD observes more accurate detailed change information such as building boundaries.
Figure 5. Effect of different threshold settings on CD performance.
Remotesensing 17 00576 g005
For quantitative evaluation, three metrics—F1, IoU and Kappa—under different semi-supervised settings are calculated and reported in Table 1. It can be observed that, in comparison to Only-Sup, S4GAN achieves even worse metric scores on all the four semi-supervised settings for the three CD datasets. This is consistent with the visual performance, demonstrating the difficulty of training an adversarial network. On the contrary, all the other SSCD methods observe superior quantitative performance to varying degrees. Overall, the performance gap is larger with smaller labeled ratios, while the number is smaller with larger labeled ratios. For instance, compared with Only-Sup, SemiCD yields an F1 increase of 3.21%, 1.38%, 0.52% and 1.12% under four semi-supervised settings, respectively. This is due to the introduction of extensive feature perturbations on the difference features. By enforcing consistency between the predictions before and after perturbations, the unlabeled information can be well exploited, thus improving the generalization of the CD network. Based on pseudo label learning, UniMatch employs simple weak-to-strong consistency by using dual-stream image-level perturbations and an auxiliary feature-level perturbation, leading to competitive SSCD performance. As a result, compared to Only-Sup, it obtains an F1 gain of 5.82%, 3.72%, 2.45% and 2.35% across the four evaluation protocols, respectively. Differently, ECPS takes advantages of pseudo label learning by introducing crosswise pseudo label supervision to enhance the quality of synthesized labels. However, to facilitate model ensembles, many student models need to be used, leading to complex training procedures and inferior SSCD performance. Note that C2F-SemiCD achieves the best quantitative performance with different evaluation protocols among all the comparative methods. This may be attributed to the powerful CD network of C2FNet, which is capable of extracting change information from coarse-grained to fine-grained. Consequently, compared to Only-Sup, it observes an F1 gain of 7.94%, 5.03%, 4.21% and 4.23% across different evaluation protocols, respectively. However, many additional modules are included in C2FNet, which inevitably leads to a sharp increase in computational overhead. On the contrary, our proposed WACS-SemiCD observes competitive quantitative performance without any additional training procedures or complex network architectures. By employing simple weak–strong consistency learning and class-balanced sampling, it yields an F1 increase of 7.91%, 4.51%, 3.95% and 3.87% with different labeled ratios, respectively.
WHU-CD Dataset. For a visual performance comparison of diverse SSCD methods, CD results on two typical sites are presented in Figure 7. One can observe that, due to the failure of network convergence with limited training data, there are numerous missed detections and false alarms with the baseline method of Only-Sup, especially under a labeled ratio of 5%. When exploiting unlabeled data potentials using semi-supervised techniques, the generalization capacity of CD networks can be improved significantly, leading to fewer missed detections and false alarms to varying degrees. Note that our proposed WACS-SemiCD is capable of producing more precise change maps with the smallest number of missed detections and false alarms, which is especially obvious with labeled ratios of 5% and 10%. This highlights the effectiveness and reliability of our WACS-SemiCD.
In the context of quantitative analysis, three metrics—F1, IoU and Kappa—are calculated and listed in Table 2. It can be observed that, due to the limitation of labeled data, the baseline method of Only-Sup still achieves poor quantitative performance among all the comparative methods, especially when the labeled ratio is 5%. By employing adversarial learning and self-training, S4GAN observes slightly better performance, with an F1 increase of 3.25%, 3.22%, 0.32% and 1.1% across different evaluation protocols. By enforcing feature perturbation consistency, SemiCD achieves small performance gains with labeled ratios of 5%, 10% and 40%, but a lower performance with a labeled ratio of 20%. This demonstrates the difficulty of choosing proper feature perturbation for different scenarios in SemiCD. Note that ECPS also obtains unstable quantitative performance across different labeled settings. It obtains an F1 increase of 1.94% with 5% labeled data but an F1 decrease of 0.55%, 4.29% and 5.1% with labeled ratios of 10%, 20% and 40%, respectively. This may be attributed to the instability of the model ensemble when student network performance is poor. In contrast, UniMatch and C2F-SemiCD achieve stable performance gains across different evaluation protocols, which demonstrates the effectiveness of weak-to-strong consistency and C2FNet. By including weak–strong consistency and class-balanced sampling, our proposed WACS-SemiCD outperforms all other comparative approaches in terms of quantitative metrics. Specially, it achieves an F1 gain of 12.25%, 9.34%, 4.96% and 6.44% with different labeled ratios, respectively.
GZ-CD Dataset. To facilitate visual assessment among various SSCD approaches, testing images on two typical sites are selected, whose CD results are depicted in Figure 8. It can be deduced that the baseline method of Only-Sup incurs a high rate of missed detections. Although including different semi-supervised learning techniques, the missed detections still exist widely for S4GAN, SemiCD and ECPS. In contrast, the missed detections can be better reduced by using UniMatch and C2F-SemiCD. Note that our proposed WACS-SemiCD obtains change maps with the least missed detections relative to all competing methods, highlighting the robustness and validity of our method.
Quantitative analysis involves the aggregation of F1, IoU and Kappa metrics across four evaluation protocols, as detailed in Table 3. It is apparent that, due to the influence of unstable adversarial network optimization, S4GAN exhibits the poorest results across all the comparative techniques. In comparison to Only-Sup, it achieves an F1 decrease of 16.51%, 6.49%, 1.28% and 2.95% with different labeled ratios, respectively. Similarly, due to the difficulty of selecting proper feature perturbation and instability of the model ensemble, SemiCD and ECPS also observe quantitative performance drops. On the contrary, UniMatch and C2F-SemiCD obtain stable performance gains. Note that our proposed WACS-SemiCD maintains the top quantitative performance across all the comparative techniques, with an F1 increase of 7.91%, 3.83%, 3.73% and 1.82% under different labeled settings, respectively.
Overall, on the LEVIR-CD dataset, C2F-SemiCD achieves the best SSCD performance, our proposed WACS-SemiCD obtains the second-best SSCD performance, and UniMatch yields the third-best SSCD performance. For the WHU-CD dataset, the top three SSCD methods are WACS-SemiCD, UniMatch and C2F-SemiCD, respectively. For the GZ-CD dataset, the top three SSCD methods are WACS-SemiCD, C2F-SemiCD and UniMatch, respectively. The reason may be due to the fact that a heavy-weighted CD detector is used in C2F-SemiCD, which possesses larger model parameters and where more training samples are needed to learn the parameters. As a result, C2F-SemiCD achieves superior performance on the LEVIR-CD dataset with larger training samples, while it has inferior performance on the WHU-CD and GZ-CD datasets with smaller training samples. Due to the limitation of generating pseudo labels using a single CD network, UniMatch yields inferior SSCD performance on all three datasets. In contrast, our proposed WACS-SemiCD employs a mean-teacher architecture with a light-weighted CD detector, which is less sensitive to the number of training samples. By combining weak–strong consistency learning and class-balanced sampling, it consistently gains superior performance on all three datasets.

4.5. Discussion

4.5.1. Effect of Different Augmentations

To leverage the utmost potential of labeled data as well as unlabeled data, we have devised a weak–strong consistency (WSC) strategy with the Adaptive CutMix augmentation, which is capable of transferring the knowledge from the labeled data into the unlabeled and mitigating their domain gap. In addition, feature-level perturbation consistency (FPC) is employed to expand the perturbation space and improve SSCD performance, rotation consistency (RC) is introduced to impose regularization for CNN networks, and the CBS strategy is proposed to overcome the class imbalance issue. To assess the efficacy of these strategies, an ablation analysis was performed on three CD datasets using 5% labeled data, as shown in Figure 9. It can be seen that, in contrast to the baseline method, which does not employ any strategies, our proposed WACS-SemiCD achieves much better quantitative results, with an F1 gain of 7.91%, 12.25% and 7.91% for the LEVIR-CD dataset, WHU-CD dataset and GZ-CD dataset, respectively. When removing the WSC, RC, FPC or CBS strategy, an obvious performance drop can be observed, which demonstrates the effectiveness and reliability of each module. To further verify the effectiveness of our proposed Adaptive CutMix method, we compare it with the traditional CutMix strategy, which only exchanges information between different unlabeled data randomly. As presented in Figure 10, our proposed Adaptive CutMix method consistently outperforms traditional CutMix on the three datasets, yielding an F1 gain of 0.41%, 0.32% and 2.85% for the LEVIR-CD dataset, WHU-CD dataset and GZ-CD dataset, respectively. This demonstrates the effectiveness and superiority of our proposed Adaptive CutMix strategy.

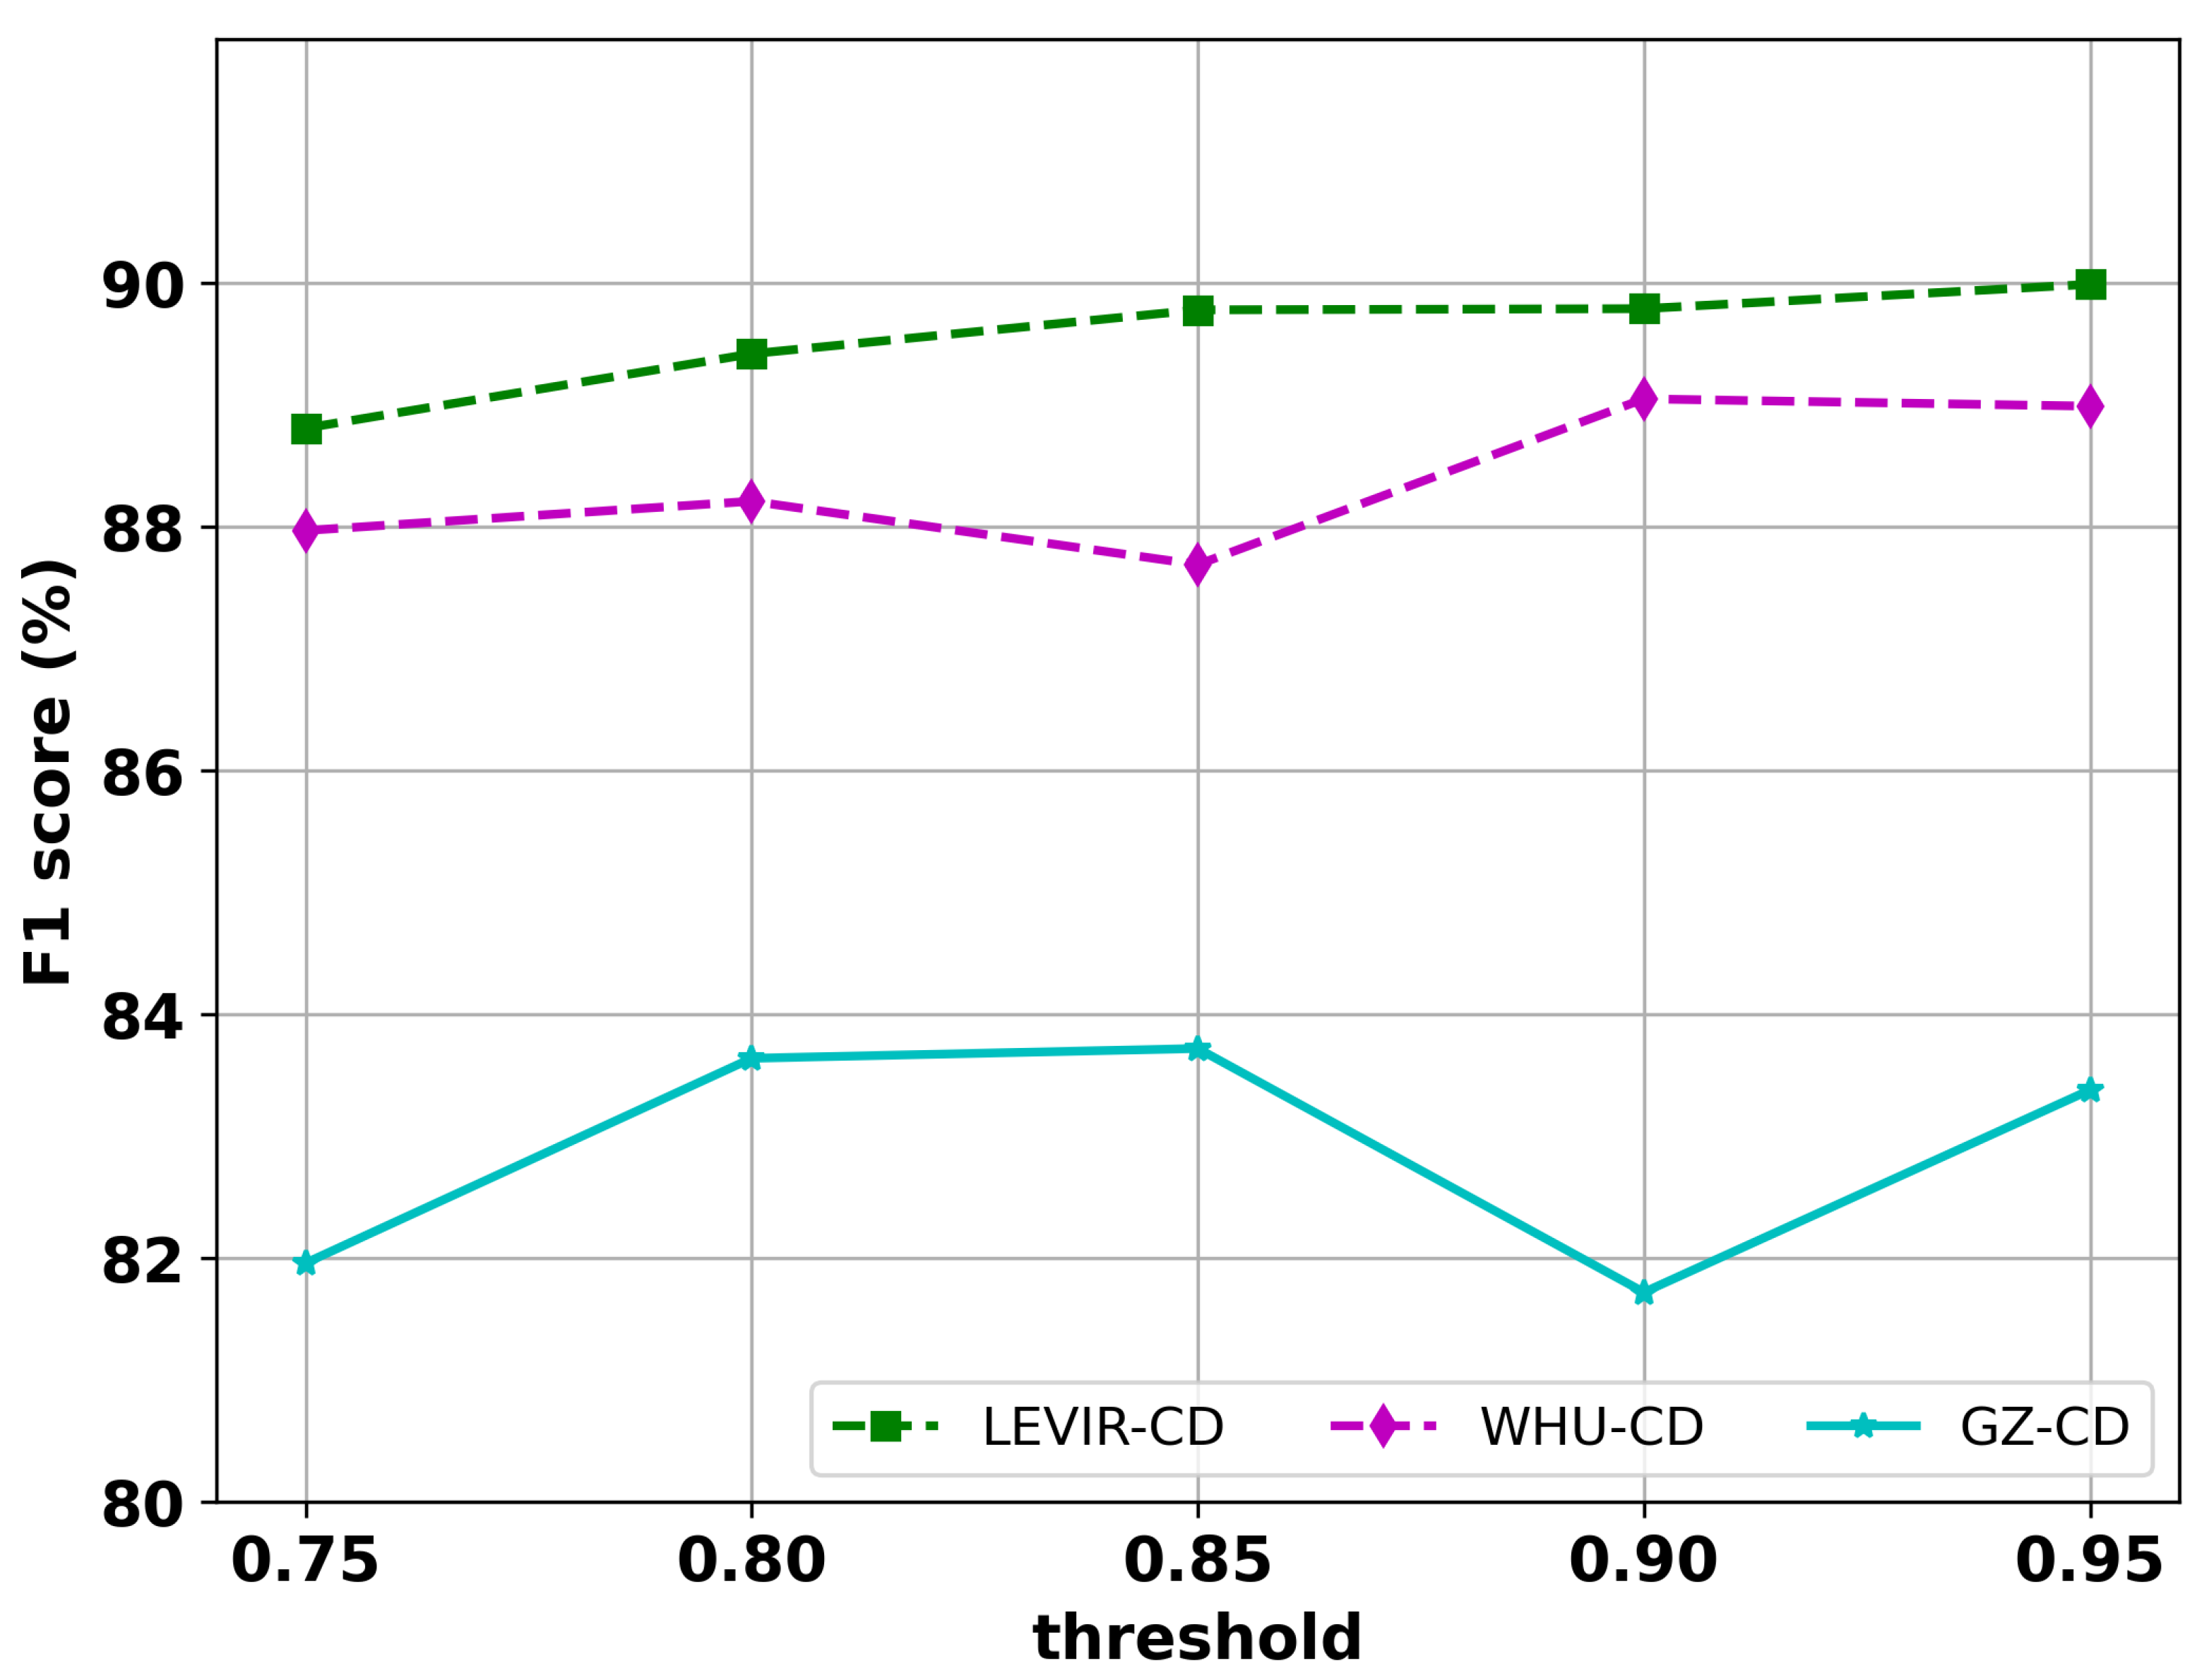
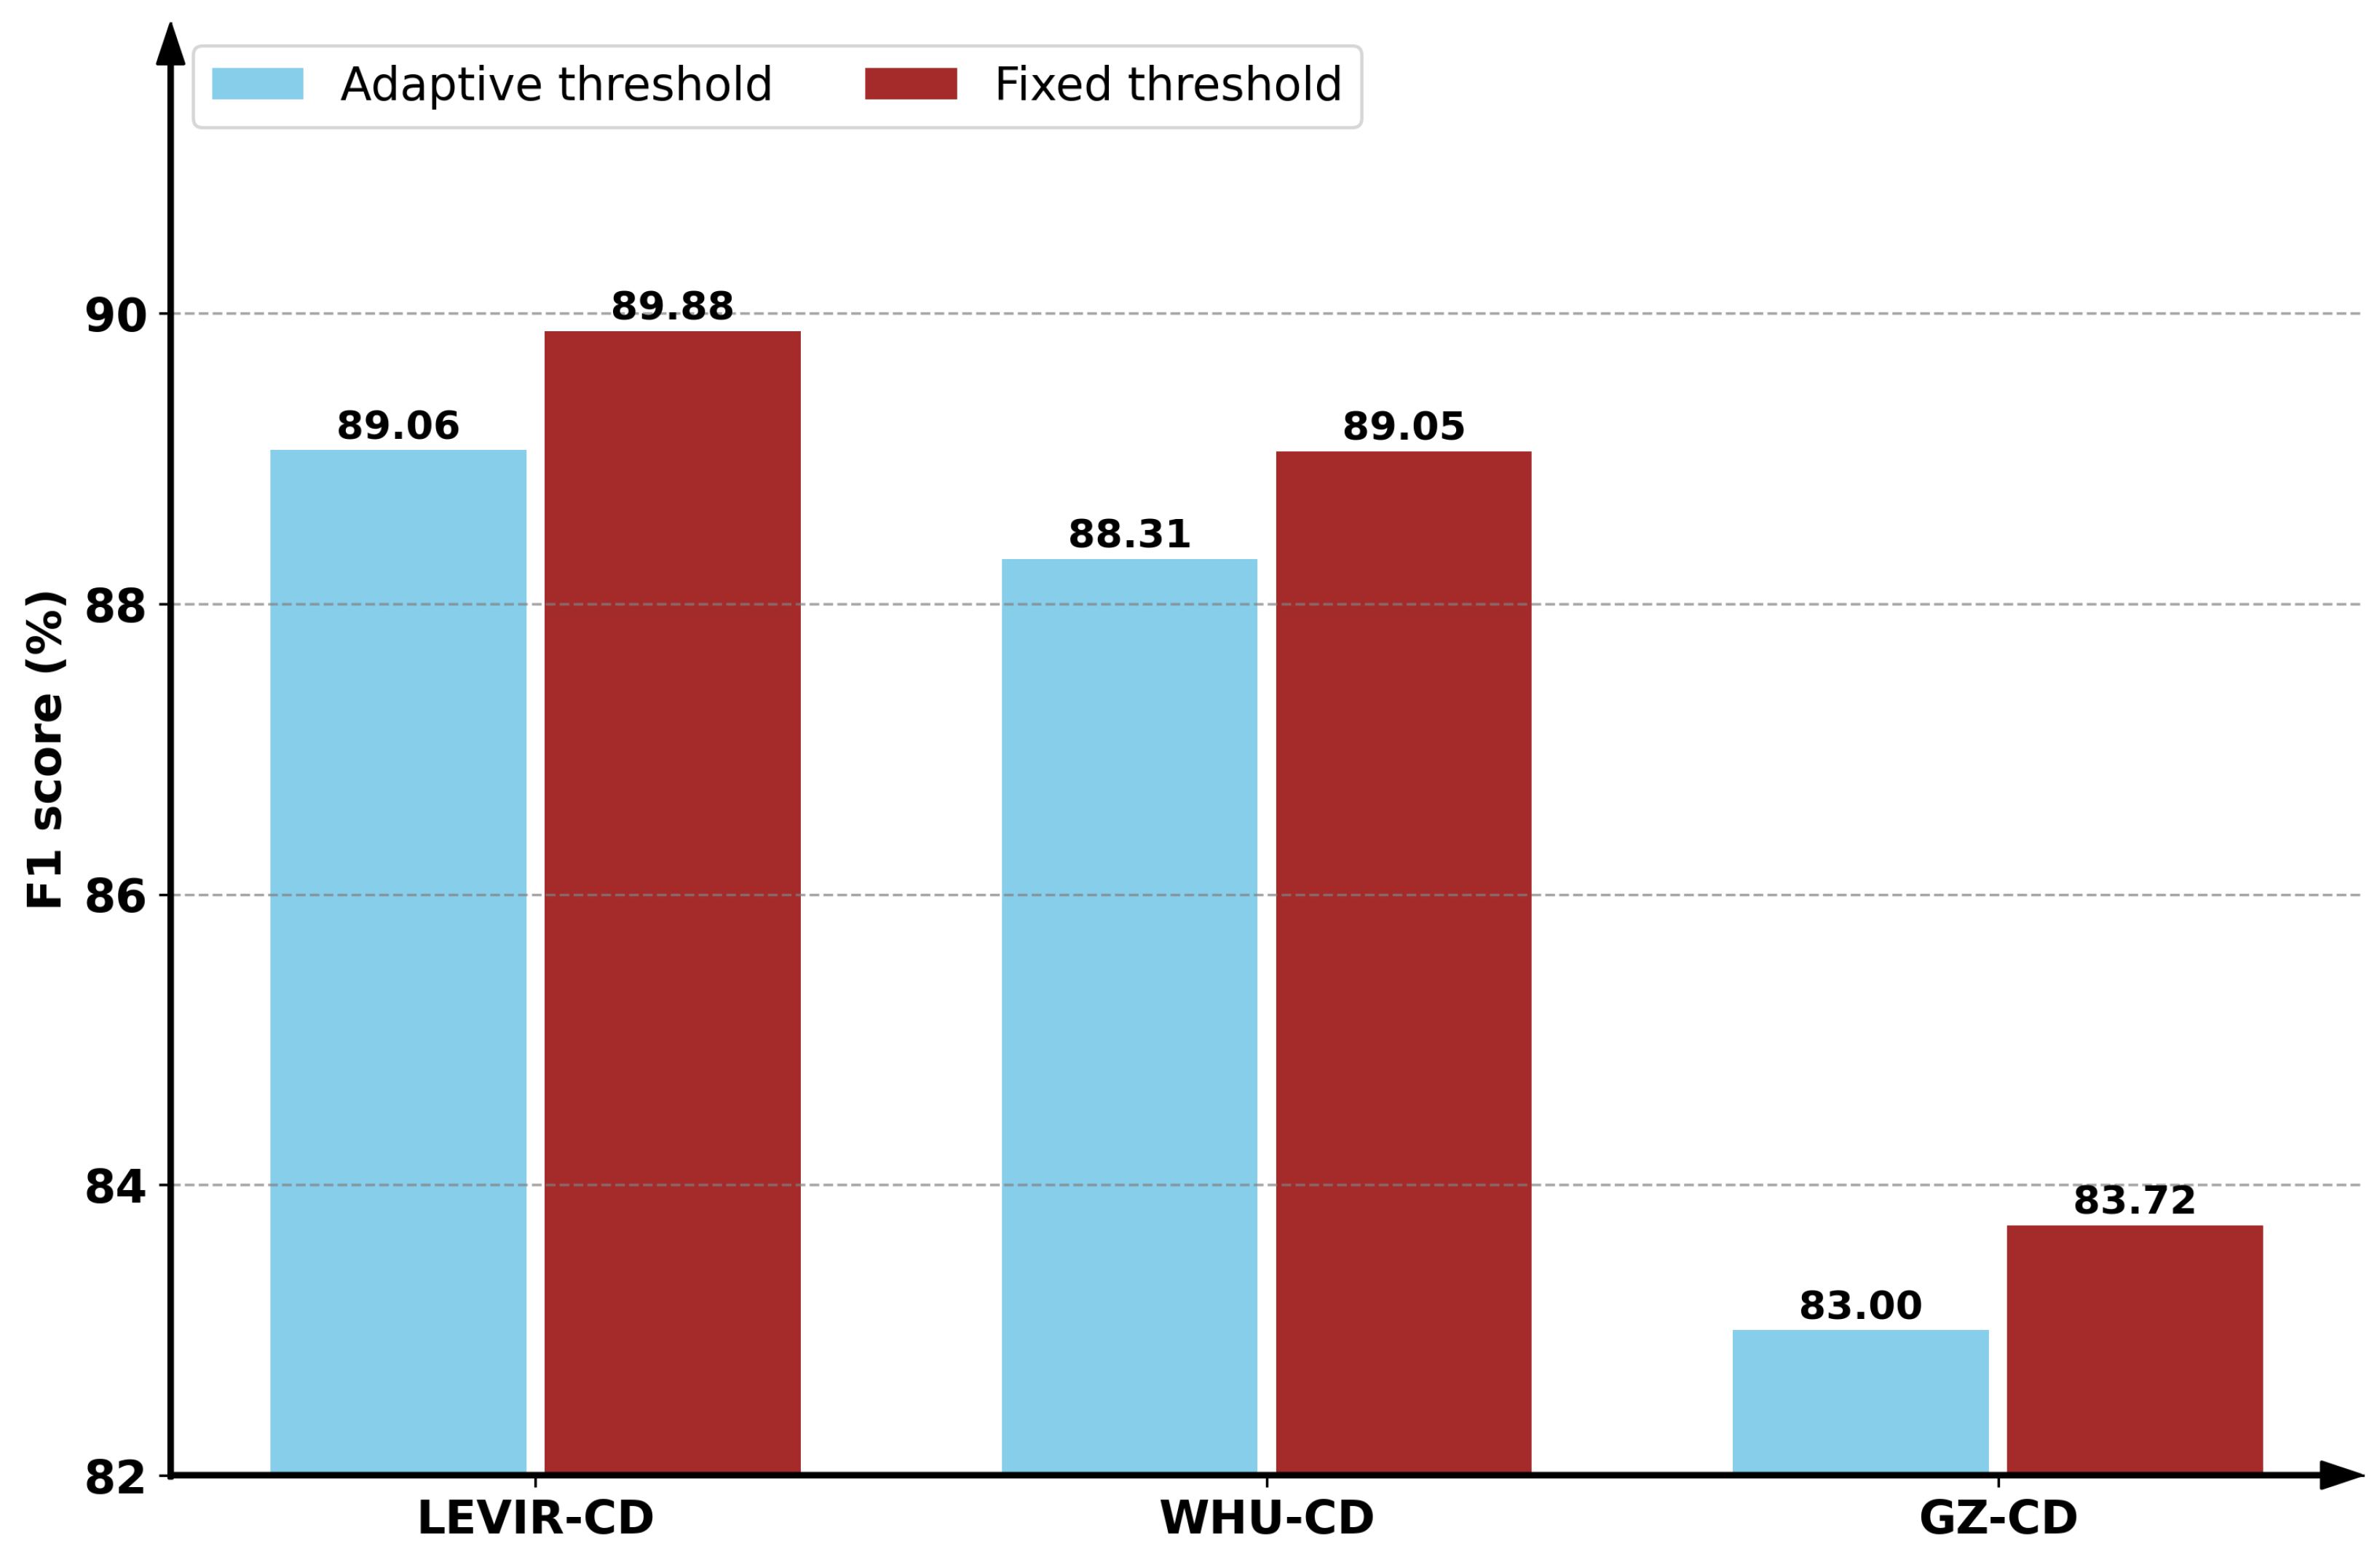
4.5.2. Fixed Threshold Versus Adaptive Threshold

In dealing with weak–strong consistency learning, a pseudo label is adopted to construct the unsupervised loss for the unlabeled data. To filter out uncertain regions, a fixed threshold τ is employed. One might argue a fixed threshold is too strict, while an adaptive threshold is more beneficial to take both the changed and unchanged categories into consideration. To this end, a class-aware threshold is calculated, as suggested in [60]. Figure 11 presents the effect of a fixed threshold and adaptive threshold on CD performance for the three CD datasets. We can conclude that, compared with an adaptive threshold, a fixed threshold observes an F1-score increase of 0.82%, 0.74% and 0.72% for the LEVIR-CD dataset, WHU-CD dataset and GZ-CD dataset, respectively. This may be due to the complex distribution of changed and unchanged pixels, where an adaptive threshold struggles to filter out noisy regions while maintaining high-confidence areas. On the contrary, a fixed threshold is more stable and efficient in dealing with the noisy regions, leading to improved SSCD performance.

4.5.3. Performance on Cross-Domain Scenarios

In SSCD scenarios, it is often assumed that the labeled data and unlabeled come from the same domain. However, due to the difference in imaging conditions and dates, this assumption does not always hold. As a result, the reliability and robustness of SSCD methods on cross-domain scenarios remain to be investigated. To this end, we conduct two cross-domain SSCD tests using LEVIR-CD and WHU-CD datasets, where the unlabeled data come from the other dataset during the training stage. We denote these two scenarios as {LEVIR-CD(Sup), WHU-CD(Unsup)} → LEVIR-CD and {WHU-CD(Sup), LEVIR-CD(Unsup)} → WHU-CD, respectively. The quantitative results of these experiments are listed in Table 4 and Table 5. It is evident that the methods of S4GAN, SemiCD, UniMatch and ECPS observe unstable performance in the two scenarios. For example, S4GAN and UniMatch obtain inferior performance against the Only-Sup baseline in the scenario of {LEVIR-CD(Sup), WHU-CD(Unsup)} → LEVIR-CD but superior performance in the scenario of {WHU-CD(Sup), LEVIR-CD(Unsup)} → WHU-CD; SemiCD and ECPS obtain superior performance against the Only-Sup baseline in the scenario of {LEVIR-CD(Sup), WHU-CD(Unsup)} → LEVIR-CD but inferior performance in the scenario of {WHU-CD(Sup), LEVIR-CD(Unsup)} → WHU-CD. This demonstrates the poor domain adaptation capacity of the four SSCD methods. On the contrary, C2F-SemiCD and WACS-SemiCD observe stable performance gains against the Only-Sup baseline in two different scenarios. However, the increase is much smaller compared to using unlabeled data from the identical domain. Surprisingly, the performance gap with our proposed WACS-SemiCD is much smaller than that of C2F-SemiCD. For example, our proposed WACS-SemiCD obtains inferior performance against C2F-SemiCD in the scenario within the same dataset of {LEVIR-CD(Sup), LEVIR-CD(Unsup)} → LEVIR-CD under the labeled setting of {5%, 10%, 20%, 40%} (as depicted in Table 1), but it obtains outstanding performance in the cross-domain scenario of {LEVIR-CD(Sup), WHU-CD(Unsup)} → LEVIR-CD under the labeled setting of {5%, 10%, 20%}. This may be attributed to the introduction of the Adaptive CutMix strategy, which facilitates alleviating the domain discrepancy between labeled and unlabeled datasets, leading to improved generalization performance. Overall, our proposed WACS-SemiCD achieves the best cross-domain SSCD performance against all the comparative methods, which is crucial for the practical deployment of SSCD algorithms.

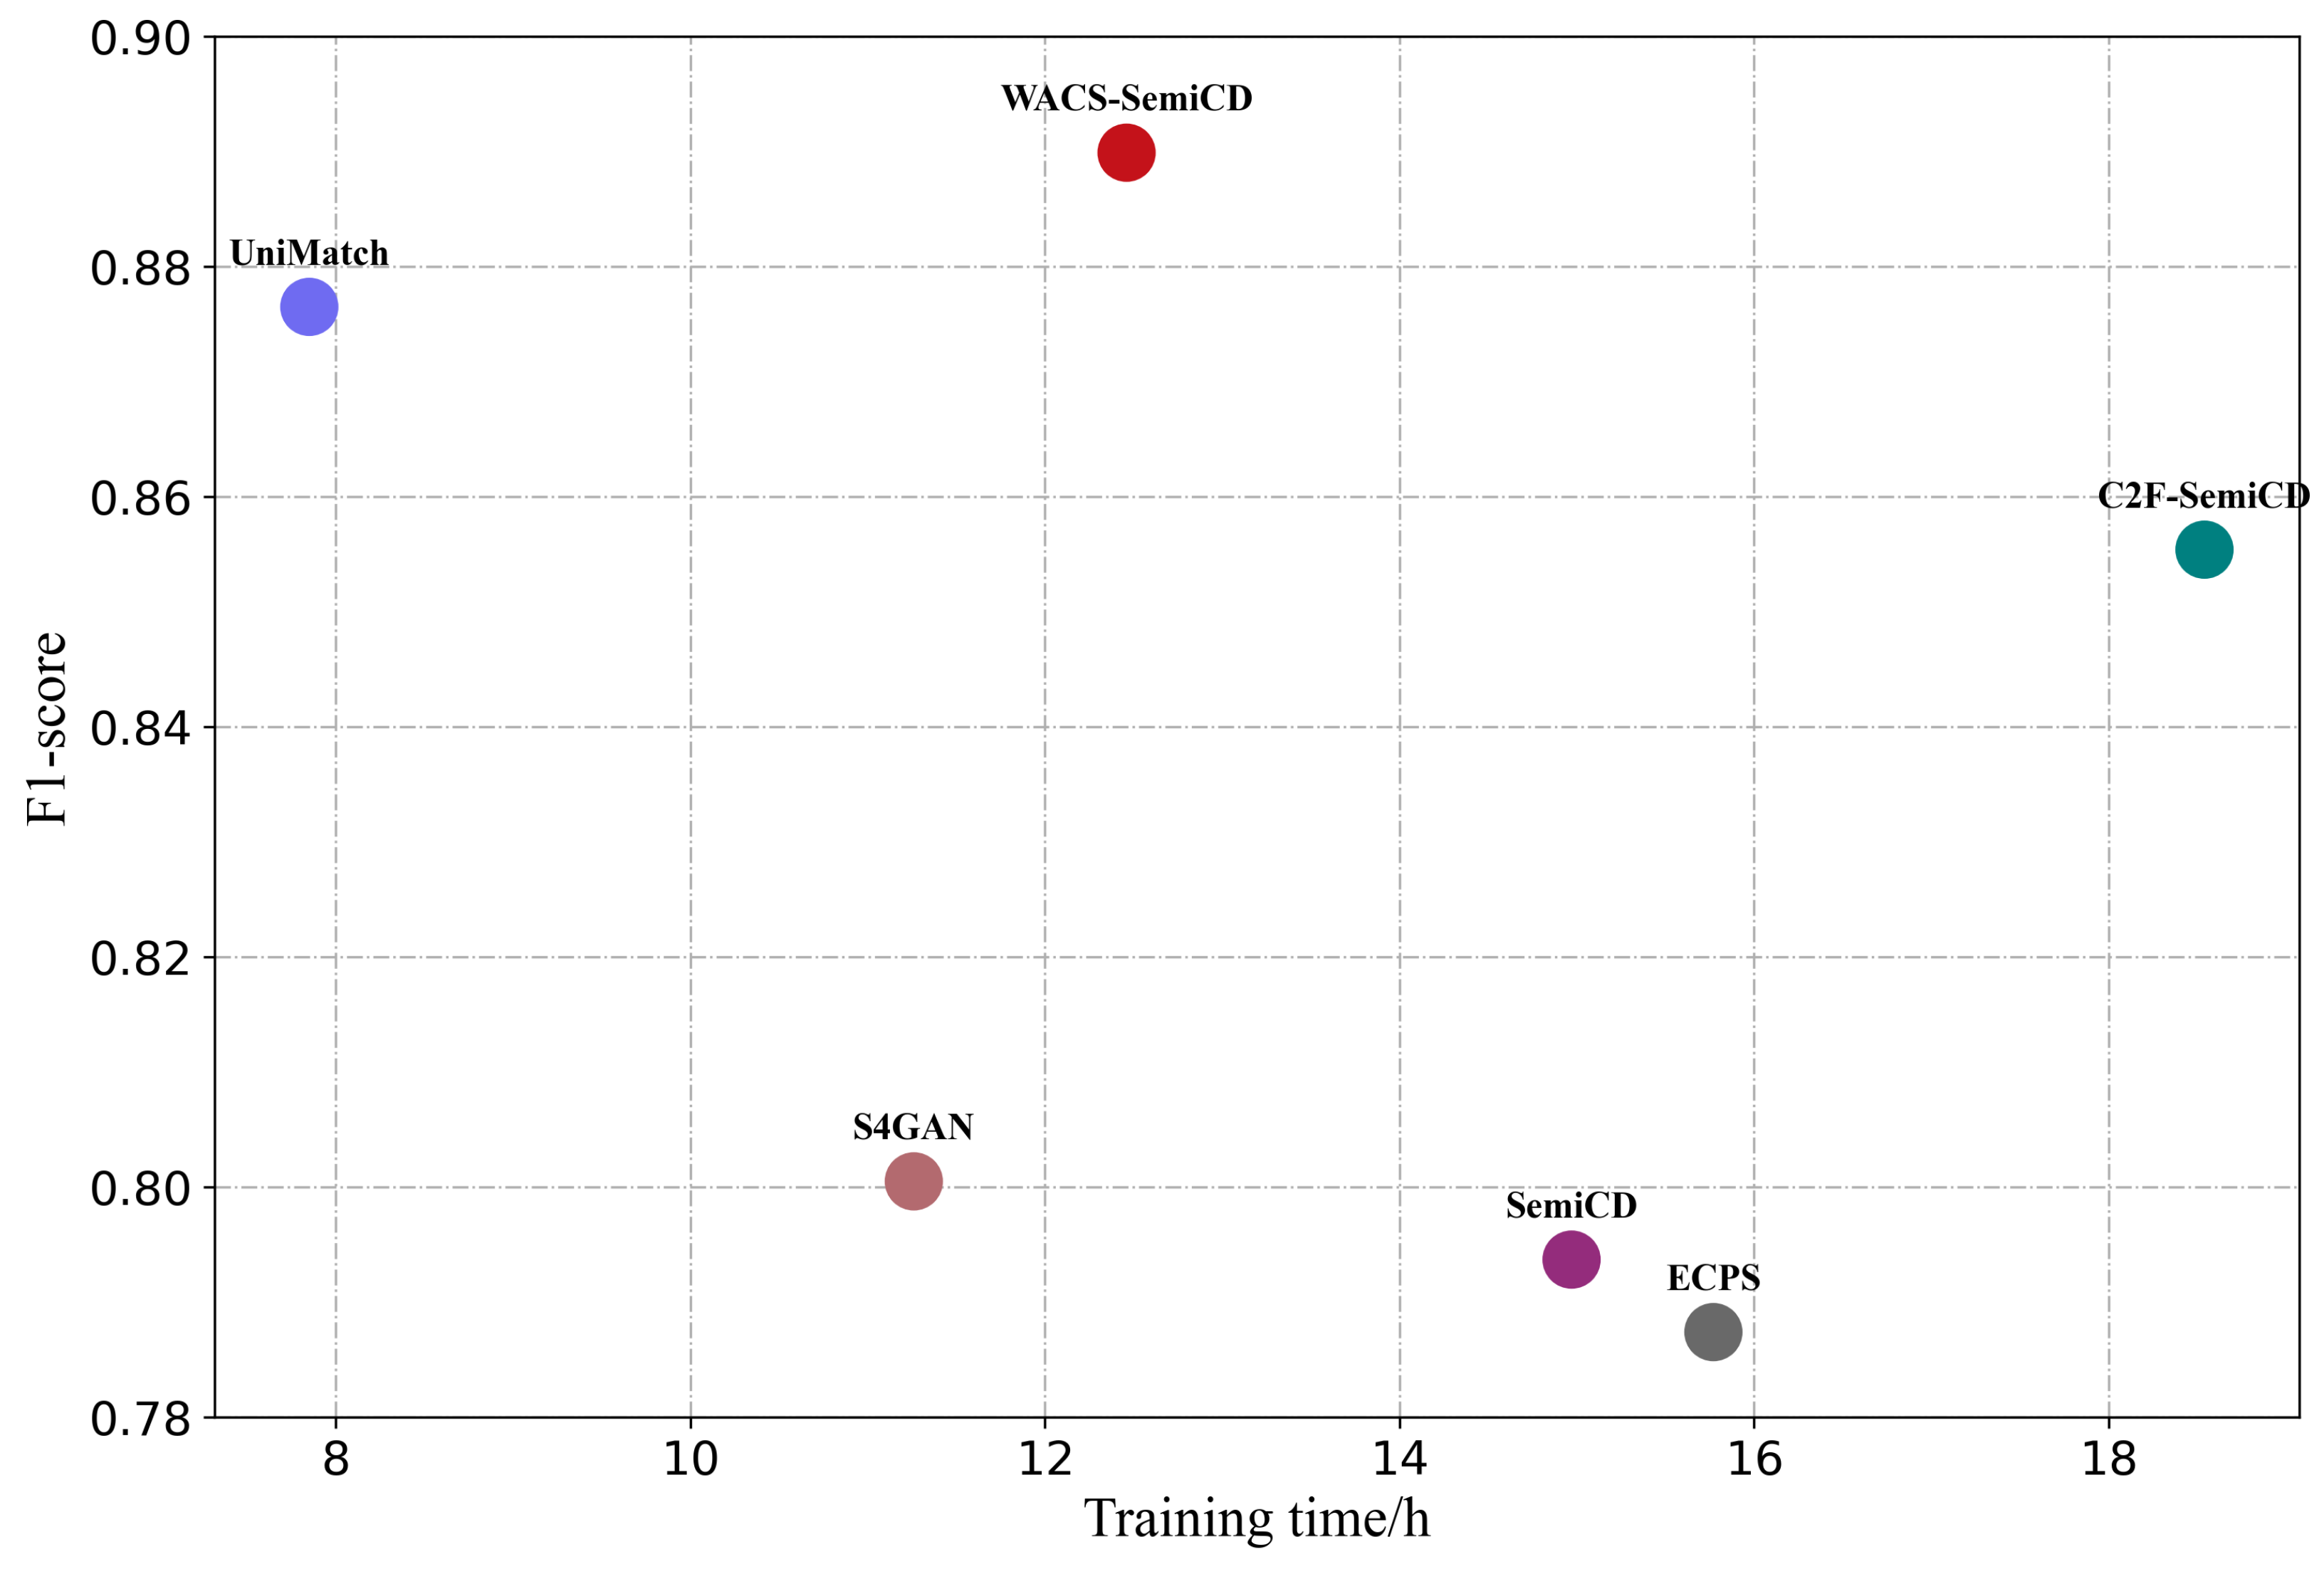
4.5.4. Training Efficiency Comparison

For the benefit of comprehensive comparison and analysis, the training times of different SSCD methods are calculated. Figure 12 presents the visual comparison of training time and F1-score of various approaches on the WHU-CD dataset using 5% labeled data. We can conclude that, due to the simple network design, UniMatch observes the least training time with high quantitative performance. In contrast, due to the inclusion of a two-step training approach, the training time in S4GAN and SemiCD increases rapidly. Meanwhile, reduced quantitative performance is observed due to the unstable effect of adversarial training and the difficulty to determine proper augmentation strategies. Note that the ECPS method, which employs more than three student–teacher networks for crosswise pseudo supervision, observes obvious gains in training time but the worst quantitative performance. In particular, due to the introduction of extensive extra components, including multi-scale feature fusion, channel and spatial attention, feature refinement and aggregation, C2F-SemiCD observes the highest training time. In contrast, our proposed WACS-SemiCD only employs a simple mean-teacher network with Weak–strong Augmentations and Class-balanced Sampling, which can be trained end-to-end with only a slight gain in computational overhead. As a result, it observes the best quantitative performance with moderate increase in training time, striking the best balance between accuracy and efficiency among all the comparative SSCD methods.

5. Conclusions

To exploit unlabeled information, existing SSCD methods often come with additional procedures or complex network architectures, which inevitably lead to large computational cost and poor training stability. To overcome this limitation, we propose a simple yet effective SSCD method termed WACS-SemiCD. Based on the smooth assumption of SSL, image-level weak–strong perturbation consistency, feature-level perturbation consistency and transformation consistency are employed to enhance the generalization capacity of the CD network. Particularly, an Adaptive CutMix strategy is introduced to facilitate the transition of insights from the labeled data to the unlabeled, and the domain gap between them can also be suppressed. In addition, the CBS strategy is further included to mitigate the class imbalance issue of CD. Extensive experiments are conducted on three publicly available CD datasets; the outcomes of the experiments highlight the superiority of our WACS-SemiCD, which is capable of achieving competitive performance across all evaluation protocols. The efficiency analysis also demonstrates that WACS-SemiCD strikes a better balance between efficiency and accuracy against other comparative methods. However, only image information is utilized in our proposed WACS-SemiCD method, which struggles to generate high-quality pseudo labels without the guidance of semantic priors. It is worthy noting that self-supervised learning is capable of learning discriminative features from unlabeled data, leading to improved model performance with small labeled data. In addition, large vision–language foundation models are becoming increasingly popular in dealing with vision tasks due to their powerful semantic information modeling and zero-shot generalization capacity. In the future, we will exploit the potential of self-supervised learning and large vision–language foundation models to further improve the accuracy and reliability of SSCD.

Author Contributions

Conceptualization and methodology, D.P.; software, D.P.; validation, M.L. and D.P.; formal analysis, H.G.; investigation, D.P.; resources, D.P.; writing—original draft preparation, D.P.; writing—review and editing, D.P. and H.G.; supervision, D.P.; project administration, D.P.; funding acquisition, D.P. All authors have read and agreed to the published version of the manuscript.

Funding

This work was funded in part by the National Natural Science Foundation of China (Grant Numbers 42371449 and 41801386) and in part by the Technology Innovation Center for Integrated Applications in Remote Sensing and Navigation, Ministry of Natural Resources of the P.R. China (Grant Number TICIARSN-2023-07).

Data Availability Statement

The LEVIR-CD dataset is available at https://chenhao.in/LEVIR/, the WHU-CD dataset is available at https://study.rsgis.whu.edu.cn/pages/download/building_dataset.html, and the GZ-CD dataset is available at https://pan.baidu.com/share/init?surl=2Ln-nCb15YNu1T28pzC0rA (accessed on 5 February 2025).

Acknowledgments

The authors sincerely appreciate the helpful comments and constructive suggestions given by the academic editors and reviewers.

Conflicts of Interest

The authors declare no conflicts of interest.

Abbreviations

The following abbreviations are used in this manuscript:
CDchange detection
SSCDsemi-supervised change detection
RSremote sensing
WACSWeak–strong Augmentation and Class-balanced Sampling
CBSclass-balanced sampling
RSCDremote sensing change detection
DLCDdeep learning-based change detection
SOTAstate-of-the-art
FSCDfully supervised CD
CNNconvolution neural network
FCNfully convolutional network
SSLsemi-supervised learning
S 3 V M semi-supervised support vector machine
GPGaussian process
GANGenerative Adversarial Networks
ECPSensemble cross pseudo supervision (ECPS)
IAugInstance-level change Augmentation
UIPCMunpaired image prototype contrast module
ASPPatrous spatial pyramid pooling
AdaCutAdaptive CutMix
EMAexponential moving averaging
S4GANsemi-supervised semantic segmentation GAN
C2F-SemiCDcoarse-to-fine semi-supervised change detection
WSCweak–strong consistency
RCrotation consistency

References

  1. Zheng, Z.; Zhong, Y.; Wang, J.; Ma, A.; Zhang, L. Building damage assessment for rapid disaster response with a deep object-based semantic change detection framework: From natural disasters to man-made disasters. Remote Sens. Environ. 2021, 265, 112636. [Google Scholar] [CrossRef]
  2. Li, H.; Zhu, F.; Zheng, X.; Liu, M.; Chen, G. MSCDUNet: A deep learning framework for built-up area change detection integrating multispectral, SAR, and VHR data. IEEE J. Sel. Top. Appl. Earth Obs. Remote Sens. 2022, 15, 5163–5176. [Google Scholar] [CrossRef]
  3. Wen, D.; Huang, X.; Bovolo, F.; Li, J.; Ke, X.; Zhang, A.; Benediktsson, J.A. Change detection from very-high-spatial-resolution optical remote sensing images: Methods, applications, and future directions. IEEE Geosci. Remote Sens. Mag. 2021, 9, 68–101. [Google Scholar] [CrossRef]
  4. Wu, C.; Du, B.; Cui, X.; Zhang, L. A post-classification change detection method based on iterative slow feature analysis and Bayesian soft fusion. Remote Sens. Environ. 2017, 199, 241–255. [Google Scholar] [CrossRef]
  5. Zhang, Y.; Peng, D.; Huang, X. Object-based change detection for VHR images based on multiscale uncertainty analysis. IEEE Geosci. Remote Sens. Lett. 2017, 15, 13–17. [Google Scholar] [CrossRef]
  6. Daudt, R.C.; Le Saux, B.; Boulch, A. Fully convolutional siamese networks for change detection. In Proceedings of the 2018 25th IEEE International Conference on Image Processing (ICIP), Athens, Greece, 7–10 October 2018; IEEE: Piscataway, NJ, USA, 2018; pp. 4063–4067. [Google Scholar]
  7. Peng, D.; Zhang, Y.; Guan, H. End-to-end change detection for high resolution satellite images using improved UNet++. Remote Sens. 2019, 11, 1382. [Google Scholar] [CrossRef]
  8. Fang, S.; Li, K.; Shao, J.; Li, Z. SNUNet-CD: A densely connected Siamese network for change detection of VHR images. IEEE Geosci. Remote Sens. Lett. 2021, 19, 8007805. [Google Scholar] [CrossRef]
  9. Hou, X.; Bai, Y.; Li, Y.; Shang, C.; Shen, Q. High-resolution triplet network with dynamic multiscale feature for change detection on satellite images. ISPRS J. Photogramm. Remote Sens. 2021, 177, 103–115. [Google Scholar] [CrossRef]
  10. Song, K.; Jiang, J. AGCDetNet: An attention-guided network for building change detection in high-resolution remote sensing images. IEEE J. Sel. Top. Appl. Earth Obs. Remote Sens. 2021, 14, 4816–4831. [Google Scholar] [CrossRef]
  11. Zhang, J.; Pan, B.; Zhang, Y.; Liu, Z.; Zheng, X. Building change detection in remote sensing images based on dual multi-scale attention. Remote Sens. 2022, 14, 5405. [Google Scholar] [CrossRef]
  12. Li, Z.; Tang, C.; Liu, X.; Zhang, W.; Dou, J.; Wang, L.; Zomaya, A.Y. Lightweight remote sensing change detection with progressive feature aggregation and supervised attention. IEEE Trans. Geosci. Remote Sens. 2023, 61, 5602812. [Google Scholar] [CrossRef]
  13. Gong, M.; Jiang, F.; Qin, A.K.; Liu, T.; Zhan, T.; Lu, D.; Zheng, H.; Zhang, M. A spectral and spatial attention network for change detection in hyperspectral images. IEEE Trans. Geosci. Remote Sens. 2021, 60, 5521614. [Google Scholar] [CrossRef]
  14. Guo, Q.; Zhang, J.; Zhu, S.; Zhong, C.; Zhang, Y. Deep multiscale Siamese network with parallel convolutional structure and self-attention for change detection. IEEE Trans. Geosci. Remote Sens. 2021, 60, 5406512. [Google Scholar] [CrossRef]
  15. Lei, T.; Geng, X.; Ning, H.; Lv, Z.; Gong, M.; Jin, Y.; Nandi, A.K. Ultralightweight spatial–spectral feature cooperation network for change detection in remote sensing images. IEEE Trans. Geosci. Remote Sens. 2023, 61, 4402114. [Google Scholar] [CrossRef]
  16. Chen, H.; Shi, Z. A spatial-temporal attention-based method and a new dataset for remote sensing image change detection. Remote Sens. 2020, 12, 1662. [Google Scholar] [CrossRef]
  17. Bandara, W.G.C.; Patel, V.M. A transformer-based siamese network for change detection. In Proceedings of the IGARSS 2022—2022 IEEE International Geoscience and Remote Sensing Symposium, Kuala Lumpur, Malaysia, 17–22 July 2022; IEEE: Piscataway, NJ, USA, 2022; pp. 207–210. [Google Scholar]
  18. Yan, T.; Wan, Z.; Zhang, P. Fully transformer network for change detection of remote sensing images. In Proceedings of the Asian Conference on Computer Vision, Macao, China, 4–8 December 2022; pp. 1691–1708. [Google Scholar]
  19. Zhang, C.; Wang, L.; Cheng, S.; Li, Y. SwinSUNet: Pure transformer network for remote sensing image change detection. IEEE Trans. Geosci. Remote Sens. 2022, 60, 5224713. [Google Scholar] [CrossRef]
  20. Chen, H.; Qi, Z.; Shi, Z. Remote sensing image change detection with transformers. IEEE Trans. Geosci. Remote Sens. 2021, 60, 5607514. [Google Scholar] [CrossRef]
  21. Li, W.; Xue, L.; Wang, X.; Li, G. ConvTransNet: A CNN–transformer network for change detection with multiscale global–local representations. IEEE Trans. Geosci. Remote Sens. 2023, 61, 5610315. [Google Scholar] [CrossRef]
  22. Zhang, X.; Cheng, S.; Wang, L.; Li, H. Asymmetric cross-attention hierarchical network based on CNN and transformer for bitemporal remote sensing images change detection. IEEE Trans. Geosci. Remote Sens. 2023, 61, 2000415. [Google Scholar] [CrossRef]
  23. Chen, H.; Song, J.; Han, C.; Xia, J.; Yokoya, N. Changemamba: Remote sensing change detection with spatio-temporal state space model. arXiv 2024, arXiv:2404.03425. [Google Scholar]
  24. Zhang, H.; Chen, K.; Liu, C.; Chen, H.; Zou, Z.; Shi, Z. CDMamba: Remote Sensing Image Change Detection with Mamba. arXiv 2024, arXiv:2406.04207. [Google Scholar]
  25. Paranjape, J.N.; de Melo, C.; Patel, V.M. A Mamba-based Siamese Network for Remote Sensing Change Detection. arXiv 2024, arXiv:2407.06839. [Google Scholar]
  26. Bovolo, F.; Bruzzone, L.; Marconcini, M. A novel approach to unsupervised change detection based on a semisupervised SVM and a similarity measure. IEEE Trans. Geosci. Remote Sens. 2008, 46, 2070–2082. [Google Scholar] [CrossRef]
  27. Chen, K.; Zhou, Z.; Huo, C.; Sun, X.; Fu, K. A semisupervised context-sensitive change detection technique via gaussian process. IEEE Geosci. Remote Sens. Lett. 2012, 10, 236–240. [Google Scholar] [CrossRef]
  28. Zhang, W.; Lu, X.; Li, X. A coarse-to-fine semi-supervised change detection for multispectral images. IEEE Trans. Geosci. Remote Sens. 2018, 56, 3587–3599. [Google Scholar] [CrossRef]
  29. Gong, M.; Yang, Y.; Zhan, T.; Niu, X.; Li, S. A generative discriminatory classified network for change detection in multispectral imagery. IEEE J. Sel. Top. Appl. Earth Obs. Remote Sens. 2019, 12, 321–333. [Google Scholar] [CrossRef]
  30. Peng, D.; Bruzzone, L.; Zhang, Y.; Guan, H.; Ding, H.; Huang, X. SemiCDNet: A semisupervised convolutional neural network for change detection in high resolution remote-sensing images. IEEE Trans. Geosci. Remote Sens. 2020, 59, 5891–5906. [Google Scholar] [CrossRef]
  31. Bandara, W.G.C.; Patel, V.M. Revisiting consistency regularization for semi-supervised change detection in remote sensing images. arXiv 2022, arXiv:2204.08454. [Google Scholar]
  32. Han, C.; Wu, C.; Hu, M.; Li, J.; Chen, H. C2F-SemiCD: A coarse-to-fine semi-supervised change detection method based on consistency regularization in high-resolution remote-sensing images. IEEE Trans. Geosci. Remote Sens. 2024, 62, 4702621. [Google Scholar] [CrossRef]
  33. Wang, L.; Zhang, M.; Shi, W. STCRNet: A Semi-Supervised Network Based on Self-Training and Consistency Regularization for Change Detection in VHR Remote Sensing Images. IEEE J. Sel. Top. Appl. Earth Obs. Remote Sens. 2024, 17, 2272–2282. [Google Scholar] [CrossRef]
  34. Sun, C.; Wu, J.; Chen, H.; Du, C. SemiSANet: A semi-supervised high-resolution remote sensing image change detection model using Siamese networks with graph attention. Remote Sens. 2022, 14, 2801. [Google Scholar] [CrossRef]
  35. Wang, J.X.; Li, T.; Chen, S.B.; Tang, J.; Luo, B.; Wilson, R.C. Reliable contrastive learning for semi-supervised change detection in remote sensing images. IEEE Trans. Geosci. Remote Sens. 2022, 60, 4416413. [Google Scholar] [CrossRef]
  36. Yuan, S.; Zhong, R.; Yang, C.; Li, Q.; Dong, Y. Dynamically updated semi-supervised change detection network combining cross-supervision and screening algorithms. IEEE Trans. Geosci. Remote Sens. 2024, 62, 1–14. [Google Scholar] [CrossRef]
  37. Chen, H.; Li, W.; Shi, Z. Adversarial instance augmentation for building change detection in remote sensing images. IEEE Trans. Geosci. Remote Sens. 2021, 60, 5603216. [Google Scholar] [CrossRef]
  38. Sun, C.; Chen, H.; Du, C.; Jing, N. SemiBuildingChange: A Semi-Supervised High-Resolution Remote Sensing Image Building Change Detection Method with a Pseudo Bi-Temporal Data Generator. IEEE Trans. Geosci. Remote Sens. 2023, 61, 5622319. [Google Scholar] [CrossRef]
  39. Zou, C.; Wang, Z. A New Semi-Supervised Method for Detecting Semantic Changes in Remote Sensing Images. IEEE Geosci. Remote Sens. Lett. 2023, 20, 5509105. [Google Scholar] [CrossRef]
  40. Yang, Y.; Tang, X.; Ma, J.; Zhang, X.; Pei, S.; Jiao, L. ECPS: Cross Pseudo Supervision Based on Ensemble Learning for Semi-Supervised Remote Sensing Change Detection. IEEE Trans. Geosci. Remote Sens. 2024, 62, 5612317. [Google Scholar] [CrossRef]
  41. Zhang, X.; Huang, X.; Li, J. Joint self-training and rebalanced consistency learning for semi-supervised change detection. IEEE Trans. Geosci. Remote Sens. 2023, 61, 5406613. [Google Scholar] [CrossRef]
  42. Ding, Q.; Shao, Z.; Huang, X.; Feng, X.; Altan, O.; Hu, B. Consistency-guided lightweight network for semi-supervised binary change detection of buildings in remote sensing images. GISci. Remote Sens. 2023, 60, 2257980. [Google Scholar] [CrossRef]
  43. Oubara, A.; Wu, F.; Maleki, R.; Ma, B.; Amamra, A.; Yang, G. Enhancing Adversarial Learning-Based Change Detection in Imbalanced Datasets Using Artificial Image Generation and Attention Mechanism. ISPRS Int. J. Geo-Inform. 2024, 13, 125. [Google Scholar] [CrossRef]
  44. Quan, Y.; Yu, A.; Guo, W.; Lu, X.; Jiang, B.; Zheng, S.; He, P. Unified building change detection pre-training method with masked semantic annotations. Int. J. Appl. Earth Obs. Geoinf. 2023, 120, 103346. [Google Scholar] [CrossRef]
  45. Zhang, M.; Li, Q.; Yuan, Y.; Wang, Q. Boosting Binary Object Change Detection via Unpaired Image Prototypes Contrast. IEEE Trans. Geosci. Remote Sens. 2024, 62, 5627409. [Google Scholar] [CrossRef]
  46. Zhu, Q.; Guo, X.; Deng, W.; Shi, S.; Guan, Q.; Zhong, Y.; Zhang, L.; Li, D. Land-use/land-cover change detection based on a Siamese global learning framework for high spatial resolution remote sensing imagery. ISPRS J. Photogramm. Remote Sens. 2022, 184, 63–78. [Google Scholar] [CrossRef]
  47. Han, C.; Wu, C.; Guo, H.; Hu, M.; Chen, H. HANet: A hierarchical attention network for change detection with bitemporal very-high-resolution remote sensing images. IEEE J. Sel. Top. Appl. Earth Obs. Remote Sens. 2023, 16, 3867–3878. [Google Scholar] [CrossRef]
  48. Xing, Y.; Jiang, J.; Xiang, J.; Yan, E.; Song, Y.; Mo, D. Lightcdnet: Lightweight change detection network based on vhr images. IEEE Geosci. Remote Sens. Lett. 2023, 20, 2504105. [Google Scholar] [CrossRef]
  49. Tao, C.; Kuang, D.; Huang, Z.; Peng, C.; Li, H. HSONet: A Siamese foreground association-driven hard case sample optimization network for high-resolution remote sensing image change detection. arXiv 2024, arXiv:2402.16242. [Google Scholar]
  50. Yang, Q.; Zhang, S.; Li, J.; Sun, Y.; Han, Q.; Sun, Y. Hyperboloid-Embedded Siamese Network for Change Detection in Remote Sensing Images. IEEE J. Sel. Top. Appl. Earth Obs. Remote Sens. 2024, 17, 9240–9252. [Google Scholar] [CrossRef]
  51. Li, X.; He, M.; Li, H.; Shen, H. A combined loss-based multiscale fully convolutional network for high-resolution remote sensing image change detection. IEEE Geosci. Remote Sens. Lett. 2021, 19, 8017505. [Google Scholar] [CrossRef]
  52. Liu, Y.; Pang, C.; Zhan, Z.; Zhang, X.; Yang, X. Building change detection for remote sensing images using a dual-task constrained deep siamese convolutional network model. IEEE Geosci. Remote Sens. Lett. 2020, 18, 811–815. [Google Scholar] [CrossRef]
  53. Peng, D.; Bruzzone, L.; Zhang, Y.; Guan, H.; He, P. SCDNET: A novel convolutional network for semantic change detection in high resolution optical remote sensing imagery. Int. J. Appl. Earth Obs. Geoinf. 2021, 103, 102465. [Google Scholar] [CrossRef]
  54. Liu, Y.; Liu, F.; Liu, J.; Tang, X.; Xiao, L. Adaptive spatial and difference learning for change detection. IEEE J. Sel. Top. Appl. Earth Obs. Remote Sens. 2023, 16, 7447–7461. [Google Scholar] [CrossRef]
  55. Zhou, Y.; Wang, F.; Zhao, J.; Yao, R.; Chen, S.; Ma, H. Spatial-temporal based multihead self-attention for remote sensing image change detection. IEEE Trans. Circuits Syst. Video Technol. 2022, 32, 6615–6626. [Google Scholar] [CrossRef]
  56. Zhang, R.; Zhang, H.; Ning, X.; Huang, X.; Wang, J.; Cui, W. Global-aware siamese network for change detection on remote sensing images. ISPRS J. Photogramm. Remote Sens. 2023, 199, 61–72. [Google Scholar] [CrossRef]
  57. Yang, L.; Qi, L.; Feng, L.; Zhang, W.; Shi, Y. Revisiting weak-to-strong consistency in semi-supervised semantic segmentation. In Proceedings of the IEEE/CVF Conference on Computer Vision and Pattern Recognition, Vancouver, BC, Canada, 17–24 June 2023; pp. 7236–7246. [Google Scholar]
  58. Ji, S.; Wei, S.; Lu, M. Fully convolutional networks for multisource building extraction from an open aerial and satellite imagery data set. IEEE Trans. Geosci. Remote Sens. 2018, 57, 574–586. [Google Scholar] [CrossRef]
  59. Mittal, S.; Tatarchenko, M.; Brox, T. Semi-supervised semantic segmentation with high-and low-level consistency. IEEE Trans. Pattern Anal. Mach. Intell. 2019, 43, 1369–1379. [Google Scholar] [CrossRef] [PubMed]
  60. Sun, B.; Yang, Y.; Zhang, L.; Cheng, M.M.; Hou, Q. Corrmatch: Label propagation via correlation matching for semi-supervised semantic segmentation. In Proceedings of the IEEE/CVF Conference on Computer Vision and Pattern Recognition, Seattle, WA, USA, 16–22 June 2024; pp. 3097–3107. [Google Scholar]
Figure 1. A comprehensive comparison of the supervised baseline and our proposed WACS-SemiCD.
Remotesensing 17 00576 g001
Figure 3. Illustration of transformation perturbation consistency.
Remotesensing 17 00576 g003
Figure 4. Illustrative images of three CD datasets.
Remotesensing 17 00576 g004
Figure 6. Visual performance of various semi-supervised CD approaches on LEVIR-CD dataset.
Remotesensing 17 00576 g006
Figure 7. Visual performance of various semi-supervised CD approaches on WHU-CD dataset.
Remotesensing 17 00576 g007
Figure 8. Visual performance of various semi-supervised CD approaches on GZ-CD dataset.
Remotesensing 17 00576 g008
Figure 9. Effect of different augmentation modules on CD performance with 5% labeled data.
Remotesensing 17 00576 g009
Figure 10. Comparison of normal CutMix and Adaptive CutMix on CD performance with 5% labeled data.
Remotesensing 17 00576 g010
Figure 11. Comparison of fixed threshold and adaptive threshold with 5% labeled data.
Remotesensing 17 00576 g011
Figure 12. Efficiency analysis of various SSCD approaches on WHU-CD dataset using 5% labeled data.
Remotesensing 17 00576 g012
Table 1. Quantitative results for various approaches with various labeled ratios on LEVIR-CD dataset.
MethodLabeled Ratio
5% 10% 20% 40%
F1IoUKappa F1IoUKappa F1IoUKappa F1IoUKappa
Only-Sup81.9769.4581.09 85.6774.9384.92 87.0277.0286.33 87.1477.2086.46
S4GAN [59]72.2456.5571.00 74.7359.6673.36 74.1358.8972.98 76.9662.5575.80
SemiCD [31]85.1874.1884.44 87.0577.0686.39 87.5477.8486.90 88.2678.9887.65
UniMatch [57]87.7978.2487.15 89.3980.8188.82 89.4780.9588.93 89.4980.9788.95
ECPS [40]84.4573.0983.66 87.8578.3387.20 88.1678.8387.54 89.1280.3788.55
C2F-SemiCD [32]89.9181.6789.39 90.7082.9890.07 91.2383.8890.77 91.3784.1190.92
WACS-SemiCD89.8881.6289.32 90.1882.1289.64 90.9783.4490.50 91.0183.5190.54
Fully Sup (100%)F1 = 91.32             IoU = 84.03             Kappa = 90.86
Table 2. Quantitative results for various approaches with various labeled ratios on WHU-CD dataset.
MethodLabeled Ratio
5% 10% 20% 40%
F1IoUKappa F1IoUKappa F1IoUKappa F1IoUKappa
Only-Sup76.8062.3475.93 80.3467.1479.56 86.4976.8786.38 87.3977.6186.89
S4GAN [59]80.0566.7379.32 83.5671.7682.91 86.8176.6986.29 88.4979.3588.13
SemiCD [31]79.3765.7978.52 80.9868.0380.17 85.4374.5684.82 87.6578.0287.13
UniMatch [57]87.6578.0287.06 88.2879.0187.80 89.1880.4788.74 90.5482.7290.15
ECPS [40]78.7467.9377.89 79.7966.3878.94 82.2070.7982.20 82.2970.0081.52
C2F-SemiCD [32]85.5474.7484.95 87.0577.0786.52 90.2582.2389.86 92.5586.1392.24
WACS-SemiCD89.0580.3088.63 89.6881.2889.25 91.4584.2591.10 93.8388.3893.58
Fully Sup (100%)F1 = 94.25             IoU = 89.13             Kappa = 94.02
Table 3. Quantitative results for various approaches with various labeled ratios on GZ-CD dataset.
MethodLabeled Ratio
% 10% 20% 40%
F1IoUKappa F1IoUKappa F1IoUKappa F1IoUKappa
Only-Sup75.8161.0573.94 80.8267.8279.35 81.4968.7680.04 84.2472.7683.02
S4GAN [59]59.3042.1457.26 74.3359.1572.69 80.2166.9678.82 81.2968.4779.96
SemiCD [31]72.9357.3970.76 77.0162.6175.22 76.8162.3574.99 80.8167.7979.37
UniMatch [57]76.9060.2173.45 81.5568.8580.20 83.9372.3282.64 85.8375.1884.37
ECPS [40]76.7562.2775.06 77.4963.2675.83 78.4764.5776.82 79.7066.2578.12
C2F-SemiCD [32]78.1064.0676.32 81.3168.5079.84 81.6268.9580.17 84.7473.5283.52
WACS-SemiCD83.7272.0182.47 84.6573.3983.44 85.2274.2484.03 86.0675.5484.99
Fully Sup (100%)F1 = 86.79             IoU = 76.66             Kappa = 85.77
Table 4. Quantitative results for various approaches with various labeled ratios on cross-dataset of {LEVIR-CD(Sup),WHU-CD(Unsup)} → LEVIR-CD.
MethodLabeled Ratio
5% 10% 20% 40%
F1IoUKappa F1IoUKappa F1IoUKappa F1IoUKappa
Only-Sup81.9769.4581.09 85.6774.9384.92 87.0277.0286.33 87.1477.2086.46
S4GAN [59]58.6841.5257.35 56.0338.9254.70 62.0644.9960.77 81.2968.4779.96
SemiCD [31]83.3471.4482.50 85.4274.5584.68 86.6176.3985.93 87.5777.8986.92
UniMatch [57]80.9067.9279.90 83.3971.5182.46 82.1569.7081.12 87.0377.0486.34
ECPS [40]84.0672.5083.23 85.3274.4084.57 87.1977.3086.53 88.4679.3084.90
C2F-SemiCD [32]86.1775.7085.46 86.7376.5786.06 89.1680.4488.60 90.6982.9690.20
WACS-SemiCD86.9076.8386.23 88.4679.3087.83 89.9481.7289.41 90.4882.6189.98
Fully Sup (100%)F1 = 91.32             IoU = 84.03             Kappa = 90.86
Table 5. Quantitative results for various approaches with various labeled ratios on cross-dataset of {WHU-CD(Sup),LEVIR-CD(Unsup)} → WHU-CD.
MethodLabeled Ratio
5% 10% 20% 40%
F1IoUKappa F1IoUKappa F1IoUKappa F1IoUKappa
Only-Sup73.2257.7571.91 78.8165.0378.02 86.4976.1985.94 87.3977.6186.89
S4GAN [59]79.1865.5378.39 79.1965.5578.37 76.9862.5876.01 83.8072.1283.11
SemiCD [31]66.9650.3465.34 78.6164.7677.70 84.0272.4483.36 87.9678.5187.45
UniMatch [57]77.6863.5176.89 78.6464.7977.71 85.4274.5584.80 85.9775.4085.42
ECPS [40]69.7253.5268.47 69.8953.6968.89 82.1769.7381.50 81.2768.4580.53
C2F-SemiCD [32]76.4561.8875.54 80.7667.7279.96 84.4473.0683.79 90.1081.9989.71
WACS-SemiCD83.1971.2382.53 86.0275.4785.44 90.0981.9789.69 92.0485.2591.71
Fully Sup (100%)F1 = 94.25             IoU = 89.13              Kappa = 94.02
Disclaimer/Publisher’s Note: The statements, opinions and data contained in all publications are solely those of the individual author(s) and contributor(s) and not of MDPI and/or the editor(s). MDPI and/or the editor(s) disclaim responsibility for any injury to people or property resulting from any ideas, methods, instructions or products referred to in the content.

