Abstract
Daily water stress reflects the water stress status of crops on a specific day, which is crucial for studying drought progression and guiding precision irrigation. However, accurately monitoring the daily water stress remains challenging, particularly when eliminating the impact of historical stress and normal growth. Recent studies have demonstrated that the diurnal characteristics of the crop canopy obtained via remote sensing techniques can be used to assess daily water stress levels effectively. Remote sensing observations, such as the solar-induced chlorophyll fluorescence (SIF) and reflectance, offer information on the crop canopy structure, physiology, or their combination. However, the sensitivity of different structural, physiological, or combined remote sensing variables to the daily water stress remains unclear. We investigated this issue via continuous measurements of the active fluorescence, leaf rolling, and canopy spectra of maize under different irrigation conditions. The results indicated that with increasing water stress, vegetation exhibited significant coordinated diurnal variations in both structure and physiology. The influence of water stress was minimal in the morning but peaked at noon. The morning-to-noon ratio (NMR) of the apparent SIF yield (SIFy), in which only the effect of the photosynthetically active radiation (PAR) is eliminated and in which both structural and physiological information is incorporated, exhibited the highest sensitivity to water stress variations. This NMR of the SIFy was followed by the NMR of the normalized difference vegetation index () and the NMR of the canopy fluorescence emission efficiency () obtained via the fluorescence correction vegetation index (FCVI) method, which primarily reflect structural and physiological information, respectively. This study highlights the advantages of utilizing diurnal vegetation structural and physiological variations for monitoring daily water stress levels.
1. Introduction
Agricultural drought poses a direct threat to both crop growth and global food security [1,2]. Within the context of global climate change, drought events are projected to occur with increasing frequency, leading to increased water stress in crops [3]. Therefore, real-time crop water stress monitoring is crucial for achieving precision irrigation and food security.
Remote sensing is an essential tool for monitoring the impact of large-scale droughts on agricultural ecosystems [4]. Monitoring the impact of drought on crops typically involves the use of remote sensing observations related to vegetation structure or physiology. Among available indices, those related to the vegetation structure, such as the normalized difference vegetation index (NDVI) [5], reflect key characteristics, including the leaf area index (LAI) and overall vegetation coverage [6]. Therefore, these indices are effective for monitoring declines in vegetation greenness caused by drought [7]. Water deficits lead to stomatal closure and affect leaf physiology. These physiological changes can also be detected via remote sensing techniques [8,9]. For example, the solar-induced chlorophyll fluorescence (SIF) is a reliable indicator for monitoring photosynthetic activity in crops [10].
On the basis of remote sensing observations related to vegetation structure or physiology, the statistical comparison approach has commonly been adopted to evaluate drought levels. This method involves the detection of anomalies caused by water deficits. Remote sensing measurements over a specific period when crops are potentially stressed are usually compared with multiyear historical statistical values for the same period to assess vegetation water stress during that period. For example, the vegetation condition index (VCI), built upon the NDVI, is highly correlated with monthly water stress changes [11]. However, owing to the impact of historical stress, i.e., the stress experienced by vegetation prior to the measurement period, the chlorophyll content and LAI may not always recover to the normal levels observed in previous years, even after adequate soil moisture becomes available during the measurement period. As a result, the VCI may still fall below the values associated with historically healthy vegetation. When the statistical comparison approach is adopted, historical stress can lead to uncertainty in accurately assessing the water stress status of vegetation during the current measurement period.
The diurnal variations in remote sensing observations related to vegetation physiology and structure hold promise for eliminating the influence of historical stress, thus enabling accurate daily water stress monitoring [12].
Since the SIF is more sensitive to water stress changes than are indices such as the NDVI and enhanced vegetation index (EVI) [13,14,15], recent research on the use of diurnal variations to monitor vegetation daily water stress levels has focused primarily on the SIF and its derived parameters. For example, Lin et al. measured daily variations in the water status via the diurnal characteristics of the far-red SIF [16]. The observed canopy SIF contains integrated information related to the photosynthetically active radiation (PAR), the fraction of PAR absorbed by vegetation (), the canopy fluorescence emission efficiency (), and the escape probability (), which describes the proportion of light that is not reabsorbed by leaves within the canopy. The observed canopy SIF can be expressed as follows:
where the is related to the vegetation physiology, whereas the and are associated with the canopy structure [17]. Notably, the variation in PAR is not related to water stress. By excluding the influence of PAR, the resulting apparent SIF yield (SIFy) exhibits greater sensitivity to water stress than does the SIF [15]. Consequently, Liu et al. proposed the use of the diurnal variation characteristics of SIFy, referred to as the noon–morning ratio (NMR), to monitor the daily water stress in vegetation and successfully tracked daily variations in the water status of maize [12].
Recent studies have also indicated that may be more sensitive to water stress [17,18,19]. Researchers have employed the spectral invariance theory to derive the NIRv and FCVI, which approximates the product of and fPAR [20,21]. They aimed to further isolate that contains only physiological information and effectively captured the suppression of agricultural drought [22]. Additionally, Pan et al. successfully tracked daily changes in water stress in forests via the afternoon–morning ratio (AMR) of [23]. Therefore, the diurnal variation characteristics of , which contains solely physiological information, may be more sensitive to changes in the daily water status.
However, on a daily scale, the canopy structure also undergoes changes, such as leaf rolling and variations in leaf angle distribution (LAD), which can affect the absorption of light energy by the canopy [10]. Zhao et al. reported that fPAR significantly decreases at midday under water stress [24]. Additionally, other researchers have indicated that the far-red SIF is highly influenced by structural factors, leading to considerable uncertainty in drought monitoring [25]. Consequently, there is no consensus on whether monitoring the daily water stress is more effective via the diurnal variation characteristics of , which exclusively contains physiological information, or via the diurnal variation characteristics of SIFy, which contains both structural and physiological information.
To investigate the relationship between water stress and the diurnal patterns of vegetation structural and physiological traits, and to evaluate the effectiveness of the use of vegetation indices with varying information contents to monitor the daily water stress, we obtained continuous observational data of the active fluorescence indicative of leaf physiological information and leaf rolling measurements representing structural information from a maize canopy. The canopy SIF and corresponding meteorological data were continuously monitored. Specifically, we aimed to address the following research questions: (1) How are the diurnal variation characteristics of the vegetation structure and physiology manifested under different water stress conditions? (2) Which approach is more effective for monitoring the daily water stress, i.e., the use of the diurnal variations in , which reflects only physiological dynamics, or the use of the diurnal variations in SIFy, which contains both vegetation structural and physiological information?
2. Materials and Methods
2.1. Description of the Experiment
The experimental plot is located in Gucheng, Baoding city, Hebei Province, China (115°44′36”E, 39°9′26”N). The region is characterized by a temperate continental climate, with maize as one of the primary crops cultivated from mid-June to late September. The experiment involved two plots, each measuring 2 × 4 m (Figure 1c). To prevent water seepage between adjacent plots, a 2.5 m-deep concrete barrier encircles each plot. Additionally, movable rain shelters were installed to protect the experimental area from natural precipitation, thus ensuring controlled water management throughout the study.
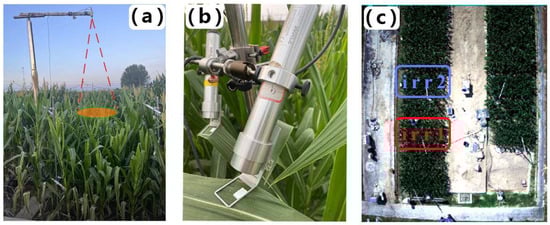
Figure 1.
(a) AutoSIF canopy observation system and temperature sensor, (b) Monitoring-PAM probe, and (c) aerial view of the study area.
In this field experiment with maize, the Zhengdan 958 variety was sown on the day of year (DOY) 170 in 2023. At the early growth stages of the maize, irrigation was precisely controlled to maintain similar soil moisture conditions across all the experimental plots, thus ensuring consistent initial growth conditions. We collected soil samples from a depth of 50 cm to calculate the relative soil moisture (RSM). RSM values were determined by employing the ratio of gravimetric soil moisture to the soil moisture holding capacity. This specific RSM calculation method was based on methodologies outlined in previous research [24]. Figure 2 shows the RSM and irrigation volume during the observation period. It is noteworthy that we implemented different irrigation schemes on two plots, with the plot subjected to Irrigation Scheme 1 named irr1 and the plot subjected to Irrigation Scheme 2 named irr2. Each plot underwent its own control process, transitioning from a well-watered state gradually to drought conditions, and then back to rehydration to reach a non-water stress control state again. This water-controlled experiment, which simulates multiple cycles of gradual progression from non-drought to drought and subsequent drought recovery, demonstrates the reproducibility of vegetation diurnal variation patterns in response to changes in water stress, thereby supporting the reliability of the study’s findings (Figure 1c). The maize observation period extended from DOY 222 to DOY 234. The irr1 plot was rewatered on the evenings of DOY 225 and DOY 232, whereas irr2 received rewatering on the evening of DOY 233 to alleviate maize water stress. Based on the RSM values, the daily drought levels for each plot are classified into three categories: non-drought (Class I, RSM > 60), moderate drought (Class II, 40 < RSM ≤ 60), and severe drought (Class III, RSM ≤ 40) [26]. The daily drought status of each plot is detailed in Table 1.
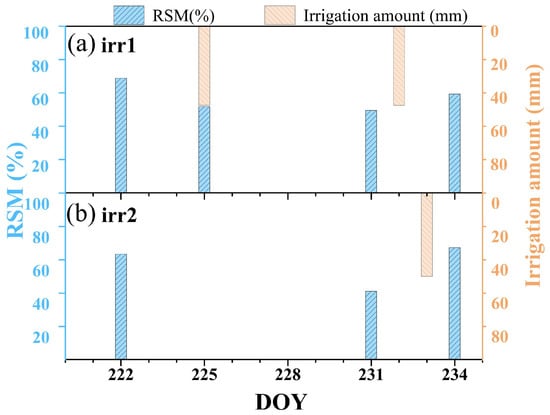
Figure 2.
Variation trends of the relative soil moisture (RSM) and irrigation amount in the irr1 and irr2 plots throughout the observation period.

Table 1.
The daily drought levels of the two plots.
Additionally, two SI-411 infrared radiometers (Apogee Instruments Inc., Logan, UT, USA) were installed above the irr1 and irr2 plots to monitor the canopy temperature. The installed infrared temperature sensors provided a field-of-view angle of 44°, an absolute accuracy greater than 0.2 °C, and monitoring data at 5 min intervals.
Meteorological observations, including the air temperature (Ta), total radiation (Total Rad), and relative humidity (RH), were measured, and the vapor pressure deficit (VPD) was derived from the RH and Ta [27]. These meteorological observations were collected at a frequency of one sample per minute, with 10 min average values analyzed. All observational data and their attributes used in this study are listed in Table S1.
2.2. Canopy Spectra
In this study, continuous canopy spectral observations under the two distinct irrigation regimes were conducted at high temporal resolution via an upgraded AutoSIF observation system (Bergsun Inc., Beijing, China) [19]. The system comprises a control computer, two spectrometers, and an optical multiplexer (MPM-2000, Ocean Optics Inc., Dunedin, FL, USA). The MPM-2000 device features 6 channels for connecting spectrometers and provides channel switching in less than 150 milliseconds. Among these channels, two channels are connected to vertically oriented optical fibers with cosine correctors for measuring the downward irradiance, another two are dedicated to measuring the dark current, and the remaining channels are used for measuring the upward radiance from the different canopies.
The two spectrometers used for spectral data collection are as follows: The first spectrometer is a QE65Pro spectrometer (Ocean Optics Inc., Dunedin, FL, USA), which exhibits a spectral range of 640–800 nm and a spectral resolution of approximately 0.7 nm. It features a sampling interval of approximately 0.35 nm and a signal-to-noise ratio of 1000:1, and it was used to extract the far-red SIF. The second spectrometer used is an HR2000 spectrometer (Ocean Optics Inc., Dunedin, FL, USA), with a spectral range of 300 to 1200 nm, a spectral resolution of approximately 3 nm, a sampling interval of 1.5 nm, and a signal-to-noise ratio of 250:1. This spectrometer was employed to calculate vegetation index values.
A vertically oriented bare optical fiber affixed to an adjustable bracket above each plot was utilized for measuring the upward radiance from the canopy. The frame height was adjusted to maintain the optical fibers at approximately 2 m above the canopies throughout the observation period, thus ensuring a circular field of view with a diameter of 1 m (Figure 1a). The measurement sequence alternates between canopy upward radiance, downwelling irradiance, and dark current measurements, and the specific measurement method is described by Han et al. [28]. To avoid unreliable data caused by excessively high solar zenith angles, observations were conducted daily between 08:00 and 16:00.
2.3. Leaf Fluorescence Observations
Continuous monitoring of the active fluorescence revealed diurnal variations in the energy distribution within the plant photosystem, highlighting the impacts of drought stress [29]. Via the use of a multichannel, continuous-monitoring pulse–amplitude modulation fluorometer system (Monitoring-PAM, Heinz Walz Inc., Effeltrich, Germany), we conducted continuous measurements of maize leaves in the two plots subjected to different irrigation regimes. Each plot was equipped with two measuring probes located at the canopy top, which specifically targeted sunlit leaves (Figure 1b). The measurement schedule was programmed from 08:00 to 16:00 local time with a recording interval of 30 min. Each measurement session involved the emission of saturated pulse light with an intensity exceeding , thereby capturing the resultant maximum fluorescence post-photochemical quenching and steady-state fluorescence under actinic light. The active fluorescence observations obtained in this study are detailed in Table 2.
Table 2.
Active fluorescence observations measured with the Monitoring-PAM system.
To reduce the impact of measurement errors, we added a calibration step in the Monitoring-PAM measurement process. First, for the nonfluorescent emission entity, for which a diffuse reflectance white standard was adopted as a substitute, the Fs measurement value is not zero, indicating the presence of systematic error. Consequently, we recorded Fs values for each probe with respect to the diffuse reflectance white standard to correct for this systematic error. Second, to ensure that the measurements of the different probes were comparable, purple fluorescence films were placed underneath the probes to record Fs. Adjustments were made to standardize the distance between each probe and the target, thereby aligning the measurement baseline and minimizing any differences among the probes.
2.4. Leaf Rolling
To measure the degree of leaf rolling, an image-based method was introduced to quantify the proportion of leaf rolling via the leaf rolling ratio (LRR). The LRR can be calculated as follows:
where is the leaf area projected in the image at the corresponding measurement time. Moreover, denotes the largest leaf area projected on the measurement day, which can be calculated from images obtained by pressing the corresponding leaves flat against a transparent plastic board.
Images of ten representative leaves from each irrigation treatment plot were captured at two-hour intervals, from 08:00 to 16:00, on DOYs 225, 226, 227, and 234. The images were obtained by placing a plastic board underneath the leaves to stabilize them and then capturing images with a smartphone positioned perpendicular to the leaves. The LRR of each leaf was then calculated by comparing the observed projected area to the full expansion area.
Figure 3 shows images of the two groups of maize leaves captured at various times throughout a single day, showing plots indicating an adequate water supply and those indicating water stress. In the well-watered plot, the leaves remained full and expanded from 08:00 to 18:00, with no significant rolling observed. In contrast, in the water-stressed plot, the leaves were relatively flat at 08:00 but began to roll inward from the main veins with increasing temperature and light intensity. This rolling intensified until approximately 14:00, resulting in tightly rolling, needle-like leaves. As the temperature and light intensity gradually decreased toward the evening, the leaves slowly unfurled but did not return to their fully expanded state by 18:00. A comparison of the relationships between the leaf morphology and the LRR revealed that the LRR effectively reflects the diurnal variations in leaf rolling under varying degrees of water stress.
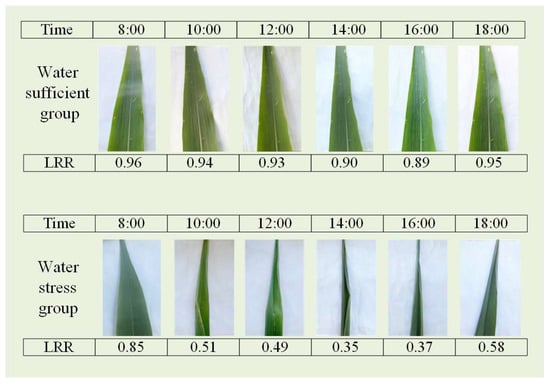
Figure 3.
Images of leaves under well-watered and water-stressed conditions, along with their corresponding measurement times and LRR values.
2.5. Numerical Experiments Using the SCOPE Radiative Transfer Model
At the canopy scale, leaf rolling leads to reduced canopy coverage and increased canopy gap fraction levels, which in turn leads to a reduction in the leaf area involved in photosynthesis and transpiration, referred to as the LAI. Consequently, the LRR can be indirectly represented by the LAI. To analyze the relationships among leaf rolling, the quantum yield of photosystem fluorescence, and canopy fluorescence, the Soil Canopy Observation of Photosynthesis and Energy fluxes (SCOPE) model was applied to simulate changes in SIFy as a function of the LAI and fluorescence quantum efficiency (Fqe) [30,31].
The parameter settings of the SCOPE model closely match the experimental conditions. The canopy LAI varied between 1 and 3.5 m2/m2, and the photosystem Fqe varied between 0.01 and 0.03. Other vegetation properties and the solar observation geometry were held constant, with the solar zenith angle fixed at 30° and the observation angle fixed at 0°, matching the real measurement setup.
2.6. Data Processing
2.6.1. Calculation of Vegetation Indices and Photosynthetic Observations at the Canopy Scale
We calculated the reflectance via measurement data from the Ocean Optics HR 2000+ spectrometer and derived vegetation indices such as the NDVI, FCVI, and NIRv on the basis of the calculated reflectance. Due to the wide [30,31] application of these vegetation indices in characterizing vegetation structure, three representative vegetation indices were selected. The specific equations used are detailed in Table 3.
Table 3.
Details on the vegetation indices used in this study.
Owing to a superior signal-to-noise ratio and spectral resolution, QE Pro spectrometer measurement data were selected for calculating the SIF. The far-red SIF was extracted via the spectral fitting method (SFM) [35]. The SFM was employed within the absorption band to mathematically model the spectral shapes of the true reflectance (r) and fluorescence (F).
where L is the upward radiance, and E is the downward irradiance. Moreover, denotes the function describing the spectral shape of the true reflectance within the band, is the function used to describe the spectral shape of F, and denotes the modeling error. A quadratic reflectance fitting function was selected, and a linear function was used for fluorescence fitting. To mitigate the effect of illumination instability, the SIF extracted under sunny weather conditions was utilized for analysis.
To analyze the physiological information within the SIF regarding the drought response, we estimated via the FCVI and NIRv methods. The values obtained via the two methods are denoted as and , respectively [20,21]. Both methods provide a more detailed understanding of the interplay between the physiological activities and structural attributes of the canopy under varying water stress conditions.
where is the ratio of the chlorophyll-absorbed PAR () to the total canopy-absorbed PAR () and is closely related to the variation in the leaf chlorophyll content [36]. Owing to the spectral range limitations of the Ocean Optics QE65Pro spectrometer, the FCVI could not be calculated. To minimize the differences in calculated via different methods, reflectance data obtained by the Ocean Optics HR2000+ spectrometer were used to compute the FCVI and NIRv.
On the basis of previous research, vegetation indices related to the chlorophyll content and canopy structure can be used to determine and , respectively [37,38,39]:
SIFy can be calculated as follows:
where PAR is the integral of E over the 400–700 nm wavelength range.
To evaluate the ability for monitoring water stress in maize via diurnal variations in maize conditions, we calculated the NMR and AMR of the canopy indices (CIs) based on the continuous canopy spectrum measurement data. We adopted the NMR expression proposed by Liu et al. [12], which is as follows:
where denotes the mean measured value between 12:00 and 13:00, and denotes the corresponding mean measured value between 8:00 and 9:00. The adopted in this study include the NDVI, SIFy, , and . Owing to the typically high values of SIFy under water stress from 8:00 to 9:00, followed by a rapid decline, we selected 8:00 to 9:00 as the time window for the NMR to better reflect the healthy physiological state in the morning. Based on the analysis of meteorological data and the diurnal variation of different CIs, maizes are most affected by water stress between 12:00 and 13:00, which is why this time window was selected for noon.
The AMR can be calculated via the equation proposed by Pan et al. [23]:
where denotes the mean measured value between 14:30 and 17:00, and denotes the mean measured value between 8:00 and 11:00. To compare with the AMRs of other vegetation types, our AMR time window is based on the study by Pan et al. [23].
2.6.2. Calculation of Photosynthetic Observations at the Leaf Scale
To analyze the diurnal variations in the energy distribution in photosystem II (PSII) in response to different levels of water stress, active fluorescence observations were continuously obtained with the Monitoring-PAM system. The energy distribution pathways in photosystem II include photochemical energy utilization (P), fluorescence emission (F), and heat dissipation (H). Heat dissipation can be further subdivided into sustained heat dissipation (D) and reversible energy-dependent heat dissipation (N), the latter of which is associated with photoprotective mechanisms involving the xanthophyll cycle and nonphotochemical quenching (NPQ) [40].
The absolute efficiency of P, , was calculated via and values obtained with the Monitoring-PAM system, according to the equation proposed by Genty et al. [41]:
Under prolonged dark adaptation, N can be reduced to zero. The quantum efficiency of N, , was subsequently calculated via fluorescence measurements obtained with and without N [42]:
The quantum efficiencies of F () and D () were estimated as follows:
where and are the rate coefficients of F and D, respectively. Notably, and were assumed to remain constant and were set to values of 0.9 and 0.1, respectively [43,44]. The rate coefficient of N () can be calculated as follows [45]:
3. Results
3.1. Diurnal Variation Trends of Environmental Observations and Canopy–Air Temperature Differences
We observed the diurnal patterns in meteorological data to assess the weather conditions during the observation period and to analyze the impacts of environmental stresses on the diurnal variations in the vegetation structure and physiology. Figure 4a–c shows the diurnal variations in Total Rad, VPD, and Ta, respectively, during the observation period. The instability of Total Rad suggested overcast or cloudy weather conditions on DOYs 223, 224, 229, 230, 232, and 233. Under clear-sky conditions, all the observations exhibited similar trends, increasing from the morning, peaking at noon, and then declining as the day progressed, with consistent diurnal patterns and slight variations. On cloudy days, the midday peak Ta was significantly reduced, Total Rad showed considerable variability, and the VPD was notably lower.
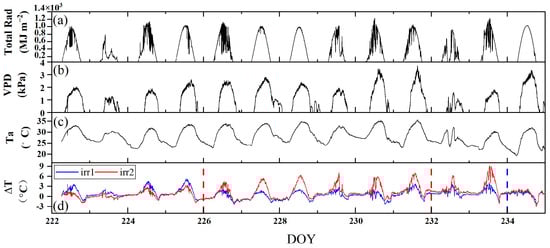
Figure 4.
The diurnal variations of total daily radiation (Total Rad) (a), vapor pressure deficit (VPD) (b), air temperature (Ta) (c), and canopy–air temperature difference (ΔT) (d) under the two irrigation treatments (irr1 and irr2) during the observation period from DOYs 222 to 234. The red and blue dashed vertical lines indicate the rewatering times in the irr1 and irr2 plots, respectively.
The diurnal variation in vegetation physiology is influenced by both environmental factors and water stress, and ΔT, which is defined as the canopy–air temperature difference, can reflect the response of vegetation to different environmental and water conditions. Under clear-sky conditions, there were significant differences in the diurnal variations in ΔT under varying water stress levels, whereas the diurnal variations in Total Rad, VPD, and Ta slightly differed. Notably, ΔT typically began to increase in the morning, peaked at noon, and then gradually declined. From DOYs 222 to 233, as water stress increased in the irr2 plot, the noon peak in ΔT correspondingly rose. Following irrigation, a significant reduction in ΔT was noted in both plots. Under cloudy conditions, the diurnal trend of ΔT remained consistently low throughout the day, in contrast to the trend observed under clear-sky conditions (Figure 4d). In this experiment, ΔT accurately reflected the degree of water stress under clear-sky conditions.
3.2. Diurnal Variations in Leaf Structure and Physiology
3.2.1. Diurnal Variation in the Leaf Rolling Ratio
Figure 5 shows the diurnal variation trends of the LRR of maize under the two water stress treatments, revealing significant diurnal variations in leaf rolling under the varying water stress conditions. Under sufficient water conditions, the LRR remained high throughout the day, indicating that leaf rolling did not occur when water was abundant (irr1: DOYs 226, 227, and 234; irr2: DOY 234). From DOYs 225 to 227, the degree of water stress progressively increased, and the LRR continued to decrease at midday. Additionally, after rewatering the irr1 plot on the night of DOY 225, the LRR quickly recovered by the next day, effectively illustrating how leaf rolling reflects changes in water stress. Therefore, the diurnal variation in leaf rolling can reflect changes in the water stress status.
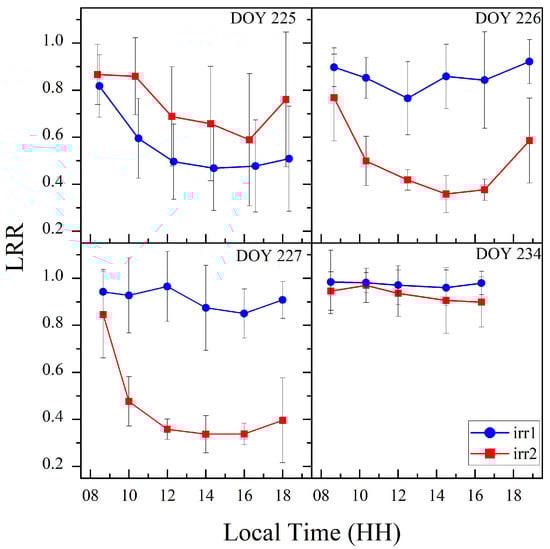
Figure 5.
Diurnal variation trends of the LRR for the two plots on DOYs 225, 226, 227, and 234.
3.2.2. Diurnal Variations in Leaf Fluorescence Observations
On the basis of the PAR sensor measurements from each plot, sensor data reflecting stable lighting conditions and nonshaded leaves were selected for analysis (Figure 6). Notably, for the irr2 plot, data for the entire day of DOY 234 were missing because leaves fell from the sensor mounting clips. The diurnal variation patterns of observations indicative of the leaf physiological status, such as , , , and , exhibited significant differences under varying degrees of water stress.
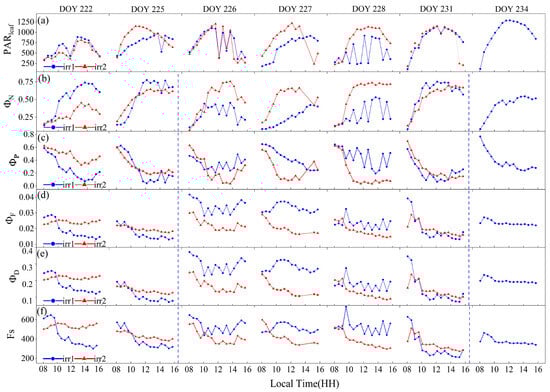
Figure 6.
The diurnal variations of leaf photosynthetically active radiation ) (a), quantum efficiencies of N ) (b), quantum efficiencies of P (c), quantum efficiencies of F (d), quantum efficiencies of D (e) and Steady-state fluorescence (f) measured by the Monitoring-PAM system on sunny days during the observation period. The blue dashed vertical lines indicate the rewatering times for the irr1 treatment.
As shown in Figure 6b, under clear-sky conditions, the diurnal pattern of typically started at a low level in the morning, increased as the day progressed, peaked at noon, and then gradually declined. However, water stress led to significant variations in this pattern. From DOYs 222 to 225, the sunlit leaves selected in the two plots exhibited similar levels of sunlight exposure, with the irr2 plot subjected to less water stress. In addition to the low light conditions in the morning, when the difference between the two plots was minimal, the values were generally greater in the irr1 plot throughout the remainder of the day. After irrigation during the night of DOY 225, despite more sunlight on DOY 226 than on DOY 225, the noon peak of significantly decreased after watering. A similar pattern occurred after rewatering on DOY 234 in both plots. From DOYs 222 to 226, with increasing water stress, the noon peak of gradually increased (Figure 6b). Consequently, water stress primarily resulted in significant midday peak changes in the diurnal pattern of .
Water stress also led to variations in the diurnal pattern of . Generally, began to decrease in the morning, reached its minimum at noon, and then started to recover. This diurnal trend was opposite to that of . Under similar sunlight conditions, the plot under greater water stress exhibited lower minimum values at noon, such as the irr1 plot on DOY 222 and the irr2 plot on DOY 226. However, in the morning, slightly differed between the two treatments (Figure 6c).
The diurnal variations in and were significantly affected by water stress (Figure 6). Notably, and were obtained under the assumption that equals 0.9 and that equals 0.1, which resulted in similar diurnal variation patterns. Under well-watered conditions, and maintained relatively constant values throughout the day on stable, sunny days, as observed in the irr2 plot on DOYs 222 and 225 and in the irr1 plot on DOYs 226 and 227. With increasing water stress, and transitioned from stable values throughout the day to a diurnal pattern characterized by higher values in the morning, followed by a decline and minimum values at midday, as observed in the irr2 plot from DOYs 222 to 231. In contrast, following rehydration irrigation, both and in the two plots exhibited overall increases, and the diurnal pattern shifted from a morning decline back to a stable value throughout the day, as observed in the irr1 plot before and after rehydration on DOYs 225 and 232, respectively (Figure 6d,e). Additionally, Fs exhibited a similar diurnal variation pattern to that of (Figure 6f).
3.3. Diurnal Variations in Canopy Spectral Observations
3.3.1. Diurnal Variations in Remote Sensing Observations Related to the Canopy Structure
Figure 7 shows significant diurnal variation differences among the NDVI, NIRv, and FCVI under varying degrees of water stress. Considering the potential interference caused by changes in the solar zenith angle, such as the variation in the ratio of direct to diffuse light, observational data from 8:00 to 16:00 were selected to mitigate such effects. Under clear-sky conditions, the PAR values exhibited an arch-shaped pattern with minimal fluctuations (Figure 7a).
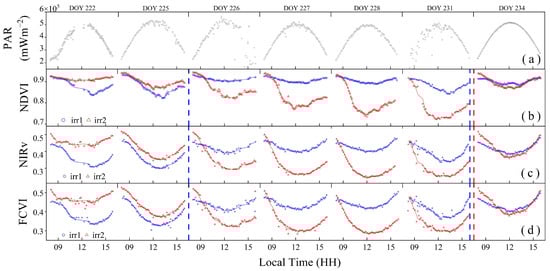
Figure 7.
The diurnal variations of photosynthetically active radiation (PAR) (a), normalized difference vegetation index (NDVI) (b), near-infrared reflectance of terrestrial vegetation (NIRv) (c), and fluorescence correction vegetation index (FCVI) (d). Scatter plots were used to visualize these variations. The solid lines of different colors indicate the respective fitted curves of each index. The red and blue dashed vertical lines indicate the rewatering times in the irr1 and irr2 plots, respectively.
As shown in Figure 7b, the diurnal variation in the NDVI was significantly influenced by water stress changes. Under non-water-stressed conditions, the NDVI values exhibited minimal variation throughout the day (irr1: DOYs 226 and 227; irr2: DOY 222). From DOYs 222 to 231, as water stress increased in the irr2 plot, the morning NDVI values remained unchanged and high, whereas the noon trough gradually decreased. After rewatering during the night of DOY 231, the trough values notably increased. The diurnal variation in the NDVI can reflect rapid changes in the vegetation structure induced by water stress.
The diurnal variations in the FCVI and NIRv also reflect changes in vegetation water stress, but their trends differed from those of the NDVI. As shown in Figure 7c,d, the diurnal change trends of the NIRv and FCVI were bowl shaped and smoother than that of the NDVI. The NIRv and FCVI values continuously decreased from morning until they reached their lowest values at midday and then gradually increased. From DOYs 222 to 231, as water stress increased, the midday nadir values of the NIRv and FCVI in the irr2 plot steadily decreased, with a greater decline than that in the NDVI. After rewatering, the midday nadir values of both NIRv and FCVI, even under sufficient water conditions, remained significantly lower than their morning values, indicating a distinct diurnal variation trend compared with that of the NDVI after rewatering (irr1: DOYs 226 and 234; irr2: DOY 234). Compared with that of the FCVI, the NIRv exhibited a lower midday minimum value under severe water stress conditions.
3.3.2. Diurnal Variations in Remote Sensing Observations Related to Vegetation Physiology
The diurnal patterns of the SIF and its derived parameters can reflect the physiological response of vegetation to water stress. As shown in Figure 8a, the SIF values throughout the observation period exhibited an arch-shaped daily variation. At the early stages of water stress or following the alleviation of water stress, the trends in the SIF and PAR were consistent (irr1: DOYs 226, 237, and 228; irr2: DOYs 222 and 225). On DOY 231, the midday peak of the SIF in the irr1 plot exhibited a significantly earlier occurrence due to water stress. With increasing water stress, the midday peak of the SIF progressively decreased, and the arch shape became flatter, as observed in the irr2 plot from DOYs 225 to 231. Therefore, changes in the diurnal variation trend of the SIF can effectively reflect the degree of water stress.
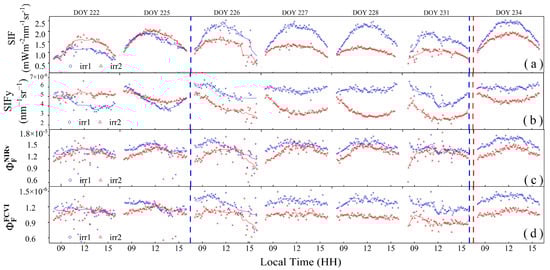
Figure 8.
The diurnal variations of solar-induced chlorophyll fluorescence (SIF) (a), apparent SIF yield (SIFy) (b), canopy fluorescence emission efficiency () (c,d). Scatter plots were used to visualize these variations. The solid lines of different colors indicate fitted curves for each parameter. The red and blue dashed vertical lines indicate the rewatering times in the irr1 and irr2 plots, respectively.
The diurnal variation in SIFy also exhibited high sensitivity to water stress, as shown in Figure 8b. Under well-watered conditions, SIFy exhibited minimal variation throughout the day (irr1: DOYs 227, 228, and 234). On the afternoon of DOY 226, SIFy anomalously declined due to unstable sunlight conditions (Figure 7a). Under water stress, the diurnal variation pattern of SIFy showed relatively high values in the morning, a decrease to its lowest point at noon, and recovery in the afternoon. With increasing water stress, from DOYs 222 to 231 in the irr2 plot, high morning values with slight declines were observed, with the midday nadir values decreasing progressively and exhibiting high variability. Notably, after rewatering during the night of DOY 233 in the irr2 plot and during the nights of DOYs 225 and 232 in the irr1 plot, a significant increase in the midday nadir values was observed, indicating that the diurnal variation in SIFy quickly responds to the relief of water stress.
The diurnal pattern of also varied under the different water stress conditions, but the variation was lower than that in SIF and SIFy (Figure 8d). Comparing the irr2 and irr1 plots under varying levels of water stress, exhibited a greater range in the irr2 plot. With increasing water stress, the diurnal pattern of shifted from a pattern encompassing an initial increase in the morning, a peak at noon, and a subsequent decline to a pattern where it started to decrease from the morning. After rewatering and alleviation of water stress, there was a notable increase in the overall value of . Therefore, the response of to water stress was reflected mainly in the changes in its diurnal pattern and the overall decrease in its magnitude.
However, showed no significant differences in diurnal variations across the different levels of water stress (Figure 8c). Apart from DOYs 226 and 231, when sunlight instability was noted, the diurnal trend of on other days exhibited an initial increase in the morning, a peak at noon, and a subsequent decline, thereby maintaining a stable overall trend without significant changes across the different water stress conditions. This indicates that the diurnal variation in does not effectively reflect water stress changes.
3.4. Differences in the Vegetation Structure and Physiology Between the Morning and Noon Under Different Levels of Water Stress
To analyze the differences in the diurnal variation characteristics of the vegetation structure and physiology under different water stress levels, we used the LRR to categorize vegetation water stress into two levels. The first condition, termed Mild Drought, was defined by an LRR value greater than 0.7 throughout the day, including the midday peak of environmental stress. This was observed on specific DOYs, such as 226, 227, and 231 in the irr1 plot and DOY 234 in the irr2 plot, indicating minimal or no leaf rolling and suggesting either mild or no water stress. Severe Drought was defined as a daily LRR value below 0.7 during the peak midday stress period. For example, this was observed on DOY 226 in the irr1 plot and DOYs 225, 226, and 227 in the irr2 plot, indicating significant leaf rolling and substantial changes in the leaf structure (Figure 5).
3.4.1. Differences in the Vegetation Structure Between the Morning and Noon Under Different Levels of Water Stress
At the leaf and canopy scales, the LRR and the response of the NDVI to water stress, respectively, significantly differed between the morning and midday periods (Figure 9). Specifically, during the Mild Drought phase, the NDVI and LRR values exhibited minimal differences between the morning (8:00–9:00) and noon (12:00–13:00) periods, with only a slight decline at noon due to the increased environmental stress. In contrast, during Severe Drought phases, although the morning NDVI and LRR values remained relatively high, there were significant decreases by noon. Among them, the LRR showed a greater decrease at midday under severe drought conditions than did the NDVI. This likely occurred because the NDVI is a composite measure of vegetation greenness and biomass at the canopy scale, whereas the LRR directly reflects changes in the leaf structure. As a result, the LRR was more sensitive to variations under water stress. At both the leaf and canopy scales, it was noted that in the morning, the impact of water stress on the crop structure was not significant. However, at noon, the effect of water stress on the vegetation structure was notable.
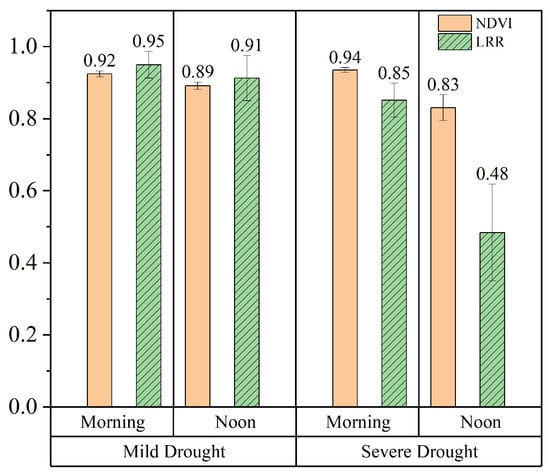
Figure 9.
Diurnal variations in the average LRR and NDVI values at the different leaf rolling stages in the morning (8:00–9:00) and at noon (12:00–13:00).
3.4.2. Differences in Vegetation Physiology and Vegetation Structure Between the Morning and Noon Under Different Levels of Water Stress
At the leaf scale, energy allocation of vegetation varies with light and water stress. Significant differences in the diurnal variation in the energy distribution within the photosystem occurred under varying levels of water stress. Figure 10 shows the diurnal variations in the energy distribution in the photosynthetic system of sunlit leaves in the irr1 plot. In the morning, when the PAR level was less than 600 , the value remained relatively low, typically under 0.2 between 8:00 and 9:00 (Figure 10). As the day progressed, gradually increased and peaked at noon. With decreasing RSM, the midday peak of notably increased (Figure 10). In contrast, exhibited the opposite trend as that of . Notably, it was higher in the morning and decreased over time, reaching its lowest point at noon. This minimum value of decreased with decreasing RSM. Although the sum of and remained relatively stable throughout the day, under severe water stress, the sum of and was notably smaller (DOYs 222 and 225). With respect to leaf physiology, vegetation water stress primarily affects N and P under high-PAR conditions at midday.
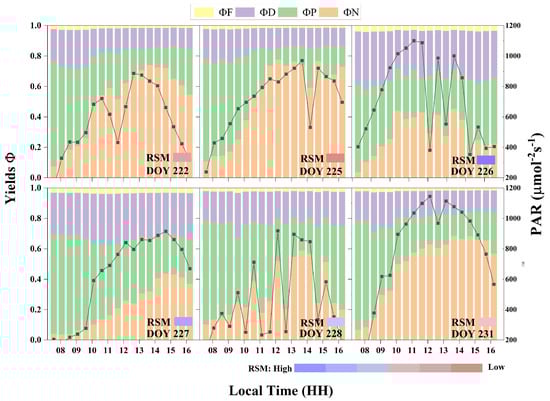
Figure 10.
Quantum efficiencies of illuminated leaves in the irr1 plot for four distinct energy pathways, alongside diurnal variations in the PAR value and corresponding changes in the relative soil moisture (RSM) with increasing water stress.
To analyze the differences in the diurnal variation characteristics of leaf-scale vegetation energy allocation in the morning and midday under different drought intensities, we grouped all the observation data from the two plots according to mild and severe drought conditions. We calculated daily mean values for the morning (8:00–9:00) and midday (12:00–13:00) periods. Figure 11 clearly shows the differences in energy allocation within the optical system of sunlit leaves under different water stress levels during the morning and noon periods. In the morning, the energy distribution pattern showed minimal differences across the different water stress levels, typically characterized by a lower value of approximately 0.2 and a higher value of approximately 0.5. Notably, compared with those under Mild Drought, the values under Severe Drought indicated a significant increase in and a significant decrease in at noon. Moreover, increased from approximately 0.5 under Mild Drought to approximately 0.7 under Severe Drought. Under Severe Drought, also decreased in the morning. Overall, due to the higher light intensity at midday, was greater than the morning value, whereas was lower. Water stress further increased and decreased at midday. Therefore, water stress primarily affects vegetation energy allocation at midday.
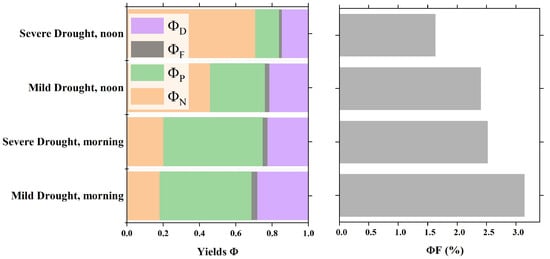
Figure 11.
Differences in the quantum efficiency of photon processing via four pathways at different leaf rolling stages during the morning and noon periods.
3.5. Relationships Among the Vegetation Structure, Physiology, and Fluorescence Observations
3.5.1. Influences of the LAI and Fqe on SIFy
SIFy is a parameter that integrates aspects of both canopy structure and physiology. To analyze the influences of the canopy structure and physiology on SIFy, we applied the SCOPE model to simulate the relationships among the LAI, Fqe, and SIFy under this experimental scenario. One key parameter representing changes in the canopy structure is the LAI, while Fqe primarily reflects changes in leaf physiology. Figure 12a shows the simulation results of the SCOPE model, in which the LAI was adopted as the independent variable under different Fqe conditions, whereas SIFy was employed as the dependent variable. The results indicated that SIFy increased with increasing LAI and stabilized at high LAI levels. Figure 12b shows the changes in SIFy in response to variations in Fqe under different LAI conditions. The results clearly revealed a positive correlation between SIFy and Fqe. With higher LAI, SIFy’s response to increases in Fqe was more pronounced. In summary, SIFy demonstrated a positive correlation with both increasing LAI and Fqe, indicating a synergistic effect on the parameter.
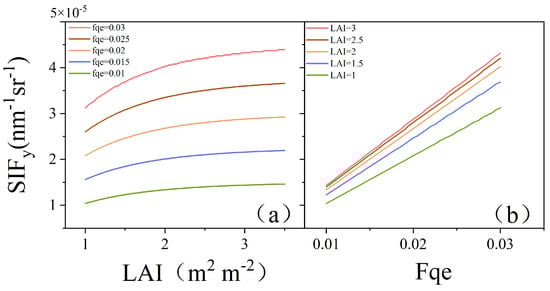
Figure 12.
Simulation results of the SCOPE model: (a) SIFy variation with LAI under different Fqe conditions; (b) SIFy variation with Fqe under different LAI conditions.
3.5.2. Relationships Between the Leaf and Canopy Fluorescence Observations
To explore the differences between the canopy- and leaf-scale fluorescence observations, we analyzed the relationships between the canopy-scale SIFy, two fluorescence emission efficiencies and , and Fs under different water stress levels. Figure 13a shows that Fs initially increased with increasing , where refers to the radiation received by the Monitoring-PAM sensor. Notably, Fs first peaked and subsequently decreased as continued to increase. At low levels, Fs was positively correlated, whereas at high levels, Fs was negatively correlated. Compared with that under Severe Drought, under Mild Drought, the peak Fs value was greater and occurred at higher light intensities. Figure 13b shows that there were significant differences in the relationships between SIFy and at different water stress levels, where refers to the PAR received by the canopy. Under Mild Drought, the SIFy value slightly decreased with increasing . However, during the Severe Drought period, SIFy exhibited a greater decline at high values than that during the Mild Drought period. The canopy-scale SIFy, due to the aggregation of vegetation structure effects, showed a different trend from that in Fs in response to light intensity changes. Nevertheless, both SIFy and Fs decreased under higher-PAR conditions as water stress increased.
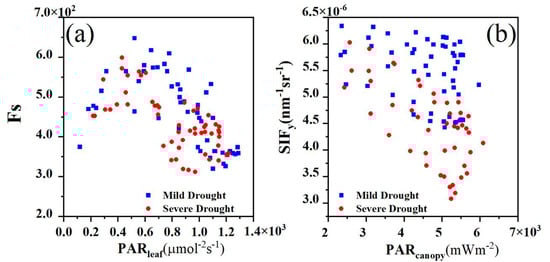
Figure 13.
(a) Relationship between the leaf steady-state fluorescence (Fs) and leaf absorption of the photosynthetically active radiation . (b) Relationships between the canopy SIFy and canopy-absorbed photosynthetically active radiation .
The Fs of leaves serves as a proxy for the leaf-scale measured . Moreover, and represent the canopy-scale measured . To better utilize for monitoring crop water stress, we analyzed the relationship between and over the entire observation period. As shown in Figure 14, there was a positive correlation between and Fs. In contrast, the correlation of with Fs was lower, indicating a slight negative trend. This finding suggests that under certain conditions, an increase in Fs does not correspond with an increase in . Overall, may more accurately reflect the physiological state of vegetation.
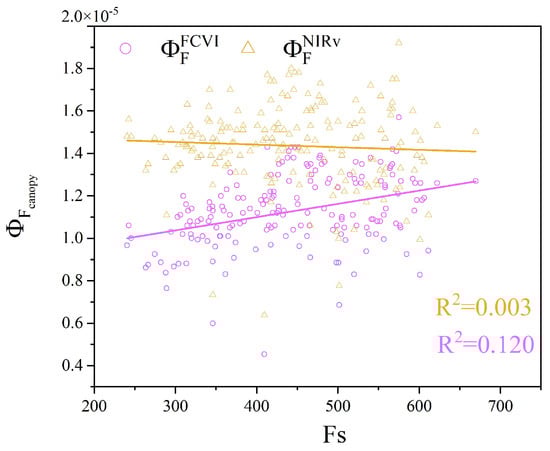
Figure 14.
Relationship between the canopy fluorescence emission efficiency and leaf steady-state fluorescence (Fs).
3.6. Capability for Monitoring Water Stress via Diurnal Variation Characteristics
To investigate the ability to monitor water stress via the diurnal variation characteristics of different canopy remote sensing observations, we assessed the ability of the NMR and AMR to reflect water stress changes. Figure 15a,b shows the trends in the NMRs of the NDVI, SIFy, , and in response to RSM changes across the different irrigation treatments throughout the observation period. Specifically, the NMR values of (), , and all decreased with decreasing RSM. However, the trend in the NMR of () diverged from the trend in RSM changes, as observed in the irr2 plot from DOYs 222 to 231 and in the irr1 plot from DOYs 222 to 225. Among these, and showed the most gradual decline, whereas decreased more steeply. Following rewatering, there was a notable increase in the RSM value, which coincided with a significant increase in ,, and . The diurnal variation characteristic NMR can accurately reflect the degree of vegetation water stress, whereas the ability of different canopy remote sensing observations to reflect water stress via the NMR varies.
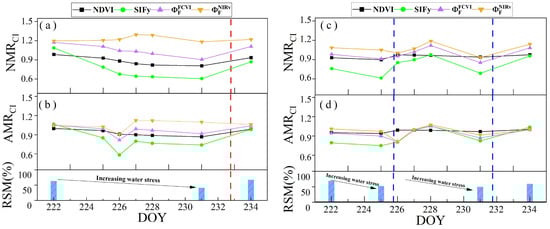
Figure 15.
Variations in the NMR and AMR of the NDVI (black), SIFy (green), (purple), and (brown) in response to changes in the RSM on clear days throughout the observation period (DOYs 222–234). Panels (a,b) and (c,d) show the irr1 and irr2 plots, respectively. The red and blue dashed vertical lines indicate the rewatering times for the irr1 and irr2 treatments, respectively.
The AMR can also reflect changes in water stress, but its ability differs from that of the NMR. Figure 15c,d shows the variations in the AMR index with changes in the RSM. Owing to the occurrence of a cloudy afternoon on DOY 226, the changes in sunlight were very rapid. Hence, the AMR values for that day were unreliable. The response of the AMR to RSM changes was less sensitive than that of the NMR. In the irr2 plot, water stress was higher than that in the irr1 plot. Consequently, except for the AMR of , the AMRs of (), , and all decreased with decreasing RSM. However, for the irr1 plot with relatively mild water stress, the changes in the AMR were not significant, except for . Therefore, the diurnal variation characteristic (AMR) exhibits a lower sensitivity for early water stress detection than that of the NMR.
Since the midday (12:00 to 14:00) mean canopy–air temperature difference () can reflect changes in water stress, we also used this difference to evaluate the ability of the NMR and AMR of different canopy remote sensing observations to monitor water stress. Figure 16a shows the correlations and slopes between and , , , and on clear days over the observation period across the two plots. Among these, the coefficient of determination (R2) represents the degree of correlation between the changes in the index and water stress, while the slope (a) indicates the range of changes in different indices under the same water stress conditions, characterizing the sensitivity of the index to water stress. The results indicated that and exhibited weak correlations with . Notably, showed a slight negative correlation with . In contrast, the structurally based vegetation index, , demonstrated a highly negative correlation with . The regression slopes of were similar to those of , but exhibited overall lower values., which incorporates both structural and physiological information, exhibited negative correlations, and compared with those of the other observations, the slope was higher.
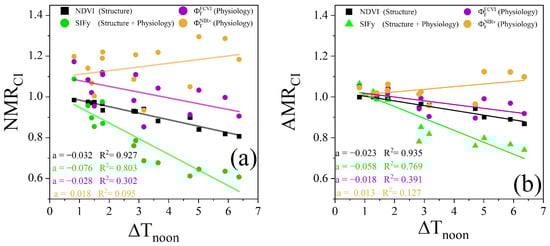
Figure 16.
The Relationships between and NMR (a), and AMR (b) for the two plots during the clear-sky observation period. The solid lines in different colors denote the linear regression fits for the various types of the NMR and AMR, with regression slopes ( and correlation coefficients shown in the lower-left corner.
Compared with that of the NMR, the relationship between the AMR and differed. The slope of the relationship between the NMR and was higher than that of the relationship with the AMR for the corresponding canopy remote sensing observations. Except for the NMR of , the NMR of the other observations decreased to a greater extent with increasing . Under mild water stress (with less than 2 °C), the AMR of the different types of canopy remote sensing observations remained close to 1 compared with the NMR, showing smaller changes (Figure 16b). This finding indicates that the sensitivity of the AMR to water stress is lower than that of the NMR.
4. Discussion
4.1. Effectiveness of the Morning-to-Noon Ratio for Monitoring Drought Stress
Liu et al. introduced the NMR concept and preliminarily validated its effectiveness in assessing daily water stress conditions [12]. Building on this foundation, this study offers a more comprehensive understanding of the mechanisms underlying the effectiveness of the NMR for monitoring water stress in maize canopies, which is supported by systematic observations at both the leaf and canopy scales. Our results demonstrated that remote sensing technology can be used to observe changes in the vegetation structure and physiology in response to drought, which together influence the diurnal dynamics captured by the NMR (Figure 5 and Figure 6, respectively).
With respect to the canopy structure, our observations of maize at the leaf scale revealed that the most severe leaf rolling occurred at noon because of water stress, with the severity of rolling progressively increasing with increasing water stress. Furthermore, leaf rolling recovered the next day following nocturnal rehydration, and the leaves remained unrolled throughout the day (Figure 5). At the canopy scale, the midday NDVI values associated with the vegetation structure also exhibited similar changes (bb). These findings indicate that the midday values of the NDVI related to the vegetation structure can effectively reflect rapid changes in the water stress status. However, differences in the vegetation LAI and chlorophyll content caused by historical stress can also lead to declines in the midday NDVI values, potentially interfering with the assessment of water stress. Therefore, relying solely on abnormal declines in the midday NDVI values to assess water stress conditions may lead to inaccuracy. Dividing by the measured morning NDVI values may effectively mitigate the interference caused by this issue. As shown in Figure 5, when the minimal environmental stress occurred in the morning, leaves remained relatively unfolded under the different water stress levels. This occurs because nocturnal transpiration is associated with less water consumption, allowing vegetation to absorb soil moisture and restore the leaf water potential to a relatively high level during the day [46,47]. At the canopy scale, the NDVI in the morning also exhibited similar response characteristics to water stress (b, respectively). The NDVI values measured in the morning provide information on the LAI and chlorophyll content, which are minimally affected by water stress on a given day. Therefore, when the morning NDVI values are employed as a baseline, can effectively reduce the influence of historical stress and reflect daily changes in water stress levels (Figure 15 and Figure 16). In addition to leaf rolling, vegetation may employ other methods to adjust the canopy structure. Xu et al. (2021) reported changes in the LAD under drought conditions in potatoes, with smaller increases in the LAD in the morning and the greatest increases observed at noon [37]. This suggests that the NDVI of potato canopies may also exhibit diurnal variations similar to those observed in the maize canopy. Therefore, the NMR of canopy remote sensing observations, which reflect the diurnal variation in the vegetation structure, can be used to effectively monitor daily water stress levels in vegetation.
In terms of vegetation physiology, our observations at the leaf scale revealed that the extent of the decline in caused by water stress varied significantly throughout the day. In the absence of water stress, these parameters remained stable throughout the day. In contrast, under water stress, higher values were maintained in the morning, but these values decreased significantly at noon (Figure 6e). Canopy fluorescence remote sensing observations, such as those of SIFy and , also exhibited similar diurnal trends (Figure 8b,d). This suggests that in the morning, when the environmental stress is minimal, the impact of water stress on fluorescence is relatively limited, whereas the midday fluorescence shows a heightened sensitivity to water stress. Nevertheless, water stress monitoring solely on the basis of the midday decline in fluorescence is not reliable. During different growing seasons, the energy allocation proportions of vegetation also vary, leading to differences in [48]. By applying the physiological state of vegetation in the morning, when it is less affected by water stress, as a baseline, the impact of seasonal variations can be reduced. Therefore, the diurnal variation characteristics of canopy fluorescence, represented by and , can be used to effectively monitor changes in water stress at the daily scale (Figure 15 and Figure 16, respectively). Therefore, NMR data of remote sensing observations related to vegetation physiological processes can serve as effective indicator data for minimizing interference from non-drought factors and for accurately monitoring the water stress status over the measurement period.
In summary, by using information obtained in the morning of the measurement day, when structural and physiological impacts from water stress are minimal, as a baseline, we can eliminate differences in the vegetation structure and physiology caused by historical stress. The information obtained at noon effectively highlights changes in vegetation due to water stress. Therefore, the NMR can be used to assess the water stress status effectively on the measurement day.
Besides the NMR, the AMR, which shifts the calculation time window from noon to afternoon, is also a potential alternative for daily water stress monitoring. We compared the NMR and AMR within the maize canopy, demonstrating that the AMR is less responsive to daily water stress in vegetation (Figure 15 and Figure 16). Evidence from Figure 7 and Figure 8 indicates that water stress is more pronounced at midday than in the afternoon in the maize canopy. These results indicate that the NMR is more effective for monitoring water stress in maize canopies. Further research by Lin et al. analyzed the diurnal variation curves of the far-red SIF, focusing on aspects such as the slopes on either side of the curve, the size of curve opening, and the timing of the peak. They reported that under water stress, the peak timing of far-red SIF shifts earlier, with diminished peak values, an expanded curve, and a decreased slope on the right [16]. However, it is challenging to obtain the high-quality, continuous intraday observations necessary to accurately assess these diurnal variations. Therefore, the NMR may offer a more practical and operationally viable method for drought monitoring, given the current technological capabilities.
4.2. Sensitivity of the Noon-to-Morning Ratio in Drought Monitoring Across Different Remote Sensing Observations
Our results indicated that the NMR data of the NDVI, SIFy, and can be used to monitor water stress in maize canopies. However, their sensitivities to changes in water stress differed (Figure 15). Recent studies have revealed that , which is more closely related to vegetation physiology, may exhibit greater sensitivity to drought compared to SIFy [17]. Our results indicated that , which contains information on both the vegetation structure and physiology, was most sensitive to water stress (Figure 16). This may occur because SIFy reflects the synergistic inhibitory effects of water stress on both the vegetation structure and physiology. Our leaf-scale observations also indicated that both the vegetation structure and leaf physiology respond simultaneously to water stress. Compared to non-water stress conditions, , which reflects vegetation physiological status, decreases significantly at noon under water stress, accompanied by noticeable leaf rolling. In contrast, both and leaf rolling in the morning show minimal differences compared to non-water stress conditions (Figure 5 and Figure 6, respectively). With respect to the components of SIFy, both fPAR and are related to the canopy structure. The diurnal variation trends of LRR and indicate that both vegetation structure and physiology respond to water stress. However, their responses to drought and their respective impacts on SIFy differ. At the leaf scale, as water stress increases, the midday LRR value exhibits a larger decrease in ratio relative to the morning value compared to the corresponding decrease in . This suggests that structural changes may play a more dominant role. There are also differences in the timing of the daily maximum values of LRR and . As water stress progresses, the peak of shifts to earlier than 10:00, which differs from the pattern of LRR (Figure 5 and Figure 6d). The highest LRR value typically appears early in the morning due to overnight recovery. Although some studies suggest that plant physiology responds more rapidly to drought in its early stages, the response of plant structure to early drought typically lags behind that of vegetation physiology [49]. However, the maize canopy structure and physiology did not show a scenario in the early stages of drought where the fluorescence efficiency changed while the structure remained unchanged in our data. Therefore, this is insufficient to conclude that fluorescence responds more rapidly than structural changes. Further exploration and research are needed for other vegetation types. The simulation analysis results of the SCOPE model indicated that the LAI was positively correlated with SIFy (Figure 12a). This suggests that, although may increase due to a reduction in the LAI, the product of fPAR and is positively correlated with the LAI. Drought leads to a reduction in the LRR, which indicates a decrease in the LAI (Figure 5). Therefore, water stress exerts an inhibitory effect on SIFy. For the physiological components of SIFy, the relationships between the vegetation Fqe and SIFy values exhibited highly positive correlations (Figure 12b). Leaf-level physiological observations also demonstrated that water stress caused a decrease in Fs (Figure 6f), indicating that water stress not only suppresses the development of the canopy structure but also suppresses physiological processes. The study of Xu et al. on potatoes also demonstrated that the decline in the SIF under drought conditions is the result of the combined effect of and LAD [37]. Therefore, from the perspective of drought monitoring, the NMR of remote sensing observations, which comprehensively reflect both the vegetation structure and physiology, may be more effective for monitoring drought.
We found that during periods of severe drought, the high Fs values in the morning slightly decreased (Figure 11). This may result in the use of causing underestimation of water stress under severe drought conditions. This phenomenon could be attributed to the increased NPQ resulting from water stress, which caused a shift in the morning peak of Fs (Figure 12b). Previous studies have shown that and are negatively correlated under low-NPQ conditions, whereas the opposite is true under high-NPQ conditions [50]. Our results indicated that the diurnal variation in decreased with increasing light intensity, whereas first increased but then decreased, with its peak occurring in the morning (Figure 6b,d). This finding is consistent with those of previous studies. This suggests that remains relatively high in the morning. Although the morning peak shifted earlier under severe drought conditions, causing the morning SIFy values to be slightly lower, they were still less affected by water stress than were the midday values. Therefore, we propose that is an effective approach for monitoring water stress changes.
In this study, the correlations between the values decoupled by the two methods and the leaf-scale Fs values notably differed. Among them, exhibited a greater correlation with Fs, indicating a positive relationship, but the correlations of both and with Fs were not high (Figure 14). This finding indicates that is more accurate than is in reflecting canopy physiological information. Yang (2020) compared these two indices via a simulated dataset and reported that the FCVI yielded a smaller error in estimating the fluorescence emission efficiency than did NIRv [20]. The error of using the NIRv is generally greater for canopies with higher vegetation coverage. Changes in the diurnal variation in the LAI caused by water stress can lead to differences in the accuracy of estimates at different times of the day. This may explain why the diurnal variation pattern of was less sensitive to changes in water stress (Figure 8). This suggests that the uncertainties in the FCVI and NIRv approaches in estimating might also contribute to the inaccuracies in and in water stress monitoring. Therefore, although can represent changes in water stress, its stability and sensitivity are inferior to those of (Figure 15 and Figure 16, respectively). Since can capture both structural and physiological changes in vegetation, it encompasses more aspects of the vegetation’s response to water stress compared to other indices. Therefore, demonstrates greater sensitivity in monitoring daily drought conditions and may be applicable to a wider range of vegetation types. We recommend the use of , that integrates both vegetation and physiological information, for drought monitoring.
4.3. Limitations and Future Applications
Varying responses of vegetation types and indices introduce uncertainties in daily water stress monitoring. The diurnal variations of vegetation structure and physiology in response to water stress differ among vegetation types such as grasslands, forests, and maize [12,17,23]. For instance, Pan et al. reported that the AMR in cork oak was more sensitive to water stress due to partial stomatal reopening [23], which contrasts with our findings of a higher sensitivity of the NMR in the maize canopy to water stress. Such findings reflect different structural and physiological responses to drought between woody and non-woody plants. Therefore, it is crucial to conduct additional field experiments to validate the applicability of the NMR across various vegetation types. Our findings indicate that the sensitivity of the NMR to daily water stress differs significantly among these indices (Figure 15 and Figure 16). Therefore, future research must focus on exploring additional indices to enhance the effectiveness of the NMR in monitoring daily water stress, for example, the Photochemical Reflectance Index (PRI) [48].
This study demonstrated that the degree of drought on a given day can be accurately assessed by integrating the intraday variations in both the physiological and structural characteristics of vegetation. This finding has significant implications for the future advancement and application of drought remote sensing technologies. In the realm of drought detection via remote sensing, it is crucial to focus on the acquisition of intraday multi-temporal data. For small-scale areas, such data can be collected using unmanned aerial vehicle (UAV) remote sensing systems [51]. However, for larger areas or global scales, the development of geostationary satellites and satellite constellations may be necessary to enhance temporal resolution [52,53]. In terms of practical applications, minimizing the interference from historical drought events and crop growth allows for a more precise evaluation of the actual water deficit on a given day. This, in turn, can aid in the guidance of precision irrigation strategies, promoting increased crop yield while optimizing the use of water resources.
5. Conclusions
This study demonstrated, via controlled hydration experiments of maize canopies, the effectiveness of using the diurnal variations in canopy structure and physiological remote sensing observations to monitor daily water stress levels. These observations include measurements at both the leaf and canopy scales. It was investigated whether SIFy, which integrates diurnal changes in both the canopy structure and physiology, is more effective or if , which solely reflects physiological changes, is preferable. The results demonstrated that the consideration of the diurnal variation characteristics of the NMR can eliminate the influence of historical stress, thus facilitating the effective monitoring of the water stress level on the measurement day. This occurs because vegetation in the morning is less affected by water stress, providing stable information such as the LAI and chlorophyll content, which reflects the impact of historical stress. Conversely, the values obtained at noon primarily represent the changes in vegetation due to water stress on the measurement day. Remote sensing observations that integrate both canopy structure and physiological information, such as , are more suitable for monitoring the daily water stress status. Furthermore, we confirmed that the diurnal variation trends of did not significantly change under varying conditions of water stress in maize canopies. Therefore, we recommend the use of the NMR of remote sensing observations that integrate both vegetation structure and physiological information to monitor daily water stress levels. In summary, the diurnal variations in the vegetation structure and physiology exhibit significant potential for accurately monitoring daily water stress levels and eliminating the influence of non-drought factors. This information is crucial for understanding the development of drought and implementing precise irrigation strategies.
Supplementary Materials
The following supporting information can be downloaded at: https://www.mdpi.com/article/10.3390/rs17040565/s1.
Author Contributions
Conceptualization, J.W. and Z.L.; methodology, J.W.; formal analysis, Z.L.; investigation, J.W. and H.J.; resources, J.W., H.J., H.Z., T.G., R.Z., D.H. and H.Z.; writing—original draft preparation, J.W.; writing—review and editing, J.W., Z.L., P.Y., S.X. and H.J.; visualization, J.W.; supervision, Z.L.; project administration, Z.L.; funding acquisition, Z.L. All authors have read and agreed to the published version of the manuscript.
Funding
This research was funded by the Natural Science Foundation of China (Grant No. 42471379, 42071402) and National Key Research and Development Program of China (Grant No. 2023YFF1303603).
Data Availability Statement
The data presented in this study are available on request from the corresponding author. The data are not publicly available due to privacy.
Acknowledgments
We thank the anonymous reviewers for their constructive comments. We are also grateful to the Natural Science Foundation of China and National Key Research and Development Program of China for their support.
Conflicts of Interest
The authors declare no conflict of interest.
References
- Bian, Z.; Roujean, J.L.; Fan, T.; Dong, Y.; Hu, T.; Cao, B.; Li, H.; Du, Y.; Xiao, Q.; Liu, Q. An angular normalization method for temperature vegetation dryness index (TVDI) in monitoring agricultural drought. Remote Sens. Environ. 2023, 284, 113330. [Google Scholar] [CrossRef]
- Zscheischler, J.; Mahecha, M.D.; Von Buttlar, J.; Harmeling, S.; Jung, M.; Rammig, A.; Randerson, J.T.; Schölkopf, B.; Seneviratne, S.I.; Tomelleri, E.; et al. A few extreme events dominate global interannual variability in gross primary production. Environ. Res. Lett. 2014, 9, 35001–35013. [Google Scholar] [CrossRef]
- Zhou, S.; Zhang, Y.; Park Williams, A.; Gentine, P. Projected increases in intensity, frequency, and terrestrial carbon costs of compound drought and aridity events. Sci. Adv. 2019, 5, eaau5740. [Google Scholar] [CrossRef]
- Rhee, J.; Im, J.; Carbone, G.J. Monitoring agricultural drought for arid and humid regions using multi-sensor remote sensing data. Remote Sens. Environ. 2010, 114, 2875–2887. [Google Scholar] [CrossRef]
- Nanzad, L.; Zhang, J.; Tuvdendorj, B.; Nabil, M.; Zhang, S.; Bai, Y. NDVI anomaly for drought monitoring and its correlation with climate factors over Mongolia from 2000 to 2016. J. Arid Environ. 2019, 164, 69–77. [Google Scholar] [CrossRef]
- Jiang, Z.; Huete, A.R.; Didan, K.; Miura, T. Development of a two-band enhanced vegetation index without a blue band. Remote Sens. Environ. 2008, 112, 3833–3845. [Google Scholar] [CrossRef]
- Kogan, F.N. Global Drought Watch from Space. B. Am. Meteorol. Soc. 1997, 78, 621–636. [Google Scholar] [CrossRef]
- Urban, L.; Aarrouf, J.; Bidel, L. Assessing the Effects of Water Deficit on Photosynthesis Using Parameters Derived from Measurements of Leaf Gas Exchange and of Chlorophyll a Fluorescence. Front. Plant Sci. 2017, 8, 2068. [Google Scholar] [CrossRef]
- Flexas, J.; Medrano, H. Drought-inhibition of photosynthesis in C3 plants: Stomatal and non-stomatal limitations revisited. Ann Bot. 2002, 89, 183–189. [Google Scholar] [CrossRef] [PubMed]
- Xu, S.; Liu, Z.; Zhao, L.; Zhao, H.; Ren, S. Diurnal Response of Sun-Induced Fluorescence and PRI to Water Stress in Maize Using a Near-Surface Remote Sensing Platform. Remote Sens. 2018, 10, 1510. [Google Scholar] [CrossRef]
- Quiring, S.M.; Ganesh, S. Evaluating the utility of the Vegetation Condition Index (VCI) for monitoring meteorological drought in Texas. Agric. For. Meteorol. 2010, 150, 330–339. [Google Scholar] [CrossRef]
- Liu, Z.; He, X.; Yang, P.; Jiang, H.; Xu, S.; Zhao, H.; Ren, S.; Chen, M. Diurnal Pattern of Sun-Induced Chlorophyll Fluorescence as Reliable Indicators of Crop Water Stress. IEEE Geosci. Remote Sens. 2023, 20, 2503805. [Google Scholar] [CrossRef]
- Sun, Y.; Fu, R.; Dickinson, R.; Joiner, J.; Frankenberg, C.; Gu, L.; Xia, Y.; Fernando, N. Drought onset mechanisms revealed by satellite solar-induced chlorophyll fluorescence: Insights from two contrasting extreme events. J. Geophys. Res. Biogeosci. 2015, 120, 2427–2440. [Google Scholar] [CrossRef]
- Zhang, Y.; Joiner, J.; Alemohammad, S.H.; Zhou, S.; Gentine, P. A global spatially contiguous solar-induced fluorescence (CSIF) dataset using neural networks. Biogeosciences 2018, 15, 5779–5800. [Google Scholar] [CrossRef]
- Song, L.; Guanter, L.; Guan, K.; You, L.; Huete, A.; Ju, W.; Zhang, Y. Satellite sun-induced chlorophyll fluorescence detects early response of winter wheat to heat stress in the Indian Indo-Gangetic Plains. Glob. Change Biol. 2018, 24, 4023–4037. [Google Scholar] [CrossRef]
- Lin, J.; Zhou, L.; Wu, J.; Han, X.; Zhao, B.; Chen, M.; Liu, L. Water stress significantly affects the diurnal variation of solar-induced chlorophyll fluorescence (SIF): A case study for winter wheat. Sci. Total Environ. 2024, 908, 168256. [Google Scholar] [CrossRef]
- Zhang, Y.; Cai, M.; Xiao, X.; Yang, X.; Migliavacca, M.; Basara, J.; Zhou, S.; Deng, Y. Immediate and lagged vegetation responses to dry spells revealed by continuous solar-induced chlorophyll fluorescence observations in a tall-grass prairie. Remote Sens. Environ. 2024, 305, 114080. [Google Scholar] [CrossRef]
- Zhang, Y.; Xiao, X.; Zhou, S.; Ciais, P.; McCarthy, H.; Luo, Y. Canopy and physiological controls of GPP during drought and heat wave. Geophys. Res. Lett. 2016, 43, 3325–3333. [Google Scholar] [CrossRef]
- Stocker, B.D.; Zscheischler, J.; Keenan, T.F.; Prentice, I.C.; Penuelas, J.; Seneviratne, S.I. Quantifying soil moisture impacts on light use efficiency across biomes. New Phytol. 2018, 218, 1430–1449. [Google Scholar] [CrossRef] [PubMed]
- Yang, P.; Van der Tol, C.; Campbell, P.K.E.; Middleton, E.M. Fluorescence Correction Vegetation Index (FCVI): A physically based reflectance index to separate physiological and non-physiological information in far-red sun-induced chlorophyll fluorescence. Remote Sens. Environ. 2020, 240, 111676. [Google Scholar] [CrossRef]
- Zeng, Y.; Badgley, G.; Dechant, B.; Ryu, Y.; Chen, M.; Berry, J.A. A practical approach for estimating the escape ratio of near-infrared solar-induced chlorophyll fluorescence. Remote Sens. Environ. 2019, 232, 111209. [Google Scholar] [CrossRef]
- Kimm, H.; Guan, K.; Jiang, C.; Miao, G.; Wu, G.; Suyker, A.E.; Ainsworth, E.A.; Bernacchi, C.J.; Montes, C.M. A physiological signal derived from sun-induced chlorophyll fluorescence quantifies crop physiological response to environmental stresses in the US Corn Belt. Environ. Res. Lett. 2021, 16, 124051. [Google Scholar] [CrossRef]
- Pan, Q.; Cheng, X.; Hu, M.; Liu, L.; Wang, X.; Zhang, J.; Li, Z.; Yuan, W.; Gao, X. The Afternoon/Morning Ratio of Tower-Based Solar-Induced Chlorophyll Fluorescence Can Be Used to Monitor Drought in a Chinese Cork Oak Plantation. Remote Sens. 2024, 16, 1897. [Google Scholar] [CrossRef]
- Zhao, L.; Liu, Z.; Xu, S.; He, X.; Ni, Z.; Zhao, H.; Ren, S. Retrieving the Diurnal FPAR of a Maize Canopy from the Jointing Stage to the Tasseling Stage with Vegetation Indices under Different Water Stresses and Light Conditions. Sensors 2018, 18, 3965. [Google Scholar] [CrossRef] [PubMed]
- Wieneke, S.; Pacheco-Labrador, J.; Mahecha, M.D.; Poblador, S.; Vicca, S.; Janssens, I.A. Comparing the quantum use efficiency of red and far-red sun-induced fluorescence at leaf and canopy under heat-drought stress. Remote Sens. Environ. 2024, 311, 114294. [Google Scholar] [CrossRef]
- Suon, S.; Li, Y.; Porn, L.; Javed, T. Spatiotemporal Analysis of Soil Moisture Drought over China during 2008–2016. J. Water Resour. Prot. 2019, 11, 700–712. [Google Scholar] [CrossRef][Green Version]
- Smith, M.; Allen, R.; Pereira, L. Revised FAO Methodology for Crop-Water Requirements; International Atomic Energy Agency (IAEA): Vienna, Austria, 1998. [Google Scholar]
- Han, S.; Liu, Z.; Chen, Z.; Jiang, H.; Xu, S.; Zhao, H.; Ren, S. Using High-Frequency PAR Measurements to Assess the Quality of the SIF Derived from Continuous Field Observations. Remote Sens. 2022, 14, 2083. [Google Scholar] [CrossRef]
- Porcar-Castell, A.; Pfündel, E.; Korhonen, J.F.J.; Juurola, E. A new monitoring PAM fluorometer (MONI-PAM) to study the short- and long-term acclimation of photosystem II in field conditions. Photosynth. Res. 2008, 96, 173–179. [Google Scholar] [CrossRef]
- Van der Tol, C.; Verhoef, W.; Timmermans, J.; Verhoef, A.; Su, Z.B. An integrated model of soil-canopy spectral radiances, photosynthesis, fluorescence, temperature and energy balance. Biogeosciences 2009, 6, 3109–3129. [Google Scholar] [CrossRef]
- Yang, P.; Prikaziuk, E.; Verhoef, W.; Van der Tol, C. SCOPE 2.0: A model to simulate vegetated land surface fluxes and satellite signals. Geosci. Model Dev. 2021, 14, 4697–4712. [Google Scholar] [CrossRef]
- Tucker, C.J.; Vanpraet, C.L.; Sharman, M.J.; Van Ittersum, G. Satellite remote sensing of total herbaceous biomass production in the senegalese sahel: 1980–1984. Remote Sens. Environ. 1985, 17, 233–249. [Google Scholar] [CrossRef]
- Badgley, G.; Field, C.B.; Berry, J.A. Canopy near-infrared reflectance and terrestrial photosynthesis. Sci. Adv. 2017, 3, e1602244. [Google Scholar] [CrossRef]
- Viña, A.; Gitelson, A.A. New developments in the remote estimation of the fraction of absorbed photosynthetically active radiation in crops. Geophys. Res. Lett. 2005, 32, L17403. [Google Scholar] [CrossRef]
- Meroni, M.; Busetto, L.; Colombo, R.; Guanter, L.; Moreno, J.; Verhoef, W. Performance of Spectral Fitting Methods for vegetation fluorescence quantification. Remote Sens. Environ. 2010, 114, 363–374. [Google Scholar] [CrossRef]
- Zhang, Y.; Fang, J.; Smith, W.K.; Wang, X.; Gentine, P.; Scott, R.L.; Migliavacca, M.; Jeong, S.; Litvak, M.; Zhou, S. Satellite solar-induced chlorophyll fluorescence tracks physiological drought stress development during 2020 southwest US drought. Glob. Change Biol. 2023, 29, 3395–3408. [Google Scholar] [CrossRef] [PubMed]
- Xu, S.; Atherton, J.; Riikonen, A.; Zhang, C.; Oivukkamaki, J.; MacArthur, A.; Honkavaara, E.; Hakala, T. Structural and photosynthetic dynamics mediate the response of SIF to water stress in a potato crop. Remote Sens. Environ. 2021, 263, 112555. [Google Scholar] [CrossRef]
- Sims, D.A.; Luo, H.; Hastings, S.; Oechel, W.C.; Rahman, A.F.; Gamon, J.A. Parallel adjustments in vegetation greenness and ecosystem CO2 exchange in response to drought in a Southern California chaparral ecosystem. Remote Sens. Environ. 2006, 103, 289–303. [Google Scholar] [CrossRef]
- Miao, G.; Guan, K.; Yang, X.; Bernacchi, C.J.; Berry, J.A.; DeLucia, E.H.; Wu, J.; Moore, C.E.; Meacham, K.; Cai, Y.; et al. Sun-Induced Chlorophyll Fluorescence, Photosynthesis, and Light Use Efficiency of a Soybean Field from Seasonally Continuous Measurements. J. Geophys. Res. Biogeosci. 2018, 123, 610–623. [Google Scholar] [CrossRef]
- Baker, N.R. Chlorophyll Fluorescence: A Probe of Photosynthesis In Vivo. Annu. Rev. Plant Biol. 2008, 59, 89–113. [Google Scholar] [CrossRef] [PubMed]
- Genty, B.; Briantais, J.; Baker, N.R. The relationship between the quantum yield of photosynthetic electron transport and quenching of chlorophyll fluorescence. Biochim. Et Biophys. Acta (Bba) Gen. Subj. 1989, 990, 87–92. [Google Scholar] [CrossRef]
- Hendrickson, L.; Furbank, R.T.; Chow, W.S. simple alternative approach to assessing the fate of absorbed light energy using chlorophyll fluorescence. Photosynth. Res. 2004, 82, 73–81. [Google Scholar] [CrossRef]
- Porcar-Castell, A. A high-resolution portrait of the annual dynamics of photochemical and non-photochemical quenching in needles of Pinus sylvestris. Physiol Plant. 2011, 143, 139–153. [Google Scholar] [CrossRef] [PubMed]
- Atherton, J.; Nichol, C.J.; Porcar-Castell, A. Using spectral chlorophyll fluorescence and the photochemical reflectance index to predict physiological dynamics. Remote Sens. Environ. 2016, 176, 17–30. [Google Scholar] [CrossRef]
- Liu, Z.; Zhao, F.; Liu, X.; Yu, Q.; Wang, Y.; Peng, X.; Cai, H.; Lu, X. Direct estimation of photosynthetic CO2 assimilation from solar-induced chlorophyll fluorescence (SIF). Remote Sens. Environ. 2022, 271, 112893. [Google Scholar] [CrossRef]
- Wang, Y.; Zeng, Y.; Yu, L.; Yang, P.; Van der Tol, C.; Yu, Q.; Lu, X.; Cai, H.; Su, A.Z. Integrated modeling of canopy photosynthesis, fluorescence, and the transfer of energy, mass, and momentum in the soil–plant–atmosphere continuum (STEMMUS–SCOPE v1.0.0). Geosci. Model Dev. 2021, 14, 1379–1407. [Google Scholar] [CrossRef]
- Tuzet, A.; Perrier, A.; Leuning, R. A coupled model of stomatal conductance, photosynthesis and transpiration. Plant Cell Environ. 2003, 26, 1097–1116. [Google Scholar] [CrossRef]
- Gamon, J.A.; Penuelas, J.; Field, C.B. A narrow-waveband spectral index that tracks diurnal changes in photosynthetic efficiency. Remote Sens. Environ. 1992, 41, 35–44. [Google Scholar] [CrossRef]
- Gu, H.; Yin, G.; Yang, Y.; Verger, A.; Descals, A.; Filella, I.; Zeng, Y.; Hao, D.; Xie, Q.; Li, X.; et al. Satellite-Detected Contrasting Responses of Canopy Structure and Leaf Physiology to Drought. IEEE J.-Stars 2023, 16, 2427–2436. [Google Scholar] [CrossRef]
- Porcar-Castell, A.; Tyystjärvi, E.; Atherton, J.; van der Tol, C.; Flexas, J.; Pfündel, E.E.; Moreno, J.; Frankenberg, C.; Berry, J.A. Linking chlorophyll a fluorescence to photosynthesis for remote sensing applications: Mechanisms and challenges. J. Exp. Bot. 2014, 65, 4065–4095. [Google Scholar] [CrossRef] [PubMed]
- Zarco-Tejada, P.J.; González-Dugo, V.; Berni, J.A.J. Fluorescence, temperature and narrow-band indices acquired from a UAV platform for water stress detection using a micro-hyperspectral imager and a thermal camera. Remote Sens. Environ. 2012, 117, 322–337. [Google Scholar] [CrossRef]
- Sun, Y.; Wen, J.; Gu, L.; Joiner, J.; Chang, C.Y.; van der Tol, C.; Porcar Castell, A.; Magney, T.; Wang, L.; Hu, L.; et al. From remotely-sensed solar-induced chlorophyll fluorescence to ecosystem structure, function, and service: Part II—Harnessing data. Glob. Change Biol. 2023, 29, 2893–2925. [Google Scholar] [CrossRef] [PubMed]
- Paek, S.W.; Kronig, L.G.; Ivanov, A.B.; de Weck, O.L. Satellite constellation design algorithm for remote sensing of diurnal cycles phenomena. Adv. Space Res. 2018, 62, 2529–2550. [Google Scholar] [CrossRef]


Disclaimer/Publisher’s Note: The statements, opinions and data contained in all publications are solely those of the individual author(s) and contributor(s) and not of MDPI and/or the editor(s). MDPI and/or the editor(s) disclaim responsibility for any injury to people or property resulting from any ideas, methods, instructions or products referred to in the content. |
© 2025 by the authors. Licensee MDPI, Basel, Switzerland. This article is an open access article distributed under the terms and conditions of the Creative Commons Attribution (CC BY) license (https://creativecommons.org/licenses/by/4.0/).