Article

Early Detection of Water Stress in Kauri Seedlings Using Multitemporal Hyperspectral Indices and Inverted Plant Traits

by
Mark Jayson B. Felix
1,*,
Russell Main
1,
Michael S. Watt
2,
Mohammad-Mahdi Arpanaei
3 and
Taoho Patuawa
4
1
Scion, Rotorua 49 Sala Street, Rotorua 3046, New Zealand
2
Scion, 10 Kyle St, Christchurch 8011, New Zealand
3
Department of Environmental Science and Policy, Università degli Studi di Milano, 20122 Milano, Italy
4
Te Iwi o Te Roroa, PO Box 6, Waimamaku 0446, New Zealand
*
Author to whom correspondence should be addressed.
Remote Sens. 2025, 17(3), 463; https://doi.org/10.3390/rs17030463
Submission received: 29 November 2024 / Revised: 25 January 2025 / Accepted: 28 January 2025 / Published: 29 January 2025
(This article belongs to the Section Environmental Remote Sensing)

Abstract

:
Global climate variability is projected to result in more frequent and severe droughts, which can have adverse effects on New Zealand’s endemic tree species such as the iconic kauri (Agathis australis). Several studies have investigated the physiological response of kauri to medium- and long-term water stress; however, no research has used hyperspectral technology for the early detection and characterization of water stress in this species. In this study, physiological (stomatal conductance (gs), assimilation rate (A), equivalent water thickness (EWT)) and leaf-level hyperspectral measurements were recorded over a ten-week period on 100 potted kauri seedlings subjected to control (well-watered) and drought treatments. In addition, plant functional traits (PTs) were retrieved from spectral reflectance data via inversion of the PROSPECT-D radiative transfer model. These data were used to (i) identify key PTs and narrow-band hyperspectral indices (NBHIs) associated with the expression of water stress and (ii) develop classification models based on single-date and multitemporal datasets for the early detection of water stress. A significant decline in soil water content and physiological responses (gs and A) occurred among the trees in the drought treatment in weeks 2 and 4, respectively. Although no significant treatment differences (p > 0.05) were observed in EWT across the whole duration of the experiment, lower mean values in the drought treatment were apparent from week 4 onwards. In contrast, several spectral bands and NBHIs exhibited significant differences the week after water was withheld. The number and category of significant NBHIs varied up to week 4, after which a substantial increase in the number of significant indices was observed until week 10. However, despite this increase, the single-date models did not show good model performance (F1 score > 0.70) until weeks 9 and 10. In contrast, when multitemporal datasets were used, the classification performance ranged from good to outstanding from weeks 2 to 10. This improvement was largely due to the enhanced temporal and feature representation in the multitemporal models. Among the input NBHIs, water indices emerged as the most important predictors, followed by photochemical indices. Furthermore, a comparison of inverted and measured EWT showed good correspondence (mean absolute percentage error (MAPE) = 8.49%, root mean squared error (RMSE) = 0.0026 g/cm2), highlighting the potential use of radiative transfer modelling for high-throughput drought monitoring. Future research is recommended to scale these measurements to the canopy level, which could prove valuable in detecting and characterizing drought stress at a larger scale.

1. Introduction

Kauri trees (Agathis australis) hold a significant place in New Zealand’s natural and cultural heritage [1]. These ancient conifers are among the largest and longest-living tree species in the world, with some individuals exceeding 1200 years in age. Kauri trees are a keystone species in their ecosystems, supporting a rich biodiversity that includes unique flora and fauna [1]. They also play a crucial role in carbon sequestration, contributing to the regulation of the global carbon cycle [2]. Kauri trees are also deeply revered in the Māori culture, where they are considered a taonga (treasure) species, and their wood and resin have been used for traditional purposes for centuries [3]. The preservation of kauri forests is thus not only vital for maintaining biodiversity but also for protecting the cultural heritage and natural landscapes of New Zealand.
Climate variability presents a significant threat to the survival of kauri trees. Rising temperatures and altered precipitation patterns are expected to increase the frequency and severity of droughts, which could severely impact the health of these trees. Prolonged drought conditions can lead to reduced growth, physiological stress, and increased vulnerability to disease [4,5,6]. Additionally, climate change may exacerbate the spread of pathogens and pests that affect kauri, further compromising their resilience. The combination of these factors could lead to a decline in kauri populations, with potentially devastating effects on the ecosystems they support [7,8].
Given the multiple stressors affecting kauri trees, early detection of stress is essential for effective conservation efforts. Hyperspectral technology offers a promising tool for monitoring the health of kauri trees by detecting subtle changes in their physiological state before visible symptoms appear. Hyperspectral spectroscopy quantifies reflectance across a wide range of wavelengths, allowing for the identification of specific spectral signatures associated with stress, such as changes in leaf pigments, water content, and photosynthetic activity [9,10,11,12,13]. This non-invasive technique can provide valuable insights into the health of kauri trees, enabling timely interventions to mitigate the effects of stressors such as disease and drought. Through providing a precise and efficient method for detecting early signs of stress, hyperspectral technology can play a crucial role in the conservation and management of kauri, both in nursery and forest settings.
Radiative transfer models simulate how light interacts with plant canopies, enabling the inversion process to retrieve biophysical and biochemical plant functional traits (PTs), such as vegetation structure, chlorophyll content, and water status, which are directly linked to plant health and stress response [14,15,16,17]. When combined with hyperspectral indices, the inverted PTs add a physiological layer of insight, enhancing the sensitivity and specificity of stress detection. This synergistic approach allows for more precise monitoring of early stress signals, such as drought, nutrient deficiency, or disease, before they become visibly apparent [13,15,18,19]. This framework improves the accuracy of stress detection, offering a more comprehensive assessment of crop and forest health under changing environmental conditions.
While previous studies have investigated the physiological response of kauri to medium- and long-term drought, we are unaware of studies that deal with the early detection of drought stress using hyperspectral techniques in this endemic species [20,21]. This study examines the utility of leaf-level hyperspectral measurements and inverted PTs for early detection of drought stress in young kauri seedlings. Using data collected from potted seedlings in a controlled environment, the objectives of this study were to (i) identify the key narrow-band hyperspectral indices (NBHIs) and PTs associated with expression of water deficiency and (ii) develop a prediction model for early detection of drought stress in kauri.

2. Materials and Methods

2.1. Experimental Setup

The experiment was undertaken between June and September 2023 within a nursery setting in Rotorua, Central North Island, New Zealand. The 100 seedlings were planted in 10 L volume pots consisting of a standard nursery potting mix and kept in a ‘polyhouse’. The study included 100 seedlings that were equally divided between control and drought treatments. After baseline measurements (week 1) and over the course of the experiment, the plants in the control treatment were watered daily prior to measurements. To capture peak physiological activity in the morning hours, the measurements were restricted to between 8 am and 12 pm. During each measurement day, the temperature and relative humidity were continuously monitored using a CR1000X data logger (Campbell Scientific, Logan, UT, USA), with observations recorded every minute. The mean temperature and relative humidity for the whole duration of the experiment were 20.2 ± 3.9 °C and 49.2 ± 9.1%, respectively.

2.2. Volumetric Water Content and Equivalent Water Thickness Measurement

Volumetric water content measurements provide insight into the amount of water available to plants and indicate the severity of water stress that they are experiencing. Pots were initially weighed with dry soil to establish a baseline and then watered to saturation and allowed to drain to field capacity before being weighed again. The VWC was calculated as the ratio of the mass of water (determined by the difference between wet and dry weights) to the volume of soil. Throughout the trial, pots were weighed regularly to monitor changes in VWC over time. Due to the size and age of the plants and the destructive nature of EWT sampling, only a subsample of 10 plants per treatment were measured each week. Three leaves per seedling were sampled for EWT measurements. For each leaf, fresh weight (FW) was recorded, and the samples were then dried in a 70 °C oven until constant weight was achieved, at which time the dry weight (DW) was measured. Leaf area (LA) was estimated using the LeafByte iOS software version 1.3.0 (Getman-Pickering, 2018) installed on an iPad 2 (Apple Computer, Inc., Cupertino, CA, USA). Using these measurements, the EWT was determined from the following:
E W T = F W D W L A

2.3. Physiological Measurement

Stomatal conductance (gs) refers to the rate at which water vapor exits a leaf through its stomata. It plays a critical role in plant water relations by regulating transpiration—the process through which a plant loses water to the atmosphere. This regulation is critical not only for maintaining water balance but also for net photosynthesis (or assimilation), as gs controls the intake of carbon dioxide (CO2) into the leaf and its subsequent conversion to organic compounds [22,23]. Thus, gs and A are key factors in both water conservation and a plant’s capacity for photosynthesis and overall health. The Walz GFS-3000 (M-Series, Heinz Walz GmbH, Effeltrich, Germany) is a portable gas exchange system used to measure gs and A. This device uses a CO2 cartridge to regulate CO2 levels, ensuring a consistent environment for precise evaluation. By analyzing variations in CO2 and H2O concentrations within a climate-controlled chamber containing a plant specimen, the device calculates A and gs. This setup allows for accurate assessments of photosynthesis and water use efficiency in plants under varying environmental conditions.
Physiological measurements were made on all 100 seedlings each week. Using leaves in the upper third of the canopy, photosynthetic parameters, such as net A, gs, and transpiration rate (E), were measured using the Walz GFS-3000. The GFS-3000 was equipped with a CO2 cartridge to maintain stable CO2 concentrations throughout the measurement process. Following a two-minute pre-illumination period, at an ambient carbon dioxide concentration of 400 ppm, five measurements were recorded for each plant after the readings had stabilized.

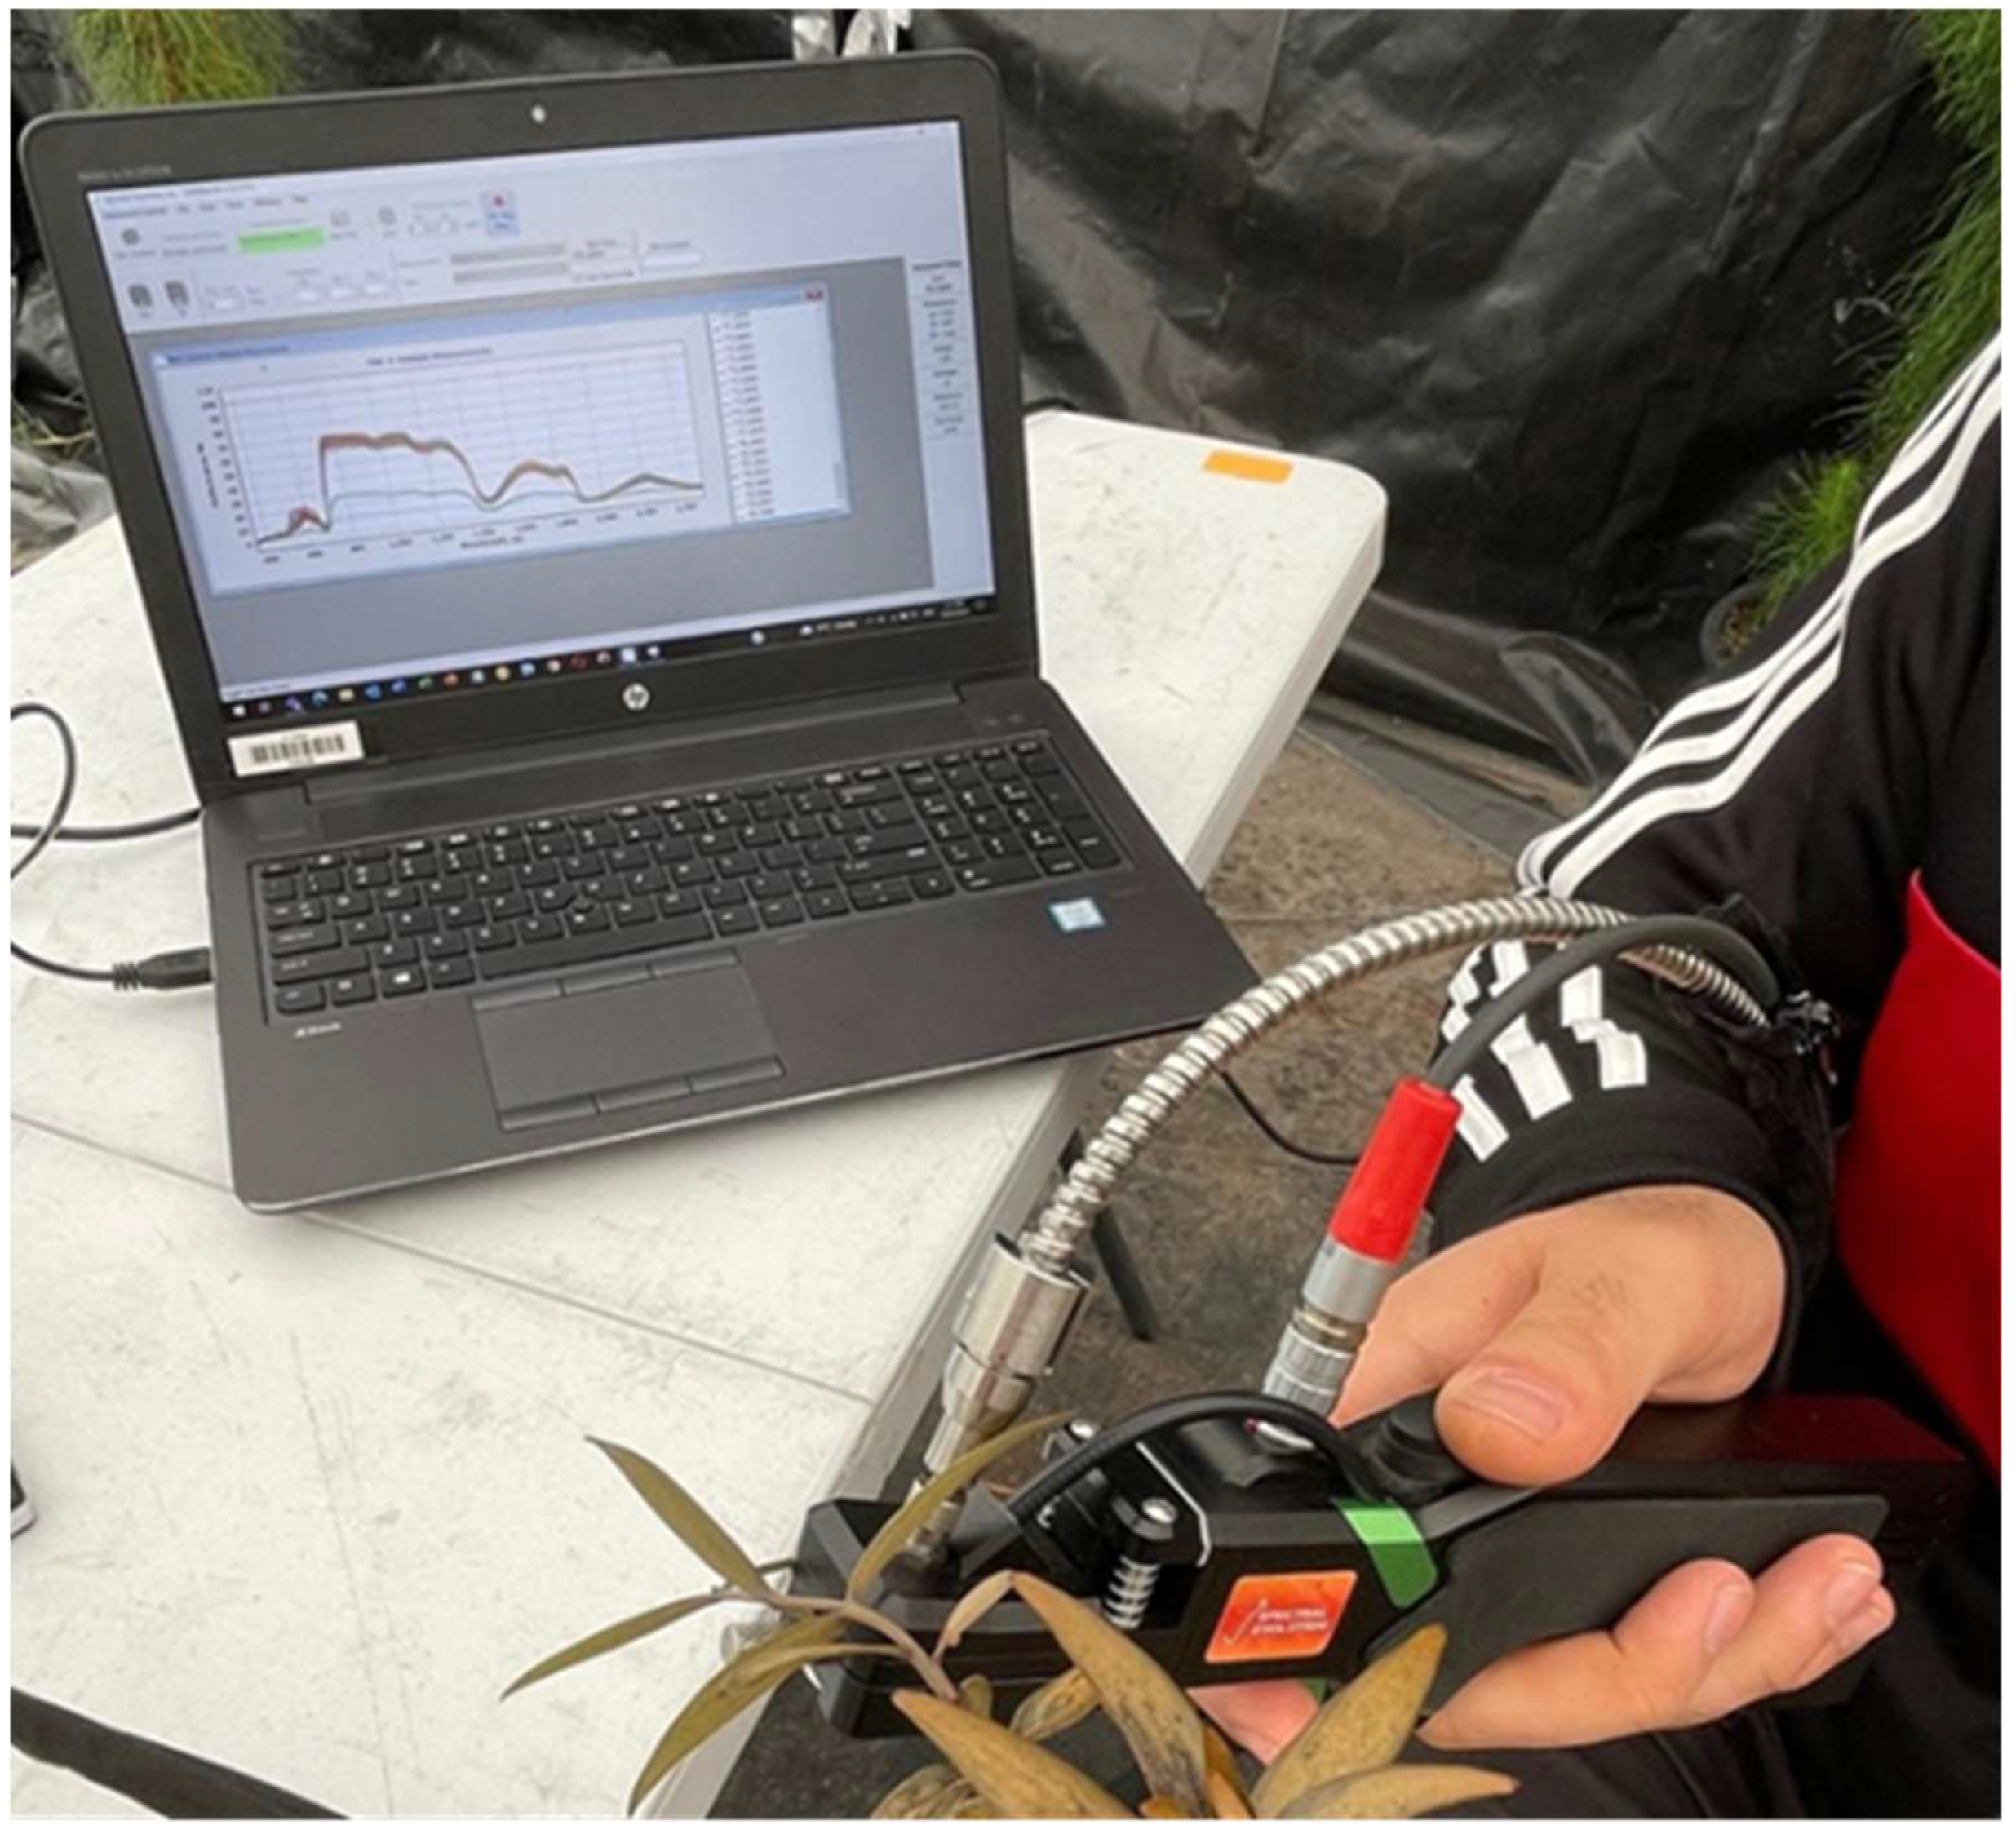
2.4. Leaf Hyperspectral Measurement

Based on the interactions between light and leaf structures, leaf-level hyperspectral measurements are valuable in understanding plant water stress by providing insight into the water content within plant leaves. These measurements utilize the distinct absorption characteristics of water in the spectral domain, particularly within the near-infrared (NIR) and shortwave infrared (SWIR) bands, where water exhibits strong absorption features. By detecting and analyzing these features, it is possible to correlate them with other bio-physiological traits that are important for assessing plant health and stress levels.
To capture leaf-level spectral signatures, a Spectral Evolution (RS-5400) spectroradiometer (Spectral Evolution, Haverhill, MA, USA) equipped with a leaf clip and dedicated light source was used (Figure 1). Using the spectroradiometer leaf clip attachment, reflectance measurements across the 350–2500 nm range were captured from three leaves of different generations of growth in the upper third of the canopy. These generations represented different stages of leaf development (year-0, year-1, and year-2 and up) with varying physiology (color and nutrient concentration) [24]. For example, year-1 leaves are reported to exhibit the highest foliar nitrogen concentration, which decreases in year-2 or older leaves [24]. To capture the representation of the full-plant response and simulate a canopy-like measurement, the hyperspectral signatures collected from different generations were averaged at the plant level, and several NBHIs (Table A1) previously found to be correlated with plant structure, physiology, photosynthetic activity, and water content were calculated [12,13].

2.5. Inversion of Leaf-Level Functional Plant Traits (PTs) Derived from the PROSPECT-D Model

PROSPECT-D is a radiative transfer model that simulates leaf directional–hemispherical reflectance and transmittance over the 400 to 2500 nm spectral range based on various plant traits. Inversion of PROSPECT-D aims to find the optimal set of variables (θ), namely, the leaf structure parameter (N), chlorophyll a+b (Cab), carotenoid (Car), anthocyanin (Ant), brown pigment (Cbrown), equivalent water thickness (EWTinv), and dry matter (Cm), by comparing the modelled and measured leaf optical properties [25]. The inversion process was undertaken using the Dantzig simplex minimization algorithm implementation in MATLAB based on the merit function J ( θ ) :
J ( θ ) = λ m i n λ m a x [ ( R m e a s λ R m o d λ , θ ) 2 + ( T m e a s λ T m o d λ , θ ) 2 ]
where λ is the wavelength, Rmeas and Tmeas are the measured reflectance and transmittance values, respectively, and Rmod and Tmod are the modelled reflectance and transmittance, respectively. In this study, Tmeas was not available; hence, Equation (2) is reduced to the following:
J ( θ ) = λ m i n λ m a x [ ( R m e a s λ R m o d λ , θ ) 2 ]
Without the transmittance spectra, the solution to the merit function becomes ill-posed leading to less accurate retrievals of N and Cm [25,26]. Hence, these PTs were excluded as a predictor variable from the subsequent classification models described in Section 2.7. To mitigate potential issues in the inversion process, boundary values for each PT were set based on commonly observed ranges. Finally, inverted EWTinv values were compared to the measured EWT to assess their accuracy.

2.6. Treatment Differences in Measured and Calculated Variables

Reflectance was plotted against wavelength for all captures, categorized by treatment, and a t-test was conducted to identify wavelengths with significant differences between treatments. Additionally, t-tests were performed to evaluate significant treatment differences for each physiological variable across both measurement dates. Differences between treatments for all hyperspectral indices were also assessed using t-tests, and the corresponding p-values were recorded.

2.7. Classification of Control and Drought Treatments Using Random Forest

The Random Forest (RF) algorithm was used to classify the two treatments of kauri seedlings (control and drought). The NBHIs and PTs were utilized as features for the classification task. The implementation was carried out using the Statistics and Machine Learning toolbox in MATLAB (MathWorks Inc., Natick, MA, USA). Random Forest is an ensemble learning method that constructs a collection of decision trees during the training process. Each tree in the forest is built from a bootstrap sample drawn with replacement from the training dataset. At each node of the tree, split decisions are made based on a random subset of features. This approach introduces diversity among the trees, which helps mitigate overfitting and improves generalization to unseen data. The final classification decision is made through the majority voting principle, where the class label predicted by the majority of the trees is selected as the final output. This ensemble-based approach enhances both the accuracy and robustness of the model, making it well suited for handling complex, high-dimensional datasets such as the one used in this study.
Random Forest models based on single-date and multitemporal datasets were evaluated in this study. The single-date models classified the weekly datasets using a five-fold cross validation that was repeated 49 times using a different train/test split during each iteration. The multitemporal RF models, however, used all the datasets prior to the week of observation for training/testing. These models were then validated using the dataset of the actual week of observation (e.g., an RF model trained/tested on combined datasets from week 1 and 2 was used to predict treatments in week 3). The input features for the RF models used in this study are summarized in Table 1. For all the models, the performance statistics were averaged across predictions from all 50 test datasets. This approach eliminated any potential bias from the selection of test datasets using a single train/test split, ensuring a more rigorous evaluation of the model’s true performance.
A confusion matrix was constructed for each model using the mean predictions across all 50 independent test datasets. The drought treatment was designated as the positive class, and the confusion matrix quantified the percentages of true positives (TPs), true negatives (TNs), false positives (FPs), and false negatives (FNs). Model performance was evaluated using precision, recall, accuracy, and the F1 score (for equations, see [13]). Precision measures the proportion of correct positive predictions, while recall identifies the fraction of true positives accurately detected. High precision indicates few false positives, whereas high recall signifies low numbers of false negatives. The F1 score, representing the harmonic mean of precision and recall, provides a balanced measure of the model’s discriminatory power. F1 scores range from 0 to 1, with values from 0.5 to 0.7, 0.7 to 0.8, 0.8 to 0.9, and above 0.9 indicating poor, good, excellent, and outstanding levels of classification, respectively [13,27].

3. Results

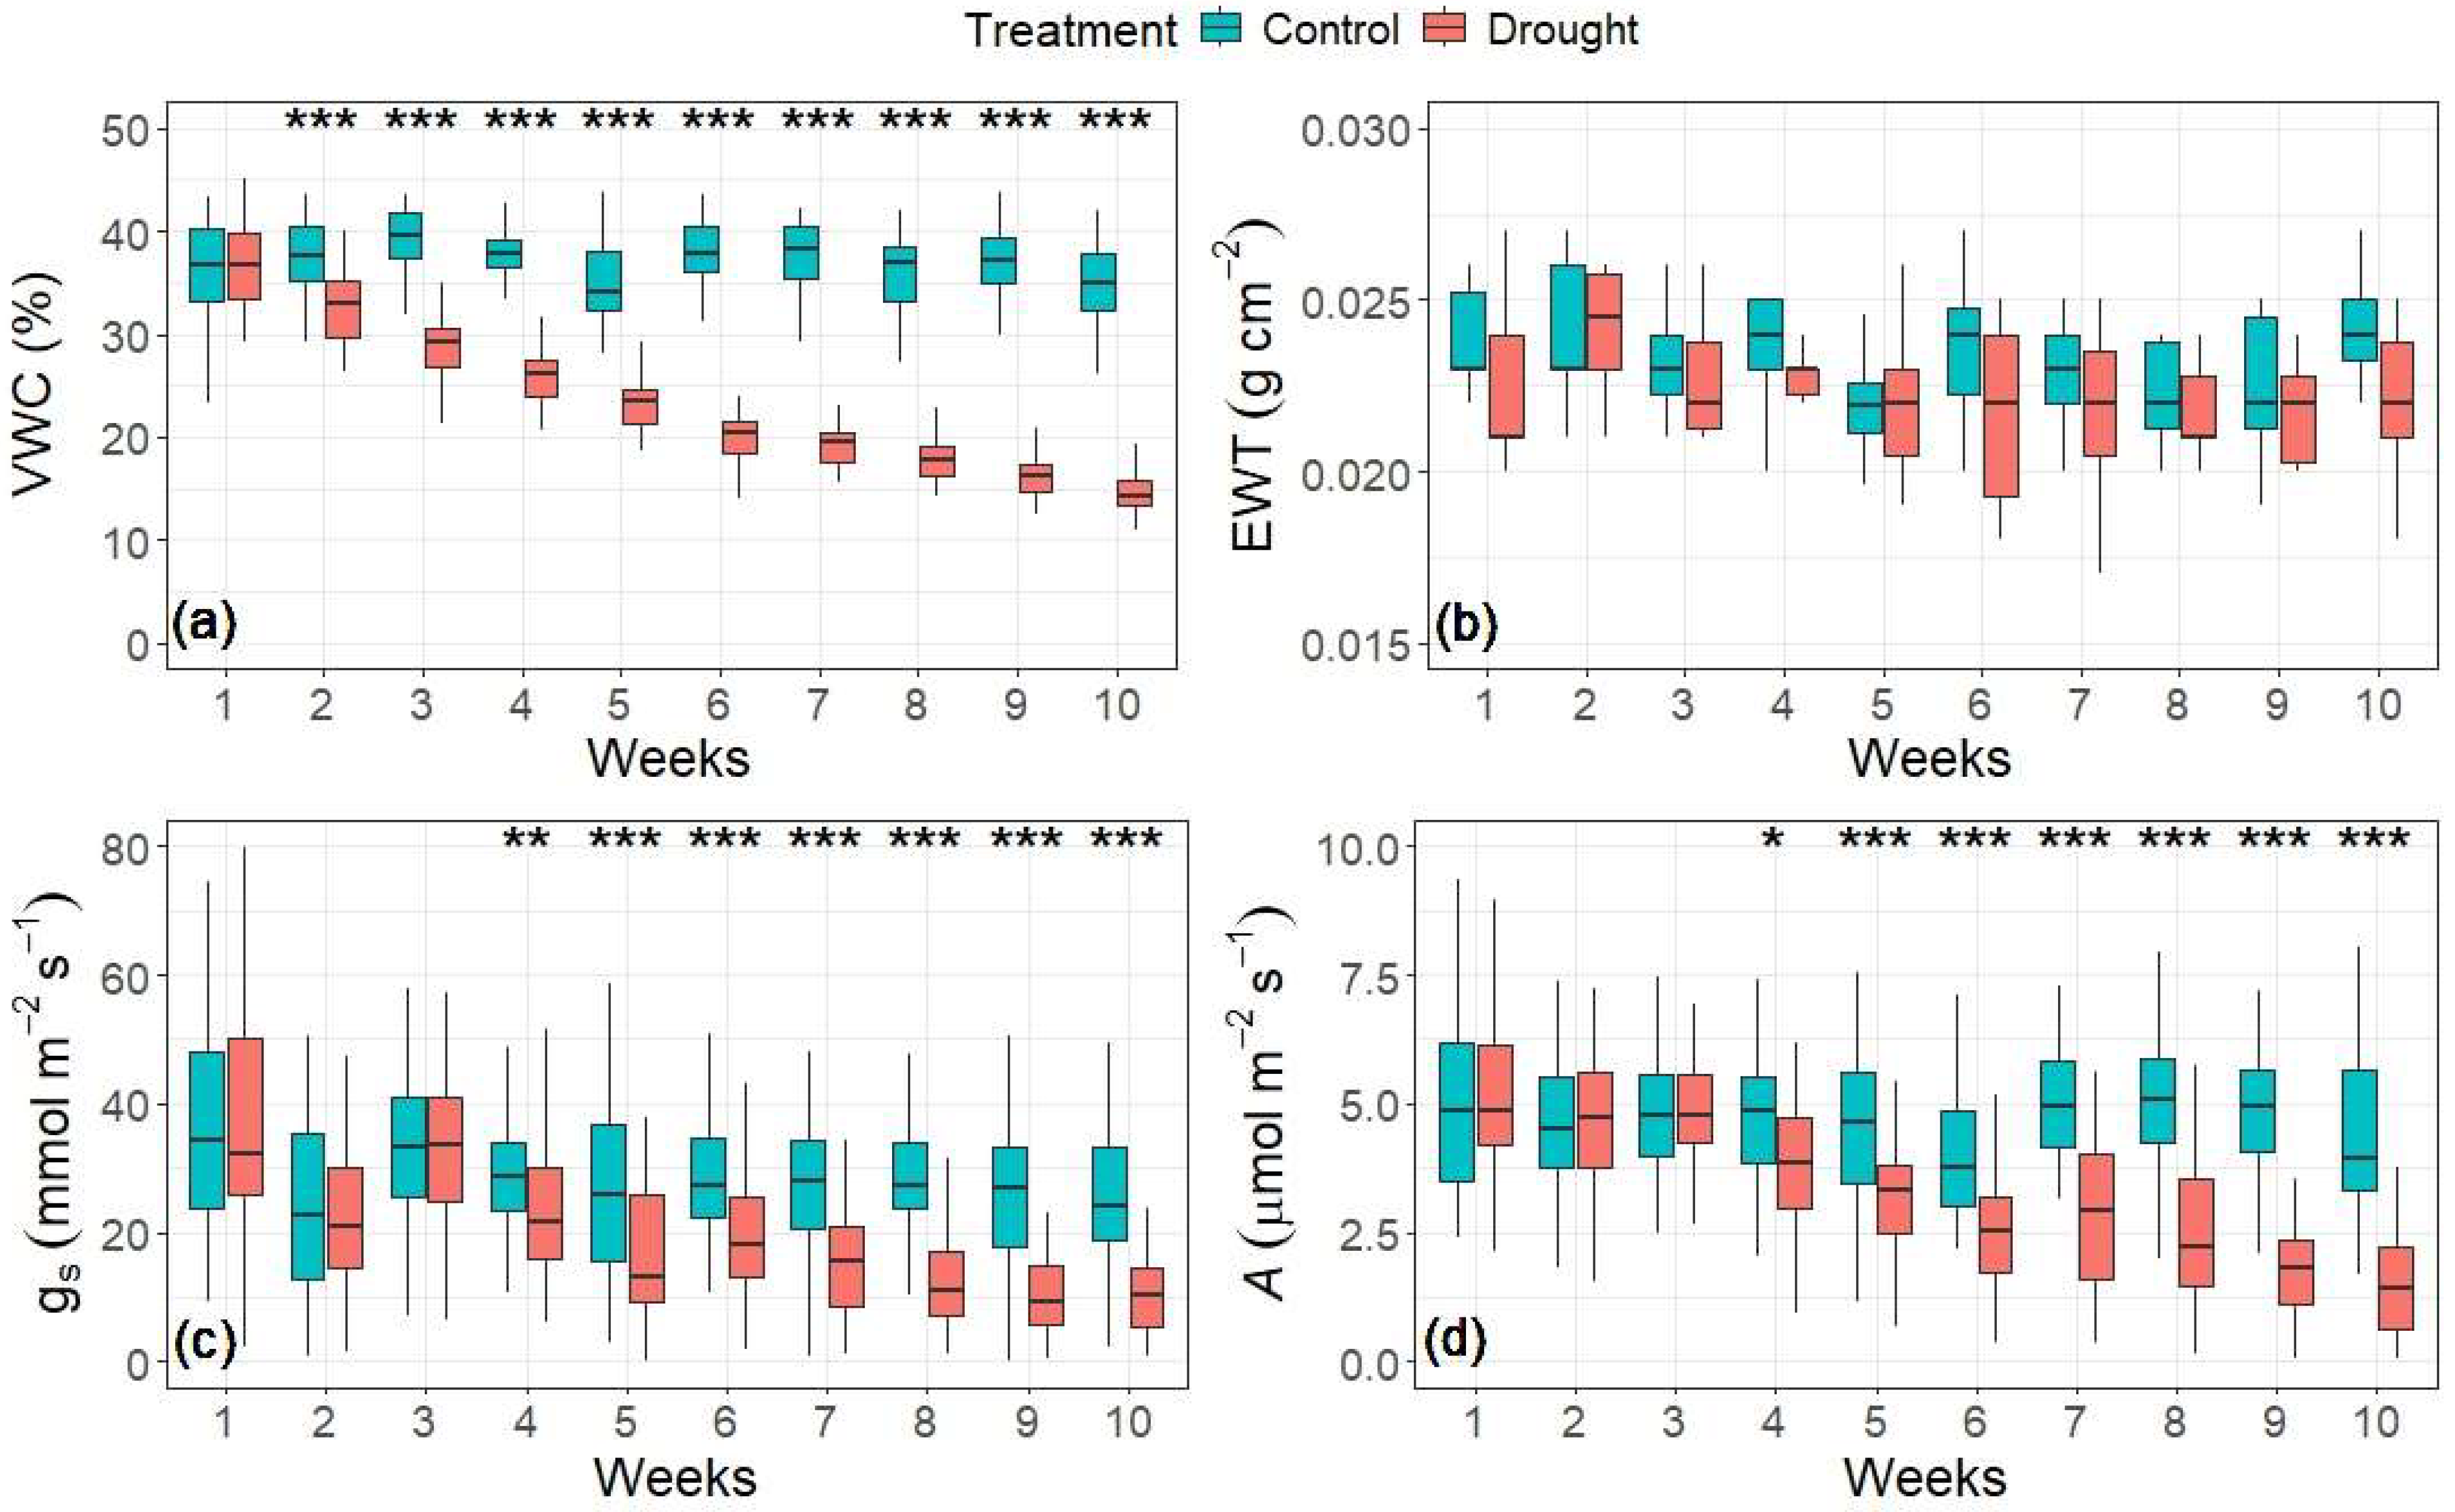
3.1. Changes in Water Content and Tree Physiology

The volumetric water content (VWC) in the control treatment remained consistently high throughout the experiment, with the mean weekly values fluctuating between 36.0% and 38.3% (Figure 2a). In contrast, the mean VWC in the drought treatment began to decline significantly, below values in the control, one week after the treatment started. Thereafter, the drought treatment showed a nearly linear reduction in VWC to a mean value of 15.5% 10 weeks after treatment. No significant differences in EWT between treatments were observed over the duration of the experiment (Figure 2b).
Compared to the changes in the VWC, reductions in physiological traits (stomatal conductance and assimilation rate) took longer to be expressed in the drought treatment (Figure 2c,d). The tree physiological traits in both treatments exhibited similar fluctuations over time. The control values of stomatal conductance (gs) and photosynthesis (A) did not significantly exceed those of the drought treatment until week 4, after which point the values diverged continuously between treatments. The treatment divergence in gs and A peaked in week 9, at which time the values in the control treatment exceeded those in the drought treatment by 76.3% and 71.5%, respectively.

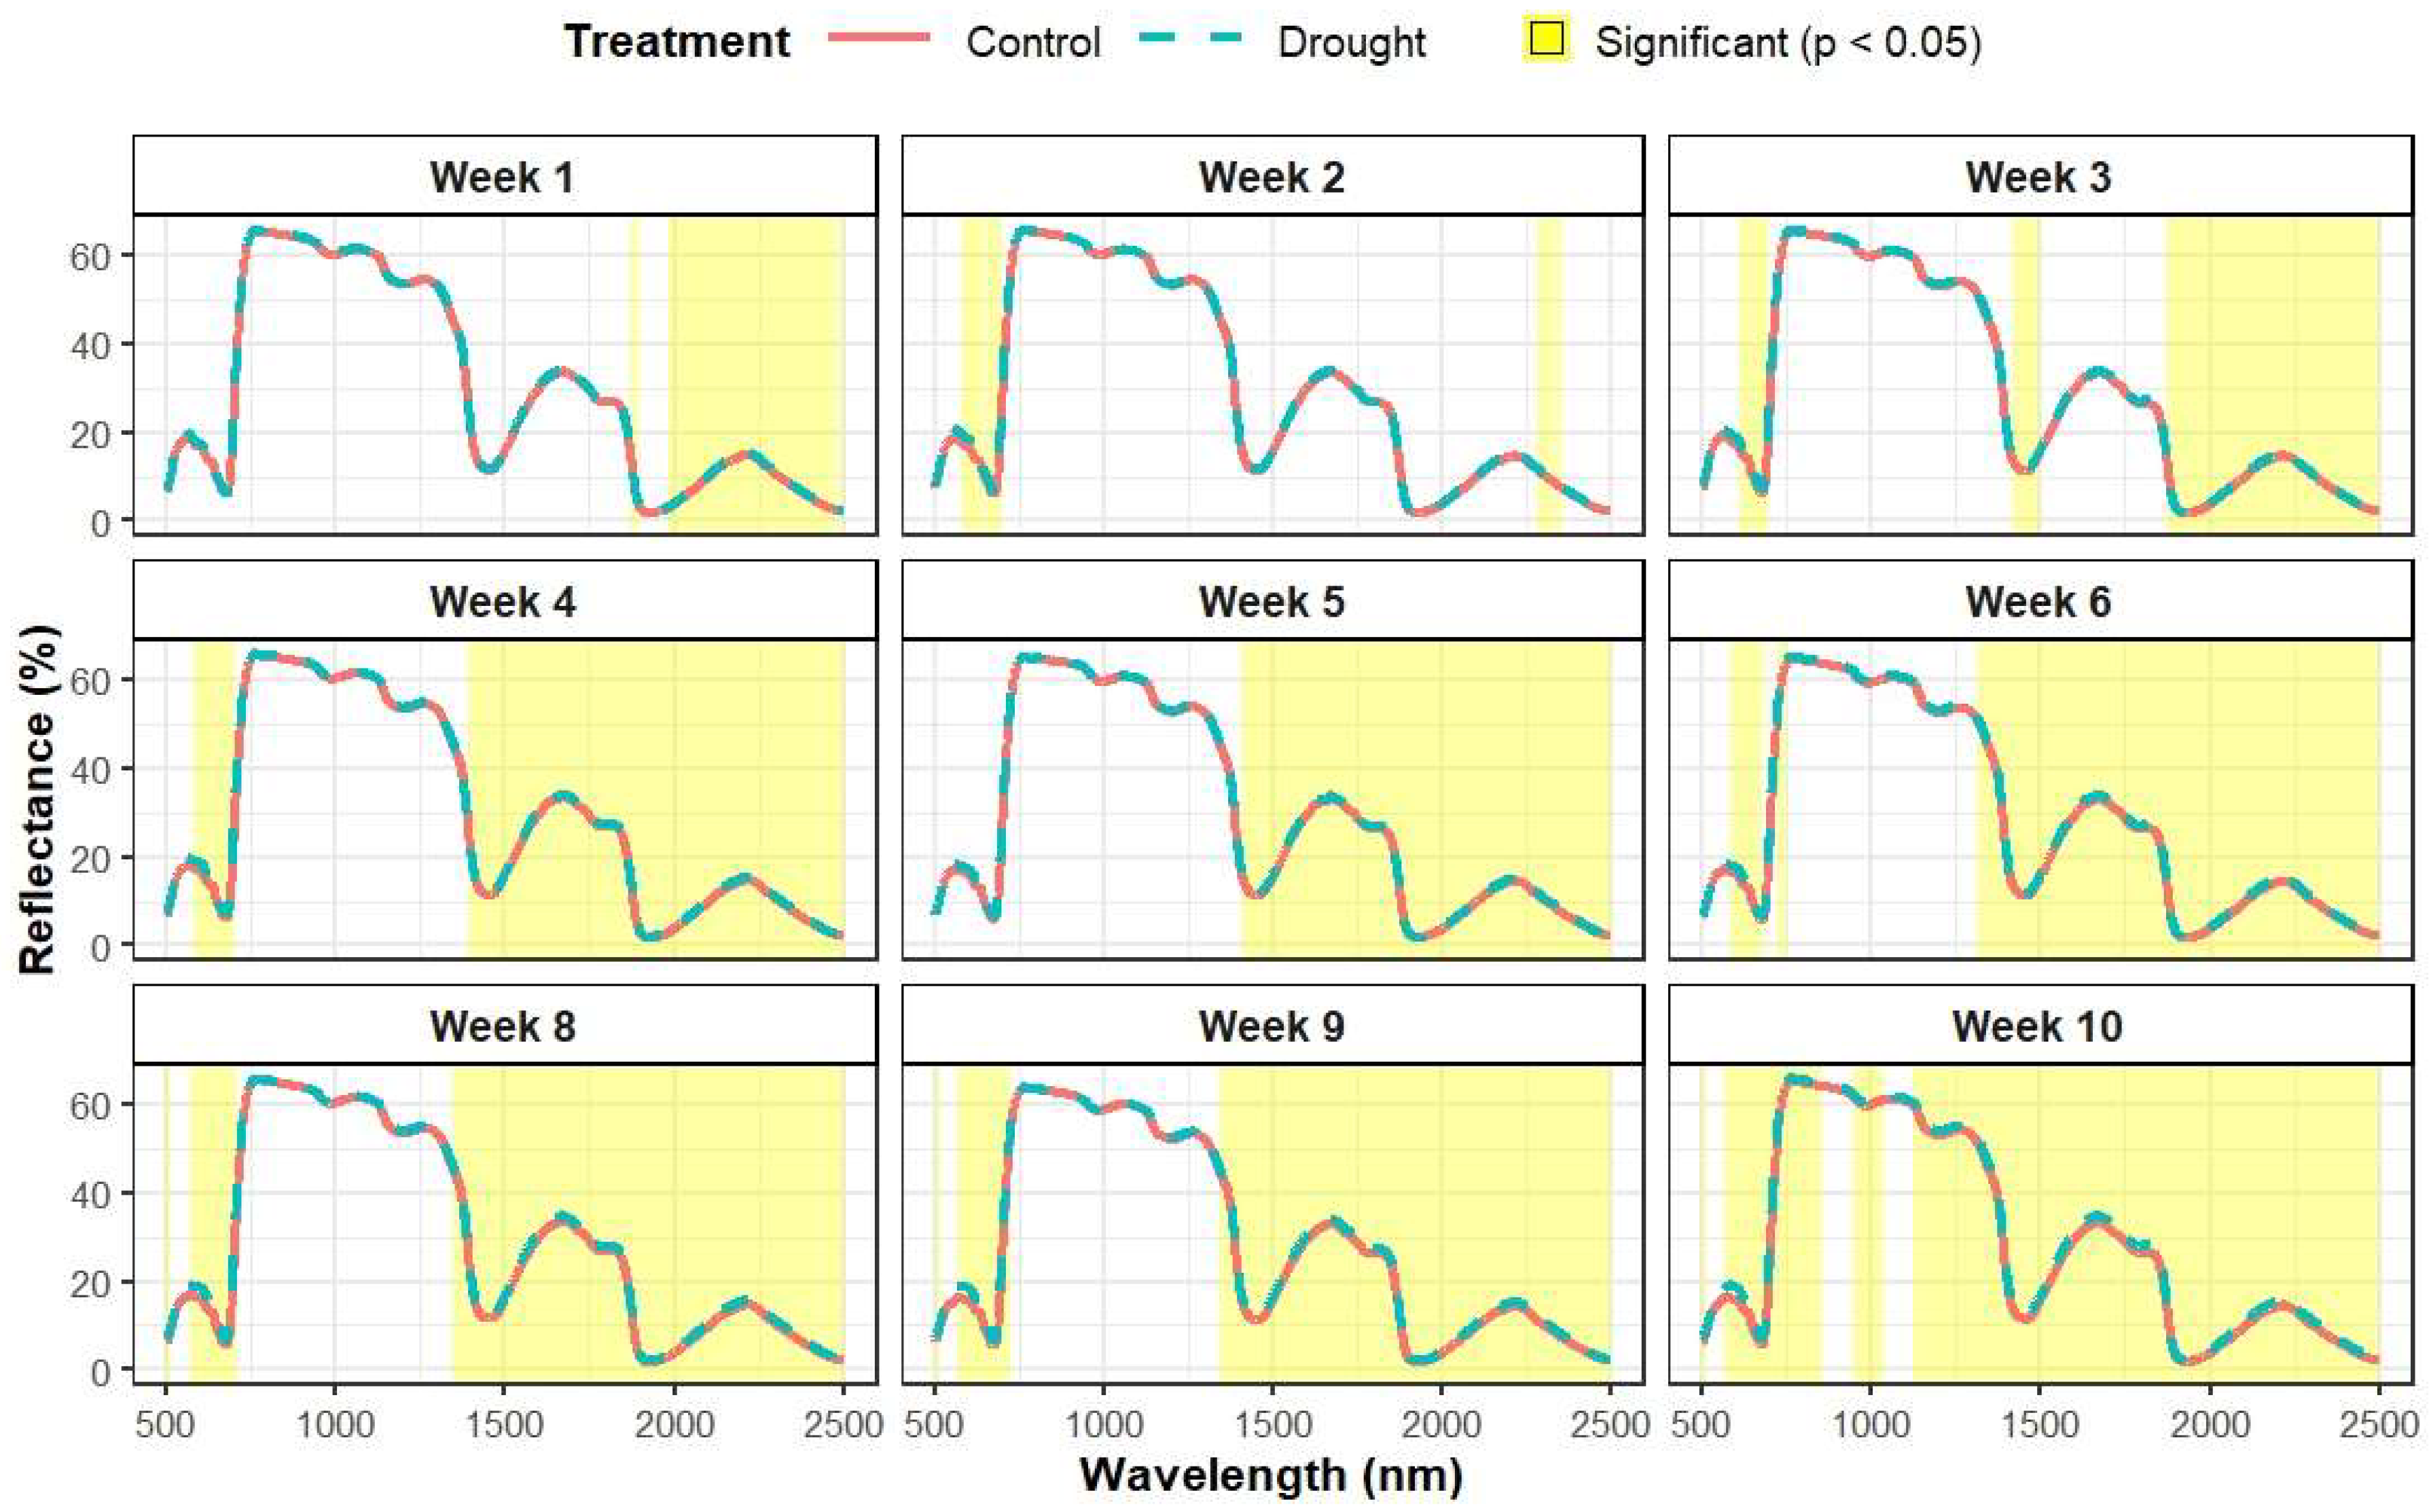
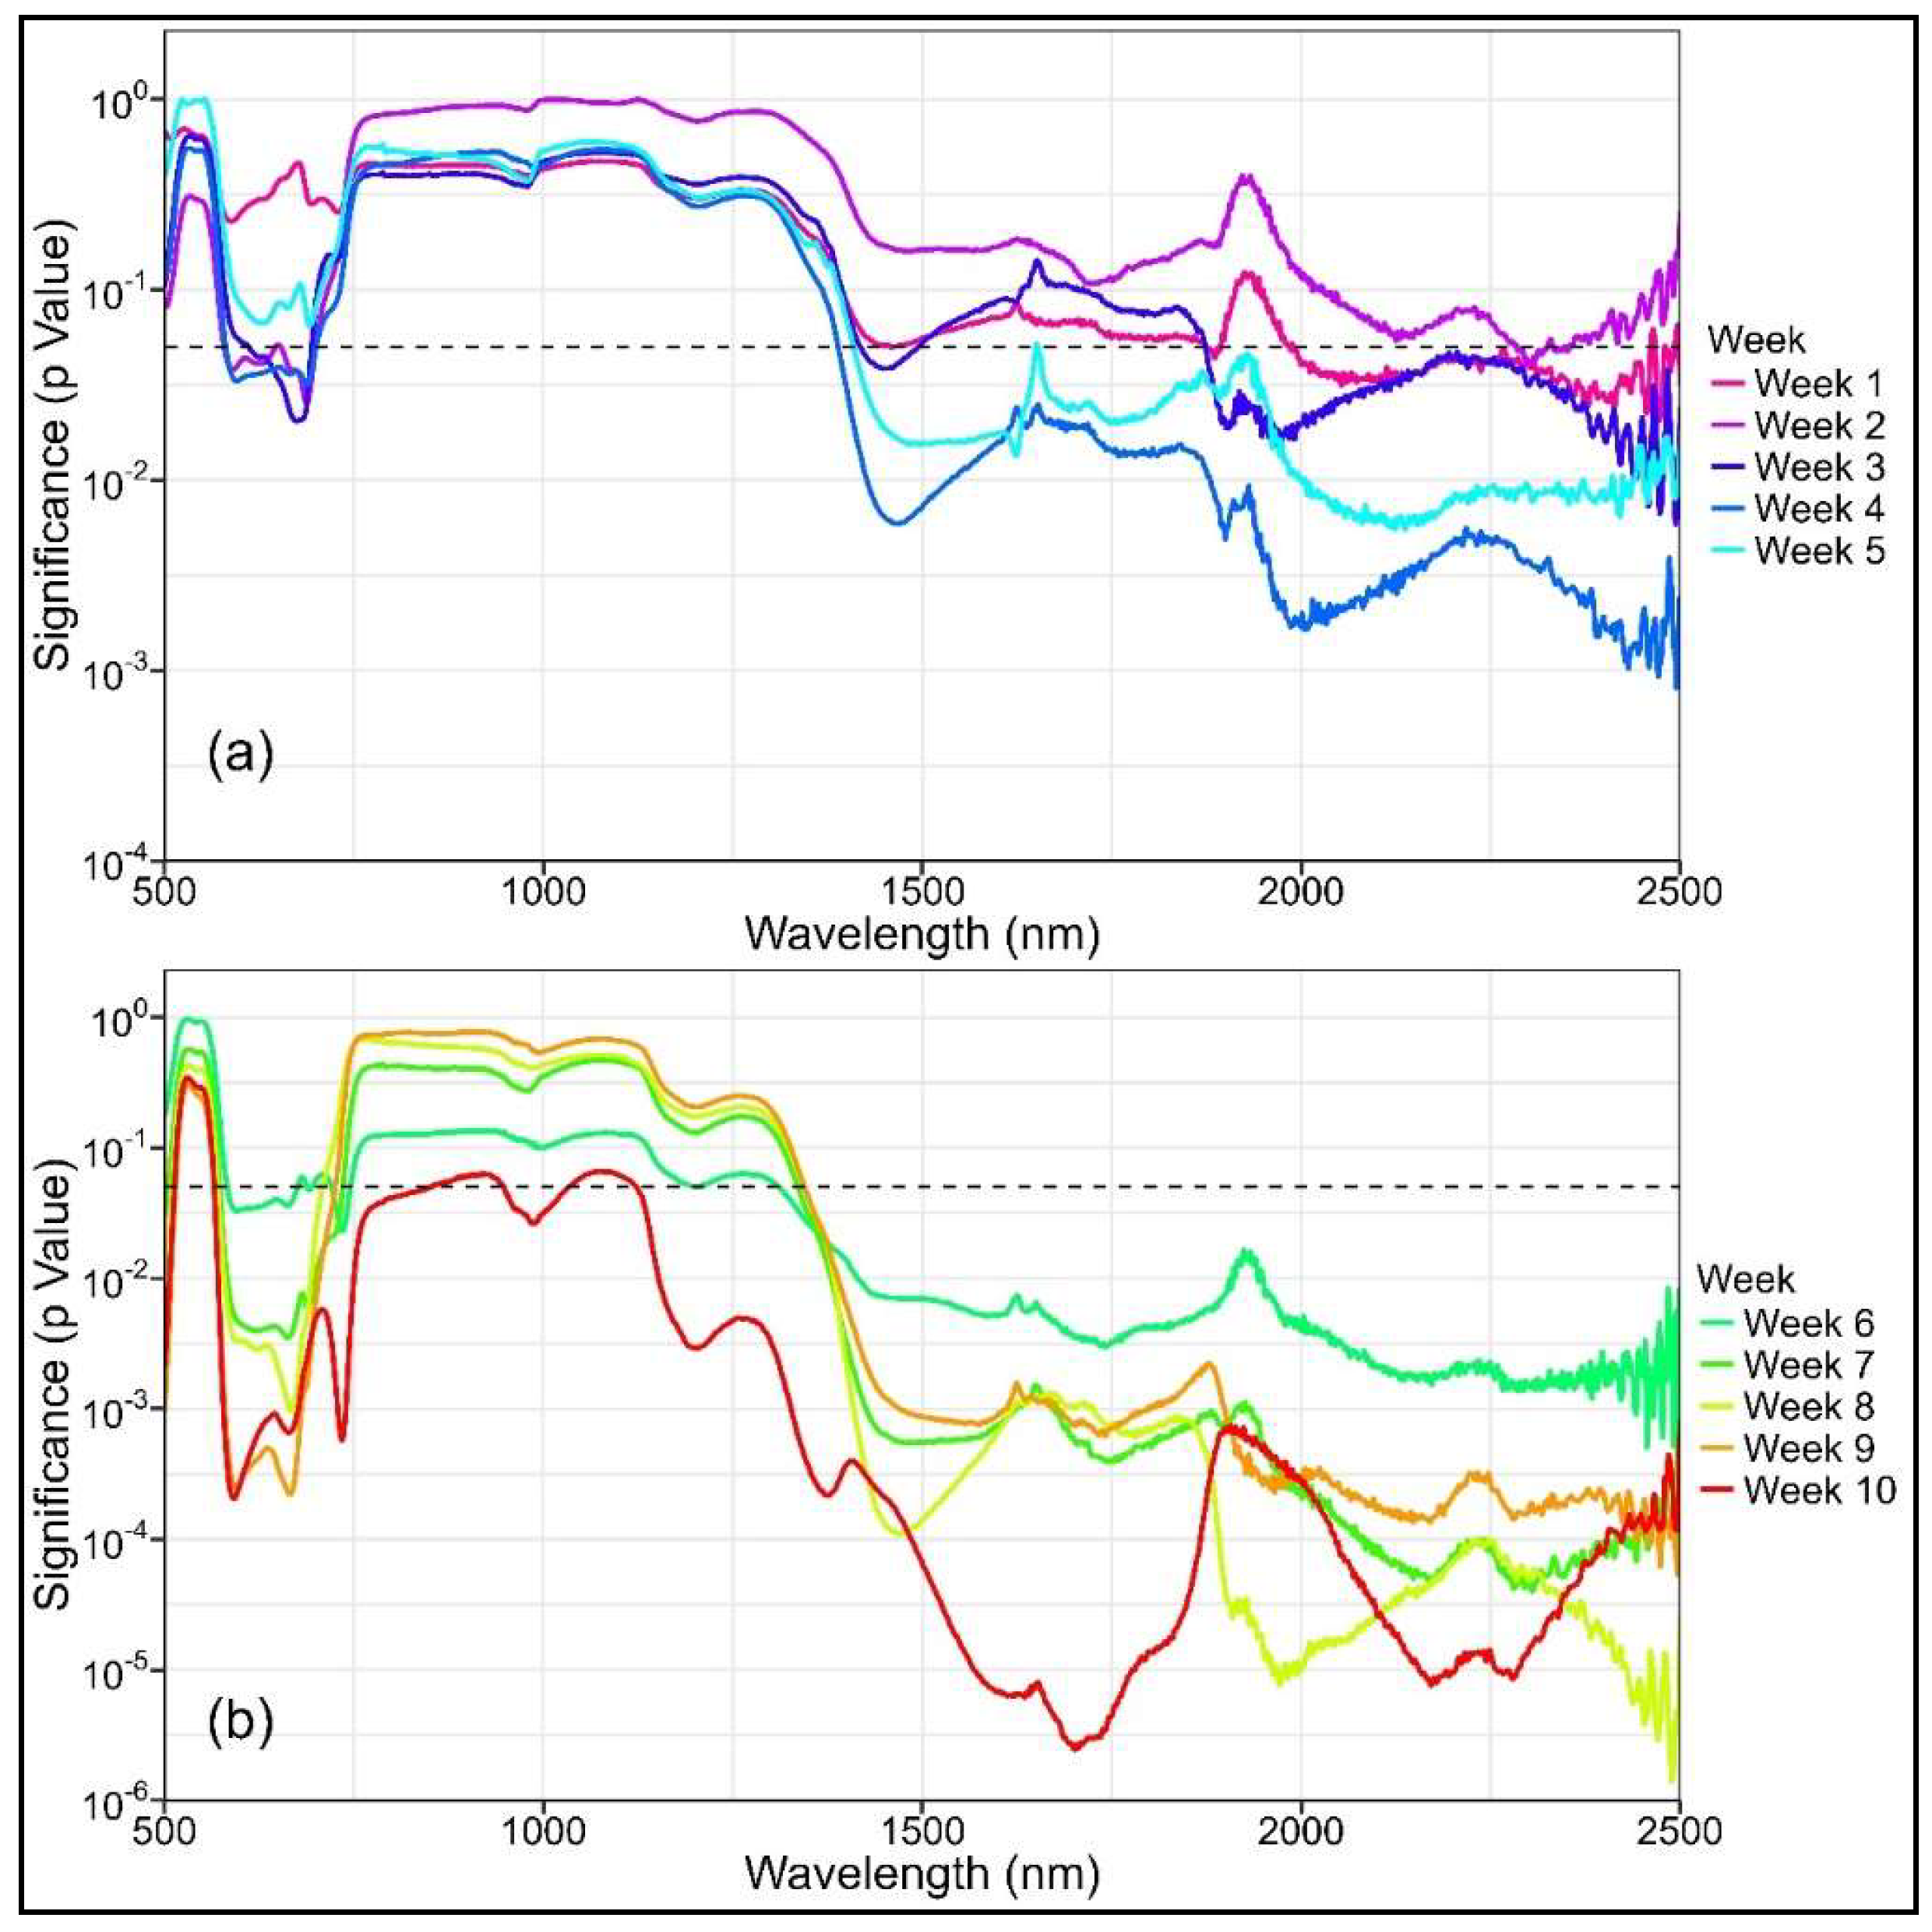
3.2. Variation in Leaf-Level Reflectance

Compared to the control treatment, the mean spectral reflectance of the plants in the drought treatment generally exhibited higher values, starting from week 1 onwards and continuing throughout the study (Figure A1). Significant differences in certain spectral bands, particularly within the SWIR region (λ > 1985 nm, p < 0.05), were observed as early at week 1 but were more consistent from week 4 onwards (Figure A2). Spectral bands with significant differences widely varied from week 1–5, but differences were mostly observed within the SWIR range. From week 6 onwards, significant differences were steadily observed in both the VNIR (583–744 nm) and SWIR (λ > 1311 nm) regions. Over this period, the treatment differences within the VNIR and SWIR ranges became increasingly significant, as indicated by the decreasing p values (Figure A2).

3.3. Differences in NBHIs and PTs Through Time

Similar to the spectral reflectance, significant differences in NBHIs were observed as early as week 1, particularly in the water indices that used SWIR bands, but they were more consistent from week 4 onwards (Table A2). The type and number of indices with significant differences varied greatly from week 1–10, but the number of significant indices increased as the water stress progressed. With the exception of WBI and fWBI, all structural and water indices displayed significant differences from week 7 onwards. Chlorophyll and photochemical indices started to show significant differences in weeks 7 and 10, respectively.
The comparison of the inverted and measured EWT is shown in Figure A3. Although the coefficient of determination (R2) was relatively low, the inversion process proved to be satisfactory, as evidenced by a low mean absolute percentage error (MAPE = 8.49%) and root mean square error (RMSE = 0.0026 g/cm2). Additionally, the calculated absolute percentage difference (APD) between the inverted and measured EWT values revealed that 83% of the data fell within an APD of less than 15%. Significant treatment differences in EWTinv were steadily observed from week 3 onwards, which became more significant over the duration of the experiment, and by week 10, this was the most significant trait (p = 3.41 × 10⁻⁶) (Table A2). This trend contrasted with that of the measured EWT, which did not show significant differences during any week. The inverted Cab showed significant differences between treatments from week 7 onwards, whereas no significant differences were observed for Ant and Car throughout the experiment.

3.4. Classification of Control and Drought Treatment Using Single-Date and Multitemporal RF Models

Overall, the multitemporal RF models demonstrated superior performance compared to the single-date models (Table 2). In balanced datasets, F1 scores are often closely aligned with precision and recall values, and thus, the F1 scores were the primary metric used to assess model performance from this point onwards.
The SD-RF1 model exhibited poor classification scores in most weeks except week 9, which yielded a good F1 score of 0.71. Similarly, the SD-RF2 model had poor F1 scores for weeks 1 to 8 but showed improvement, with good scores for weeks 9 and 10. In contrast, the M-RF3 model had the highest classification score during weeks 2–4 of between 0.76 in week 2 to 0.81 in week 4 and continued with excellent scores from week 5 onwards. The M-RF2 model exhibited similar performance to M-RF3, and although it was slightly less accurate from weeks 2–4 (F1 scores of 0.69–0.79), this model was more accurate from weeks 5–10 and had the highest scores among all models from weeks 7–10. The other two multitemporal RF models (M-RF1, M-RF4) showed good performance from week 3, with steadily improving accuracy in the latter weeks.
The relatively accurate detection of water-stressed seedlings in week 2 using the M-RF3 model coincided with the week when the volumetric soil water content (VWC) between the treatments started to exhibit significant differences. This detection occurred two weeks earlier than when the first significant variations in physiological traits (gs and A) were observed. In contrast, the other multitemporal models exhibited accurate detection of water stress a week prior to its physiological expression.
Water indices, and in particular LWI, emerged as the most important predictors for single-date RF models in 9 out of 10 weeks. A similar result was observed with the M-RF1 and MRF-2 models, though it is noteworthy that photochemical indices (PRI or MPRI) consistently ranked as the second most important predictors. In contrast, EWTinv was the most important predictor in the M-RF3 model, while the inverted Cab and Ant were the most prominent predictors in M-RF4.

4. Discussion

This study highlighted the utility of NBHIs and inverted PTs for the early detection of water stress in kauri, an important endemic conifer in New Zealand. Previous research has shown the utility of multispectral and hyperspectral imagery in detecting disease-related stress in kauri trees and carried out simulation experiments of medium- to long-term drought in kauri [10,11,20,21,28]. However, these studies have primarily focused on the characterization of plant responses to drought based on the soil water content and tree physiology. This is the first time that hyperspectral remote sensing has been used to detect water stress in kauri, advancing our knowledge and capability for early management of drought impacts on these endemic species.
Leaf water potential can decline with minimal impact on EWT, as it is often characterized by a steep water release curve at the saturated range. Hence, no significant drop in EWT is expected in the early stages of water stress [29,30]. In contrast, stomatal conductance (gs) and assimilation rate (A) exhibit dynamic responses to even minor fluctuations in water availability, aiming to optimize water use efficiency and mitigate the effects of stress on plant metabolism [29,30,31]. Within our study, these expected changes were consistent with the relatively stable EWT values for both treatments throughout the experiment and with the decline in gs and A from week 4 onwards in the drought treatment. This reflects kauri’s conservative water use strategy, where it regulates water use to avoid hydraulic failure in response to water stress [1,32].
Early signs of weak water stress may have been present as early as week 2 and persisted through week 3, as indicated by the significant treatment differences in the various spectral bands and NBHIs. During this period, variability in the significance between treatments was observed for both the spectral wavelengths and the NBHIs. This may be associated with the weak and partial expression of water stress in a small number of leaves that may or may not have been captured during the limited number of stochastic samplings. The aggregation of spectra from three distinct leaf developmental stages may also have contributed to this variability, as these stages likely had differences in pigment concentrations and leaf water content. As water stress progressed and intensified, it was increasingly expressed in more leaves, which resulted in a higher number of significant (p < 0.05) spectral bands and NBHIs that were prevalent from week 4 onwards. This did not translate to good classification scores (F1 score < 0.70) among the single-date RF models except in weeks 9 and 10, which were already at the late stage of water stress. We surmise that relying solely on single-date measurements is associated with significant variation in spectral signatures (reflectance and NBHIs), which may have contributed additional variation between treatments, hence resulting in poor classification scores (F1 score < 0.70). This result suggests that multiple significant variables do not necessarily produce good predictions, which has been similarly reported in other studies [33,34,35,36]. These studies underscore the importance of interactions between variables that may have differing complexity and non-linear relationships. Lo et al. (2015) pointed out that different properties of the underlying distribution determine the variable’s significance and use for good predictivity and argued that significance should not be the only standard selection for good predictivity [37].
In contrast to the single-date models, the multitemporal RF models yielded good predictive scores (F1 score > 0.70) as early as week 2 for M-RF3 and week 3 for the other three multitemporal models. It is likely that the aggregation of datasets for training/testing aided the model in extracting additional information about the data distribution, potentially capturing temporal variations and improving feature representation [38,39,40]. This then reduced the generalization error of the model, resulting in better predictions.
As expected, water indices (mainly LWI and variants of NDWI) emerged as the most prominent predictors in both the single-date and multitemporal models, with the exception of M-RF3 and M-RF4, which relied solely on either VNIR- or SWIR-based NBHIs. Notably, photochemical indices ranked as the second most important type of predictor. These indices are well-known indicators of plant photosynthetic activity. Previous studies have consistently demonstrated the effectiveness of photochemical indices in predicting light use efficiency and key photosynthetic parameters under various stress conditions, such as nutrient limitations and cold winter temperatures [12,41,42,43,44,45]. Given that water availability is a critical regulator of photosynthesis, it is unsurprising that photochemical and water indices emerged as the most important predictors.
While good correspondence between the inverted and measured EWT was obtained, it is notable that the inverted EWTinv values exhibited significant differences from week 3 onwards. This result differs from the trend of the measured EWT, which did not show significant differences between treatments in any week, though the mean values of the drought treatment were visibly lower compared to the control from week 3 onwards. The observed differences in trends are primarily attributed to variations in sampling sizes between the measured EWT and the spectral data used for PT inversion. While only 10 out of 50 kauri seedlings per treatment were sampled for EWT each week, spectral measurements were conducted on all seedlings. This resulted in more robust EWTinv estimates and overall representation of the water status of kauri seedlings over the 10-week period. It is recommended that, where possible, the EWT sample size be increased and that leaf developmental stage is tracked or standardized to minimize any confounding effects. Nonetheless, the results in EWTinv demonstrate the potential of the radiative transfer model for high-throughput monitoring and characterization of water stress.
As indicated by the tree physiology and spectral measurements in this study, kauri exhibited resilience to short- and medium-term water stress, which is consistent with previous studies [20,21,28]. However, climate change projections for New Zealand predict more frequent and severe droughts, which could increase mortality rates among endemic species such as kauri. Studies have shown that large trees are particularly vulnerable to drought-related mortality, and kauri have traits that may accelerate death, including vulnerability to xylem embolism and high water potential at the turgor loss point [4,46,47]. To address this, future research is recommended to scale-up measurements to the canopy level, enabling better characterization and detection of water stress in mature kauri stands.

5. Conclusions

This study demonstrated the early detection of drought stress in young kauri using hyperspectral measurements. Significant differences in varying spectral bands and NBHIs were observed early at weeks 1 to 3, indicating the presence of weak water stress. As the experiment progressed and available soil water diminished, the number of significant spectral bands and NBHIs increased substantially. However, this did not translate into good classification scores for the single-date RF models before week 9. Instead, substantial improvements in classification accuracy (F1 score > 0.70) were achieved by using multitemporal datasets, which produced good performance (F1 score = 0.76) observed as early as week 2, and excellent performance (F1 score = 0.80) in week 3. This earliest robust prediction of water stress in week 2 matched the time occurrence of significant treatment divergence in VWC and preceded the significant decline in key physiological traits in the drought treatment by 2 weeks.
Good correspondence between the measured and inverted EWT values highlighted the potential use of radiative transfer modelling for high-throughput monitoring during drought occurrences. Future research is recommended to scale-up leaf-level measurements to the canopy level in mature stands to better understand how leaf and vegetation structure along with environmental factors influence plant photosynthetic activity and responses to water stress. Regardless, the findings illustrate the potential of hyperspectral data for the early detection of water stress using equipment and methods that are simpler to collect than physiological data. This may offer kauri stakeholders a tool for proactive water management and the opportunity to study selective propagation of climate-resilient genotypes.

Author Contributions

Conceptualization, M.J.B.F., R.M. and M.S.W.; methodology, M.J.B.F., R.M., M.S.W. and M.-M.A.; software, M.J.B.F. and R.M.; formal analysis, M.J.B.F., R.M. and M.S.W.; investigation, M.J.B.F., R.M., M.S.W., M.-M.A. and T.P; resources, R.M., M.-M.A. and T.P.; data curation, M.J.B.F., R.M. and M.-M.A.; writing—original draft preparation, M.J.B.F. and R.M.; writing—review and editing, M.J.B.F., R.M., M.S.W., M.-M.A. and T.P.; visualization, M.J.B.F., R.M. and M.S.W.; supervision, R.M. and M.S.W.; project administration, R.M.; funding acquisition, R.M. and M.S.W. All authors have read and agreed to the published version of the manuscript.

Funding

This project was funded through Scion SSIF funding and the Ministry of Business, Innovation and Employment (MBIE) program, grant number C04X2101 (Seeing the forest for the trees: transforming tree phenotyping for future forests).

Data Availability Statement

The data presented in this study are not available without prior consent from the mana whenua (customary authority) that the kauri seedlings originated from. Reasonable requests submitted to the corresponding author will be conveyed to the appropriate parties.

Acknowledgments

Scion’s standard practice is to source indigenous trees and materials with full knowledge and permission of mana whenua (the iwi/tribe or hapū-/sub-tribe who have customary authority over land) to carry out the science research. In this case, a Memorandum of Understanding was agreed with Te Roroa, which underpinned the use of the kauri seedlings from their Waipoua Forest that they generously donated. We thank Scion’s nursery staff and Te Ao Māori Research Group, specifically Taiāwhio Bryers, who oversaw that the trees were cared for in an appropriate manner according to tikanga Māori (Māori customary practice). All appropriate cultural procedures were adhered to. We are grateful to Anita Wylie, Matt Dunn, and Scion nursery staff for maintaining the plants before and after the experiment. We greatly appreciate the work carried out by Peter Massam, Warren Yorston, Honey-Jane Estarija, and David Cajes in the larger experimental setup and/or data collection processes.

Conflicts of Interest

The authors declare no conflicts of interest.

Appendix A

Table A1. List of narrow-band hyperspectral indices (NBHIs) and their formulations that were used in the analysis [13].
IndexIndex NameEquation
Chlorophyll and other photosynthetic pigment indices
CIChlorophyll Index ρ 750 / ρ 710
GM1Gitelson and Merzlyak Index 1 ρ 750 / ρ 550
GM2Gitelson and Merzlyak Index 2 ρ 750 / ρ 700
MCARIMod. Chl. Absorp. Rfl. Index [ ( ρ 700 ρ 670   ) 0.2   ( ρ 700 ρ 550   ) ] ( ρ 700 / ρ 670   )  
PSSRbPig. Spec. Simpl. Ratio Chl. b ρ 800 / ρ 635
TCARITransf. Chl. Absorp. Rfl. Index 3 [ ( ρ 700 ρ 670   ) 0.2   ( ρ 700 ρ 550   ) ( ρ 700 / ρ 670   ) ]
VOGVogelmann Index ρ 740 / ρ 720
Structural Indices
NDVINormalized Difference Vegetation Index ( ρ 800 ρ 670 ) / ( ρ 800 + ρ 670 )
OSAVIOpt. Soil-Adjusted Veg. Index 1 + 0.16 ( ρ 800 ρ 670 ) / ( ρ 800 + ρ 670 + 0.16 )
RDVIRenormalized Diff. Veg. Index ( ρ 800 ρ 670 ) / ( ρ 800 + ρ 670 ) 0.5
Physiological/Photochemical index
PRIPhotochemical Reflectance Index ( ρ 531 ρ 570 ) / ( ρ 531 + ρ 570 )
MPRIMod Photochemical Reflectance Index ( ρ 515 ρ 531 ) / ( ρ 515 + ρ 531 )
Water indices
Datt1Datt1 ( ρ 850 ρ 2218 ) / ( ρ 850 ρ 1928 )
Datt2Datt2 ( ρ 850 ρ 1788 ) / ( ρ 850 ρ 1928 )
DDIDouble Difference Index 2 ρ 1530 ρ 1005 ρ 2005
fWBIFloating Position Water Band Index ρ 900 / m i n ρ 930 ρ 980
GVMIGlobal Vegetation Moisture Index ( ( ρ 820 + 0.1 ) ( ρ 1600 + 0.02 ) ) ( ρ 820 + 0.1 + ( ρ 1600 + 0.02 ) )
LWILeaf Water Index ρ 1300 / ρ 1450
MSIMoisture Stress Index ρ 1600 / ρ 820
MSI1Moisture Stress Index 1 ρ 1650 / ρ 1230
MSI2Moisture Stress Index 2 ρ 1650 / ρ 830
NDIINormalized Difference Infrared Index ( ρ 820 ρ 1600 ) / ( ρ 820 + ρ 1600 )
NDWI1Normalized Difference Water Index 1 ( ρ 860 ρ 1240 ) / ( ρ 860 + ρ 1240 )
NDWI2Normalized Difference Water Index 2 ( ρ 870 ρ 1260 ) / ( ρ 870 + ρ 1260 )
NDWI3Norm. Diff. Water Index 1640 nm ( ρ 860 ρ 1640 ) / ( ρ 860 + ρ 1640 )
NDWI4Norm. Diff. Water Index 2130 nm ( ρ 858 ρ 2130 ) / ( ρ 858 + ρ 2130 )
SIWSIShortwave Infrared Water Stress Index ( ρ 1640 ρ 858 ) / ( ρ 1640 + ρ 858 )
SRWISimple Ratio Water Index ρ 860 / ρ 1240
SRWI1Simple Ratio Water Index 1 ρ 1350 / ρ 870
SRWI2Simple Ratio Water Index 2 ρ 880 / ρ 1265
TM57Ratio of Thematic Mapper B5 to B7 ρ 1650 / ρ 2220
WBIWater Band Index ρ 970 / ρ 900
Table A2. Result of t-test analysis between treatments for narrow-band hyperspectral indices (NBHIs) and inverted plant traits (PTs) used in this study over the ten-week period. The p values are color-coded according to the strength of the significance. Pink shaded cells indicate p < 0.001, orange cells indicate p < 0.01, and yellow indicates p < 0.05.
WEEK
INDEX TYPEVariable12345678910
Chlorophyll IndicesCI0.48010.14550.3960.14650.22810.209390.051950.12140.040520.0272
GM10.60980.46770.94660.73440.9950.946770.575950.423010.307060.40718
GM20.50110.11460.3510.13470.21760.196230.043580.078380.023350.014
MCARI0.26980.61460.35980.76490.4910.760660.971330.179250.412890.80623
TCARI0.26980.61460.35980.76490.4910.760660.971330.179250.412890.80623
PSSRb0.51610.1050.29520.12080.20.148980.020550.015560.002510.00184
VOG0.46040.16610.4120.14770.23060.210260.054930.146860.053240.03797
Structural IndicesNDVI0.5260.05080.03920.04870.11720.068270.006910.001820.000510.00179
OSAVI0.52670.05090.03940.04880.11740.068610.006940.001830.000520.00181
RDVI0.7430.09370.12370.11340.2120.219970.028040.012110.004280.02006
Photochemical IndicesPRI0.64040.51130.27090.21680.16070.07260.088850.151480.088690.03136
MPRI0.68950.2430.21810.17380.41970.215940.151590.125110.168240.11244
Water IndicesDatt10.09090.06940.13080.01260.0140.010270.00020.000260.00050.00008
Datt20.10390.0960.21120.02030.02830.018960.000420.000310.000830.00011
DDI0.28130.1420.30130.04310.05210.100090.002370.002640.002990.00101
fWBI0.45870.58750.19770.24590.19190.29190.013280.001440.064140.01223
GVMI0.09730.10920.18120.01050.01770.013320.00020.000060.000220.00004
LWI0.04220.11320.03850.00350.01470.01340.000470.000060.000380.00006
MSI0.1020.11370.1810.01070.01730.013310.000190.000060.000270.00006
MSI10.07460.04880.19790.01170.03430.014630.000240.000160.000140.00003
MSI20.11310.25850.13320.12180.19010.08420.015460.0060.015970.00095
NDII0.09740.10930.18150.01050.01770.013350.00020.000060.000220.00004
NDWI10.32080.81720.8510.29570.32890.091960.022150.000540.008850.00227
NDWI20.34310.82970.85320.31160.32590.096840.026690.000520.008660.00205
NDWI30.09870.10120.23990.01380.03110.015690.000280.000090.000230.00004
NDWI40.04740.05540.07080.00350.00870.00470.000070.000030.000110.00005
SIWSI0.09810.10110.24340.01410.03180.015840.00030.000090.000230.00004
SRWI0.31860.80980.84710.29580.3260.09090.022540.000520.008710.00215
SRWI10.17850.44340.41940.09630.15020.055130.003810.000330.003820.00072
SRWI20.3450.80090.84220.29230.31940.091670.023120.00050.007370.00169
TM570.06280.06530.04720.00570.0110.006080.000110.000060.000190.00001
WBI0.53350.70060.21540.36130.31330.236630.020990.002730.102970.01816
            
INVERTED PLANT TRAITSCab0.4156950.0784120.123090.0636790.1470180.067170.0113080.0154960.0034190.001288
Car0.994670.4996250.8604990.6353630.7413830.7904020.2774730.0973960.1634810.095901
Ant0.6648190.6101470.9723040.8280260.97650.9809570.7503060.6167340.4624380.613397
EWTinv0.0422790.1486370.0478290.0079790.0175040.0028670.0005380.0002820.0007463.41 × 10−6
Figure A1. Mean spectral variation between treatments over the course of the experiment. Significantly different (p < 0.05) spectral regions are highlighted in yellow, and week 7 has been excluded for conciseness.
Remotesensing 17 00463 g0a1
Figure A2. Variation in treatment significance (as indicated by p value) in reflectance against wavelength for the 11 captures, obtained from (a) weeks 1 to 5 and (b) weeks 6 to 10. The dashed line is drawn at p = 0.05. Note that the y-axis is a log scale.
Remotesensing 17 00463 g0a2
Figure A3. Comparison of measured and inverted EWT values for pooled data from both treatments. The 1:1 line is shown as a black dashed line.
Remotesensing 17 00463 g0a3

References

  1. Steward, G.A.; Beveridge, A.E. A review of New Zealand kauri (Agathis australis (D. Don) Lindl.): Its ecology, history, growth and potential for management for timber. N. Z. J. For. Sci. 2010, 40, 33–59. [Google Scholar]
  2. Wardle, D.A. Communities and Ecosystems: Linking the Aboveground and Belowground Components; Princeton University Press: Princeton, NJ, USA, 2002. [Google Scholar]
  3. Craig, R.; Taonui, R.; Wild, S. The concept of taonga in Māori culture: Insights for accounting. Account. Audit. Account. J. 2012, 25, 1025–1047. [Google Scholar] [CrossRef]
  4. McDowell, N.; Pockman, W.T.; Allen, C.D.; Breshears, D.D.; Cobb, N.; Kolb, T.; Plaut, J.; Sperry, J.; West, A.; Williams, D.G.; et al. Mechanisms of plant survival and mortality during drought: Why do some plants survive while others succumb to drought? New Phytol. 2008, 178, 719–739. [Google Scholar] [CrossRef] [PubMed]
  5. Beever, R.E.; Waipara, N.W.; Ramsfield, T.D.; Dick, M.A.; Horner, I.J. Kauri (Agathis australis) under threat from Phytophthora? Phytophthoras For. Nat. Ecosyst. 2009, 74, 74–85. [Google Scholar]
  6. Allen, C.D.; Macalady, A.K.; Chenchouni, H.; Bachelet, D.; McDowell, N.; Vennetier, M.; Kitzberger, T.; Rigling, A.; Breshears, D.D.; Hogg, E.T.; et al. A global overview of drought and heat-induced tree mortality reveals emerging climate change risks for forests. For. Ecol. Manag. 2010, 259, 660–684. [Google Scholar] [CrossRef]
  7. Jactel, H.; Petit, J.; Desprez-Loustau, M.L.; Delzon, S.; Piou, D.; Battisti, A.; Koricheva, J. Drought effects on damage by forest insects and pathogens: A meta-analysis. Glob. Change Biol. 2012, 18, 267–276. [Google Scholar] [CrossRef]
  8. Seidl, R.; Schelhaas, M.J.; Lexer, M.J. Unraveling the drivers of intensifying forest disturbance regimes in Europe. Glob. Change Biol. 2011, 17, 2842–2852. [Google Scholar] [CrossRef]
  9. Carter, G.A.; Knapp, A.K. Leaf optical properties in higher plants: Linking spectral characteristics to stress and chlorophyll concentration. Am. J. Bot. 2005, 88, 677–684. [Google Scholar] [CrossRef]
  10. Meiforth, J.J.; Buddenbaum, H.; Hill, J.; Shepherd, J.D.; Dymond, J.R. Stress Detection in New Zealand Kauri Canopies with WorldView-2 Satellite and LiDAR Data. Remote Sens. 2020, 12, 1906. [Google Scholar] [CrossRef]
  11. Meiforth, J.J.; Buddenbaum, H.; Hill, J.; Shepherd, J. Monitoring of Canopy Stress Symptoms in New Zealand Kauri Trees Analysed with AISA Hyperspectral Data. Remote Sens. 2020, 12, 926. [Google Scholar] [CrossRef]
  12. Watt, M.S.; Buddenbaum, H.; Leonardo, E.M.C.; Estarija, H.J.; Bown, H.E.; Gomez-Gallego, M.; Hartley, R.J.L.; Pearse, G.D.; Massam, P.; Wright, L.; et al. Monitoring biochemical limitations to photosynthesis in N and P-limited radiata pine using plant functional traits quantified from hyperspectral imagery. Remote Sens. Environ. 2020, 248, 112003. [Google Scholar] [CrossRef]
  13. Watt, M.S.; Bartlett, M.; Soewarto, J.; de Silva, D.; Estarija, H.J.C.; Massam, P.; Cajes, D.; Yorston, W.; Graevskaya, E.; Dobbie, K. Previsual and early detection of myrtle rust on rose apple using indices derived from thermal imagery and visible-to-short-infrared spectroscopy. Phytopathology 2023, 113, 1405–1416. [Google Scholar] [CrossRef] [PubMed]
  14. Zarco-Tejada, P.J.; Gonzalez-Dugo, V.; Berni, J.A.J. Fluorescence, temperature and narrow-band indices acquired from a UAV platform for water stress detection using a micro-hyperspectral imager and a thermal camera. Remote Sens. Environ. 2012, 117, 322–337. [Google Scholar] [CrossRef]
  15. Zarco-Tejada, P.J.; Pushnik, J.C.; Dobrowski, S.; Ustin, S.L. Hyperspectral remote sensing of photosynthetic pigment concentrations and photosynthetic efficiency in stressed crops. Remote Sens. Environ. 2018, 113, 38–54. [Google Scholar]
  16. Hernández-Clemente, R.; Hornero, A.; Mottus, M.; Penuelas, J.; González-Dugo, V.; Jiménez, J.C.; Suárez, L.; Alonso, L.; Zarco-Tejada, P.J. Early Diagnosis of Vegetation Health From High-Resolution Hyperspectral and Thermal Imagery: Lessons Learned From Empirical Relationships and Radiative Transfer Modelling. Curr. For. Rep. 2019, 5, 169–183. [Google Scholar] [CrossRef]
  17. Sims, D.A.; Gamon, J.A. Relationships between leaf pigment content and spectral reflectance across a wide range of species, leaf structures and developmental stages. Remote Sens. Environ. 2002, 81, 337–354. [Google Scholar] [CrossRef]
  18. Okyere, F.G.; Cudjoe, D.K.; Virlet, N.; Castle, M.; Riche, A.B.; Greche, L.; Mohareb, F.; Simms, D.; Mhada, M.; Hawkesford, M.J. Hyperspectral Imaging for Phenotyping Plant Drought Stress and Nitrogen Interactions Using Multivariate Modeling and Machine Learning Techniques in Wheat. Remote Sens. 2024, 16, 3446. [Google Scholar] [CrossRef]
  19. Homolová, L.; Malenovský, Z.; Clevers, J.G.P.W.; García-Santos, G.; Schaepman, M.E. Review of optical-based remote sensing for plant trait mapping. Ecol. Complex. 2013, 15, 1–16. [Google Scholar] [CrossRef]
  20. Cranston, B.M.; Powers, B.F.; Macinnis-Ng, C. Inexpensive Throughfall Exclusion Experiment for Single Large Trees. Appl. Plant Sci. 2020, 8, e11325. [Google Scholar] [CrossRef]
  21. Rhodes, G.G. Physiological Responses of Three Native Plants to Drought and Heatwave. Master Thesis, The University of Auckland, Auckland, New Zealand, 2024. Available online: https://hdl.handle.net/2292/68823 (accessed on 5 November 2024).
  22. Jones, H.G. Stomatal control of photosynthesis and transpiration. J. Exp. Bot. 1998, 49, 387–398. [Google Scholar] [CrossRef]
  23. Flexas, J.; Medrano, H. Drought-inhibition of photosynthesis in C3 plants: Stomatal and non-stomatal limitations revisited. Ann. Bot. 2002, 89, 183–189. [Google Scholar] [CrossRef] [PubMed]
  24. Macinnis-Ng, C.; Webb, T.; Lin, Y.S.; Schwendenmann, L.; Medlyn, B. Leaf age-related and diurnal variation in gas exchange of kauri (Agathis australis). N. Z. J. Bot. 2016, 55, 80–99. [Google Scholar] [CrossRef]
  25. Féret, J.-B.; Gitelson, A.A.; Noble, S.D.; Jacquemoud, S. PROSPECT-D: Towards modeling leaf optical properties through a complete lifecycle. Remote Sens. Environ. 2017, 193, 204–215. [Google Scholar] [CrossRef]
  26. Féret, J.B.; François, C.; Gitelson, A.; Asner, G.P.; Barry, K.M.; Panigada, C.; Richardson, A.D.; Jacquemoud, S. Optimizing spectral indices and chemometric analysis of leaf chemical properties using radiative transfer modeling. Remote Sens. Environ. 2011, 115, 2742–2750. [Google Scholar] [CrossRef]
  27. Watt, M.S.; Estarija, H.J.C.; Bartlett, M.; Main, R.; Pasquini, D.; Yorston, W.; McLay, E.; Zhulanov, M.; Dobbie, K.; Wardhaugh, K.; et al. Early Detection of Myrtle Rust on Pōhutukawa Using Indices Derived from Hyperspectral and Thermal Imagery. Remote Sens. 2024, 16, 1050. [Google Scholar] [CrossRef]
  28. Wyse, S.V.; Macinnis-Ng, C.; Burns, B.R.; Clearwater, M.J.; Schwendenmann, L. Species assemblage patterns around a dominant emergent tree are associated with drought resistance. Tree Physiol. 2013, 33, 1269–1283. [Google Scholar] [CrossRef]
  29. Jones, H.G.; Higgs, K.H. Water Potential—Water Content Relationships In Apple Leaves. J. Exp. Bot. 1979, 30, 965–970. Available online: http://www.jstor.org/stable/23688948 (accessed on 5 November 2024). [CrossRef]
  30. Duursma, R.A.; Blackman, C.J.; Lopéz, R.; Martin-StPaul, N.K.; Cochard, H.; Medlyn, B.E. On the Minimum Leaf Conductance: Its Role in Models of Plant Water Use, and Ecological and Environmental Controls. New Phytol. 2019, 221, 693–705. [Google Scholar] [CrossRef]
  31. Emmerichs, T.; Lu, Y.-S.; Taraborrelli, D. The influence of plant water stress on vegetation–atmosphere exchanges: Implications for ozone modelling. Atmos. Chem. Phys. 2021, 21, 16419–16441. [Google Scholar] [CrossRef]
  32. Stephens, D.W.; Silvester, W.B.; Burns, B.R. Differences in water-use efficiency between Agathis australis and Dacrycarpus dacrydioides are genetically, not environmentally, determined. N. Z. J. Bot. 1999, 37, 361–367. [Google Scholar] [CrossRef]
  33. Ripullone, F.; Grassi, G.; Lauteri, M.; Borghetti, M. Photosynthesis–nitrogen relationships: Interpretation of different patterns between Pseudotsuga menziesii and Populus x euroamericana in a mini-stand experiment. Tree Physiol. 2003, 23, 137–144. [Google Scholar] [CrossRef] [PubMed]
  34. Verrelst, J.; Alonso, L.; Camps-Valls, G.; Delegido, J.; Moreno, J. Retrieval of vegetation biophysical parameters using Gaussian process techniques. IEEE Trans. Geosci. Remote Sens. 2012, 50, 1832–1843. [Google Scholar] [CrossRef]
  35. Devi, A.S. Influence of trees and associated variables on soil organic carbon: A review. J. Ecol. Environ. 2021, 45, 5. [Google Scholar] [CrossRef]
  36. Vélez, S.; Martínez-Peña, R.; Castrillo, D. Beyond Vegetation: A Review Unveiling Additional Insights into Agriculture and Forestry through the Application of Vegetation Indices. J 2023, 6, 421–436. [Google Scholar] [CrossRef]
  37. Lo, A.; Chernoff, H.; Zheng, T.; Lo, S.H. Why significant variables aren't automatically good predictors. Proc. Natl. Acad. Sci. USA 2015, 112, 13892–13897. [Google Scholar] [CrossRef]
  38. Yu, S.; Fan, J.; Lu, X.; Wen, W.; Shao, S.; Liang, D.; Yang, X.; Guo, X.; Zhao, C. Deep learning models based on hyperspectral data and time-series phenotypes for predicting quality attributes in lettuces under water stress. Comput. Electron. Agric. 2023, 211, 108034. [Google Scholar] [CrossRef]
  39. Das Choudhury, S.; Saha, S.; Samal, A.; Mazis, A.; Awada, T. Drought stress prediction and propagation using time series modeling on multimodal plant image sequences. Front. Plant Sci. 2023, 14, 1003150. [Google Scholar] [CrossRef]
  40. Dao, P.D.; He, Y.; Proctor, C. Plant drought impact detection using ultra-high spatial resolution hyperspectral images and machine learning. Int. J. Appl. Earth Obs. Geoinf. 2021, 102, 102364. [Google Scholar] [CrossRef]
  41. Garbulsky, M.F.; Peñuelas, J.; Gamon, J.; Inoue, Y.; Filella, I. The photochemical reflectance index (PRI) and the remote sensing of leaf, canopy and ecosystem radiation use efficiencies: A review and meta-analysis. Remote Sens. Environ. 2011, 115, 281–297. [Google Scholar] [CrossRef]
  42. Peñuelas, J.; Garbulsky, M.F.; Filella, I. Photochemical reflectance index (PRI) and remote sensing of plant CO2 uptake. New Phytol. 2011, 191, 596–599. [Google Scholar] [CrossRef]
  43. Wong, C.Y.S.; Gamon, J.A. The photochemical reflectance index provides an optical indicator of spring photosynthetic activation in evergreen conifers. New Phytol. 2015, 206, 196–208. [Google Scholar] [CrossRef] [PubMed]
  44. Wong, C.Y.S.; Gamon, J.A. Three causes of variation in the photochemical reflectance index (PRI) in evergreen conifers. New Phytol. 2015, 206, 187–195. [Google Scholar] [CrossRef] [PubMed]
  45. Gamon, J.A.; Huemmrich, K.F.; Wong, C.Y.S.; Ensminger, I.; Garrity, S.; Hollinger, D.Y.; Noormets, A.; Peñuelas, J. A remotely sensed pigment index reveals photosynthetic phenology in evergreen conifers. Proc. Natl. Acad. Sci. USA 2016, 113, 13087–13092. [Google Scholar] [CrossRef] [PubMed]
  46. Anderegg, W.R.L.; Kane, J.M.; Anderegg, L.D.L. Consequences of widespread tree mortality triggered by drought and temperature stress. Nat. Clim. Change 2013, 3, 30–36. [Google Scholar] [CrossRef]
  47. Choat, B.; Brodribb, T.J.; Brodersen, C.R.; Duursma, R.A.; López, R.; Medlyn, B.E. Triggers of tree mortality under drought. Nature 2018, 558, 531–539. [Google Scholar] [CrossRef]
Figure 1. Leaf-level hyperspectral measurements using the spectroradiometer leaf clip with its independent light source.
Remotesensing 17 00463 g001
Figure 2. Variation in (a) soil water content, (b) equivalent water thickness (EWT), (c) stomatal conductance, and (d) assimilation rate between treatments from week 1 to 10. Whiskers represent ±1.5 × the interquartile range. Box plots with asterisks above them represent significance denoted by * p < 0.05, ** p < 0.01, and *** p < 0.001.
Remotesensing 17 00463 g002
Table 1. Summary of different Random Forest (RF) models used in this study. The narrow-band hyperspectral indices (NBHIs) and inverted plant traits (PTs) were used as input variables in the models. The input features include bands from the visible near-infrared (VNIR) and shortwave infrared (SWIR) ranges.
Random Forest (RF) ModelInput Features
Single-Date (SD) SD-RF1all NBHIs
SD-RF2all NBHIs + PTs
Multitemporal (M)M-RF1all NBHIs
M-RF2all NBHIs + PTs
M-RF3VNIR NBHIs only + PTs
M-RF4SWIR NBHIs only + PTs
Table 2. Performance of single-date (SD) and multitemporal (M) Random Forest (RF) models. The RF models listed in the table are fully described in Table 1.
F1 Score
Single-Date (SD)Multitemporal (M)
WeekSD-RF1SD-RF2M-RF1M-RF2M-RF3M-RF4
10.580.580.570.560.600.56
20.580.600.660.690.760.68
30.620.620.780.790.80.73
40.630.620.80.790.810.76
50.610.60.840.830.810.78
60.570.620.860.860.810.83
70.640.620.870.880.850.85
80.640.640.860.900.880.84
90.700.710.870.870.850.85
100.670.710.830.860.860.81
       
LEGEND: 0.7 < F1 score 0.80.8 < F1 score ≤ 0.90.9 < F1 score
(Good/Satisfactory)(Excellent)(Outstanding)
Disclaimer/Publisher’s Note: The statements, opinions and data contained in all publications are solely those of the individual author(s) and contributor(s) and not of MDPI and/or the editor(s). MDPI and/or the editor(s) disclaim responsibility for any injury to people or property resulting from any ideas, methods, instructions or products referred to in the content.

