Article

AGFNet: Adaptive Guided Scanning and Frequency-Enhanced Network for High-Resolution Remote Sensing Building Change Detection

1
College of Computer and Cyber Security, Hebei Normal University, Shijiazhuang 050010, China
2
Hebei Digital Education Collaborative Innovation Center, Shijiazhuang 050010, China
3
Information Technology Center, Hebei Normal University, Shijiazhuang 050010, China
4
School of Mathematical Sciences, Hebei Normal University, Shijiazhuang 050010, China
*
Author to whom correspondence should be addressed.
Remote Sens. 2025, 17(23), 3844; https://doi.org/10.3390/rs17233844
Submission received: 15 October 2025 / Revised: 17 November 2025 / Accepted: 26 November 2025 / Published: 27 November 2025

Highlights

  • What are the main findings?
  • An adaptive scanning strategy is proposed to make the state-space model more compatible with the characteristics and requirements of change detection tasks.
  • An early explicit guidance mechanism and a lightweight frequency-domain enhancement module are designed to further exploit and utilize cross-temporal differential features.
  • What are the implications of the main findings?
  • The proposed method significantly improves the accuracy and robustness of change detection under complex scenarios.
  • It provides a general, efficient, and scalable framework for high-resolution remote sensing change detection, which can be extended to various scenes and tasks.

Abstract

Change detection in high-resolution remote sensing imagery is vital for applications such as urban expansion monitoring, land-use analysis, and disaster assessment. However, existing methods often underutilize the differential features of bi-temporal images and struggle with complex backgrounds, illumination variations, and pseudo-changes, which hinder accurate identification of true changes. To address these challenges, this paper proposes a Siamese change detection network that integrates an adaptive scanning state-space model with frequency-domain enhancement. The backbone is constructed using Visual State Space (VSS) Blocks, and a Cross-Spatial Guidance Attention (CSGA) module is designed to explicitly guide cross-temporal feature alignment, thereby enhancing the reliability of differential feature representation. Furthermore, a Frequency-guided Adaptive Difference Module (FADM) is developed to apply adaptive low-pass filtering, effectively suppressing textures, noise, illumination variations, and sensor discrepancies while reinforcing spatial-domain differences to emphasize true changes. Finally, a Dual-Stage Multi-Scale Residual Integrator (DS-MRI) is introduced, incorporating both VSS Blocks and the newly designed Attention-Guided State Space (AGSS) Blocks. Unlike fixed scanning mechanisms, AGSS dynamically generates scanning sequences guided by CSGA, enabling a task-adaptive and context-aware decoding strategy. Extensive experiments on three public datasets (LEVIR-CD, WHU-CD, and SYSU-CD) demonstrate that the proposed method surpasses mainstream approaches in both accuracy and efficiency, exhibiting superior robustness under complex backgrounds and in weak-change scenarios.

1. Introduction

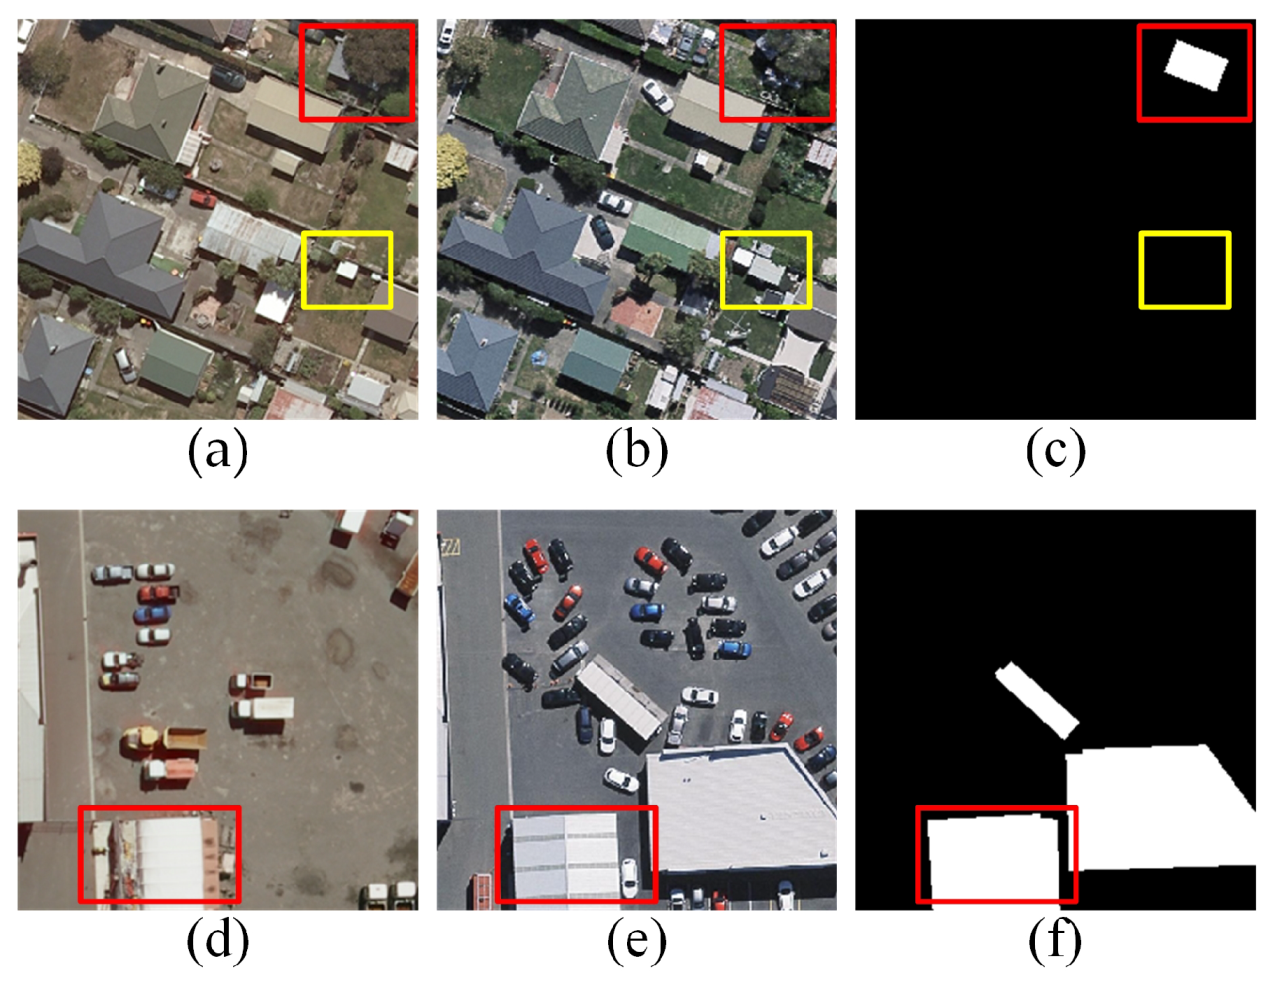
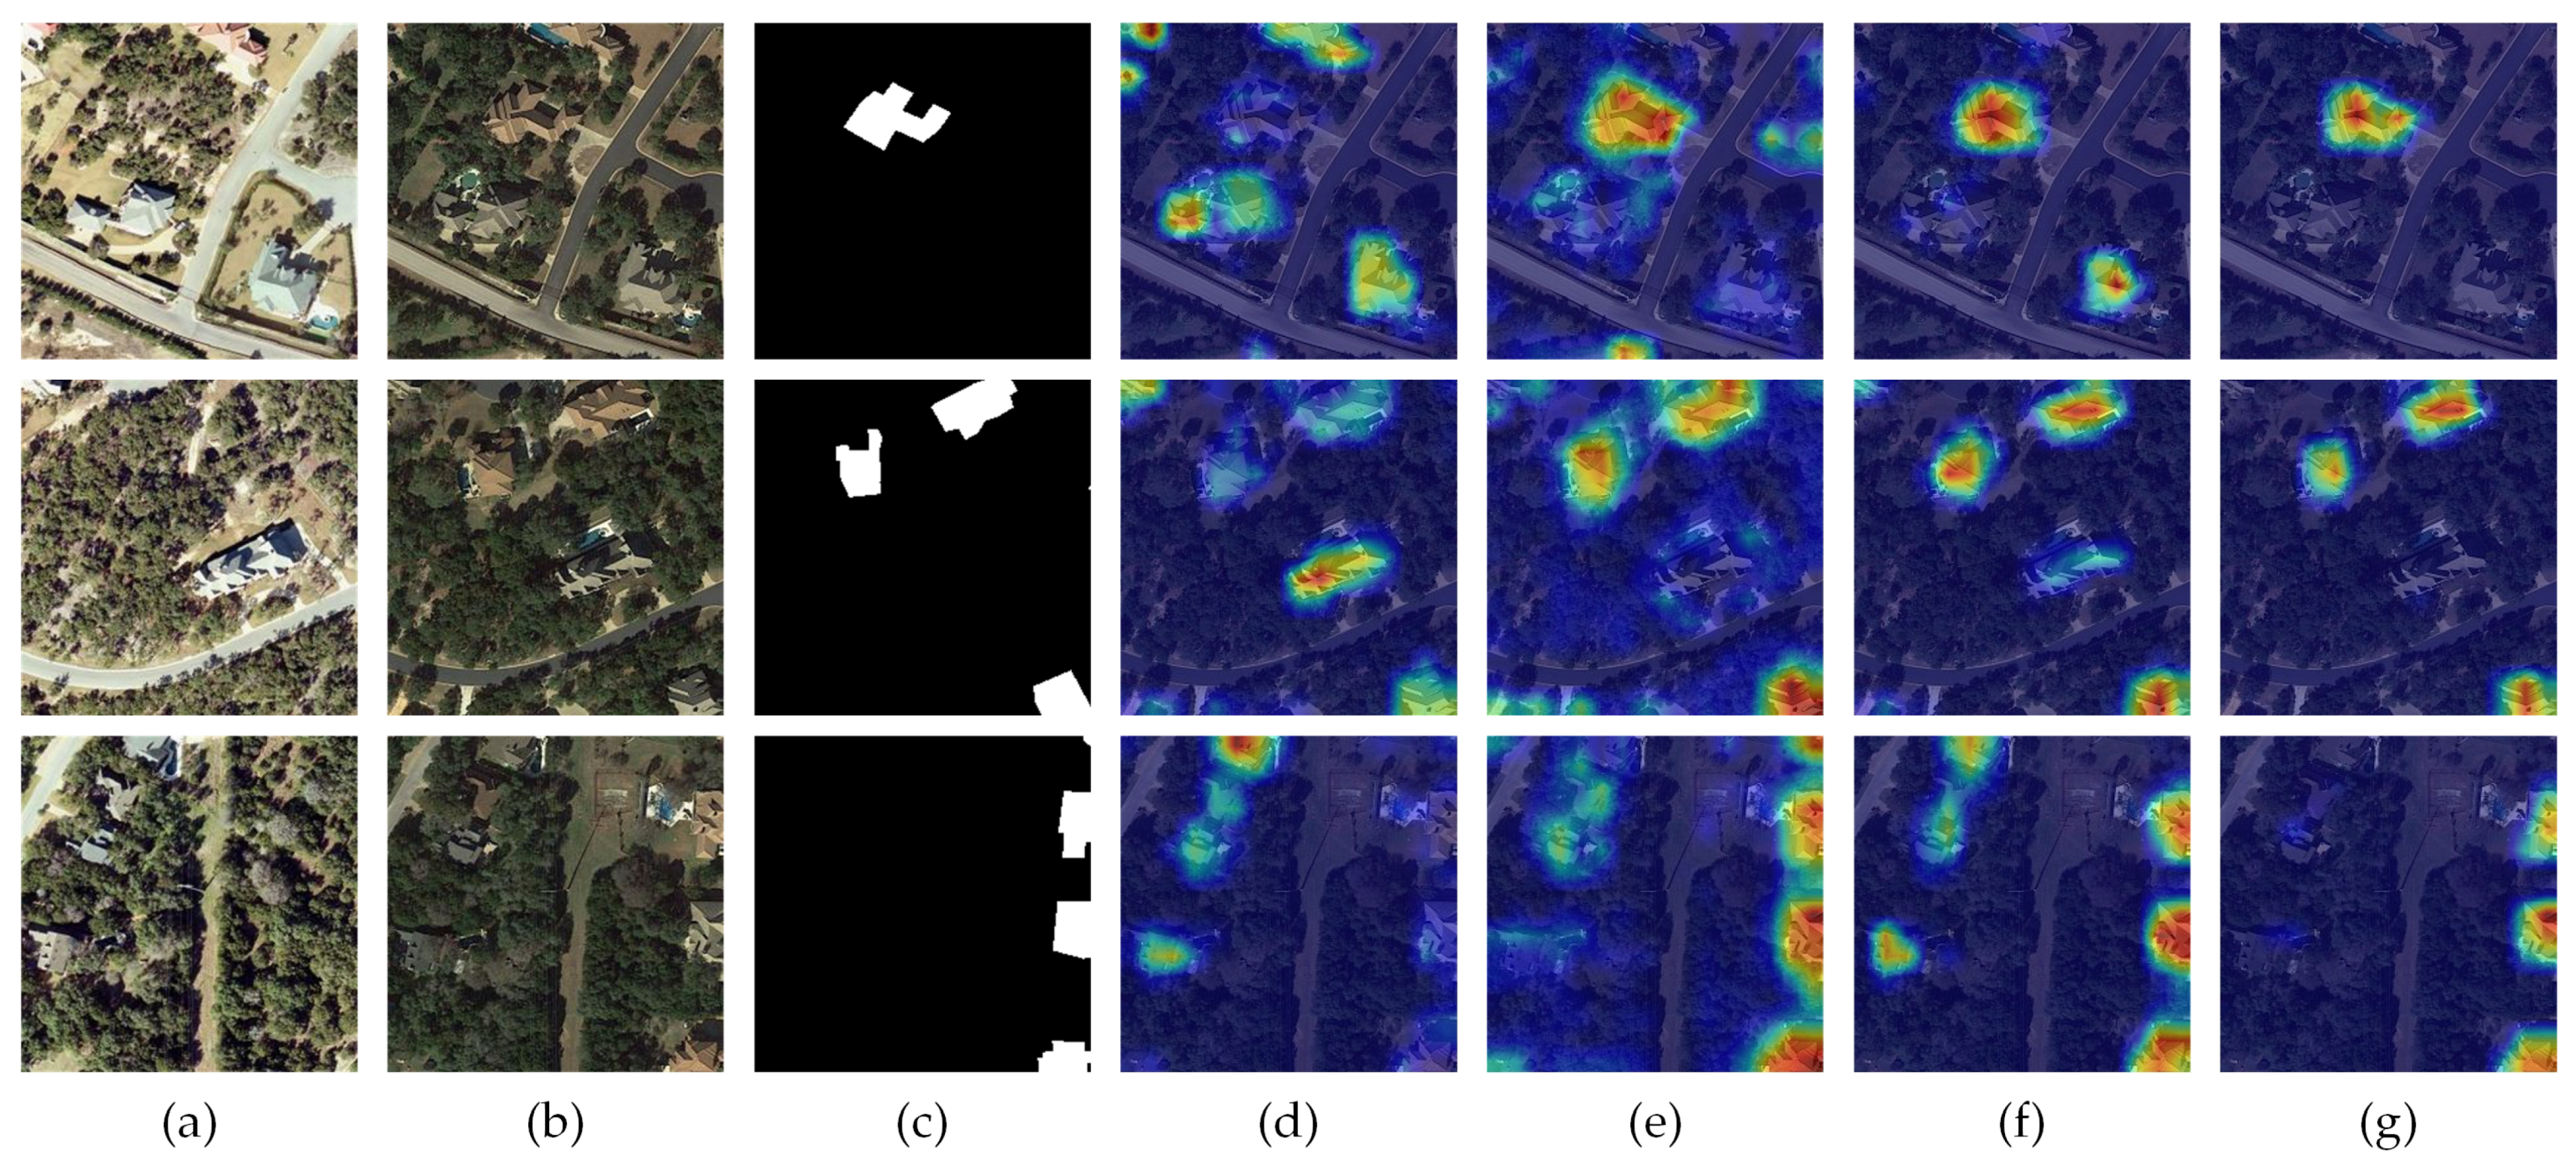
Change detection aims to identify surface changes by comparing multi-temporal remote sensing images. It has broad applications, including disaster assessment [1], environmental monitoring [2], urban planning [3], and military reconnaissance [4]. Recent advances in earth-observation sensors have made high-resolution imagery increasingly accessible, thereby driving the evolution of change detection methods. However, this progress also brings new challenges, such as inter-sensor discrepancies, seasonal and illumination variations, pseudo-changes, and complex scene characteristics including occlusions, shadows, and diverse textures. To illustrate these issues, Figure 1 presents a representative example: regions (a–c) demonstrate the difficulty of distinguishing true changes from pseudo-changes caused by tree occlusions and non-target objects, whereas regions (d–f) depict a building replaced by a new structure, which—despite their high visual similarity—still constitutes a true change.
Prior to deep learning, change detection relied on three traditional paradigms: algebra-based, transformation-based, and classification-based methods. Algebra-based methods construct difference maps via image differencing, ratioing, or regression analysis, followed by thresholding to identify changed pixels. In transformation-based methods, Principal Component Analysis (PCA) [5,6] and Change Vector Analysis (CVA) [7] are the most commonly used statistical techniques, which identify changes by mapping spectral features into transformed spaces. Classification-based methods utilize classifiers such as K-means or SVM [8,9] to categorize pixels into changed and unchanged classes. However, these methods are highly sensitive to image quality, radiometric consistency, and noise. The proliferation of high-resolution imagery, with its rich details and variations, has outpaced the capacity of these methods to model complex scenes accurately.
Deep learning has opened up promising new avenues for change detection, significantly improving both accuracy and efficiency. Since Daudt et al. [10] introduced FCNs [11] to this task, CNN-based methods have long dominated the field. To meet the demands of change detection, researchers have successively proposed various innovative network architectures. For instance, IFN [12] enhances multi-scale features via deep supervision and fusion, while FC-Siam-diff-PA [13] improves differential feature extraction through a pyramid attention layer built upon FC-Siam-diff [10]. Despite strong performance on public datasets, CNNs’ limited receptive fields hinder long-range dependency capture and global modeling. Consequently, existing methods struggle with accurate detection in complex scenarios involving significant cross-temporal and cross-resolution variations.
Since Dosovitskiy et al. [14] introduced Vision Transformer (ViT), Transformers have overcome CNNs’ global modeling limitations. Through self-attention, ViT captures local-global feature relationships for richer contextual representation. This has spurred numerous Transformer-based change detection approaches. For example, ChangeFormer [15] employs a purely Transformer encoder, achieving competitive performance on multiple benchmarks, while BIT [16] integrates semantic labels to enhance change region perception and global modeling. However, Transformers’ quadratic complexity with input size incurs prohibitive overhead for dense prediction on high-resolution imagery. To mitigate this, Swin Transformer [17] employs window-based attention, reducing computation and serving as the backbone in models like SwinSUNet [18]. Nonetheless, window partitioning inherently constrains the global receptive field, leaving long-range dependency modeling incompletely resolved.
Recent studies have introduced State Space Model (SSM) architectures to balance global modeling with computational efficiency. Mamba [19] exemplifies this approach, leveraging structured state space modeling for efficient long-sequence modeling with linear complexity, and demonstrating strong performance in NLP [20,21] and vision tasks [22,23]. SSMs capture global dependencies while reducing computational cost, offering an emerging alternative to Transformers for dense prediction in remote sensing [24,25,26,27,28]. However, existing SSM-based methods remain limited by their reliance on fixed scanning directions, lacking adaptability for complex change regions.
Currently, deep learning-based change detection methods generally consist of three key stages: bi-temporal feature extraction, difference feature generation, and multi-scale feature fusion with classification. Although existing models have achieved notable progress in terms of accuracy, they still suffer from certain limitations. First, most methods encode bi-temporal images independently, neglecting cross-temporal interaction. This yields insufficient cross-temporal representation and undermines difference feature quality. Second, current difference generation methods rely on simple concatenation or absolute difference, neglecting rich frequency-domain information and limiting downstream classification accuracy.
To tackle the limitations of existing methods, this paper proposes AGFNet, a novel change detection model that integrates Visual State Space Models with a two-dimensional Discrete Cosine Transform (2D-DCT). AGFNet is designed to address three key challenges: (1) the lack of explicit interaction in Siamese encoders, which leads to underutilized spatiotemporal features; (2) the sensitivity of difference features to high-frequency noise, which results in pervasive pseudo-changes; and (3) the inflexibility of fixed scanning orders in SSMs, which hinders the modeling of irregular structural changes. To this end, AGFNet introduces three core components. First, the Cross-Spatial Guidance Attention (CSGA) module is embedded into the Visual State Space (VSS) backbone to enable direct spatial interaction between bi-temporal features during encoding, thereby producing richer and more discriminative spatiotemporal representations. Second, the Frequency-guided Adaptive Difference Module (FADM) applies lightweight adaptive filtering in the frequency domain to suppress high-frequency noise and enhance genuine change cues, effectively reducing pseudo-changes. Finally, in the decoding stage, the Dual-Stage Multi-Scale Residual Integrator (DS-MRI) incorporates an Attention-Guided State Space (AGSS) block, which dynamically adjusts its scanning sequence based on attention maps from CSGA. By progressively integrating and reconstructing multi-scale features, AGFNet achieves efficient and accurate change detection.
The main contributions of this paper are summarized as follows:
  • AGFNet builds a Siamese feature extraction backbone based on VSS Blocks and introduces the CSGA module. Unlike traditional Siamese networks that extract features independently, CSGA enables explicit interaction and guidance between bi-temporal images during the extraction stage, effectively enhancing cross-temporal feature alignment and representation while reducing the interference of pseudo-changes in subsequent modeling.
  • The FADM is designed to address the challenge that high-frequency noise and texture differences often cause pseudo-changes. It employs lightweight adaptive frequency-domain filtering to suppress high-frequency pseudo-change components, integrates a channel attention mechanism to align frequency-domain channels, and enhances true change differences in the spatial domain, thereby significantly improving the discriminability of difference features.
  • We propose DS-MRI and the Adaptive Guided Scanning (AGSS) mechanism. AGSS adaptively adjusts scanning sequences using attention maps generated by CSGA, breaking the limitations of fixed scanning patterns. This enables dynamic modeling of irregular change patterns and further enhances multi-scale feature fusion and change region reconstruction.
  • Extensive experiments on multiple public change detection datasets demonstrate the superior performance of AGFNet. The results show that our method achieves higher accuracy and robustness than existing mainstream approaches under lower computational complexity, with particularly strong performance in complex backgrounds and weak-change scenarios.
The remainder of this paper is organized as follows: Section 2 reviews the related work; Section 3 presents the detailed methodology of AGFNet; Section 4 reports experimental results and discussion; Section 5 concludes the paper.

2. Related Works

This section provides a review of deep learning-based change detection methods for remote sensing imagery.

2.1. CNN-Based CD Methods

The introduction of convolutional neural networks (CNNs) has significantly advanced change detection in remote sensing imagery. By leveraging their strong capability in local feature extraction, CNN-based methods have achieved substantial improvements in detection accuracy over traditional approaches. Most existing methods adopt a Siamese architecture in which bi-temporal images are encoded independently, and difference maps are generated through simple operations such as concatenation or subtraction. Daudt et al. [10] pioneered this direction by proposing three fully convolutional network (FCN) architectures based on U-Net [29], which validated the effectiveness of end-to-end learning and established an important foundation for subsequent research. Building on this line of work, later studies have explored various improvements in feature extraction and fusion. For example, DSIFN [12] employs a dual-stream FCN with deep supervision; Ref. [30] integrates dense connections with channel attention to enhance feature discriminability; Ref. [31] introduces multi-scale decoupled convolutions together with a spatial–spectral collaborative modeling strategy; and Ref. [32] further designs a spatio-temporal difference enhancement module that combines the strengths of multiple operations.
However, CNNs are inherently constrained by their limited receptive fields, which makes it difficult for them to effectively model long-range dependencies and global contextual information. This limitation becomes particularly pronounced in high-resolution remote sensing imagery, where models often lack robustness against disturbances such as illumination changes, seasonal variations, and registration errors. To alleviate this issue, several studies have incorporated self-attention mechanisms (e.g., DASNet [33], RCTNet [34]) or cross-scale fusion strategies. Although these approaches enhance sensitivity to subtle changes and improve generalization to some extent, the intrinsic structural limitations of CNNs still hinder further progress, thereby motivating the exploration of architectures with stronger global modeling capabilities.

2.2. Transformer-Based CD Methods

The breakthrough of Transformers in computer vision [14] has been rapidly adopted in remote sensing change detection, effectively addressing the limitations of CNNs in modeling long-range dependencies. By leveraging self-attention, Transformers capture global interactions among all pixels, enabling comprehensive contextual modeling that is particularly beneficial for change recognition in complex scenarios.
Several representative works illustrate this trend. ChangeFormer by Bandara et al. [15] employs a pure Transformer encoder to directly model global interactions between bi-temporal features, achieving precise change localization and demonstrating robustness to illumination and seasonal variations. BIT by Chen et al. [16] incorporates semantic tokens to enhance focus on fine-grained change regions, thereby refining global context modeling. Further innovations include DMINet [35], which integrates self- and cross-attention to improve feature representation while suppressing noise; a dense attention module proposed by Peng et al. [36], which leverages upsampling units to capture spatial context for land-cover changes; and MaskChanger [37], which reformulates change detection as a mask classification task using a Siamese encoder coupled with a Mask2Former [38] decoder, significantly improving object-level completeness and boundary precision.
Despite their superior global modeling capabilities, Transformers face a critical challenge: the quadratic computational complexity with respect to image size imposes a bottleneck for high-resolution dense prediction. To address this, various strategies have been proposed. For instance, Zhang et al. [18] integrated the Swin Transformer [17], which employs local window attention, into a U-Net backbone for efficient multi-scale feature extraction. Other approaches, such as Noman et al. [39], design lightweight models using sparse attention to focus computation on key regions. While these methods outperform CNNs in modeling long-range dependencies and complex scenes, the computational overhead remains a significant barrier to practical deployment, highlighting the need for more efficient global modeling architectures.

2.3. Mamba-Based CD Methods

Recent advances in State Space Models (SSMs), particularly Mamba, have attracted significant interest for their ability to model long-range dependencies with linear computational complexity. Unlike Transformers that rely on self-attention, Mamba [19] employs a selective scanning mechanism, enabling it to capture global contextual relationships efficiently. This capability is particularly beneficial for remote sensing change detection, where accurately modeling cross-temporal semantic relationships over large areas is as crucial as the alignment of local features.
In general computer vision, Mamba has been successfully adapted through architectures like Vision Mamba [23] and VMamba [22], which incorporate bidirectional and cross-scanning mechanisms for 2D image modeling, outperforming state-of-the-art models in tasks like classification and segmentation. This success has spurred its adoption in downstream domains. In medical image analysis, models such as VMUNetV2 [40], Mamba-Unet [41], UMamba [42], SegMamba [43], and LKMUnet [44] have demonstrated high accuracy. Similarly, in remote sensing image interpretation, RS3Mamba [26], UnetMamba [28], and CMUnet [27] have demonstrated Mamba’s strong potential for dense prediction tasks like semantic segmentation.
Encouraging progress has also been made in applying Mamba to change detection. For instance, CDMamba [45] integrates Mamba’s global modeling with convolutional layers for local enhancement and employs multi-scale feature fusion. ST-Mamba [46] performs collaborative scanning on concatenated bi-temporal features to leverage unified background information. RSMamba [47] designs an Omnidirectional Selective Scan module to better model complex remote sensing objects. ChangeMamba [48] introduces multiple framework variants tailored for different scenarios, incorporating spatiotemporal modeling mechanisms in the decoder. Collectively, these works establish Mamba as a lightweight and effective paradigm for global modeling in change detection, overcoming CNNs’ limited receptive fields while avoiding the quadratic complexity of Transformers.
Nevertheless, Mamba-based change detection research is still in its early stages. A key challenge that remains is designing state-space mechanisms that are more specifically aligned with the unique characteristics of bi-temporal remote sensing data, which represents an important direction for future work.

3. Methodology

3.1. Preliminaries

In recent years, SSMs have gradually emerged as a promising class of methods for handling long-sequence problems in deep learning. These models are based on linear time-invariance, with the core idea of modeling the dynamic evolution from input sequence x ( t ) R to output sequence y ( t ) R through recursive hidden variables h ( t ) R N . This enables long-range dependency modeling while maintaining computational efficiency. The key characteristic lies in describing the temporal evolution of hidden variables using a set of linear ordinary differential equations:
h ( t ) = A h ( t ) + B x ( t ) y ( t ) = C h ( t )
where N denotes the state space dimension, A R N × N represents the state transition matrix, B R N × 1 denotes the input matrix, and C R 1 × N represents the output matrix. To integrate SSMs into deep learning models, the continuous formulation must first be discretized using the Zero-Order Hold (ZOH) method applied to the continuous parameters A and B , as follows:
A ¯ = exp ( Δ A ) B ¯ = ( Δ A ) 1 exp ( Δ A ) I ( Δ B )
where A ¯ and B ¯ denote the state transition matrix and the input matrix at time step Δ , respectively, with the assumption that the input remains constant within each time step. After discretization, Equation (1) can be expressed as:
h ( t ) = A ¯ h ( t 1 ) + B ¯ x ( t ) y ( t ) = C h ( t )
The final output is then obtained through convolution operations.
However, the parameters in conventional state-space models are fixed, limiting their expressive capacity. To address this, Mamba [19] introduces a selective scanning mechanism that makes parameters Δ , B, and C data-dependent and learnable. Combined with hardware-aware algorithms, Mamba efficiently filters irrelevant information while extracting critical details, with linear computational complexity and memory consumption.

3.2. Overview

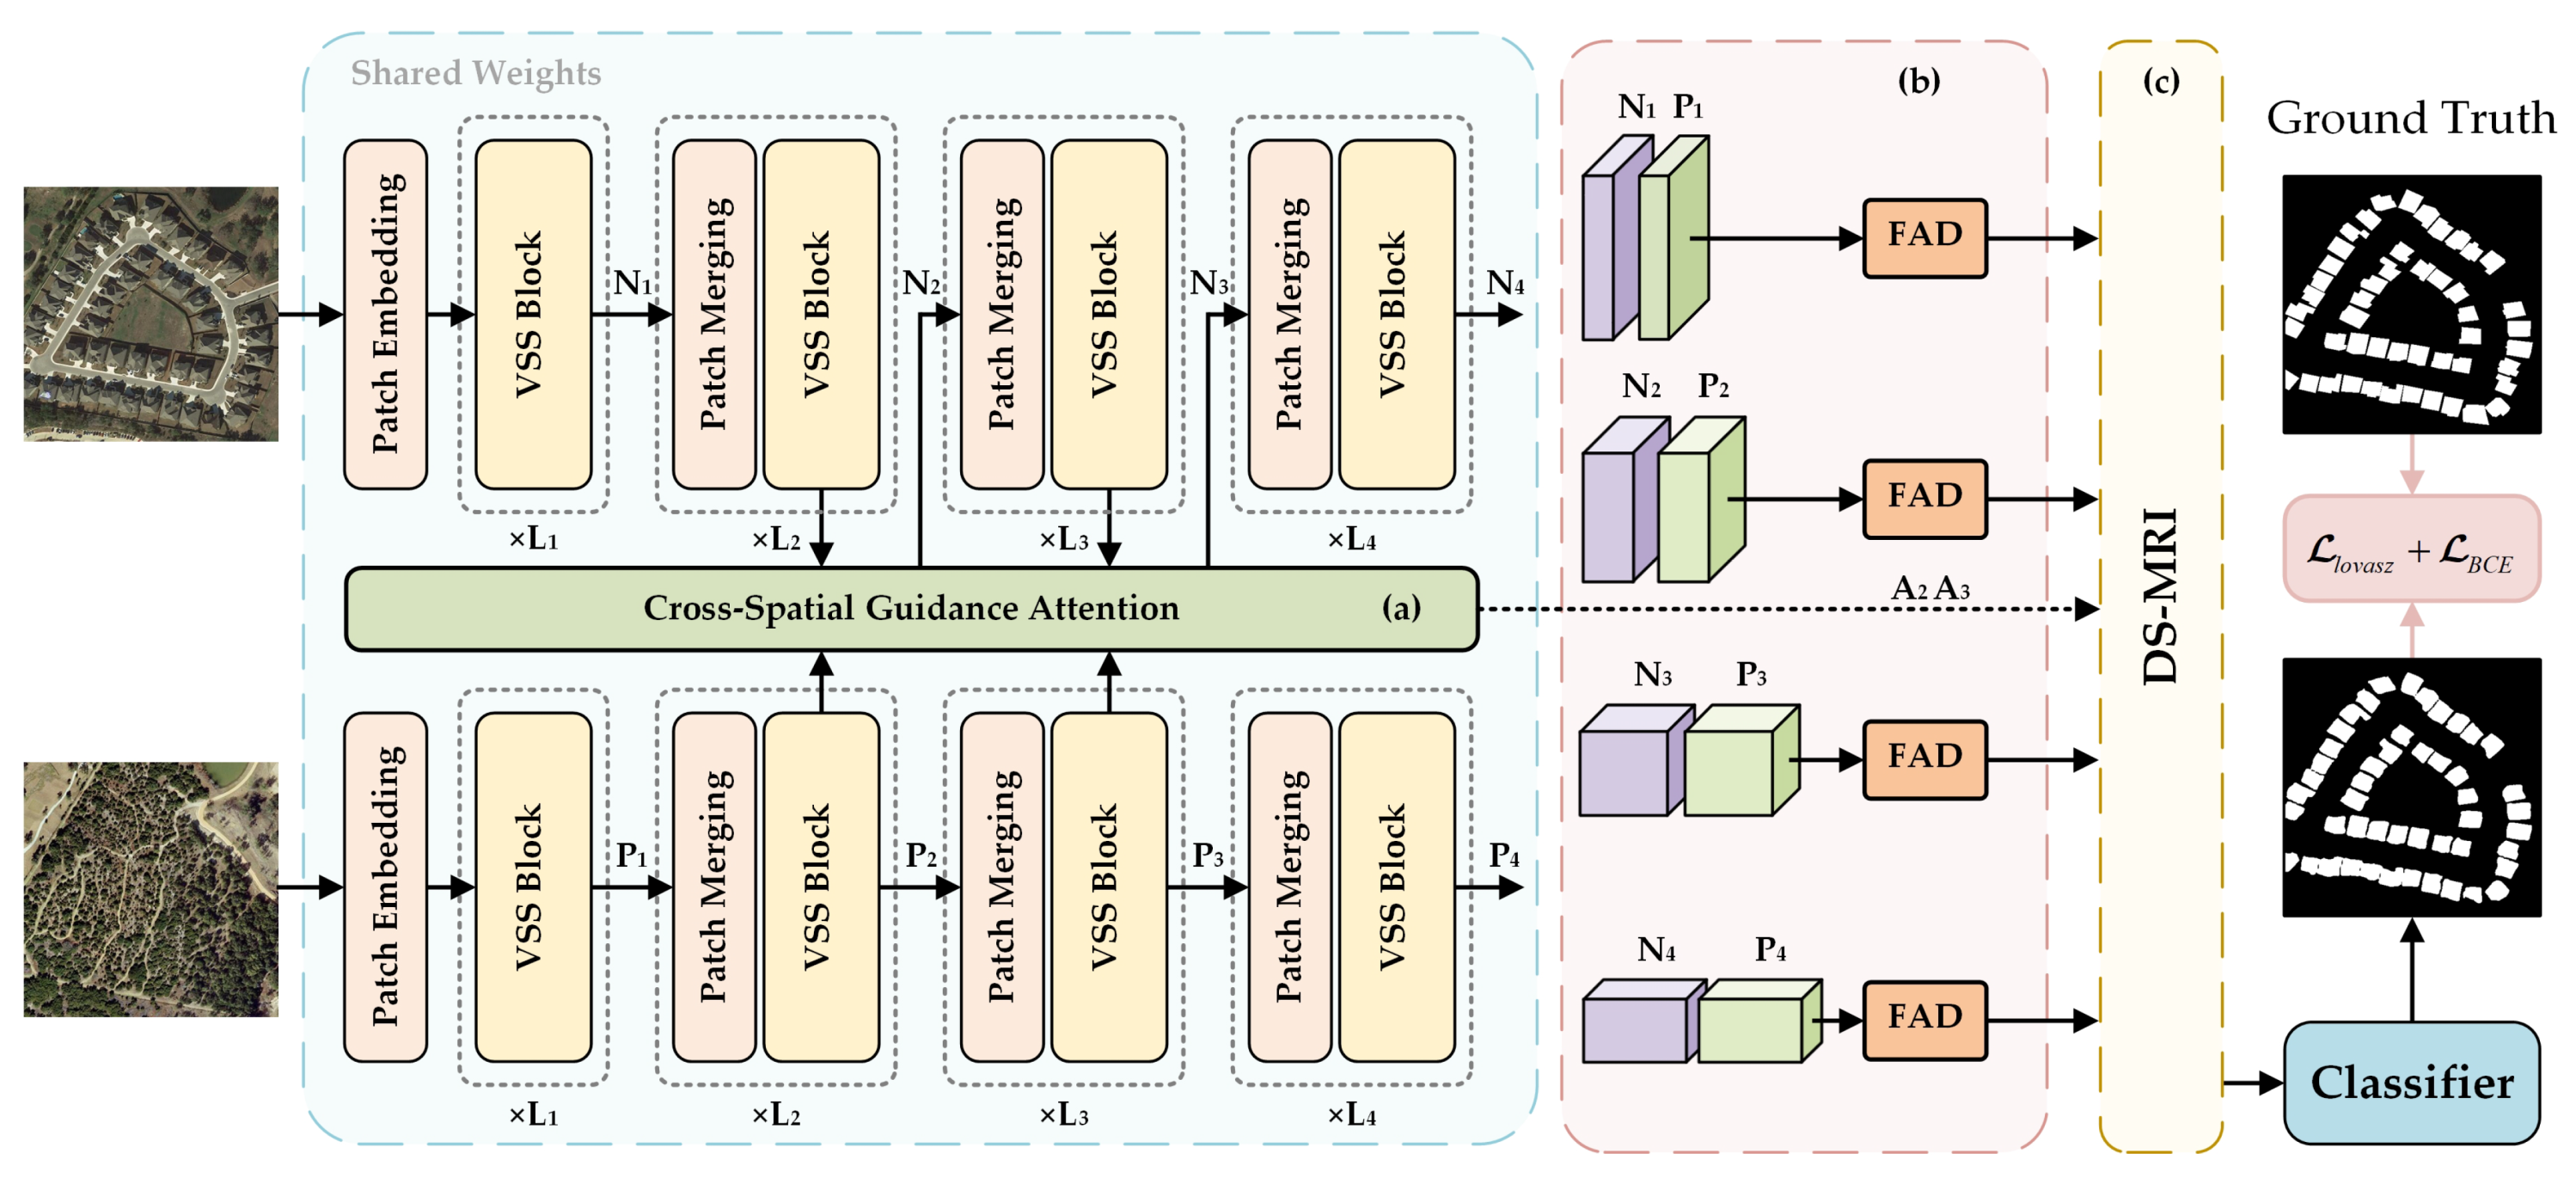
The architecture of the proposed AGFNet is illustrated in Figure 2. It is composed of three main components: a Siamese feature extraction backbone with CSGA module, a difference feature generation module, and a decoder.
Figure 2. Overview of the proposed AGFNet architecture. (a) CSGA module: provides guided feature maps for the backbone network, where A 2 and A 3 serve as the scan guidance map. Specific details are illustrated in Figure 3. (b) FAD module. Specific details are illustrated in Figure 4. (c) DS-MRI decoder. Specific structural details are illustrated in Figure 5.
Remotesensing 17 03844 g002
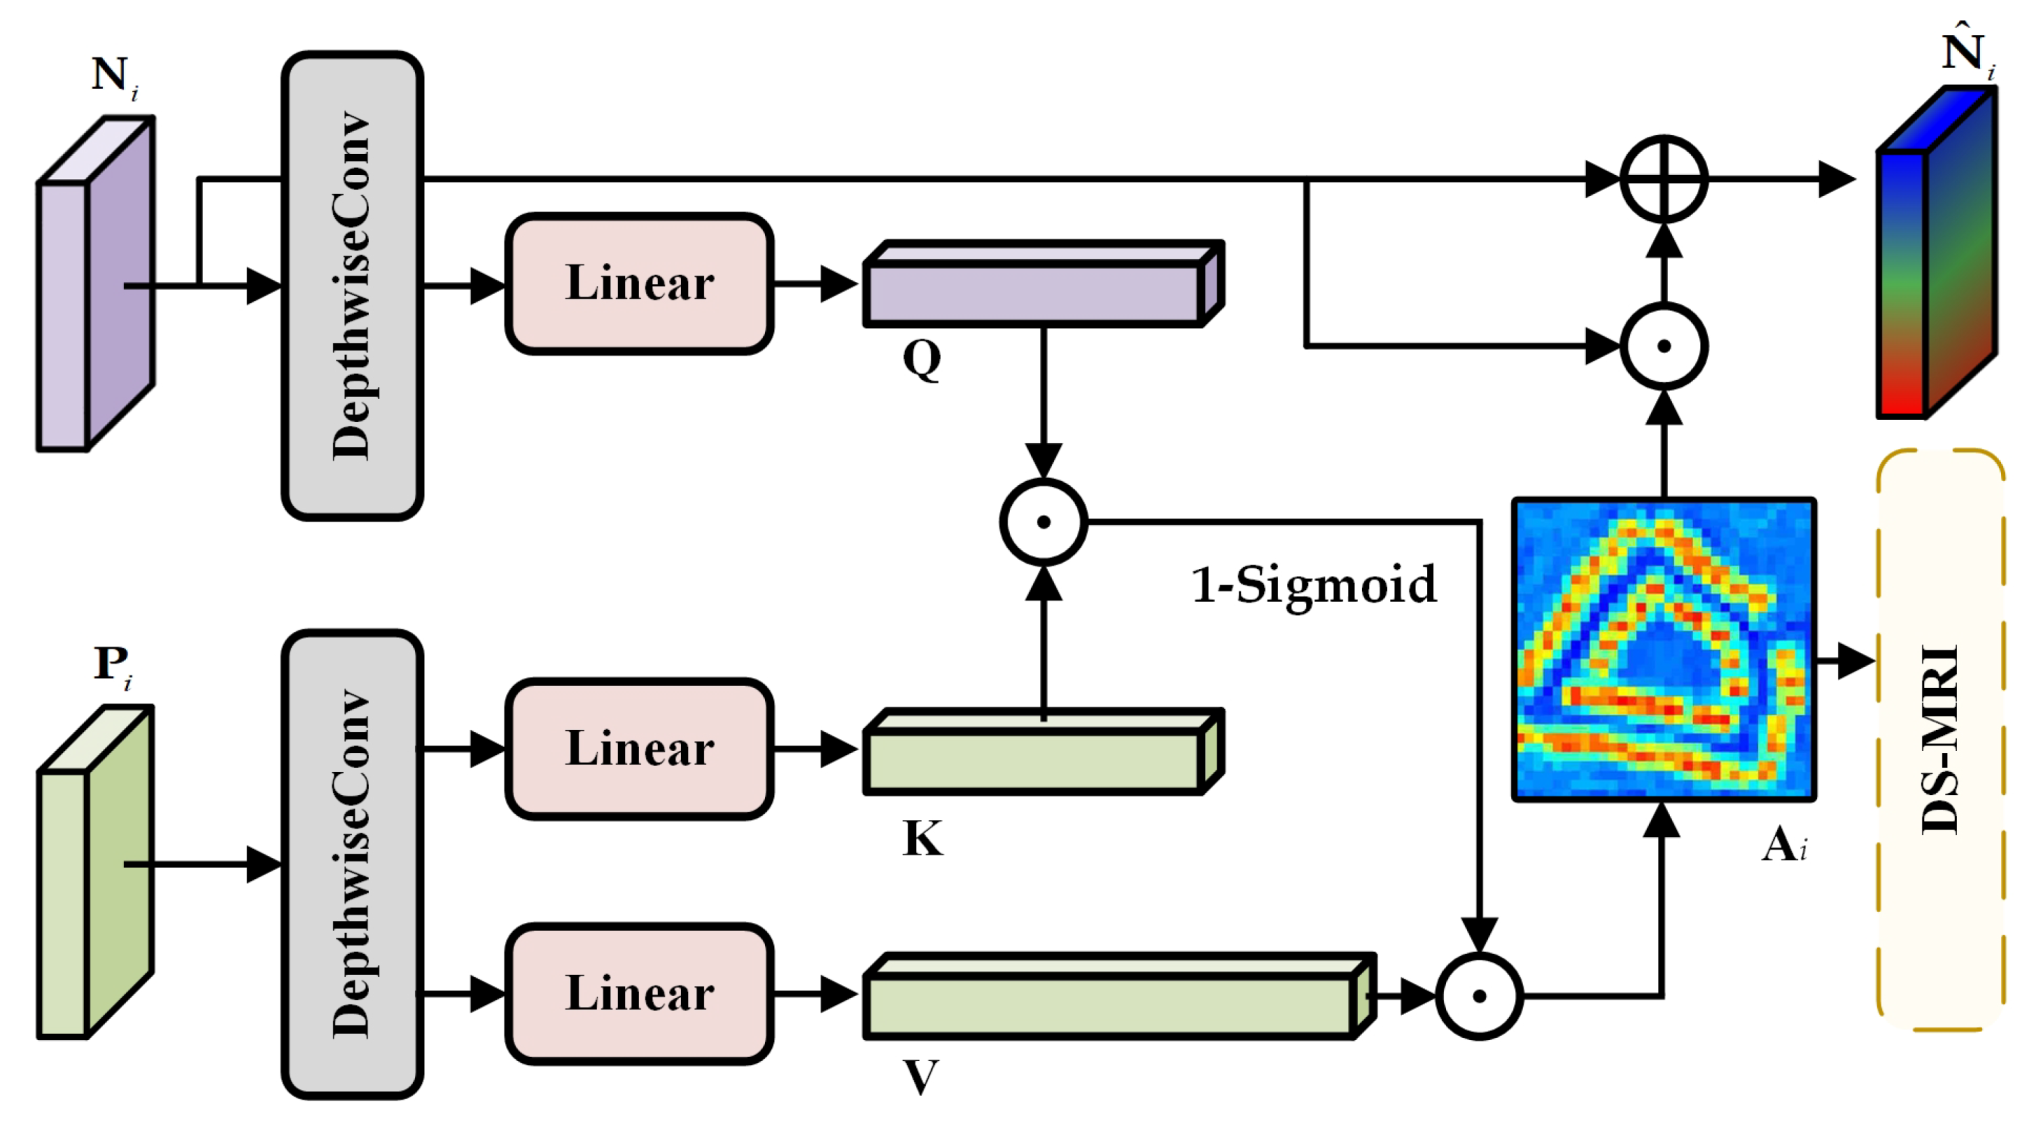
Figure 3. Illustration of the CSGA module. The inputs N i and P i denote the i-th layer outputs from the T2 and T1 branches, where i { 2 , 3 } , respectively. The output N ^ i replaces the original N i , while A i serves as the guidance map for subsequent scanning.
Remotesensing 17 03844 g003
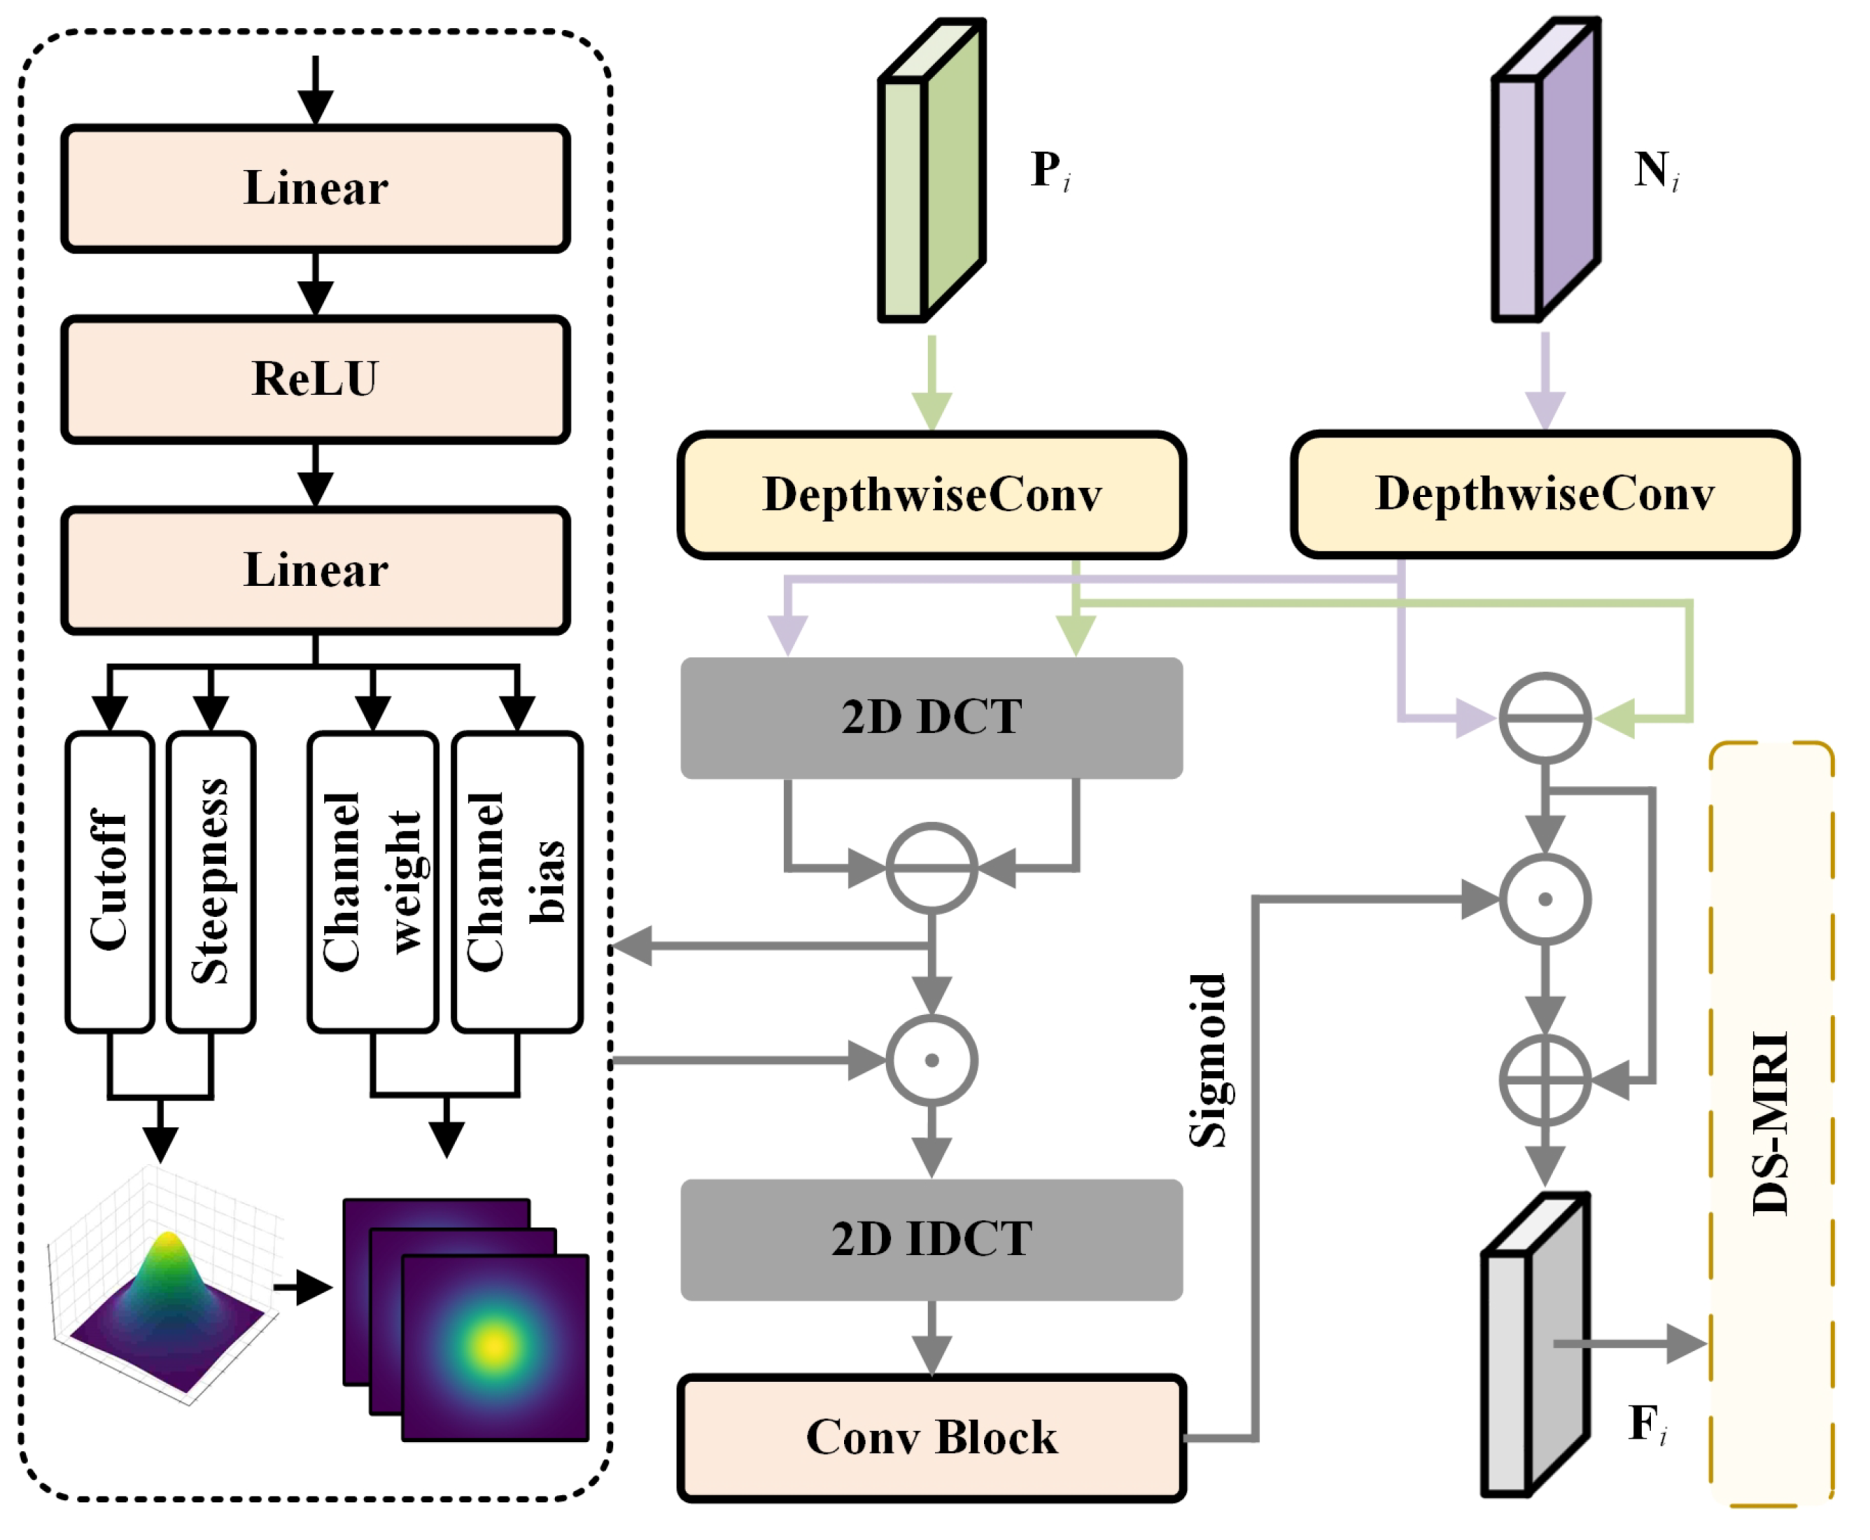
Figure 4. Illustration of the FADM. The module takes bi-temporal feature maps from the feature extraction network as input and outputs differential feature maps, which are denoted as F i , after adaptive difference processing. The set F i i = 1 4 constitutes the multi-level feature maps for the DS-MRI.
Remotesensing 17 03844 g004
First, in the feature extraction stage, we adopt a Siamese network structure based on the VSS Block [22] to encode bi-temporal images separately. Each branch consists of a Patch Embedding layer, multiple VSS Blocks, and a Patch Merging module. Unlike conventional independent extraction strategies, we integrate the CSGA module into the backbone network. Given the bi-temporal remote sensing images T 1 R 3 × H × W and T 2 R 3 × H × W , we process T 1 and T 2 through the feature extraction network for layer-by-layer encoding. At the second and third stages, outputs from the T 1 and T 2 branches undergo cross-spatial guidance in the CSGA module. The guided feature maps are subsequently used as inputs for further extraction. Finally, we obtain four-level feature maps P i i = 1 4 and N i i = 1 4 from the two temporal branches.
Next, in the difference stage, we propose the FADM to model differences between multi-scale feature pairs. Specifically, the input bi-temporal features are first processed with frequency-domain filtering to suppress high-frequency pseudo-change components, then aligned in dimensionality through a frequency-domain channel attention mechanism, and finally highlighted in the spatial domain to emphasize true change regions. This process effectively enhances the discriminability of differential features, thereby providing high-quality inputs for subsequent fusion.
In the decoding stage, we design DS-MRI, which progressively integrates differential features across multiple scales. Specifically, we propose the Attention-Guided State Space (AGSS) mechanism within this structure, which leverages attention maps from the CSGA module to generate dynamic scanning orders, thereby overcoming the limitations of conventional fixed scanning patterns. AGSS can adaptively model multi-scale contextual information based on the spatial distribution of change regions, significantly improving the localization and reconstruction of change areas.
Finally, the fused features are fed into a classification head to generate prediction results, and the model is trained through joint optimization of binary cross-entropy loss and Lovasz loss. Section 3.3, Section 3.4 and Section 3.5 provide detailed descriptions of these three key components.
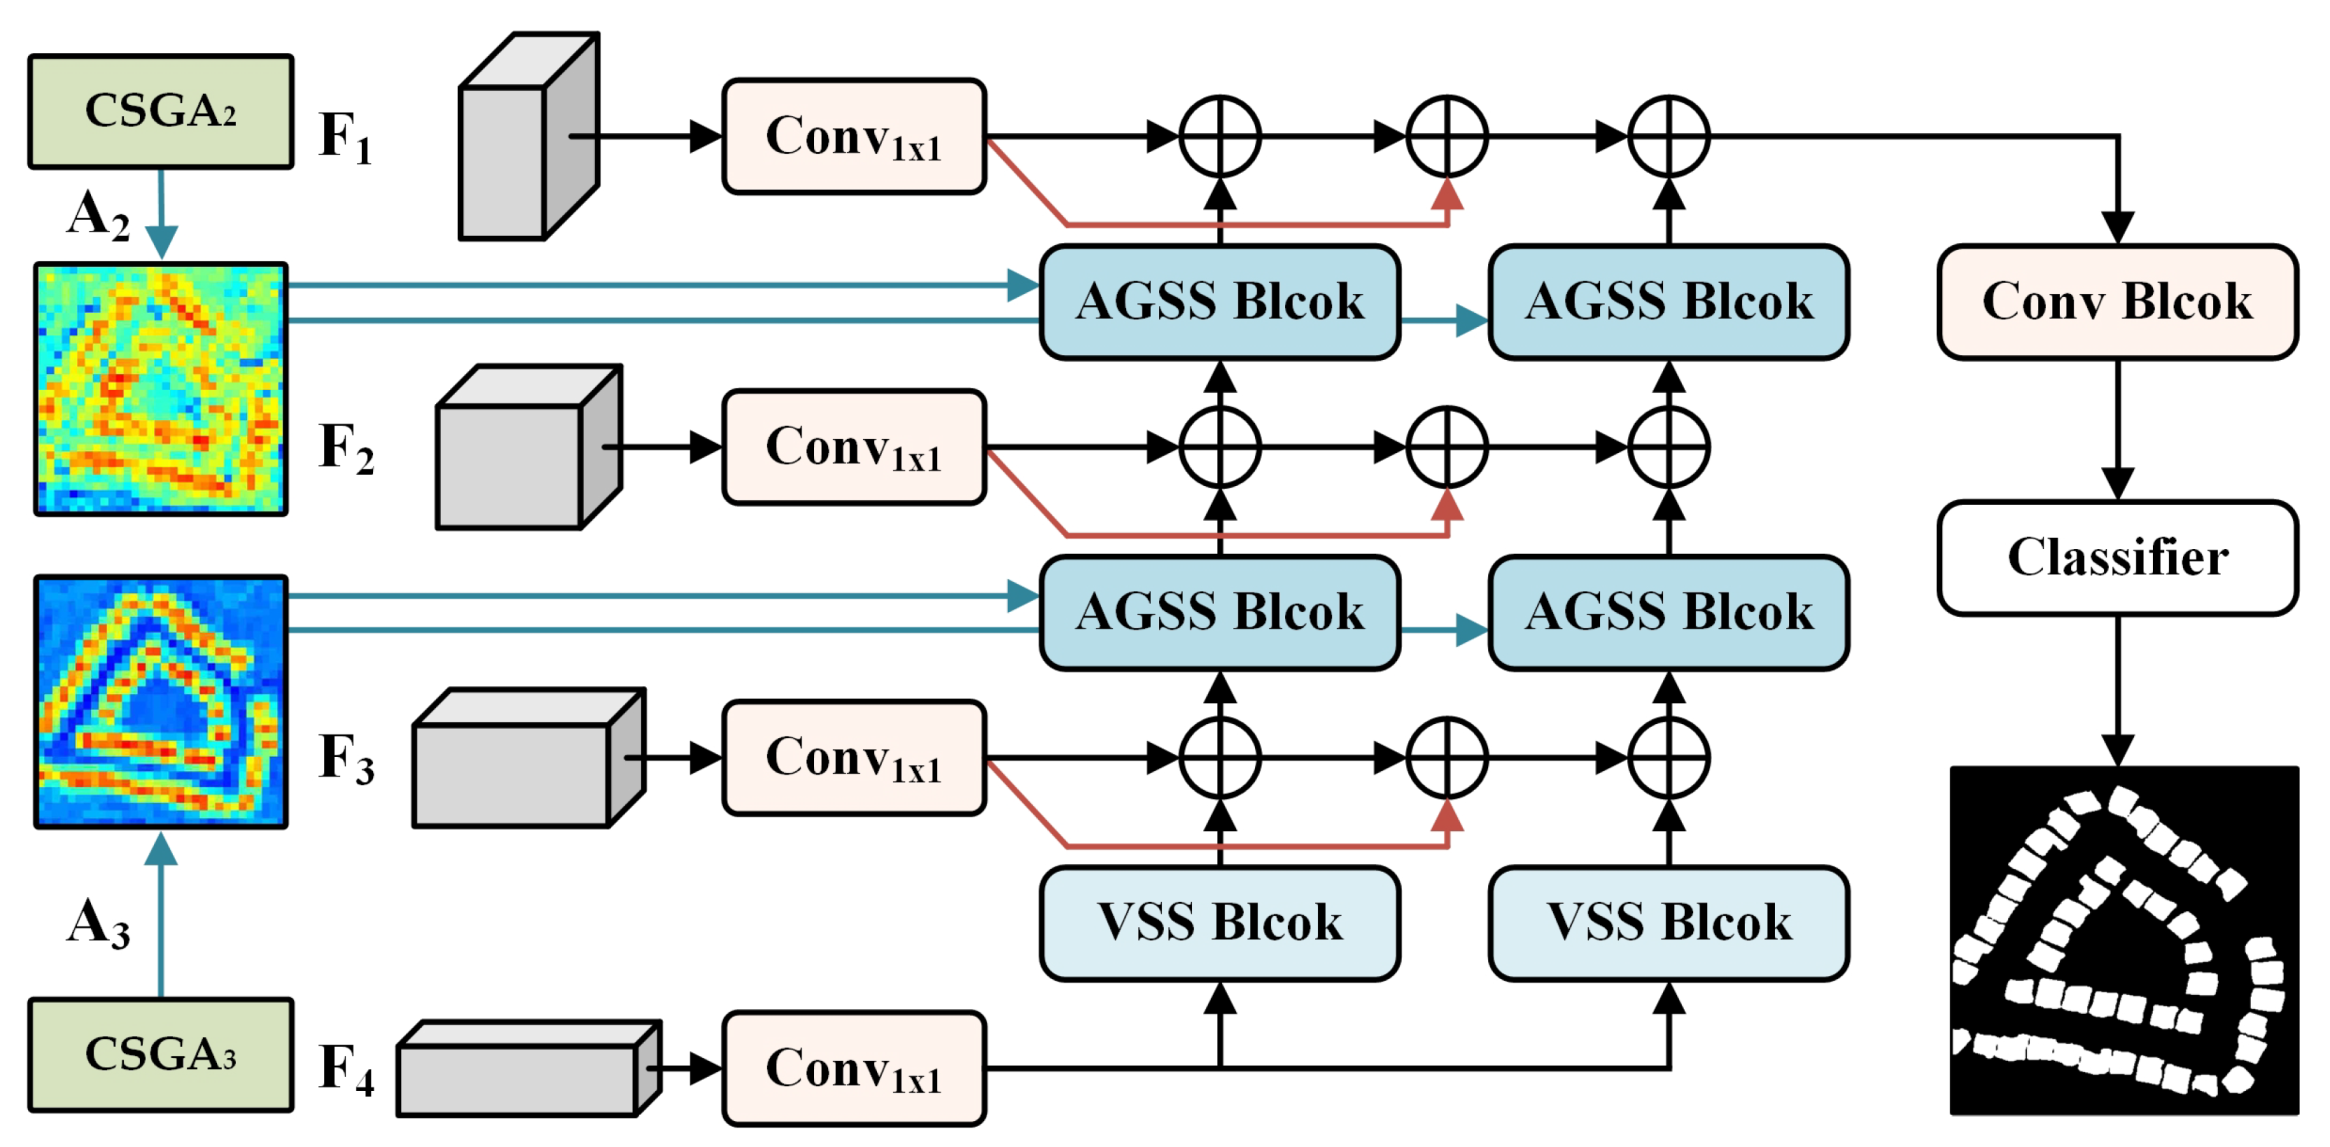
Figure 5. Illustration of the DS-MRI, where A 2 and A 3 are the attention maps output by CSGA2 and CSGA3, and F 1 F 4 are the feature maps output by FADM at each layer.
Remotesensing 17 03844 g005

3.3. Siamese Feature Extraction Network Based on VSS Block with Cross-Spatial Guidance Attention Module

In the feature extraction stage, AGFNet employs a Siamese network based on VSS Blocks, where two parameter-sharing branches encode bi-temporal images separately to ensure feature consistency. The input images are first split into non-overlapping patches and embedded into high-dimensional features via a patch embedding module. These features are then passed through alternating stacks of VSS Blocks and patch merging layers to progressively extract multi-scale representations. As a state-space modeling unit, the VSS Block captures long-range dependencies with linear complexity, providing superior contextual modeling in large-scale remote sensing scenarios.
However, conventional Siamese architectures typically perform independent feature extraction for bi-temporal images, neglecting cross-temporal interactions at the early stage, which often results in amplified pseudo-changes and poor alignment of actual changes. To establish stronger spatial dependencies between bi-temporal features, we design the Cross-Spatial Guidance Attention (CSGA) module, whose structure is illustrated in Figure 3. The core idea of this module is to leverage the spatial contextual information of the T 1 branch as guidance to dynamically refine the features of the T 2 branch.
Specifically, given the bi-temporal feature representations P i and N i produced by the T 1 and T 2 branches, we first apply a depthwise convolution block to extract detailed contextual information and suppress pseudo-changes:
F N = DWConv ( N i ) F P = DWConv ( P i )
where DWConv ( · ) denotes a depthwise separable convolution block, which is used to model local contextual dependencies. Subsequently, we take F N as the guiding feature and F P as the guided feature, i.e., we perform a query mapping on F N :
Q = Linear ( F N ) K = Linear ( F P ) V = Linear ( F P )
Then, cross-temporal spatial guidance weights are computed via an attention mechanism:
A t t n ( Q , K ) = 1 Sigmoid Q T K d
where Sigmoid ( · ) denotes the Sigmoid activation function, unlike conventional cross-attention mechanisms, here we employ a reverse activation scheme, i.e., inverting the attention values, whereas the standard attention mechanism is typically formulated as:
A t t n ( Q , K ) = Softmax Q T K d
Essentially, traditional attention mechanisms aim to identify “matching regions”, where locations with high similarity between the T 1 features and T 2 features are amplified. However, in the context of change detection, the focus shifts from similarity to differences. In addition, Softmax normalization introduces competition among pixels for attention allocation. In change detection tasks, it is common that certain regions exhibit no significant changes or that all regions have changed. When some regions show no noticeable change, they are still forced to receive a portion of the attention; conversely, when all regions change, the attention is either evenly distributed or allocated unpredictably, causing the guidance to become misleading. Therefore, we adopt 1 Sigmoid as a replacement for Softmax, making the cross-attention mechanism more consistent with the sparse and global response characteristics required for change detection tasks.
Subsequently, the guided weights are applied to update F N :
F N = F N + ( γ · Attn ( Q , K ) ) F N
where ⊙ denotes element-wise multiplication and γ is a learnable scaling factor. In this way, the F N features are explicitly aligned and enhanced under the guidance of F P , thereby suppressing pseudo-changes and highlighting true change regions at an early stage.
The CSGA module is deployed only in the 2nd and 3rd layers of the encoder. Shallow features (1st layer) lack semantic information and are sensitive to both noise and misregistration, while deep features (4th layer) lose spatial details due to excessive abstraction. Intermediate layers strike an optimal balance between spatial detail and semantic richness, making them suitable for cross-temporal guidance.
By integrating CSGA, AGFNet achieves explicit interaction between bi-temporal features during encoding. The T 2 branch is refined under the guidance of T 1 , enhancing feature consistency and alignment, and providing a more robust foundation for subsequent difference modeling and decoding.

3.4. Frequency-Guided Adaptive Difference Module

In remote sensing change detection tasks, bi-temporal images are often affected by pseudo-change interference, primarily arising from illumination differences, seasonal variations, and geometric misregistration errors. Conventional strategies such as absolute differencing or feature concatenation tend to propagate these non-semantic discrepancies into subsequent representations, thereby weakening the model’s discriminative capability. To address this issue, we propose the Frequency-guided Adaptive Difference Module (FADM), whose structure is illustrated in Figure 4. By combining frequency-domain filtering with spatial-domain enhancement, FADM suppresses pseudo differences while preserving genuine changes.
Given the bi-temporal feature maps N i and P i , we first employ non-shared depthwise separable convolution branches to extract preliminary contextual features:
F N = DWConv ( N i ) F P = DWConv ( P i )
where DWConv(·) denotes the depthwise separable convolution block. Subsequently, F N and F P are projected into the frequency domain, where a two-dimensional Discrete Cosine Transform (2D-DCT) is applied to obtain the spectra:
F N = DCT ( F N ) F P = DCT ( F P )
Finally, the frequency-domain difference is computed as:
F Δ = F N F P
where DCT ( · ) denotes the 2D-DCT operation. The low-frequency components usually capture the global consistency of the scene, corresponding to stable semantic structures, whereas the high-frequency components are more susceptible to noise, misregistration errors, and environmental variations, in which pseudo-changes are predominantly concentrated. To suppress such pseudo-changes, we design an adaptive low-pass filter. Specifically, inspired by FCANet [49], we introduce a lightweight MLP to predict the filtering parameters η , λ , w, and b from the features of the low-frequency sub-block, which, respectively, represent the cutoff frequency, steepness, channel weight, and bias. The filtering mask is defined as:
M ( f ) = Sigmoid λ ( η d ( f ) )
where d ( f ) denotes the distance matrix of normalized frequency positions, which serves as the basis of the filter. By adjusting the steepness λ , the filter can achieve either smooth transitions or approximately ideal hard cutoffs, thereby offering a diverse range of frequency responses. To ensure the positivity and training stability of the steepness parameter, we apply the Softplus activation function to the predicted raw steepness values. In this manner, the filter can adaptively determine which high-frequency components should be suppressed and which should be preserved, dynamically accommodating varying noise levels across different scenarios, and is ultimately formulated as:
F = F Δ M ( f ) w + b
This design offers several advantages. Unlike fixed high- or low-pass operations, the adaptive filter can automatically adjust to input image characteristics, thereby enhancing model robustness and generalization capability. Moreover, it achieves differentiable adaptive low-pass filtering with minimal parameters, rather than relying on convolution to globally predict the filter. Subsequently, the filtered frequency-domain differences are mapped back to the spatial domain via inverse transformation, yielding a purified change signal δ freq :
δ freq = IDCT ( F )
This signal generates a spatial weight map W = Sigmoid Conv ( δ freq ) , which encapsulates prior knowledge from frequency-domain analysis regarding the locations of significant changes. Meanwhile, another spatial branch directly computes the absolute difference in features:
δ spatial = | F N F P |
Finally, the output is obtained by modulating the spatial difference with the frequency-derived weight map:
output = δ spatial W + δ spatial
In summary, FADM balances the complementary strengths of frequency and spatial domains: frequency-domain differencing emphasizes global energy consistency and suppresses noise, while spatial differencing preserves local details and structural integrity. This integration effectively suppresses pseudo-changes while retaining true variations. A channel-wise weighting and bias mechanism further enhances robustness through selective emphasis and compensation. Moreover, predicting parameters via low-frequency sub-blocks enables efficient global modeling with minimal cost, which is significantly lighter than convolutional kernels or quadratic-complexity attention. The use of low-pass filtering aligns with the observation that high-frequency components often correspond to pseudo-changes, thereby preserving sensitivity to genuine semantic variations. Overall, FADM offers an efficient and robust dual-domain differencing paradigm for change detection.

3.5. Dual-Stage Multi-Scale Residual Integrator

In change detection, the decoding stage not only requires the progressive recovery of spatial resolution but also the effective integration of cross-temporal difference features. To this end, we propose the Dual-Stage Multi-Scale Residual Integrator (DS-MRI) decoder, whose core lies in a two-stage multi-scale residual fusion process: the first stage focuses on progressively enhancing cross-temporal alignment at both local and global levels, while the second stage further restores semantic consistency through residual iteration. The overall structure is illustrated in Figure 5.
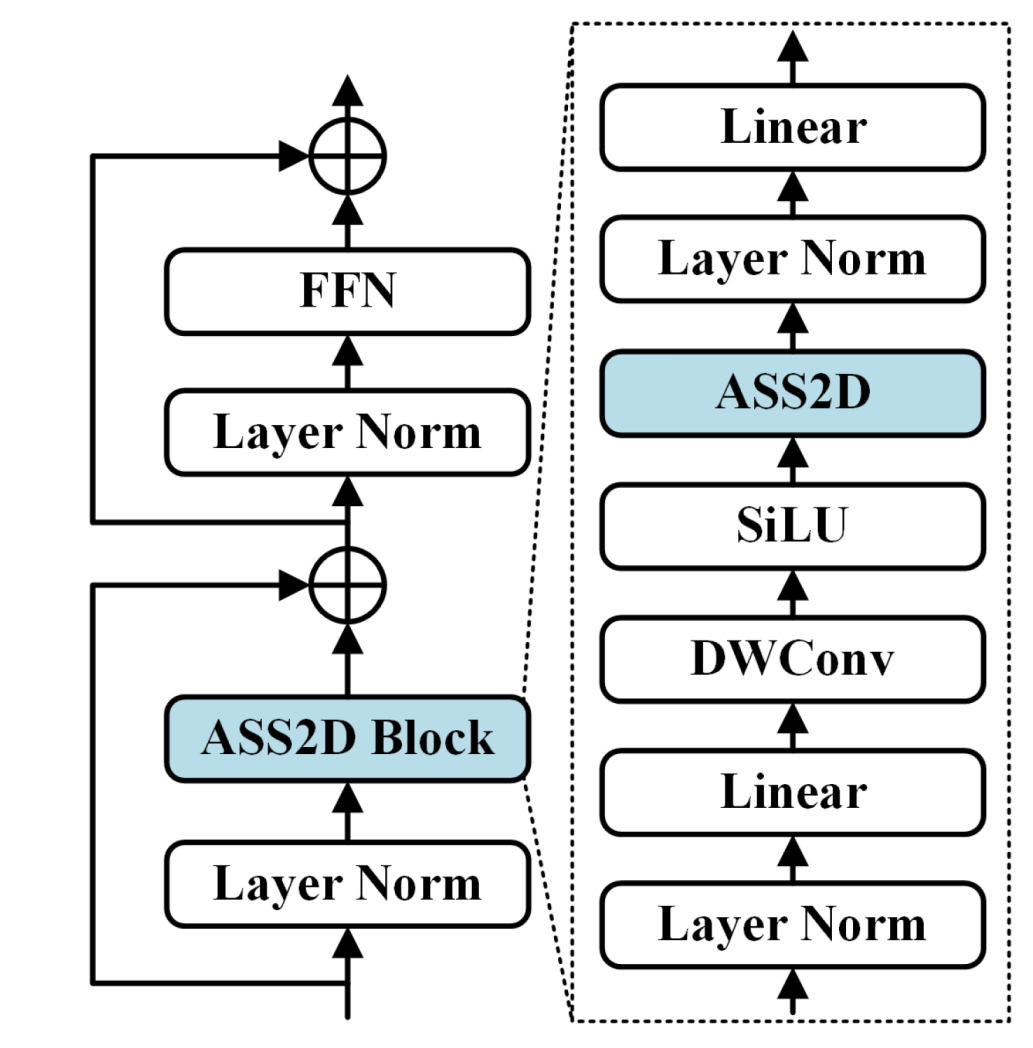
In DS-MRI, we design the Attention-Guided Selective Scan (AGSS) Block (Figure 6) to replace conventional self-attention or unconditional scanning. Unlike fixed-order scans, AGSS incorporates the spatial change probability map from the CSGA module to guide its scanning strategy. Specifically, we introduce a six-directional scanning approach: four original fixed-direction scans from the VSS Block are retained to capture anisotropic structures and ensure robust spatial propagation, while two new adaptive scan orders are introduced. The first order scans from high to low confidence regions, prioritizing early modeling of salient changes to prevent their dilution by background features. The second order scans from low to high confidence, gradually aggregating contextual information into high-confidence areas to correct boundary predictions and suppress isolated false differences.
These two orders are complementary: the first emphasizes early modeling of prominent regions, while the second provides semantic compensation from background areas. By fusing the four fixed-direction scans with the two adaptive scans in parallel, the AGSS Block combines the stability of spatial priors with the flexibility of attention guidance, effectively avoiding biases from a single scanning strategy and significantly improving overall robustness. Given the input feature map F , the ASS2D module in Figure 7 can be expressed as:
F i = expand ( F , i ) F v = expand ( F , v , A ) F i = S 6 ( F i ) F v = S 6 ( F v ) F o u t = merge ( F 1 , F 2 , F 3 , F 4 , F 1 , F 2 )
where i { 1 , 2 , 3 , 4 } denotes the four directions of the fixed scanning strategy, v { 1 , 2 } represents the two directions of the adaptive scanning strategy, and A is the corresponding attention map output from CSGA. expand ( · ) and merge ( · ) indicate the scan expansion and scan aggregation operations, respectively. S 6 ( · ) serves as the core of the module, representing the selective scanning operation.
In the DS-MRI processing pipeline, the input is the highly condensed difference map, denoted as F S R C × H S × W S , obtained via FADM processing, where S { 4 , 8 , 16 , 32 } represents the downsampling factor. First, a linear projection is applied to map features across different scales to a uniform channel dimension d, thereby eliminating channel discrepancies:
F ^ S = Linear ( F S )
Subsequently, the first stage employs a top-down, layer-wise residual propagation to gradually transfer high-level semantic information to shallower features:
F ^ 16 = F 16 + VSSBlock ( F 32 ) F ^ 8 = F 8 + AGSSBlock ( F ^ 16 , A 16 ) F ^ 4 = F 4 + AGSSBlock ( F ^ 8 , A 8 )
where A 16 and A 8 refer to the attention maps generated by the CSGA module introduced in Section 3.3. In the second stage, the outputs from the first stage are re-aggregated with the original input features and then progressively fed back to higher-resolution outputs through residual paths:
G 32 = VSSBlock ( F ^ 32 ) G 16 = AGSSBlock ( F ^ 16 + F 16 + G 32 , A 16 ) G 8 = AGSSBlock ( F ^ 8 + F 8 + G 16 , A 8 ) G 4 = F ^ 4 + F 4 + G 8
Finally, the decoder output is produced by integrating these features via a series of convolutional blocks:
F o u t = ConvBlock ( G 4 )
In summary, the DS-MRI decoder leverages a six-direction fusion mechanism (fixed spatial priors plus attention-guided adaptive scanning) to achieve comprehensive modeling of cross-temporal differential features. Driven by this two-stage residual integration framework, the model effectively balances the semantic relationships between salient change regions and background areas while restoring spatial resolution, ultimately yielding more robust and fine-grained change detection results.

4. Experimental Results

4.1. Dataset Introduction

We compared the proposed method with state-of-the-art change detection approaches on three widely used datasets: WHU-CD, SYSU-CD, and LEVIR-CD.
WHU-CD [50] is a dataset dedicated to building change detection, containing paired high-resolution remote sensing images (32,507 × 15,354 pixels, 0.3 m/pixel) of New Zealand captured in 2012 and 2016, covering an area of 20.5 km2. We cropped the original images into non-overlapping 256 × 256 patches and randomly split them into 6096 patches for training, 762 for validation, and 762 for testing.
LEVIR-CD [51] is a widely used change detection dataset comprising 637 image pairs from Google Earth (each 1024 × 1024 pixels, 0.5 m/pixel), focusing on building changes such as construction and demolition over 5–14 years. Following the official split, images were cropped into non-overlapping 256 × 256 patches and divided into 7120 patches for training, 1024 for validation, and 2048 for testing.
SYSU-CD [52] is a category-agnostic change detection dataset containing 20,000 pairs of aerial images from Hong Kong (256 × 256 pixels, 0.5 m/pixel) taken between 2007 and 2014. Unlike the building-specific WHU-CD and LEVIR-CD, it includes diverse change categories such as buildings, roads, and vegetation, providing a more comprehensive benchmark. We adopted the official split: 12,000 pairs for training, 4000 for validation, and 4000 for testing.

4.2. Experimental Setup

Our experiments were implemented in PyTorch (v2.2.0) using Python 3.10 on a single NVIDIA L20 GPU. The models were trained with a batch size of 32 for 22,000 steps per dataset, optimized by AdamW with an initial learning rate of 1 × 10 4 , weight decay of 5 × 10 4 , and a cosine annealing schedule. The backbone used VSS blocks with depths [2, 2, 9, 2], initialized from VMamba-T pre-trained weights [22]. We applied random rotation, horizontal and vertical flipping for data augmentation, and optimized using a combined loss of Cross-Entropy and Lovász-Softmax [53].
For a comprehensive evaluation of the proposed model and competing methods in remote sensing change detection, six representative metrics were adopted: Overall Accuracy (OA), Intersection over Union (IoU), F1 score (F1), Recall (Rec), Precision (Pre), and the Kappa coefficient (KC). It is important to note that the F1, IoU, and Kappa metrics were computed exclusively for the “change” category. This approach ensures consistency in evaluation across different methods and effectively mitigates potential assessment bias arising from class distribution imbalance.

4.3. Performance Comparison

To validate the effectiveness of AGFNet in change detection (CD) tasks, we compare it against several state-of-the-art methods, including CNN-based approaches (FC-EF [10], FC-Siam-Diff [10], FC-Siam-Conc [10], SEIFNet [32]), Transformer-based approaches (ScratchFormer [39], ChangeFormer [15], BIT [16], RCTNet [34]), and Mamba-based approaches (RSMamba [47], ChangeMamba [48], and CDMamba [45]). To ensure a fair comparison, all competing methods were trained and evaluated under their recommended settings based on the officially released code.

4.3.1. Quantitative Results

Table 1, Table 2 and Table 3 present the quantitative results of all compared methods on the three datasets. AGFNet achieves superior performance across all three datasets. Specifically, on LEVIR-CD, it attains an F1 score of 92.12% and IoU of 85.39%, surpassing the second-best method by 0.30% and 0.51%, respectively. On WHU-CD, it reaches 95.69% F1 score and 91.47% IoU, exceeding the second-best method by 0.22% and 0.56%, respectively. On the more challenging SYSU-CD dataset, AGFNet still achieves the best performance, with an F1 score of 84.48% and an IoU of 73.13%, outperforming the second-best method by 1.24% and 1.86%, respectively. These results demonstrate the superiority and robustness of AGFNet across different scenarios.
Compared to Transformer-based methods, AGFNet shows clear advantages in F1 score and IoU. Although its Precision is slightly lower on SYSU-CD, it achieves top performance in other key metrics, confirming strong overall accuracy. Against Mamba-based approaches, while RS-Mamba and ChangeMamba are competitive, AGFNet maintains a stable edge—for instance, leading RS-Mamba by 0.98% F1 score and 0.92% IoU on LEVIR-CD, and by 1.21% F1 score and 1.50% IoU on WHU-CD, validating the efficacy of our architectural design.

4.3.2. Qualitative Results

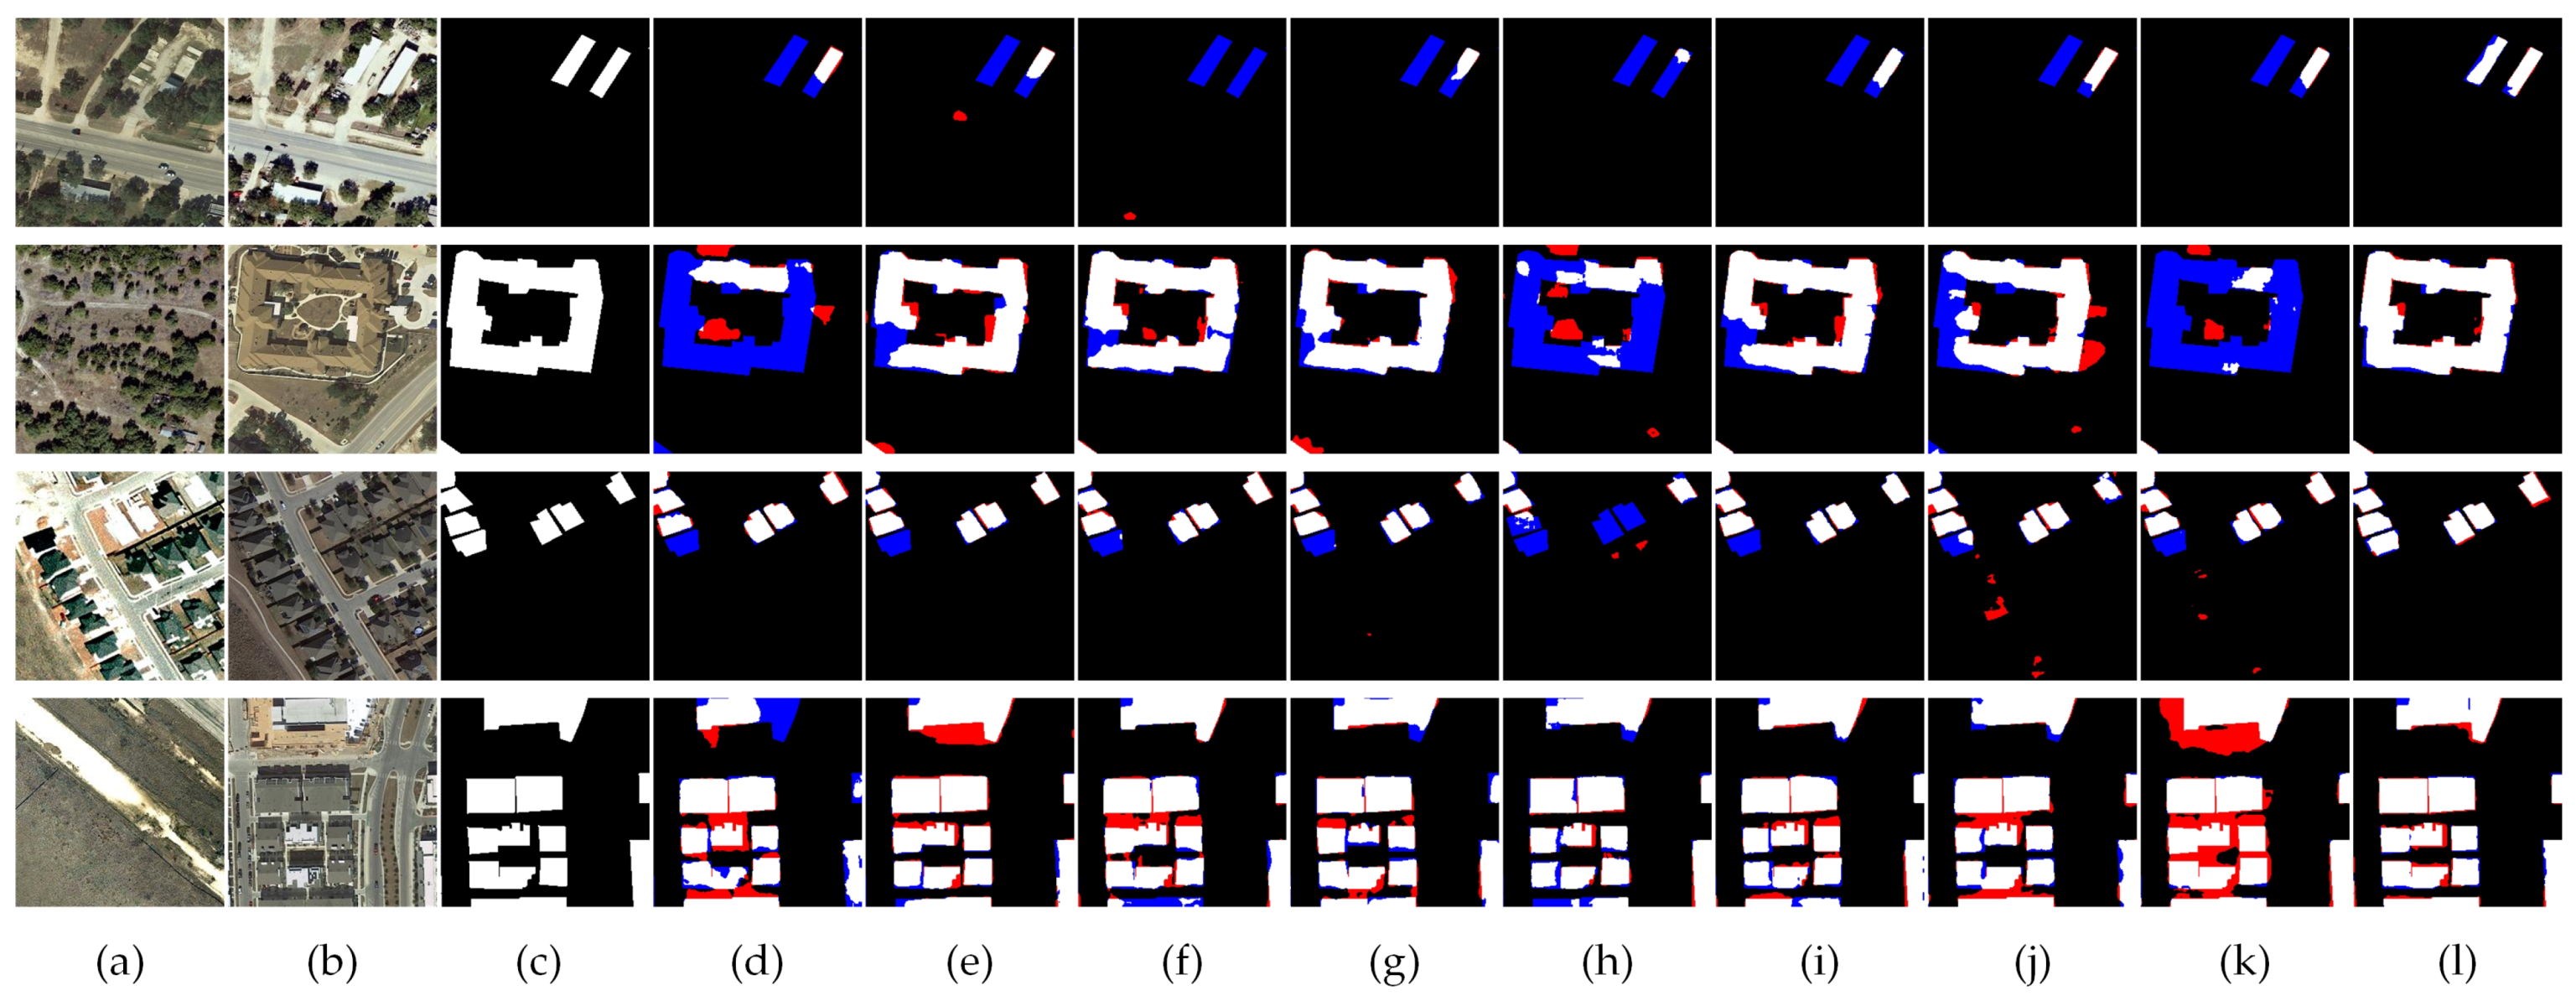
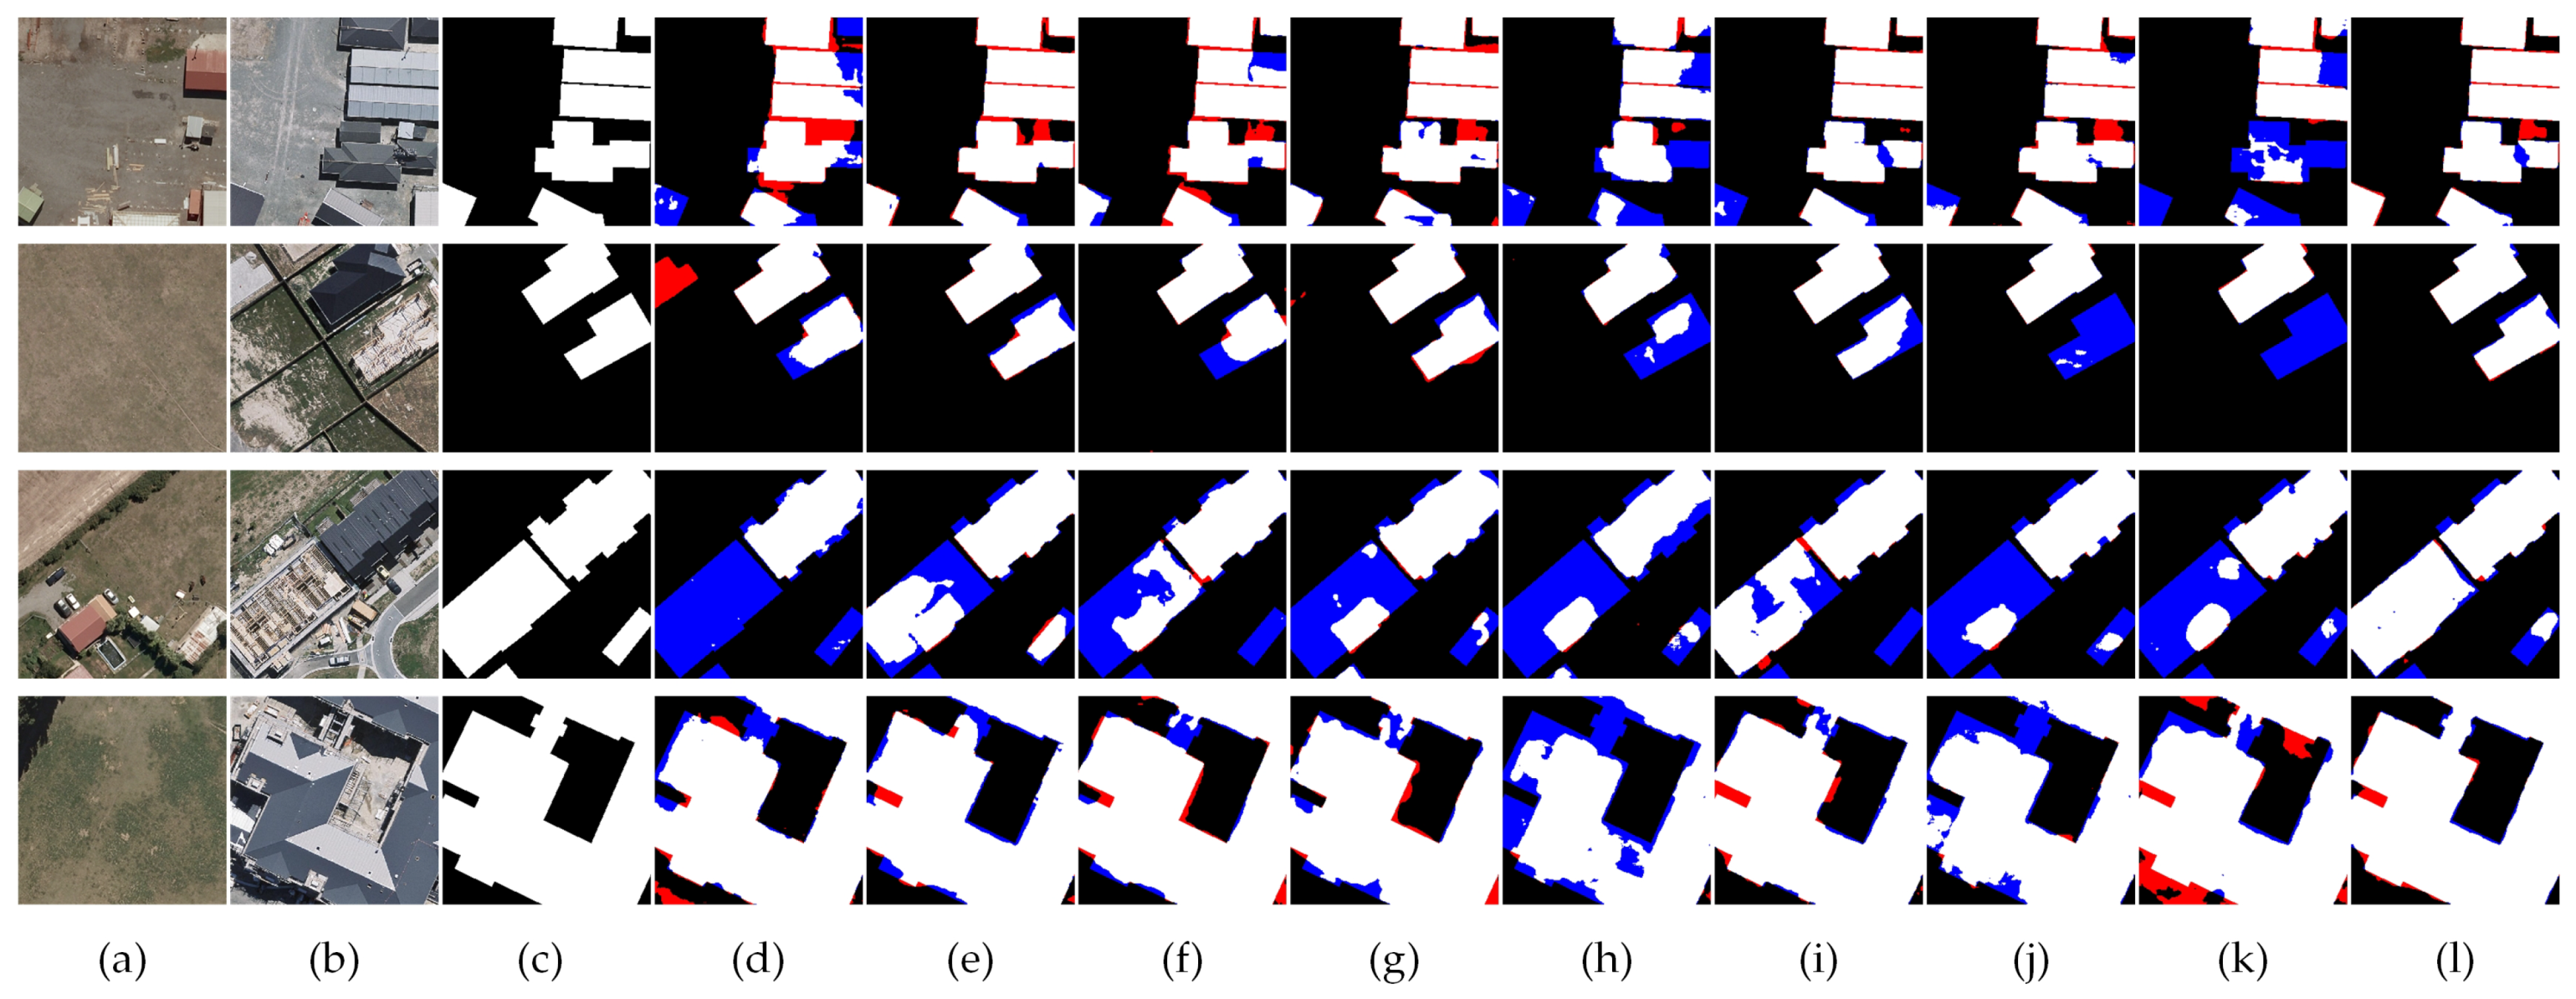
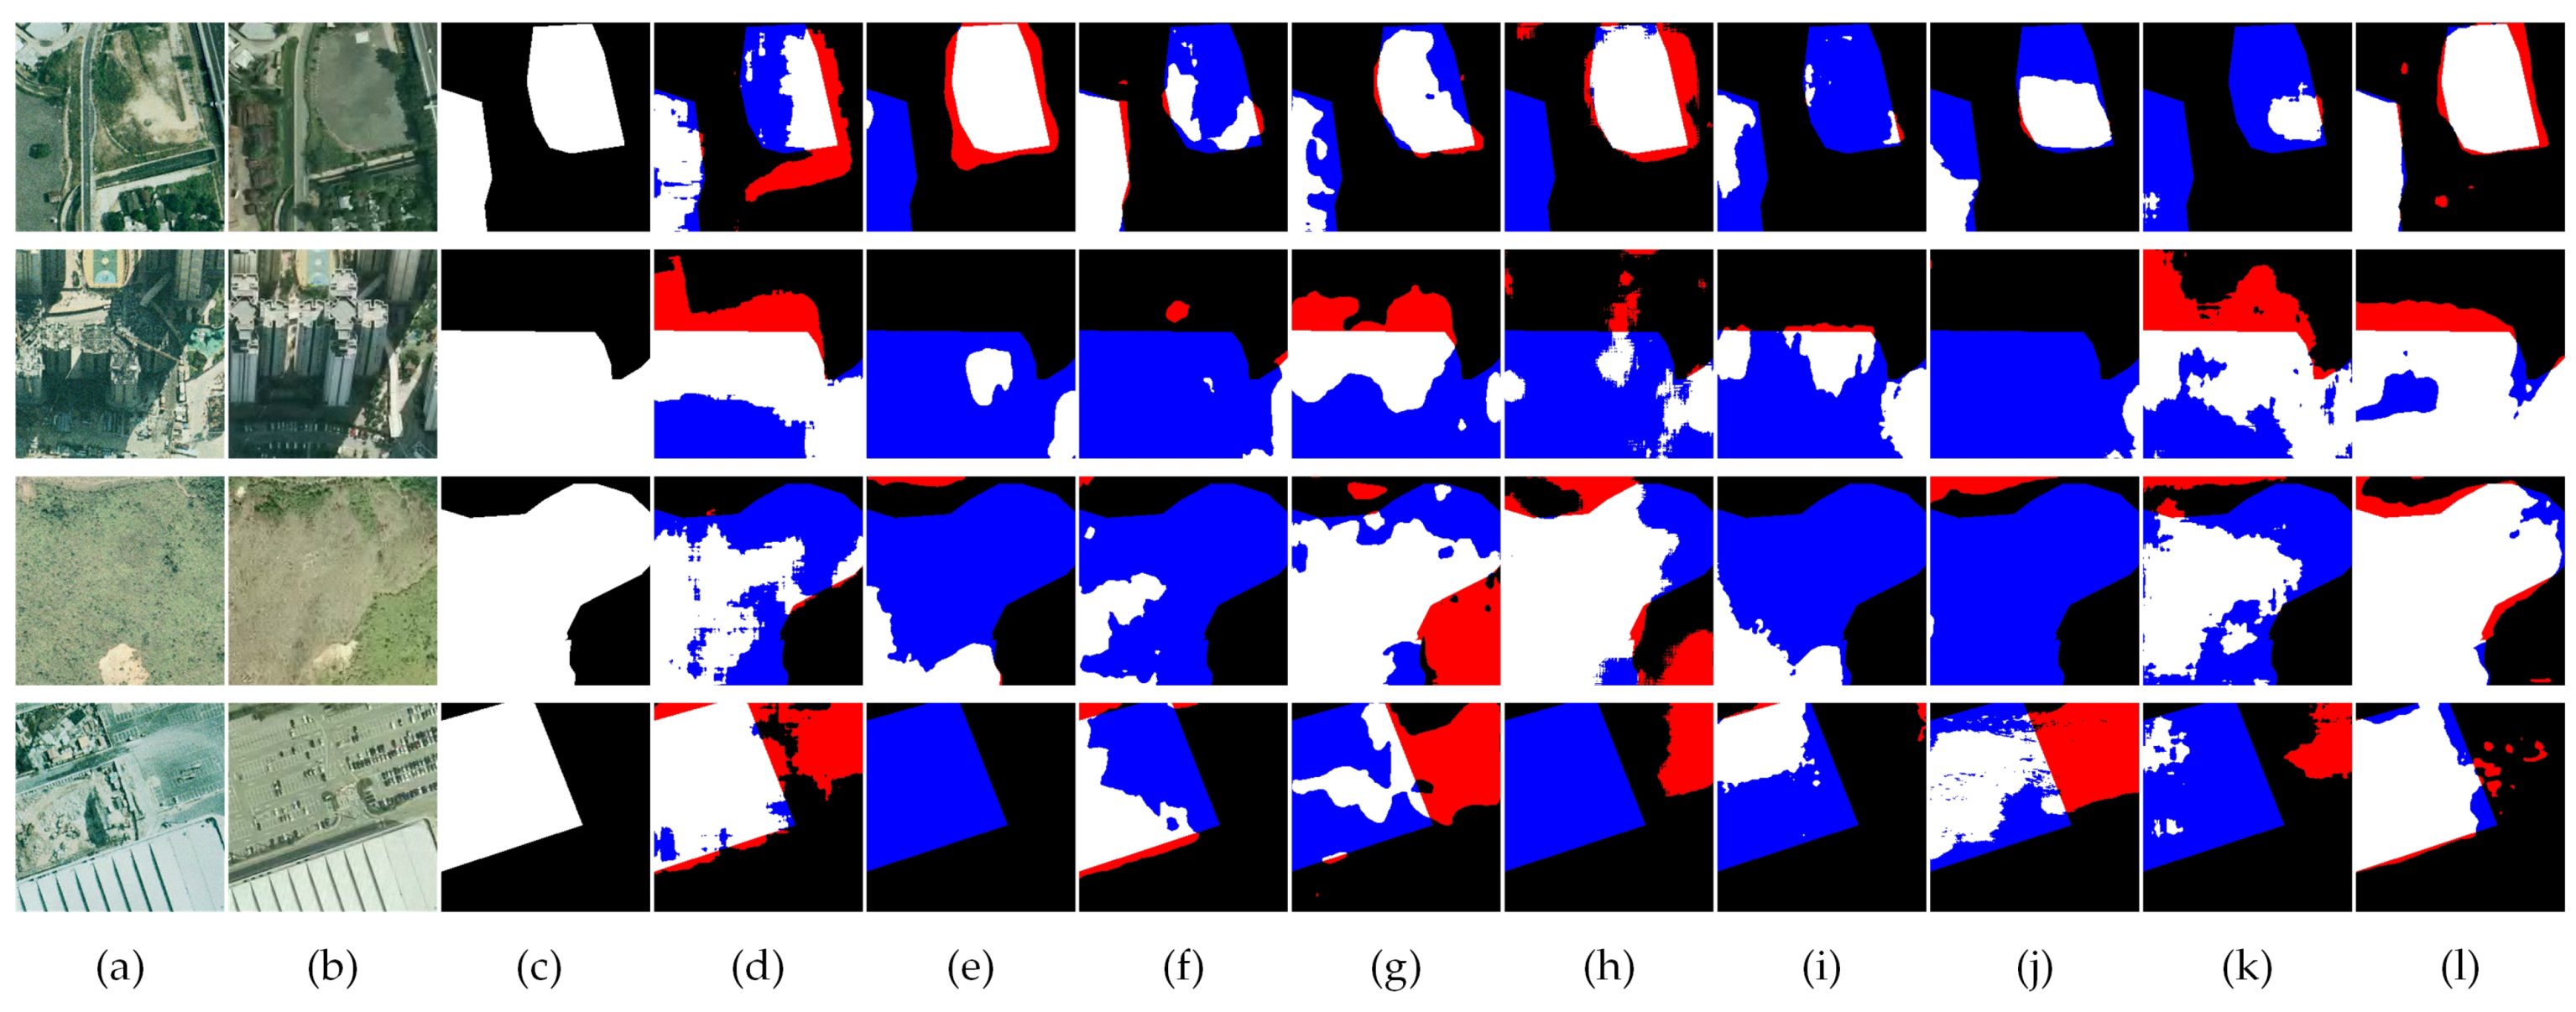
To validate the effectiveness of our method, we provide qualitative comparisons on all three datasets. The prediction results are color-coded as: True Positives (white), True Negatives (black), False Positives (red), and False Negatives (blue). For each dataset, we select four representative samples to visually compare AGFNet against other advanced methods.
Figure 8 and Figure 9 present a total of eight sets of visualization results from the LEVIR-CD and WHU-CD test sets. In detecting building changes, other methods often suffer from general misidentification or blurred change boundaries due to influences such as illumination variations and near-vertical imaging angles. For example, in LEVIR-CD results, large differences between bi-temporal images make it difficult to determine whether a building has changed, causing objects with similar characteristics (e.g., vehicles, roads) to be mistakenly identified as building changes. Furthermore, scene complexity exacerbates false detections, with some building changes incorrectly classified as other land-cover changes, leading to failures in detecting actual changes. In WHU-CD results, many building change regions are missed, especially in areas where shadows obscure change features, as seen in the last row of Figure 9. By contrast, AGFNet accurately captures change regions. Thanks to its frequency-domain analysis and adaptive scanning strategy, AGFNet avoids significant over-detection or under-detection, precisely outlining building change boundaries.
Figure 10 shows four visualization samples from the SYSU-CD test set. The scene complexity and change diversity inherent in the SYSU-CD dataset are primary sources of pseudo-changes. As illustrated in the second and fourth rows, other methods struggle to distinguish true changes from false ones in occlusions caused by high-rise buildings and cluttered urban scenes, resulting in misclassifications and omissions. Additionally, vegetation changes induced by seasonal differences blur change boundaries, as evidenced in the third row of visualizations. By contrast, AGFNet demonstrates greater robustness against these factors. The change regions it detects align highly with the Ground Truth (GT). Particularly when handling complex scenes, it demonstrates superior adaptability, effectively distinguishing genuine changes from the complex background.

4.3.3. Complexity Analysis

To assess model efficiency, we report the number of parameters and Floating Point Operations (FLOPs) for all methods under an input size of 256 × 256 in Table 4. All experiments were conducted on a single NVIDIA L20 GPU. Overall, AGFNet achieves favorable results in terms of floating-point operations. Although its FLOPs are slightly higher than some lightweight CNN-based methods, these methods often struggle to maintain accuracy in complex scenes and suffer from significant performance bottlenecks. Compared to Transformer- and Mamba-based approaches, AGFNet exhibits lower FLOPs than all counterparts, including the relatively lightweight BIT-ResNet18.
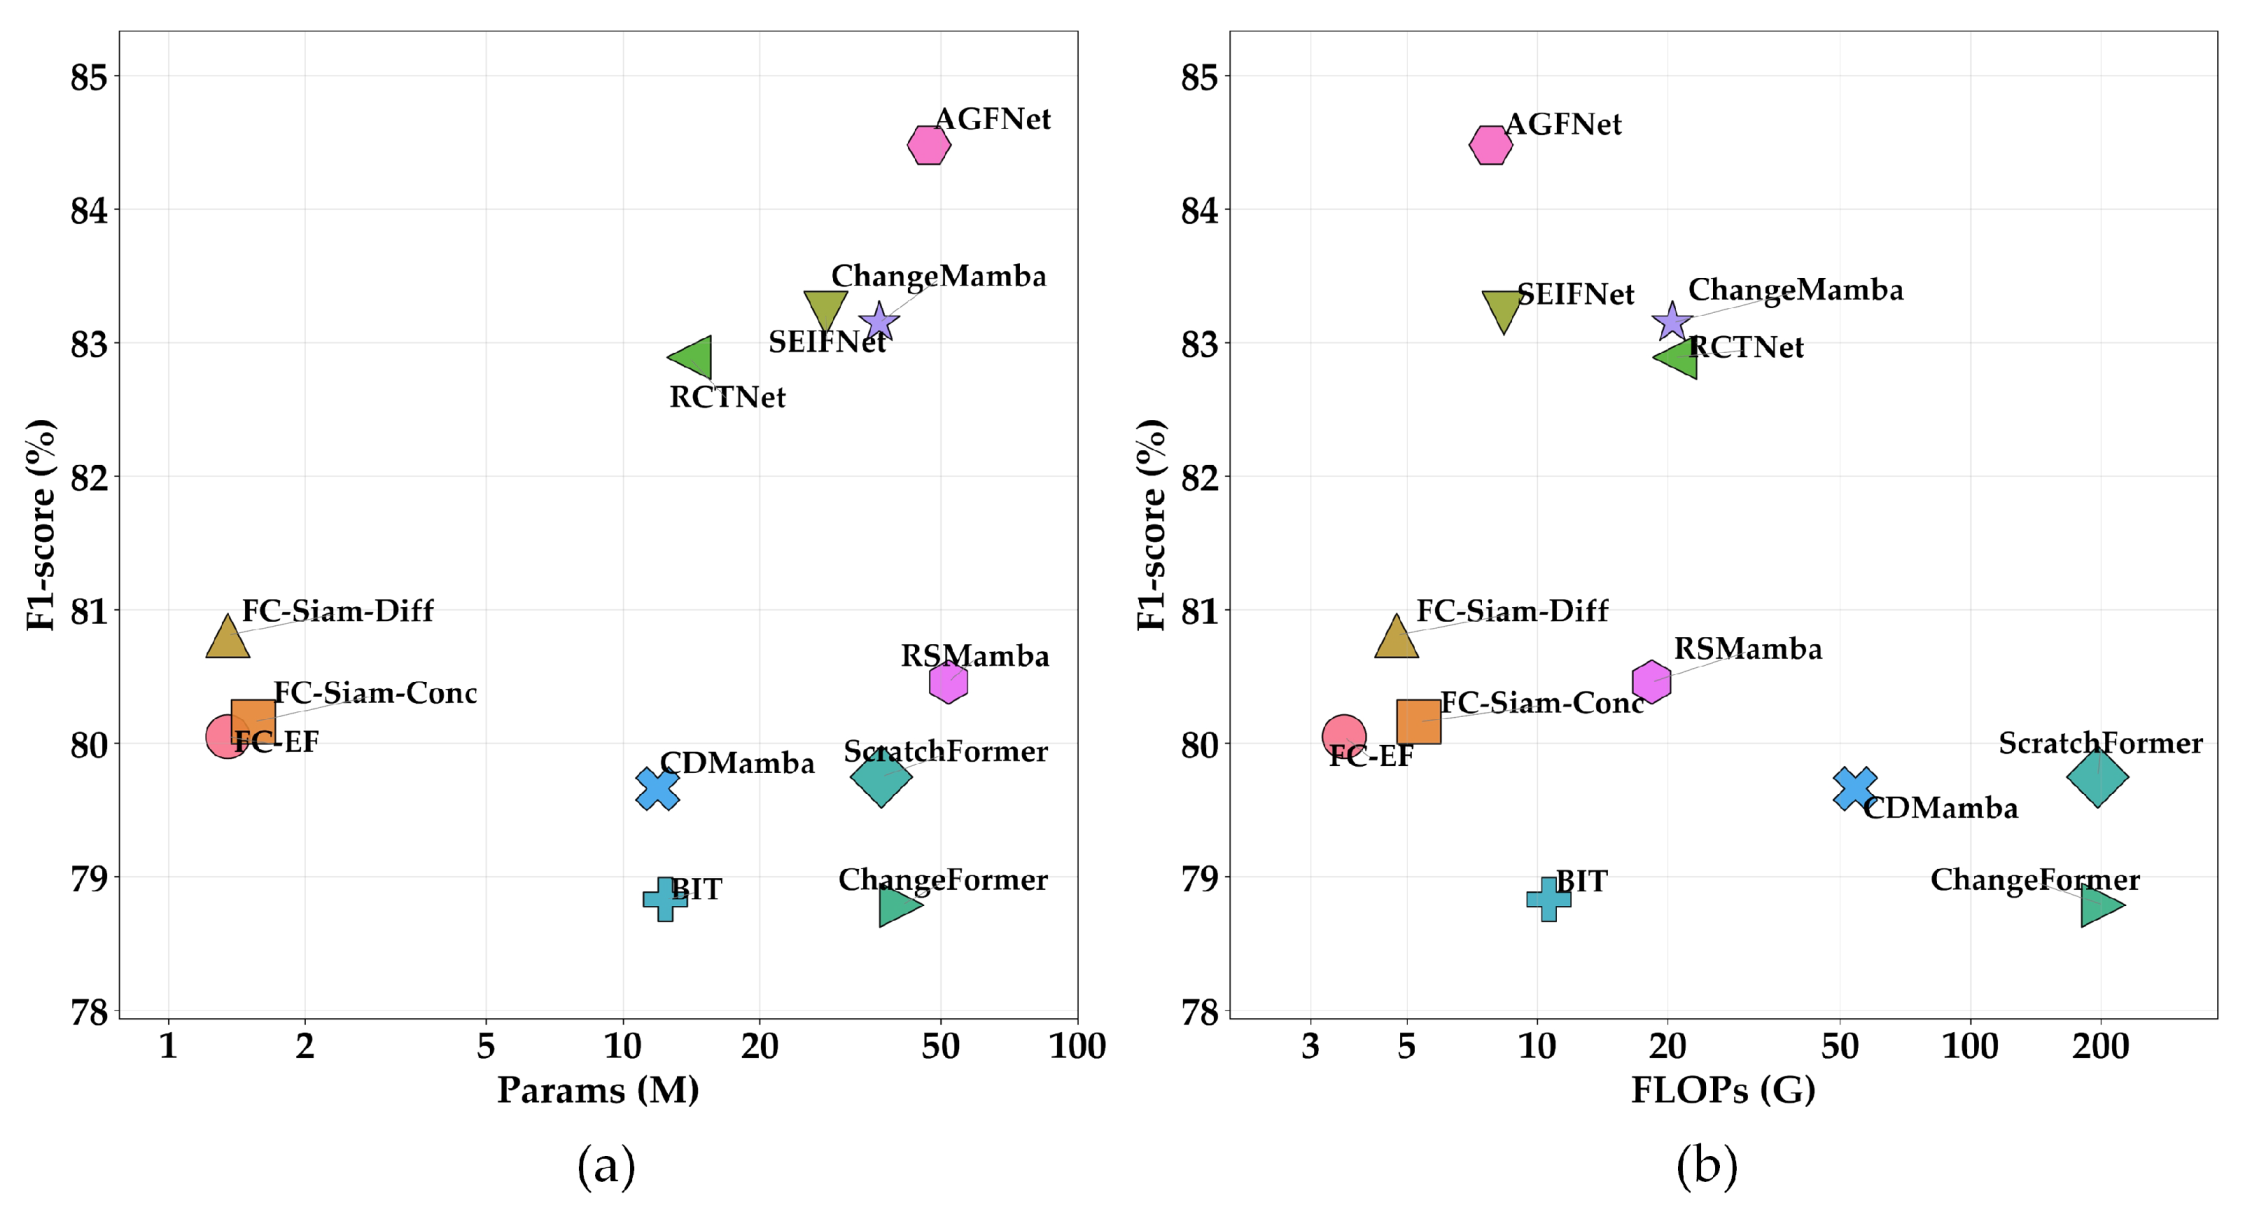
To further illustrate these efficiency characteristics, Figure 11a,b plot performance against parameter count and FLOPs, respectively, on the SYSU-CD dataset. As shown in Figure 11a, our method achieves a 1.33% higher F1 score while requiring 29% more parameters compared to ChangeMamba. More critically, Figure 11b shows that our model occupies the advantageous region of high accuracy and low computational cost. Compared to the highest-accuracy counterparts, ChangeMamba and SEIFNet, our FLOPs are reduced by 61.85% and 6.57%, respectively. This directly validates the core advantage of our model: powerful representational capacity coupled with a lightweight computational design.
To analyze the computational profile of AGFNet, we provide a breakdown of its key components. The core of our approach, DS-MRI, is the primary contributor to the model’s capacity, accounting for 5.51 G FLOPs and 10.03 M parameters. In contrast, the CSGA module is highly lightweight, requiring only 0.13 G FLOPs with a parameter count ranging from 0.09 M to 0.34 M depending on the configuration. The FADM module, employed four times in the architecture, exhibits variable complexity (0.12–0.13 G FLOPs and 0.09–5.34 M parameters per instance), culminating in a total cost of 0.48 G FLOPs and 7.11 M parameters across all instances. This breakdown reveals that the model’s efficiency stems from its balanced design, where a powerful core (DS-MRI) is effectively complemented by lightweight yet effective components (CSGA and FADM).

4.4. Ablation Studies

Table 5 reports the ablation results on the LEVIR-CD and SYSU-CD datasets. It can be observed that all three modules contribute to performance improvements, though with varying degrees of effectiveness. Among the single-module settings, DS-MRI yields the most significant gains: on LEVIR-CD, the F1 score increases from 90.25% to 91.26%, with an IoU improvement of 1.71 percentage points; on SYSU-CD, the F1 improvement reaches 1.69%. This demonstrates that, as an enhanced decoding structure, DS-MRI effectively strengthens multi-scale feature fusion and hierarchical reconstruction, thereby improving the structural completeness and boundary quality of the predicted masks.
In comparison, both CSGA and FADM also provide consistent performance gains across the two datasets, indicating that cross-spatial guidance and feature-difference enhancement contribute positively to the discrimination of change regions. Moreover, when any two modules are combined, additional improvements are observed, highlighting their complementary roles. Notably, the combination of CSGA and DS-MRI brings a clear performance boost, suggesting that the cross-spatial guidance mechanism provides robust structural cues that benefit the feature reconstruction process in the decoder.
The full model integrating all three modules achieves optimal performance (F1: 92.12% on LEVIR-CD, 84.48% on SYSU-CD), representing improvements of 1.87% and 3.60% over the baseline. These results confirm that our modules collectively enhance feature representation, difference modeling, and decoding quality throughout the change detection pipeline.

4.4.1. Ablation on Loss Function

To determine the optimal training objective, we compare various loss functions as shown in Table 6. While individual losses like Cross-Entropy (CE), Lovász, and Dice achieve competitive results, their combinations exhibit different characteristics. In contrast to the consistent gains from CE + Lovász, other combinations yield fluctuating results across the three datasets. The CE + Lovász combination consistently delivers the best performance across all three datasets, achieving the highest F1 and IoU scores. This suggests that combining the pixel-wise classification capability of CE with the segmentation-friendly property of Lovász loss provides the most effective supervision for our change detection task. Consequently, we adopt CE + Lovász as our default loss function.

4.4.2. Ablation on FADM in AGFNet

To validate the effectiveness of the FADM, we performed ablation studies to assess its performance across the three datasets. Specifically, we removed this module from the overall framework and compared it with several alternative strategies, including absolute difference, feature concatenation, and replacing the adaptive filtering with a trainable fixed filtering scheme. The results are presented in Table 7, where Cat denotes concatenation and FTDM represents the frequency-guided trainable difference module.
From the experimental results, it can be observed that on LEVIR-CD and SYSU-CD datasets with relatively abundant training samples, introducing FTDM consistently yielded performance improvements, suggesting that under large-scale data conditions, it can better capture and model cross-temporal frequency-domain differences. However, on the smaller WHU-CD dataset, FTDM exhibited a performance drop. This can be attributed to the difficulty of sufficiently training the learnable filtering strategy with limited data, preventing it from achieving its full potential. Replacing FTDM with the adaptive generation of filtering parameters alleviated this issue. Overall, the results demonstrate that FADM possesses strong generalization and enhancement capabilities, with the most notable improvements observed on SYSU-CD, where F1 and IoU increased by 1.31% and 1.94% compared to the lowest-performing baseline.
We further visualized intermediate features in Figure 12. Absolute difference and concatenation often produced dispersed responses and false activations in complex scenes. In contrast, FADM generated more compact and accurate activations, effectively highlighting true changes and suppressing false ones. These qualitative results align with the quantitative metrics, confirming that not only does FADM enhance both numerical performance and feature clarity, it also exhibits clearer and more focused feature representations in the visual domain.

4.4.3. Ablation on CSGA in AGFNet

To validate the effectiveness of the CSGA module, we conducted ablation experiments on three datasets, and the results are presented in Table 8. Softmax and Sigmoid indicate replacing the 1-Sigmoid operation in CSGA with Softmax or Sigmoid, respectively. Additionally, we explore alternative difference measurement strategies by replacing the dot product with L1 and L2 norms to directly generate difference attention maps.
The results show that completely removing CSGA leads to a significant performance drop: the F1 scores on LEVIR-CD, WHU-CD, and SYSU-CD decrease by 0.70%, 1.45%, and 1.58%. While both L1 and L2 norms provide reasonable alternatives, they underperform compared to our proposed 1-Sigmoid design, with F1 scores consistently lower by 0.2–0.5% across datasets. This suggests that the learnable, non-linear transformation in the dot product followed by 1-Sigmoid offers superior discriminative capability for change detection compared to fixed distance metrics.
Among activation functions, both Softmax and Sigmoid bring improvements over the unguided case. However, Softmax’s normalization property leads to attention dispersion, as visualized in Figure 13, where it assigns high probabilities to non-change regions. While Sigmoid, which computes attention independently per region and thus outperforms Softmax, still operates on feature similarity. In contrast, the 1-Sigmoid function inherently focuses on feature difference, which aligns more directly with the objective of change detection. This fundamental distinction enables 1-Sigmoid to more effectively suppress pseudo-changes and accurately highlight true change regions, leading to superior performance.
In summary, CSGA’s explicit difference modeling with 1-Sigmoid effectively addresses attention dispersion, enhances change-background separability, and provides accurate guidance for subsequent adaptive scanning and difference modeling, achieving the best performance across all three datasets.

4.4.4. Ablation on DS-MRI in AGFNet

To evaluate the effectiveness of the proposed DS-MRI decoding structure, we conducted four ablation experiments on three datasets, with the comparative results summarized in Table 9. First, w/o DS-MRI denotes replacing the decoder with a simple U-Net-style cascaded decoder, which caused significant performance drops, reducing F1-scores to 90.92%, 92.86%, and 81.39% on LEVIR-CD, WHU-CD, and SYSU-CD, respectively. This confirms that simple concatenation fails to effectively integrate cross-temporal features in complex change detection scenarios.
Furthermore, removing either the VSS Block or AGSS Block also degraded performance. On SYSU-CD, omitting the VSS Block reduced F1 by 1.27%, while removing the AGSS Block on WHU-CD decreased F1 by 1.59%, demonstrating their complementary roles: the VSS Block captures cross-scale structural information and enhances semantic consistency, while the AGSS Block adaptively emphasizes differential features and focuses on true change regions. Replacing both blocks with residual convolutions (Res Blocks) improved results compared to removing DS-MRI entirely, but still underperformed the complete design, indicating that residual convolution alone cannot adequately model complex spatiotemporal differences.
Overall, the full DS-MRI achieved the best performance across all datasets, reaching 95.69% F1 and 91.74% IoU on WHU-CD. These results highlight that the synergistic integration of the VSS and AGSS Blocks is essential for effective feature alignment and differential modeling during decoding.

4.4.5. Ablation on AGSS Block in AGFNet

This section ablates the core scanning strategies within the AGSS block, with results detailed in Table 10. We compare our proposed ASS2D, which integrates four fixed and two adaptive scanning directions, against several representative strategies: the bidirectional SS1D [23] from VisionMamba, SS2D [22] as a four-directional baseline, the eight-directional OSSM [24] from RSMamba, and our simplified variant ASS1D with two adaptive scanning directions. The consistent superiority of ASS2D across all datasets validates the effectiveness of combining stable spatial priors with flexible attention guidance. While ASS1D demonstrates the value of adaptability alone, and SS2D shows the benefit of expanded fixed directions, their individual limitations are overcome by ASS2D’s synergistic design. This balanced approach proves most suitable for capturing the complex spatial dependencies in change detection tasks.

5. Discussion

Experimental results demonstrate that the proposed method achieves excellent performance across three benchmark datasets: LEVIR-CD, WHU-CD, and SYSU-CD. As reported in Section 4, our model outperforms all existing state-of-the-art methods across all evaluation metrics, particularly excelling in change boundary preservation and change detection under complex backgrounds.
To further quantitatively verify whether the performance advantage of the proposed method over baseline models is statistically significant, we conducted systematic paired statistical tests on the LEVIR-CD dataset. We employed two complementary statistical methods: the paired t-test was used to assess the significance of average performance differences, which assumes approximately normal distribution of the data and focuses on mean differences; the Wilcoxon signed-rank test served as a non-parametric alternative, evaluating the consistency of improvements based on performance rankings, without relying on distributional assumptions and being less sensitive to outliers. Both tests were conducted using two-sided hypotheses. The comparison results with four representative baseline models (Table 11) show that our method achieves high statistical significance in all comparisons (paired t-test: p < 1 × 10 6 ). Specifically, for ChangeMamba, SEIFNet, and ChangeFormer, the extremely low Wilcoxon p-values (p < 1 × 10 13 ) indicate that the performance advantage is highly consistent at the sample level. This collective statistical evidence demonstrates that the performance improvement brought by our method is systematic and robust, rather than being driven by random factors or a few outlier samples.

6. Conclusions

This paper addresses key challenges in high-resolution remote sensing change detection, such as insufficient exploitation of cross-temporal relationships and strong interference from irrelevant variations. We introduce AGFNet, a novel change detection framework that integrates a visual state space (VSS) model with 2D-DCT-based frequency-domain analysis. In the early feature extraction stage, the CSGA module performs unidirectional guidance to complement the backbone, aligning channel responses and providing explicit cues that facilitate subsequent feature extraction and difference modeling. Next, the FADM module processes bi-temporal feature pairs through parallel frequency–spatial operations within a lightweight architecture, efficiently producing highly discriminative difference representations. Finally, the DS-MRI decoder equipped with the AGSS Block adaptively models change regions through attention-guided scanning and progressively fuses multi-scale features.
Comprehensive experiments on three public datasets show that AGFNet achieves state-of-the-art performance in both accuracy and computational efficiency, demonstrating strong robustness in complex scenes and weak-change scenarios. Compared with competing methods, AGFNet delivers notably lower computational cost. Ablation studies further reveal the importance of both the VSSBlock and AGSSBlock for enhancing semantic consistency and spatial detail reconstruction, while the FADM module effectively suppresses pseudo-change interference.
Although AGFNet exhibits strong detection accuracy and statistically significant improvements, its overall model efficiency still presents limitations for deployment in resource-constrained environments. Future work will explore model compression strategies—such as knowledge distillation and pruning—as well as architectural refinements to better balance accuracy and complexity. We believe these enhancements will further improve practical applicability while preserving the model’s statistical performance advantages.
Author Contributions

Conceptualization, X.L. and L.T.; methodology, X.L. and L.T.; software, X.L. and Z.W.; investigation, X.L.; resources, L.T. and Y.W.; data curation, X.L. and R.G.; writing—original draft preparation, X.L.; writing—review and editing, X.L., L.T. and Y.W.; visualization, X.L. and H.Z.; supervision, L.T. and Y.W.; project administration, L.T., Y.W. and Y.D.; funding acquisition, L.T., Y.W. and Y.D. All authors have read and agreed to the published version of the manuscript.

Funding

This research was funded by the Scientific Research Projects of Institutions of Higher Education, Hebei Province(Grant No. CXZX2025038) and Science and Technology Project of Hebei Education Department (Grant No. QN2023141).

Data Availability Statement

The LEVIR-CD, WHU-CD, and SYSU-CD datasets used in this study are publicly available. LEVIR-CD: https://justchenhao.github.io/LEVIR/ (accessed on 5 June 2025). WHU-CD: https://gpcv.whu.edu.cn/data/building_dataset.html (accessed on 5 June 2025). SYSU-CD: https://github.com/liumency/SYSU-CD (accessed on 5 June 2025).

Conflicts of Interest

The authors declare no conflicts of interest.

References

  1. Zhan, T.; Tian, Q.; Zhu, Y.; Lan, J.; Dang, Q.; Gong, M. Difference-Aware Multiscale Feature Aggregation Network for Building Change Detection. IEEE Trans. Geosci. Remote Sens. 2025, 63, 5620915. [Google Scholar] [CrossRef]
  2. Lv, Z.; Huang, H.; Li, X.; Zhao, M.; Benediktsson, J.A.; Sun, W.; Falco, N. Land Cover Change Detection With Heterogeneous Remote Sensing Images: Review, Progress, and Perspective. Proc. IEEE 2022, 110, 1976–1991. [Google Scholar] [CrossRef]
  3. Wellmann, T.; Lausch, A.; Andersson, E.; Knapp, S.; Cortinovis, C.; Jache, J.; Scheuer, S.; Kremer, P.; Mascarenhas, A.; Kraemer, R.; et al. Remote sensing in urban planning: Contributions towards ecologically sound policies? Landsc. Urban Plan. 2020, 204, 103921. [Google Scholar] [CrossRef]
  4. Meola, J.; Eismann, M.T.; Moses, R.L.; Ash, J.N. Application of Model-Based Change Detection to Airborne VNIR/SWIR Hyperspectral Imagery. IEEE Trans. Geosci. Remote Sens. 2012, 50, 3693–3706. [Google Scholar] [CrossRef]
  5. Deng, J.S.; Wang, K.; Deng, Y.H.; Qi, G.J. PCA-based land-use change detection and analysis using multitemporal and multisensor satellite data. Int. J. Remote Sens. 2008, 29, 4823–4838. [Google Scholar] [CrossRef]
  6. Celik, T. Unsupervised Change Detection in Satellite Images Using Principal Component Analysis and k-Means Clustering. IEEE Geosci. Remote Sens. Lett. 2009, 6, 772–776. [Google Scholar] [CrossRef]
  7. Johnson, R.D.; Kasischke, E.S. Change vector analysis: A technique for the multispectral monitoring of land cover and condition. Int. J. Remote Sens. 1998, 19, 411–426. [Google Scholar] [CrossRef]
  8. Volpi, M.; Tuia, D.; Bovolo, F.; Kanevski, M.; Bruzzone, L. Supervised change detection in VHR images using contextual information and support vector machines. Int. J. Appl. Earth Obs. Geoinf. 2013, 20, 77–85. [Google Scholar] [CrossRef]
  9. Negri, R.G.; Frery, A.C.; Casaca, W.; Azevedo, S.; Dias, M.A.; Silva, E.A.; Alcântara, E.H. Spectral–Spatial-Aware Unsupervised Change Detection With Stochastic Distances and Support Vector Machines. IEEE Trans. Geosci. Remote Sens. 2021, 59, 2863–2876. [Google Scholar] [CrossRef]
  10. Caye Daudt, R.; Le Saux, B.; Boulch, A. Fully Convolutional Siamese Networks for Change Detection. In Proceedings of the 2018 25th IEEE International Conference on Image Processing (ICIP), Athens, Greece, 7–10 October 2018; pp. 4063–4067. [Google Scholar]
  11. Long, J.; Shelhamer, E.; Darrell, T. Fully Convolutional Networks for Semantic Segmentation. In Proceedings of the IEEE Conference on Computer Vision and Pattern Recognition (CVPR), Boston, MA, USA, 8–10 June 2015; pp. 3431–3440. [Google Scholar]
  12. Zhang, C.; Yue, P.; Tapete, D.; Jiang, L.; Shangguan, B.; Huang, L.; Liu, G. A deeply supervised image fusion network for change detection in high resolution bi-temporal remote sensing images. ISPRS J. Photogramm. Remote Sens. 2020, 166, 183–200. [Google Scholar] [CrossRef]
  13. Li, S.; Huo, L. Remote Sensing Image Change Detection Based on Fully Convolutional Network With Pyramid Attention. In Proceedings of the 2021 IEEE International Geoscience and Remote Sensing Symposium IGARSS, Online, 11–16 July 2021; pp. 4352–4355. [Google Scholar]
  14. Dosovitskiy, A.; Beyer, L.; Kolesnikov, A.; Weissenborn, D.; Zhai, X.; Unterthiner, T.; Dehghani, M.; Minderer, M.; Heigold, G.; Gelly, S.; et al. An Image is Worth 16x16 Words: Transformers for Image Recognition at Scale. arXiv 2020, arXiv:2010.04159. [Google Scholar] [CrossRef]
  15. Bandara, W.G.C.; Patel, V.M. A Transformer-Based Siamese Network for Change Detection. In Proceedings of the IGARSS 2022—2022 IEEE International Geoscience and Remote Sensing Symposium, Kuala Lumpur, Malaysia, 17–22 July 2022; pp. 207–210. [Google Scholar]
  16. Chen, H.; Qi, Z.; Shi, Z. Remote Sensing Image Change Detection With Transformers. IEEE Trans. Geosci. Remote Sens. 2022, 60, 5607514. [Google Scholar] [CrossRef]
  17. Liu, Z.; Lin, Y.; Cao, Y.; Hu, H.; Wei, Y.; Zhang, Z.; Lin, S.; Guo, B. Swin Transformer: Hierarchical Vision Transformer Using Shifted Windows. In Proceedings of the IEEE/CVF International Conference on Computer Vision (ICCV), Online, 11–17 October 2021; pp. 10012–10022. [Google Scholar]
  18. Zhang, C.; Wang, L.; Cheng, S.; Li, Y. SwinSUNet: Pure Transformer Network for Remote Sensing Image Change Detection. IEEE Trans. Geosci. Remote Sens. 2022, 60, 5224713. [Google Scholar] [CrossRef]
  19. Gu, A.; Dao, T. Mamba: Linear-Time Sequence Modeling with Selective State Spaces. arXiv 2023, arXiv:2312.00752. [Google Scholar] [CrossRef]
  20. Waleffe, R.; Byeon, W.; Riach, D.; Norick, B.; Korthikanti, V.; Dao, T.; Gu, A.; Hatamizadeh, A.; Singh, S.; Narayanan, D.; et al. An Empirical Study of Mamba-based Language Models. arXiv 2024, arXiv:2406.07887. [Google Scholar] [CrossRef]
  21. Zhao, H.; Zhang, M.; Zhao, W.; Ding, P.; Huang, S.; Wang, D. Cobra: Extending mamba to multi-modal large language model for efficient inference. In Proceedings of the AAAI Conference on Artificial Intelligence, Philadelphia, PA, USA, 27 February–4 March 2025; Volume 39, pp. 10421–10429. [Google Scholar]
  22. Liu, Y.; Tian, Y.; Zhao, Y.; Yu, H.; Xie, L.; Wang, Y.; Ye, Q.; Jiao, J.; Liu, Y. VMamba: Visual State Space Model. In Proceedings of the Advances in Neural Information Processing Systems, Vancouver, BC, Canada, 10–15 December 2024; Volume 37, pp. 103031–103063. [Google Scholar]
  23. Zhu, L.; Liao, B.; Zhang, Q.; Wang, X.; Liu, W.; Wang, X. Vision Mamba: Efficient Visual Representation Learning with Bidirectional State Space Model. In Proceedings of the 41st International Conference on Machine Learning, Vienna, Austria, 21–27 July 2024; Volume 235, pp. 62429–62442. [Google Scholar]
  24. Chen, K.; Chen, B.; Liu, C.; Li, W.; Zou, Z.; Shi, Z. RSMamba: Remote Sensing Image Classification With State Space Model. IEEE Geosci. Remote Sens. Lett. 2024, 21, 8002605. [Google Scholar] [CrossRef]
  25. He, X.; Cao, K.; Zhang, J.; Yan, K.; Wang, Y.; Li, R.; Xie, C.; Hong, D.; Zhou, M. Pan-mamba: Effective pan-sharpening with state space model. Inf. Fusion 2025, 115, 102779. [Google Scholar] [CrossRef]
  26. Ma, X.; Zhang, X.; Pun, M.O. RS3Mamba: Visual State Space Model for Remote Sensing Image Semantic Segmentation. IEEE Geosci. Remote Sens. Lett. 2024, 21, 6011405. [Google Scholar] [CrossRef]
  27. Liu, M.; Dan, J.; Lu, Z.; Yu, Y.; Li, Y.; Li, X. CM-UNet: Hybrid CNN-Mamba UNet for Remote Sensing Image Semantic Segmentation. arXiv 2024, arXiv:2405.10530. [Google Scholar] [CrossRef]
  28. Zhu, E.; Chen, Z.; Wang, D.; Shi, H.; Liu, X.; Wang, L. UNetMamba: An Efficient UNet-Like Mamba for Semantic Segmentation of High-Resolution Remote Sensing Images. IEEE Geosci. Remote Sens. Lett. 2025, 22, 6001205. [Google Scholar] [CrossRef]
  29. Ronneberger, O.; Fischer, P.; Brox, T. U-net: Convolutional networks for biomedical image segmentation. In Proceedings of the International Conference on Medical Image Computing and Computer-Assisted Intervention, Munich, Germany, 5–9 October 2015; pp. 234–241. [Google Scholar]
  30. Fang, S.; Li, K.; Shao, J.; Li, Z. SNUNet-CD: A Densely Connected Siamese Network for Change Detection of VHR Images. IEEE Geosci. Remote Sens. Lett. 2022, 19, 8007805. [Google Scholar] [CrossRef]
  31. Lei, T.; Geng, X.; Ning, H.; Lv, Z.; Gong, M.; Jin, Y.; Nandi, A.K. Ultralightweight Spatial–Spectral Feature Cooperation Network for Change Detection in Remote Sensing Images. IEEE Trans. Geosci. Remote Sens. 2023, 61, 4402114. [Google Scholar] [CrossRef]
  32. Huang, Y.; Li, X.; Du, Z.; Shen, H. Spatiotemporal Enhancement and Interlevel Fusion Network for Remote Sensing Images Change Detection. IEEE Trans. Geosci. Remote Sens. 2024, 62, 5609414. [Google Scholar] [CrossRef]
  33. Chen, J.; Yuan, Z.; Peng, J.; Chen, L.; Huang, H.; Zhu, J.; Liu, Y.; Li, H. DASNet: Dual Attentive Fully Convolutional Siamese Networks for Change Detection in High-Resolution Satellite Images. IEEE J. Sel. Top. Appl. Earth Obs. Remote. Sens 2021, 14, 1194–1206. [Google Scholar] [CrossRef]
  34. Gao, Y.; Pei, G.; Sheng, M.; Sun, Z.; Chen, T.; Yao, Y. Relating CNN-Transformer Fusion Network for Remote Sensing Change Detection. In Proceedings of the 2024 IEEE International Conference on Multimedia and Expo (ICME), Niagra Falls, ON, Canada, 15–19 July 2024; pp. 1–6. [Google Scholar]
  35. Feng, Y.; Jiang, J.; Xu, H.; Zheng, J. Change Detection on Remote Sensing Images Using Dual-Branch Multilevel Intertemporal Network. IEEE Trans. Geosci. Remote Sens. 2023, 61, 4401015. [Google Scholar] [CrossRef]
  36. Peng, X.; Zhong, R.; Li, Z.; Li, Q. Optical Remote Sensing Image Change Detection Based on Attention Mechanism and Image Difference. IEEE Trans. Geosci. Remote Sens. 2021, 59, 7296–7307. [Google Scholar] [CrossRef]
  37. Ebrahimzadeh, M.; Manzuri, M.T. MaskChanger: A Transformer-Based Model Tailoring Change Detection with Mask Classification. In Proceedings of the 2024 13th Iranian/3rd International Machine Vision and Image Processing Conference (MVIP), Tehran, Iran, 6–7 March 2024; pp. 1–6. [Google Scholar]
  38. Cheng, B.; Misra, I.; Schwing, A.G.; Kirillov, A.; Girdhar, R. Masked-Attention Mask Transformer for Universal Image Segmentation. In Proceedings of the IEEE/CVF Conference on Computer Vision and Pattern Recognition (CVPR), Online, 19–24 June 2022; pp. 1290–1299. [Google Scholar]
  39. Noman, M.; Fiaz, M.; Cholakkal, H.; Narayan, S.; Muhammad Anwer, R.; Khan, S.; Shahbaz Khan, F. Remote Sensing Change Detection With Transformers Trained From Scratch. IEEE Trans. Geosci. Remote Sens. 2024, 62, 4704214. [Google Scholar] [CrossRef]
  40. Zhang, M.; Yu, Y.; Jin, S.; Gu, L.; Ling, T.; Tao, X. VM-UNET-V2: Rethinking vision mamba UNet for medical image segmentation. In Proceedings of the International Symposium on Bioinformatics Research and Applications, Kunming, China, 19–21 July 2024; pp. 335–346. [Google Scholar]
  41. Wang, Z.; Zheng, J.Q.; Zhang, Y.; Cui, G.; Li, L. Mamba-UNet: UNet-Like Pure Visual Mamba for Medical Image Segmentation. arXiv 2024, arXiv:2402.05079. [Google Scholar] [CrossRef]
  42. Ma, J.; Li, F.; Wang, B. U-Mamba: Enhancing Long-range Dependency for Biomedical Image Segmentation. arXiv 2024, arXiv:2401.04722. [Google Scholar] [CrossRef]
  43. Xing, Z.; Ye, T.; Yang, Y.; Liu, G.; Zhu, L. Segmamba: Long-range sequential modeling mamba for 3d medical image segmentation. In Proceedings of the International Conference on Medical Image Computing and Computer-Assisted Intervention, Marrakesh, Morocco, 6–10 October 2024; pp. 578–588. [Google Scholar]
  44. Wang, J.; Chen, J.; Chen, D.; Wu, J. Lkm-unet: Large kernel vision mamba unet for medical image segmentation. In Proceedings of the International Conference on Medical Image Computing and Computer-Assisted Intervention, Marrakesh, Morocco, 6–10 October 2024; pp. 360–370. [Google Scholar]
  45. Zhang, H.; Chen, K.; Liu, C.; Chen, H.; Zou, Z.; Shi, Z. CDMamba: Incorporating Local Clues Into Mamba for Remote Sensing Image Binary Change Detection. IEEE Trans. Geosci. Remote Sens. 2025, 63, 4405016. [Google Scholar] [CrossRef]
  46. Zhao, J.; Xie, J.; Zhou, Y.; Du, W.L.; Yao, R.; Saddik, A.E. ST-Mamba: Spatio-Temporal Synergistic Model for Remote Sensing Change Detection. IEEE Trans. Geosci. Remote Sens. 2025, 63, 4412413. [Google Scholar] [CrossRef]
  47. Zhao, S.; Chen, H.; Zhang, X.; Xiao, P.; Bai, L.; Ouyang, W. RS-Mamba for Large Remote Sensing Image Dense Prediction. IEEE Trans. Geosci. Remote Sens. 2024, 62, 5633314. [Google Scholar] [CrossRef]
  48. Chen, H.; Song, J.; Han, C.; Xia, J.; Yokoya, N. ChangeMamba: Remote Sensing Change Detection With Spatiotemporal State Space Model. IEEE Trans. Geosci. Remote Sens. 2024, 62, 4409720. [Google Scholar] [CrossRef]
  49. Qin, Z.; Zhang, P.; Wu, F.; Li, X. FcaNet: Frequency Channel Attention Networks. In Proceedings of the IEEE/CVF International Conference on Computer Vision (ICCV), Online, 10–17 October 2021; pp. 783–792. [Google Scholar]
  50. Ji, S.; Wei, S.; Lu, M. Fully Convolutional Networks for Multisource Building Extraction From an Open Aerial and Satellite Imagery Data Set. IEEE Trans. Geosci. Remote Sens. 2019, 57, 574–586. [Google Scholar] [CrossRef]
  51. Chen, H.; Shi, Z. A Spatial-Temporal Attention-Based Method and a New Dataset for Remote Sensing Image Change Detection. Remote Sens. 2020, 12, 1662. [Google Scholar] [CrossRef]
  52. Shi, Q.; Liu, M.; Li, S.; Liu, X.; Wang, F.; Zhang, L. A Deeply Supervised Attention Metric-Based Network and an Open Aerial Image Dataset for Remote Sensing Change Detection. IEEE Trans. Geosci. Remote Sens. 2022, 60, 5604816. [Google Scholar] [CrossRef]
  53. Berman, M.; Triki, A.R.; Blaschko, M.B. The Lovasz-Softmax Loss: A Tractable Surrogate for the Optimization of the Intersection-Over-Union Measure in Neural Networks. In Proceedings of the 2018 IEEE/CVF Conference on Computer Vision and Pattern Recognition, Salt Lake City, UT, USA, 19–23 June 2018; pp. 4413–4421. [Google Scholar]
Figure 1. Pseudo-changes caused by scene complexity and imaging conditions. (a,d) are the T1 images, (b,e) are the T2 images, (c,f) denote the Ground Truth.
Remotesensing 17 03844 g001
Figure 6. Structure of the AGSS Block within DS-MRI.
Remotesensing 17 03844 g006
Figure 7. Illustration of the structure of ASS2D.
Remotesensing 17 03844 g007
Figure 8. Visualization results of different methods on the LEVIR-CD test set. (a) T1 image, (b) T2 image, (c) Ground Truth, (d) FC-Siam-Conc, (e) SEIFNet, (f) RCTNet, (g) ScratchFormer, (h) BIT, (i) CDMamba, (j) ChangeMamba, (k) RS-Mamba, (l) AGFNet.
Remotesensing 17 03844 g008
Figure 9. Visualization results of different methods on the WHU-CD test set. (a) T1 image, (b) T2 image, (c) Ground Truth, (d) FC-Siam-Conc, (e) SEIFNet, (f) RCTNet, (g) ScratchFormer, (h) BIT, (i) CDMamba, (j) ChangeMamba, (k) RS-Mamba, (l) AGFNet.
Remotesensing 17 03844 g009
Figure 10. Visualization results of different methods on the SYSU-CD test set. (a) T1 image, (b) T2 image, (c) Ground Truth, (d) FC-Siam-Conc, (e) SEIFNet, (f) RCTNet, (g) ScratchFormer, (h) BIT, (i) CDMamba, (j) ChangeMamba, (k) RS-Mamba, (l) AGFNet.
Remotesensing 17 03844 g010
Figure 11. The relationship between model performance and model complexity. (a) Performance versus parameter count. (b) Performance versus computational FLOPs.
Remotesensing 17 03844 g011
Figure 12. Visualization results of the ablation study for the FADM on the LEVIR-CD dataset. (a) T1 image, (b) T2 image, (c) Ground Truth, and the comparative results from (d) feature Concatenation (Cat.), (e) |A–B|, (f) FTDM, (g) AGFNet.
Remotesensing 17 03844 g012
Figure 13. Visualization results of the ablation study for the CSGA module on the LEVIR-CD dataset. (a) w/o CSGA, (b) Softmax, (c) Sigmoid. (d) L1. (e) L2. (f) AGFNet.
Remotesensing 17 03844 g013
Table 1. Quantitative comparison of Different Methods on the LEVIR-CD Dataset.
MethodPROAF1IoUKC
FC-EF89.0986.4698.7787.7578.1887.11
FC-Siam-Conc90.5686.4198.8488.4479.2787.83
FC-Siam-Diff90.1086.6698.8388.3579.1387.74
SEIFNet91.7989.9999.0790.8383.2090.34
RCTNet92.2391.4199.1791.8284.8891.38
ChangeFormer91.4389.9799.0590.6982.9790.20
ScratchFormer91.6686.7598.8289.1480.4188.57
BIT91.9689.2099.0590.5682.7590.06
CDMamba91.2289.3999.0290.3082.3189.78
ChangeMamba92.2890.7499.1491.5084.3491.05
RSMamba89.9690.4899.0090.2582.1989.69
Ours92.7891.4699.2092.1285.3991.70
Note: Bold indicates the best result.
Table 2. Quantitative comparison of Different Methods on the WHU-CD Dataset.
MethodPROAF1IoUKC
FC-EF91.1782.1998.8586.4476.1385.85
FC-Siam-Conc83.6784.5398.5884.1072.5683.35
FC-Siam-Diff83.6986.1198.6384.8873.7484.17
SEIFNet91.1793.9899.3592.8686.6892.53
RCTNet94.4793.3099.4693.8888.4793.60
ChangeFormer93.0086.0299.0989.3880.8088.90
ScratchFormer93.5880.8798.9086.7676.6286.19
BIT92.2593.1199.3492.6886.3692.34
CDMamba92.2790.6899.2491.4784.2891.07
ChangeMamba96.3594.4399.5995.3891.1895.17
RSMamba90.7192.9599.2691.8184.8791.43
Ours96.1295.2699.6195.6991.7495.49
Note: Bold indicates the best result.
Table 3. Quantitative comparison of Different Methods on the SYSU-CD Dataset.
MethodPROAF1IoUKC
FC-EF83.4176.9690.9580.0566.7474.22
FC-Siam-Conc80.5479.7990.6880.1666.8974.08
FC-Siam-Diff80.8780.7590.9480.8167.8074.88
SEIFNet85.5381.0492.2983.2271.2778.23
RCTNet82.6983.0991.9182.8970.7877.60
ChangeFormer78.6278.9589.9778.7965.0072.23
ScratchFormer79.3580.1690.4079.7566.3373.47
BIT90.4777.2690.2178.8365.0672.47
CDMamba82.3877.1290.7179.6666.2073.66
ChangeMamba86.8579.7692.3783.1571.1678.24
RSMamba87.5674.4391.4780.4667.3175.06
Ours83.8085.1892.6284.4873.1379.64
Note: Bold indicates the best result.
Table 4. Comparison of model complexity results, including the number of parameters and floating-point operations when the input is a pair of bi-temporal images with a size of 256 × 256.
MethodParams(M)FLOPs(G)
FC-EF1.353.58
FC-Siam-Conc1.545.33
FC-Siam-Diff1.354.73
SEIFNet27.918.37
RCTNet13.9520.71
ChangeFormer41.03202.79
ScratchFormer37.00196.59
BIT12.4010.63
CDMamba11.9154.18
ChangeMamba36.6720.50
RSMamba51.9518.36
AGFNet47.077.82
Table 5. Ablation Study Results of CSGA, FADM, and DS-MRI in AGFNet on the LEVIR-CD and SYSU-CD Datasets.
CSGA FADM DS-MRI LEVIR-CDSYSU-CD
F1 IoU F1 IoU
×××90.2582.2380.8867.91
××90.5183.1581.1168.23
××90.8383.2081.2468.41
××91.2683.9482.5770.32
×90.9283.3581.3968.63
×91.7084.6683.1771.19
×91.4284.2082.9070.87
92.1285.3984.4873.13
Note: The symbols ✓ and × indicate the addition and removal of the module, respectively; bold indicates the best result.
Table 6. Ablation study on the impact of different loss functions.
Loss FunctionLEVIR-CDWHU-CDSYSU-CD
F1 IoU F1 IoU F1 IoU
CE Loss91.6384.5695.3891.1683.4171.54
Lovász Loss91.6784.6494.4389.4683.7372.01
Dice Loss91.6384.5694.0388.7384.1772.68
CE + Dice91.5984.4994.8090.1183.4171.55
CE + Lovász92.1285.3995.6991.7484.4873.13
Note: Bold indicates the best result.
Table 7. Ablation study of FADM.
MethodLEVIR-CDWHU-CDSYSU-CD
F1 IoU F1 IoU F1 IoU
Cat.91.7084.6694.6989.9183.1771.19
| A B | 91.6484.5895.1990.8283.2471.29
FTDM91.8384.9094.7089.9483.3571.45
Ours92.1285.3995.6991.7484.4873.13
Note: Bold indicates the best result on each dataset; | A B | denotes the absolute difference between two temporal features.
Table 8. Ablation Study of the CSGA module.
MethodLEVIR-CDWHU-CDSYSU-CD
F1 IoU F1 IoU F1 IoU
w/o CSGA91.4284.2094.2489.1282.9070.87
Softmax91.5784.4594.4789.5283.2971.37
Sigmoid91.8384.9095.1690.7683.7071.97
L191.8284.8895.4291.2483.8672.21
L291.9195.0395.3291.0683.2171.25
Ours92.1285.3995.6991.7484.4873.13
Note: Bold indicates the best result on each dataset; “w/o CSGA” denotes the model without the CSGA component.
Table 9. Ablation Study on DS-MRI.
MethodLEVIR-CDWHU-CDSYSU-CD
F1 IoU F1 IoU F1 IoU
w/o DS-MRI90.9283.3592.8686.6781.3968.63
w/o VSS Block91.8184.8694.5389.6283.2171.26
w/o AGSS Block91.7284.7194.1088.8782.2369.82
Res Block91.7884.8194.6489.8282.8570.72
Ours92.1285.3995.6991.7484.4873.13
Note: Bold indicates the best result on each dataset; “w/o” denotes “without”, representing the model removing the corresponding module.
Table 10. Ablation study of the component of the AGSS block.
Scanning Strategy LEVIR-CDWHU-CDSYSU-CD
F1 IoU F1 IoU F1 IoU
SS1D91.8284.8894.8890.2683.2571.31
ASS1D91.9085.0195.3891.1783.2771.34
SS2D91.9385.0795.1590.7583.4173.54
OSSM91.9485.0995.0390.3383.5771.88
ASS2D92.1285.3995.6991.7484.4873.13
Note: Bold indicates the best result on each dataset.
Table 11. Statistical significance tests comparing the proposed method with baseline models on LEVIR-CD test set.
MethodPaired t-Test p-ValueWilcoxon p-Value
ChangeMamba 1.15 × 10 7 4.59 × 10 13
RCTNet 8.69 × 10 7 3.70 × 10 3
SEIFNet 6.57 × 10 15 3.22 × 10 58
ChangeFormer 2.01 × 10 14 1.65 × 10 37
Disclaimer/Publisher’s Note: The statements, opinions and data contained in all publications are solely those of the individual author(s) and contributor(s) and not of MDPI and/or the editor(s). MDPI and/or the editor(s) disclaim responsibility for any injury to people or property resulting from any ideas, methods, instructions or products referred to in the content.