Highlights
What are the main findings?
- A multi-level VideoARD model formalizes scene–object–event entities with standardized metadata and provenance.
- A spatiotemporal VideoCube links frame facts to spatial, temporal, product, quality, and semantic dimensions to enable OLAP-style queries and cross-sensor integration.
What is the implication of the main finding?
- The standardized representation streamlines workflows, reducing preprocessing burden and improving reproducibility for detection, tracking, and event analysis.
- Benchmarks show lower query latency and resource usage with non-inferior or slightly improved task accuracy versus frame-level baselines.
Abstract
Remote sensing video (RSV) provides continuous, high spatiotemporal earth observations that are increasingly important for environmental monitoring, disaster response, infrastructure inspection and urban management. Despite this potential, operational use of video streams is hindered by very large data volumes, heterogeneous acquisition platforms, inconsistent preprocessing practices, and the absence of standardized formats that deliver data ready for immediate analysis. These shortcomings force repeated low-level computation, complicate semantic extraction, and limit reproducibility and cross-sensor integration. This manuscript presents a principled multi-level analysis-ready data (ARD) model for remote sensing video, named VideoARD, along with VideoCube, a spatiotemporal management and query infrastructure that implements and operationalizes the model. VideoARD formalizes semantic abstraction at scene, object, and event levels and defines minimum and optimal readiness configurations for each level. The proposed pipeline applies stabilization, georeferencing, key frame selection, object detection, trajectory tracking, event inference, and entity materialization. VideoCube places the resulting entities into a five-dimensional structure indexed by spatial, temporal, product, quality, and semantic dimension, and supports earth observation OLAP-style operations to enable efficient slicing, aggregation, and drill down. Benchmark experiments and three application studies, covering vessel speed monitoring, wildfire detection, and near-real-time three-dimensional reconstruction, quantify system performance and operational utility. Results show that the proposed approach achieves multi-gigabyte-per-second ingestion under parallel feeds, sub-second scene retrieval for typical queries, and second-scale trajectory reconstruction for short tracks. Case studies demonstrate faster alert generation, improved detection consistency, and substantial reductions in preprocessing and manual selection work compared with on-demand baselines. The principal trade-off is an upfront cost for materialization and storage that becomes economical when queries are repeated or entities are reused. The contribution of this work lies in extending the analysis-ready data concept from static imagery to continuous video streams and in delivering a practical, scalable architecture that links semantic abstraction to high-performance spatiotemporal management, thereby improving responsiveness, reproducibility, and cross-sensor analysis for Earth observation.
1. Introduction
RSV refers to time-sequenced imagery captured by aerial, spaceborne, or ground-based sensors that preserves both spatial and temporal continuity, enabling the observation of dynamic phenomena and moving objects in the observed scene [1,2]. Unlike static remote sensing imagery, which provides only discrete snapshots, RSV allows analysis of temporal changes, object behavior, and event dynamics, making it particularly valuable for real-time monitoring, environmental surveillance, disaster response, and urban management [3,4,5].
With the rapid advancement of remote sensing technologies, RSV has become increasingly accessible and widely adopted. As illustrated in Figure 1, remote sensing videos offer continuous spatiotemporal capture, enabling the sub-second observation of moving targets. This capability provides new opportunities for automatic object recognition, behavior analysis, and event detection [6].
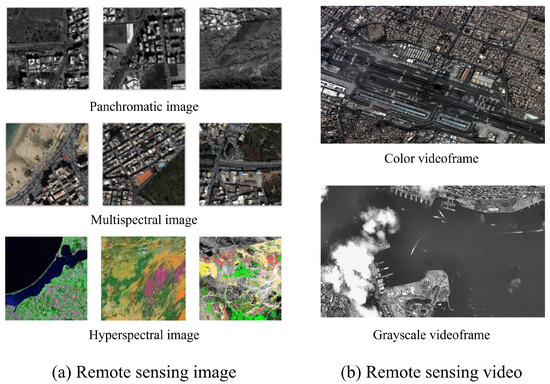
Figure 1.
Schematic comparison of static remote sensing images and remote sensing video. (a) Representative static images: panchromatic, multispectral, and hyperspectral. (b) Representative video frames: color and grayscale.
A widely used term in this context is Full Motion Video (FMV), which specifically denotes high-frame-rate video capturing continuous scene evolution, typically at 24–30 frames per-second or higher, and is extensively employed in applications such as object detection, target tracking, and dynamic activity analysis [7,8,9,10,11,12,13]. FMV can be considered a subset of RSV, emphasizing both the temporal resolution and real-time applicability of the data. Techniques developed for FMV processing are generally applicable to RSV, providing a foundation for advanced video analytics in remote sensing.
However, the massive volume, structural complexity, and diverse sources of video data significantly increase the cost of data management and processing. As shown in Figure 2, the absence of unified preprocessing and quality evaluation standards has left a large portion of these data underutilized, remaining as so-called “dark data” [14].
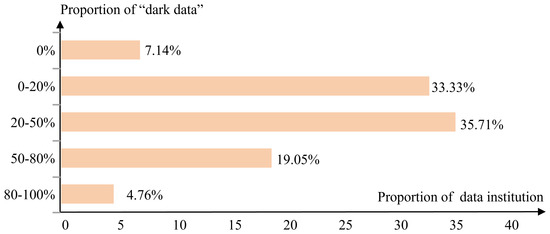
Figure 2.
Distribution of Chinese Earth observation institutions by proportion of “dark data”. The horizontal axis shows the percentage of institutions in each bin and the vertical axis indicates the share of data classified as “dark data”. For example, 4.76% of institutions have more than 80% of their holdings labeled as “dark data”.
Against this backdrop, the concept of ARD offers a valuable framework for the efficient use of remote sensing imagery. ARD ensures that data meet minimum analytical requirements through standardized preprocessing steps—such as calibration, registration, and atmospheric correction—allowing users to perform immediate, downstream analysis without additional preparation [15,16,17,18]. While several organizations (e.g., USGS, ESA) have developed ARD standards for optical and radar imagery [19,20,21,22,23], there remains a lack of a systematic ARD framework for remote sensing video. As a result, preprocessing is often tedious, semantic information is difficult to extract, and cross-source data integration poses significant challenges.
To address these challenges, this paper introduces VideoARD, a multi-level semantic abstraction model for analysis-ready remote sensing video data. The model abstracts and represents content at three semantic levels: scene-level for ground feature distribution, object-level for individual object characteristics, and event-level for dynamic activity patterns. It further leverages metadata fields and the OGC Moving Features API [24,25] to support structured storage and efficient data access. To manage large-scale video datasets, we also propose VideoCube which is a spatiotemporal cube framework. It supports Earth Online Analysis Process (EOLAP) operations such as slice, trim, roll-up, and drill-down, enabling multidimensional, high-throughput query and analysis. The main contributions of this study are summarized as follows:
- 1.
- Compared to directly applying algorithms on raw videos, VideoARD performs a one-time preprocessing step to generate reusable analysis-ready data, significantly reducing redundant computation in downstream tasks.
- 2.
- The multi-level semantic abstraction enables accurate extraction of scene, object, and event information, improving detection and recognition performance.
- 3.
- The spatiotemporal cube framework organizes data across varying resolutions and time scales, greatly enhancing querying and statistical efficiency.
- 4.
- The effectiveness and scalability of VideoARD are validated through three representative case studies—vessel speed monitoring, forest fire detection, and 3D scene reconstruction—by comparing it with baseline methods in terms of latency, accuracy, and resource consumption.
The remainder of this paper is organized as follows. Section 2 reviews existing ARD standards and the current landscape of remote sensing video data management. Section 3 presents the proposed VideoARD model and the implementation of the VideoCube framework. Section 4 evaluates system performance through application scenarios and benchmark comparisons. Section 5 discusses limitations and outlines potential directions for future research. Section 6 concludes the paper.
2. Related Works
This section provides a critical review of foundational work in two key areas: (1) the standardization of ARD for earth observation and (2) management techniques for remote sensing video data. We identify existing gaps and challenges that underscore the need for the proposed VideoARD framework.
2.1. Definition and Standardization Progress of ARD
The concept of ARD was first introduced by the Committee on Earth Observation Satellites (CEOS) to standardize preprocessing workflows for earth observation data. The goal is to convert raw observational data into products ready for immediate analysis, thereby reducing users’ reliance on low-level calibration and correction steps. Typically, ARD products must meet strict criteria, including sub-pixel geometric accuracy, atmospheric correction to surface reflectance, cloud, and shadow masking, as well as standardized projection and resolution, enabling automated analysis across time, space, and multiple sensors.
Key developments in the international standardization of ARD are outlined below:
- CEOS Analysis-Ready Data for Land (CARD4L): Developed by the CEOS Working Group on Calibration and Validation (WGCV), CARD4L [26] defines ARD product specifications for land remote sensing, covering optical, infrared, and radar sensors. It imposes strict requirements on geometric accuracy, radiometric calibration, quality masking, and metadata to ensure comparability and interoperability across satellites and sensors [27].
- USGS Landsat Collection 2 ARD: The USGS released Collection 2 ARD [28] products for the Landsat series provide tiled-surface reflectance data embedded with SpatioTemporal Asset Catalog (STAC) metadata and quality masks, supporting cloud-based analysis and downloads.
- Sentinel-2 Level-2A: Although not explicitly labeled as ARD, the European Space Agency’s Sentinel-2 L2A products under the Copernicus program implement atmospheric correction, scene classification masks, and standardized projections, consistent with ARD principles. These products are distributed on cloud platforms such as CREODIAS in an ARD-compatible manner [18,29,30].
- Open Data Cube (ODC): The ODC initiative offers a data cube framework for ARD distribution and management, enabling the loading and cataloging of ARD products from diverse sources and bands [27]. It supports spatiotemporal linked retrieval and analysis, facilitating large-scale time series remote sensing research.
It can be observed that there are currently no ARD standards or products specifically designed for remote sensing videos. Therefore, specialized ARD extension standards are required to support temporal coherence and dynamic semantic abstraction in remote sensing video data. As summarized in Table 1, we compare our proposed ARD framework with existing mainstream standards, products, and frameworks of ARD in terms of temporal handling, semantic abstraction, and preprocessing requirements. The results demonstrate the advantages of our approach in achieving higher temporal fidelity, richer semantic representation, and reduced preprocessing overhead.

Table 1.
Comparison of temporal, semantic, and preprocessing characteristics across representative ARD products and standards.
2.2. Management and Analysis of Remote Sensing Video Data
Remote sensing video data exhibit unique challenges stemming from their temporal continuity and massive data volume. High-frame-rate sequences often contain substantial temporal redundancy, which increases storage and computational burdens when raw frames are directly processed [31,32,33]. Additionally, differences in spatial resolution, field of view, and revisit frequency among satellites, unmanned aerial vehicles (UAVs), and airborne sensors further complicate the integration and standardized management of multi-platform video sources [32,33]. Effective analysis in dynamic environments, e.g., wildfire propagation, traffic movement, or maritime surveillance, requires modeling temporal correlations across video frames, which is essential for capturing evolving spatiotemporal patterns [34].
Existing approaches generally fall into three categories. The first is academic prototype systems, typically built on libraries such as OpenCV and FFmpeg, which focus on fundamental operations like frame extraction or object detection. However, these systems often remain confined to isolated lab environments, lacking scalability and standardization. The second is commercial cloud platforms (e.g., AWS Ground Station [35], Google Earth Engine [36]), which have introduced distributed video analysis capabilities, including segmentation and tracking. These solutions, however, rely on closed APIs with limited transparency in terms of internal data models and semantic representations [37,38,39,40,41]. For the third category, recent research emphasizes multi-level semantic modeling by combining scene-level features with object-level motion to construct spatiotemporal graph structures. Studies in applications such as traffic monitoring and disaster prediction suggest that hierarchical semantic abstraction improves both analysis accuracy and computational efficiency [42,43,44,45,46,47].
A common strategy for semantic abstraction in remote sensing videos involves organizing content into three hierarchical levels: the scene level (environmental context), object level (detected and tracked entities), and event level (higher-order spatiotemporal activities). This framework supports structured annotation and enhances the indexing and retrieval of meaningful video content.
To support scalable organization and efficient querying of multi-source remote sensing video data, recent advances have incorporated data warehouse principles and OLAP techniques [34,48,49]. A typical approach involves the construction of spatiotemporal data cubes, where video frames are indexed by spatial and temporal dimensions. These cubes enable interactive querying through roll-up, drill-down, slicing, and dicing operations. Complementarily, spatiotemporal indexing techniques—such as R-tree [46] and quadtree [47] structures enhanced with temporal stamps—facilitate rapid access to scene-level content. In support of interoperability, interface standards like the OGC Moving Features API and STAC extensions are being explored for encoding semantic labels and geospatial metadata [50].
Although these efforts are still nascent, they lay the foundation for systems like VideoARD and VideoCube, which integrate multi-level semantics with scalable spatiotemporal models, and thus represent a promising direction for advancing video-based remote sensing analysis.
3. VideoARD Framework
3.1. VideoARD: A Multi-Level Data Model
The VideoARD framework is proposed to address the intrinsic complexity of remote sensing video data, which typically exhibit high spatial resolution, high temporal frequency, and a variety of acquisition conditions. Traditional video archives store raw or minimally processed frames, making analytical tasks inefficient due to repeated preprocessing, inconsistent metadata, and the absence of a unified semantic representation. The objective of the VideoARD model is to ensure that each video segment can be used directly for analytical tasks without additional preparation. This is achieved through a formalized multi-level semantic abstraction, covering scene-level, object-level, and event-level representations, each meeting defined minimum and optimal configurations of VideoARD.
3.1.1. Characteristics of Remote Sensing Video Data and ARD Readiness Criteria
As shown in Figure 3, remote sensing videos differ from conventional imagery primarily in their temporal continuity and the diversity of acquisition platforms such as satellites, UAVs, and surveillance and mobile terminals. These characteristics result in several technical challenges, including significant temporal redundancy, platform-dependent distortions, and heterogeneous spatial coverage.
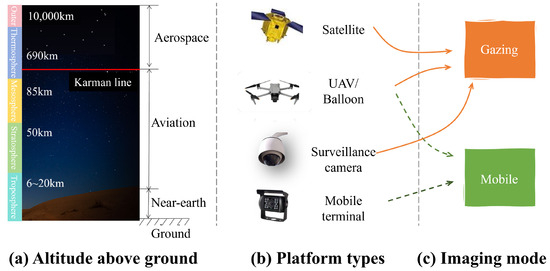
Figure 3.
Classification of remote sensing videos along three axes. (a) By altitude above ground: aerospace, aviation, near-Earth, and ground. (b) By platform/sensor type: satellite, UAV/balloon, surveillance camera, and mobile terminal. (c) By imaging mode: gazing (stationary) and mobile (platform in motion).
In the context of ARD, readiness is determined by whether the data meet specific quality and completeness criteria. For remote sensing videos, we define a minimum configuration as the set of attributes required for basic analytical usability, such as consistent georeferencing, corrected radiometry, and essential metadata fields. The optimal configuration represents the highest level of readiness, including fine-grained semantic annotations, multi-temporal calibration, and harmonized sensor models. Only when each of the three semantic levels (scene, object, event) meets at least the minimum configuration can the video segment be classified as ARD-compliant.
3.1.2. Semantic Abstraction Framework
The core of the VideoARD model is the semantic abstraction process, which transforms raw spatiotemporal data into structured entities that are immediately analyzable.
Let a remote sensing video be denoted as Equation (1), where is the t-th frame, accompanied by its associated metadata (geolocation, timestamp, platform orientation, IMU/GPS data, sensor parameters, and so on).
We define three sets:
- S: Scene-level entities, each representing a spatial–temporal segment of the video.
- O: Object-level entities, each corresponding to a tracked physical object.
- E: Event-level entities, each denoting high-level semantic phenomena involving one or more objects and/or scenes.
According to the level of data preprocessing, remote sensing videos are divided into four analysis-ready levels, as shown in Table 2.
Table 2.
VideoARD data processing level.
This process is formalized through three mapping functions:
- : Mapping from the original video to scene entities.
- : Mapping from the video to object entities.
- : Mapping from scenes and objects to event entities.
Equation (2) defines the mappings that formalize the transitions between levels.
As shown in Table 3, Table 4 and Table 5, we had summarized the minimum and optimal configurations for each level, including mandatory metadata fields, preprocessing steps, and semantic attributes.
Table 3.
Scene-level VideoARD metadata summary.
Table 4.
Object-level VideoARD metadata summary.
Table 5.
Event-level VideoARD metadata summary.
As shown in Figure 4, at the scene level, abstraction aims to encapsulate spatial coverage, temporal span, quality assessment, and references to reduced-resolution previews for rapid inspection. At the object level, abstraction involves detecting, tracking, and describing individual moving entities, storing their trajectories in a temporally consistent and geospatially calibrated form. At the event level, abstraction captures higher-order patterns or interactions among objects and scenes, such as vessel clustering, wildfire spread, or large-scale human activities.
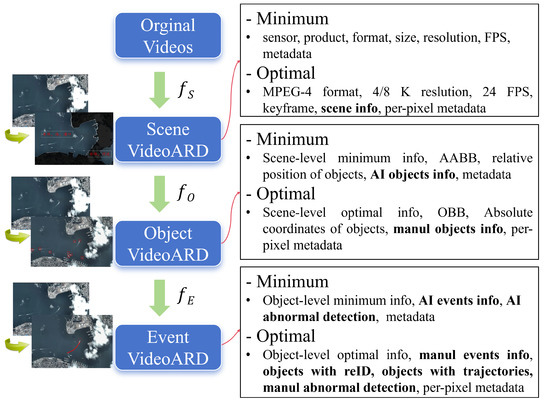
Figure 4.
Schematic diagram of the three-level semantic abstraction framework in VideoARD. The original video is processed by to produce the scene-level VideoARD, further transformed by into the object-level VideoARD, and then by into the event-level VideoARD. The right panel illustrates the minimal and optimal configurations corresponding to the three abstraction levels.
Figure 5 shows an example of scene/object/event information stored using the OGC moving features API. It can be observed that scene and object can be linked to event through the trajectory ID. Appendix A shows two real-world instances of moving features in the Jilin-1 satellite video.
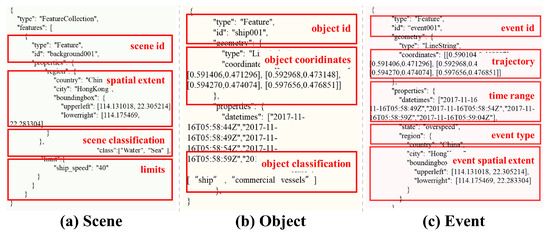
Figure 5.
Examples of scene, object, and event information in VideoARD. (a) Scene-level information, including scene ID, spatial extent, scene classification, and limits/thresholds. (b) Object-level information, including object ID, object coordinates, and object classification. (c) Event-level information, including event ID, trajectory, time range, event type, and event spatial extent.
By constructing geographic entities at three distinct level, namely scene, object, and event, the proposed approach maximally captures the spatiotemporal semantic information inherent in remote sensing video data and enables the extraction of user-relevant video content. Compared with traditional geographic information models that primarily focus on the data itself, this method enhances data usability, reduces the need for additional user processing, and introduces a novel retrieval dimension in the form of semantic-based video search, which can significantly improve retrieval efficiency.
The advantage of this framework lies in its modularity and composability. Each level can be processed and stored independently while remaining semantically linked, which supports both hierarchical querying and cross-level reasoning.
3.1.3. Multi-Level Model Design and Implementation
The multi-level structure of VideoARD is implemented through a combination of metadata schemas, preprocessing algorithms, and persistence mechanisms. Scene entities are stored with spatial and temporal indexes, object entities are indexed by trajectory identifiers and attributes, and event entities are stored with explicit references to the objects and scenes from which they were derived.
Formally, a scene s is represented as follows:
where is the spatial coverage, is the temporal range, is the spatial extent, is the category of the major background in the scene, is the quality descriptor, and is a URI to a quicklook product.
An object o is represented as follows:
where is the class label, is the existence time range, is the trajectory, and is a set of derived attributes.
An event e is represented as follows:
where is the event category, is the temporal range, is the spatial extent, is the set of participating objects, and is the confidence score.
As shown in Figure 6, the scene categories are derived from the classification of surface features defined in the international standard ISO 19144-2 “Geographic Information—Land Cover Metadata [51]”. To ensure interoperability and semantic consistency with existing geographic information systems, this standard was restructured for the domain of remote sensing video analysis, with a focus on highlighting category distinctions frequently emphasized in academic research and application scenarios. After reorganization, the scene classification is arranged into eight primary categories and several secondary subcategories, in order to balance expressive power with indexing efficiency.
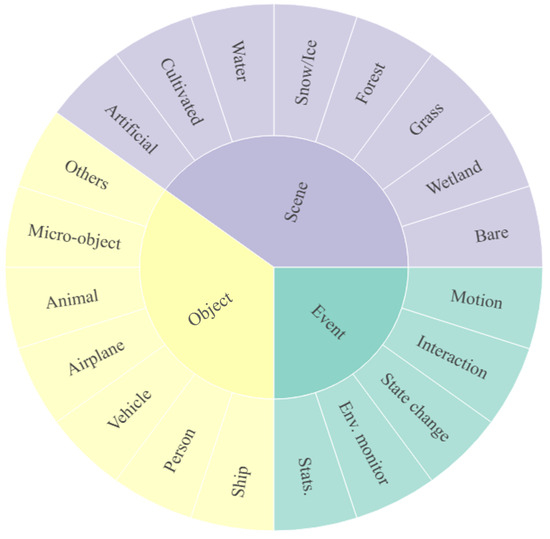
Figure 6.
Categories of scene, object, and event in VideoARD. Some labels use abbreviations, e.g., Env. for Environmental.
The object categories are based on the commonly used semantic system from the COCO dataset [52]. Considering the unique characteristics of remote sensing videos in terms of perspective, scale, and object representation, the original categories were merged and simplified, resulting in seven major categories and seventeen subcategories. This design preserves sufficient semantic granularity to support complex analyses while significantly reducing the engineering complexity of annotation and recognition.
The event categories were designed based on expert recommendations. In view of the cross-disciplinary expansion needs of VideoARD, the initial version of the framework defines only five basic event types, while also providing extensible interfaces that allow users or future work to incorporate additional domain-specific event types as needed. The complete list of scene, object, and event categories is provided in Table 6.
Table 6.
Scene, object, and event categories.
Overall, the adoption of standardized sources combined with application-oriented restructuring enables the three-layer semantic system to strike a balance among interoperability, feasibility, and scalability; the scene layer is used for rapid filtering and scheduling, the object layer for detection and semantic interpretation of trajectories, and the event layer for modeling high-level behaviors and processes.
This structured representation ensures reproducibility and traceability, as each entity retains references to its source data and the processing steps applied.
3.2. VideoCube: A Spatiotemporal Data Cube for VideoARD Management
The efficient storage, retrieval, and analysis of multi-level ARD entities require a dedicated spatiotemporal management structure. VideoCube is designed to fulfill this role by organizing scene, object, and event entities into a multidimensional array indexed by space, time, and semantic level.
3.2.1. Architecture and Implementation of VideoCube
Figure 7 depicts the architecture of the VideoCube, which partitions data along one fact, named Video Fact, and five primary dimensions: spatial, temporal, semantic, product, and quality. Each cell in the cube stores references to relevant ARD entities, along with aggregated statistics to support OLAP queries and analysis.
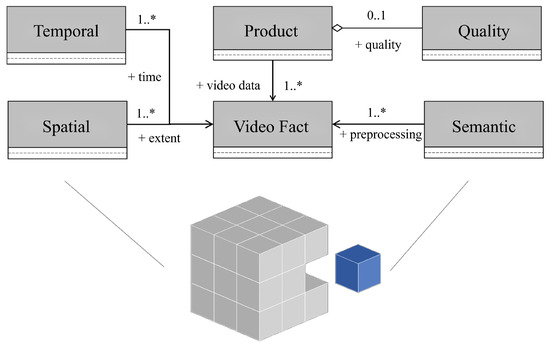
Figure 7.
Conceptual model of VideoCube. Symbols follow standard ER model notation.
- 1.
- Video Frame Fact: VideoARD tiles, generated by temporal segmentation and spatial gridding, serve as measures of the video frame fact, linked with temporal, spatial, product, and semantic dimensions.
- 2.
- Temporal Dimension: To harmonize varying temporal resolutions, this dimension is designed with precision higher than the maximum among data sources and is linked to the frame fact.
- 3.
- Spatial Dimension: Using a unified grid reference, heterogeneous spatial resolutions are standardized into a 2D grid, where each cell corresponds to a spatial member.
- 4.
- Product Dimension: This records product metadata, including source, type, and processing level, and is linked to the frame fact.
- 5.
- Quality Dimension: This captures scene-level quality indicators (e.g., scene classification, object detection accuracy, cloud masking) and is aggregated into the product dimension.
- 6.
- Semantic Dimension: This encodes higher-level video semantics, including scenes, objects, and events, and is linked to the frame fact.
Spatial partitioning reduces the cost of spatial filtering, temporal slicing allows direct access to relevant intervals, and semantic partitioning ensures that queries can be restricted to the desired level of abstraction. Columnar storage formats are used for object and event attributes to accelerate aggregation queries.
In terms of physical design, VideoCube ensures high-performance storage and efficient management of VideoARD through its database architecture and storage structures, thereby laying the foundation for subsequent high-performance analytical services. A complete database design is provided in Appendix B.
3.2.2. EOLAP Operations on VideoCube
VideoCube supports a set of EOLAP query and analysis operations tailored to remote sensing video analytics.
(1) EOLAP Query Operations: As shown in Table 7, EOLAP query operations mainly include the classical OLAP operations such as slice, trim, roll-up, and drill-down [53,54,55]. However, OLAP primarily targets business intelligence data cubes, while the proposed EOLAP extends these query operations to Earth observation data.
Table 7.
EOLAP query operations on VideoCube.
Figure 8 is an example of performing EOLAP query operations on VideoCube along the time dimension. It is obvious that new video cubes can be obtained through EOLAP query operation. Optimization strategies include the use of precomputed views for frequently requested aggregations and incremental decoding for drill-down operations, which minimizes the need to reprocess raw frames.
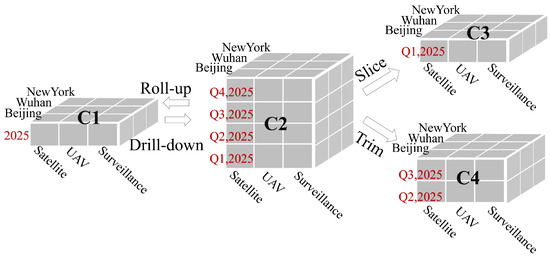
Figure 8.
Schematic of an EOLAP query operation. Red labels highlight queries along the temporal dimension. The VideoCube has a product dimension (Satellite, UAV, Surveillance); a spatial dimension (Beijing, Wuhan, New York); and a temporal dimension (2025 Q1–Q4). Applying “drill-down” to cube C1 yields a finer 2025 quarter-level cube C2; applying “roll-up” to C2 aggregates back to the year-level cube C1 over all spatial and product members (“drill-down” and “roll-up” are reversible). Applying “slice” to C2 selects a single quarter to form C3, while “trim” (i.e., a selective multi-member filter akin to “dice”) on C2 selects several quarters to form C4.
(2) EOLAP Analysis Operations: Traditional spatial OLAP (SOLAP) systems extend general OLAP to support multidimensional analysis of spatially referenced but static or slowly changing datasets, typically focusing on map-based exploration, aggregation, and visualization of spatial measures. In this work, we build on this idea and introduce the EOLAP analysis operations that are specifically tailored to RSV and high-temporal-resolution EO data. Beyond conventional SOLAP, EOLAP natively incorporates moving objects, events, and sensor/geometry metadata into the cube, and provides domain-specific operations such as trajectory-based slicing, event materialization, and frame-to-scene temporal aggregation. While general OLAP mainly supports statistical analysis and SOLAP adds geometric and scalar operations, neither can handle complex spatiotemporal and semantic analyses involving events and causal relationships. VideoCube overcomes this limitation by introducing advanced EOLAP-based semantic analysis operations for Earth observation data. One key function is trajectory join, which retrieves pairs of trajectories within a defined spatial or temporal window based on criteria such as intersection, proximity, or similarity. This allows the system to identify encounters, collisions, or coordinated formations. Another important function is event causality tracing, which leverages a three-level index of events, objects, and scenes to rapidly uncover the precursors of specific events. For instance, the system can link the occurrence of a fire to preceding variations in temperature, brightness, or object activity. Query execution and optimization are also integral to the framework. An EOLAP query first employs VideoCube metadata to determine appropriate voxel resolutions and materialized views. Attribute-based filtering is then applied in columnar storage, with trajectory indexes enabling partial decoding. For complex event inference, the system can adopt incremental decoding, processing only the key frames associated with relevant trajectories, which substantially reduces computational costs. To maintain interactive performance, frequently used complex queries may be accelerated through materialized templates, asynchronous aggregation, and multi-level caching.
The VideoARD framework and its VideoCube management structure provide a theoretically grounded and practically efficient approach to organizing remote sensing video data for immediate analysis. The multi-level abstraction ensures that analytical tasks can target the appropriate semantic granularity without redundant preprocessing. The spatiotemporal data cube model enables scalable retrieval and OLAP-style analysis, while maintaining traceability through explicit references between data entities and their sources.
4. Experimental Evaluation
This section presents a systematic evaluation of the VideoARD framework with respect to remote sensing video organization, analysis efficiency, and semantic representation capabilities. The evaluation is conducted through quantitative comparative experiments and validated using real-world application scenarios.
4.1. Efficiency Benchmarking
The efficiency of data access and query processing is a critical factor in evaluating the practical value of the proposed VideoARD model and its companion spatiotemporal management framework, VideoCube. In real-world remote sensing applications, data analysis often needs to be performed over long temporal sequences, heterogeneous sources, and under multi-user concurrent workloads. Therefore, the primary objective of this experiment is to determine whether the proposed method can sustain low latency and high throughput under large-scale workloads while maintaining analysis readiness.
4.1.1. Experimental Environment and Dataset
The experimental evaluation was conducted on a distributed computing platform specifically optimized for large-scale remote sensing video processing. The hardware configuration, summarized in Table 8, consists of one master node and three worker nodes, each equipped with high-performance multi-core CPUs and large-capacity memory to ensure the computational throughput required for near-real-time analysis. The system adopts a petabyte-scale storage infrastructure to accommodate the continuous ingestion and long-term retention of high-resolution video streams.
Table 8.
Experimental hardware environment.
The software environment, summarized in Table 9, integrates relational databases, spatial extensions, distributed file systems, and object storage frameworks. PostgreSQL with the PostGIS extension enables efficient management of spatial metadata associated with remote sensing video, supporting fine-grained geographic queries on frame- and object-level metadata. Hadoop Distributed File System (HDFS) and HBase are employed for distributed indexing of structured video frame and object information, providing high-throughput retrieval capabilities. For unstructured video files, the system adopts a distributed object storage approach using MinIO, allowing for flexible and scalable management of heterogeneous video data formats. This hybrid storage strategy ensures a balanced optimization between query latency for structured metadata and sustained I/O throughput for raw video content retrieval.
Table 9.
Experimental software environment.
This integrated architecture enables seamless interoperability between spatial databases and distributed storage backends. The combination of PostgreSQL/PostGIS with HDFS and HBase significantly reduces query latency for spatiotemporal retrieval operations while maintaining scalability for high-throughput ingestion. The object storage layer provided by MinIO ensures that large video files are managed independently of their metadata, which allows for optimized caching and load balancing strategies.
The datasets used in the experiments are shown in Table 10. They consist of multiple satellite and drone videos. The data sources used in the examples below are all from the datasets in Table 10.
Table 10.
Experimental datasets.
4.1.2. Benchmarking Methodology
Traditional remote sensing video data services are typically built on distributed file systems and object storage. To demonstrate the feasibility and efficiency of the approach proposed in this study, we conduct a comprehensive evaluation covering three aspects: experimental design, experimental results, and result analysis. The comparison focuses on performance in terms of query time, data throughput, and resource utilization between our method and traditional approaches.
The experiments are conducted using a controlled comparison design, with details of the experimental plan, evaluation metrics, datasets, and procedures described as follows.
(1) Experimental Groups: The experimental group applies the proposed service method (Group A), while the control group (Group B) uses a video data service based on the HDFS combined with the MinIO object storage service.
(2) Evaluation Metrics:
- Query time (ms): The time difference between a user request and the system’s data response.
- Data throughput (Mbps): The maximum data volume the system can process.
- Resource utilization: CPU consumption.
(3) Experimental Data: The datasets and experimental environment used in this section are described in Section 4.1.1.
(4) Experimental Procedure: A load-testing tool (JMeter) is employed to simulate concurrent access by multiple users, with four levels of concurrency: 10, 50, 100, and 500 users. The experiments are carried out in two steps: data query and object tracking. For each concurrency level, query time, data throughput, and resource utilization are measured and recorded.
4.1.3. Results and Observations
After conducting the benchmark tests, the experimental results are shown in Figure 9.
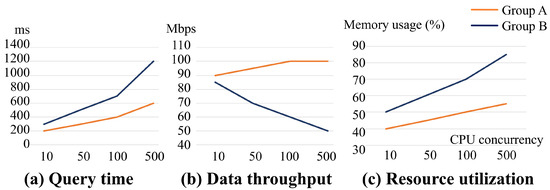
Figure 9.
Comparison of service performance. Panels (a), (b), and (c) show differences between Group A (proposed method) and Group B (conventional method) in query time, data throughput, and resource utilization, respectively.
As illustrated in Figure 9a, the response time of the experimental group increased from 200 ms to 600 ms as the number of concurrent users rose, whereas the control group’s response time increased from 250 ms to 1200 ms. The control group exhibited both higher latency and a faster growth rate in response time compared with the experimental group. Figure 9b shows that as concurrency increased, the experimental group’s throughput initially rose from 90 Mbps to 1000 Mbps and then stabilized, while the control group’s throughput decreased from 85 Mbps to 50 Mbps. Thus, the experimental method demonstrated higher and more stable throughput. Figure 9c indicates that CPU utilization increased for both groups with higher concurrency, but the experimental group showed slower and more stable growth, whereas the control group’s CPU usage rose faster and was less stable.
The results indicate that the proposed service method is more efficient than traditional approaches. Several factors, summarized in Table 11, likely contribute to this improvement:
- 1.
- Enhanced data modeling: The proposed method incorporates a multi-dimensional hierarchical structure on top of distributed storage, making it better suited for complex analytical tasks. In contrast, object storage methods focus primarily on block-based storage and redundancy, without supporting complex data-dimensional models.
- 2.
- Structured and fine-grained management: The proposed method extends data across spatial, temporal, and semantic dimensions, facilitating rapid queries and supporting complex applications. Object storage, however, is oriented toward unstructured data management and lacks support for complex queries.
- 3.
- High concurrency support: By using distributed architecture and multi-dimensional data partitioning, the proposed method supports parallel processing and high-concurrency access. The VideoCube design leverages load balancing and parallel mechanisms to maintain low latency under heavy load. While traditional file systems and object storage can handle concurrency, their performance can degrade for complex queries or large-scale concurrent access.
- 4.
- Optimized query efficiency: The proposed method emphasizes efficient multi-dimensional query and analysis through the indexing, caching, and pre-processing of key frames. Traditional methods primarily optimize for data transfer speed and storage scalability rather than complex query performance.
- 5.
- Application-specific design: The method is tailored to complex remote sensing video scenarios, enabling multi-dimensional queries and rapid analytics. Object storage solutions are better suited for general-purpose tasks such as video-on-demand or data backup, but are less effective for real-time analysis or multi-dimensional retrieval.
Table 11.
Comparison of experimental groups.
Table 11.
Comparison of experimental groups.
| Comparison Dimension | Group A (Ours) | Group B |
|---|---|---|
| Architecture | Multi-level analytical model combining spatiotemporal cubes and semantic dimensions; supports complex queries and analytics | Distributed file system or object storage architecture; emphasizes storage and data transfer efficiency |
| Data Management | Multi-level management (scene, object, event); structured and fine-grained | Simple file-block and metadata-based management |
| Concurrency Support | Multi-dimensional partitioning and parallel processing; suitable for high-concurrency, multi-dimensional queries | High concurrency capability, but limited support for complex queries |
| Performance Optimization | Preprocessing key frames and semantic data; caching and indexing improve access speed | Relies on block storage and redundancy; low efficiency for complex queries |
| Application Scenarios | Multi-user remote sensing video analysis, dynamic analytics, event detection | Simple queries and storage, e.g., video-on-demand, backup |
In summary, compared with traditional distributed file system and object storage approaches, the proposed method offers superior data management and complex query support, enabling efficient multi-dimensional, dynamic, and concurrent data analysis. Traditional object storage is better suited for general-purpose video storage, providing scalability but limited analytical capability.
The results demonstrate that the proposed approach achieves multi-gigabyte-per-second ingestion under parallel feeds, sub-second scene retrieval for typical queries and second-scale trajectory reconstruction for short tracks.
4.2. Application Cases Studies
Having established the superior system-level performance of VideoARD through controlled benchmarks, we now evaluate its practical utility through three real-world application scenarios. These cases span different semantic requirements and operational constraints, thereby exercising the scene-level, object-level, and event-level functionalities of the proposed framework. Each case begins with a concise statement of the operational objective, specifies the input modality and the VARD configuration used, describes the processing chain, and then reports system-level performance and practical observations.
4.2.1. Case 1: Vessel Speed Monitoring (Object-Level Case)
(1) Objective: The operational objective is continuous monitoring of vessel speed within a port area, supporting near-real-time detection of abnormal motion and automated alerting. This application primarily exercises the object-level semantics of VideoARD while requiring scene-level consistency to ensure geolocation correctness.
(2) Data and VideoARD Configuration: As shown in Figure 10, the case uses Jilin 1 satellite videos covering Victoria Harbour, Hong Kong. In Figure 10a, the satellite video data are from the Jilin-1 satellite, captured on 24 September 2023, at 13:00, covering the Victoria Harbour area in Hong Kong. The video spans from 13:33:05 to 13:34:35 on the same day, with a spatial extent from 114.131018°E to 114.175469°E in longitude and from 22.283304°N to 22.305214°N in latitude. Figure 10b shows Google satellite imagery updated in September 2023, covering a spatial extent from 114.078582°E to 114.229129°E in longitude and from 22.255089°N to 22.339743°N in latitude.
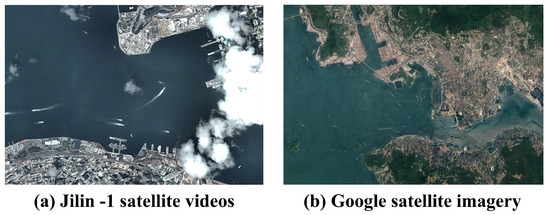
Figure 10.
Datasets used in Case 1. (a) Jilin-1 satellite video data covering Victoria Harbour, Hong Kong. (b) Google satellite imagery covering Victoria Harbour, Hong Kong.
The object-level entities are required to satisfy the minimum configuration for basic monitoring. The preprocessing pipeline enforces spatial and temporal registration, video stabilization, per-frame georeferencing, and key frame extraction. Object detection and classification is performed on preprocessed key frames, followed by multi-frame association and trajectory smoothing.
(3) Processing and Results: A dedicated cross-video small object tracking algorithm, based on an improved YOLOv8 [56] and DeepSORT [57], was employed to address challenges such as motion blur and occlusion common in satellite videos, as detailed in Figure 11. The algorithm integrates a fine-tuned YOLOv8 with SAM [58] for enhanced shape representation of small-scale objects and incorporates a cross-video object retrieval module for object re-identification across videos, significantly improving tracking accuracy while reducing identity switches.
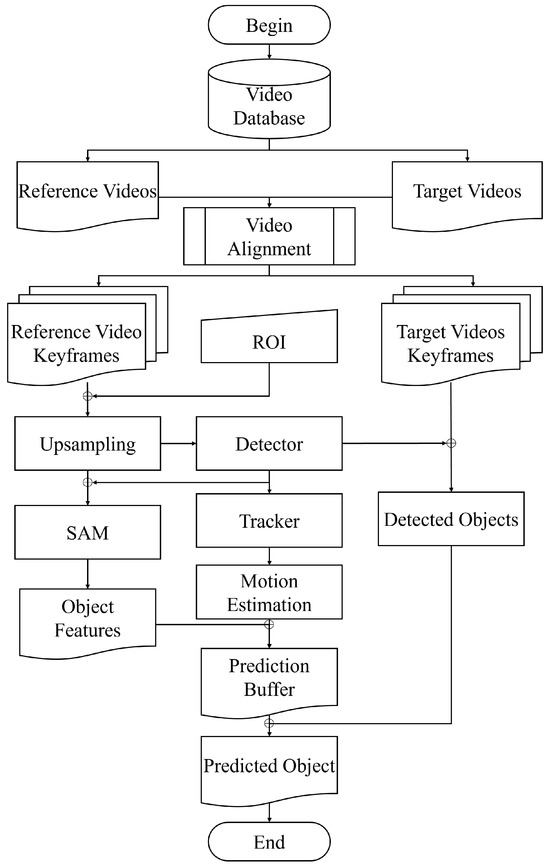
Figure 11.
Small object tracking in remote sensing videos. Reference videos are reference videos in which the object first appeared, while target videos are the video in which the same object may reappear. Video alignment denotes spatial, temporal, and color alignment; ROI indicates the region of interest. Detector refers to object detection algorithms (e.g., YOLOv8), tracker to tracking algorithms (e.g., DeepSORT), and SAM to the Segment Anything Model for enhanced segmentation.
System-level timing for a typical monitoring episode is summarized in Table 12, and the visualization results are shown in Figure 12. The results demonstrate that once trajectories are materialized in VideoCube, query times for operational alarms become lightweight and deterministic.
Table 12.
Time spent at each stage of Case 1.
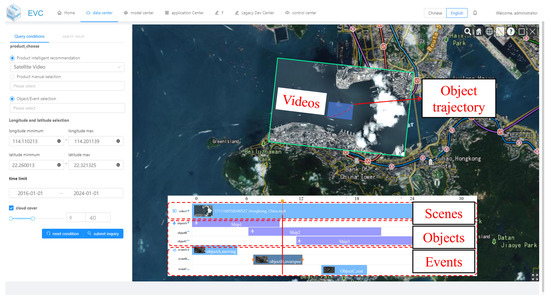
Figure 12.
Vessel speed monitoring results.
(4) Observation: Comparison to the traditional baseline indicates that VideoARD reduces the time taken to retrieve object trajectories and generate alerts by one order of magnitude in high-reuse scenarios. The principal reason for this is that the baseline recomputes detection and association on demand, whereas VideoARD reuses materialized object entities.
4.2.2. Case 2: Wildfire Detection and Monitoring (Event-Level Case)
(1) Objective: The objective is early detection and continuous tracking of fire fronts and smoke plumes across heterogeneous platforms. This application stresses scene-level semantics because accurate estimation of burn extent and propagation depends on consistent scene quality metadata and on multi-frame spatial coherence.
(2) Data and VideoARD Configuration: Input data include both UAV video and satellite video (Himawari 8) over a forested test site in Australia. As shown in Figure 13a, the Himawari-8 satellite video data cover the period from 1 December 2019 to 4 January 2020, with a spatial extent from 112.131671°E to 152.649245°E in longitude and from 37.498355°S to 10.948692°S in latitude. Figure 13b presents UAV surveillance video data collected over the New South Wales State Conservation Area between 26 December and 30 December 2019, with a spatial extent from 145.664346°E to 145.893686°E in longitude and from 33.082984°S to 32.942492°S in latitude. Figure 13c shows Google satellite imagery updated in September 2023, covering a spatial extent from 112.131671°E to 152.649245°E in longitude and from 37.498355°S to 10.948692°S in latitude.
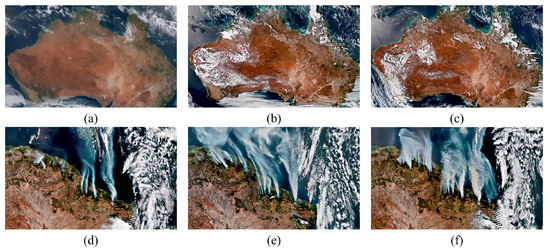
Figure 13.
Datasets used in Case 2. Panels (a–c) show the temporal progression of Australian forest fires captured by the Himawari 8 satellite, while panels (d–f) show a zoomed-in view of fire development in a coastal region.
(3) Processing and Results: The preprocessing pipeline emphasizes stabilization, radiometric normalization, and cloud and smoke masking. Fire detection leverages a frame-level classifier (DEnet [59]) tuned to smoke and high-temperature signatures. The visualization results are shown in Figure 14, and Figure 15 presents the sequence of frames showing detected smoke masks and the temporal expansion of the burnt area.
Figure 14.
Wildfire detection and monitoring results. Scene#1 is from satellite video; Scene#2 from UAV video. Smoke objects (Object#1) detected in both scenes are automatically identified as fire events (Event#1).
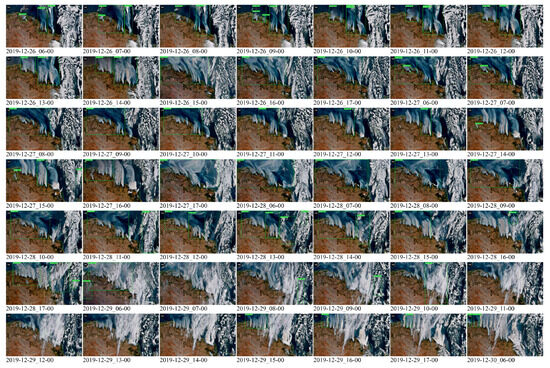
Figure 15.
Smoke detection maps over time. Green boxes indicate detected smoke targets, showing fire progression.
Representative timings for the wildfire monitoring workflow are reported in Table 13.
Table 13.
Time spent at each stage of Case 2.
(4) Observation: The experiment demonstrates that the scene materialization time is modest. Once scene-level overviews and per-frame masks are generated, area aggregation and temporal trend queries are executed rapidly. The VideoARD approach reduces the time required for repeated queries such as cumulative burned area estimation, which are common during active fire operations.
4.2.3. Case 3: Near-Real-Time 3D Scene Reconstruction (Scene-Level Case)
(1) Objective: The objective is to produce dense three-dimensional models of an urban segment from a collection of UAV video streams in near real time. This application primarily exercises scene-level indexing combined with selective extraction of multi-view frame sets that satisfy geometric diversity and overlap constraints.
(2) Data and VideoARD Configuration: The input data includes both UAV videos and Google satellite imagery. As shown in Figure 16a, the remote sensing video data were acquired by a UAV over the Qilihe District of Lanzhou City on 4 February 2023. The video spans from 13:12:05 to 13:32:01 local time on the same day, covering a spatial extent from 103.708586°E to 103.768924°E in longitude and from 36.071303°N to 36.098563°N in latitude. Figure 16b presents Google satellite imagery updated in September 2023, covering a spatial extent from 103.570312°E to 103.939384°E in longitude and from 36.015922°N to 36.159638°N in latitude.
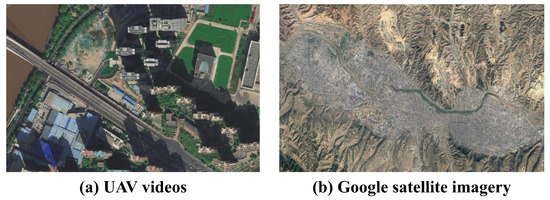
Figure 16.
Datasets used in Case 3. (a) UAV video data covering Qilihe District, Lanzhou City. (b) Google satellite imagery covering Lanzhou City.
The key contribution of VideoARD is that the cube provides fast access to scene candidates and to meta-information that identifies frames with complementary viewpoints and sufficient baseline for photogrammetric reconstruction.
(3) Processing and Results: The preprocessing stage generates scene-level summaries that include frame geolocation, view vectors, and coarse image quality indicators. A view selection step then queries VideoCube to return a candidate set of frames. The subsequent dense reconstruction uses the Danesfield algorithm [60], an end-to-end system for extracting 3D models from multi-view imagery, which includes semantic segmentation of buildings and texture mapping. The visualization results are shown in Figure 17, and Figure 18 shows the results of the 3D scene reconstruction.
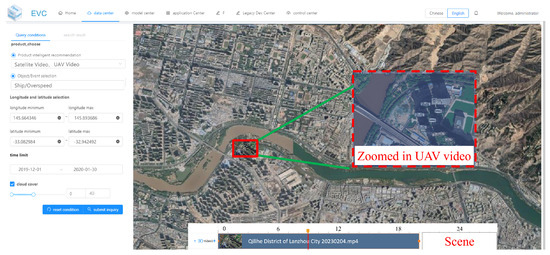
Figure 17.
Near-real-time 3D scene reconstruction results. Red boxes indicate UAV video frames, with red dashed boxes showing zoomed-in views.
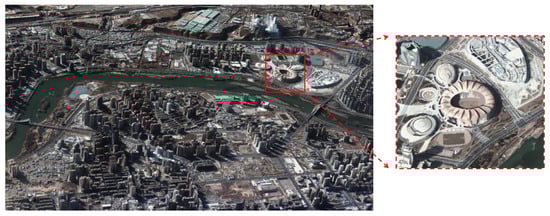
Figure 18.
Three-dimensional scene reconstruction results. Red dashed boxes highlight zoomed-in building details.
Representative timings for the near-real-time 3D scene reconstruction workflow are reported in Table 14.
Table 14.
Time spent at each stage of Case 3.
(4) Observation: VideoARD reduces the pre-modeling search effort significantly. In conventional practice, large volumes of frames must be manually filtered or exhaustively considered for matching. With VideoCube, the retrieval of geometrically useful frames is an indexed operation, which reduces human effort and I/O overhead. The dominant cost remains the photogrammetric processing, which is inherently compute intensive.
4.2.4. Case-Level Summary and Practical Remarks
Across the three cases, a consistent pattern is observed. Scene and object materialization introduce an upfront cost that is justified when queries are frequent, when multi-user access is expected, or when downstream analytics reuse the same semantic entities for different tasks.
As shown in Figure 19, stacked bar charts showing cube creation, data querying, event creation, and alert pushing durations for the vessel speed monitoring, wildfire detection and monitoring, and near-real-time 3D reconstruction cases.
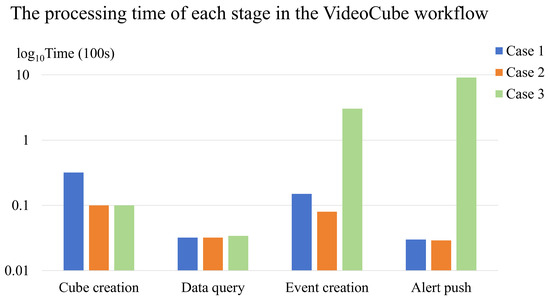
Figure 19.
Comparative timeline for the three application workflows of each stage. The vertical axis represents the processing time in units of 100 seconds, expressed on a base-10 logarithmic scale, while the horizontal axis denotes the workflow stages.
4.2.5. Accuracy Consistency Evaluation
Our objective prioritizes efficiency while maintaining task accuracy. We therefore adopt a non-inferiority protocol with an absolute margin against strong baselines using the same algorithm. A small, stratified subset in each case is manually annotated to isolate pipeline effects from algorithm changes. The tested tasks were conducted under the same experimental conditions as described in Section 4.1.
To evaluate the accuracy of the proposed method, we use the following metrics:
IDSW: An IDSW occurs when a tracker wrongfully swaps object identities or when a track was lost and reinitialised with a different identity. Formally, an IDSW is a True Positive (TP) which has a predicted ID (prID) that is different from the prID of the previous TP, which has the same ground truth ID (gtID). IDSWs only measure association errors compared to the single previous TP, and do not count errors where the same prID swaps to a different gtID (ID Transfer).
MOTA: Matching is performed at a detection level. Bijective (one-to-one) mapping is constructed between predict detections (prDets) and ground truth detections (gtDets) in each frame. Any prDets and gtDets that are matched (correct predictions) become TPs. Any remaining prDets that are not matched (extra predictions) become False Positives (FPs). Any gtDets that are not matched (missing predictions) become False Negatives (FNs). prDets and gtDets can only be matched if they are adequately spatially similar. MOTA measures three types of tracking errors: the detection errors of FNs and FPs, as well as the association error of IDSW. The final MOTA score is calculated by summing up the total number of these errors, dividing by this result by the number of gtDets, and subtracting from one.
IDF1: Unlike MOTA, which matches at a detection level, IDF1 calculates a bijective (one-to-one) mapping between the sets of ground truth trajectories (gtTrajs) and predicted trajectories (prTrajs). It defines new types of detection matches. Identity True Positives (IDTPs) are matches on the overlapping part of trajectories that are matched together. Identity False Negatives (IDFNs) and Identity False Positives (IDFPs) are the remaining gtDets and prDets, respectively, from both non-overlapping sections of matched trajectories, and from the remaining trajectories that are not matched.
Precision/Recall: We use :
Z-RMSE: After alignment and correspondence, measure only the height error:
where N is the number of matched points; i indexes a matched pair; and are the estimated and reference heights; and is their height residual.
H-RMSE: Measure only the planar (X–Y) error:
where and are the estimated and reference planar coordinates; are the planar residuals; and N and i are as above.
Table 15 summarizes the accuracy comparison. The detailed experimental designs for Group A (VideoARD) and Group B (baseline) are presented in Table 11. Within the non-inferiority margin () for percentage metrics, Group A maintains accuracy and shows small positive deltas across object tracking and wildfire tasks. For 3D reconstruction, Group A achieves slightly improved vertical error (Z-RMSE: m) and horizontal error (H-RMSE: m), indicating enhanced planimetric consistency. Combined with substantially lower query latency, steadier data throughput, and reduced resource utilization (Section 4.1.3), these results confirm that the proposed data model and pipeline deliver significant efficiency gains without degrading, and in some cases improving, analytical quality.
Table 15.
Accuracy comparison between the baseline pipeline and VideoARD.
5. Discussion
This section synthesizes the experimental findings and identifies avenues for methodological refinement and future research. The discussion addresses limitations discovered in the experiments, the generalizability of the VideoARD approach, and targeted directions where advances are most likely to increase practical utility.
Scalability and incremental update mechanisms: The experiments show that the initial cost of scene and semantic materialization is the primary engineering burden. To serve continuously evolving data streams, a robust incremental update mechanism is necessary, one that can update voxel-level aggregates and semantic indices without full cube reconstruction. Research efforts should focus on fine-grained update policies, change-detection-driven refresh schedules, and bounded staleness models that allow controlled freshness trade-offs.
Edge-assisted preprocessing and bandwidth management: The majority of per-scene computational cost arises from video stabilization, geometric rectification, and object detection. Pushing parts of the preprocessing pipeline toward edge nodes or sensor-side processors reduces transport volume and central computational load. Future work should quantify how edge-assisted processing affects overall accuracy, latency, and cost when integrated with VideoCube. Additionally, adaptive compression schemes guided by semantic importance can substantially reduce bandwidth consumption while preserving analysis fidelity.
Adaptive materialization policies: The decision to materialize a scene or an object should be informed by predicted query likelihood, task criticality, and storage constraints. Developing a predictive cost model and an associated policy engine will improve resource utilization. Such a model requires historical query logs, semantic popularity profiles, and cost estimates for recomputation versus storage. Machine-learned policies that incorporate these inputs can outperform static heuristics.
Cross-sensor fusion and provenance: The value of VideoARD increases when multiple sensors with complementary characteristics are integrated. Fusion across satellite video, UAV video, and ground cameras improves detection robustness and reduces occlusion induced uncertainty. Key scientific challenges include time alignment of heterogeneous streams, resolution harmonization, and provenance tracking that preserves lineage for every semantic entity. Transparent provenance representation is essential for downstream scientific interpretation and for auditability in operational contexts.
Semantic enrichment and uncertainty quantification: Event detection often relies on thresholding or deterministic rules, which may lack robustness in ambiguous conditions. Augmenting event entities with uncertainty measures and supporting the probabilistic fusion of evidence will make VideoARD outputs more useful for decision making. Research into calibrated confidence estimates for detectors and trackers, and the propagation of such uncertainty through aggregate queries, is an important direction.
User-centric interfaces and interactive workflows: The experiments show that VideoCube accelerates data preparation and enables interactive analysis. To maximize adoption, it is necessary to develop user interfaces that expose semantic entity versioning, lineage, and quality indicators. Interactive workflows that allow analysts to request additional refinement on demand, for example raising a minimum configuration object to best configuration upon request, will increase operational flexibility.
6. Conclusions
This study introduces VideoARD, a multi-level analysis-ready data model for remote sensing video, and VideoCube, a spatiotemporal organization and query infrastructure that operationalizes the model. The central idea is to transform high-volume video streams into semantically rich entities at scene, object, and event levels and to apply those entities in a multidimensional structure optimized for Earth observation analytics. The experimental evaluation demonstrates that this approach delivers substantial reductions in query latency and substantial improvements in concurrent throughput when compared to a baseline that performs repeated frame-level processing.
From an engineering perspective, the principal contribution is a practical architecture that balances preprocessing cost against downstream responsiveness. The experimental cases show that the initial materialization cost becomes economical as soon as queries are repeated, as soon as multiple users share the same dataset, or as soon as multiple analytics reuse the created semantic entities. From a scientific perspective, the contribution is an explicit formalization of multi-level readiness, which clarifies what metadata and semantic attributes are necessary for reliable analysis at each layer.
Limitations remain. The upfront cost of materialization and the storage overhead of persisting semantic entities require careful operational planning. Additional research is required to automate incremental updates and to integrate edge-level preprocessing without loss of provenance. Uncertainty quantification and cross-sensor fusion are promising directions that will broaden the impact of VideoARD for complex monitoring and response tasks.
In closing, VideoARD and VideoCube provide a feasible path toward practical, scalable, and reproducible remote sensing video analytics. The architecture is sufficiently modular to incorporate new detection algorithms, to adopt alternative storage back ends, and to integrate automated policy engines for materialization. Future work that refines incremental update logic, extends cross-sensor fusion capabilities, and formalizes uncertainty propagation will increase both the scientific value and the operational readiness of video-based Earth observation systems.
Author Contributions
Conceptualization, Y.W. and Z.L.; methodology, Z.L. and Z.X.; software, Y.L. and Y.S.; validation, Y.W., C.Z., X.J. and Z.L.; formal analysis, Z.L.; investigation, Z.X.; resources, Y.W. and Z.L. and Z.X.; data curation, Z.L.; writing—original draft preparation, Y.W. and Z.L.; writing—review and editing, C.Z. and Z.L.; visualization, Y.W. and Z.L.; supervision, C.Z. and Z.L.; project administration, Z.L.; funding acquisition, Y.W. All authors have read and agreed to the published version of the manuscript.
Funding
This research received no external funding.
Informed Consent Statement
Informed consent was obtained from all subjects involved in the study.
Data Availability Statement
Since some research is still in progress, only some of the releasable data resources are currently available at https://github.com/lizilong1993/EO_Videos (accessed on 27 August 2025).
Acknowledgments
The authors gratefully acknowledge Chang Guang Satellite Technology Co., Ltd. for providing the Jilin-1 datasets. They also thank Huanhuan Chen from Hubei University for assistance with manuscript polishing and Peng Yue from Wuhan University for providing data resources.
Conflicts of Interest
The authors declare no conflicts of interest.
Appendix A. Moving Features Instances of the Object-Level VideoARD
Table A1.
Example of single-object remote sensing video.
Table A1.
Example of single-object remote sensing video.
| Object | Timestamp | Relative Coordinate X (Ratio) | Relative Coordinate Y (Ratio) |
|---|---|---|---|
| Ship2 | 0 | 0.584115 | 0.460185 |
| 1 | 0.584115 | 0.460648 | |
| 2 | 0.584375 | 0.461111 | |
| 3 | 0.584896 | 0.462037 | |
| 4 | 0.585677 | 0.462963 | |
| 5 | 0.585938 | 0.463426 | |
| 6 | 0.586458 | 0.463889 | |
| 7 | 0.586719 | 0.464352 | |
| 8 | 0.586979 | 0.464815 | |
| 9 | 0.587500 | 0.465278 | |
| 10 | 0.587760 | 0.466204 | |
| 11 | 0.588021 | 0.466204 | |
| 12 | 0.588802 | 0.466667 | |
| 13 | 0.589323 | 0.467593 | |
| 14 | 0.589583 | 0.468981 | |
| 15 | 0.590104 | 0.469907 | |
| 16 | 0.590365 | 0.470370 | |
| 17 | 0.590885 | 0.470833 | |
| 18 | 0.591406 | 0.471296 | |
| 19 | 0.591667 | 0.472222 | |
| 20 | 0.592188 | 0.472685 | |
| 21 | 0.592448 | 0.472685 | |
| 22 | 0.592969 | 0.473148 | |
| 23 | 0.593490 | 0.473611 | |
| 24 | 0.593750 | 0.474074 | |
| 25 | 0.594271 | 0.474074 | |
| 26 | 0.595052 | 0.475000 | |
| 27 | 0.595573 | 0.475000 | |
| 28 | 0.596354 | 0.475463 | |
| 29 | 0.596875 | 0.475926 | |
| 30 | 0.597656 | 0.476852 |
Notes: This video shows Hong Kong’s Victoria Harbour, taken by the Jilin-1 satellite on 16 November 2017. Ship2 is the ship numbered 2 in the video. Time refers to the relative moment when the ship appears in the video. The relative coordinates (x and y) refer to the ratio of the pixel at the center of the ship to the pixel in the upper left corner of the video in the entire image.
Table A2.
Example of multi-object remote sensing video.
Table A2.
Example of multi-object remote sensing video.
| Objects | Relative Coordinate X | Relative Coordinate Y | Relative Coordinate X, Y (Ratio) |
|---|---|---|---|
| ship_1 | 1032 | 2027 | 0.251953,0.938425 |
| ship_2 | 238 | 1773 | 0.058105,0.820833 |
| ship_3 | 825 | 1720 | 0.201416,0.796296 |
| ship_3 | 513 | 1534 | 0.125244,0.710185 |
| ship_4 | 1851 | 1598 | 0.451904,0.739814 |
| ship_4 | 2342 | 1912 | 0.571777,0.885185 |
| ship_5 | 910 | 1007 | 0.222167,0.466203 |
| ship_5 | 1470 | 1365 | 0.358886,0.631944 |
| ship_6 | 2872 | 1416 | 0.701171,0.655555 |
| ship_6 | 3145 | 1595 | 0.767822,0.738425 |
| ship_7 | 2132 | 1112 | 0.520507,0.514814 |
| ship_7 | 2149 | 1125 | 0.524660,0.520830 |
| ship_7 | 2162 | 1127 | 0.527832,0.521759 |
| ship_7 | 2379 | 1272 | 0.580810,0.588890 |
| ship_7 | 2527 | 1365 | 0.616943,0.631944 |
| ship_8 | 4087 | 1965 | 0.997802,0.909722 |
| ship_9 | 3962 | 1855 | 0.967285,0.858796 |
| ship_10 | 3817 | 1772 | 0.931884,0.820370 |
| ship_11 | 3685 | 1687 | 0.899658,0.781018 |
| ship_12 | 3570 | 1570 | 0.871582,0.726851 |
| ship_13 | 3685 | 957 | 0.899658,0.443055 |
| ship_14 | 3217 | 1410 | 0.785400,0.652777 |
| ship_15 | 2010 | 1290 | 0.490722,0.597222 |
| ship_16 | 2815 | 1122 | 0.687255,0.519444 |
| ship_17 | 2142 | 747 | 0.522949,0.345833 |
| ship_18 | 1685 | 470 | 0.411376,0.217592 |
| ship_19 | 1510 | 350 | 0.368652,0.162037 |
| ship_20 | 1415 | 285 | 0.345458,0.131944 |
| ship_21 | 1315 | 217 | 0.321044,0.100462 |
| ship_22 | 1095 | 110 | 0.267333,0.050925 |
| ship_23 | 1010 | 50 | 0.246582,0.023148 |
| ship_24 | 2866 | 1042 | 0.699707,0.482407 |
| ship_25 | 2895 | 1048 | 0.706787,0.485185 |
| ship_26 | 2905 | 982 | 0.709228,0.454629 |
| ship_27 | 2937 | 927 | 0.717041,0.429166 |
| ship_28 | 2968 | 871 | 0.724609,0.403240 |
Notes: This video shows Dubai International Airport, captured by the Jilin-1 satellite on 21 February 2023. The
object is the aircraft number shown in the video. The relative coordinates x and y refer to the coordinates of the
pixel at the center of the aircraft relative to the pixel in the upper left corner of the video. The relative coordinates
x and y (ratio) refer to the percentage of the relative coordinates x and y in the entire image. Rows with the same
object number in the image indicate that the object has multiple coordinate locations, meaning it is in motion.
Rows with only one object number indicate that the object is stationary.
Appendix B. Database Design of VideoCube
As shown below, Appendix B details the specific database table design under different dimensions of VideoCube.
(1) Video fact
Table A3.
Video fact table of VideoCube.
Table A3.
Video fact table of VideoCube.
| Field Name | Type | Foreign/Primary Key | Description |
|---|---|---|---|
| id | int4 | PK | Fact id of the video fact |
| product_key | int4 | FK | Product key of the video fact |
| space_key | int4 | FK | Spatial key of the video fact |
| time_key | int4 | FK | Temporal key of the video fact |
| semantic_key | int4 | FK | Semantic key of the video fact |
| tile_id | int4 | FK | Tile id of the video fact |
Notes: The VideoCube video frame fact table id is the primary key to record the fact number, which is linked to the product dimension table through the foreign key product_key, to the spatial dimension table through space_key, to the time dimension table through time_key, to the semantic dimension table through semantic_key, and to the tile number through tile_id.
(2) Product dimension
Table A4.
Product dimension table of VideoCube.
Table A4.
Product dimension table of VideoCube.
| Field Name | Type | Foreign/Primary Key | Description |
|---|---|---|---|
| product_key | int4 | PK | Product key of the product |
| product_name | varchar | None | Product name of the product |
| product_type | varchar | None | Product tpye of the product |
| sensor_key | int4 | FK | Sensor key of the video fact |
| video_key | int4 | FK | Video key of the video fact |
| level_key | int1 | FK | Level key of the video fact |
Notes: In the VideoCube product dimension table, product_key is the product key; product_name is the product name; product_type is the product type; sensor_key is the sensor number, which is associated with the sensor table; video_key is the video key, which is associated with the video file table; level_key is the level key, which is associated with the product level table.
Table A5.
Product level table of VideoCube.
Table A5.
Product level table of VideoCube.
| Field Name | Type | Foreign/Primary Key | Description |
|---|---|---|---|
| level_key | int1 | PK | Level key of the product |
| level_type | enum | None | Level type of the product, include L0, L1, L2 and L3 |
| level_name | varchar | None | Level name, include original-level, scene-level, object-level and event-level |
Notes: In the VideoCube product level table, level_key is the level key, level_type is the level type, which includes L0 (scene level), L1 (object level), and L2 (event level), and level_name is the level name, which includes scene level, object level, and event level.
Table A6.
Video file table of VideoCube.
Table A6.
Video file table of VideoCube.
| Field Name | Type | Foreign/Primary Key | Description |
|---|---|---|---|
| video_key | int4 | PK | Video key of the video fact |
| URL | varchar | None | Video file path |
| tile_ids | varchar | FK | The ID set of all video tiles associated with the video file |
| video_resolution | varchar | None | Video resolution |
| video_fps | int2 | None | Frames per second of video file |
Notes: In the VideoCube video file table, video_key is the video key, URL records the video file address, tile_ids is the ID set of all video tiles associated with the video file, video_resolution records the video resolution, and video_fps records the video frame rate.
Table A7.
Sensor table of VideoCube.
Table A7.
Sensor table of VideoCube.
| Field Name | Type | Foreign/Primary Key | Description |
|---|---|---|---|
| sensor_key | int4 | PK | Sensor key of the video fact |
| sensor_name | varchar | None | Sensor name |
| platform | varchar | None | Name of the platform on which the sensor is mounted |
Notes: In the VideoCube sensor table, sensor_key is the sensor key, URL records the video file address, and tile_ids is the ID set of all video tiles associated with the video file.
(3) Temporal dimension
Table A8.
Temporal dimension table of VideoCube.
Table A8.
Temporal dimension table of VideoCube.
| Field Name | Type | Foreign/Primary Key | Description |
|---|---|---|---|
| time_key | int4 | PK | Time key of the video fact |
| time_standard | varchar | None | Time reference framework |
| time | timestamp8 | None | Time with time zone, e.g., 2003-04-12T04:05:06Z |
Notes: In the VideoCube time dimension table, time_key is the time key, time_standard is the time standard, and the time field stores the timestamp with the time zone.
(4) Spatial dimension
Table A9.
Spatial dimension table of VideoCube.
Table A9.
Spatial dimension table of VideoCube.
| Field Name | Type | Foreign/Primary Key | Description |
|---|---|---|---|
| space_key | int4 | PK | Spatial key of the video fact |
| grid_key | int4 | FK | Spatial grid key |
| grid_ids | varchar | None | Grid id sets of the video fact |
| city_key | int4 | FK | City key of the video fact |
Notes: In the VideoCube spatial dimension table, space_key is the space key, grid_key is the grid key, grid_ids records the ID set of the grid code, and city_key is the city key.
Table A10.
Grid reference table of VideoCube.
Table A10.
Grid reference table of VideoCube.
| Field Name | Type | Foreign/Primary Key | Description |
|---|---|---|---|
| grid_key | int4 | PK | Grid key of the video fact |
| grid_type | varchar | None | Type of the grid reference |
| grid_size | int4 | None | Size of the grid |
| crs | varchar | None | Coordinate reference system of the grid |
Notes: The grid_key field of the VideoCube grid reference table is the grid key, the grid_type field stores the grid encoding type, the grid_size field records the grid size, and the crs field records the reference coordinate system information.
Table A11.
Region table of VideoCube.
Table A11.
Region table of VideoCube.
| Field Name | Type | Foreign/Primary Key | Description |
|---|---|---|---|
| city_key | int4 | PK | City key of the video fact |
| city_name | varchar | None | City name |
| province_name | varchar | None | Province name |
Notes: The VideoCube location table uses the city_key field to record the city key, the city_name field to record the city name, and the province_name field to record the province name.
(5) Semantic dimension
Table A12.
Semantic dimension table of VideoCube.
Table A12.
Semantic dimension table of VideoCube.
| Field Name | Type | Foreign/Primary Key | Description |
|---|---|---|---|
| semantic_key | int4 | PK | Semantic key of the video fact |
| level_key | int4 | FK | Level key of the video fact |
Notes: The VideoCube level table is a redundant decoupled table, where semantic_key is the semantic key and level_key is the level key, and is associated with the product level table.
Table A13.
Object table of VideoCube.
Table A13.
Object table of VideoCube.
| Field Name | Type | Foreign/Primary Key | Description |
|---|---|---|---|
| object_key | int4 | PK | Object key of the video fact |
| semantic_key | int4 | FK | Semantic key of the video fact |
| object_type | int4 | None | Type of the object |
| object_name | varchar | None | Class of the object |
| trajectory_key | int4 | FK | Trajectory key of the object |
Notes: The VideoCube target table records the target information in the video. object_key is the target key, semantic_key is the semantic key, which is associated with the semantic dimension table, object_type is the target type, object_name is the target name, and trajectory_key is the trajectory key, which is associated with the trajectory table.
Table A14.
Trajectory table of VideoCube.
Table A14.
Trajectory table of VideoCube.
| Field Name | Type | Foreign/Primary Key | Description |
|---|---|---|---|
| trajectory_key | int4 | PK | Tracjectory key of the object |
| trajectory | varchar | None | Trajectory, a sets of objects’ coordinates |
Notes: The VideoCube trajectory table records the trajectory information of the target in the video. trajectory_key is the trajectory key, and trajectory is a target trajectory set consisting of a sequence of coordinate points.
Table A15.
Scene table of VideoCube.
Table A15.
Scene table of VideoCube.
| Field Name | Type | Foreign/Primary Key | Description |
|---|---|---|---|
| scene_key | int4 | PK | Scene key of the video fact |
| semantic_key | int4 | FK | Semantic key of the video fact |
| scene_type | varchar | None | Type of the scene |
| limit | varchar | None | Limits of the scene |
Notes: The VideoCube scene table records scene information in the video. background_key is the scene key, semantic_key is the semantic key, and is associated with the semantic dimension table. background_type is the scene type, and limit is the scene restriction behavior.
Table A16.
Event table of VideoCube.
Table A16.
Event table of VideoCube.
| Field Name | Type | Foreign/Primary Key | Description |
|---|---|---|---|
| event_key | int4 | PK | Event key of the video fact |
| semantic_key | int4 | FK | Semantic key of the video fact |
| event_type | varchar | None | Type of the event |
| event_name | varchar | None | Event name |
| object_keys | int8 | None | The target collection associated with the event |
| moving_features_url | varchar | None | Moving Features files path |
| period | int4 | None | The time range (s) |
| extent | varchar | None | The spatial range, represented by the upper left and lower right corner coordinates. |
Notes: The VideoCube event table records event information in the video, where event_key is the event key; semantic_key is the semantic key; event_type is the event type; event_name is the event name; object_keys is the target set associated with the event; moving_features_url is the file path of the Moving Features associated with the video; period is the time range of the event; and extent is the spatial range of the event.
(6) Quality dimension
Table A17.
Quality table of VideoCube.
Table A17.
Quality table of VideoCube.
| Field Name | Type | Foreign/Primary Key | Description |
|---|---|---|---|
| product_key | int4 | FK | Product key of the video |
| sensor_key | int4 | FK | Sensor key of the product |
| quality | varchar | None | Quality info of the video fact |
Notes: The VARD quality table records the quality information in the video, where product_key is the product key, which is associated with the product table; sensor_key is the sensor key, which is associated with the sensor table; and quality records the quality information.
Table A18.
Tile table of VideoCube.
Table A18.
Tile table of VideoCube.
| Rowkey | Timestamp | RasterTile | |
|---|---|---|---|
| tile_id | long | tile | Metadata |
| Byte | Json | ||
Notes: Raster tiles are stored in a columnar database. The table’s rowkey is tile_id, which is associated with the video frame fact table. The timestamp is of type long, recording the time of entry. RasterTile consists of a tile field (storing binary tiles) and a metadata field (storing json files).
(7) Moving Features table
Table A19.
Moving Features table of VideoCube.
Table A19.
Moving Features table of VideoCube.
| Path | File | Description |
|---|---|---|
| background_path | Json | Scene-level Moving Features file path |
| object_path | Json | Object-level Moving Features file path |
| event_path | Json | Event-level Moving Features file path |
Notes: The VideoCube Moving Features table is stored in the distributed object storage system and records the paths of Moving Features files. Background_path records the scene-level Moving Features file path, object_path records the target-level Moving Features file path, and event_path records the event-level Moving Features file path.
References
- Picoli, M.C.A.; Camara, G.; Sanches, I.; Simões, R.; Carvalho, A.; Maciel, A.; Coutinho, A.; Esquerdo, J.; Antunes, J.; Begotti, R.A.; et al. Big earth observation time series analysis for monitoring Brazilian agriculture. ISPRS J. Photogramm. Remote Sens. 2018, 145, 328–339. [Google Scholar] [CrossRef]
- Li, D.; Zhang, L.; Xia, G. Automatic analysis and mining of remote sensing big data. Acta Geod. Cartogr. Sin. 2014, 43, 1211–1216. [Google Scholar]
- Elliott, J. Earth observation for the assessment of earthquake hazard, risk and disaster management. Surv. Geophys. 2020, 41, 1323–1354. [Google Scholar] [CrossRef]
- McCabe, M.F.; Rodell, M.; Alsdorf, D.E.; Miralles, D.G.; Uijlenhoet, R.; Wagner, W.; Lucieer, A.; Houborg, R.; Verhoest, N.E.; Franz, T.E.; et al. The future of Earth observation in hydrology. Hydrol. Earth Syst. Sci. 2017, 21, 3879–3914. [Google Scholar] [CrossRef]
- Zhao, Z. Jilin-1 satellite constellation. Satell. Appl. 2015, 11, F0003. [Google Scholar]
- Guo, Z. Satellite Video Processing and Applications. J. Appl. Sci. 2016, 34, 361–370. [Google Scholar]
- Pelapur, R.; Candemir, S.; Bunyak, F.; Poostchi, M.; Seetharaman, G.; Palaniappan, K. Persistent target tracking using likelihood fusion in wide-area and full motion video sequences. In Proceedings of the 2012 15th International Conference on Information Fusion, Singapore, 9–12 July 2012; pp. 2420–2427. [Google Scholar]
- Davey, S.J.; Gaetjens, H.X. Tracking in Full Motion Video. In Track-Before-Detect Using Expectation Maximisation: The Histogram Probabilistic Multi-Hypothesis Tracker: Theory and Applications; Springer: Berlin/Heidelberg, Germany, 2018; pp. 287–318. [Google Scholar]
- Wu, R.; Chen, Y.; Blasch, E.; Liu, B.; Chen, G.; Shen, D. A container-based elastic cloud architecture for real-time full-motion video (fmv) target tracking. In Proceedings of the 2014 IEEE Applied Imagery Pattern Recognition Workshop (AIPR), Washington, DC, USA, 14–16 October 2014; pp. 1–8. [Google Scholar]
- Kant, S. Activity-based exploitation of full motion video (fmv). In Full Motion Video (FMV) Workflows and Technologies for Intelligence, Surveillance, and Reconnaissance (ISR) and Situational Awareness; SPIE: Baltimore, MD, USA, 25 May 2012; pp. 78–88. [Google Scholar]
- Asraf Mohamad Sharom, M.A.; Ahmad Fauzi, M.F.; Sipit, A.R.; Mat Azmi, M.Z. Development of video data post-processing technique: Generating consumer drone full motion video (FMV) data for intelligence, surveillance and reconnaissance (ISR). Def. S&T Tech. Bull. 2021, 14, 70. [Google Scholar]
- Faraj, F. Object Detection and Pattern of Life Analysis from Remotely Piloted Aircraft System Acquired Full Motion Video. Master’s Thesis, Queen’s University, Kingston, ON, Canada, 2021. [Google Scholar]
- Macior, R.E.; Bright, G.A.; Walter, S.M. Adapting full motion video data for the real world. Electro-Opt. Infrared Syst. Technol. Appl. V 2008, 7113, 361–370. [Google Scholar]
- Gong, J.; Li, G. China’s Earth Observation Data Resources Development Report (2019); National Earth Observation Science Data Center: Beijing, China, 2019. [Google Scholar]
- Lewis, A.; Lacey, J.; Mecklenburg, S.; Ross, J.; Siqueira, A.; Killough, B.; Szantoi, Z.; Tadono, T.; Rosenavist, A.; Goryl, P.; et al. CEOS Analysis Ready Data for Land (CARD4L) Overview. In Proceedings of the IGARSS 2018—2018 IEEE International Geoscience and Remote Sensing Symposium, Valencia, Spain, 22–27 July 2018; pp. 7407–7410. [Google Scholar]
- Dwyer, J.L.; Roy, D.P.; Sauer, B.; Jenkerson, C.B.; Zhang, H.K.; Lymburner, L. Analysis ready data: Enabling analysis of the Landsat archive. Remote Sens. 2018, 10, 1363. [Google Scholar] [CrossRef]
- Zhu, Z. Science of Landsat analysis ready data. Remote Sens. 2019, 11, 2166. [Google Scholar] [CrossRef]
- Frantz, D. FORCE—Landsat+ Sentinel-2 analysis ready data and beyond. Remote Sens. 2019, 11, 1124. [Google Scholar] [CrossRef]
- Landsat Collection 2 U.S. Analysis Ready Data. Available online: https://www.usgs.gov/ (accessed on 27 August 2025).
- Pahlevan, N.; Schott, J.R.; Franz, B.A.; Zibordi, G.; Markham, B.; Bailey, S.; Schaaf, C.B.; Ondrusek, M.; Greb, S.; Strait, C.M. Landsat 8 remote sensing reflectance (Rrs) products: Evaluations, intercomparisons, and enhancements. Remote Sens. Environ. 2017, 190, 289–301. [Google Scholar] [CrossRef]
- Pahlevan, N.; Mangin, A.; Balasubramanian, S.V.; Smith, B.; Alikas, K.; Arai, K.; Barbosa, C.; Bélanger, S.; Binding, C.; Bresciani, M.; et al. ACIX-Aqua: A global assessment of atmospheric correction methods for Landsat-8 and Sentinel-2 over lakes, rivers, and coastal waters. Remote Sens. Environ. 2021, 258, 112366. [Google Scholar] [CrossRef]
- Rosenqvist, A.; Tadono, T.; Shimada, M.; Itoh, T. Jaxa Global Sar Mosaics–Assessing Compliance with Ceos Analysis Ready Data for Land (Card4l) Specifications. In Proceedings of the IGARSS 2019-2019 IEEE International Geoscience and Remote Sensing Symposium, Yokohama, Japan, 28 July–2 August 2019; pp. 5545–5548. [Google Scholar]
- Yuan, F.; Repse, M.; Leith, A.; Rosenqvist, A.; Milcinski, G.; Moghaddam, N.F.; Dhar, T.; Burton, C.; Hall, L.; Jorand, C.; et al. An operational analysis ready radar backscatter dataset for the African continent. Remote Sens. 2022, 14, 351. [Google Scholar] [CrossRef]
- Geographic Information—Schema for Moving Features. Available online: https://www.iso.org/standard/41445.html (accessed on 27 August 2025).
- Hayashi, H.; Asahara, A.; Kim, K.; Shibasaki, R.; Ishimaru, N. OGC Moving Features Access. Version 1.0. Available online: https://repository.oceanbestpractices.org/handle/11329/1009 (accessed on 27 August 2025).
- Bachmann, M.; Alonso, K.; Carmona, E.; Gerasch, B.; Habermeyer, M.; Holzwarth, S.; Krawczyk, H.; Langheinrich, M.; Marshall, D.; Pato, M.; et al. Analysis-ready data from hyperspectral sensors—The design of the enmap card4l-sr data product. Remote Sens. 2021, 13, 4536. [Google Scholar] [CrossRef]
- Lewis, A.; Oliver, S.; Lymburner, L.; Evans, B.; Wyborn, L.; Mueller, N.; Raevksi, G.; Hooke, J.; Woodcock, R.; Sixsmith, J.; et al. The Australian geoscience data cube—foundations and lessons learned. Remote Sens. Environ. 2017, 202, 276–292. [Google Scholar] [CrossRef]
- Earth Resources Observation and Science (EROS) Center. Landsat 8-9 Operational Land Imager/Thermal Infrared Sensor Level-2 Collection 2. Available online: https://www.usgs.gov/centers/eros/science/usgs-eros-archive-landsat-archives-landsat-8-9-olitirs-collection-2-level-2 (accessed on 27 November 2020).
- Ørka, H.O.; Gailis, J.; Vege, M.; Gobakken, T.; Hauglund, K. Analysis-ready satellite data mosaics from Landsat and Sentinel-2 imagery. MethodsX 2023, 10, 101995. [Google Scholar] [CrossRef]
- Chini, M.; Pelich, R.; Hostache, R.; Matgen, P.; López-Martinez, C. Towards a 20 m global building map from Sentinel-1 SAR data. Remote Sens. 2018, 10, 1833. [Google Scholar] [CrossRef]
- Khosravi, M.R.; Tavallali, P. Real-time statistical image and video processing for remote sensing and surveillance applications. J. Real-Time Image Process. 2021, 18, 1435–1439. [Google Scholar] [CrossRef]
- Schowengerdt, R.A. The title of the cited contribution. In Remote Sensing: Models and Methods for Image Processing; Elsevier: Amsterdam, The Netherlands, 2006. [Google Scholar]
- Sharma, V.; Gupta, M.; Kumar, A.; Mishra, D. Video processing using deep learning techniques: A systematic literature review. IEEE Access 2021, 9, 139489–139507. [Google Scholar] [CrossRef]
- Kastrinaki, V.; Zervakis, M.; Kalaitzakis, K. A survey of video processing techniques for traffic applications. Image Vis. Comput. 2003, 21, 359–381. [Google Scholar] [CrossRef]
- AWS Ground Station—Easily Control Satellites and Ingest Data. Available online: https://aws.amazon.com/cn/ground-station/ (accessed on 27 August 2025).
- Gorelick, N.; Hancher, M.; Dixon, M.; Ilyushchenko, S.; Thau, D.; Moore, R. Google Earth Engine: Planetary-scale geospatial analysis for everyone. Remote Sens. Environ. 2017, 202, 18–27. [Google Scholar] [CrossRef]
- Zhang, R.; Zhang, J.; Wang, W. Remote sensing imaging analysis and ubiquitous cloud-based mobile edge computing based intelligent forecast of forest tourism demand. Distrib. Parallel Databases 2023, 41, 95–116. [Google Scholar] [CrossRef]
- Jiang, Q.; Zheng, L.; Zhou, Y.; Liu, H.; Kong, Q.; Zhang, Y.; Chen, B. Efficient On-Orbit Remote Sensing Imagery Processing via Satellite Edge Computing Resource Scheduling Optimization. IEEE Trans. Geosci. Remote Sens. 2025, 63, 1000519. [Google Scholar] [CrossRef]
- Koubaa, A.; Ammar, A.; Abdelkader, M.; Alhabashi, Y.; Ghouti, L. AERO: AI-enabled remote sensing observation with onboard edge computing in UAVs. Remote Sens. 2023, 15, 1873. [Google Scholar] [CrossRef]
- Hu, W.; Li, W.; Zhou, X.; Kawai, A.; Fueda, K.; Qian, Q.; Wang, J. Spatio-temporal graph convolutional networks via view fusion for trajectory data analytics. IEEE Trans. Intell. Transp. Syst. 2022, 24, 4608–4620. [Google Scholar] [CrossRef]
- Zhang, X.; Reichard-Flynn, W.; Zhang, M.; Hirn, M.; Lin, Y. Spatiotemporal graph convolutional networks for earthquake source characterization. J. Geophys. Res. Solid Earth 2022, 127, e2022JB024401. [Google Scholar] [CrossRef]
- Cheng, G.; Xie, X.; Han, J.; Guo, L.; Xia, G. Remote sensing image scene classification meets deep learning: Challenges, methods, benchmarks, and opportunities. IEEE J. Sel. Top. Appl. Earth Obs. Remote Sens. 2020, 13, 3735–3756. [Google Scholar] [CrossRef]
- Phan, T.C.; Nguyen, T.T.; Hoang, T.D.; Nguyen, Q.V.H.; Jo, J. Multi-scale bushfire detection from multi-modal streams of remote sensing data. IEEE Access 2020, 8, 228496–228513. [Google Scholar] [CrossRef]
- Gu, Y.; Wang, Y.; Li, Y. A survey on deep learning-driven remote sensing image scene understanding: Scene classification, scene retrieval and scene-guided object detection. Appl. Sci. 2019, 9, 2110. [Google Scholar] [CrossRef]
- Cheng, G.; Han, J.; Lu, X. Remote sensing image scene classification: Benchmark and state of the art. Proc. IEEE 2017, 105, 1865–1883. [Google Scholar] [CrossRef]
- Guttman, A. R-trees: A dynamic index structure for spatial searching. In Proceedings of the 1984 ACM SIGMOD International Conference on Management of Data, Boston, MA, USA, 18–21 June 1984; pp. 47–57. [Google Scholar]
- Finkel, R.A.; Bentley, J.L. Quad trees a data structure for retrieval on composite keys. Acta Inform. 1974, 4, 1–9. [Google Scholar] [CrossRef]
- Li, S.; Sun, X.; Gu, Y.; Lv, Y.; Zhao, M.; Zhou, Z.; Guo, W.; Sun, Y.; Wang, H.; Yang, J. Recent advances in intelligent processing of satellite video: Challenges, methods, and applications. IEEE J. Sel. Top. Appl. Earth Obs. Remote Sens. 2023, 16, 6776–6798. [Google Scholar] [CrossRef]
- Byeong-Ho, K. A Review on Image and Video processing. Int. J. Multimed. Ubiquitous Eng. 2007, 2, 49–64. [Google Scholar]
- Li, S.; Cui, Y.; Liu, M.; He, H.; Ravan, S. Integrating global open geo-information for major disaster assessment: A case study of the Myanmar flood. ISPRS Int. J. Geo-Inf. 2017, 6, 201. [Google Scholar] [CrossRef]
- ISO 19144-2:2023; Geographic Information—Classification Systems—Part 2: Land Cover Meta Language (LCML). International Organization for Standardization: Geneva, Switzerland, 2023. Available online: https://www.iso.org/standard/81259.html (accessed on 27 August 2025).
- Lin, T.; Maire, M.; Belongie, S.; Hays, J.; Perona, P.; Ramanan, D.; Dollár, P.; Zitnick, C.L. Microsoft coco: Common objects in context. In Proceedings of the European Conference on Computer Vision, Zurich, Switzerland, 6–12 September 2014; pp. 740–755. [Google Scholar]
- Thomsen, E. OLAP Solutions: Building Multidimensional Information Systems; John Wiley & Sons: Hoboken, NJ, USA, 2002. [Google Scholar]
- Chaudhuri, S.; Dayal, U. An overview of data warehousing and OLAP technology. ACM Sigmod Rec. 1997, 26, 65–74. [Google Scholar] [CrossRef]
- Bachmann, P. Datacube standards and their contribution to analysis-ready data. In Proceedings of the IGARSS 2018-2018 IEEE International Geoscience and Remote Sensing Symposium, Valencia, Spain, 22–27 July 2018; pp. 2051–2053. [Google Scholar]
- Varghese, R.; Sambath, M. Yolov8: A novel object detection algorithm with enhanced performance and robustness. In Proceedings of the 2024 International Conference on Advances in Data Engineering and Intelligent Computing Systems (ADICS), Chennai, India, 18–19 April 2024; pp. 1–6. [Google Scholar]
- Wojke, N.; Bewley, A.; Paulus, D. Simple online and realtime tracking with a deep association metric. In Proceedings of the 2017 IEEE International Conference on Image Processing (ICIP), Beijing, China, 17–20 September 2017; pp. 3645–3649. [Google Scholar]
- Kirillov, A.; Mintun, E.; Ravi, N.; Mao, H.; Rolland, C.; Gustafson, L.; Xiao, T.; Whitehead, S.; Berg, A.C.; Lo, W.; et al. Segment anything. In Proceedings of the IEEE/CVF International Conference on Computer Vision, Paris, France, 2–3 October 2023; pp. 4015–4026. [Google Scholar]
- Wang, M.; Yu, D.; He, W.; Yue, P.; Liang, Z. Domain-incremental learning for fire detection in space-air-ground integrated observation network. Int. J. Appl. Earth Obs. Geoinf. 2023, 118, 103279. [Google Scholar] [CrossRef]
- Leotta, M.J.; Long, C.; Jacquet, B.; Zins, M.; Lipsa, D.; Shan, J.; Xu, B.; Li, Z.; Zhang, X.; Chang, S.; et al. Urban semantic 3D reconstruction from multiview satellite imagery. In Proceedings of the IEEE/CVF Conference on Computer Vision and Pattern Recognition Workshops, Long Beach, CA, USA, 16–17 June 2019. [Google Scholar]
Disclaimer/Publisher’s Note: The statements, opinions and data contained in all publications are solely those of the individual author(s) and contributor(s) and not of MDPI and/or the editor(s). MDPI and/or the editor(s) disclaim responsibility for any injury to people or property resulting from any ideas, methods, instructions or products referred to in the content. |
© 2025 by the authors. Licensee MDPI, Basel, Switzerland. This article is an open access article distributed under the terms and conditions of the Creative Commons Attribution (CC BY) license (https://creativecommons.org/licenses/by/4.0/).