Article

An Airborne G-Band Water Vapor Radiometer and Dropsonde Validation of Reanalysis and NWP Precipitable Water Vapor over the Korean Peninsula

Observation Research Department, National Institute of Meteorological Sciences, 33, Seohobuk-ro, Seogwipo 63568, Jeju-do, Republic of Korea
*
Author to whom correspondence should be addressed.
Remote Sens. 2025, 17(23), 3788; https://doi.org/10.3390/rs17233788
Submission received: 11 October 2025 / Revised: 10 November 2025 / Accepted: 18 November 2025 / Published: 21 November 2025
(This article belongs to the Section Atmospheric Remote Sensing)

Highlights

What are the main findings?
  • Global reanalysis ERA5 most accurately represents both upper-air and total column Precipitable Water Vapor (PWV) over the Korean Peninsula.
  • Local high-resolution weather models exhibit a significant dry bias, underestimating PWV, especially under moist and cloudy conditions.
What is the implications of the main findings?
  • For water vapor analysis in Korea, ERA5 serves as a more reliable benchmark than higher-resolution local models, despite their finer grid spacing.
  • The systematic errors in local models highlight the need to improve their humidity data assimilation and cloud microphysics schemes.

Abstract

Accurate representation of Precipitable Water Vapor (PWV) in numerical models is critical over the meteorologically complex Korean Peninsula, yet validation remains a challenge. This study presents a unique airborne validation of hourly PWV from two local Numerical Weather Prediction (NWP) models—the Local Data Assimilation and Prediction System (LDAPS) and the Korea Local Analysis and Prediction System (KLAPS)—and two global reanalysis datasets—the ECMWF Reanalysis v5 (ERA5) and the Modern-Era Retrospective Analysis for Research and Applications, Version 2 (MERRA-2). We utilize a G-band Water Vapor Radiometer (GVR) and dropsondes, applying a rigorous multi-stage quality control (QC) procedure to ensure data reliability. Two strategies were used: comparing GVR-measured upper-column PWV against model layers and comparing a total-column GVR–dropsonde composite against the models’ total PWV. Our key finding reveals that the ERA5 reanalysis consistently provides the most accurate representation of both upper-air and total column PWV. In contrast, the high-resolution local models exhibit significant dry biases, particularly in moist and cloudy conditions. These results underscore the value of airborne validation and suggest that for water vapor analysis over Korea, ERA5 serves as a more reliable benchmark than local models, highlighting the need to improve humidity assimilation and microphysics in regional systems.

1. Introduction

Observations of precipitable water vapor (PWV) are crucial for predicting and preparing for severe summer weather phenomena in the Korean Peninsula. The expansion and contraction of the North Pacific High determines the location of the monsoon front and affects the intensity and duration of heatwaves [1,2,3]. Weather changes occur most dynamically at the edge of a high-pressure system; as typhoons tend to move along this edge, accurately identifying the extent of their influence is critical for improving typhoon forecast accuracy. PWV, defined as the total atmospheric water vapor in a vertical column of a unit cross-section, is a key parameter for quantifying atmospheric moisture content and is crucial for climate change studies and numerical weather predictions. The greater the amount of water vapor in the atmosphere, the higher the PWV and the greater the potential for rainfall. Heavy rainfall events are directly related to a high PWV. Accurately observed PWV data, when used as the initial input for Numerical Weather Prediction (NWP) models, can contribute to improved forecast accuracy. However, PWV exhibits significant spatial and temporal variability, making precise measurement and estimation challenging. This is particularly true for the Korean Peninsula, a region that poses significant challenges for numerical models due to its complex meteorology [4]. Characterized by complex mountainous terrain, its position as a peninsula surrounded by sea on three sides, and distinct seasonal climate patterns including the East Asian monsoon, this unique environment makes it an ideal testbed for evaluating model performance. While our validation methodology using airborne platforms is generalizable, our findings provide critical, region-specific insights into model performance where ground-based validation data is sparse, particularly over the surrounding oceans.
While several established techniques observe PWV, they face significant limitations in addressing the specific meteorological challenges of the Korean Peninsula. Ground-based platforms, such as radiosondes (RS) and the Global Navigation Satellite System (GNSS) network, provide highly accurate point measurements, but they are predominantly land-locked. This creates a critical observational gap over the surrounding seas (the West Sea and East Sea), which are the primary source regions for the moisture that fuels severe weather events like the East Asian monsoon and typhoons. Consequently, models used to forecast these high-impact weather events are least constrained by observations in the very areas where their accuracy is most critical [5].
Satellite remote sensing, while offering broad oceanic coverage, also has well-known limitations. Satellite retrievals are often unreliable in cloudy conditions—precisely during the severe weather events this study is concerned with. Furthermore, they can suffer from biases at the complex land–sea interface surrounding the peninsula and typically lack the high vertical resolution provided by in situ soundings. Therefore, validating model performance against an independent, high-resolution, all-weather dataset in these data-sparse oceanic regions is essential [6].
Aircraft-based observations offer a unique opportunity to obtain high-resolution atmospheric data in regions where ground-based networks are sparse, and to validate satellite retrievals over various terrains. By flying directly through or above weather phenomena, airborne platforms can bridge the observational gap between ground-based point measurements and the broader view of satellites, providing crucial data for both the upper-tropospheric layers and the total atmospheric column. The integration of multiple remote sensing and in situ instruments on a single aircraft platform, including a G-band (183 GHz) Water Vapor Radiometer (GVR), has been shown to provide more complete and less ambiguous descriptions of atmospheric properties [7,8,9].
In 2017, the National Institute of Meteorological Sciences (NIMS) in Korea introduced the NIMS Atmospheric Research Aircraft (NARA) King Air 350HW, equipped with a suite of meteorological instruments, along with a GVR. Since early 2018, this national facility has conducted annual operational observation flights to reduce atmospheric observation uncertainties around the Korean Peninsula [10]. The GVR provides PWV estimates by measuring the upward-looking brightness temperatures (Tb) from the aircraft’s flight altitude. The development of compact and reliable G-band radiometers has rendered airborne applications increasingly feasible [7]. This research aircraft has already demonstrated its utility in collecting high-quality atmospheric data over the Korean Peninsula using dropsondes [11] and by providing more complete and less ambiguous descriptions of cloud properties [8]. The GVR is a proven instrument for atmospheric research and has been deployed in major field campaigns such as the In-Cloud Icing and Large-Drop Experiment (ICICLE) to measure liquid water path (LWP) and PWV under aircraft icing conditions [12]. Furthermore, airborne GVRs have been effectively used with neural network algorithms to retrieve supercooled liquid water paths (SLWP) [9] and have served as reliable validation sources for LWP derived from other remote sensing techniques, such as airborne radar [13]. Intercomparing studies at high latitudes have further confirmed that G-band radiometers show good agreement with other established sensors, such as the Global Positioning System (GPS) and radiosondes, particularly highlighting their enhanced sensitivity to small amounts of water vapor [14]. The 183 GHz frequency band is also a cornerstone of satellite-based microwave humidity sounders, which have been used to develop robust algorithms for retrieving total water vapor in challenging polar environments [15].
The quality of the GVR data was ensured through the development and implementation of a multi-faceted flagging system, which is described in detail in Section 2.2.
Building on the demonstrated utility of GVR data and employing the QC procedures developed in this study, we aimed to evaluate a suite of PWV products. This study incorporates the latest global reanalysis datasets, ERA5 and MERRA-2, along with a Local Data Assimilation and Prediction System (LDAPS) and the Korea Local Analysis and Precipitation System (KLAPS). The primary objective was to assess the accuracy of these four datasets using quality-controlled aircraft GVR PWV observations for specific meteorological cases over the Korean Peninsula. The evaluation was conducted using two distinct comparison strategies to comprehensively analyze the performance of the reanalysis and NWP model products relative to the GVR observations. First, to directly compare with the GVR observational domain, the PWV from the reanalysis and NWP models was calculated by integrating the pressure level closest to the aircraft’s flight altitude up to the top of the atmosphere. Second, comparisons involving the total atmospheric column PWV were estimated at the dropsonde launch locations by combining the GVR PWV (representing the column above the aircraft at that specific point) with the collocated dropsonde-derived PWV (representing the column below the aircraft to the surface). This is the first study to use a unique, quality-controlled aircraft-based dataset—comprising GVR and dropsonde composites—to comprehensively validate the performance of widely used global atmospheric reanalysis and local NWP models in representing PWV over the complex meteorological environment of the Korean Peninsula.
The key contributions of this study are as follows:
  • Development of a Unique Airborne Validation Dataset: We present a novel, high-quality validation dataset for PWV over the Korean Peninsula by creating a composite reference from airborne G-band Water Vapor Radiometer (GVR) and co-located dropsonde measurements.
  • Implementation of a Rigorous QC System: We developed and implemented a comprehensive, multi-stage quality control (QC) system for airborne GVR data, ensuring the reliability of our observational benchmark by filtering data compromised by instrument instability, aircraft maneuvering, and radio-frequency interference.
  • First Comprehensive Validation over the Korean Peninsula: This study provides the first multi-strategy validation of both leading global reanalysis (ERA5, MERRA-2) and high-resolution local NWP models (LDAPS, KLAPS) using a direct, observation-based airborne reference, offering critical region-specific insights into model performance.

2. Materials and Methods

2.1. Data Sources

2.1.1. GVR PWV Data

The primary observational data for this study were PWV measurements from a GVR manufactured by ProSensing (Amherst, MA, USA). The GVR instrument installed on the NIMS aircraft is shown in Figure 1. It measures upward-looking Tb at four dual-sideband channels centered around the 183.31 GHz water vapor absorption line (±1, ±3, ±7, and ±14 GHz) to retrieve PWV and LWP in the atmospheric column above the aircraft. The detailed specifications of the GVR are listed in Table 1. The detailed specifications of the GVR are listed in Table 1, showing a radiometric precision (ΔT) of 0.2 K. According to the manufacturer’s validation studies [7], this high precision allows for a PWV retrieval precision of approximately 0.1 mm in dry, high-altitude conditions.
The high sensitivity of the 183 GHz line to water vapor is a key reason for its selection in this study. It is approximately 50 times more sensitive than the 22 GHz line, the frequency band often used by ground-based GNSS meteorology, making it particularly suitable for detecting low PWV concentrations in dry conditions, such as those found at high altitudes [7]. For the upward-looking airborne GVR, the opaque center frequency (e.g., 183.31 ± 1 GHz) is the most sensitive to water vapor in the atmospheric layer closest to the sensor, whereas more transparent channels further from the center (e.g., ±14 GHz) can probe higher and more distant altitudes.
The GVR uses a core equation to convert raw measurements into final frequency signals (PH, PW, and PS). This formula is defined as Signal Frequency (Hz) = (Number of Pulses × Clock Frequency)/Raw Data Value. The number of pulses (500.0) and clock frequency (19.9 MHz) are fixed instrument constants. Consequently, the final frequency is determined solely by the Raw Data Value, which represents the signal intensity converted into a time-based measurement. The stronger the microwave signal (from more water vapor), the less time it takes to count a fixed number of pulses, resulting in a smaller raw data value being recorded.
To ensure high accuracy without requiring external field calibration, the GVR performs a continuous real-time, two-point self-calibration procedure using two internal blackbody reference components:
  • Two-Point Calibration: The instrument uses a “Hot Load” (maintained at a constant high temperature) and a “Warm Load” (passively following the instrument’s ambient temperature) as stable references. The Hot and Warm Loads are engineered to act as near-perfect black bodies. A blackbody emits radiation at a Tb equal to its physical temperature. Since their precise physical temperatures (Thot and Twarm) are continuously measured, their corresponding frequency signals (PH and PW) provide two known points to create a linear conversion formula. This formula, defined by a slope (m) and intercept (c) according to Equations (1) and (2), is then used to convert a given raw frequency signal, such as from the sky (PS), into its corresponding physical unit, brightness temperature (Tb). The slope and intercept are calculated as follows:
Slope :   m = T h o t T w a r m / P H P W
Intercept :   c = T w a r m m × P W
  • Noise Cancelation: To eliminate thermal noise from the instrument, the sky signal (PS) is referenced against the Warm Load signal (PW). This is because the Warm Load temperature accurately tracks the instrument’s own thermal fluctuations. The final, noise-corrected sky brightness temperature is calculated by applying the conversion formula from step 1 to the difference between the raw sky signal (PS) and warm load signal (PW), as embedded in the final retrieval Equation (3):
Sky   brightness   temperature :   T b = T w a r m + m · P W P S
Finally, the set of clean, noise-corrected brightness temperatures from the GVR’s multiple channels is fed into a pre-trained neural network algorithm [7,9]. This algorithm analyzes the patterns in the data to calculate the final, accurate PWV and Liquid Water Path (LWP) values.

2.1.2. Dropsonde Data

Vaisala RD-94 dropsonde data were used to estimate the PWV in the atmospheric layer below the aircraft’s flight altitude. The dropsonde observations of temperature, humidity, and pressure profiles were quality-controlled using the Atmospheric Sounding Processing Environment (ASPEN) software (version 3.3-668). The PWV from the dropsonde was calculated by vertically integrating the specific humidity derived from these profiles. This methodology, which utilizes dropsondes released from the NARA to characterize the lower atmosphere, has been effectively employed in previous studies over the seas of the Korean Peninsula [11]. When combined with the GVR PWV above the aircraft, the dropsonde-derived PWV formed the reference total column. This combined observational reference was later used to evaluate the performance of reanalysis and forecast model datasets.

2.1.3. Cloud Combination Probe

Data from a Cloud Combination Probe (CCP), manufactured by Droplet Measurement Technologies (Longmont, CO, USA) were used to identify the presence and characteristics of clouds along the aircraft’s flight path. A CCP comprises two main components.
  • The Cloud Droplet Probe (CDP) measures small cloud particles with diameters ranging from 2 to 50 µm by detecting forward-scattered light from a laser beam.
  • The Cloud Imaging Probe (CIP) measures and images larger particles with diameters from 7.5 to 930 µm by recording changes in illumination across a 64-element diode array.
For this study, particle counts from both the CDP and CIP at 1 s intervals were used to confirm the presence of clouds. To distinguish between clear-sky and in-cloud conditions, periods were flagged as “In-Cloud” when the cloud droplet number concentration exceeded 1 cm−3.

2.1.4. LDAPS and KLAPS Data

PWV data from two operational NWP models in Korea were included in the evaluation. These high-resolution models are commonly used for sub-mesoscale phenomenon analyses over the Korean Peninsula [16].
The two models are:
  • LDAPS: This is the KMA’s high-resolution (1.5 km, 70 vertical levels) operational model, which is a configuration of the Met Office Unified Model (UM). Its physical parameterizations include a nonlocal boundary layer scheme [17] and the mixed-phase cloud microphysics scheme of Wilson and Ballard [18]. As a convection-permitting model, the cumulus parameterization is turned off. Lateral boundary conditions (LBCs) are provided by the KMA’s global model (GDAPS) [19]. The data, provided in the GRIB2 format, only had pressure-level information available for this study. From this, the PWV for the layer above the aircraft and the total column PWV were calculated.
  • KLAPS: This model is based on the Weather Research and Forecasting (WRF) model. The configuration has a 5 km horizontal resolution and 23 vertical levels. It uses LBCs from the KMA’s UM (12 km). Its key physical parameterizations, adopted from the KMA operational setup, include the YonSei University (YSU) scheme for the planetary boundary layer (PBL) and the WRF Double-Moment 6-class (WDM6) microphysics scheme [20]. The data, provided in the NetCDF4 format, had both single- and pressure-level information available.

2.1.5. ERA5 Reanalysis Data

ERA5 is the fifth-generation atmospheric reanalysis produced by the European Centre for Medium-Range Weather Forecasts (ECMWF) [21]. This study used hourly ERA5 data with a horizontal spatial resolution of 0.25° × 0.25° in the NetCDF4 format.
Specifically, pressure-level data were used to calculate the PWV from the aircraft altitude to the top of the atmosphere, while single-level data were used for a direct comparison of the total column PWV.

2.1.6. MERRA-2 Reanalysis Data

The MERRA-2 is a global atmospheric reanalysis produced by NASA [22]. This evaluation used hourly MERRA-2 PWV data with a horizontal spatial resolution of 0.625° × 0.5° in the NetCDF4 format. Similarly to ERA5, pressure-level data were used to retrieve the upper-column PWV, while single-level data were used for total column comparisons.

2.1.7. Satellite Imagery

Visible imagery from the Communication, Ocean, and Meteorological Satellite (COMS) was used to provide a meteorological context for the aircraft observation flights. For each case study, the aircraft flight path was overlaid on the corresponding satellite image to visually depict the prevailing weather conditions, such as cloud distribution, during the observation period.

2.2. GVR Data Processing and Quality Control

The multi-stage QC system is based on established principles to ensure the fundamental validity of the data. The first three checks address data integrity, physical possibility, and geometric constraints, respectively. The fourth check implements an established methodology for RFI filtering. These four methods are applied as follows:
The initial step in the QC process ensured the integrity of the fundamental observation blocks. The GVR operates on a two-point calibration scheme that is essential for converting raw radiometer counts into physical units of Tb. This was achieved by periodically observing two internal blackbody targets maintained at different physical temperatures: a Hot Load and a Warm Load. These two reference measurements established a linear relationship, from which the instrument’s linear coefficients—gain (slope) and offset (y-intercept)—were derived. These coefficients were then applied to the linear formula: Tb = (Gain × Raw Measurement) + Offset. Here, the raw measurement is the direct output from each subsequent sky observation. The derived gain and offset were used for all sky measurements that followed until the next calibration cycle began, ensuring a continuous and accurate calibration that corrects for instrumental drift.
Therefore, a complete observation block was composed of four measurement sequences from this repeating cycle: the internal Hot-Load view, a subsequent sky view (Sky-1), an internal Warm-Load view, and a final sky view (Sky-2). For a block to be considered valid for processing, each of the four components must contain a full set of 20 samples. If this condition is not met by any component, the entire observation block for that time step is considered invalid, and its quality flag, FLAG_Incomp, is set to 1. Consequently, incomplete data points are excluded from further geophysical data retrieval. Each complete observation block, comprising 80 samples (4 components × 20 samples), was processed to generate a single PWV data point, resulting in a final data resolution of approximately 7–8 s.
A second quality control check was performed to identify and flag non-physical retrievals, denoted as FLAG_NegTb (Negative Brightness Temperature). This flag was set to 1 if any of the four retrieved Tb channels yielded a negative value after the calibration process. Because Tb is expressed on an absolute Kelvin scale, where 0 K represents absolute zero, a negative value is physically impossible. Therefore, the occurrence of such a value indicates a severe data anomaly, likely stemming from transient instrument malfunction, extreme noise, or critical failure in the two-point calibration. Consequently, any data point marked with this flag was considered invalid, and all associated retrieved parameters for that time step were discarded from the final dataset.
The third data validity check, FLAG_Att, addressed the potential data contamination arising from the aircraft’s attitude. This flag was set to 1 if the aircraft’s pitch or roll, as recorded by the onboard AIMMS, exceeded a threshold of 8°from the level flight during the GVR observation interval. This check is critical because the GVR is a zenith pointing radiometer designed for the most accurate PWV retrieval when it directly measures the atmospheric column overhead. When the aircraft’s altitude surpasses this threshold, the instrument’s viewing angle is no longer at the zenith, but is instead directed obliquely through the atmosphere. Observation at oblique angle increases the length of the atmospheric path through which the signal travels. This longer path can lead to an artificial overestimation of the retrieved PWV. Therefore, the data points marked with FLAG_Att =1 are considered suspect, as they may not accurately represent the true vertical atmospheric state.
The fourth quality control procedure, FLAG_TbIDsc, addresses transient disturbances such as those from radio frequency interference (RFI). To filter these known issues in airborne radiometry, we implemented an established methodology proposed by Wang et al. [9], which is specifically designed to identify, correct, and remove such anomalous data spikes. This procedure analyzes the multichannel Tb data point-by-point in three steps. First, a data point is flagged as a suspect if its value is greater than the maximum of the four preceding data points by more than 5 K, or less than the minimum of the same preceding points by more than 5 K. Second, the source of the anomaly is confirmed by examining the stability of the radiometer’s internal calibration signals (Hot and Warm Loads). If a sharp spike is observed in the sky-viewing Tb while the internal load signals remain stable, the point is confirmed as an external RFI. If the internal signals also vary sharply, they are classified as instrument-related disturbances. Finally, any data point confirmed as interference or disturbance is corrected by replacing its value with the mean of the four preceding valid data points.
Two summary flags were generated for practical use in this analysis. First, FLAG_SUM recorded the total number of QC failures for each data point. Thus, FLAG_FINAL presented a simple binary quality indicator. If any QC check failed (FLAG_SUM > 0), the data point was considered suspect (FLAG_FINAL = 1); otherwise, it was considered valid (FLAG_FINAL = 0). Only the data with FLAG_FINAL = 0 were retained for subsequent model observation comparisons. This rigorous QC procedure ensured that the GVR PWV dataset provided a robust and high-quality observational reference. This rigorous QC procedure ensured that the GVR PWV dataset provided a robust and high-quality observational reference. The specific application and impact of these QC flags on each case study are detailed in Section 3.1.

2.3. PWV Comparison Strategies

Quality-controlled GVR PWV data served as a benchmark for evaluating the performances of the reanalysis and NWP model datasets. Two distinct strategies were employed to compare the datasets.

2.3.1. GVR Observational Layer PWV Comparison

The first comparison strategy directly assessed how well the models and reanalysis represent the specific atmospheric layer observed by the GVR, i.e., the column extending from the aircraft’s flight altitude to the top of the atmosphere. To ensure a robust comparison, a meticulous spatiotemporal matching (collocation) procedure was implemented as follows:
  • Spatial Matching: Each GVR observation (at ~7–8 s resolution) was matched to the model grid cell nearest to the aircraft’s latitude and longitude at the time of observation. For the regularly gridded ERA5 and MERRA-2 data, a standard “nearest neighbor” method was used. For the high-resolution, unstructured grids of KLAPS and LDAPS, a computationally efficient k-d tree algorithm (scipy.spatial.cKDTree) was employed to rapidly determine the closest grid point.
  • Temporal Matching: The model output closest in time to the GVR observation was selected from the hourly model data, with a maximum tolerance of one hour.
After the corresponding model profile was identified, the PWV of the observational layer was calculated. Instead of using the total column value, vertical integration of the specific humidity profile of the model began at the pressure level closest to the aircraft’s actual flight altitude. The integration then proceeded upward to the top of the model atmosphere. This process was repeated for every quality-controlled GVR data point, creating a synthetic PWV time series from each model and reanalysis that replicated the GVR’s upward-looking observational domain. This approach allowed for a direct and accurate assessment of how well the datasets represented moisture in the upper atmospheric column, unaffected by the influence of water vapor below the aircraft.

2.3.2. Total Atmospheric Column PWV Comparison

The second strategy evaluated the performance of the datasets in representing the total atmospheric column PWV. First, the dropsonde profiles were quality-controlled using the standard Atmospheric Sounding Processing Environment (ASPEN) software [23]. To construct a composite reference PWV for each deployment, a single geographical location had to be defined.
For this study, the representative coordinate was defined as the latitude and longitude of the aircraft at the precise moment of the dropsonde launch.
While the dropsonde drifts horizontally during its descent, referencing the entire vertical profile to the launch point is a standard methodology for collocating soundings with model grids, and is consistent with previous dropsonde analyses over this region [11].
This composite was therefore created by adding the following two components, both referenced to the launch point:
  • The GVR PWV, representing the column from the aircraft’s upward altitude.
  • The dropsonde-derived PWV, representing the column from the surface to the altitude of the aircraft.
This observation-based total column PWV was then compared with the total column PWV from the four external datasets that were spatially and temporally matched to the same dropsonde launch point.

2.4. Statistical Evaluation Metrics

The performance of each model and reanalysis dataset against the GVR PWV was quantitatively assessed using three standard statistical metrics.
  • Pearson correlation coefficient (r): evaluates the linear agreement between the datasets.
  • Root Mean Square Deviation (RMSD): quantifies the overall magnitude of the error.
  • Mean Bias (MB): indicates the systematic tendency of a dataset to overestimate or underestimate PWV relative to the GVR reference.

3. Results

This section details the characteristics of the GVR PWV (either GVR layer or the total column), application of QC procedures, comparison of the GVR PWV with forecasts from the two NWP models (KLAPS and LDAPS), and historical data from the two reanalysis datasets (ERA5 and MERRA-2) for selected case studies over the Korean Peninsula.

3.1. Analysis of Observational Cases and Flight Strategies

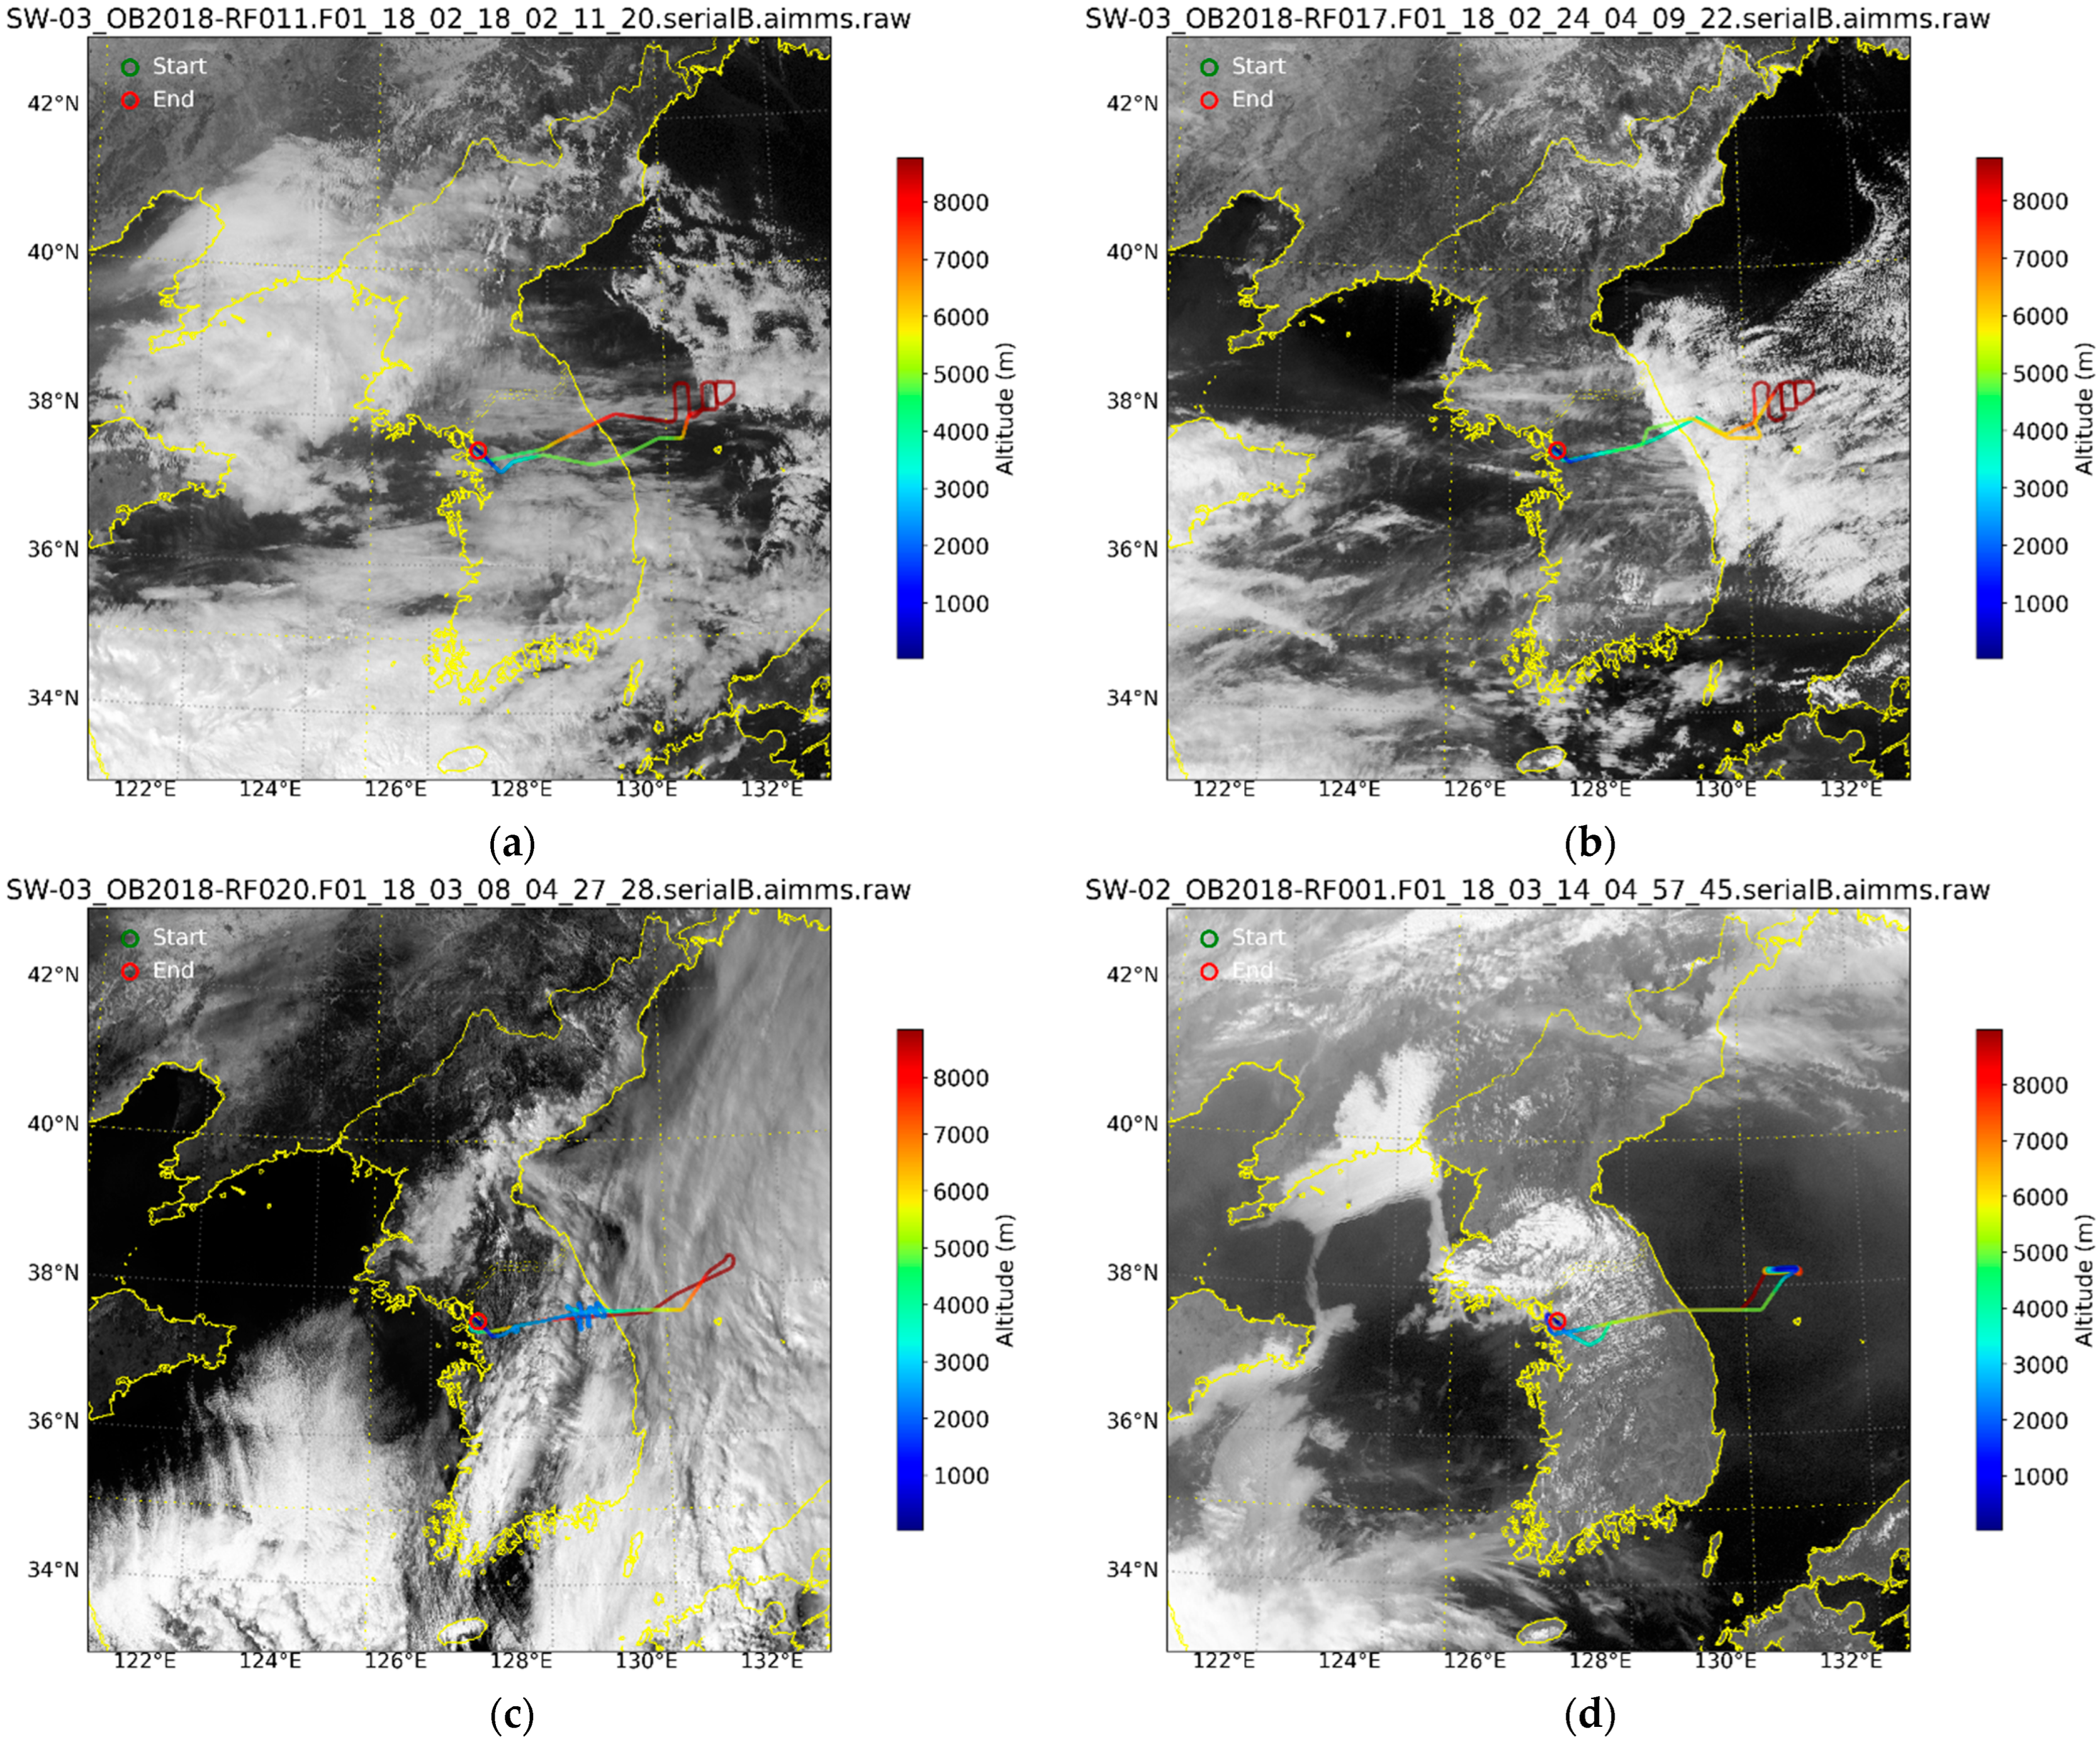
The scientific basis for this research is the International Collaborative Experiments for Pyeongchang Olympic and Paralympic winter games 2018 (ICE-POP 2018) campaign, which provided a unique dataset of atmospheric structure over the East Sea. From this campaign, four case studies were selected to evaluate the performance of the numerical models and reanalysis datasets using high-quality airborne GVR PWV observations as a reference. For each case, the flight path was overlaid on the corresponding COMS visible imagery, with the color of the path indicating the aircraft’s altitude, along with a detailed analysis of the GVR’s quality control flags and in-flight signal characteristics. The specific flight path for each case is presented in Figure 2.
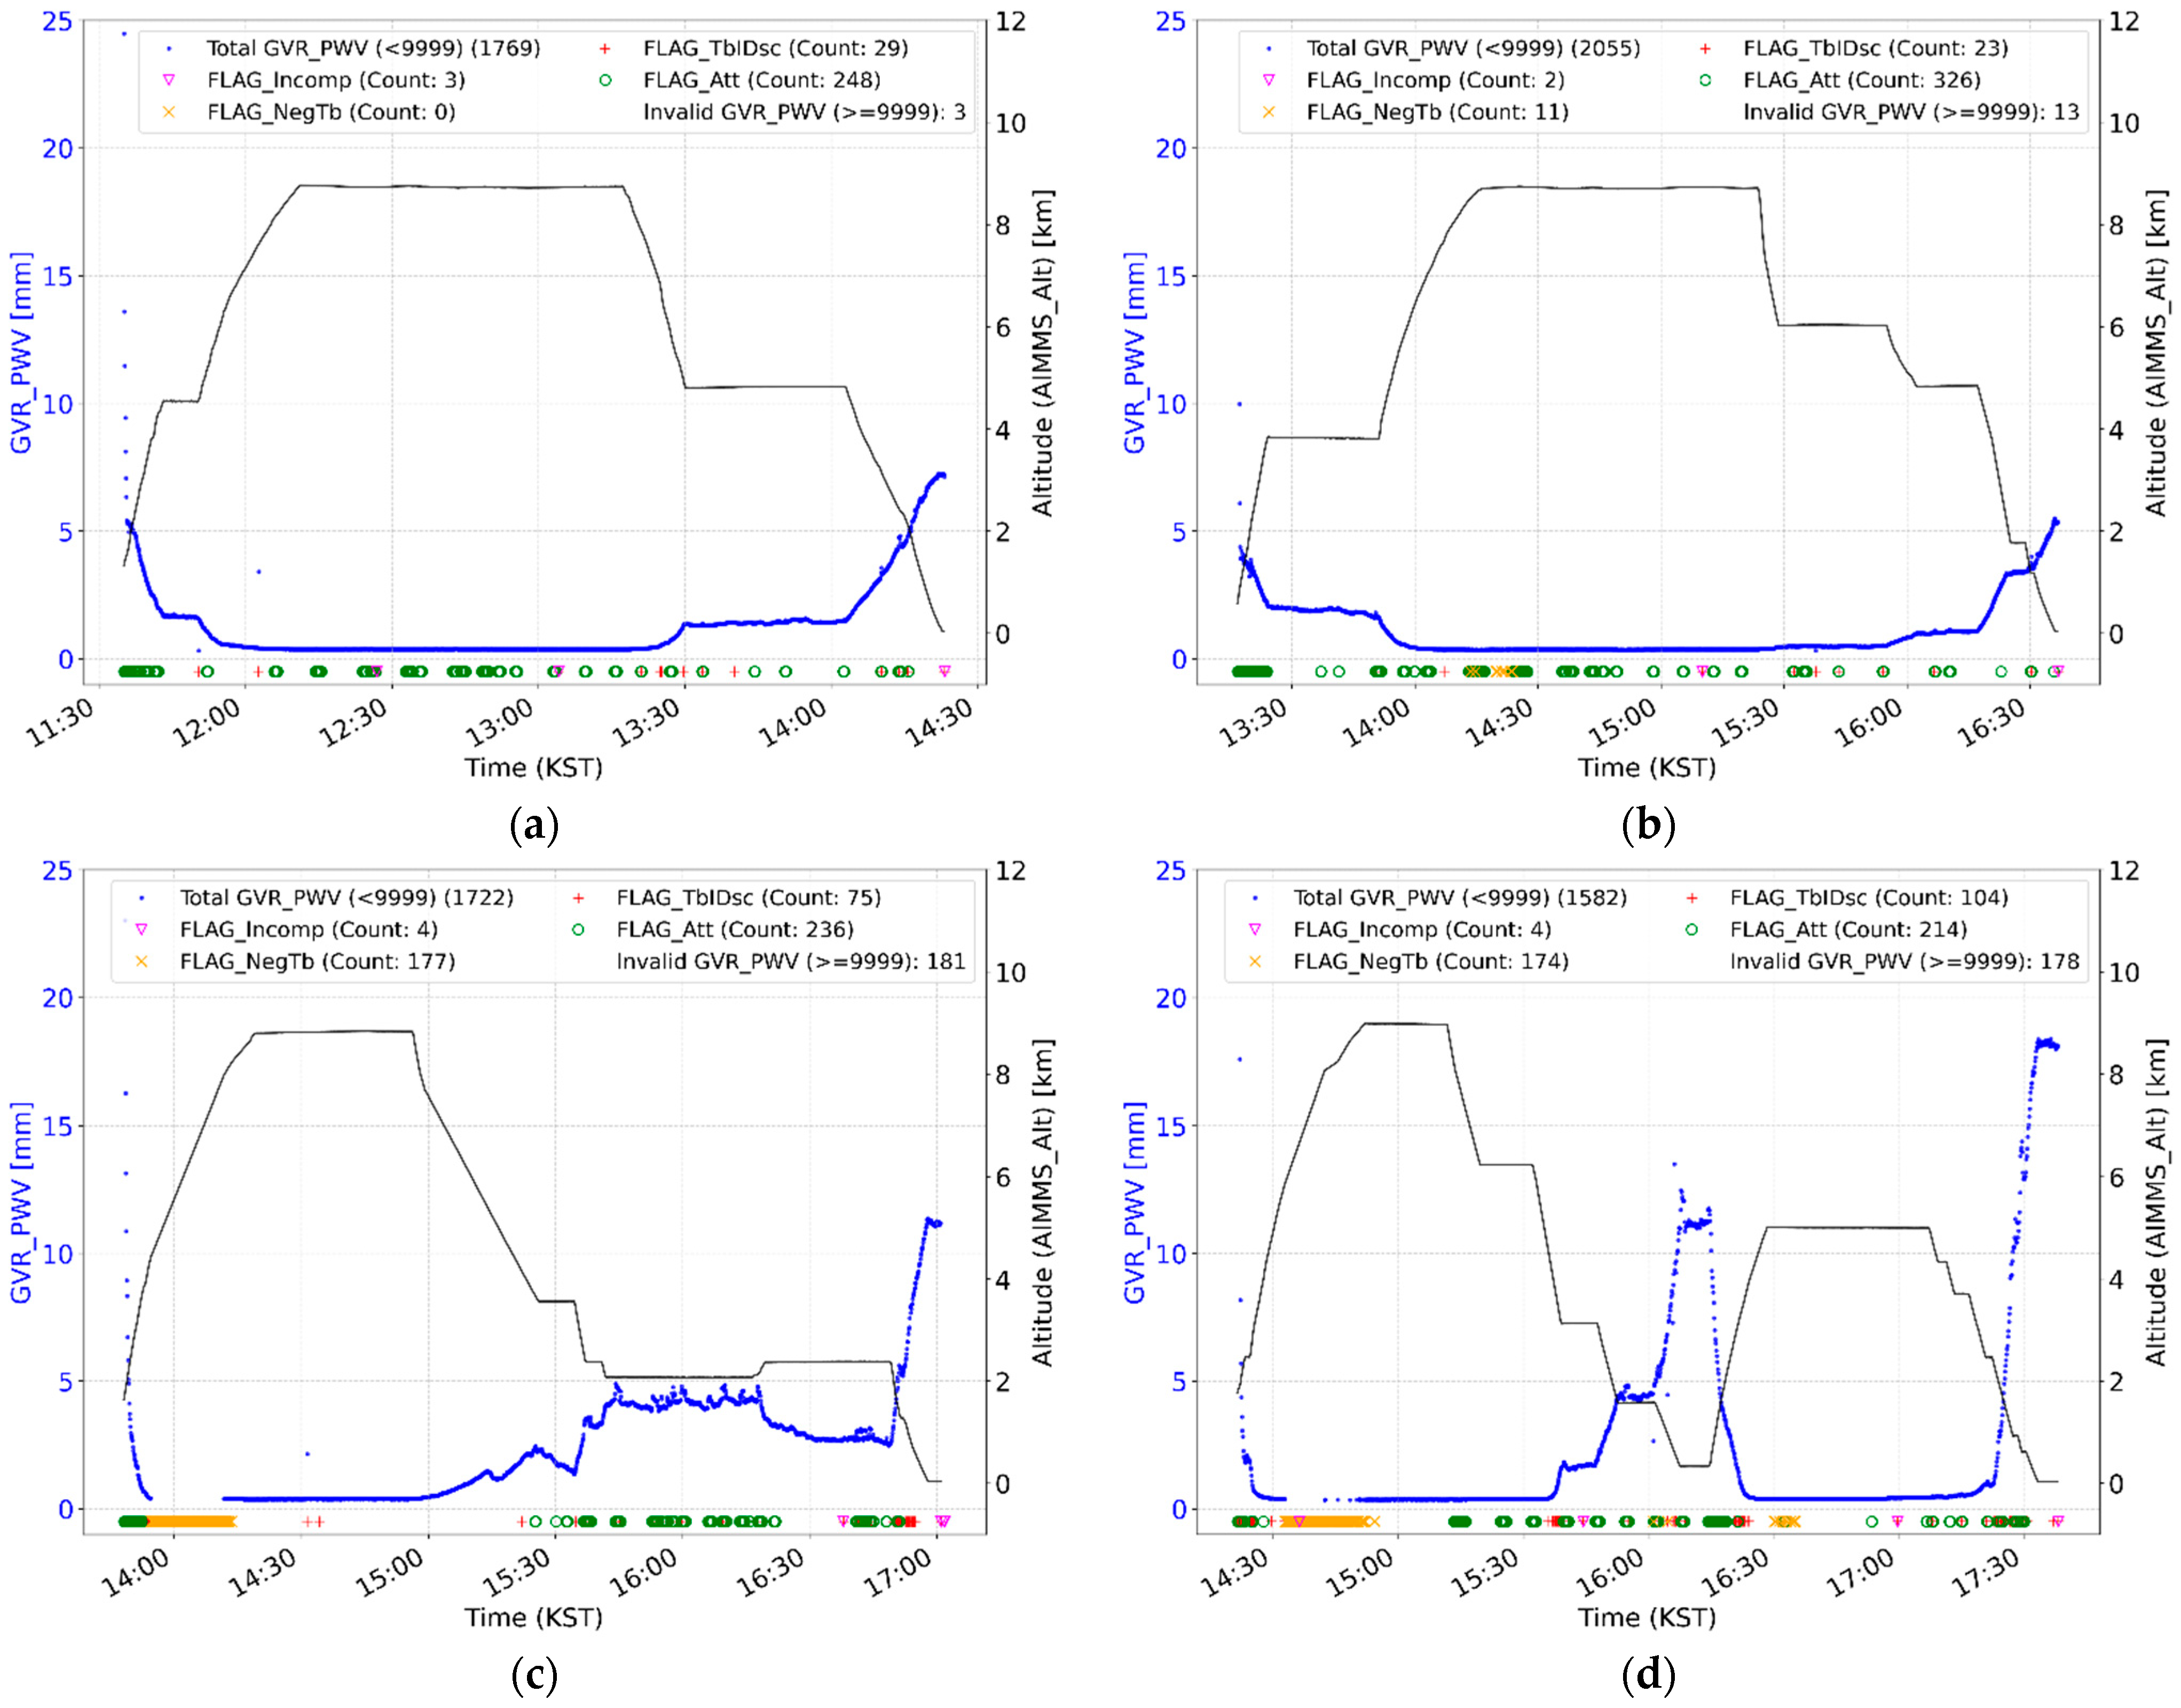
This study analyzed the interaction between PWV data, as measured by the GVR, and its associated QC flags across four atmospheric science flights conducted in February and March 2018. In all observation cases (Figure 3a–d), a strong inverse correlation between the aircraft altitude and PWV was observed, demonstrating that the GVR instrument consistently captured the physical phenomenon of decreasing atmospheric water vapor with increasing altitude. The scientific integrity of the data was ensured not only by the measurements themselves, but also by the QC flag system, which records real-time anomalies in flight and instrument status. For example, the FLAG_Incomp is as a foundational quality check that ensures the integrity of the raw data by identifying incomplete observation blocks, which is essential for valid calibration. This analysis focused on elucidating how a QC system functions under different flight conditions to guarantee data validity.

3.1.1. Case 1: 18 February 2018

  • Meteorology and Flight Strategy: Scattered clouds over the East Sea characterized the meteorological conditions for the flight on this day. NARA, after departing from Gimpo Airport (37.56°N, 126.80°E), passed over the western inland region of Gangwon-do Province at an altitude of approximately 3000 m and gradually ascended to approximately 4000 m (green), as it moved toward the East Sea. Subsequently, the aircraft turned northeastward over the East Sea and reached a maximum altitude of approximately 8000 m (orange–red). The primary objective of this high-altitude flight was to use dropsondes to map the vertical atmospheric structure over a wide, heterogeneous area. The flight path is shown in Figure 2a.
  • GVR Quality Control: The flight was conducted on 18 February 2018, with a mission of approximately three hours (11:30–14:30 KST), and provided a baseline case for instrument stability (Figure 3a). The most significant feature of this flight was the complete absence of FLAG_NegTb (0 points), which indicated internal instrument stability during the initial ascent phase. This suggests that the instrument reached a stable state very quickly after powering on, yielding reliable data from the start of the flight. In addition, FLAG_Incomp was not triggered during this mission, confirming that all calibration blocks were fully completed and that no data were lost due to incomplete Hot–Warm–Sky sequences. Although FLAG_Att (248 points), indicating aircraft maneuvering, and FLAG_TbIDsc (29 points), indicating external RFI, were observed intermittently, the high initial stability of the instrument provided a critical benchmark for evaluating performance across all flights. The count for FLAG_Incomp was negligible (3 points), indicating that data block transmission was stable.
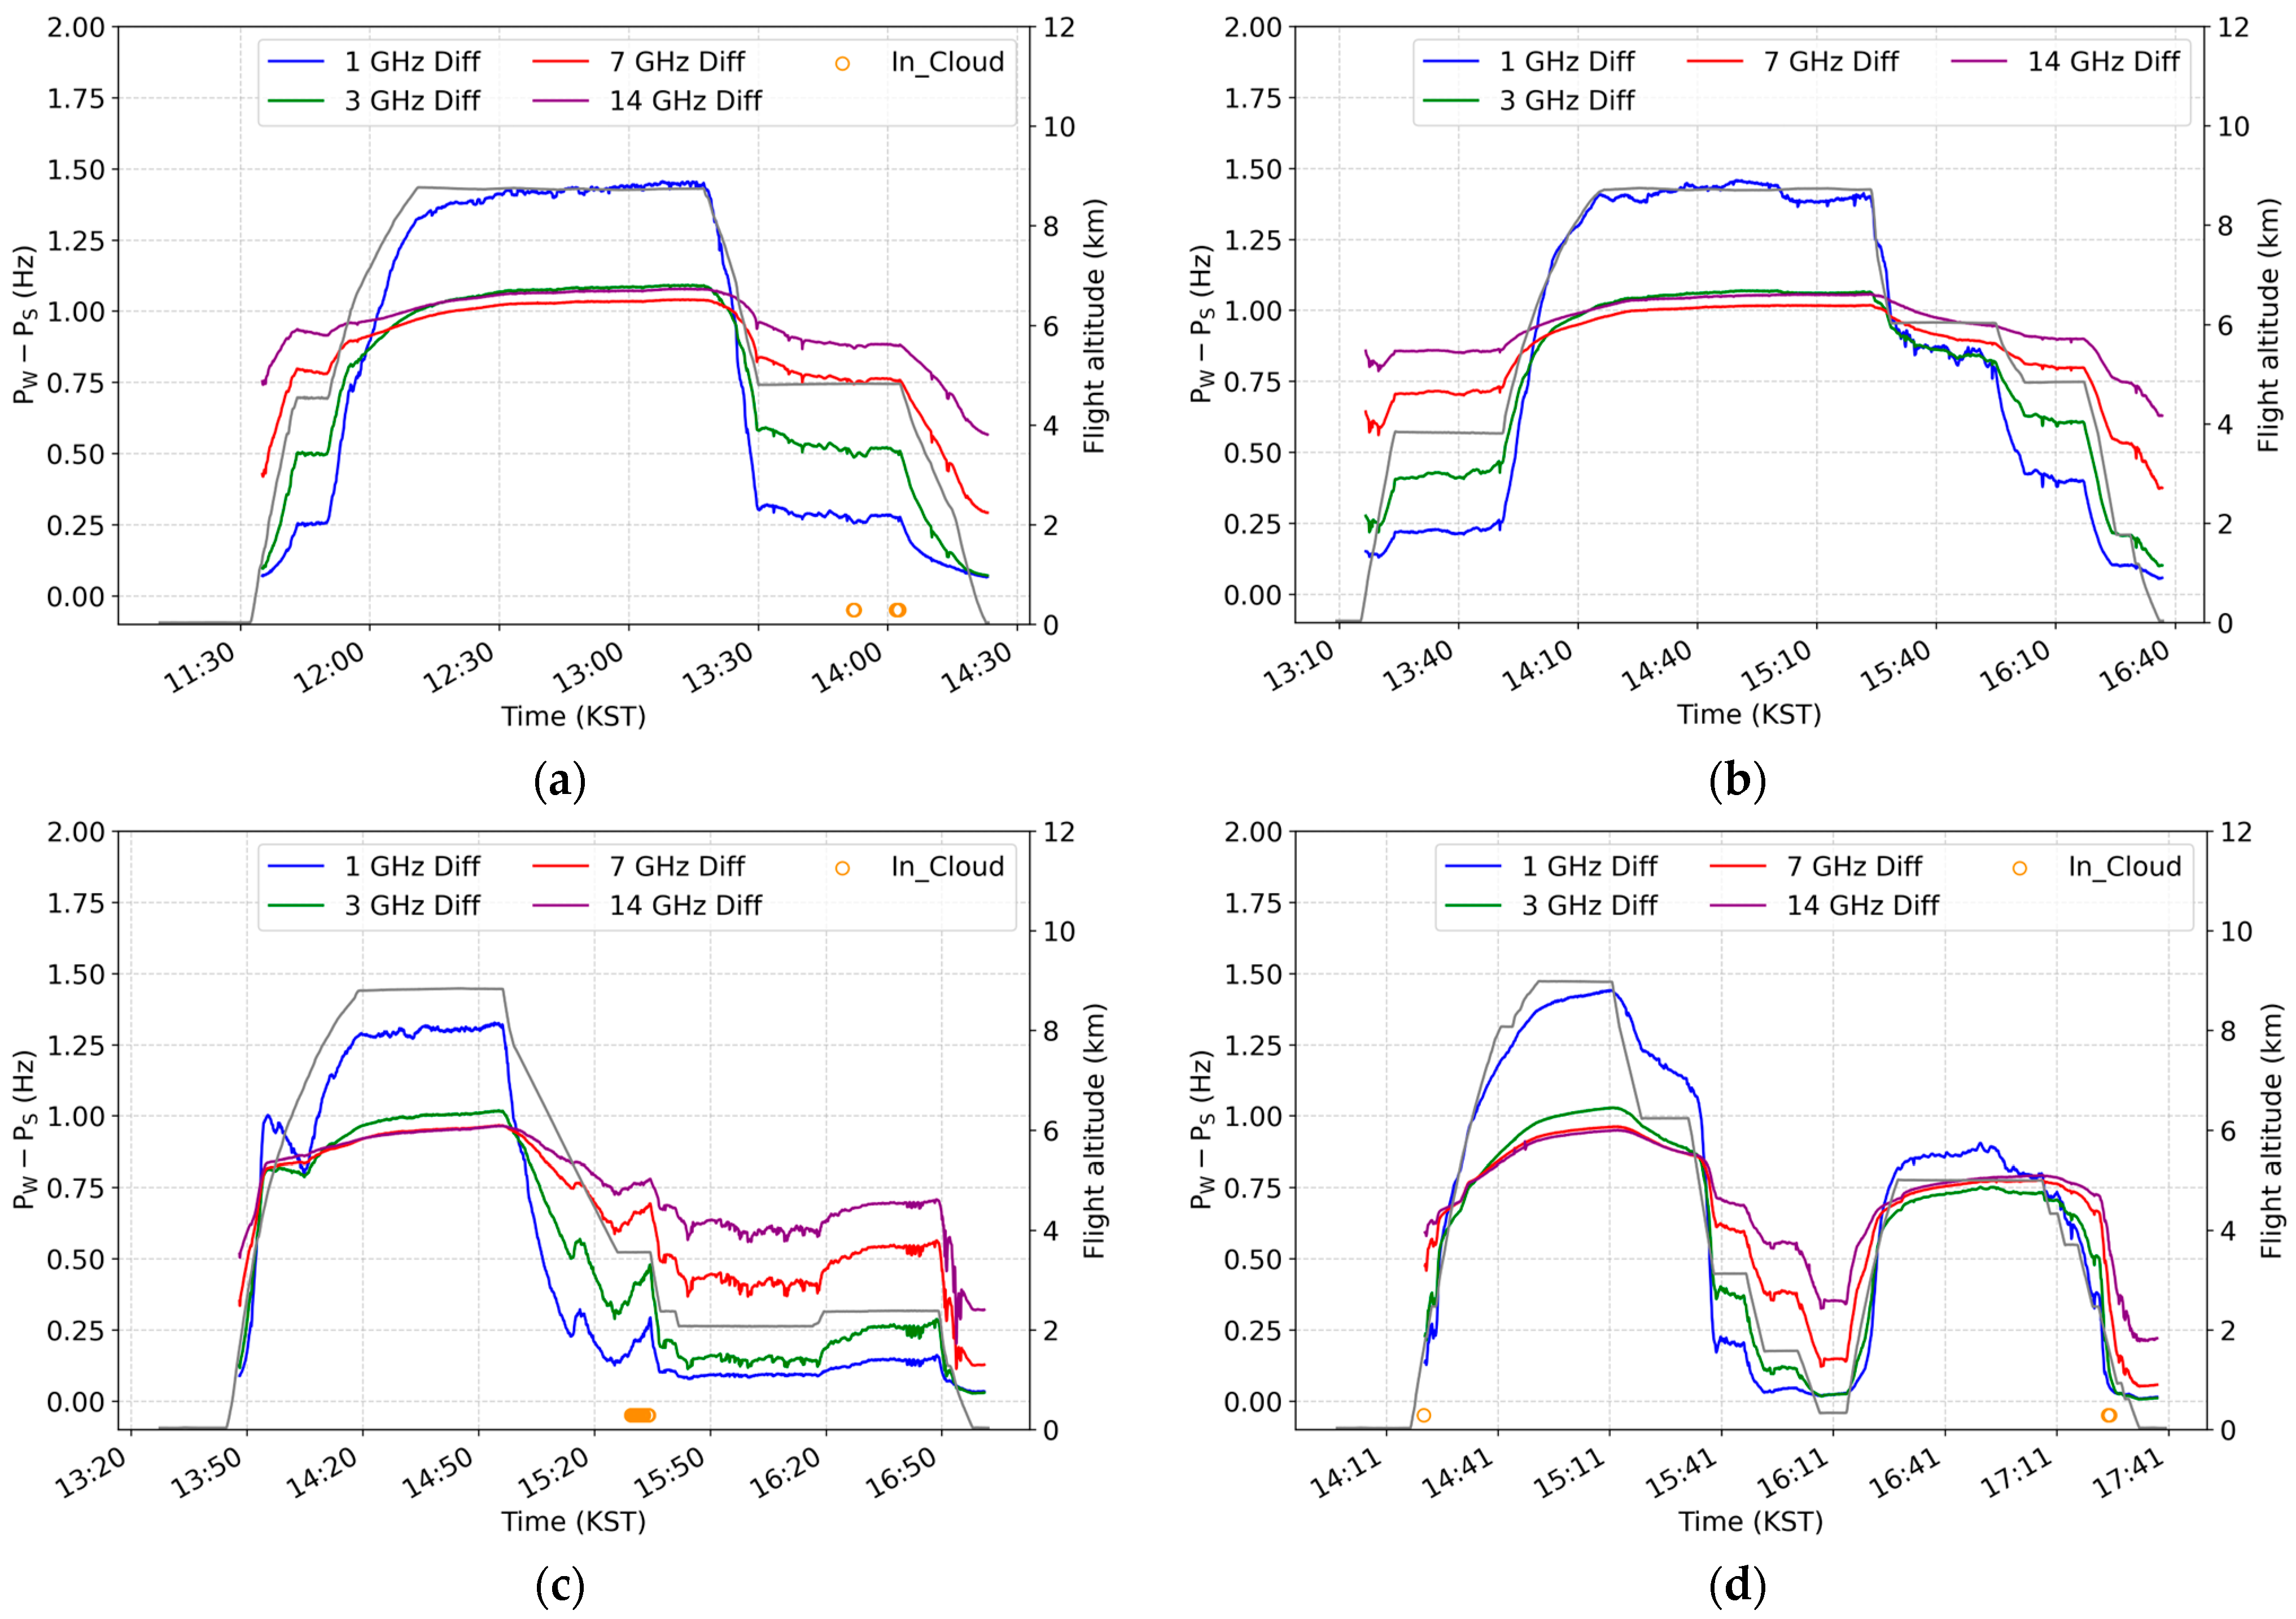
  • GVR Signal Characteristics: The flight on 18 February 2018 presents ideal data for characterizing the GVR instrument’s unique performance, featuring a distinct stepped ascent and a long-duration, high-altitude flight (Figure 4a). The analysis focused on the “pure atmospheric signal” (PW − PS), which was inversely proportional to the amount of water vapor; a larger difference value signifies drier conditions. The flight began with a stepped ascent at approximately 11:35 KST. The aircraft elevated rapidly to 4 km, held a level altitude for approximately 10 min, and then resumed its climb to 9.2 km by 12:10 KST. Meanwhile, the four channel difference signals precisely tracked each stage, increasing in value as the aircraft ascended through progressively drier air. The most significant portion of this flight was the one-hour high-altitude cruise from 12:10 to 13:17 KST. During this period, the difference signal remained at its maximum, reflecting dry atmospheric conditions. Furthermore, each channel was clearly separated based on its unique sensitivity. However, this separation did not follow a simple monotonic order. Instead, the observed order of the difference magnitude was approximately 1 > 14 ≈ 3 > 7 GHz, with the 1 GHz channel showing the largest difference at ~1.45 Hz. This nonlinear ordering is caused by the complex vertical temperature profile of the atmosphere (troposphere, tropopause, and stratosphere) and the unique weighting function of each channel. This was consistent with findings from ground-based microwave radiometer studies, which have shown that the mean vertical profile of water vapor content is well described by a function of temperature, similar to that of the Clausius-Clapeyron equation [24].
The 1 GHz channel, being the opaquest, was the most sensitive to the very cold upper troposphere immediately above the aircraft, resulting in the largest difference. The other, more transparent channels probed different layers, which were effectively warmer or colder and located at higher altitudes, leading to a complex but stable ordering. Furthermore, a subtle but continuous increase in all signals during this constant-altitude cruise clearly revealed the instrument’s “soak time,” the thermal stabilization process required to reach equilibrium. While this stabilization period was evident, the real-time, two-point calibration effectively self-corrected most of the thermal noise, validating the data for analysis even during this phase. Therefore, all quality-controlled data within this period were retained for final analysis. Following the cruise, the four-channel signals precisely tracked the stepped descent profile after 13:21 KST, decreasing in lockstep as the aircraft re-entered the lower moister atmosphere. According to the CCP data, indicated by the ‘In-Cloud’ symbols, the aircraft passed through a cloud layer during its descent phase around 14:00 KST. In conclusion, the February 18 data demonstrated that the pure atmospheric signal (PW − PS) consistently tracked the changes in water vapor during all flight phases. In particular, a long, high-altitude cruise provides a key case study for instrument characterization, facilitating a detailed analysis of the unique sensitivity of each channel and the instrument’s thermal stabilization dynamics.

3.1.2. Case 2: 24 February 2018

  • Meteorology and Flight Strategy: A distinct cloud band with very sharp boundaries, oriented northwest-southeast along the Yeongdong region (approximately 37–38.5°N, east of 128.5°E on the coast), was the primary target for observation. This feature was analyzed as a “coastal front” or “convergence zone,” formed by the combined effects of the synoptic pressure pattern and local topography, including the blocking effect of the Taebaek Mountains on cold-modified air from a continental high-pressure system. The NARA flew eastward from the Korean Peninsula to determine the cross-sectional structure of the system. The flight path, ascending to a constant altitude of approximately 4500 m above the system, was designed to acquire a detailed profile of the atmospheric layers comprising this organized weather event via dropsonde deployment. The flight path is shown in Figure 2b.
  • GVR Quality Control: In contrast to the February 18 flight, the flight on 24 February 2018, which lasted approximately 3.5 h (13:30–17:00 KST), exhibited a cluster of 11 FLAG_NegTb during its initial ascent phase between 14:15 and 14:30 KST. This trend demonstrates that a brief period of instability, during which the instrument acclimates to rapid environmental changes (e.g., pressure and temperature) after takeoff, is typical. The QC system played a key role in clearly identifying the invalid initial data; therefore, it was excluded from the analysis. FLAG_Incomp did not appear in this case, indicating that all calibration blocks were successfully completed and the internal two-point calibration remained intact throughout the mission. FLAG_Att was observed intermittently during altitude changes but was absent during the extended cruise phase. FLAG_TbIDsc was recorded only a few times as short spikes, classified as external RFI. The QC data are presented in Figure 3b.
  • GVR Signal Characteristics: The flight on 24 February 2018, serves as a powerful cross-validation of the instrument characteristics observed in the February 18 case, featuring a similar high-altitude cruise profile and providing an ideal dataset for verifying the performance of GVR. The pure atmospheric signal was inversely proportional to the amount of water vapor, implying a larger difference value signifies drier conditions. The mission began with a stepped ascent between approximately 13:26 and 14:26 KST, during which the four-channel difference signals precisely tracked each stage of the ascent, increasing in value as the aircraft ascended through progressively drier air. The most critical portion of the flight for analysis was the subsequent one-hour high-altitude cruise from 14:26 to 15:26 KST at a stable altitude of ~9.2 km. Two key instrument characteristics were reconfirmed during this cruise. First, all four difference signals exhibited a slight but continuous increase, demonstrating the instrument’s stabilization process (“soak time”) to reach full thermal equilibrium, a pattern identical to that observed on 18 February. This characteristic has also been observed in other airborne GVR deployments, such as during the VOCALS-REx campaign [25]. Second, the channels settled into a distinct and stable separation. Following the cruise, the signals precisely tracked the stepped descent after 15:26 KST. In conclusion, the 24 February data generated a robust cross-validation of the GVR’s key performance characteristics, confirming the necessity of a significant “soak time” for thermal stabilization and demonstrating the consistent nature of the instrument’s multi-channel sensitivities. The signal characteristics are shown in Figure 4b.

3.1.3. Case 3: 8 March 2018

  • Meteorology and Flight Strategy: On this day, an extensive mid-latitude cyclone produced widespread cloud bands over the southern Korean Peninsula and the East Sea. Departing from Gimpo Airport, the NARA made a continuous, steep ascent over the East Sea, climbing from below 1000 m (dark blue) to a peak altitude of approximately 8000 m (orange to red) near Uljin (36.98°N, 129.40°E). This ascent profile was performed to enable a comprehensive vertical sounding of the deep cloud system with a dropsonde deployed from the maximum altitude. The flight path is shown in Figure 2c.
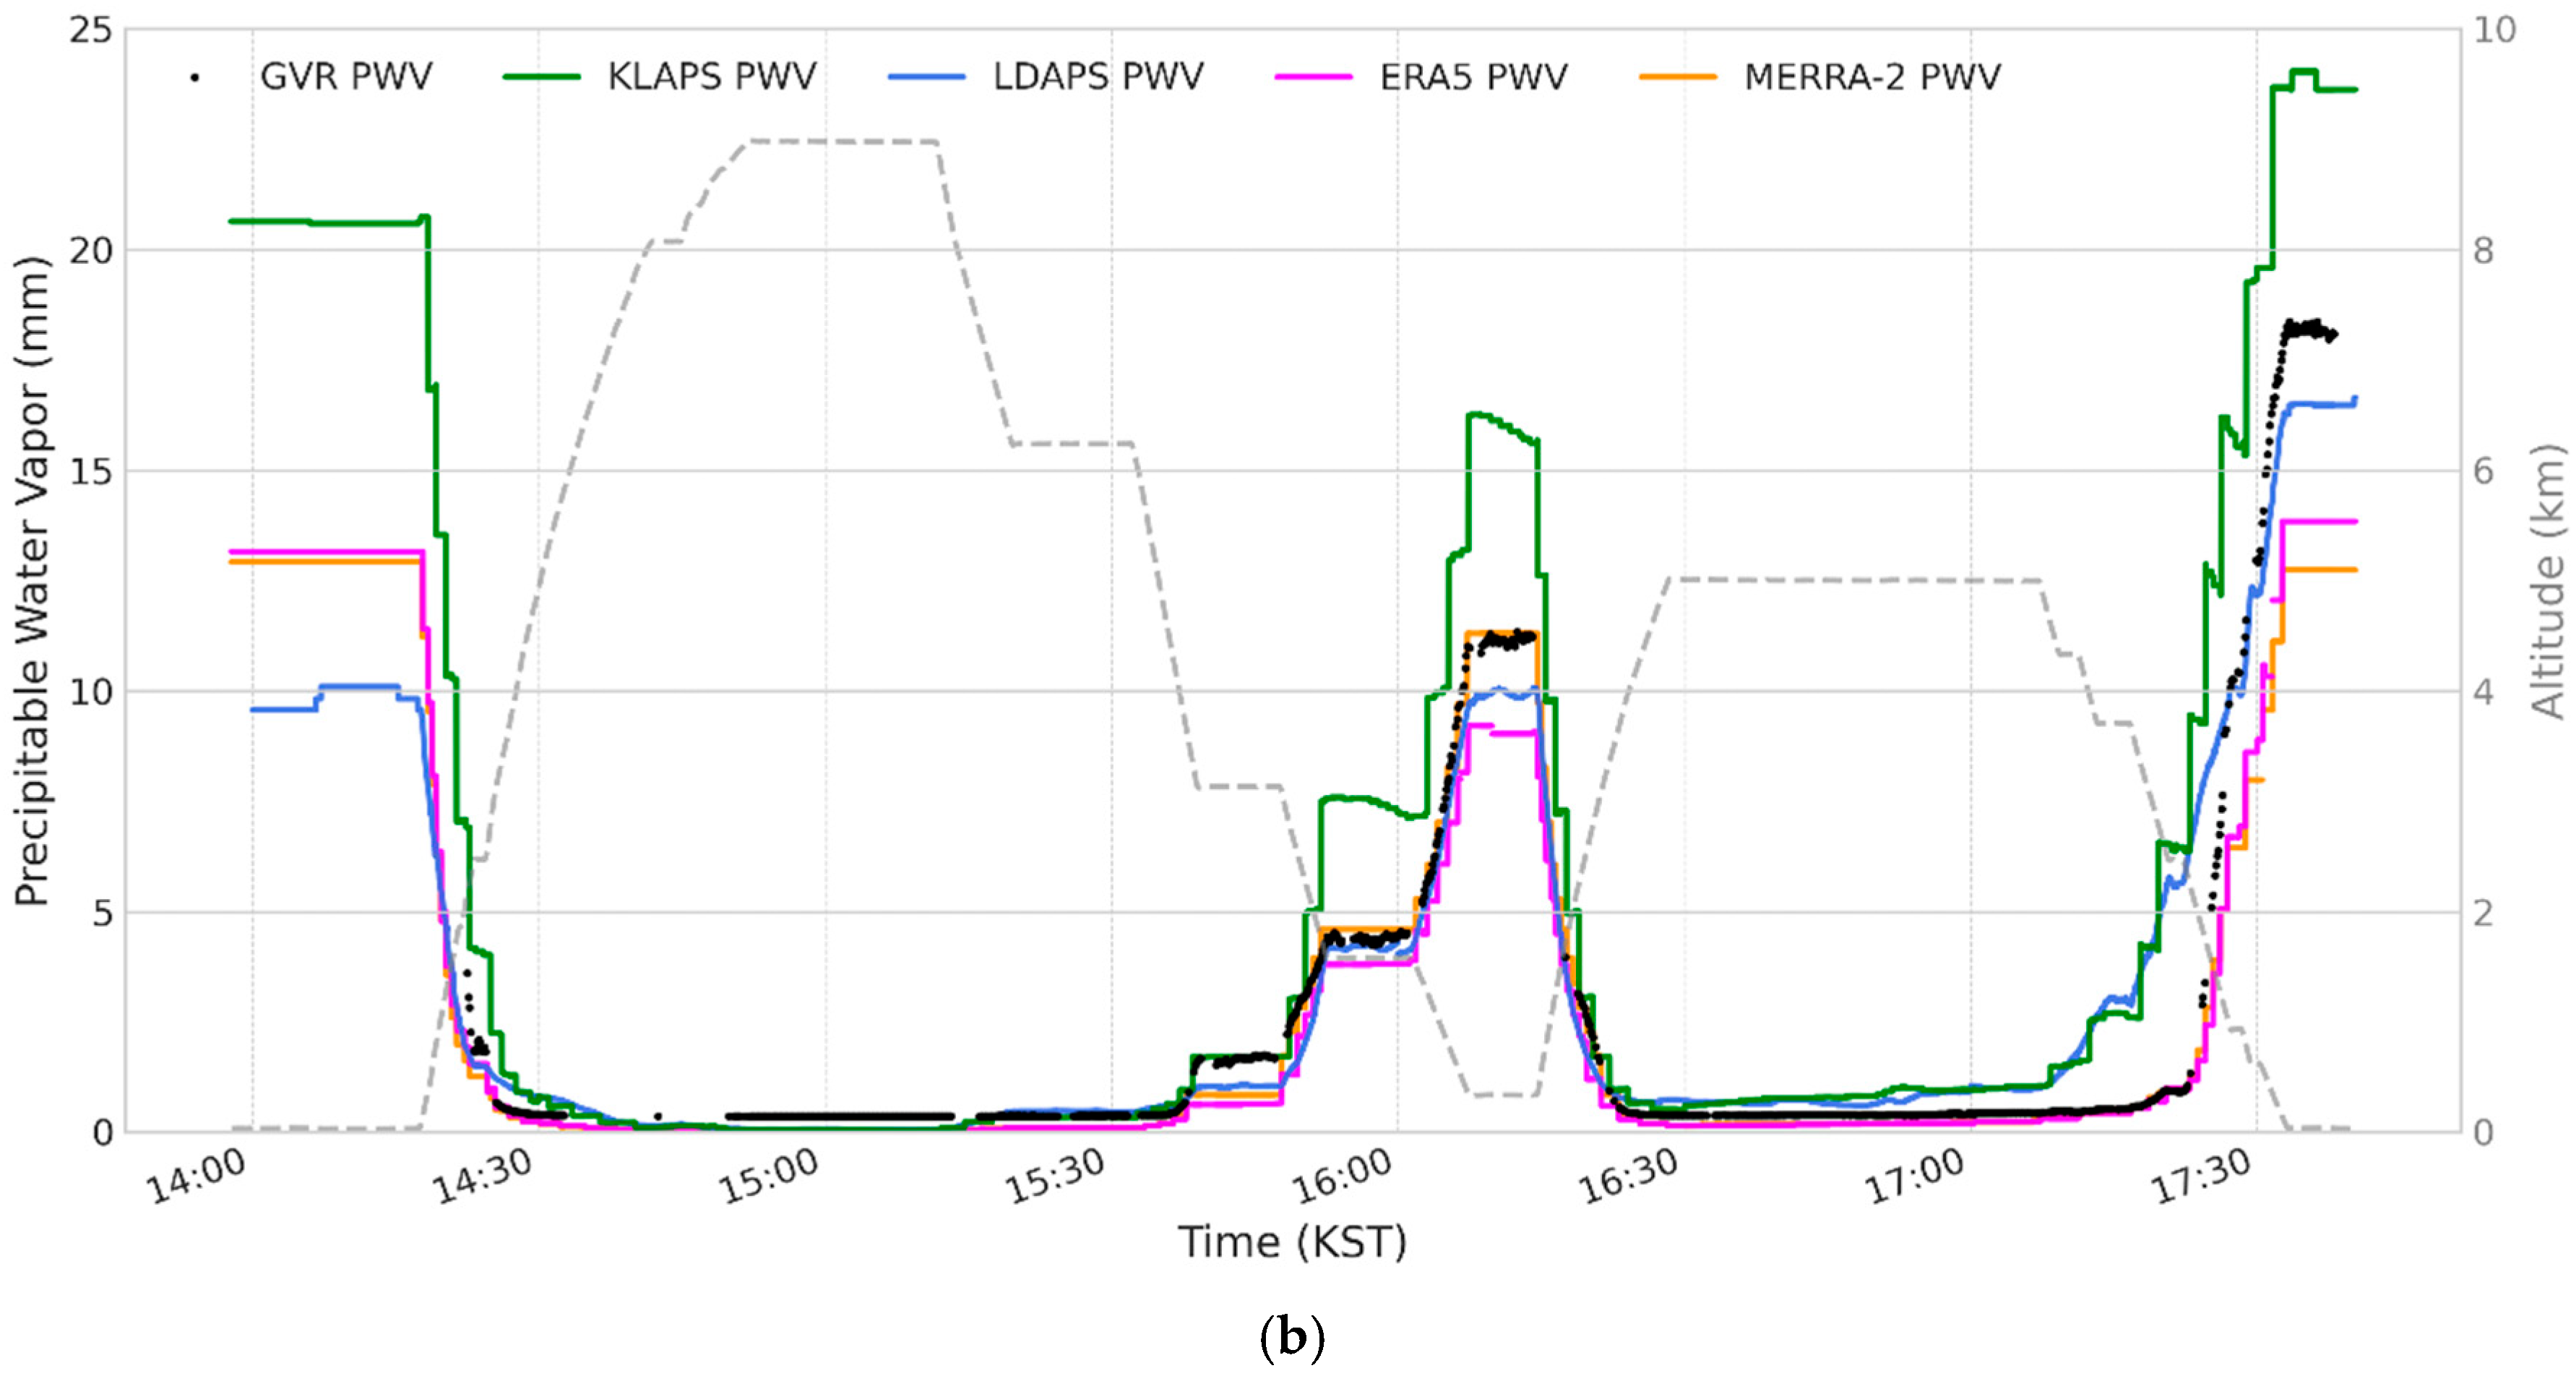
  • GVR Quality Control: The flight on 8 March 2018, spanning approximately three hours (14:00–17:00 KST), showed a significant cluster of 177 FLAG_NegTb points that appeared between 14:00 and 14:20 KST. This case was also notable for a high concentration of FLAG_Att flags (236 points) and FLAG_TbIDsc flags (75 points) during a low-altitude segment (approximately 15:45–16:45 KST). This indicated that the QC system successfully recorded the potential impact of aircraft maneuvers performed for targeted scientific observation, potentially impacting the data quality. FLAG_Incomp was observed sporadically during steep ascent and descent phases, suggesting that some calibration cycles were incomplete when the aircraft executed rapid altitude changes. The QC data are shown in Figure 3c.
  • GVR Signal Characteristics: The flight on 8 March 2018, serves as a classic example of a mission designed for targeted low-altitude cloud observation, illustrating how the GVR’s pure atmospheric signal responds to the atmosphere’s vertical structure and the presence of clouds. The PW − PS difference was inversely proportional to the total amount of water (vapor and liquid), indicating that a larger value signifies drier conditions. The flight began at approximately 13:50 KST by transiting a low-level cloud layer near the surface. As the aircraft climbed through the clouds to a peak altitude of approximately 9.2 km by 14:30 KST, the pure atmospheric signal (PW − PS) difference increased proportionally to its maximum value. At this peak altitude, each channel was clearly separated according to its unique sensitivity. Immediately after approximately 15:45 KST, the aircraft entered the cloud layer at 2.2 km, as confirmed by the In-Cloud flags. In response, the PW − PS difference for all channels plummeted to a very small value, converging in the 0.1–0.2 Hz range, due to the strong microwave emission from liquid water droplets. In conclusion, the March 8 data demonstrates that the PW − PS difference not only tracks the general profile of water vapor with altitude but can also precisely detect fine structures, such as dry layers and the presence and inhomogeneous characteristics of clouds, on a channel-specific basis. The signal characteristics are shown in Figure 4c.

3.1.4. Case 4: 14 March 2018

  • Meteorology and Flight Strategy: The observations on this day targeted a uniform, relatively low-brightness stratus-like cloud layer over the East Sea. The flight strategy involved a comprehensive sounding of the full atmospheric column, which was executed as a slow, gradual descent from a high altitude of 9 km (red) to a low altitude of 1 km (dark blue). This continuous descent allowed for a precise scan of the entire atmospheric cross-section. The objective was to acquire a deep understanding of the multilayered vertical structure by continuously tracking the upper-air water vapor with the GVR while deploying a dropsonde to observe the atmospheric layers below. The flight path is shown in Figure 2d.
  • GVR Quality Control: The 14 March flight, which was a highly dynamic mission of approximately 3.5 h (14:30–18:00 KST), was the most complex case among those analyzed. This flight was characterized by a multilayered profile with repeated ascents and descents. This complexity was directly reflected through the QC flags. A dense cluster of 174 FLAG_NegTb points was observed during the initial rapid ascent and other maneuvering phases, indicating significant and recurring instrument instability. Furthermore, owing to the mission’s complexity, aircraft maneuvering (FLAG_Att, 214 points) and external radio frequency interference (FLAG_TbIDsc, 104 points) occurred consistently throughout the flight. FLAG_Incomp was intermittently triggered during abrupt transitions, showing that some calibration sequences were left incomplete when the aircraft executed sharp altitude changes. The large number of flagged data points demonstrates the QC system’s success in tracking and documenting factors affecting data quality, even under extremely dynamic conditions. The QC data are shown in Figure 3d.
  • GVR Signal Characteristics: The flight data from 14 March 2018 provide an ideal case study of the GVR’s performance during a dynamic, multilayered sampling mission. Its complex flight profile, featuring multiple ascents and descents, validates the rapid response and reliability of the instrument. The pure atmospheric signal (PW − PS) was inversely proportional to the amount of water vapor, indicating that a larger value signifies drier conditions. The flight began by transiting a low-level cloud layer at approximately 14:30 KST. As the aircraft climbed out of the cloud to its peak altitude of ~9.4 km around 15:05 KST, the pure atmospheric signal increased to its maximum value, reflecting the dry upper atmosphere. At this altitude, the channels were clearly separated by their unique sensitivities, with the 1 GHz channel (blue) showing the largest difference at approximately 1.45 Hz, followed by the 14 GHz (purple), 3 GHz (green), and 7 GHz (red) channels. The most dramatic feature of this flight was the rapid descent and re-ascent maneuvers between 16:05 and 16:35 KST. The four PW − PS signals perfectly mirrored this “V-shaped” flight path, hitting their minimum values at the lowest altitude and rising again with the climb, clearly demonstrating the instrument’s immediate response to drastic changes in the atmospheric profile. During the subsequent hold at 5 km after 16:35 KST, the channels maintained their consistent separation, with the 1 GHz channel again demonstrating the largest difference. The signals then dropped to near zero during the final descent at approximately 17:30 KST as the aircraft passed through another cloud layer. In conclusion, the 14 March data validate the GVR’s reliability and rapid response time in complex sampling missions. Its ability to precisely track the vertical structure of water vapor on a channel-specific basis during aggressive maneuvering establishes that it is a highly effective instrument for studying complex meteorological conditions. The signal characteristics are shown in Figure 4d.
In conclusion, the assessment of these four flights confirms the GVR instrument’s capability to robustly quantify atmospheric water vapor profiles under various conditions and provides a comprehensive validation of its in-flight performance. The QC flag system proved to be an indispensable component that critically enhanced the scientific reliability of the data by systematically identifying and recording data degradation factors according to distinct flight characteristics (stable, typical, and dynamic).
Furthermore, the differential measurement principle was verified by the dramatic signal difference observed between the dry, high-altitude atmosphere and the moist (or cloudy), low-altitude atmosphere. The data quantitatively showed that the instrument required approximately one hour to become thermally stable in the real flight environment, a period known as “soak time”; however, owing to its real-time, two-point calibration, the GVR self-corrected most of this thermal noise even during the stabilization process. The rapid and consistent response of the instrument during dynamic flight environments with multiple ascents and descents demonstrated its observational reliability under complex meteorological conditions.

3.2. GVR Measurement Principle and Stability Validation

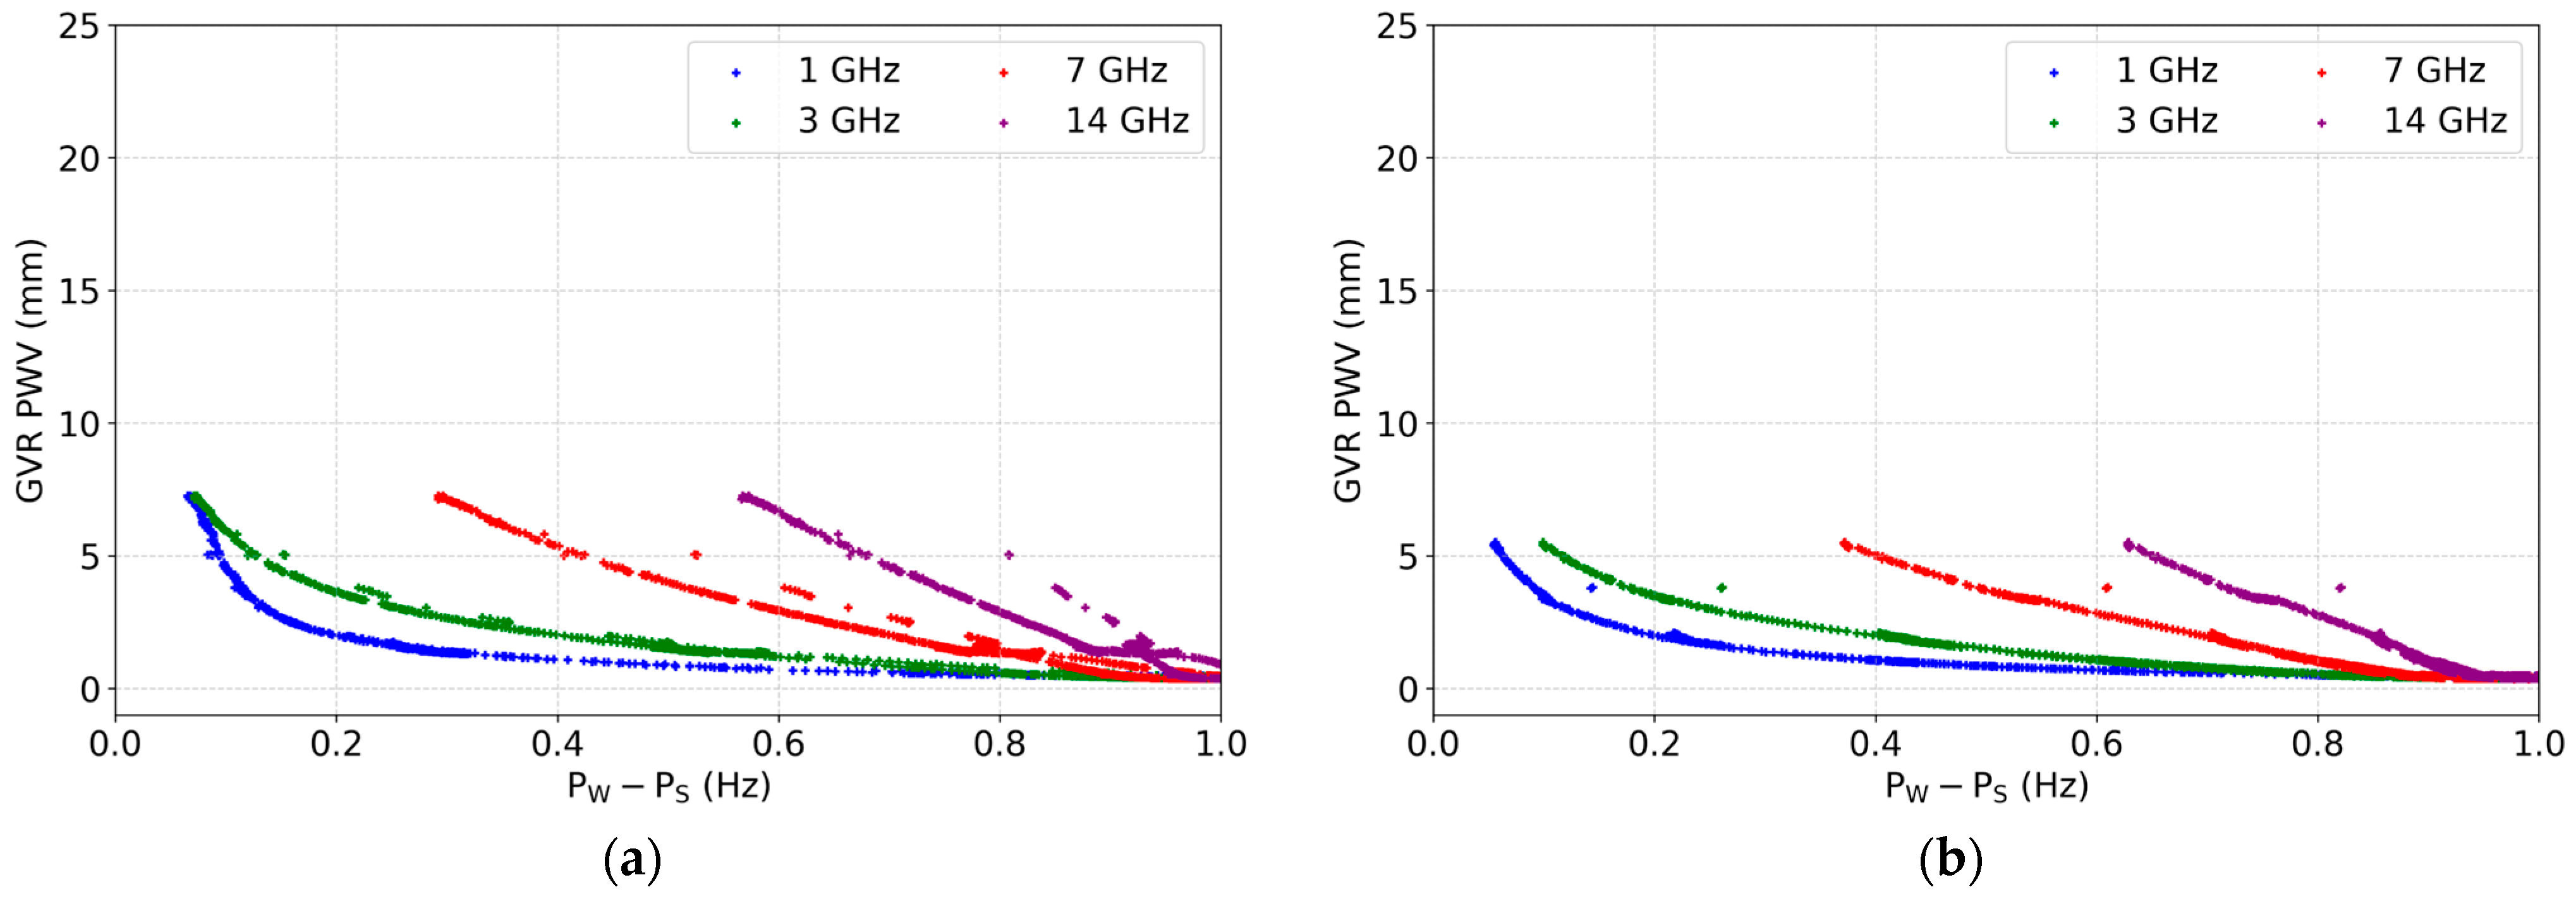
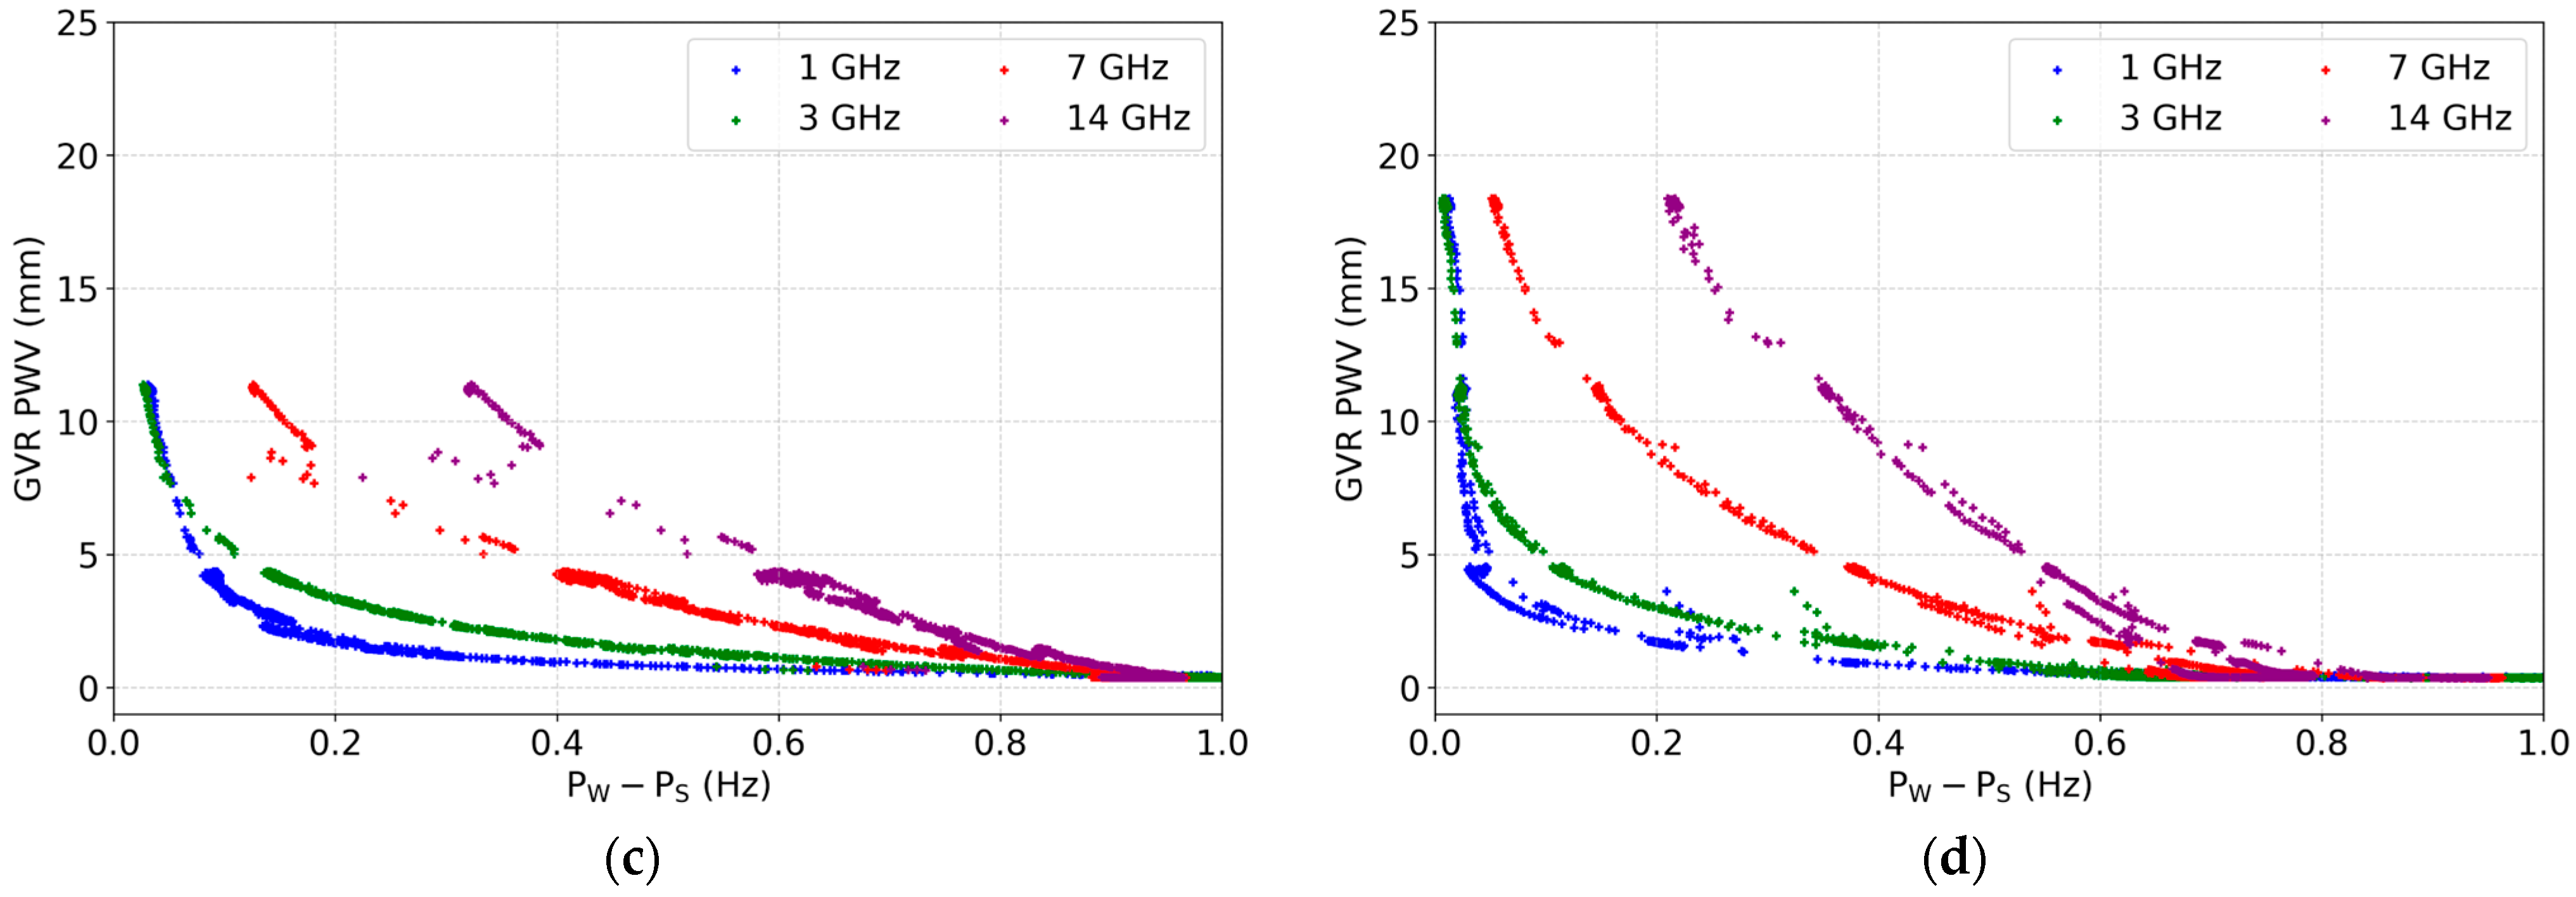
The scatter plots of the “pure atmospheric signal” (PW − PS) versus the PWV for the four flight cases (Figure 5) provide a key validation of the GVR system’s performance and measurement principles. A common pattern was evident across all flights: each of the four frequency channels formed a unique and stable nonlinear relationship curve, exhibiting a distinct inverse correlation, where the PWV decreases as the PW − PS difference increases. Within this consistent pattern, the differences according to atmospheric conditions on each flight day were also clear. The flights on 18 February and 24 reflected very dry atmospheric conditions, with PWV values below 10 mm. In contrast, the flights on 8 March and 14 exhibited moist and cloudy conditions, with PWV values reaching up to 20 mm. Notably, in March flights, where clouds were observed, the shape of the curves was slightly altered in the high-PWV region, which can be interpreted as an effect of the presence of liquid water.
This analysis presents three important academic findings that demonstrate the performance and reliability of the GVR system.
  • First, the clear and stable curved relationship between the PW − PS difference and final PWV validated the measurement principle and retrieval algorithm. This signified that the instrument’s intermediate physical measurement (noise-corrected atmospheric signal) had a highly consistent relationship with the final scientific product, proving the stability of the entire GVR system.
  • Second, each of the four channels drew a unique response curve visually demonstrating the operational basis of the multichannel retrieval algorithm. This shows that for a specific PWV value, the four channels formed a “unique signature” of distinct PW − PS values. The algorithm then used this combination to calculate an accurate PWV value from the complex atmospheric state.
  • Third, the high degree of similarity in the shape of each channel’s curve across different flight days and atmospheric conditions represents strong evidence that validates the instrument’s stability and the reproducibility. This implies that the GVR’s calibration state is stably maintained and that observations conducted on different days can be reliably compared.

3.3. Comparative Analysis of GVR Layer PWV with Models

In this section, the vertically integrated PWV retrieved from the GVR observations was compared with those derived from the numerical forecast models (LDAPS and KLAPS) and reanalysis datasets (ERA5 and MERRA-2). For consistency, the PWV profiles from the models and reanalysis were vertically integrated from the aircraft altitude to the top of the atmosphere, matching the upward-looking configuration of the GVR. Four representative cases (18 February, 24 February, 8 March, and 14 March 2018, were analyzed. The time series of PWV were examined together with statistical measures, including the correlation coefficient (r), RMSD, and mean bias (MB) (Figure 6 and Figure 7; Table 2 and Table 3). Table 2 and Table 3 also present a quantitative comparison of these statistics before and after the application of the QC filters to demonstrate the impact of the data quality procedure.
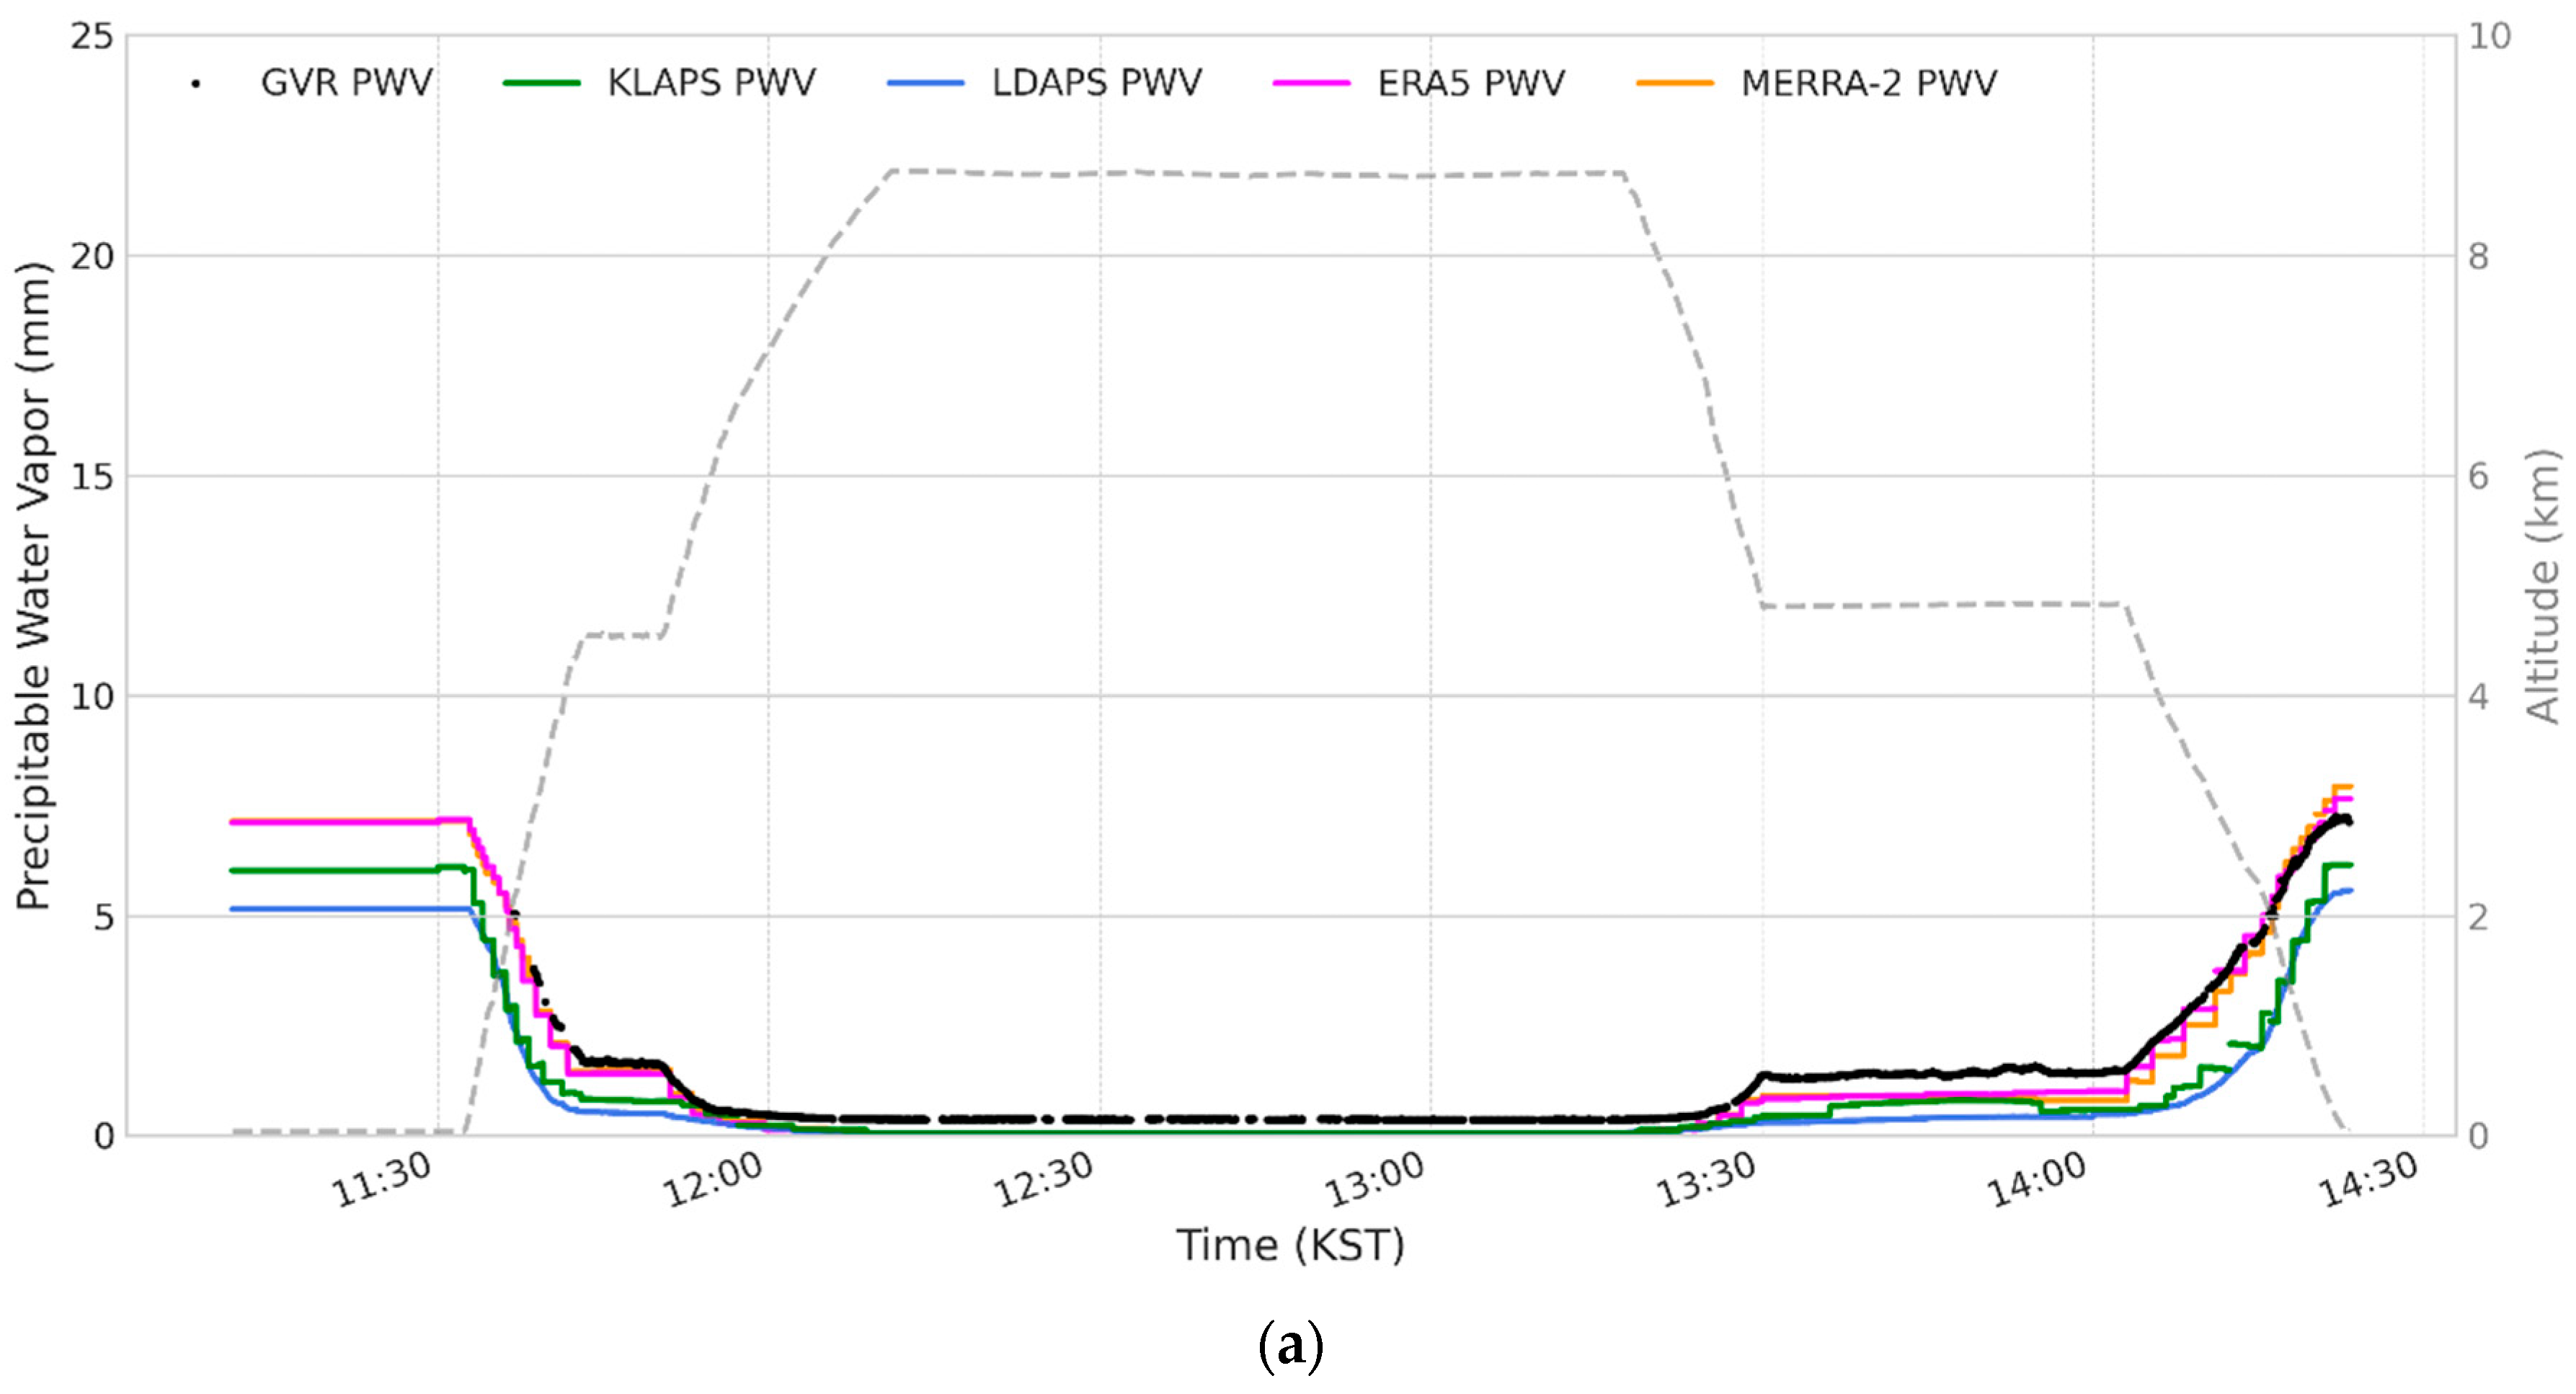
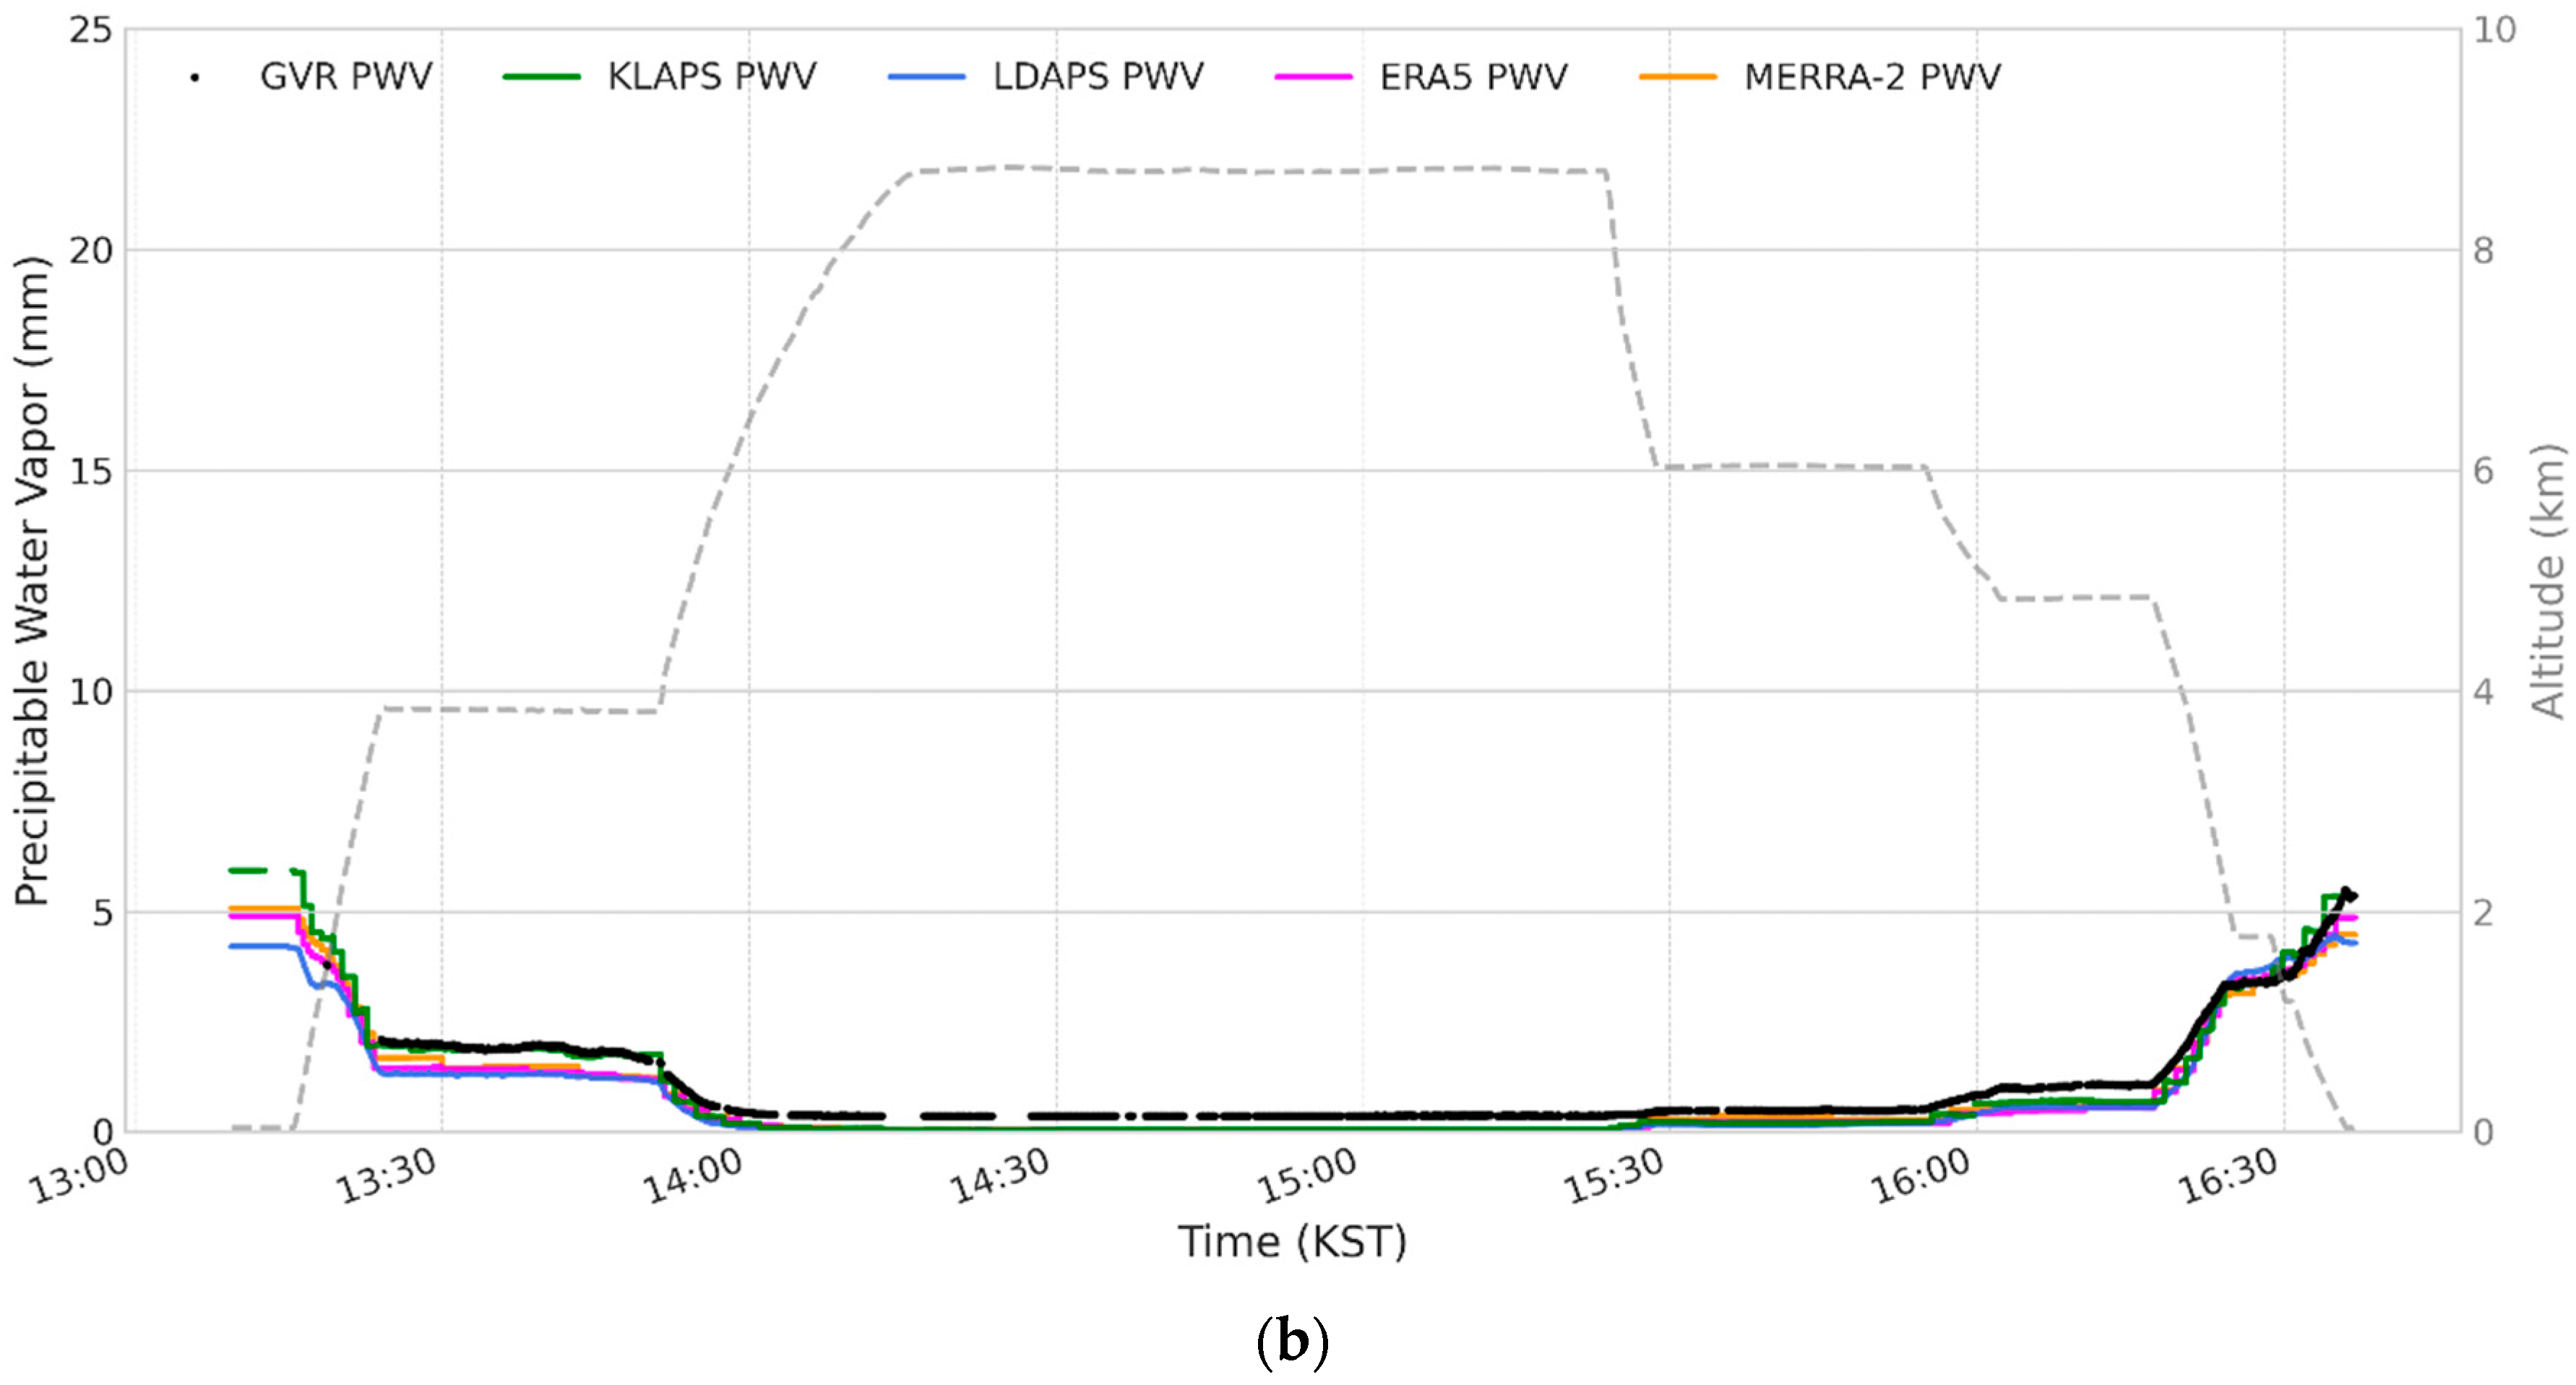
  • Case 1: 18 February 2018: This case occurred under relatively dry atmospheric conditions. During the initial low-altitude flight (around 11:30 KST), all the datasets were consistent with the GVR observations, although LDAPS and KLAPS exhibited slightly lower values, indicating a dry bias (Figure 6a). As the aircraft rapidly ascended to 8.5 km (approximately 11:45–12:10 KST), the PWV decreased sharply and all the datasets simultaneously converged to near zero values, explaining very high consistency. During the subsequent cruising phase at high altitude (approximately 12:10–13:20 KST), ERA5 and MERRA-2 remained closely aligned with the GVR, whereas LDAPS and KLAPS persistently underestimated the PWV. Statistically, ERA5 (r = 1.00, RMSD = 0.36 mm, MB = −0.31 mm) and MERRA-2 (r = 0.99, RMSD = 0.35 mm, MB −0.33 mm) displayed the best performance, whereas LDAPS (−0.76 mm) and KLAPS (−0.63 mm) yielded significant negative biases.
  • Case 2: 24 February 2018: This case was characterized by a coastal frontal system with distinct vertical moisture structures. During the stepwise ascent (13:30–14:30), the observed PWV gradually decreased (Figure 6b). ERA5 and MERRA-2 successfully reproduced this evolution, whereas LDAPS and KLAPS followed the overall trend but consistently underestimated PWV at each step. During the cruise phase at an altitude of 9 km altitude (14:30–15:30), ERA5 and MERRA-2 remained stable, showing good agreement with the GVR, whereas the local models continued to accumulate a dry bias. In terms of statistics, MERRA-2 (r = 0.99, RMSD = 0.4 mm, MB = −0.33 mm) showcased the smallest error, followed by ERA5 (r = 0.99, RMSD = 0.38 mm, MB = −0.35 mm). LDAPS and KLAPS, however, exhibited negative biases of −0.38 mm and −0.24 mm, respectively.
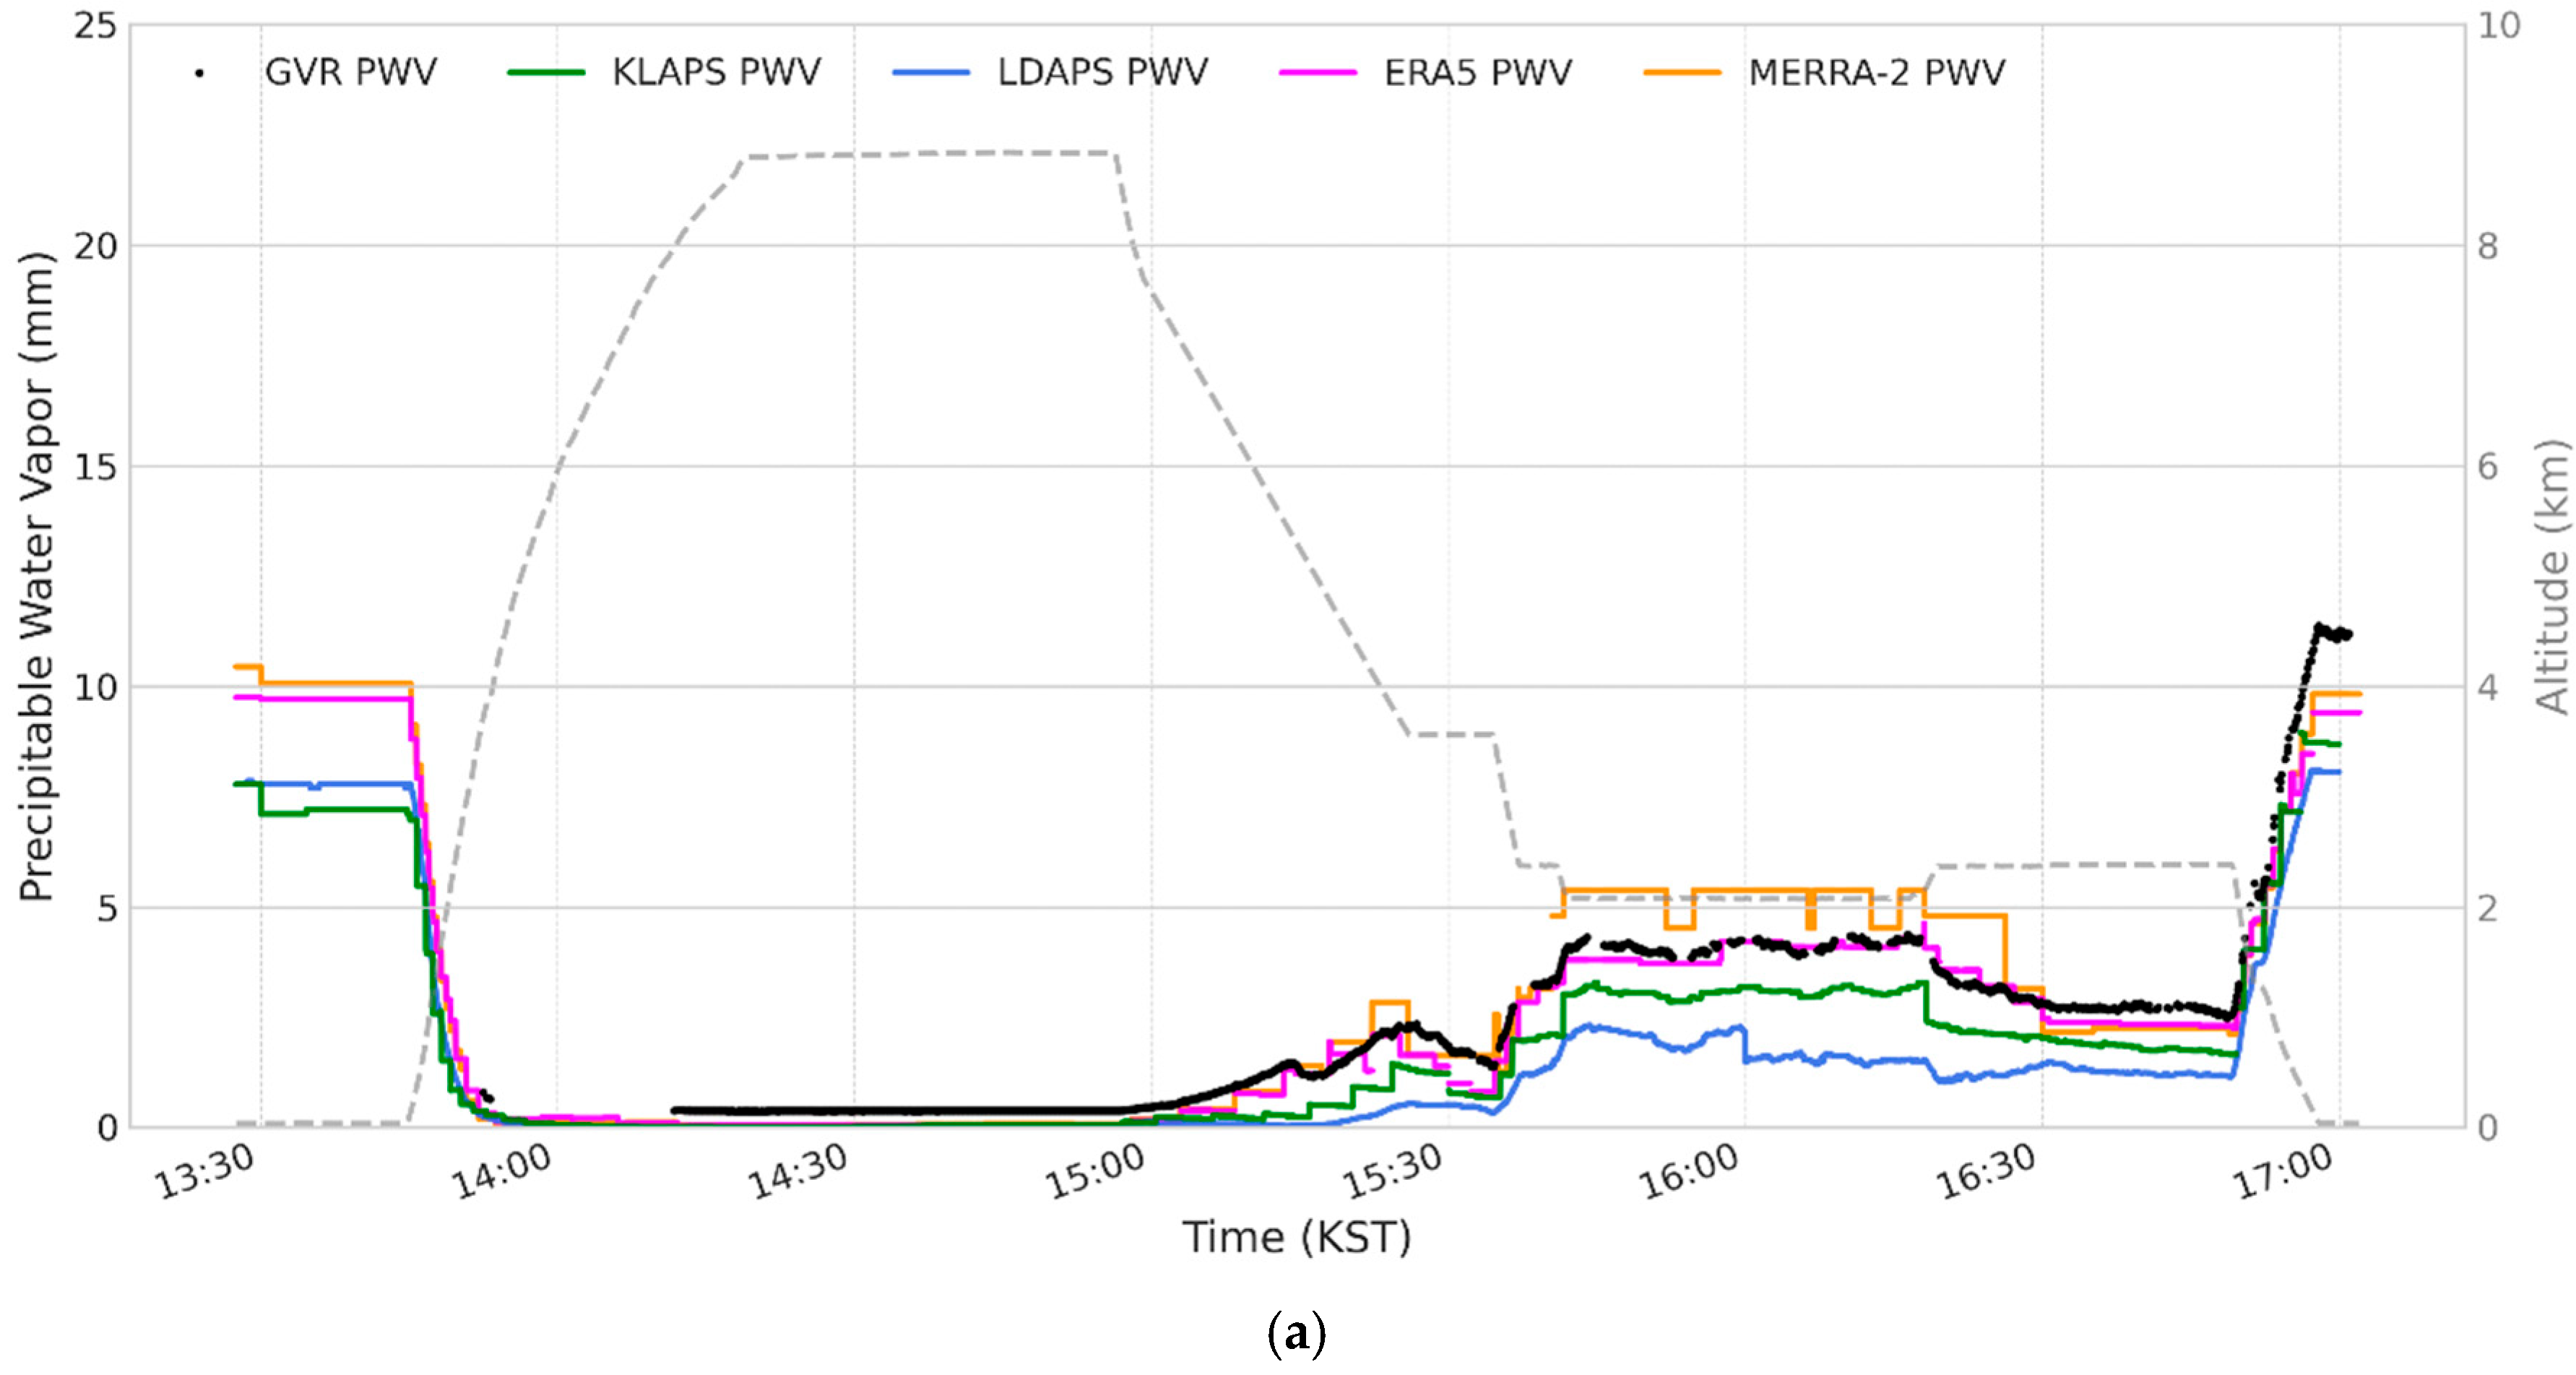
  • Case 3: 8 March 2018: On this day, a widespread low-pressure system produced thick cloud bands over the Korean Peninsula and East Sea. During the rapid ascent through low-level clouds to 9 km (approximately 13:50–14:15 KST), ERA5 accurately reproduced the sharp PWV decrease, and MERRA-2 followed closely but with a slight wet bias (Figure 7a). In contrast, LDAPS and KLAPS substantially underestimated PWV, showing pronounced dry biases. While the aircraft descended through the lower stratiform cloud layer (15:40–16:45 KST), the GVR recorded strong PWV fluctuations. ERA5 reproduced the overall pattern but with smaller amplitudes, whereas MERRA-2 generated larger variations that were closer to the observations. Statistically, ERA5 (r = 0.99, RMSD = 0.49 mm, MB = −0.33 mm) yielded the most accurate results, followed by MERRA-2 (r = 0.95, RMSD = 0.73 mm, MB = 0.02 mm).
  • Case 4: 14 March 2018: This case was dominated by extensive stratiform clouds over the East Sea. The aircraft ascended from the lower cloud layer to a maximum altitude of 9.4 km at 15:05 KST, during which the PWV decreased sharply (Figure 7b). ERA5 and MERRA-2 captured this decrease adequately, whereas LDAPS significantly underestimated it; KLAPS exhibited the largest deviations. In the sharp descent-ascent maneuver (approximately 15:20–16:40 KST), the GVR PWV increased and then decreased rapidly in a V-shaped pattern. ERA5 and MERRA-2 reasonably reproduced this feature; however, LDAPS and KLAPS underestimated the amplitude of variation. Statistically, ERA5 (r = 0.99, RMSD = 1.25 mm, MB −0.68 mm) was the most accurate, followed by MERRA-2 (r = 0.97, RMSD = 1.36 mm, MB = −0.54 mm).
In the February cases (under relatively dry atmospheric conditions), all datasets reproduced the general decrease in PWV with altitude; however, LDAPS and KLAPS consistently exhibited dry biases. In the March cases involving moist and cloudy conditions, ERA5 consistently generated the most reliable results. Overall, ERA5 showcased the most stable and consistent performance across all four cases, whereas MERRA-2, although slightly inferior to ERA5, outperformed the local forecast models. The local models demonstrated strengths in resolving regional details, but exhibited significant limitations in representing upper-level and cloud-layer moisture structures.

3.4. Evaluation of Total Atmospheric Column PWV

To evaluate the accuracy of total atmospheric column PWV, the PWV retrieved from the GVR (representing the upper column above the aircraft) was combined with the PWV from the collocated dropsonde launches (representing the lower column). This composite estimate (hereafter GVR + DROP) was used as the observational reference for the total column PWV. For this evaluation, a total of fourteen flight days were selected from 2018 that featured concurrent dropsonde deployments and GVR operations (Figure 8).
Twelve of these cases were from the ICE-POP 2018 campaign over the East Sea. The remaining two flights were conducted on September 10 and November 30, with dropsondes deployed over the West Sea at an altitude of approximately 4 km. For each dropsonde release, the GVR PWV at the closest time point was selected, and the two components were summed. The scatterplots in Figure 8 illustrate the relationship between the GVR + DROP reference and the four datasets, with Table 4 providing the corresponding statistical summaries. Overall, ERA5 exhibited the strongest correlation with the GVR + DROP reference (r = 0.98 and RMSD = 0.98 mm). MERRA-2 also performed soundly, with r = 0.97 and RMSD = 1.17 mm. These findings are consistent with research in other geographically complex regions, such as the Tibetan Plateau, where ERA5’s higher spatial resolution also led to better performance than MERRA-2 when validated against ground-based observations [26]. In contrast, the regional forecast models showed larger deviations. LDAPS attained r = 0.83 with RMSD = 2.4 mm, whereas KLAPS achieved a similar correlation (r = 0.84) but the largest RMSD (2.8 mm). These results indicate systematic biases and greater uncertainties in the local models than in the reanalysis. A closer inspection of Figure 8 reveals that some discrepancies were concentrated in particular cases, such as those of March 8 and November 30. This highlights the limitation of the local models to capture the full variability of the PWV under complex moist and cloudy conditions.

4. Discussion

This study provides a comprehensive evaluation of the atmospheric PWV over the Korean Peninsula using airborne GVR observations, dropsondes, global reanalysis (ERA5 and MERRA-2), and regional NWP models (LDAPS and KLAPS). The unique experimental setup of ICE-POP 2018, supported by additional flights in September and November, provided a rare opportunity to validate both the upper-tropospheric PWV and total column PWV under diverse meteorological conditions.
A key strength of this study lies in the rigorous QC system developed for the airborne GVR. By applying four independent flags (incomplete calibration blocks, negative brightness temperatures, excessive aircraft pitch/roll, and radio-frequency interference), the dataset ensured that only physically consistent and geometrically reliable measurements were used for analysis. The ability of the GVR to capture fine-scale vertical structures, combined with collocated dropsondes in the lower atmosphere, provided a robust observational benchmark for model evaluation. While ground-based GNSS provides a robust standard for PWV validation over land, its spatial limitation is the primary motivation for this study. Severe weather events impacting the Korean Peninsula are often fueled by moisture transport over the surrounding seas, creating an observational gap where model performance is least constrained. The airborne GVR provides a unique, high-fidelity reference dataset precisely in this critical, data-sparse oceanic region. Its reliability is ensured not only by its real-time self-calibration [7] and superior sensitivity, but also by its strong agreement with co-located dropsonde measurements, as demonstrated in our total column analysis (Section 3.4).
Comparisons with atmospheric reanalysis confirmed that ERA5 consistently outperformed other datasets, exhibiting the smallest RMSD and the lowest biases across both dry and moist cases. MERRA-2, although slightly inferior, reproduced PWV variability with commendable skill, occasionally showing wet or dry biases depending on the meteorological regime. In contrast, the regional models demonstrated larger systematic errors.
A significant finding of this study is the consistently superior performance of the ERA5 global reanalysis over the high-resolution regional models. It is important to clarify that the regional models used here, LDAPS and KLAPS, are not directly forced by ERA5 and operate with their own assimilation systems. Several factors may contribute to ERA5’s superior performance. First, regional models are sensitive to the quality of the lateral boundary conditions (LBCs) provided by their parent global models. Errors in these LBCs can propagate into the regional domain, particularly over the data-sparse oceanic regions surrounding the Korean Peninsula [27,28]. This issue remains a critical factor influencing the performance of modern regional models like the Weather Research and Forecasting (WRF) model [29]. As a global model, ERA5 is not subject to such LBC constraints. Second, differences in data assimilation schemes are crucial. ERA5 benefits from an advanced 4D-Var system that ingests a vast range of global observations [21]. Regional models may employ different algorithms or assimilate a different set of observations, leading to variations in the initial moisture field accuracy. Finally, and perhaps most importantly, the specific physical parameterizations used by the local models are a likely source of the observed dry bias. As specified in Section 2.1.4, the LDAPS (UM) model utilizes the Wilson and Ballard [18] microphysics scheme. This finding is highly consistent with Song et al. [19], who evaluated the exact same LDAPS configuration and found it significantly underestimates “warm-type” (i.e., lower, moister) rainfall while overestimating “cold-type” (high, ice-dominated) rain. This known model behavior directly aligns with the systematic dry bias we observed in moist, cloudy conditions. Similarly, the KLAPS (WRF) model’s bias can be linked to its WDM6 microphysics scheme. While WDM6 is an advanced double-moment scheme, Jang et al. [30] specifically reported limitations of this scheme in simulating winter precipitation over Korea during the exact same ICE-POP 2018 campaign that our data is from. Therefore, the systematic dry bias observed in our study is not an arbitrary error but is likely a direct manifestation of known limitations within the specific microphysics schemes used by these regional models.
A key question raised by this large total column error is whether the systematic bias originates primarily from the upper or lower atmosphere. Our analysis provides strong evidence to answer this. First, the analysis in Section 3.3 (Figure 6 and Figure 7; Table 2 and Table 3), which exclusively evaluated the upper column (GVR layer), already confirmed a significant systematic dry bias in the local NWP models. Second, the total column analysis in Section 3.4 (Figure 8; Table 4) shows this bias becomes even larger (e.g., RMSD of 2.40–2.80 mm for LDAPS/KLAPS). As clearly shown in Table 4, the lower-column PWV measured by the dropsonde is the dominant component of the total PWV (often accounting for >90% of the total value). Therefore, given that a significant dry bias is already confirmed in the upper layers, the only way for the total column bias to be this large is if the models are also substantially underestimating the dominant, lower-layer moisture. We conclude that the systematic dry bias in the local models is a pervasive issue present in both the upper and lower troposphere, but that the largest absolute contribution (i.e., the primary source in magnitude) to the total PWV error originates from the lower column.
Our finding that ERA5 provides the most robust PWV representation aligns with a growing body of literature that highlights its superior performance in various regions. For instance, Huang et al. [26], using GNSS data over the Tibetan Plateau, also concluded that ERA5 offered more reliable hourly PWV estimates than other reanalysis products, attributing its success to higher spatial resolution and an advanced assimilation system [2]. Similarly, studies in Europe and North America have consistently demonstrated ERA5’s high fidelity in capturing atmospheric moisture when validated against radiosondes and ground-based remote sensing instruments [31]. Our results extend these findings to the complex meteorological environment of the Korean Peninsula, confirming ERA5’s utility as a high-quality benchmark dataset even when compared against high-resolution regional models. The systematic dry bias observed in the LDAPS and KLAPS models, particularly under moist and cloudy conditions, is a recurring challenge noted in regional NWP systems elsewhere. Studies evaluating regional models have often reported difficulties in accurately representing the moisture field, frequently attributing such biases to inadequacies in cloud microphysics or convection parameterization schemes [32]. This aligns with findings from Maurya et al. [33], which demonstrated that humidity-related biases in regional models are highly sensitive to horizontal resolution, with higher resolution settings not always yielding better results and sometimes leading to an underestimation of moisture transport.
It is also important to address the issue of observational representativeness when comparing our airborne data with model outputs. The GVR and dropsonde provide instantaneous, “along-track” measurements (a point or a line), whereas the models provide hourly averaged values over a “grid-cell area” (e.g., 1.5 km to 25 km). This fundamental “point-to-area” mismatch is an inherent source of representativeness error and undoubtedly contributes to the overall scatter (RMSD) in our comparisons. This effect may be particularly amplified in the meteorologically dynamic and high-gradient coastal zones targeted by our flights. However, while representativeness error can introduce non-systematic (random) noise, the systematic dry bias we consistently observed in the regional models (LDAPS and KLAPS)—especially in moist, cloudy regimes—is unlikely to be a simple artifact of this mismatch. Such a persistent, one-sided bias is more indicative of a true systematic limitation in the models’ physical parameterizations or data assimilation schemes.
This study has some limitations. Observational campaigns were primarily conducted during winter as part of the ICE-POP 2018 experiment. Consequently, the findings, particularly the systematic dry biases in the local models, may not be fully representative of other seasons, such as the hot and humid Korean summer, which is characterized by different moisture transport mechanisms. Furthermore, the GVR and dropsonde data were collected along specific flight paths, which, although scientifically targeted, did not provide continuous spatial coverage of a ground-based network. Future studies incorporating observations from different seasons are needed to build a more comprehensive understanding of year-round model performance.
From a broader perspective, these findings underscore the complementary roles of global atmospheric reanalysis and regional forecast systems. Atmospheric reanalysis provides stable and consistent long-term moisture fields, whereas local models offer higher spatial detail but require improved parameterization to reduce systematic biases. Importantly, this study demonstrates the scientific value of airborne radiometer observations. The GVR filled observational gaps over the oceanic and upper-atmospheric domains, bridged ground-based GNSS networks and satellite retrievals, and provided critical reference data for model validation.

5. Conclusions

This study performed a comprehensive validation of the reanalysis and NWP PWV products over the Korean Peninsula, utilizing a unique airborne dataset from the ICE-POP 2018 campaign. By integrating observations from a G-band Water Vapor Radiometer (GVR) and co-located dropsondes, underpinned by a rigorous multi-stage QC system, we successfully provided a robust observational benchmark in the critical, data-sparse oceanic regions.
The main finding is that the ERA5 global reanalysis provides the most accurate and reliable representation of both upper-air and total column PWV (r = 0.98, RMSD = 0.98 mm for total column). In stark contrast, the high-resolution local NWP models (LDAPS and KLAPS) exhibit a significant systematic dry bias, with substantially larger errors (RMSD 2.4–2.8 mm), particularly in moist and cloudy regimes.
Our analysis links this systematic dry bias directly to the models’ specific physical parameterizations. The LDAPS (UM) model utilizes the Wilson and Ballard (1999) microphysics scheme, which, as noted in previous studies [18], is known to underestimate “warm-type” (lower, moister) rainfall common to the region. Similarly, the KLAPS (WRF) model’s WDM6 scheme has documented limitations in simulating winter precipitation over Korea during the exact same ICE-POP 2018 campaign [30].
Furthermore, by synthesizing our upper-column (GVR-only) and total-column (GVR + dropsonde) analyses, we determined that while the dry bias is a pervasive issue in both the upper and lower troposphere, the largest absolute contribution to the total PWV error originates from the lower column (below the aircraft’s flight level), where the vast majority of the moisture resides.
These findings establish ERA5 as a more reliable benchmark for water vapor analysis over Korea than the higher-resolution local models. They highlight a clear need to improve the humidity assimilation and, most critically, the microphysical parameterizations within the regional NWP systems. Sustained airborne measurement efforts, as demonstrated in this study, are crucial for identifying these specific model limitations and advancing the forecasting of water-vapor-driven weather events.
Future studies should expand on these findings. This validation was primarily conducted during winter; therefore, further airborne campaigns are needed during the hot and humid Korean summer to investigate whether the systematic dry bias in local models persists during different moisture transport mechanisms. Furthermore, sensitivity experiments could be designed to quantify the direct impact of this PWV bias on the accuracy of precipitation forecasts and to pinpoint the specific physical parameterizations, such as cloud microphysics, responsible for the observed errors.

Author Contributions

Conceptualization, M.-S.K.; methodology, M.-S.K.; formal analysis, M.-S.K.; validation, M.-S.K.; investigation, M.-S.K.; visualization, M.-S.K.; writing—original draft preparation, M.-S.K.; writing—review and editing, M.-S.K.; supervision, M.-S.K.; project administration, T.-Y.G.; funding acquisition, T.-Y.G. All authors have read and agreed to the published version of the manuscript.

Funding

This work was funded by the Korea Meteorological Administration Research and Development Program “Development of Application Technology on Atmospheric Research Aircraft” under Grant (KMA2018-00222).

Institutional Review Board Statement

Not applicable.

Informed Consent Statement

Not applicable.

Data Availability Statement

The reanalysis data, namely, the ERA5 and MERRA-2 products, were provided by the ECMWF (https://cds.climate.copernicus.eu/datasets/reanalysis-era5-single-levels?tab=overview, accessed on 20 November 2025) and NASA (https://gmao.gsfc.nasa.gov/gmao-products/merra-2/data-access_merra-2/, accessed on 20 November 2025), respectively. The KLAPS and LDAPS model outputs are available at the KMA open MET Data Portal (https://data.kma.go.kr/resources/html/en/aowdp.html; last access: 10 April 2025).

Acknowledgments

We would like to thank the editor and the anonymous reviewers for their comments, which helped to substantially improve this manuscript.

Conflicts of Interest

The authors have no conflict of interests to declare.

References

  1. Kalogiros, J.; Wang, Q. Aircraft Observations of Sea-Surface Turbulent Fluxes Near the California Coast. Bound.-Layer Meteorol. 2011, 139, 283–306. [Google Scholar] [CrossRef]
  2. Yoshida, S.; Sakai, T.; Nagai, T.; Seko, H.; Kato, T.; Shiraishi, K.; Shimizu, S. Observation of a slanted moisture structure with weak updraft leading to localized heavy rainfalls. Sci. Rep. 2025, 15, 22979. [Google Scholar] [CrossRef]
  3. Noh, E.; Kim, J.; Jun, S.Y.; Cha, D.H.; Park, M.S.; Kim, J.H.; Kim, H.G. The Role of the Pacific-Japan Pattern in Extreme Heatwaves Over Korea and Japan. Geophys. Res. Lett. 2021, 48, e2021GL093990. [Google Scholar] [CrossRef]
  4. Li, H.; Choy, S.; Wang, X.; Liang, H.; Purwar, S.; Zhang, K. Investigating the Optimal Spatial Resolution for Assimilating GNSS PWV Into an NWP System to Improve the Accuracy of Humidity Field. IEEE J. Sel. Top. Appl. Earth Obs. Remote Sens. 2023, 16, 6876–6888. [Google Scholar] [CrossRef]
  5. Xian, T.; Su, K.; Zhang, J.; Hu, H.; Wang, H. Precipitable Water Vapor Retrieval Based on GNSS Data and Its Application in Extreme Rainfall. Remote Sens. 2025, 17, 2301. [Google Scholar] [CrossRef]
  6. Vaquero-Martínez, J.; Antón, M. Review on the Role of GNSS Meteorology in Monitoring Water Vapor for Atmospheric Physics. Remote Sens. 2021, 13, 2287. [Google Scholar] [CrossRef]
  7. Pazmany, A.L. A compact 183-GHz radiometer for water vapor and liquid water sensing. IEEE Trans. Geosci. Remote Sens. 2007, 45, 2202–2206. [Google Scholar] [CrossRef]
  8. Wang, Z.; French, J.; Vali, G.; Wechsler, P.; Haimov, S.; Rodi, A.; Deng, M.; Leon, D.; Snider, J.; Peng, L.; et al. Single Aircraft Integration of Remote Sensing and In Situ Sampling for the Study of Cloud Microphysics and Dynamics. Bull. Am. Meteorol. Soc. 2012, 93, 653–668. [Google Scholar] [CrossRef]
  9. Wang, W.; Pazmany, A.; Lei, H.-C.; Chen, C.; Nie, H.-H.; Zuo, D.-F. Measurement of supercooled liquid water path in cold clouds based on a 183GHz airborne microwave radiometer. Atmos. Res. 2023, 285, 106655. [Google Scholar] [CrossRef]
  10. Kim, J.-H.; Goo, T.-Y.; Jung, S.-P.; Kim, M.-S.; Lee, K.; Kang, M.; Lee, C.; Yang, J.; Hong, S.; Ko, H.; et al. Overview of the KMA/NIMS Atmospheric Research Aircraft (NARA) and its data archive: Annual airborne observations over the Korean peninsula. Wiley Online Libr. 2022, 10, 447–460. [Google Scholar] [CrossRef]
  11. Kim, M.S.; Kwon, B.H.; Goo, T.Y.; Jung, S.P. Dropsonde-Based Heat Fluxes and Mixed Layer Height over the Sea Surface near the Korean Peninsula. Remote Sens. 2022, 15, 25. [Google Scholar] [CrossRef]
  12. Bernstein, B.; DiVito, S.; Riley, J.T.; Landolt, S.; Haggerty, J.; Thompson, G.; Adriaansen, D.; Serke, D.; Kessinger, C.; Tessendorf, S.; et al. The In-Cloud Icing and Large-Drop Experiment Science and Operations Plan; United States. Department of Transportation. Federal Aviation Administration. William J. Hughes Technical Center: Washington, DC, USA, 2021. [Google Scholar]
  13. Zuo, D.; Liu, D.; Zhao, D.; Yang, L.; Chen, Y.; Zhou, W.; Huang, M.; He, H.; Tian, P.; Du, Y.; et al. Liquid water determination by airborne millimeter cloud radar and in-situ size distribution measurements. Atmos. Res. 2023, 284, 106607. [Google Scholar] [CrossRef]
  14. Fionda, E.; Cadeddu, M.; Mattioli, V.; Pacione, R. Intercomparison of Integrated Water Vapor Measurements at High Latitudes from Co-Located and Near-Located Instruments. Remote Sens. 2019, 11, 2130. [Google Scholar] [CrossRef]
  15. Triana-Gómez, A.M.; Heygster, G.; Melsheimer, C.; Spreen, G.; Negusini, M.; Petkov, B.H. Improved water vapour retrieval from AMSU-B and MHS in the Arctic. Atmos. Meas. Tech. 2020, 13, 3697–3715. [Google Scholar] [CrossRef]
  16. Hwang, B.H.; Yoo, S.; Chang, E.C.; Tapiador, F.J.; Kim, K.; Lee, G.W. Classification and Key Factors for the Snowfall over the Eastern Part of the Korean Peninsula. Asia-Pacific J. Atmos. Sci. 2025, 61, 15. [Google Scholar] [CrossRef]
  17. Lock, A.P.; Brown, A.R.; Bush, M.R.; Martin, G.M.; Smith, R.N.B. A New Boundary Layer Mixing Scheme. Part I: Scheme Description and Single-Column Model Tests. Mon. Weather Rev. 2000, 128, 3187–3199. [Google Scholar] [CrossRef]
  18. Wilson, D.R.; Ballard, S.P. A microphysically based precipitation scheme for the UK meteorological office unified model. Q. J. R. Meteorol. Soc. 1999, 125, 1607–1636. [Google Scholar] [CrossRef]
  19. Song, H.J.; Lim, B.; Joo, S. Evaluation of Rainfall Forecasts with Heavy Rain Types in the High-Resolution Unified Model over South Korea. Weather Forecast. 2019, 34, 1277–1293. [Google Scholar] [CrossRef]
  20. Jee, J.B.; Kim, S. Sensitivity Study on High-Resolution WRF Precipitation Forecast for a Heavy Rainfall Event. Atmosphere 2017, 8, 96. [Google Scholar] [CrossRef]
  21. Hersbach, H.; Bell, B.; Berrisford, P.; Hirahara, S.; Horányi, A.; Muñoz-Sabater, J.; Nicolas, J.; Peubey, C.; Radu, R.; Schepers, D.; et al. The ERA5 global reanalysis. Q. J. R. Meteorol. Soc. 2020, 146, 1999–2049. [Google Scholar] [CrossRef]
  22. Gelaro, R.; McCarty, W.; Suárez, M.J.; Todling, R.; Molod, A.; Takacs, L.; Randles, C.A.; Darmenov, A.; Bosilovich, M.G.; Reichle, R.; et al. The modern-era retrospective analysis for research and applications, version 2 (MERRA-2). J. Clim. 2017, 30, 5419–5454. [Google Scholar] [CrossRef]
  23. George, G.; Stevens, B.; Bony, S.; Klingebiel, M.; Vogel, R. Observed Impact of Mesoscale Vertical Motion on Cloudiness. J. Atmos. Sci. 2021, 78, 2413–2427. [Google Scholar]
  24. Iassamen, A.; Sauvageot, H.; Jeannin, N.; Ameur, S. Distribution of Tropospheric Water Vapor in Clear and Cloudy Conditions from Microwave Radiometric Profiling. J. Appl. Meteorol. Climatol. 2009, 48, 600–615. [Google Scholar] [CrossRef]
  25. Zuidema, P.; Leon, D.; Pazmany, A.; Cadeddu, M. Aircraft millimeter-wave passive sensing of cloud liquid water and water vapor during VOCALS-REx. Atmos. Chem. Phys. 2012, 12, 355–369. [Google Scholar] [CrossRef]
  26. Huang, L.; Mo, Z.; Liu, L.; Zeng, Z.; Chen, J.; Xiong, S.; He, H. Evaluation of Hourly PWV Products Derived from ERA5 and MERRA-2 Over the Tibetan Plateau Using Ground-Based GNSS Observations by Two Enhanced Models. Earth Sp. Sci. 2021, 8, e2020EA001516. [Google Scholar] [CrossRef]
  27. Davies, H.C. Limitations of Some Common Lateral Boundary Schemes used in Regional NWP Models. Mon. Weather Rev. 1983, 111, 1002–1012. [Google Scholar] [CrossRef]
  28. Warner, T.T.; Peterson, R.A.; Treadon, R.E. A Tutorial on Lateral Boundary Conditions as a Basic and Potentially Serious Limitation to Regional Numerical Weather Prediction. Bull. Am. Meteorol. Soc. 1997, 78, 2599–2618. [Google Scholar] [CrossRef]
  29. Skamarock, W.C.; Klemp, J.B.; Dudhia, J.; Gill, D.O.; Barker, D.M.; Duda, M.G.; Huang, X.-Y.; Wang, W.; Powers, J.G. A description of the advanced research WRF version 4. NCAR Tech. Note Ncar/Tn-556+ Str 2019, 145. [Google Scholar]
  30. Jang, S.; Lim, K.S.S.; Ko, J.; Kim, K.; Lee, G.; Cho, S.J.; Ahn, K.D.; Lee, Y.H. Revision of WDM7 Microphysics Scheme and Evaluation for Precipitating Convection over the Korean Peninsula. Remote Sens. 2021, 13, 3860. [Google Scholar] [CrossRef]
  31. Wang, S.; Xu, T.; Nie, W.; Jiang, C.; Yang, Y.; Fang, Z.; Li, M.; Zhang, Z. Evaluation of Precipitable Water Vapor from Five Reanalysis Products with Ground-Based GNSS Observations. Remote Sens. 2020, 12, 1817. [Google Scholar] [CrossRef]
  32. Morrison, H.; van Lier-Walqui, M.; Fridlind, A.M.; Grabowski, W.W.; Harrington, J.Y.; Hoose, C.; Korolev, A.; Kumjian, M.R.; Milbrandt, J.A.; Pawlowska, H.; et al. Confronting the challenge of modeling cloud and precipitation microphysics. J. Adv. Model. Earth Syst. 2020, 12, e2019MS001689. [Google Scholar] [CrossRef] [PubMed]
  33. Maurya, R.K.S.; Sinha, P.; Mohanty, M.R.; Mohanty, U.C. RegCM4 model sensitivity to horizontal resolution and domain size in simulating the Indian summer monsoon. Atmos. Res. 2018, 210, 15–33. [Google Scholar] [CrossRef]
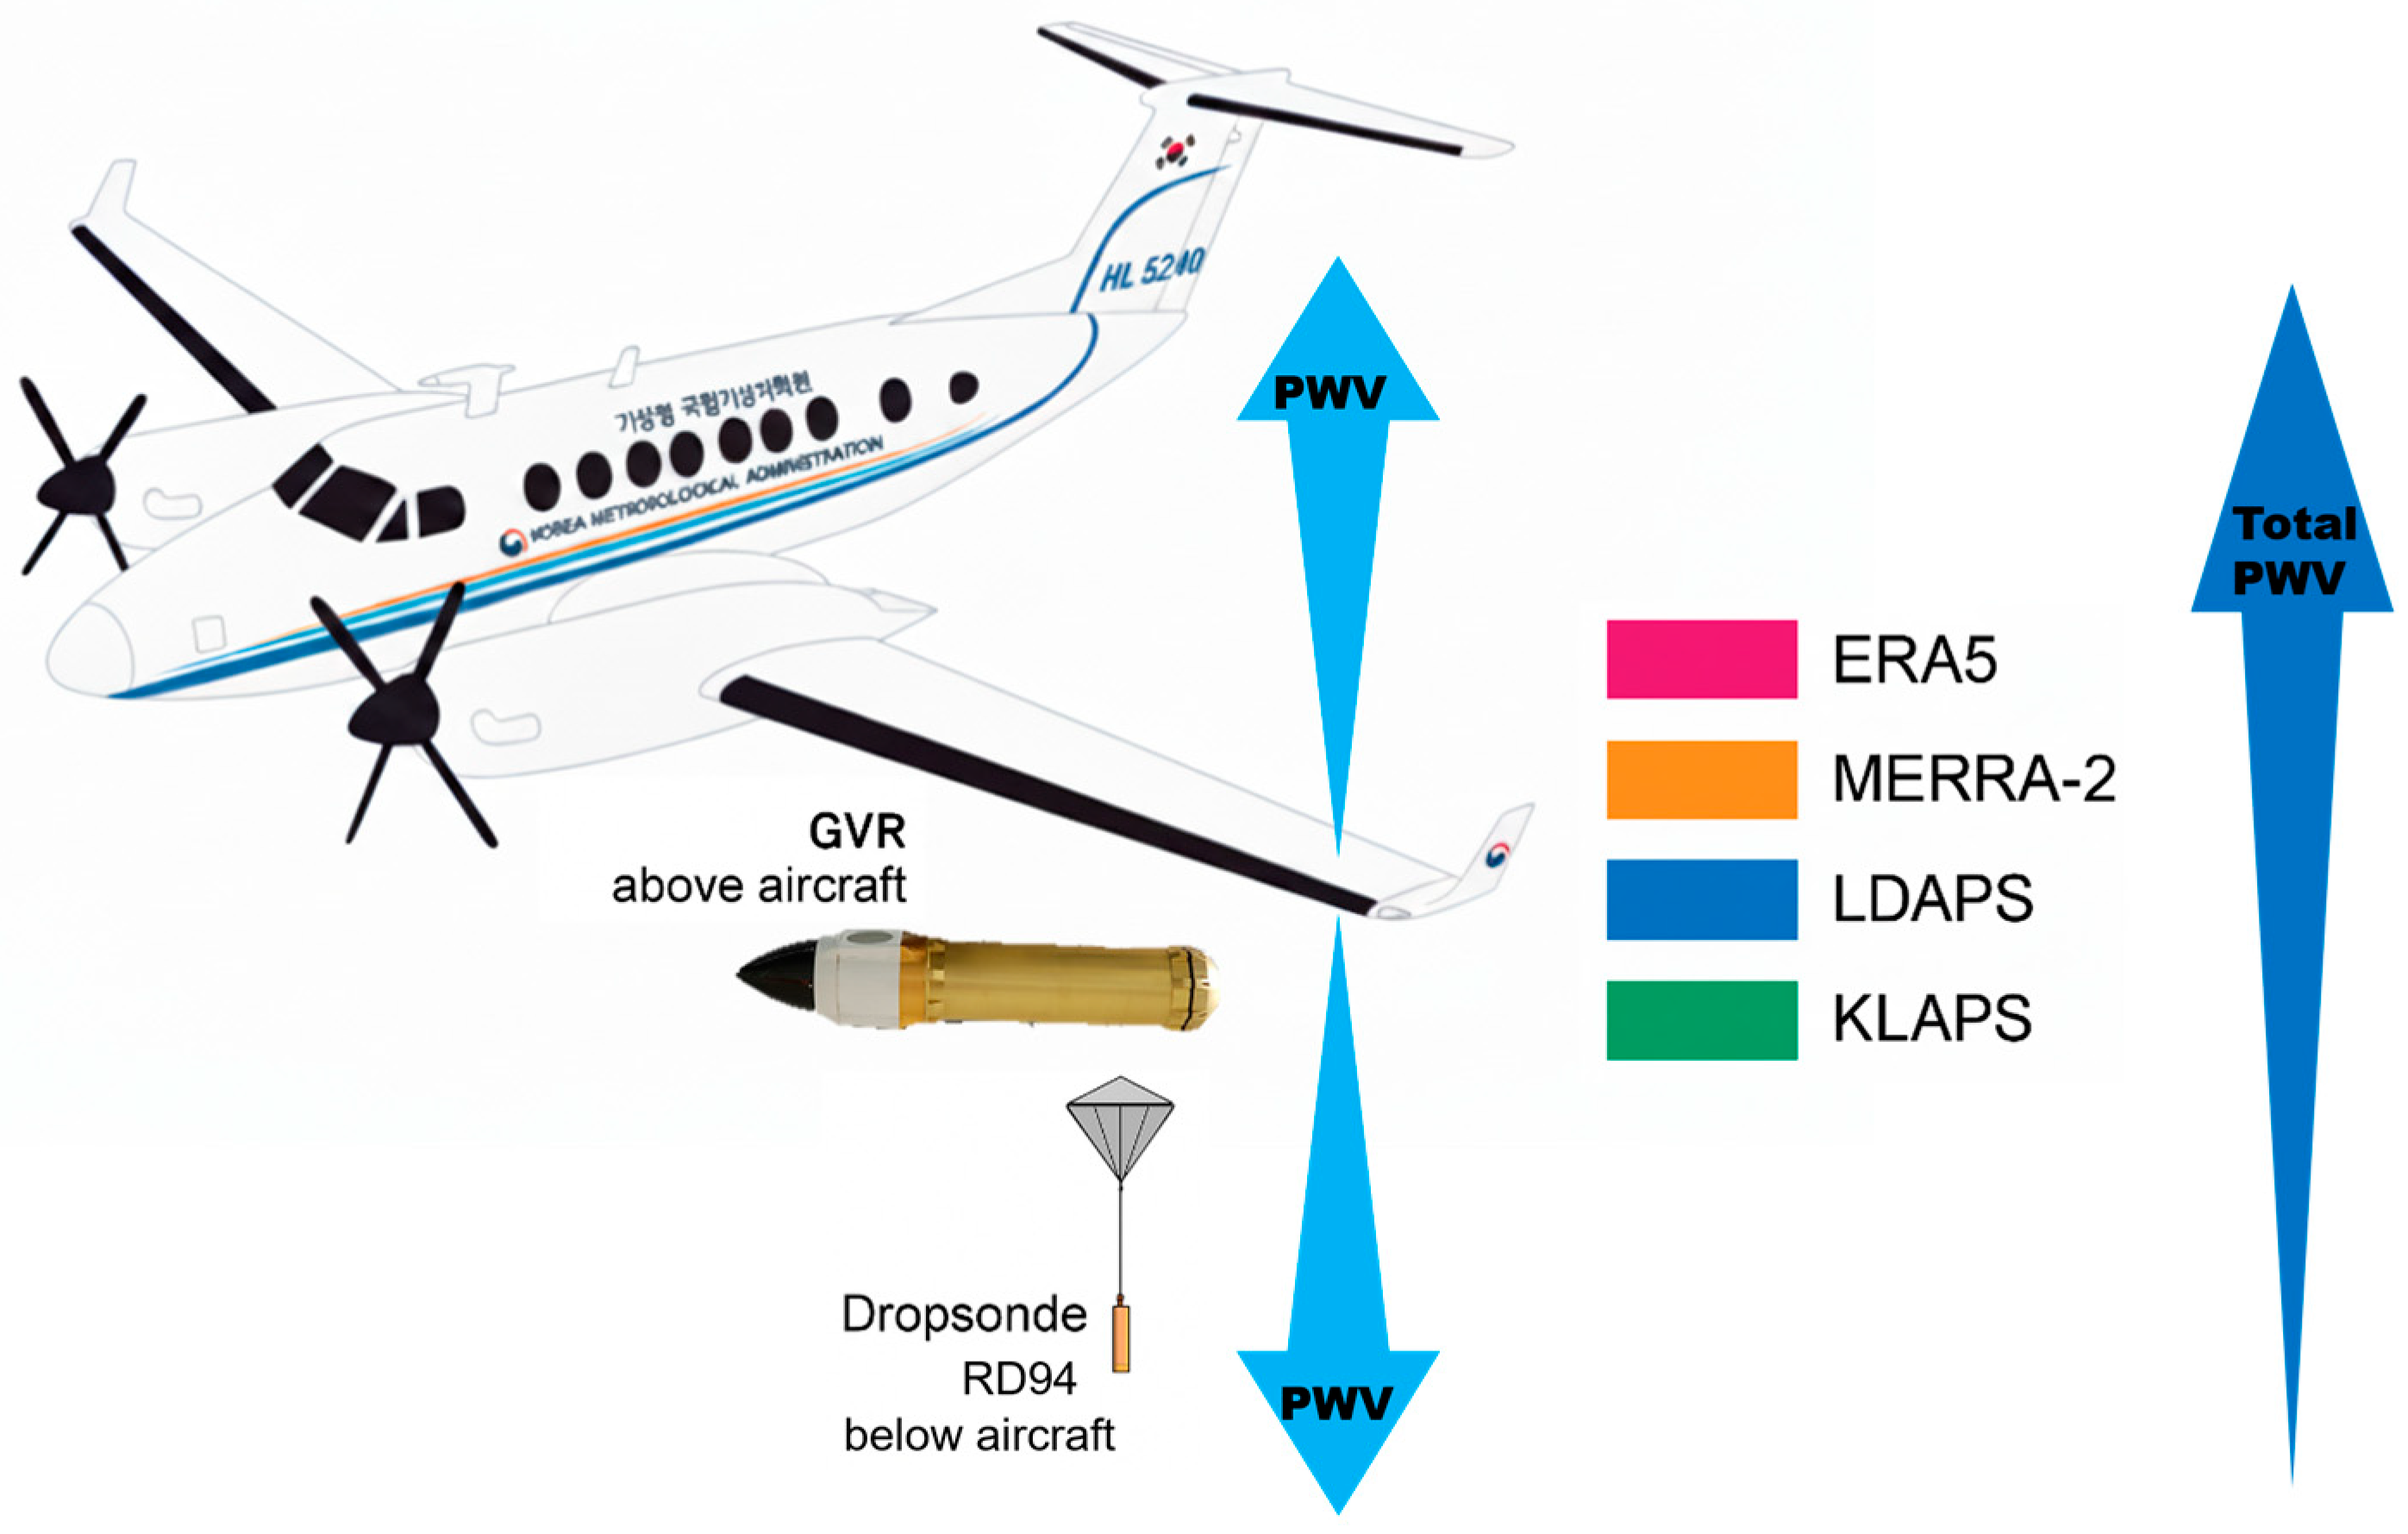
Figure 1. Schematic of the National Institute of Meteorological Sciences (NIMS) King Air 350HW aircraft with the G-band Water Vapor Radiometer (GVR) and RD94 dropsonde for PWV observations, in comparison with ERA5, MERRA-2, LDAPS, and KLAPS datasets. The upward and downward blue arrows represent the PWV observed by the GVR (above the aircraft) and the dropsonde (below the aircraft), respectively. The Total PWV is calculated by summing these two components. (Note: The Korean text on the aircraft fuselage reads ‘National Institute of Meteorological Sciences’).
Remotesensing 17 03788 g001
Figure 2. Flight paths of the National Institute of Meteorological Sciences (NIMS) NIMS Atmospheric Research Aircraft (NARA), colored by altitude (m), overlaid on COMS visible satellite imagery at 15:00 KST for the four observational case studies: (a) 18 February 2018; (b) 24 February 2018; (c) 8 March 2018; and (d) 14 March 2018.
Remotesensing 17 03788 g002
Figure 3. Time series of G-band Water Vapor Radiometer (GVR) Precipitable Water Vapor (PWV; blue circles, left y-axis), aircraft altitude (black line, right y-axis), and the corresponding quality control (QC) flag counts for the four case studies: (a) 18 February 2018; (b) 24 February 2018; (c) 8 March 2018; and (d) 14 March 2018. The legend indicates the total number of valid GVR PWV points and the count for each QC flag.
Remotesensing 17 03788 g003
Figure 4. Time series of the G-band Water Vapor Radiometer (GVR) channel difference signal (PW − PS; y-axis) and flight altitude (gray line, right y-axis) for the four case studies: (a) 18 February 2018; (b) 24 February 2018; (c) 8 March 2018; and (d) 14 March 2018. The PW − PS difference is a measure of the raw atmospheric signal, which is inversely proportional to water vapor. The legend indicates the four GVR frequency channels and periods (yellow circles) identified as “In-Cloud” by the Cloud Combination Probe (CCP) instrument.
Remotesensing 17 03788 g004
Figure 5. Scatter plots of G-band Water Vapor Radiometer (GVR)-retrieved Precipitable Water Vapor (PWV; y-axis) versus the raw channel difference signal (PW − PS; x-axis) for the four case studies: (a) 18 February 2018; (b) 24 February 2018; (c) 8 March 2018; and (d) 14 March 2018. Each panel shows the unique nonlinear relationship for the four different frequency channels, validating the instrument’s measurement principle.
Remotesensing 17 03788 g005aRemotesensing 17 03788 g005b
Figure 6. Time series comparison of G-band Water Vapor Radiometer (GVR)-observed upper-column Precipitable Water Vapor (PWV; y-axis) with corresponding values from the KLAPS, LDAPS, ERA5, and MERRA-2 models for the two February case studies: (a) 18 February 2018 and (b) 24 February 2018. The gray dashed line indicates the aircraft flight altitude.
Remotesensing 17 03788 g006aRemotesensing 17 03788 g006b
Figure 7. Time series comparison of G-band Water Vapor Radiometer (GVR)-observed upper-column Precipitable Water Vapor (PWV; y-axis) with corresponding values from the KLAPS, LDAPS, ERA5, and MERRA-2 models for the two March case studies: (a) 8 March 2018 and (b) 14 March 2018. The gray dashed line indicates the aircraft flight altitude.
Remotesensing 17 03788 g007aRemotesensing 17 03788 g007b
Figure 8. Scatter plots comparing the total atmospheric column Precipitable Water Vapor (PWV) from the G-band Water Vapor Radiometer (GVR) + dropsonde composite reference (x-axis) against the corresponding values from (a) ERA5, (b) MERRA-2, (c) LDAPS, and (d) KLAPS (y-axis). The dashed line represents the 1:1 line of perfect agreement. The blue cross (+) symbols represent individual data points, and the adjacent numbers indicate the specific case numbers corresponding to the data listed in Table 4.
Remotesensing 17 03788 g008
Table 1. G-band Water Vapor Radiometer (GVR) specification.
ParametersSpecification
Frequency183.31 ± 1, 183.3 ± 3, 183.3 ± 7, 183.3 ± 14 GHz
Bandwidth0.5 (1), 1.0 (3), 1.4 (7) and 2.0 (14) GHz
∆T0.2 K @ 200 msec integration (5 Hz data rate)
T r e c e i v e r 1750 K (1), 1610 K (3), 1600 K (7) and 2170 K (14)
Data rate0.1–20 Hz with periodic calibration
Antenna Type4″ offset reflector, 2 degree beam width
RadomeSurface matched TPX window
Weight10 kg without canister
Power28 WAC, 28 VDC
Note: Numbers in parentheses indicate the frequency offset (in GHz) from the center frequency.
Table 2. Statistical evaluation of the upper-column Precipitable Water Vapor (PWV) for the February 2018 cases, showing metrics before and after QC application (r, correlation coefficient; RMSD, Root Mean Square Deviation).
NumberrRMSD (mm)Mean Bias (mm)
18 February24 February18 February24 February18 February24 February18 February24 February
ERA51769

1514
2055

1730
0.62 → 1.000.53 → 0.992.16 → 0.362.31 → 0.38−0.39 → −0.31−0.46 → −0.35
MERRA20.62 → 0.990.55 → 0.992.18 → 0.352.29 → 0.40−0.40 → −0.33−0.43 → −0.33
LDAPS0.59 → 0.950.51 → 0.982.44 → 0.972.35 → 0.42−0.86 → −0.76−0.49 → −0.38
KLAPS0.59 → 0.960.55 → 0.992.37 → 0.812.25 → 0.30−0.73 → −0.63−0.34 → −0.24
Table 3. Statistical evaluation of the upper-column Precipitable Water Vapor (PWV) for the March 2018 cases, showing metrics before and after QC application (r, correlation coefficient; RMSD, Root Mean Square Deviation).
NumberrRMSD (mm)Mean Bias (mm)
8 March14 March 8 March14 March8 March14 March8 March14 March
ERA51722 → 14571576

1313
0.70 → 0.990.86 → 0.992.34 → 0.492.79 → 1.25−0.49 → −0.33−0.81 → −0.68
MERRA20.66 → 0.950.84 → 0.972.40 → 0.732.83 → 1.36−0.12 → 0.02−0.64 → −0.54
LDAPS1712 → 14470.67 → 0.960.84 → 0.972.83 → 1.482.72 → 1.10−1.49 → −1.230.02 → 0.10
KLAPS0.67 → 0.990.86 → 0.982.53 → 0.873.35 → 2.27−0.97 → −0.761.26 → 1.21
Table 4. Total Precipitable Water Vapor (PWV) values from the G-band Water Vapor Radiometer (GVR) + dropsonde composite and corresponding model/reanalysis data.
DateTime
(LST)
GVR
(mm)
Dropsonde
(mm)
ERA5
(mm)
MERRA2
(mm)
LDAPS
(mm)
KLAPS
(mm)
2 February 201805:010.3505.66.25.94.76.1
05:050.3596.46.46.25.15.1
05:100.3606.36.064.96.3
05:150.3608.16.57.43.85.2
05:260.3607.85.96.34.45.4
05:360.3626.36.16.35.25.4
06:010.3597.35.76.93.96.8
06:060.3588.16.27.34.06.4
06:110.3588.25.97.34.46.4
06:160.3608.66.16.14.66.3
5 February 201815:510.3573.93.64.02.93.9
6 February 201805:140.3584.23.85.23.54.4
05:190.3584.43.95.44.04.4
06:110.3604.44.05.43.94.6
7 February 201805:300.3624.64.85.44.04.3
05:340.3634.94.85.43.64.2
05:400.3634.44.75.23.14.2
18 February 201803:150.3716.56.76.95.25.8
03:190.3716.16.66.95.25.7
03:230.3726.26.66.85.05.8
03:270.3736.26.77.04.95.9
03:310.3727.06.77.55.16.0
03:350.3747.76.77.55.26.1
03:390.3725.86.67.54.85.7
03:430.3757.96.47.05.05.5
03:470.3707.16.67.55.05.7
03:510.3728.06.67.65.35.9
03:550.3707.56.36.86.55.7
04:030.3707.76.67.65.85.7
04:070.3686.36.87.64.95.9
04:150.3717.46.66.95.25.9
20 February 201802:430.3745.054.55.45.1
02:470.3705.354.54.54.8
02:510.3724.14.64.53.74.7
02:550.3754.24.53.73.74.9
02:590.3694.04.84.83.94.7
03:030.3672.84.94.54.75.1
03:070.3756.954.54.85.3
03:110.3773.94.84.53.95.1
03:150.3744.34.74.23.65.4
03:190.3724.44.84.24.05.3
03:230.3745.24.954.25.3
03:270.3744.9554.35.5
03:310.3724.2554.15.3
03:350.3733.1554.05.4
03:390.3745.254.23.85.7
03:430.3744.64.84.23.95.5
22 February 201805:450.3573.93.744.75.2
05:490.3593.03.944.85.6
05:530.3613.44.14.35.05.9
05:580.3603.43.744.35.6
06:050.3654.13.944.75.7
06:090.3603.74.14.54.95.9
06:130.3593.74.14.55.16.2
06:170.3604.34.244.65.7
06:210.3584.34.44.44.55.9
06:250.3573.84.44.45.26.3
06:290.3574.14.44.45.36.3
06:330.3583.84.14.55.06.1
06:370.3583.64.244.65.7
06:410.3573.43.944.45.6
06:450.3553.43.944.55.6
23 February 201805:560.3694.85.56.29.39.9
06:000.3675.05.86.39.110.9
06:040.3664.066.28.910.6
06:080.3665.15.66.38.810.6
06:120.3665.75.86.39.010.7
06:150.3655.966.38.810.8
06:200.3706.26.26.29.210.7
06:240.3676.266.39.411.0
06:280.3675.96.2610.010.9
06:320.3655.66.36.210.010.8
06:360.3656.06.26.29.610.8
06:410.3655.966.29.510.8
06:440.3666.166.39.411.0
06:480.3645.55.86.39.410.6
24 February 201805:140.3615.05.04.55.46.7
05:180.3615.25.54.25.56.7
05:220.3665.46.35.45.76.7
05:260.3685.86.35.46.17.2
05:370.3645.25.45.45.26.7
05:450.3656.04.44.15.46.6
05:490.3645.24.64.24.86.3
05:580.3644.85.45.45.16.4
06:020.3725.46.05.45.56.4
06:060.3736.06.05.45.96.8
06:100.3745.86.05.46.07.1
06:140.3705.85.44.25.96.9
06:180.3715.45.04.55.46.4
8 March 201805:340.37815.616.315.79.210.4
05:380.37915.616.917.19.710.7
05:420.37416.416.917.110.711.4
05:460.37616.418.217.411.212.1
14 March 201806:100.36212.011.614.211.214.2
16 March 201805:060.3572.93.43.42.84.2
05:150.3572.93.22.92.33.2
05:260.3572.53.23.22.43.5
05:300.3582.93.23.22.63.7
10 September 201805:241.61319.723.226.518.924.4
05:311.70921.523.425.620.426.7
05:371.57621.723.625.620.229.4
05:571.67021.523.426.519.925.3
18 November 201813:451.6007.09.710.410.812.6
14:001.3008.812.212.29.720.1
14:151.10013.613.714.813.819.7
15:009.4004.212.512.410.818.7
15:152.2004.69.610.211.811.5
15:306.5004.79.510.212.112.3
Disclaimer/Publisher’s Note: The statements, opinions and data contained in all publications are solely those of the individual author(s) and contributor(s) and not of MDPI and/or the editor(s). MDPI and/or the editor(s) disclaim responsibility for any injury to people or property resulting from any ideas, methods, instructions or products referred to in the content.