Article

Estimating and Mapping Aboveground Biomass of Vegetation in Typical Lake Flooding Wetland Based on MODIS and Landsat Images Fusion

1
State Key Laboratory of Lake and Watershed Science for Water Security, Nanjing Institute of Geography and Limnology, Chinese Academy of Sciences, Nanjing 211135, China
2
Lushan Floodplain Lake Wetland Observation and Research Station, Jiujiang 332899, China
*
Author to whom correspondence should be addressed.
Remote Sens. 2025, 17(22), 3754; https://doi.org/10.3390/rs17223754
Submission received: 15 October 2025 / Revised: 16 November 2025 / Accepted: 17 November 2025 / Published: 18 November 2025

Highlights

What are the main findings?
  • The biomass of Carex cinerascens and Phragmites australis-Triarrhena lutarioriparia communities in Poyang Lake wetland during the spring growth period is greater than that during the autumn growth period.
  • The biomass is highest in the Southern part of the wetland and lowest in the Northern part, with over 78% of the total biomass distributed in areas with elevations of 11.0–15.0 m.
What are the implication of the main findings?
  • The spatial distribution and seasonal physiological characteristics of different wetland plants should be considered when estimating the aboveground biomass in the Poyang Lake wetland.
  • The hydrological condition of oyang Lake plays a dominant role in the spatial pattern and seasonal distribution of biomass of wetland plant communities.

Abstract

Aboveground biomass (AGB) is a key indicator reflecting the metabolic mechanisms of wetland plants. This study simulated the AGB of multi-community in Poyang Lake (PYL) wetland based on long-term high-resolution (30 m, 8 d) NDVI fused from MODIS and Landsat images and analyzed the spatial distribution of AGB of different wetland plants and their relationships with wetland surface elevation. Comparative analysis showed that the cubic polynomial regression model performed the best in describing the quantitative relationship between AGB and NDVI, with the R2 of 0.83 for fitting data, the Root Mean Square Error (RMSE) of 51.8 g/m2, and prediction accuracy (G) of 71.7% for validation data. The results showed that the maximum AGB of Carex cinerascens (Cc) and Phragmites australis-Triarrhena lutarioriparia (P-T) communities during the spring growth period reached 1352 g/m2 and 1529 g/m2, respectively. The total AGB value of the Polygonum hydropiper-Phalaris arundinacea (P-P) community was the lowest from June to August, due to the flooding of PYL. Trend analysis found that the AGB of the Cc and P-P communities presented increasing trends during 2001–2020. In spatial terms, the Southern and Western areas had the largest AGB, with an average of 1340 g/m2 and 1283 g/m2, respectively, while the AGB in the Northern lake area was the lowest. Additionally, more than 78% of the total vegetation AGB was distributed in areas with elevations of 11.0–15.0 m (total AGB values of up to 332.7–376.3 × 10⁷ kg). The changes in water level and the timing of soil exposure in PYL dominated the spatiotemporal patterns of wetland vegetation AGB.

1. Introduction

Wetlands are transitional zones between land and water, and are also the most productive, diverse, dynamic, and unique ecosystems on land surface [1,2], providing approximately 14.8% of ecosystem service value [3]. Wetlands, along with forests, grasslands, and agricultural ecosystems, jointly maintain biodiversity and ecological balance on the land surface, and are also important strategic resources for ensuring ecological security and sustainable economic and social development [4]. According to the Global Lakes and Wetlands Database [5], the wetland area worldwide is approximately 0.8–1.0 × 10⁷ km2, accounting for 6.2–7.6% of the total land area. Wetland vegetation, as the key component of wetland, is the foundation of material production, energy flow, biogeochemical cycling, pollutant absorption, and transformation in the wetland ecosystem [6], playing an important role in regulating carbon storage [7,8].
Wetland vegetation biomass is an important and fundamental quantitative characteristic of wetland ecosystems [9,10,11], which can reflect the metabolic mechanisms of wetland plants, as well as their sensitivity to environmental factors [12]. Especially, aboveground biomass (AGB) is an important biophysical indicator for simulating carbon cycles and estimating carbon storage in wetlands [13]. Its spatiotemporal pattern also provides important support for measuring the stability of wetland ecosystems and for reflecting the health, growth status, and productivity of wetland vegetation [14,15]. The traditional method of measuring AGB through sampling and weighing is inefficient and laborious. More importantly, it is difficult to accurately obtain the dynamic changes in AGB in large area wetlands [16,17]. Alternatively, remote sensing technology can rapidly and continuously obtain land surface information at a large scale, which provides an important approach for accurately estimating and mapping the AGB in large-area wetlands [18,19].
Various remote sensing approaches have been widely used in wetland vegetation monitoring research, among which optical remote sensing methods based on empirical models have been developed earlier and applied to simulate the AGB of wetland vegetation at different spatial scales [9,20,21,22,23,24]. Belloli et al. [25] evaluated the potential of multispectral bands and vegetation indices in estimating AGB of wetland vegetation in Southern Brazil based on Sentinel-2A data, and the results revealed that vegetation indices had the best correlation and estimation accuracy as predictive variables. Gou et al. [26] obtained similar results in estimating the AGB of vegetation in the Sugan Lake wetland based on ZY-3 satellite data. Barrachina et al. [16] presented a remote sensing method to simulate AGB of mountainous meadows and pastures based on vegetation and wetness indices computed from Landsat data during the growing season. Mutanga et al. [6] estimated and mapped the vegetation AGB in a wetland with high-density vegetation using WorldView-2 satellite images. Ramoelo et al. [27] also conducted a similar study; they used WorldView-2 images to monitor AGB in the Northeast region of South Africa. Especially, the Normalized Difference Vegetation Index (NDVI) is the best indicator of the vegetation growth status and coverage. Numerous studies have confirmed NDVIs significant correlation with biomass [28,29,30,31,32,33], making it a universal index for estimating the AGB of typical wetland vegetation. In addition, several scholars believed that the spectral reflectance of Landsat-5 TM3 and Landsat-7 ETM4/ETM+4-band had significant correlation with dry AGB [34,35]. O’Donnell and Schalles [36] investigated the spatiotemporal dynamics of the AGB of Spartina alterniflora using Landsat 5 TM imageries (1984–2011) on the Central coast of Georgia, United States. Buffington et al. [21] calculated the AGB of tidal marshes in the Northwest United States based on the Landsat archive (1984–2015), and validated the availability of Landsat satellite images for dynamic monitoring of AGB in coastal ecosystems.
Poyang Lake (PYL) is one of the lakes connected to the middle reaches of the Yangtze River and is also the largest freshwater lake in China [37]. The lake has complex hydrological and hydrodynamic relationships with the surrounding water systems [38,39], and the lake level and area vary greatly in different seasons, resulting in a vast floodplain wetland around the lake [40,41,42]. The floodplain wetland of PYL has diverse habitat types and abundant wetland plant communities with significant spatial heterogeneity [43] and is known as a treasure trove of numerous wild plant species [42]. However, frequent extreme floods and droughts in PYL have put unprecedented pressure on the ecological security of the PYL wetland [44]. The latest research has revealed that the overall evolution of the PYL wetland landscape presented a trend of vegetation on the high beach expanding towards the low beach, while vegetation on the low beach expands towards the center of the lake [45]. Continuous low dry water conditions have led to the fragmentation of vegetation distribution on high beaches. At the same time, there is a clear trend of dwarfing and xerophilization in wetland plant communities, and even several xerophytes have become new dominant species [46].
Subsequently, many scholars have studied the dynamic changes and biomass distribution of wetland plant communities in the PYL wetland based on various types and resolutions of remote sensing images [47,48,49]. However, previous studies have used remote sensing images with coarse spatiotemporal resolution or only a few images during the dry season. This posed great challenges in distinguishing the differences in AGB of various wetland plants, and it is also unable to analyze the seasonal and long-term dynamic changes in AGB [50,51]. Moreover, less attention has been paid to the relationship between the AGB of typical wetland plants and the surface elevation of wetlands. Consequently, the fusion method of multi-source remote sensing images, which combines high-resolution spatiotemporal information from multiple sensors, has become an effective way to address the above shortcomings and challenges. Therefore, this study simulated and analyzed the seasonal distribution, interannual variation, and spatial patterns of AGB for various wetland plants based on high-resolution NDVI fused from MODIS and Landsat images. The study also revealed the relationships between the spatial distributions of AGB and the surface elevation of the PYL wetland. Outcomes of this study are of great significance for accurately assessing the regional carbon balance, the health status of wetland vegetation, as well as the wetland ecological service functions.

2. Materials and Methods

2.1. Study Area

The PYL wetland is a typical lake flooding wetland, located in the Northern part of Jiangxi Province, China (Figure 1). PYL is the largest freshwater lake in China, with a length of approximately 173 km from North to South, and a maximum East-to-West width of 74 km, and the narrowest width of only 2.8 km (average width of about 17 km) [46]. The average depth of the lake is 8.4 m [52]. The lake water level and lake area exhibit great seasonal fluctuations due to the dual influence of the inflow of tributaries in the local basin and the discharge of the main stream of the Yangtze River [53]. Generally, the lake level starts to increase from April and maintains the high-water level during June to August. Since September, with the weakening of the blocking effect of the Yangtze River, the lake water level began to gradually decline, and entered a dry season in November, and the low water continues until February of the following year [37,46]. Significant seasonal water level fluctuations have formed over 2000 km2 of wetland around PYL.
The terrain of the PYL wetland is complex, generally low in the North and high in the South, with a maximum elevation difference of up to 13 m. The topography of the lake area consists of waterways, beaches, islands, sub-lakes, and small bays [46]. The plant types in the PYL wetland are diverse, and the community structure is complete. The dominant species and their main companion species are herbaceous plants. The PYL wetland can be divided into high-beach wetland, low-beach wetland, and mudflats [54]. The elevation of the high-beach wetland is about 16–18 m, with a long exposure time, and the soil is mainly composed of meadow soil and swamp soil. This area is the main distribution area of mixed grassland and Phragmites australis and Triarrhena lutarioriparia communities. The elevation of the low-beach wetland is about 13–16 m. This type of wetland has a gentle terrain, a vast area, and a relatively short exposure time compared to a high-beach wetland. The soil is meadow swamp soil. This area is the main distribution area of Carex, Phalaris arundinacea, and other communities. The elevation of the mudflat is about 10–13 m, and it is affected by water level fluctuations, with a short exposure time. The soil is swamp soil, and the vegetation in this area is sparse [46,54].

2.2. Data

The remote sensing products used for spatio-temporal fusion in the study included MOD13Q1 and all available Landsat TM/ETM+/OLI data. MOD13Q1 was collected from NASA, and Landsat data were collected from USGS. Our previous study had fused MOD13Q1 and Landsat images in the PYL wetland using the STAFFN model developed by Chen et al. [55] and obtained a long-term and continuous NDVI dataset with the spatial resolution of 30 m and temporal resolution of 8 d from 2001 to 2020, totaling 966 scenes [45]. Moreover, a decision tree classification method was constructed by considering the phenological characteristics of different wetland plants, and further refined the landscape classification in PYL wetland, including: the floating aquatic macrophyte community (FAM), Carex cinerascens community (Cc), Polygonum hydropiper-Phalaris arundinacea community (P-P), Artemisia selengensis community (As), Phragmites australis-Triarrhena lutarioriparia community (P-T), forest, water bodies, and mudflats, with an overall classification accuracy of up to 89.36% [45].
In this study, the above high-resolution NDVI and annual refined wetland plant type dataset were directly adopted to simulate the vegetation AGB in the PYL wetland. Additionally, during the periods of 2012–2013 and 2019–2020, the quadrat method (with a sample size of 0.5 m × 0.5 m) was adopted to conduct continuous surveys of the plant communities in PYL wetland every 30–40 days. The geographical coordinates, species composition, number, and height of plants in each quadrat were recorded, and the aboveground parts of the plants were harvested and weighed for fresh weight, followed by drying to obtain dry weight. Meanwhile, the wetland information from the second PYL scientific survey conducted by Jiangxi Province, China, from 2012 to 2015, as well as wetland vegetation data in several previous studies, were also collected. The terrain information of the wetland was collected from the survey data conducted by Jiangxi Provincial Hydrological Bureau in 2010, with a spatial resolution of 4.8 m. Additionally, the terrain data was re-projected and resampled to match the NDVI. In addition, the elevation gradient was set with a step size of 0.5 m to reveal the change in AGB of different wetland plant communities.

2.3. Methods

2.3.1. STAFFN Model

The STAFFN model (spatio-temporal adaptive fusion model for NDVI products) is a remote sensing image fusion model proposed by Chen et al. [55], which has been applied in many studies and achieved good performance [45]. The STAFFN model was used in this study to fuse MODIS and Landsat data covering the PYL wetland to obtain a new high-resolution NDVI dataset.
F 2 x ω 2 , y ω 2 , b = i = 1 ω j = 1 ω W i j · P i j · L 1 x i , y j , b + M 2 x i , y j , b M 1 x i , y j , b
W i j = 1 / ( S i j × d i j ) i = 1 ω j = 1 ω 1 / ( S i j × d i j )
S i j = P i j × | L x i , y j L ( x ω / 2 , y ω / 2 ) | i = 1 ω j = 1 ω P i j × | L x i , y j L ( x ω / 2 , y ω / 2 ) |
d i j = 1 + 1 ( 1 + ω ) ( x i x ω / 2 ) 2 + ( y j y ω / 2 ) 2
where Wij was the weight coefficient, which was related to spatial distance difference (dij) and spectral similarity (Sij); ω was the size of the computing window; Pij was a set of similar pixels.

2.3.2. Method for Estimating AGB of Wetland Vegetation

The scatter plots were constructed using the vegetation AGB measured in the field and high-resolution NDVI in the corresponding grid. Five models, including linear function, quadratic polynomial, power function, exponential function, and cubic polynomial, were selected for fitting analysis. The optimal model for estimating AGB of wetland vegetation was determined based on the determination coefficient R2, and its performance was validated using a reserved sample of data based on the Root Mean Square Error (RMSE) and prediction accuracy (G). The calculation formulas for RMSE and G were as follows:
R M S E = 1 n i = 1 n y i y i 2
G = 1 i = 1 n y i y i 2 i = 1 n y i y ¯ 2 × 100 %
where y i is the measured AGB; y i is the estimated AGB; y ¯ is the average measured AGB; n is the number of samples.
Comparative analysis showed that the cubic polynomial regression model performed the best in characterizing the relationship between AGB and NDVI, with a determination coefficient R2 of 0.83. The validation of this model using reserved sampling data showed that the overall accuracy was high, with an RMSE of 51.8 g/m2 and G of 71.7%. Therefore, the cubic polynomial regression model was used in this study to estimate the spatiotemporal distribution and variation characteristics of AGB of various plant types in the PYL wetland; the estimation formula is as follows:
y = 8368.3 x 3 7576.2 x 2 + 3243.4 x + 75.5
where y represents the estimated AGB (g/m2); x is NDVI.

2.3.3. Gaussian Regression Model

The Gaussian regression model has been widely used to describe the spatial pattern characteristics of plant distribution and its response relationship with geographical environmental factors. This study used the Gaussian model to explore the spatial characteristics of four typical plant communities in the PYL wetland along the surface elevation of the wetland. The coefficient of determination R2 was used as a goodness-of-fit metric for both individual vegetation communities and the overall region. The Gaussian regression model can be represented by the following equation:
y = c   exp 1 2 x μ 2 / t 2  
where x is the surface elevation where the wetland plants are located; y is the area of a wetland plant community; μ and t represent the optimal distribution elevation and tolerance of the plant community, respectively. Generally, [μ − 2t, μ + 2t] stands for its normal ecological range of the plant community, while [μt, μ + t] represents its suitable ecological range for the plant community.

3. Results

3.1. Monthly and Annual Changes in AGB of Wetland Vegetation

The average monthly changes in vegetation AGB and total AGB values in the PYL wetland are shown in Figure 2. There was a significant seasonal variation in vegetation AGB and total AGB values. In early spring, wetland plants entered the germination period, and AGB began to increase, reaching its highest in April, with an average AGB of 1116 g/m2. Then, with the arrival of the flood season in PYL, most of the wetland beaches were submerged by floods, and the AGB gradually decreased, reaching its lowest in July and August. In autumn, Carex community and other plants sprouted again, and the vegetation AGB increased accordingly, reaching its largest value of 776 g/m2 in the second growing season in October. Comparing the vegetation AGB during its two growing seasons, the spring AGB (about 1022 g/m2) is about 39.7% higher than the autumn AGB (732 g/m2) (Figure 2a). The monthly variation process of total AGB values was similar to that of AGB. It reached a spring peak of 224.8 × 10⁷ kg in April, but the autumn peak of total AGB continued until December, reaching 151.6 × 10⁷ kg (Figure 2b).
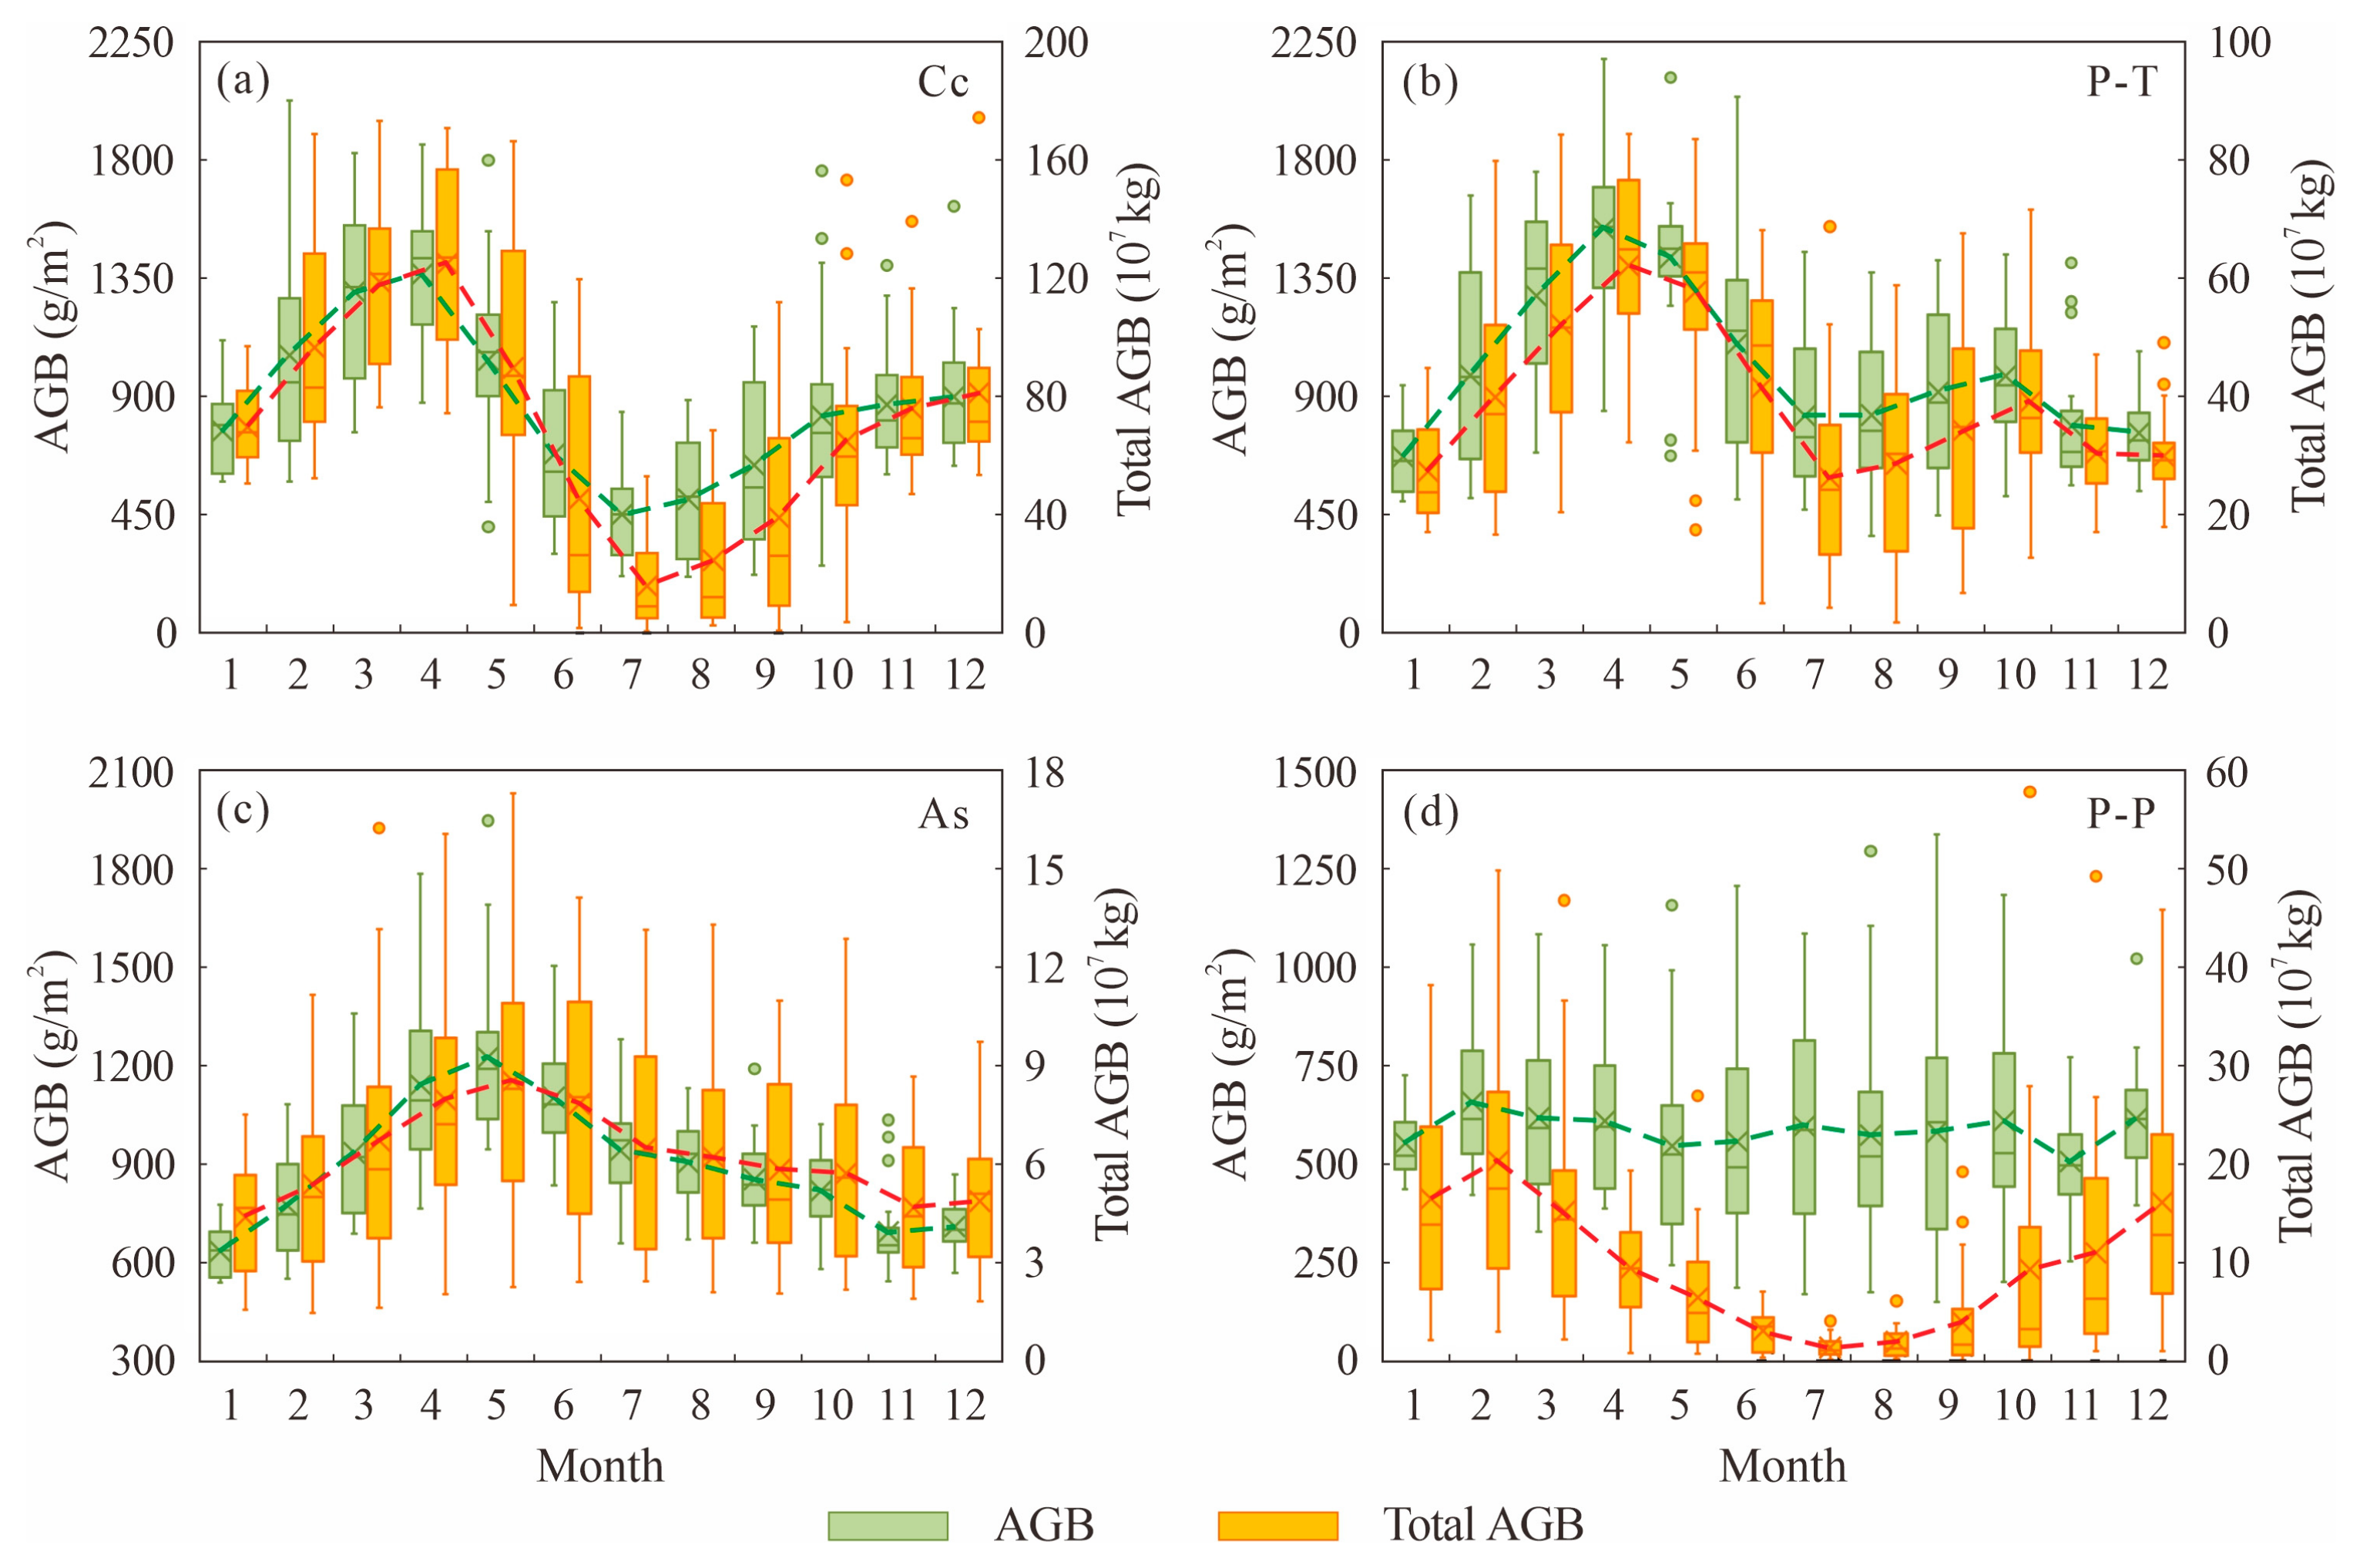
Furthermore, the monthly variation characteristics of AGB and total AGB values of four typical wetland plant communities were analyzed, including P-P, Cc, P-T, and As, as shown in Figure 3. The Cc and P-T communities had two main growth periods in spring and autumn, with the highest AGB in spring being 1352 g/m2 and 1529 g/m2. The AGB of both wetland plant communities in autumn was lower than that in spring. The main growth period of the As community was from April to June, and its AGB reached a peak of 1220 g/m2 in May. Afterwards, the AGB gradually decreased until December. Meanwhile, the seasonal changes in the total AGB values of these three wetland plants exhibited similar characteristics to AGB, with their maximum values in spring reaching 123.7 × 10⁷ kg, 61.7 × 10⁷ kg, and 8.5 × 10⁷ kg, respectively. However, the monthly AGB and total AGB values of the P-P community showed significantly different patterns from the other three wetland plants. Its AGB fluctuated generally between 500 g/m2 and 700 g/m2, while the total AGB values were the lowest throughout the year during the flood season. This is mainly due to the lower distribution terrain of the P-P community, and most areas were submerged by lake water during the flood season.
Figure 4 shows the interannual changes in vegetation AGB and total AGB values from 2001 to 2020. The average AGB of wetland vegetation showed a decreasing trend before 2004 (from 1411 g/m2 in 2001 to 942 g/m2 in 2004) and a significant increasing trend after 2004 (reaching the maximum of 1454 g/m2 in 2019), with a long-term average of 1203 g/m2. Especially, the upward trends of the P-P and Cc communities were most significant, with the increase of 35.9 g/m2 and 31.2 g/m2 per year, respectively. The trend of annual total AGB values was similar to that of AGB, decreasing from 317.1 × 10⁷ kg in 2001 to 252.7 × 10⁷ kg in 2004. Afterwards, the total AGB values showed a fluctuating increase trend, reaching a maximum of around 366 × 107 kg in 2018–2019, with a multi-year average of 302.1 × 10⁷ kg. Specifically, the total AGB values presented a significant increase in trends after 2004 for the Cc and P-P communities, while a significant decrease in trends for the As community, and the total AGB value was only 2.8 × 10⁷ kg in 2020.

3.2. Spatial Distribution of Wetland Vegetation AGB

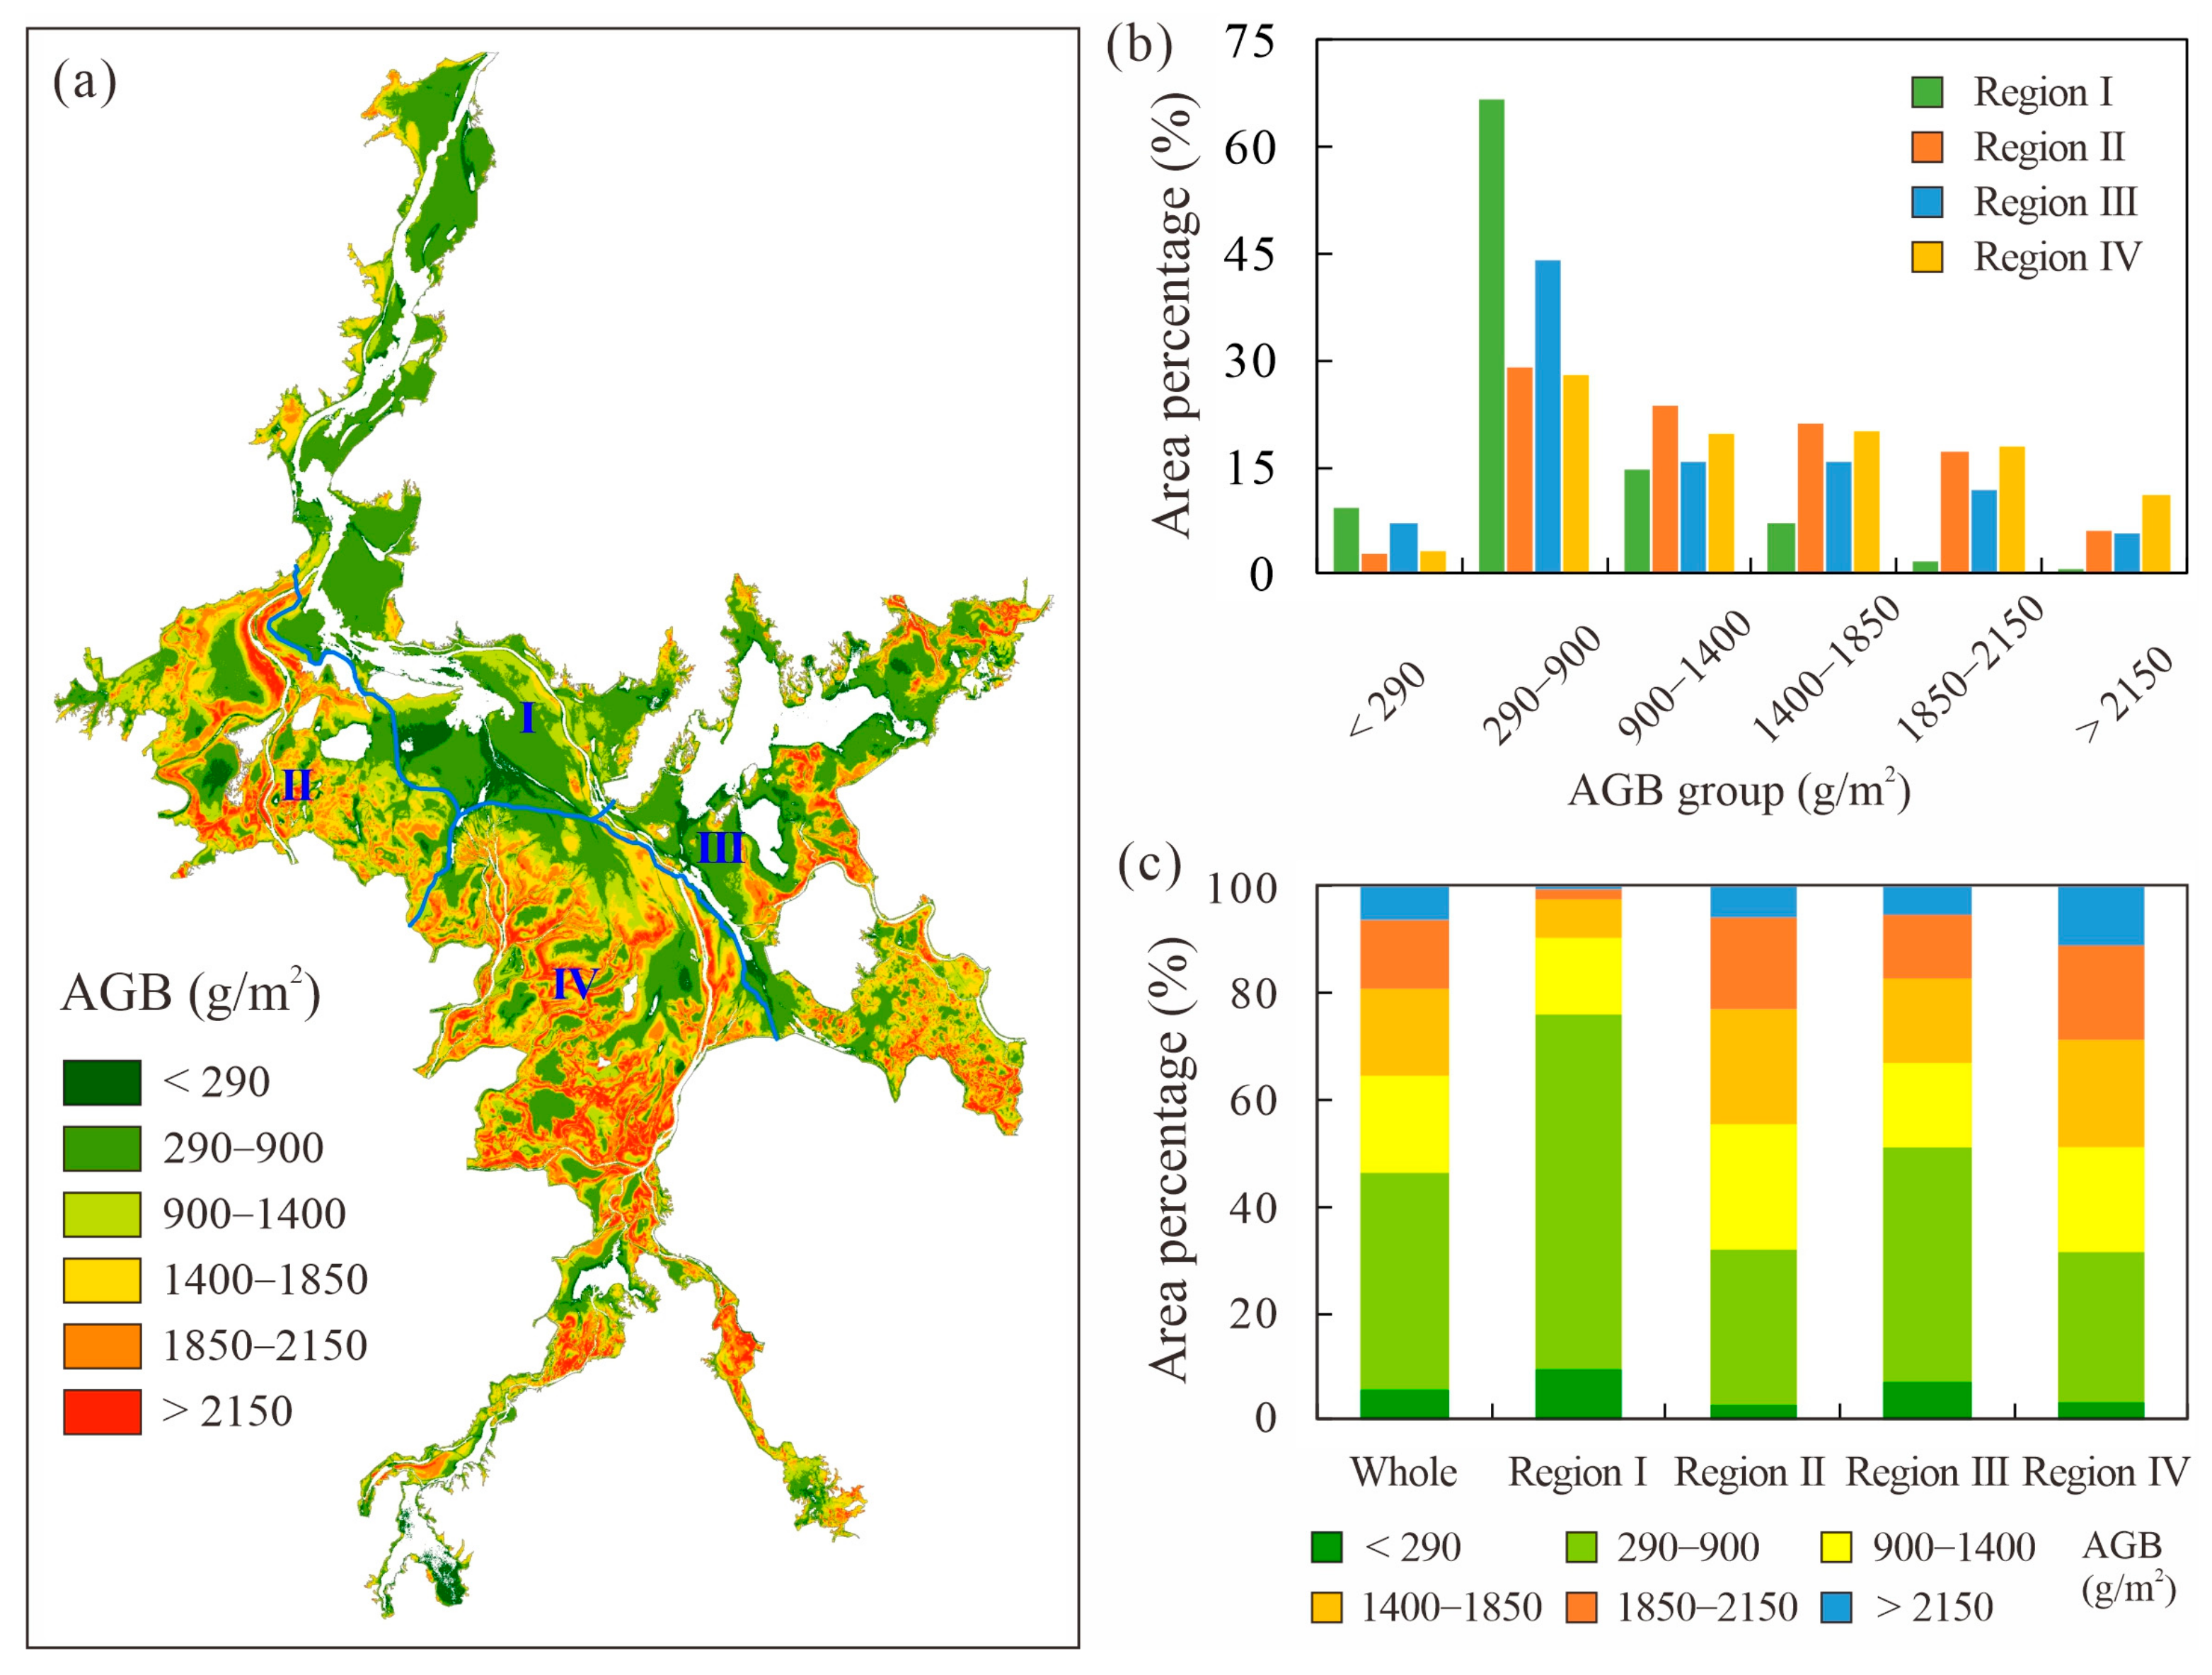
The spatial distribution pattern of vegetation AGB in the PYL wetland during 2001–2020 is presented in Figure 5. Although the spatial distributions of vegetation AGB varied each year, the overall spatial pattern of AGB was lower in the North and higher in the South. The AGB of most areas in the Southern part of the PYL wetland generally exceeds 1850 g/m2. In addition, the AGB in the National Natural Reserve of PYL wetland (Wucheng) was also relatively high, with some areas even around 3000 g/m2. However, in the Northern and Eastern regions, the AGB was generally low, especially in the wetlands near the channel connecting the Yangtze River, which generally has an AGB of less than 900 g/m2.
Figure 6 presents the distributions of average vegetation AGB and corresponding area proportion in different lake regions. The largest vegetation AGB occurred in region IV, with an average of 1340 g/m2, followed by regions II and III, with an average AGB of 1283 and 1058 g/m2, respectively. Region I had the lowest annual AGB, with an average of only 700 g/m2. Specifically, the vegetation AGB in Region I is generally low, with areas with AGB < 900 g/m2 accounting for 76% of the total area, while areas with AGB > 1850 g/m2 accounted for only 2%. However, the proportions of large AGB values (>1850 g/m2) in regions IV and II were higher than those in other regions, accounting for 29% and 23%, respectively. Especially in region IV, 11% of the area had an average annual AGB exceeding 2150 g/m2.
Distributions of average vegetation AGB of four typical wetland plant communities in each wetland region are presented in Table 1. It is found that the biomass of the P-T community in the wetland was the highest, especially in regions II, III, and IV, with an average AGB of 1771 g/m2, 1692 g/m2, and 1838 g/m2, respectively. Followed by the Cc community, the average AGB in four wetland regions was 1368 g/m2, 1634 g/m2, 1556 g/m2, and 1700 g/m2, respectively. The biomass of the P-P community was the smallest, especially in Region I, with an average AGB of only 795 g/m2. Meanwhile, the area proportion of different wetland plant communities varied in different AGB groups. The areas with AGB < 900 g/m2 in the Cc and P-T communities in Region I accounted for 28.0% and 21.8% of the total area, respectively, and areas with AGB > 2150 g/m2 accounted for only 12.4% and 11.2%, respectively. In Region IV, the low AGB areas (AGB < 900 g/m2) decreased to 11.9% and 7.9%, respectively, while the high AGB areas (AGB > 2150 g/m2) increased to 24.7% and 32.9%, respectively. In addition, for the P-P community, the small biomass group was predominant in each wetland region, and the proportion of areas with AGB < 900 g/m2 was between 50.6% in Region II and 76.6% in Region I (Figure 7).

3.3. Changes in AGB of Wetland Vegetation Along Elevation Gradients

The distribution characteristics of vegetation AGB and total AGB values in the PYL wetland with surface elevation changes are presented in Figure 8. It is shown that in areas with elevations below 11.0 m, vegetation AGB remained at a relatively low level (approximately 290–600 g/m2). In areas with elevations between 11.0 m and 15.0 m, the AGB rapidly increased from 600 g/m2 to over 1600 g/m2. When the elevation is above 15.0 m, the AGB in this area remained relatively high, around 1500 g/m2 (Figure 8a). Meanwhile, the total AGB values were mainly distributed in areas with elevations of 11.0–15.0 m, accounting for 78.6% of the total biomass, especially in areas with elevations of 12.0–14.0 m, where the total AGB values were the highest (332.7–376.3 × 10⁷ kg), accounting for 46.0%. Additionally, the distribution characteristics of AGB and total AGB values along the elevation gradients in regions II, III, and IV were basically similar to the overall distribution. However, for the lake region I, its optimal elevation for biomass was 2.0–3.0 m lower than other regions, with 70.1% of the total biomass distributed in the areas with the elevations of 9.0–11.0 m (Figure 8b).
Figure 9 presents the changes in average AGB of four typical wetland plant communities along elevation gradients. It is found that the AGB of Cc and P-T communities showed a unimodal distribution along the elevation, with maximum AGB values of 1781 g/m2 and 1906 g/m2, located in the elevation areas of 13.5–14.0 m and 14.0–14.5 m, respectively. Moreover, both communities had lower AGB in areas with elevations below 10.0 m. The AGB of As and P-P communities gradually increased with the increase in elevation, and remained at a relatively high level after reaching their maximum AGB at 14.0 m and 16.0 m, respectively. In addition, there are certain spatial differences in this distribution pattern. The maximum AGB of the Cc community was only around 1400 g/m2 in region I, and distributed in areas with an elevation of 10.5–13.0 m, which was lower than in other lake regions. While in region IV, its maximum AGB was even 1878 g/m2 at an elevation of 13.5–14.0 m. The biomass of the P-T community in region I and the P-P community in region II both increased continuously with elevation, and their maximum AGB occurred in areas with higher elevation (elevation > 22.0 m).
Similarly, the variations in total AGB values of four typical wetland plants along the elevation gradient are presented in Figure 10. The total AGB values of Cc, P-T, As, and P-P communities reached their maximum at elevations of 13.0–13.5 m, 14.0–14.5 m, 14.5–15.0 m, and 11.0–11.5 m, with values of 252.0 × 10⁶ kg, 134.8 × 10⁶ kg, 13.4 × 10⁶ kg, and 42.9 × 10⁶ kg, respectively. Their spatial distribution also varied in different lake regions. Specifically, the total AGB values of Cc and P-T communities in region IV were much higher than those in other regions, while in region I, the total AGB values of the P-P community were the highest. In addition, the maximum total AGB values of wetland plants in region I appeared at a lower elevation than those in other regions, especially for the Cc and P-P communities.
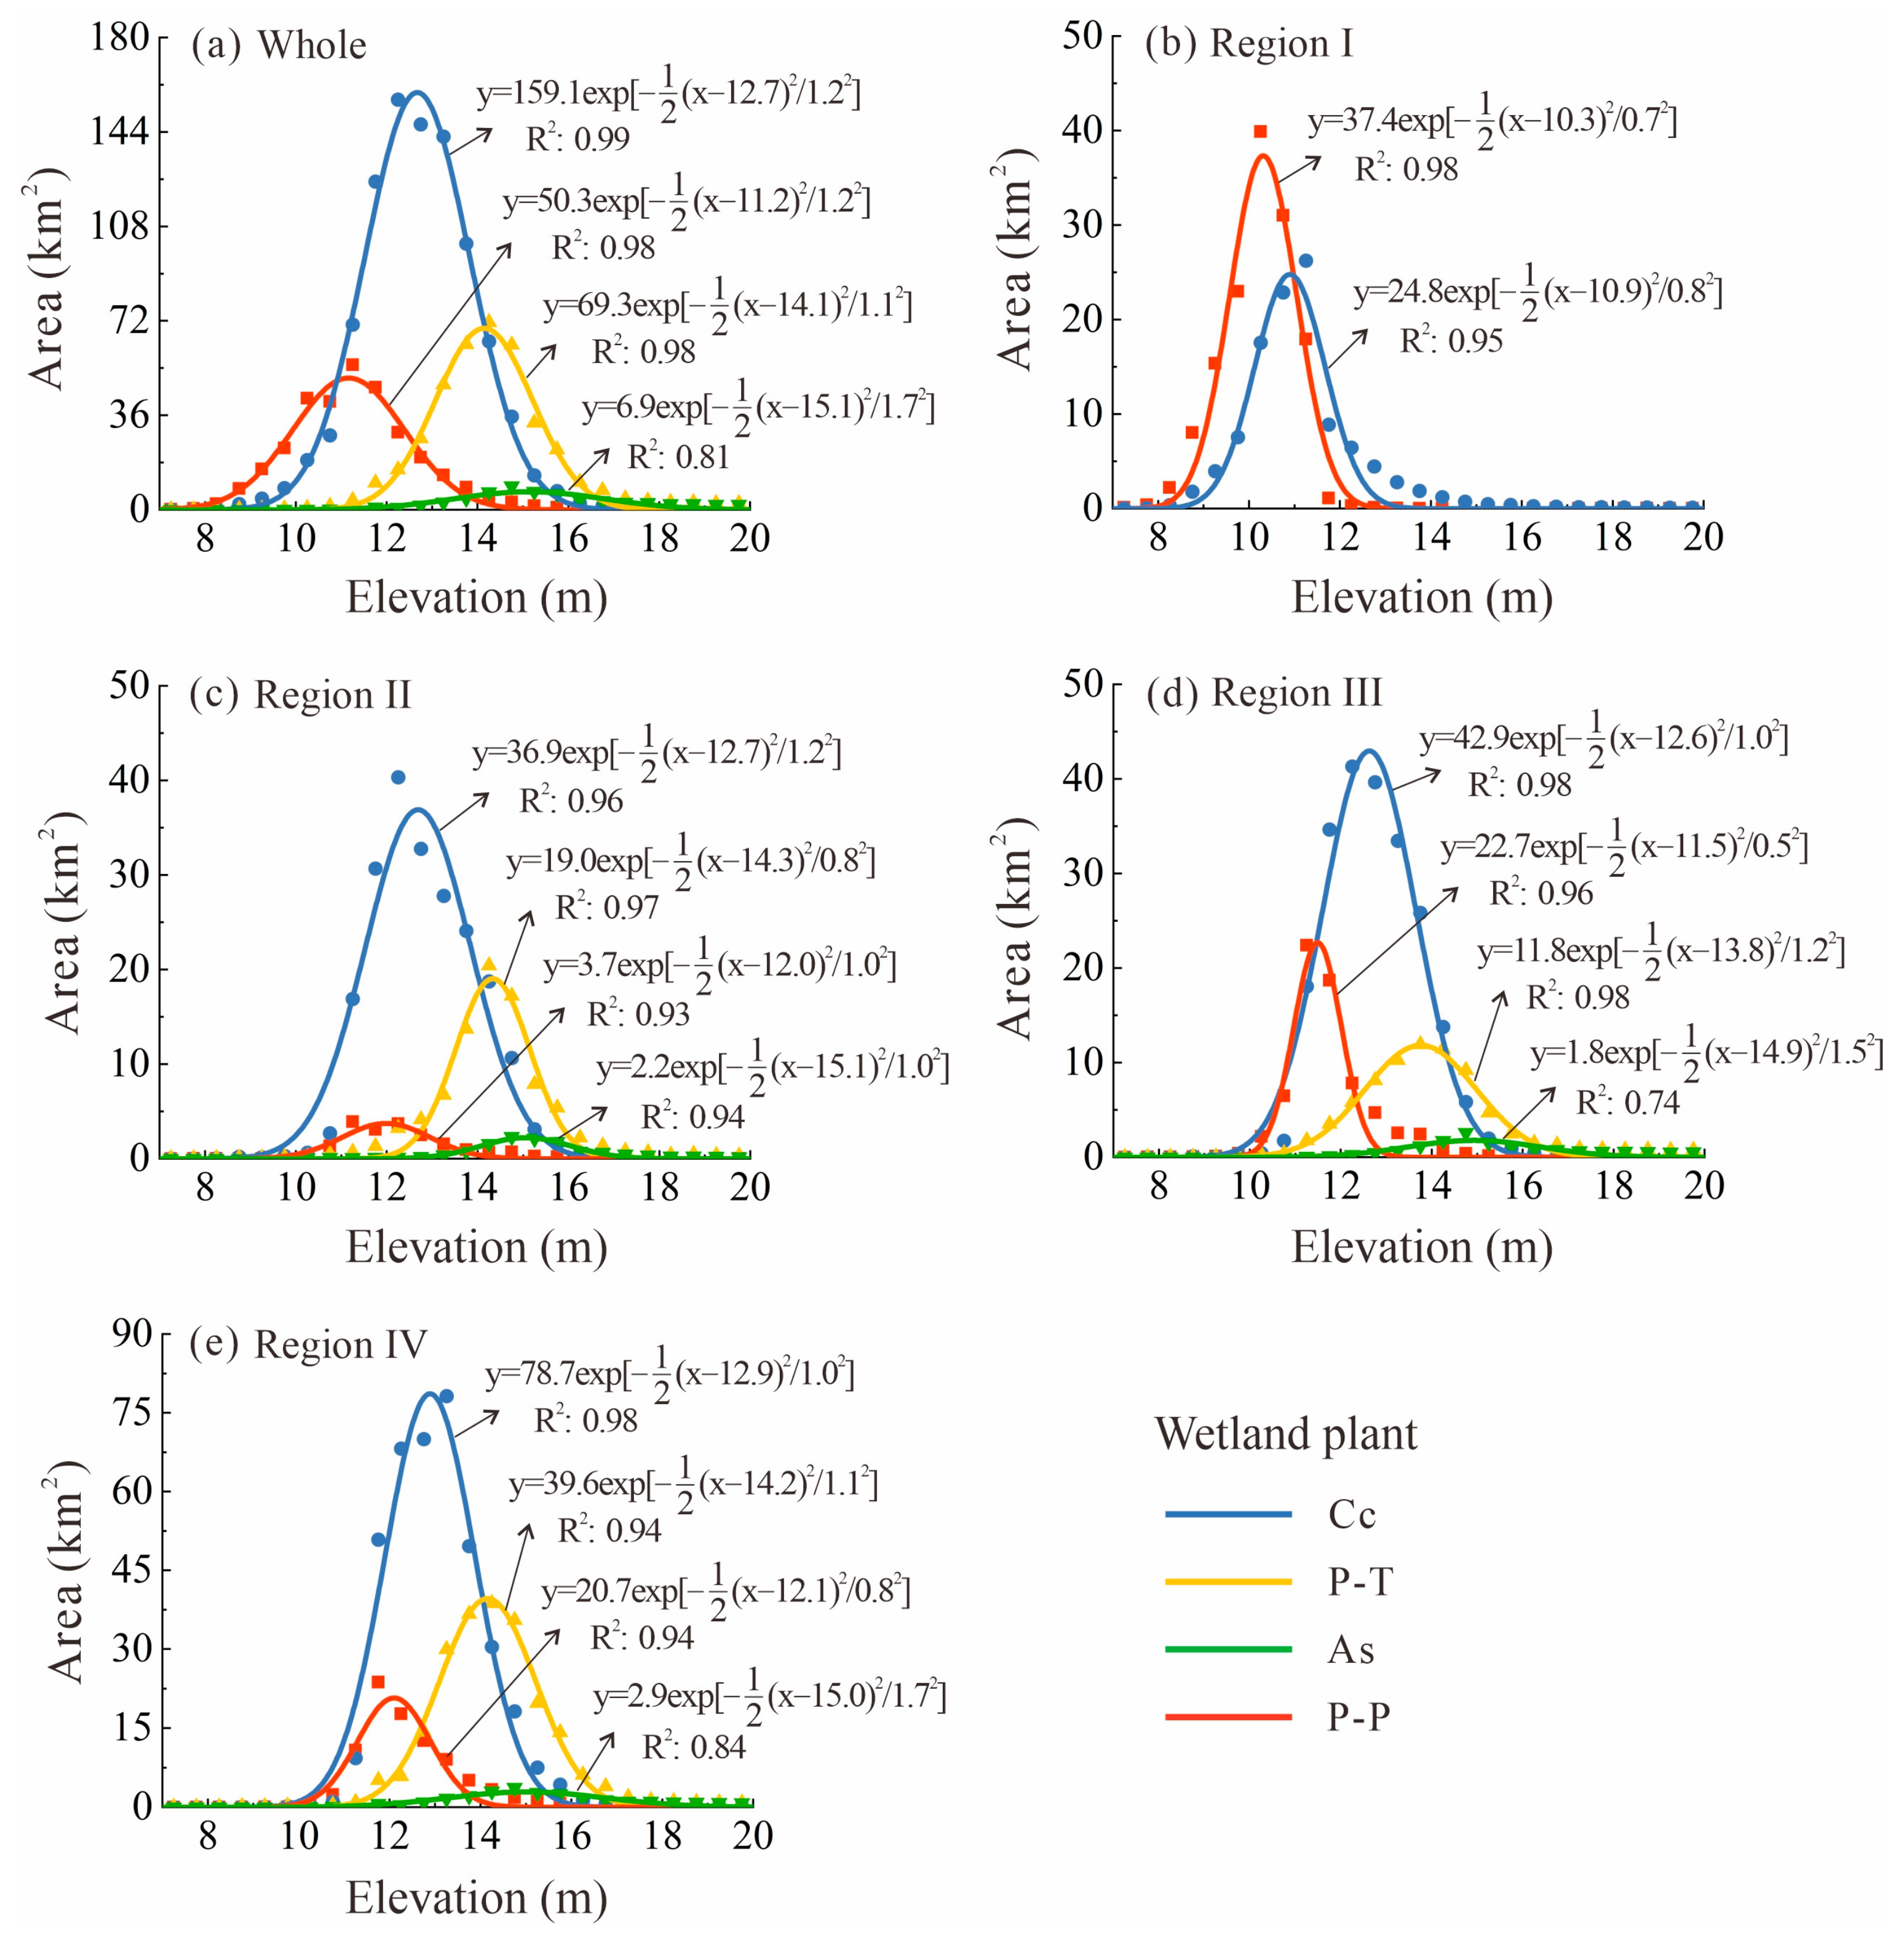
Furthermore, the Gaussian regression model was used to quantitatively analyze the distribution characteristics of four dominant plants in the PYL wetland with changes in surface elevation, as shown in Figure 11. It is shown that the suitable elevation ranges and optimal elevations for different wetland plants vary. Specifically, the elevation of the P-P community distribution area was relatively low, mainly between 8.70 and 13.62 m, with the most suitable elevation being 11.16 m. The Cc community was mainly distributed in areas with elevations between 10.35 and 14.90 m. The distribution areas of P-T and As communities had relatively high elevations (ranging from 12.0 to 16.3 m and 11.8 to 18.46 m, respectively), with the most suitable elevations of 14.14 m and 15.14 m, respectively. Meanwhile, the ecological width of the As community was as high as 6.64 m, indicating its strong adaptability in the PYL wetland.

4. Discussion

Hydrological conditions were the main driving force for wetland vegetation succession [56], which had great effects on the growth of wetland plants, dominance, species composition, and community distribution patterns of plant communities [57]. They were also important factors determining the species diversity, community stability, and biomass of wetland vegetation [58]. Especially, the water level changes in wetlands had the most direct impacts on the morphological characteristics of wetland plants, such as plant height, node spacing, number and length of branches, leaf width and length, etc. [59]. The water level of Poyang Lake can determine the timing of soil exposure, the growth time of the wetland plants, and the climatic factors such as temperature and precipitation, which can influence the growth of plants. Different water levels can also determine the soil environment, such as soil temperature, soil nutrient content, and soil microbial community, which can affect the growth of plants [51]. The hydrological situation of the PYL floodplain wetland was complex, with water levels fluctuating by over 10 m throughout the year. The periodic changes in the exposed and submerged areas of PYL beach caused drastic changes in the wetland area in time and space, which in turn affected the spatial patterns and biomass allocation of wetland vegetation [60]. Since 2000, the low water situation in PYL has been continuously worsening, and the average lake water level has been decreasing year by year [61], which has led to a downward trend in the distribution elevation of wetland plants. Li et al. [62] found that drought caused the optimal distribution elevation of four typical plant communities in PYL wetland to decrease by 0.16–0.34 m, especially in the Northern lake area, where the upper limit elevation of the As community decreased by as much as 0.56–1.07 m. Han et al. [63] also pointed out that the vegetation in the PYL wetland was expanding towards the center of the lake since 2000. Meanwhile, frequent drought in PYL intensified the interspecific competition between different wetland plant communities, which compete for water and favorable living space, resulting in significant differences in the growth, biomass allocation, and distribution of different plant communities [64]. Spatially, due to the lower terrain and lake water level in the Northern lake area compared to the Southern lake area, the optimal distribution elevation of the same plant community in the lake region I is generally about two meters lower than that in other regions. This may be the main reason for the lower biomass distribution elevation in the Northern lake area. In addition, hydrological connectivity served as a key link connecting the hydrological and ecological processes (including material cycling, energy flow, and biological migration) between rivers, lakes, and wetlands [65]. The changes in hydrological situation had altered the hydraulic connections between rivers, lakes, and wetland, which directly had a significant synergistic impact on the distribution, succession, or habitat status of wetland vegetation [66], as well as the spatiotemporal patterns of vegetation AGB.
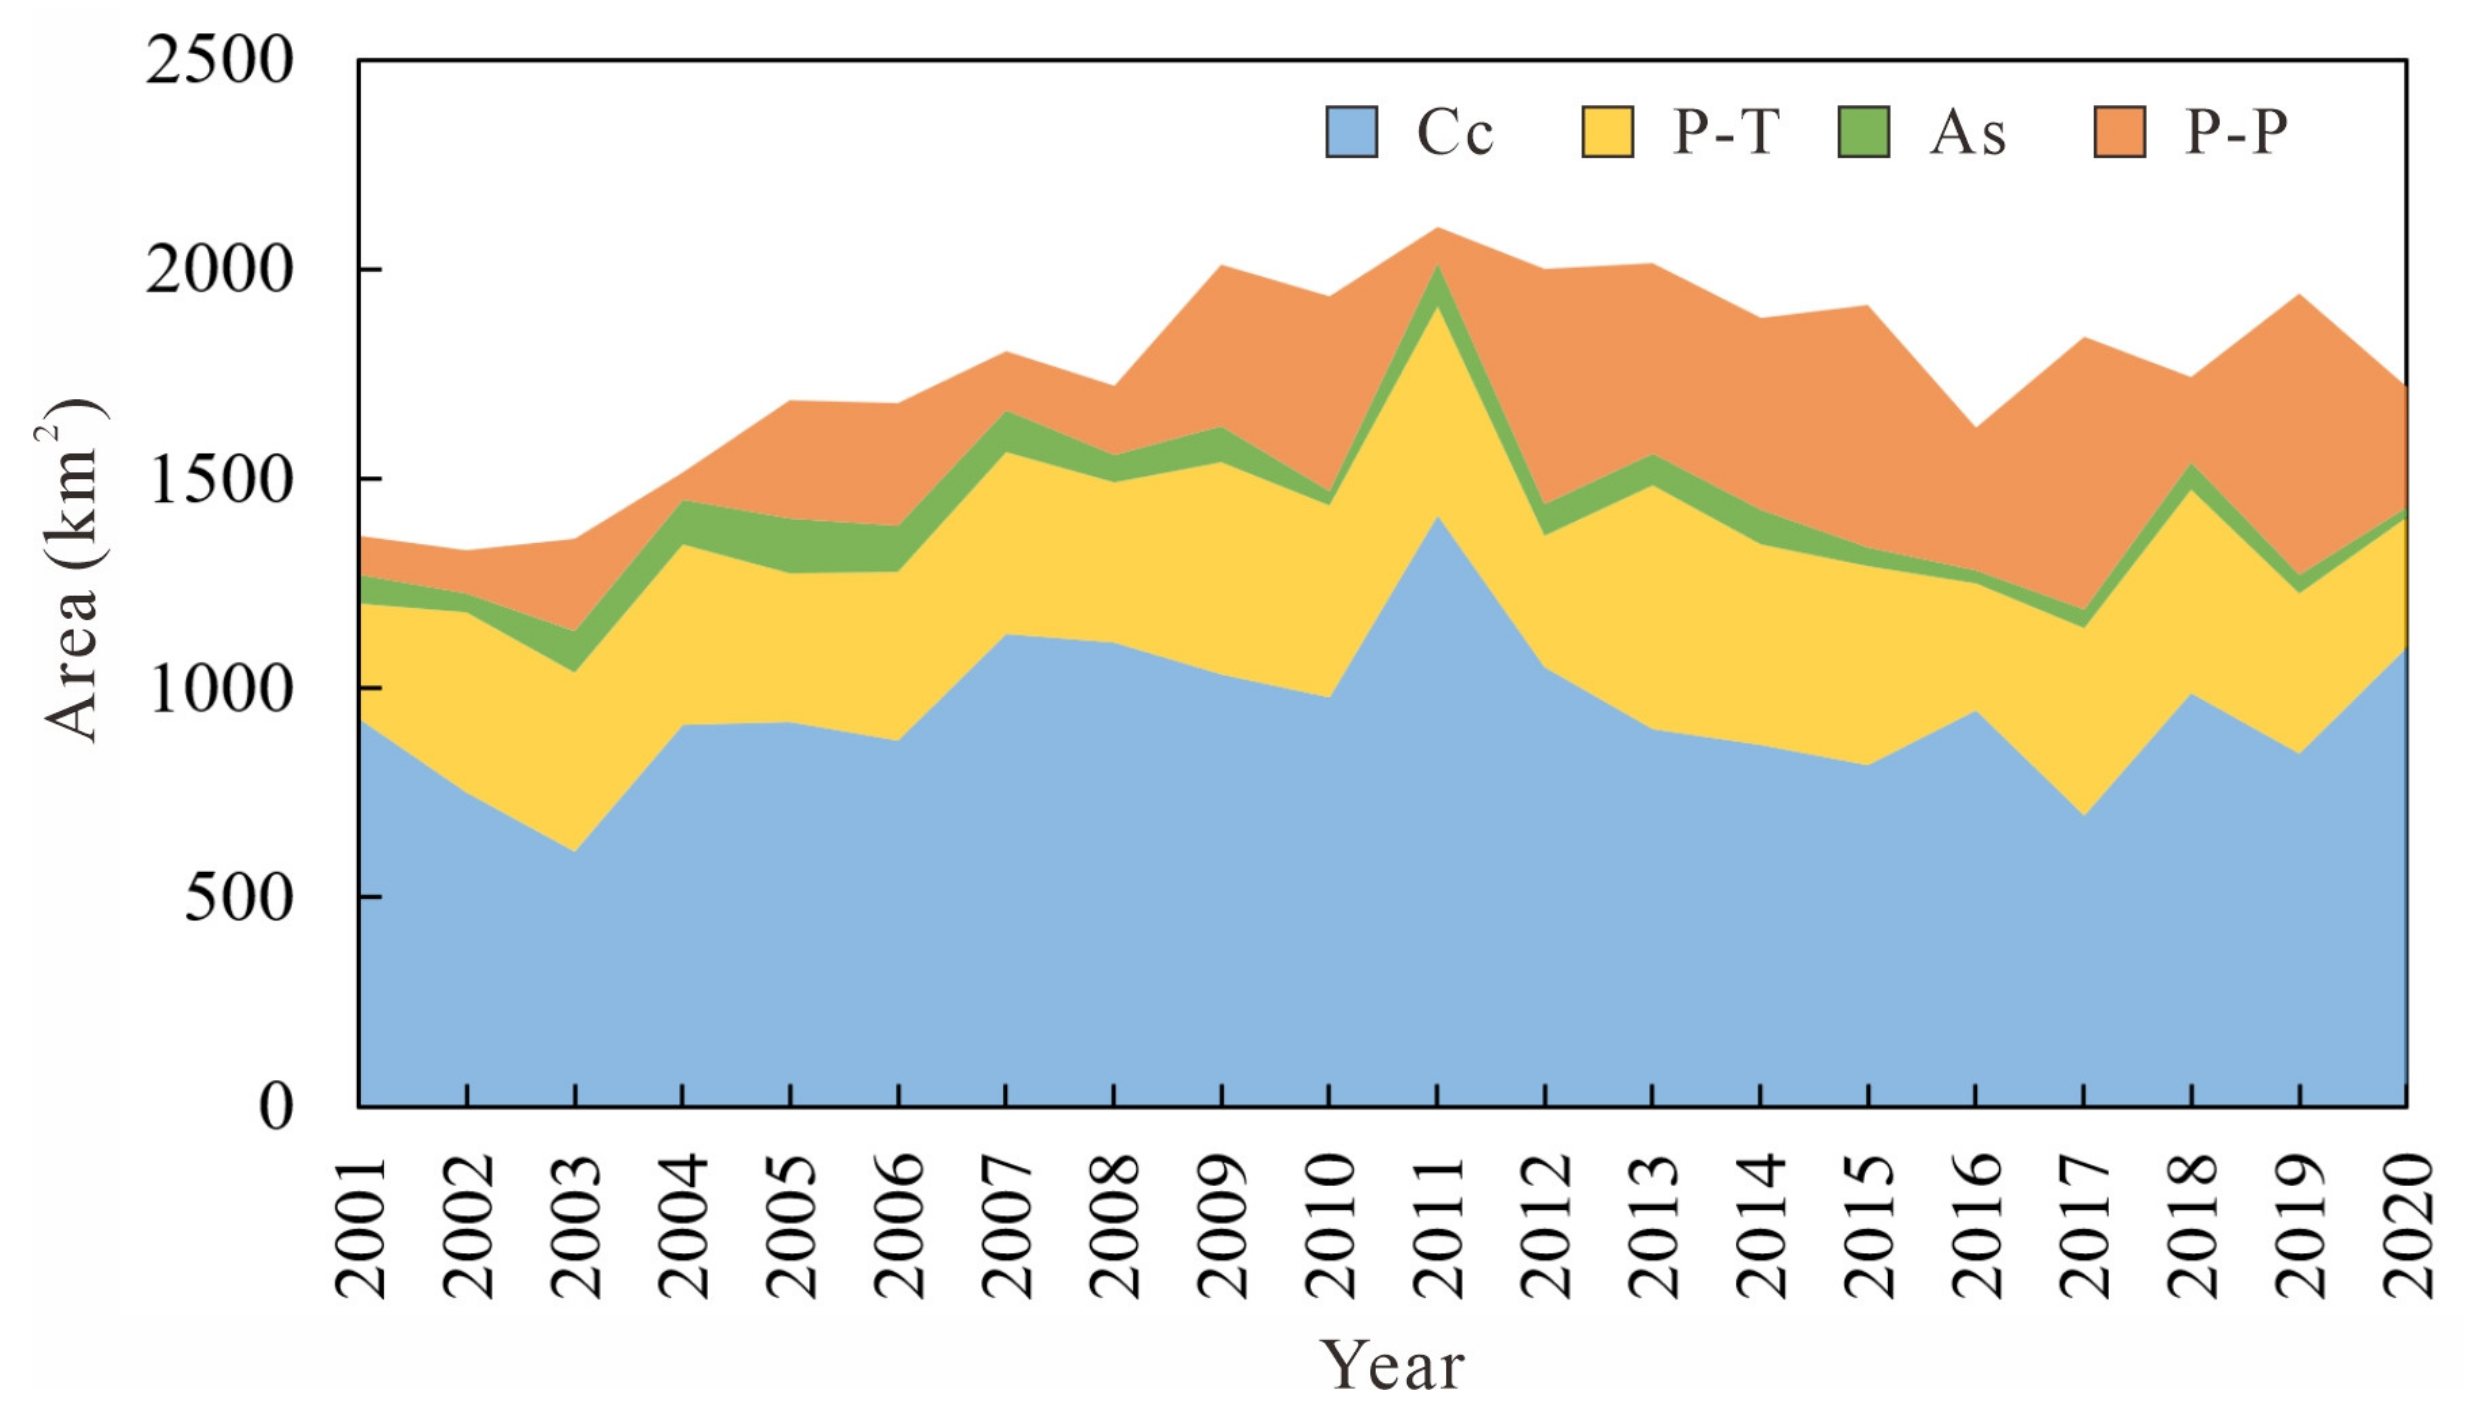
Additionally, this study showed that the total AGB values in PYL wetland presented an upward trend over the years, which was closely related to the increase in vegetation area in PYL wetland. Figure 12 shows the interannual variation in the area of four typical wetland plant communities in the PYL wetland. The total vegetation area of the PYL wetland showed a fluctuating upward trend during 2000–2020, with an average increase of 25.3 km2/a. The vegetation area reached its maximum of 2087.9 km2 in 2011, accounting for 66% of the total area of the PYL floodplain wetland. Specifically, the P-P community showed the most significant increasing trend in area, with an average increase of 19.2 km2/a. The Cc community presented a slight increasing trend, especially with its coverage area reaching a maximum of 1503.5 km2 in 2011, nearly half (47%) of the total area of the PYL wetland. The distribution area of the As community showed a significant downward trend, while the area of the P-T community fluctuated between 300 and 500 km2 and did not show a significant trend. The changes in vegetation area largely determined the interannual variation characteristics of the total AGB values in the PYL wetland.
Finally, this study showed that the annual total AGB of the PYL wetland was 2.5–3.6 × 10⁹ kg, and higher than the results of Wan et al. [49], who believed the annual total AGB ranged from 0.88 × 10⁹ kg to 2.07 × 10⁹ kg during 2010–2016, with an average of 1.27 × 10⁹ kg. However, Wan et al. [49] mainly estimated the AGB during the autumn growing season, which was significantly lower than that during the spring growing season. In addition, Wang and Liao [67] estimated the AGB of the PYL wetland in April 2007 based on Landsat TM and Envisat ASAR data and found that the total AGB was about 2.1 × 10⁹ kg. Li and Liu [68] reported that the total biomass of the PYL wetland in April 2000 was about 3.8 × 10⁹ kg. It can be seen that our results were very close to their estimates, indicating that the estimation of AGB in the PYL wetland in this study was reliable. On the other hand, there are still some uncertainties in the results of this study, such as NDVI saturation in high biomass areas and classification errors between wetland plant communities. These limitations will be addressed in future studies by incorporating SAR data (e.g., Sentinel 1), which is less sensitive to canopy saturation and cloud cover.

5. Conclusions

This study simulated the vegetation AGB in the PYL wetland based on high-resolution NDVI fused from multiple remote sensing images and refined wetland vegetation classification data. The study also analyzed the spatiotemporal pattern characteristics of AGB of different wetland plants and their relationship with wetland surface elevation. Comparative analysis showed that the cubic polynomial regression model performed the best for multi-community AGB modeling, with an R2 of 0.83 for fitting data, an RMSE of 51.8 g/m2, and a G of 71.7% for validation data. The results showed that there were two main growth seasons for the Cc and P-T communities in the PYL wetland, and their maximum AGB in spring reached 1352 g/m2 and 1529 g/m2, respectively. At the same time, the AGB in autumn was slightly lower than that in spring. Trend analysis found that the AGB and total AGB values of Cc and P-P communities presented the long-term increasing trends during 2001–2020, especially after 2004. The total AGB values of the As community presented a significant downward trend. In spatial terms, the AGB in the Southern (region IV) and Western area (region II) of the wetland were the highest, with the average of 1340 g/m2 and 1283 g/m2, respectively. While the AGB in the Northern area (region I) was the lowest, with an average of only 700 g/m2. Over 78% of the total vegetation AGB values in PYL wetland were distributed in areas with elevations of 11.0–15.0 m, especially in areas with elevations of 12.0–14.0 m, with a total AGB value of up to 332.7–376.3 × 10⁷ kg. The biomass distribution elevation in the Northern lake area is generally 2–3 m lower than in other regions, with over 70% of the total AGB distributed in the areas with elevations of 9.0–11.0 m. The spatiotemporal distribution patterns of AGB in various wetland plant communities were significantly influenced by the hydrological situations of PYL.
Additionally, it should be pointed out that there are still some limitations and uncertainties in this study, especially the NDVI saturation effects, wetland plant classification errors, and simulation accuracy of multi-community AGB. These are the key issues that need to be addressed in future studies to help expand the application of this method to other similar wetlands.

Author Contributions

Conceptualization, X.L.; data curation, Z.L., Y.S. and X.H.; formal analysis, Y.L.; funding acquisition, X.L.; investigation, Y.L.; methodology, Y.L.; project administration, X.L.; software, Y.L.; supervision, X.L.; validation, Y.L.; visualization, Z.L., Y.S. and X.H.; writing—original draft, X.L.; writing—review and editing, X.L., Y.L., Z.L., Y.S. and X.H. All authors have read and agreed to the published version of the manuscript.

Funding

This research was funded by the Ganpo Excellent Talent Support Program of Jiangxi–Training Program for Academic and Technical Leaders in Major Disciplines (grant number 20232BCJ22011), the Key Science and Technology Project of Jiangxi Province (grant number 20252ABF010001 and 20244BCF61001), the Project of Jiujiang Science and Technology Bureau (grant number 2025_000773), and the Basic Research Program of Jiangsu (grant number BK20242106).

Data Availability Statement

The raw data supporting the conclusions of this article will be made available by the authors on request.

Conflicts of Interest

The authors declare no conflicts of interest.

References

  1. Bridgham, S.D.; Megonigal, J.P.; Keller, J.K.; Bliss, N.B.; Trettin, C. The carbon balance of North American wetlands. Wetlands 2006, 26, 889–916. [Google Scholar] [CrossRef]
  2. Desta, H.; Lemma, B.; Fetene, A. Aspects of climate change and its associated impacts on wetland ecosystem functions—A review. J. Am. Sci. 2012, 8, 582–596. [Google Scholar]
  3. Costanza, R.; d’Arge, R.; de Groot, R.; Farber, S.; Grasso, M.; Hannon, B.; Limburg, K.; Naeem, S.; ONeill, R.V.; Paruelo, J.; et al. The value of the world’s ecosystem services and natural capital. Nature 1997, 387, 253–260. [Google Scholar] [CrossRef]
  4. Chen, W.; Cao, C.X.; Liu, D.; Tian, R.; Wu, C.Y.; Wang, Y.Q.; Qian, Y.F.; Ma, G.Q.; Bao, D.M. An evaluating system for wetland ecological health: Case study on nineteen major wetlands in Beijing-Tianjin-Hebei region, China. Sci. Total Environ. 2019, 666, 1080–1088. [Google Scholar] [CrossRef]
  5. Lehner, B.; Döll, P. Development and validation of a global database of lakes, reservoirs and wetlands. J. Hydrol. 2004, 296, 1–22. [Google Scholar] [CrossRef]
  6. Mutanga, O.; Adam, E.; Cho, M.A. High density biomass estimation for wetland vegetation using WorldView-2 imagery and random forest regression algorithm. Int. J. Appl. Earth Obs. Geoinf. 2012, 18, 399–406. [Google Scholar] [CrossRef]
  7. Lai, W.L.; Zhang, Y.; Chen, Z.H. Radial oxygen loss, photosynthesis, and nutrient removal of 35 wetland plants. Ecol. Eng. 2012, 39, 24–30. [Google Scholar] [CrossRef]
  8. Zhou, L.Y.; Yan, W.; Sun, X.Y.; Shao, J.J.; Zhang, P.P.; Zhou, G.Y.; He, Y.H.; Liu, H.Y.; Fu, Y.L.; Zhou, X.H. Regulation of climate, soil and hydrological factors on macrophyte biomass allocation for coastal and inland wetlands in China. Sci. Total Environ. 2021, 774, 145317. [Google Scholar] [CrossRef]
  9. Lan, Z.C.; Chen, Y.S.; Shen, R.C.; Cai, Y.J.; Luo, H.; Jin, B.S.; Chen, J.K. Effects of flooding duration on wetland plant biomass: The importance of soil nutrients and season. Freshw. Biol. 2021, 66, 211–222. [Google Scholar] [CrossRef]
  10. Barya, M.P.; Kumar, A.; Thakur, T.K. Utilization of constructed wetland for the removal of heavy metal through fly ash bricks manufactured using harvested plant biomass. Ecohydrology 2022, 15, E2424. [Google Scholar] [CrossRef]
  11. Pan, Y.Y.; Zhang, Z.M.; Zhang, M.X.; Huang, P.S.; Dai, L.Y.; Ma, Z.W.; Liu, J.K. Climate vs. nutrient control: A global analysis of driving environmental factors of wetland plant biomass allocation strategy. J. Clean. Prod. 2023, 406, 136983. [Google Scholar] [CrossRef]
  12. Qiao, W.C.; Li, R.; Tang, T.H.; Zuh, A.A. Removal, distribution and plant uptake of perfluorooctane sulfonate (PFOS) in a simulated constructed wetland system. Front. Environ. Sci. Eng. 2021, 15, 20. [Google Scholar] [CrossRef]
  13. Wu, G.P.; Ye, C.; Liu, Y.B. Spatial distribution of wetland vegetation biomass in the Poyang Lake National Nature Reserve, China. Acta Ecol. Sin. 2015, 35, 361–369. (In Chinese) [Google Scholar] [CrossRef]
  14. Klemas, V. Remote Sensing of Coastal Wetland Biomass: An Overview. J. Coast. Res. 2013, 29, 1016–1028. [Google Scholar] [CrossRef]
  15. Adam, E.; Mutanga, O.; Rugege, D. Multispectral and hyperspectral remote sensing for identification and mapping of wetland vegetation: A review. Wetl. Ecol. Manag. 2010, 18, 281–296. [Google Scholar] [CrossRef]
  16. Barrachina, M.; Cristóbal, J.; Tulla, A.F. Estimating above-ground biomass on mountain meadows and pastures through remote sensing. Int. J. Appl. Earth Obs. Geoinf. 2015, 38, 184–192. [Google Scholar] [CrossRef]
  17. Asner, G.P.; Powell, G.V.N.; Mascaro, J.; Knapp, D.E.; Clark, J.K.; Jacobson, J.; Kennedy-Bowdoin, T.; Balaji, A.; Paez-Acosta, G.; Victoria, E.; et al. High-resolution forest carbon stocks and emissions in the Amazon. Proc. Natl. Acad. Sci. USA 2010, 107, 16738–16742. [Google Scholar] [CrossRef]
  18. Luo, S.Z.; Wang, C.; Xi, X.H.; Pan, F.F.; Peng, D.L.; Zou, J.; Nie, S.; Qin, H.M. Fusion of airborne LiDAR data and hyperspectral imagery for aboveground and belowground forest biomass estimation. Ecol. Indic. 2017, 73, 378–387. [Google Scholar] [CrossRef]
  19. Naicker, R.; Mutanga, O.; Peerbhay, K.; Odebiri, O. Estimating high-density aboveground biomass within a complex tropical grassland using Worldview-3 imagery. Environ. Monit. Assess. 2024, 196, 370. [Google Scholar] [CrossRef]
  20. Byrd, K.B.; Ballanti, L.; Thomas, N.; Nguyen, D.; Holmquist, J.R.; Simard, M.; Windham-Myers, L. A remote sensing-based model of tidal marsh aboveground carbon stocks for the conterminous United States. ISPRS J. Photogramm. Remote Sens. 2018, 139, 255–271. [Google Scholar] [CrossRef]
  21. Buffington, K.J.; Dugger, B.D.; Thorne, K.M. Climate-related variation in plant peak biomass and growth phenology across Pacific Northwest tidal marshes. Estuar. Coast. Shelf Sci. 2018, 202, 212–221. [Google Scholar] [CrossRef]
  22. Amarsaikhan, E.; Erdenebaatar, N.; Amarsaikhan, D.; Otgonbayar, M.; Bayaraa, B. Estimation and mapping of pasture biomass in Mongolia using machine learning methods. Geocarto Int. 2023, 38, 2195824. [Google Scholar] [CrossRef]
  23. Wang, S.; Tuya, H.; Zhang, S.W.; Zhao, X.Y.; Liu, Z.Q.; Li, R.S.; Lin, X. Random forest method for analysis of remote sensing inversion of aboveground biomass and grazing intensity of grasslands in Inner Mongolia, China. Int. J. Remote Sens. 2023, 44, 2867–2884. [Google Scholar] [CrossRef]
  24. Singh, R.K.; Biradar, C.M.; Behera, M.D.; Prakash, A.J.; Das, P.; Mohanta, M.R.; Krishna, G.; Dogra, A.; Dhyani, S.K.; Rizvi, J. Optimising carbon fixation through agroforestry: Estimation of aboveground biomass using multi-sensor data synergy and machine learning. Ecol. Inform. 2024, 79, 102408. [Google Scholar] [CrossRef]
  25. Belloli, T.F.; Guasselli, L.A.; Kuplich, T.M.; Ruiz, L.F.C.; de Arruda, D.C.; Etchelar, C.B.; Simioni, J.D. Estimation of aboveground biomass and carbon in palustrine wetland using bands and multispectral indices derived from optical satellite imageries PlanetScope and Sentinel-2A. J. Appl. Remote Sens. 2022, 16, 034516. [Google Scholar] [CrossRef]
  26. Gou, F.Z.; Zhao, C.Z.; Yang, J.C.; Ren, J.; Ma, J.Y.; Li, Z.Q. Spatial Heterogeneity of Above-ground Biomass in Sugan Lake Wetland Vegetation. Acta Ecol. Sin. 2021, 41, 7774–7784. (In Chinese) [Google Scholar] [CrossRef]
  27. Ramoelo, A.; Cho, M.A.; Mathieu, R.; Madonsela, S.; van de Kerchove, R.; Kaszta, Z.; Wolff, E. Monitoring grass nutrients and biomass as indicators of rangeland quality and quantity using random forest modelling and World View-2 data. Int. J. Appl. Earth Obs. Geoinf. 2015, 43, 43–54. [Google Scholar]
  28. Nakano, T.; Bavuudorj, G.; Urianhai, N.G.; Shinoda, M. Monitoring aboveground biomass in semiarid grasslands using MODIS images. J. Agric. Meteorol. 2013, 69, 33–39. [Google Scholar] [CrossRef]
  29. Cunliffe, A.M.; Assmann, J.J.; Daskalova, G.N.; Kerby, J.T.; Myers-Smith, I.H. Aboveground biomass corresponds strongly with drone-derived canopy height but weakly with greenness (NDVI) in a shrub tundra landscape. Environ. Res. Lett. 2020, 15, 125004. [Google Scholar] [CrossRef]
  30. Alegria, C. Aboveground Biomass Mapping and Fire Potential Severity Assessment: A Case Study for Eucalypts and Shrubland Areas in the Central Inland Region of Portugal. Forests 2023, 14, 1795. [Google Scholar] [CrossRef]
  31. Dashpurev, B.; Dorj, M.; Phan, T.N.; Bendix, J.; Lehnert, L.W. Estimating fractional vegetation cover and aboveground biomass for land degradation assessment in eastern Mongolia steppe: Combining ground vegetation data and remote sensing. Int. J. Remote Sens. 2023, 44, 452–468. [Google Scholar] [CrossRef]
  32. Zhang, M.; Ma, X.H.; Chen, A.; Guo, J.; Xing, X.Y.; Yang, D.; Xu, B.; Lan, X.Y.; Yang, X.C. A spatio-temporal fusion strategy for improving the estimation accuracy of the aboveground biomass in grassland based on GF-1 and MODIS. Ecol. Indic. 2023, 157, 111276. [Google Scholar] [CrossRef]
  33. Zhou, Y.J.; Liu, T.X.; Batelaan, O.; Duan, L.M.; Wang, Y.X.; Li, X.; Li, M.Y. Spatiotemporal fusion of multi-source remote sensing data for estimating aboveground biomass of grassland. Ecol. Indic. 2023, 146, 109892. [Google Scholar] [CrossRef]
  34. Han, Y.; Pei, L.; Du, J. Remote Sensing Inversion of Aboveground Biomass over the Honghe Wetland. Remote Sens. Technol. Appl. 2014, 29, 224–231. (In Chinese) [Google Scholar]
  35. Zhao, T.G.; Yu, R.H.; Zhang, Z.L. Estimation of wetland vegetation aboveground biomass based on remote sensing data: A review. Chin. J. Ecol. 2016, 35, 1936–1946. (In Chinese) [Google Scholar]
  36. O’Donnell, J.P.R.; Schalles, J.F. Examination of Abiotic Drivers and Their Influence on Biomass over a Twenty-Eight Year Period Using Landsat 5 TM Satellite Imagery of the Central Georgia Coast. Remote Sens. 2016, 8, 477. [Google Scholar] [CrossRef]
  37. Zhang, Q.; Ye, X.C.; Werner, A.D.; Li, Y.L.; Yao, J.; Li, X.H.; Xu, C.Y. An investigation of enhanced recessions in Poyang Lake: Comparison of Yangtze River and local catchment impacts. J. Hydrol. 2014, 517, 425–434. [Google Scholar] [CrossRef]
  38. Li, X.; Hu, Q.; Zhang, Q.; Wang, R. Response of rainfall erosivity to changes in extreme precipitation in the Poyang Lake basin, China. J. Soil Water Conserv. 2020, 75, 537–548. [Google Scholar] [CrossRef]
  39. Li, X.H.; Zhang, Q.; Hu, Q.; Zhang, D.; Ye, X.C. Lake flooding sensitivity to the relative timing of peak flows between upstream and downstream waterways: A case study of Poyang Lake, China. Hydrol. Process. 2017, 31, 4217–4228. [Google Scholar] [CrossRef]
  40. Zhang, Q.; Li, L.; Wang, Y.G.; Werner, A.D.; Xin, P.; Jiang, T.; Barry, D.A. Has the Three-Gorges Dam made the Poyang Lake wetlands wetter and drier? Geophys. Res. Lett. 2012, 39, L20402. [Google Scholar] [CrossRef]
  41. Li, X.H.; Ye, X.C.; Yao, J.; Lin, Y.L.; Xu, C.Y.; Yuan, C.Y. Influences of increasing water release of the Three Gorges Reservoir during dry season on water regimes of downstream lake. Hydrol. Process. 2023, 37, e14895. [Google Scholar] [CrossRef]
  42. Li, X.H.; Ye, X.C.; Yuan, C.Y.; Xu, C.Y. Can water release from local reservoirs cope with the droughts of downstream lake in a large river-lake system? J. Hydrol. 2023, 625, 130172. [Google Scholar] [CrossRef]
  43. Hu, Z.P.; Lin, Y.R. Analysis of evolution process and driving factors for aquatic vegetations of Poyang Lake in 30 years. Resour. Environ. Yangtze Basin 2019, 28, 1947–1955. (In Chinese) [Google Scholar]
  44. Wang, R.; Li, X.H.; Zhang, Q.; Cheng, J.X.; Li, J.F.; Zhang, D.; Liu, Y.B. Projection of drought-flood abrupt alternation in a humid subtropical region under changing climate. J. Hydrol. 2023, 624, 129875. [Google Scholar] [CrossRef]
  45. Lin, Y.L.; Li, X.H.; Tan, Z.Q.; Song, Y.Y.; Xu, C.Y. Dynamic characteristics of vegetation communities in the floodplain wetland of Poyang Lake based on spatiotemporal fusion of remote sensing data. J. Lake Sci. 2023, 35, 1408–1422. (In Chinese) [Google Scholar]
  46. Xu, L.G.; Xu, W.M.; Wang, X.L. Research on the Ecological Environment of Poyang Lake; Science Press: Beijing, China, 2023. (In Chinese) [Google Scholar]
  47. Hu, Y.X.; Huang, J.L.; Du, Y.; Han, P.P.; Wang, J.L.; Huang, W. Monitoring wetland vegetation pattern response to water-level change resulting from the Three Gorges Project in the two largest freshwater lakes of China. Ecol. Eng. 2015, 74, 274–285. [Google Scholar] [CrossRef]
  48. Han, X.X.; Feng, L.; Hu, C.M.; Chen, X.L. Wetland changes of China’s largest freshwater lake and their linkage with the Three Gorges Dam. Remote Sens. Environ. 2018, 204, 799–811. [Google Scholar] [CrossRef]
  49. Wan, R.R.; Wang, P.; Wang, X.L.; Yao, X.; Dai, X. Mapping Aboveground Biomass of Four Typical Vegetation Types in the Poyang Lake Wetlands Based on Random Forest Modelling and Landsat Images. Front. Plant Sci. 2019, 10, 1281. [Google Scholar] [CrossRef]
  50. Dai, X.; Wan, R.R.; Yang, G.S.; Wang, X.L.; Xu, L.G.; Li, Y.Y.; Li, B. Impact of seasonal water-level fluctuations on autumn vegetation in Poyang Lake wetland, China. Front. Earth Sci. 2019, 13, 398–409. [Google Scholar] [CrossRef]
  51. Li, Y.; Yu, X.B.; Guo, Q.; Liu, Y.; Xia, S.X.; Zhang, G.S.; Zhang, Q.J.; Duan, H.L.; Zhao, L. Estimating the biomass of Carex cinerascens (Cyperaceae) in floodplain wetlands in Poyang Lake, China. J. Freshw. Ecol. 2019, 34, 379–394. [Google Scholar] [CrossRef]
  52. Hu, Z.P.; Ge, G.; Liu, C.L.; Chen, F.S.; Li, S. Structure of Poyang Lake wetland plants ecosystem and influence of lake water level for the structure. Resour. Environ. Yangtze Basin 2010, 19, 597–605. (In Chinese) [Google Scholar]
  53. Hu, Q.; Feng, S.; Guo, H.; Chen, G.; Jiang, T. Interactions of the Yangtze river flow and hydrologic processes of the Poyang Lake, China. J. Hydrol. 2007, 347, 90–100. [Google Scholar] [CrossRef]
  54. Zhou, W.B.; Wan, J.B.; Jiang, J.H. The Impact of Water Level Changes in Poyang Lake on Its Ecosystem; Science Press: Beijing, China, 2011. (In Chinese) [Google Scholar]
  55. Chen, B.; Chen, L.F.; Huang, B.; Michishita, R.; Xu, B. Dynamic monitoring of the Poyang Lake wetland by integrating Landsat and MODIS observations. ISPRS J. Photogramm. Remote Sens. 2018, 139, 75–87. [Google Scholar] [CrossRef]
  56. Todd, M.J.; Muneepeerakul, R.; Pumo, D.; Azaele, S.; Miralles-Wilhelm, F.; Rinaldo, A.; Rodriguez-Iturbe, I. Hydrological drivers of wetland vegetation community distribution within Everglades National Park, Florida. Adv. Water Resour. 2010, 33, 1279–1289. [Google Scholar] [CrossRef]
  57. Zhang, G.X. The effects of changes in hydrological regimes and salinity on wetland vegetation: A review. Acta Ecol. Sin. 2012, 32, 4254–4260. (In Chinese) [Google Scholar] [CrossRef]
  58. Hebb, A.J.; Mortsch, L.D.; Deadman, P.J.; Cabrera, A.R. Modeling wetland vegetation community response to water-level change at Long Point, Ontario. J. Great Lakes Res. 2013, 39, 191–200. [Google Scholar] [CrossRef]
  59. Yang, J.; Li, E.H.; Cai, X.B.; Wang, Z.; Wang, X.L. Research Progress in Response of Plants in Wetlands to Water Level Change. Wetl. Sci. 2014, 12, 807–813. (In Chinese) [Google Scholar]
  60. Xie, D.M.; Zheng, P.; Deng, H.B.; Zhao, J.Z.; Fan, Z.W.; Fang, Y. Landscape responses to changes in water levels at Poyang Lake wetlands. Acta Ecol. Sin. 2011, 31, 1269–1276. (In Chinese) [Google Scholar]
  61. Li, X.H.; Ye, X.C.; Li, Z.; Zhang, D. Hydrological drought in two largest river-connecting lakes in the middle reaches of the Yangtze River, China. Hydrol. Res. 2023, 54, 82–98. [Google Scholar] [CrossRef]
  62. Li, X.H.; Lin, Y.L.; Ye, X.C.; Yuan, C.Y.; Tan, Z.Q.; Sun, T. The impacts of drought on the ecological niches of typical wetland plants in Poyang Lake, China. Hydrol. Res. 2024, 55, 890–904. [Google Scholar] [CrossRef]
  63. Han, X.X.; Chen, X.L.; Feng, L. Four decades of winter wetland changes in Poyang Lake based on Landsat observations between 1973 and 2013. Remote Sens. Environ. 2015, 156, 426–437. [Google Scholar] [CrossRef]
  64. Qin, X.Y.; Xie, Y.H.; Chen, X.S. Competition and facilitation among wetland plants: A review. Chin. J. Ecol. 2010, 29, 117–123. (In Chinese) [Google Scholar]
  65. Meng, B.; Liu, J.L.; Bao, K.; Sun, B. Methodologies and Management Framework for Restoration of Wetland Hydrologic Connectivity: A Synthesis. Integr. Environ. Assess. Manag. 2020, 16, 438–451. [Google Scholar] [CrossRef]
  66. Yuan, J.; Cohen, M.J.; Kaplan, D.A.; Acharya, S.; Larsen, L.G.; Nungesser, M.K. Linking metrics of landscape pattern to hydrological process in a lotic wetland. Landsc. Ecol. 2015, 30, 1893–1912. [Google Scholar] [CrossRef]
  67. Wang, Q.; Liao, J.J. Estimation of wetland vegetation biomass in the Poyang Lake area using Landsat TM and Envisat ASAR data. In Proceedings of the Sixth International Symposium on Digital Earth: Data Processing and Applications, Beijing, China, 9–12 September 2009; Volume 7841, pp. 420–429. [Google Scholar]
  68. Li, R.; Liu, J. Wetland vegetation biomass estimation and mapping from Landsat ETM data: A case study of Poyang Lake. J. Geogr. Sci. 2002, 12, 35–41. [Google Scholar] [CrossRef]
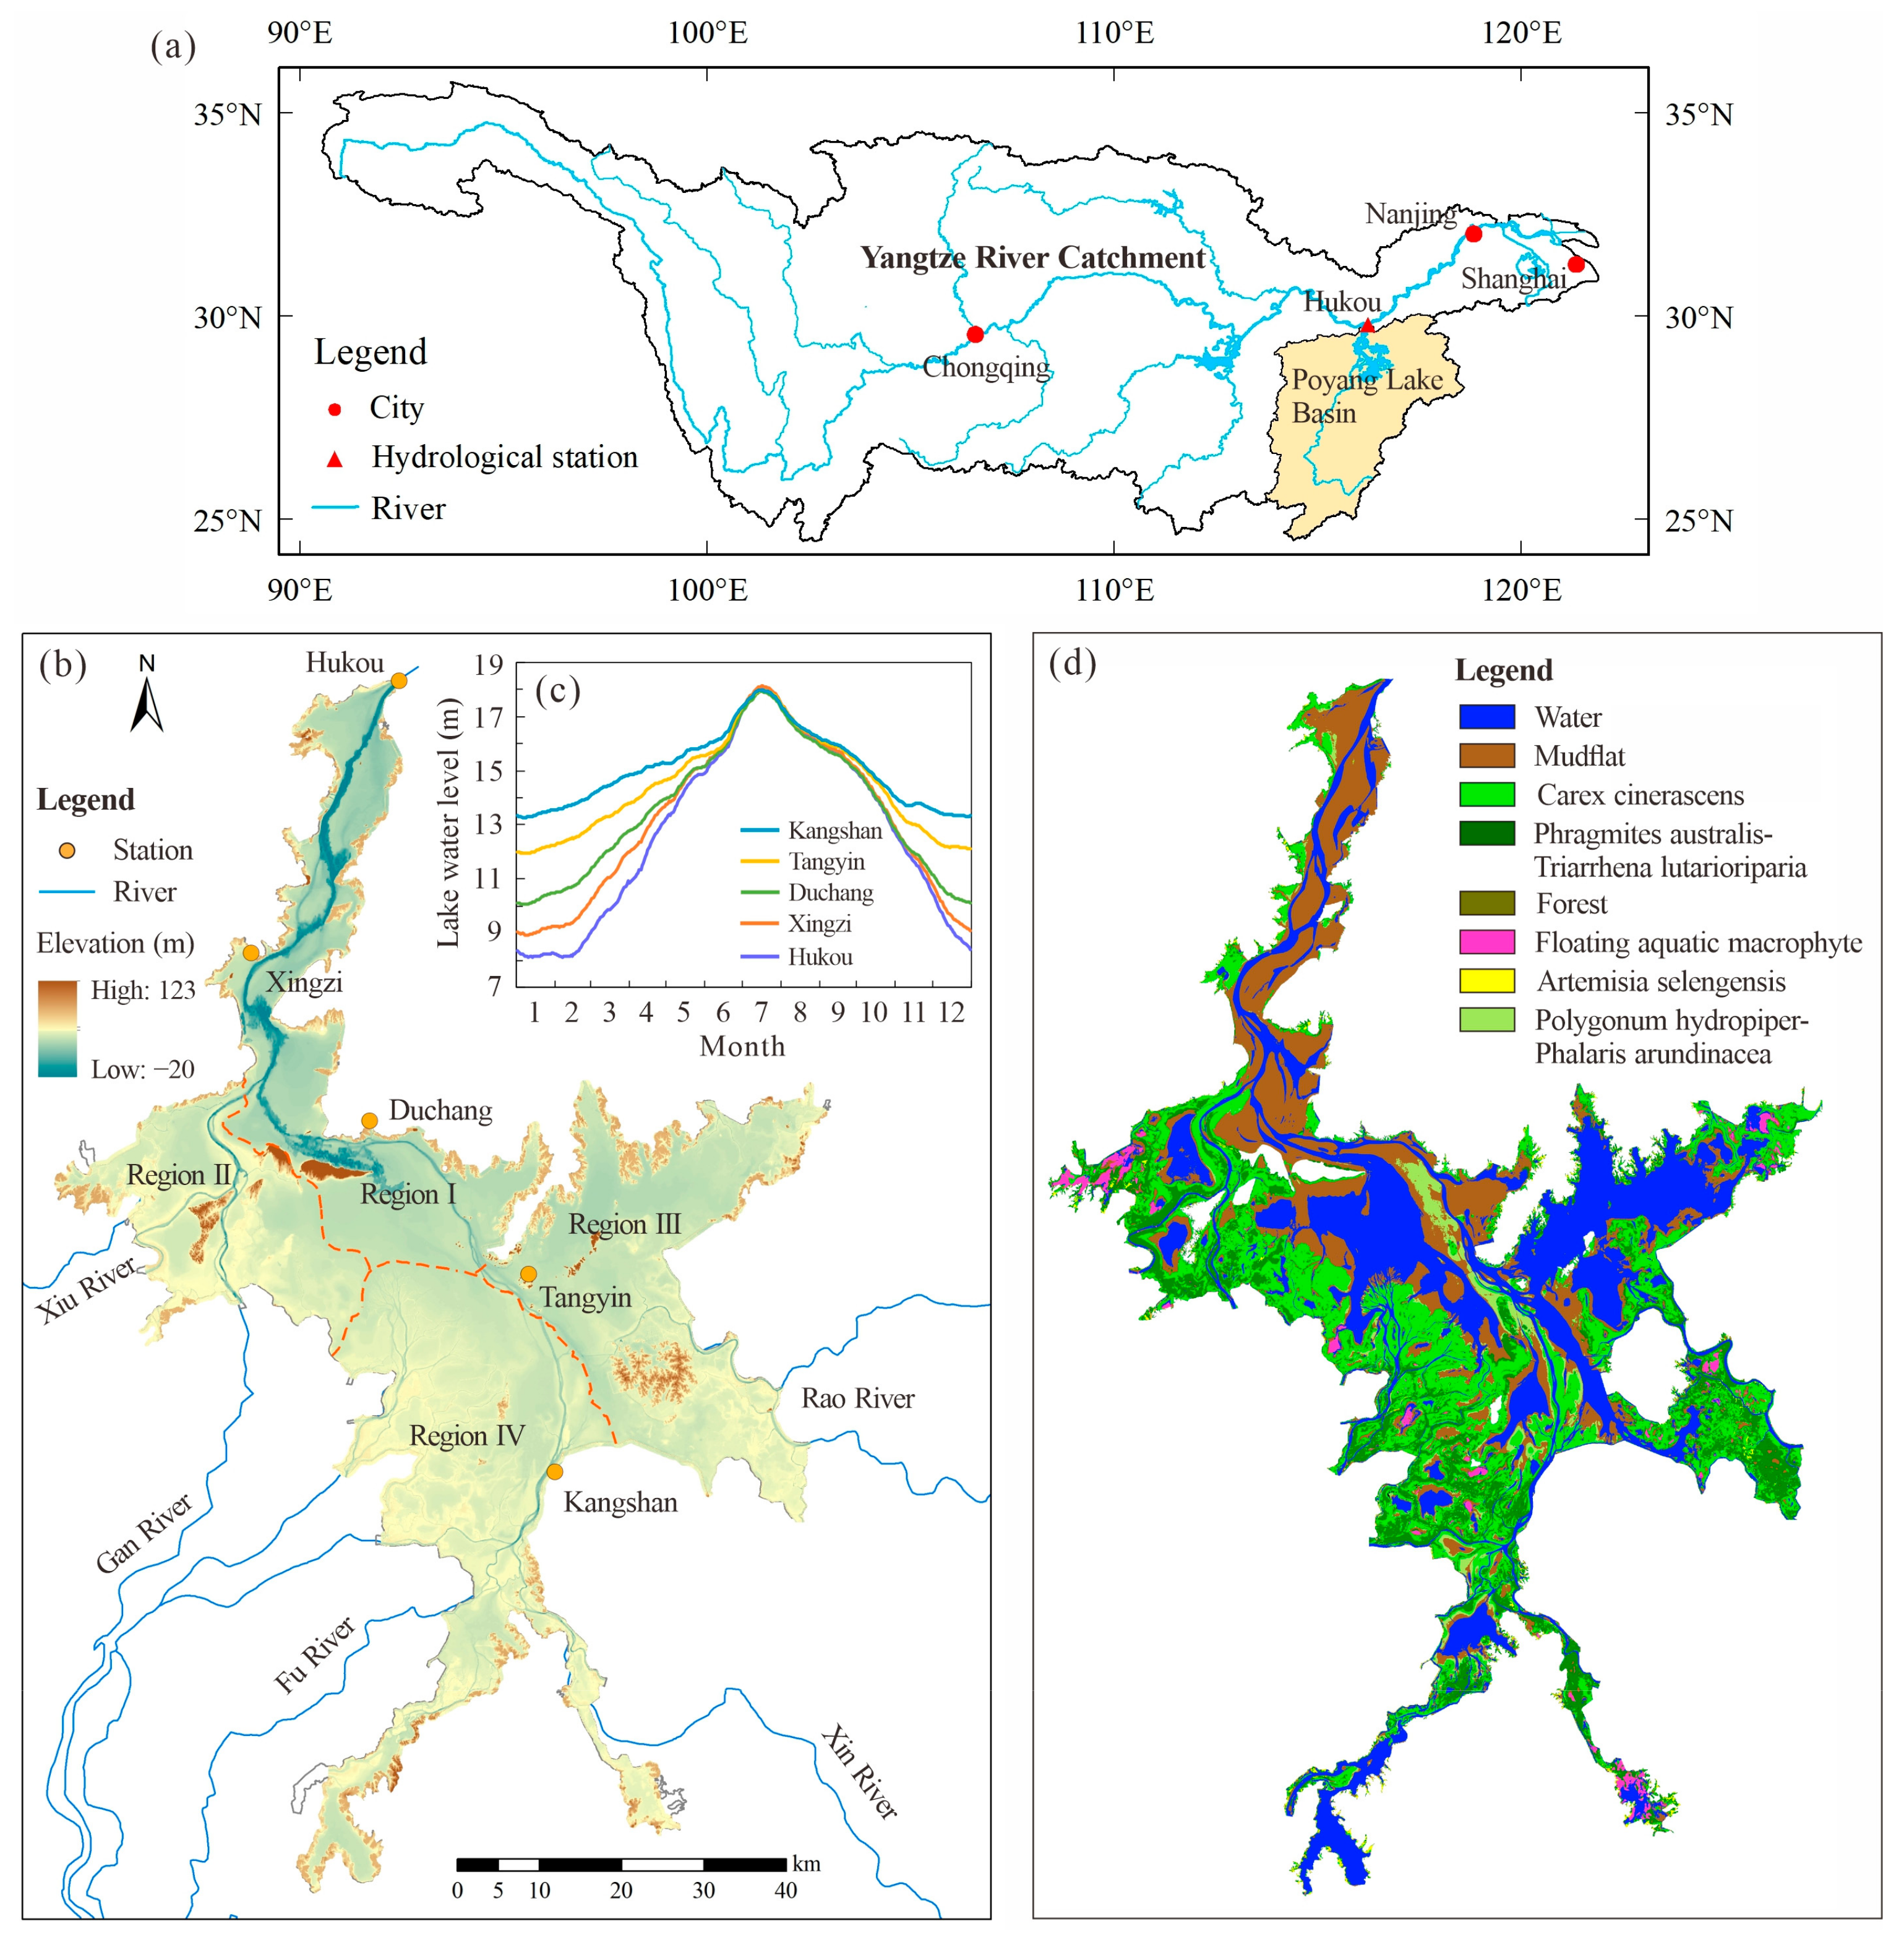
Figure 1. Location (a) and elevation (b) of PYL wetland, changes in lake water level (c), and distribution of wetland vegetation (d).
Remotesensing 17 03754 g001
Figure 2. Monthly variation in vegetation AGB (a) and total AGB values (b) in the PYL wetland.
Remotesensing 17 03754 g002
Figure 3. Monthly variation in AGB and total AGB values of the Cc (a), P-T (b), As (c), and P-P (d) communities in PYL wetland.
Remotesensing 17 03754 g003
Figure 4. Interannual variation in vegetation AGB and total AGB values in the PYL wetland ((a) average, (b) Cc, (c) P-T, (d) As, and (e) P-P).
Remotesensing 17 03754 g004
Figure 5. Spatial distributions of vegetation AGB in PYL wetland during 2001–2020.
Remotesensing 17 03754 g005
Figure 6. Distribution of average vegetation AGB (a) and corresponding area proportion of different AGB groups in different wetland regions (b,c).
Remotesensing 17 03754 g006
Figure 7. Distribution of average AGB of four typical plants in different wetland regions ((a), region I; (b), region II; (c), region III; (d), region IV).
Remotesensing 17 03754 g007
Figure 8. Variation in vegetation AGB and total AGB values along elevation gradients in the PYL wetland ((a) whole, (b) region I, (c) region II, (d) region III, (e) region IV).
Remotesensing 17 03754 g008
Figure 9. Changes in the average AGB of four typical wetland plant communities along elevation gradients ((ad) whole, (eh) region I, (il) region II, (mp) region III, (qt) region IV).
Remotesensing 17 03754 g009
Figure 10. Variation in total AGB values of four typical wetland plant communities along elevation gradients ((ad) whole, (eh) region I, (il) region II, (mp) region III, (qt) region IV).
Remotesensing 17 03754 g010
Figure 11. Gaussian curves of area–elevation for four typical plant communities in the PYL wetland ((a) whole, (b) region I, (c) region II, (d) region III, (e) region IV).
Remotesensing 17 03754 g011
Figure 12. Interannual variation in the area of four typical plant communities in the PYL wetland.
Remotesensing 17 03754 g012
Table 1. Comparison of the AGB of four typical wetland plant communities in different wetland regions.
Plant CommunityRegion IRegion IIRegion IIIRegion IV
Mean (g/m2)SD (g/m2)Mean (g/m2)SD (g/m2)Mean (g/m2)SD (g/m2)Mean (g/m2)SD (g/m2)
Cc1368368163431915562721700244
P-T1443233177131416922261838231
As1331193143321713421811462271
P-P7951891075289833196924201
Note: Cc, Carex cinerascens; P-T, Phragmites australis-Triarrhena lutarioriparia; As, Artemisia selengensis; P-P, Polygonum hydropiper-Phalaris arundinacea; SD, standard deviation.
Disclaimer/Publisher’s Note: The statements, opinions and data contained in all publications are solely those of the individual author(s) and contributor(s) and not of MDPI and/or the editor(s). MDPI and/or the editor(s) disclaim responsibility for any injury to people or property resulting from any ideas, methods, instructions or products referred to in the content.