Article

Inferring River Channel Geometry Based on Multi-Satellite Datasets and Hydraulic Modeling

1
Key Laboratory of Groundwater Resources and Environment, Ministry of Education, Jilin University, Changchun 130021, China
2
Jilin Provincial Key Laboratory of Water Resources and Environment, Jilin University, Changchun 130021, China
3
College of New Energy and Environment, Jilin University, Changchun 130021, China
4
Hydraulic Engineering Research Institute, Jilin University, Changchun 130021, China
5
College of Water Conservancy and Environmental Engineering, Changchun Institute of Technology, Changchun 130012, China
6
Satellite Application Center for Ecology and Environment, Ministry of Ecology and Environment/Key Laboratory of Satellite Remote Sensing, Ministry of Environmental Protection, Beijing 100094, China
7
China Water Northeastern Investigation, Design and Research Company, Changchun 130021, China
8
Department of Civil and Environmental Engineering, Hanam University, 70 Hannam-ro, Daedeok-gu, Daejeon 34430, Republic of Korea
*
Author to whom correspondence should be addressed.
Remote Sens. 2025, 17(22), 3753; https://doi.org/10.3390/rs17223753
Submission received: 28 September 2025 / Revised: 6 November 2025 / Accepted: 17 November 2025 / Published: 18 November 2025

Highlights

What are the main findings?
  • An innovative method integrating multi-source satellite images and hydraulic modeling is proposed to develop channel geometry.
  • Both channel widths and bottom elevations are well predicted.
  • The predicted channel geometry leads to good hydrodynamic simulations.
What are the implications of the main findings?
  • Channel geometry for inland rivers can be derived from satellite data instead of ground surveys.
  • The derived channel geometry can be used to drive hydrodynamic simulations, which provide critical bathymetry for data-scarce watersheds.

Abstract

Channel geometry, e.g., riverbed elevation and channel width, is the fundamental input for hydrodynamic simulations and conveys critical information for understanding fluvial processes. In remote or data-scarce areas, however, traditional field surveys face financial and technical challenges for providing enough spatiotemporal coverage. This study proposes an innovative method integrating multi-source satellite data (Sentinel-2 and ICESat-2) and hydraulic modeling to derive channel geometry for part of the Nen River, China. Both channel width (R2 = 0.98, RMSE = 35.41 m) and bottom elevation (R2 = 0.86, RMSE = 1.77 m, PBIAS = −0.61%) are well predicted. The satellite-derived channel geometry results in an overall good simulation of 1D flows through the 5-yr period in terms of peak magnitudes and timings, with the NSE value of 0.94, RMSE of 207.76 m3/s, and PBIAS of 6.19%. The 2D inundation driven by the derived channel geometry achieved accurate hydrodynamic responses. However, for the channel bend with complicated flow regimes, the satellite-derived channel terrains tend to generate more different flow rates due to the hypothesized rectangular channel. This proposed method provides a promising way to derive river bathymetry in both low-gradient and high-slope regions where precise river topography is difficult to obtain.

1. Introduction

Rivers are essential networks in the Earth’s water cycle, undertaking crucial functions such as water resource allocation, flood regulation, ecosystem maintenance, navigation, and geomorphological shaping. A deep understanding of the river system is critically important for analyzing and addressing escalating riverine flooding risks [1,2]. As the fundamental geometric characteristics of river channels, the top width and riverbed elevation play a role in determining the hydraulic properties, such as flow area and bed slope at cross sections, and affecting the entire flow field.
For a watershed or an even larger-scale region, the high-resolution channel geometric parameters are difficult to obtain. Traditional field surveys through staff gauge, acoustic Doppler current profiler (ADCP), or real-time kinematics positioning (RTK) can provide localized high-precision data but are laborious and costly for large-scale monitoring, especially when numerous tributaries are involved. The limitations of those point-scale datasets in terms of spatial coverage and resolution result in inadequate representation of the spatial heterogeneity of complex river networks [3]. Changes in channel morphology driven by floods, scours, and depositions further demand a more timely and efficient surveying method. Unmanned surface vehicles (USVs) can partly reduce the labor for field surveys but are constrained by high-velocity flows and harsh conditions [4,5].
Compared to in situ measurements, satellite-borne sensors provide global-scale spectral and altimetry datasets with up to sub-meter resolutions, which could help address the sparse coverage and outdated nature of ground surveys of channel characteristics, especially for the data-scarce regions.
The retrieval of the top width of river channels based on remote sensed multispectral and elevation observations is relatively straightforward. By the RivWidth (V04) tool [6], the Landsat reflectance values have been used to develop the North American River Width (NARWidth) dataset and the Global River Width Dataset (GRWL) [7,8]. The width retrieval from the Landsat imagery was further automated by RivaMap and validated by NARWidth (V1.0) [9]. The RivWidth tool was further parallelized to generate the Multi-temporal China River Width (MCRW) dataset covering the period of 1990–2015, which was validated against the GRWL [10]. The water masks, retrieved from the Shuttle Radar Topography Mission (SRTM) Water Body Data (SWBD), were used to develop the Global Width Database for Large Rivers (GWD-LR), which yet inadequately covers rivers narrower than 300 m [11]. Such methods are constrained by the resolution of multispectral data, like 30 m for Landsat, so narrower channels remain less detected. The remote sensing-derived river width also suffers from the ambiguity and variations in water–land boundaries due to shadows, waves, and on-channel objects like bridges, dams, ships, or wetlands [12].
Riverbed elevation is crucial for modeling flood propagation, yet it proves more challenging to estimate via satellite [13]. The downscaled bathymetric mapping approach (DBMA) was proposed to integrate the bathymetry retrieved from Landsat-8 with higher-resolution imagery from Sentinel-2A/B, GaoFen-1/2, ZiYuan-3, and WorldView-2 by random matchup, which achieved a root mean square error (RMSE) smaller than 2 m [14]. Traditional optical imaging methods (such as Sentinel-2 and Landsat) rely on the light attenuation properties of clear water, but their performance degrades significantly in turbidity. The Ice, Cloud, and Land Elevation Satellite 2 (ICESat-2), launched on 15 September 2018, carries a photon-counting laser altimeter and provides more possibility for bathymetry mapping [15]. Some pioneering studies have used deep learning to integrate spectral information from Sentinel-2 satellites with depths sampled through clear water by ICESat-2, aiming to construct the continuous bathymetric seafloor [16]. Although ICESat-2 has been applied for shallow coastal waters, its detection capabilities for inland river channels remain less known but become more promising [17].
With these research challenges and opportunities, this study aims to propose an inversion framework to retrieve channel width and riverbed elevation from multi-source remote sensing data when integrated with hydrodynamic models. The proposed approach seeks to quantitatively identify the key characteristics of channel geometry in ungauged reaches and overcome the limitations of traditional in situ measurements in terms of limited spatial coverage and temporal resolution.

2. Materials and Methods

This study employs an integrated approach to derive the channel width and bottom elevation by combining satellite retrieval and hydrologic routing (Figure 1). The water surface elevation (Hj) and river width (Wj) of the jth cross section were retrieved from the ICESat-2 and Sentinel-2B, respectively. The Muskingum method was used to provide hydrologic routing calculation to generate the discharge at each cross section (Qj). For the data-scarce region where streamflow observation is limited, the rating curve at the outlet with the known water surface elevation (hout) and discharge (Qout) was extrapolated to the upstream cross sections.

2.1. Materials

2.1.1. Study Area

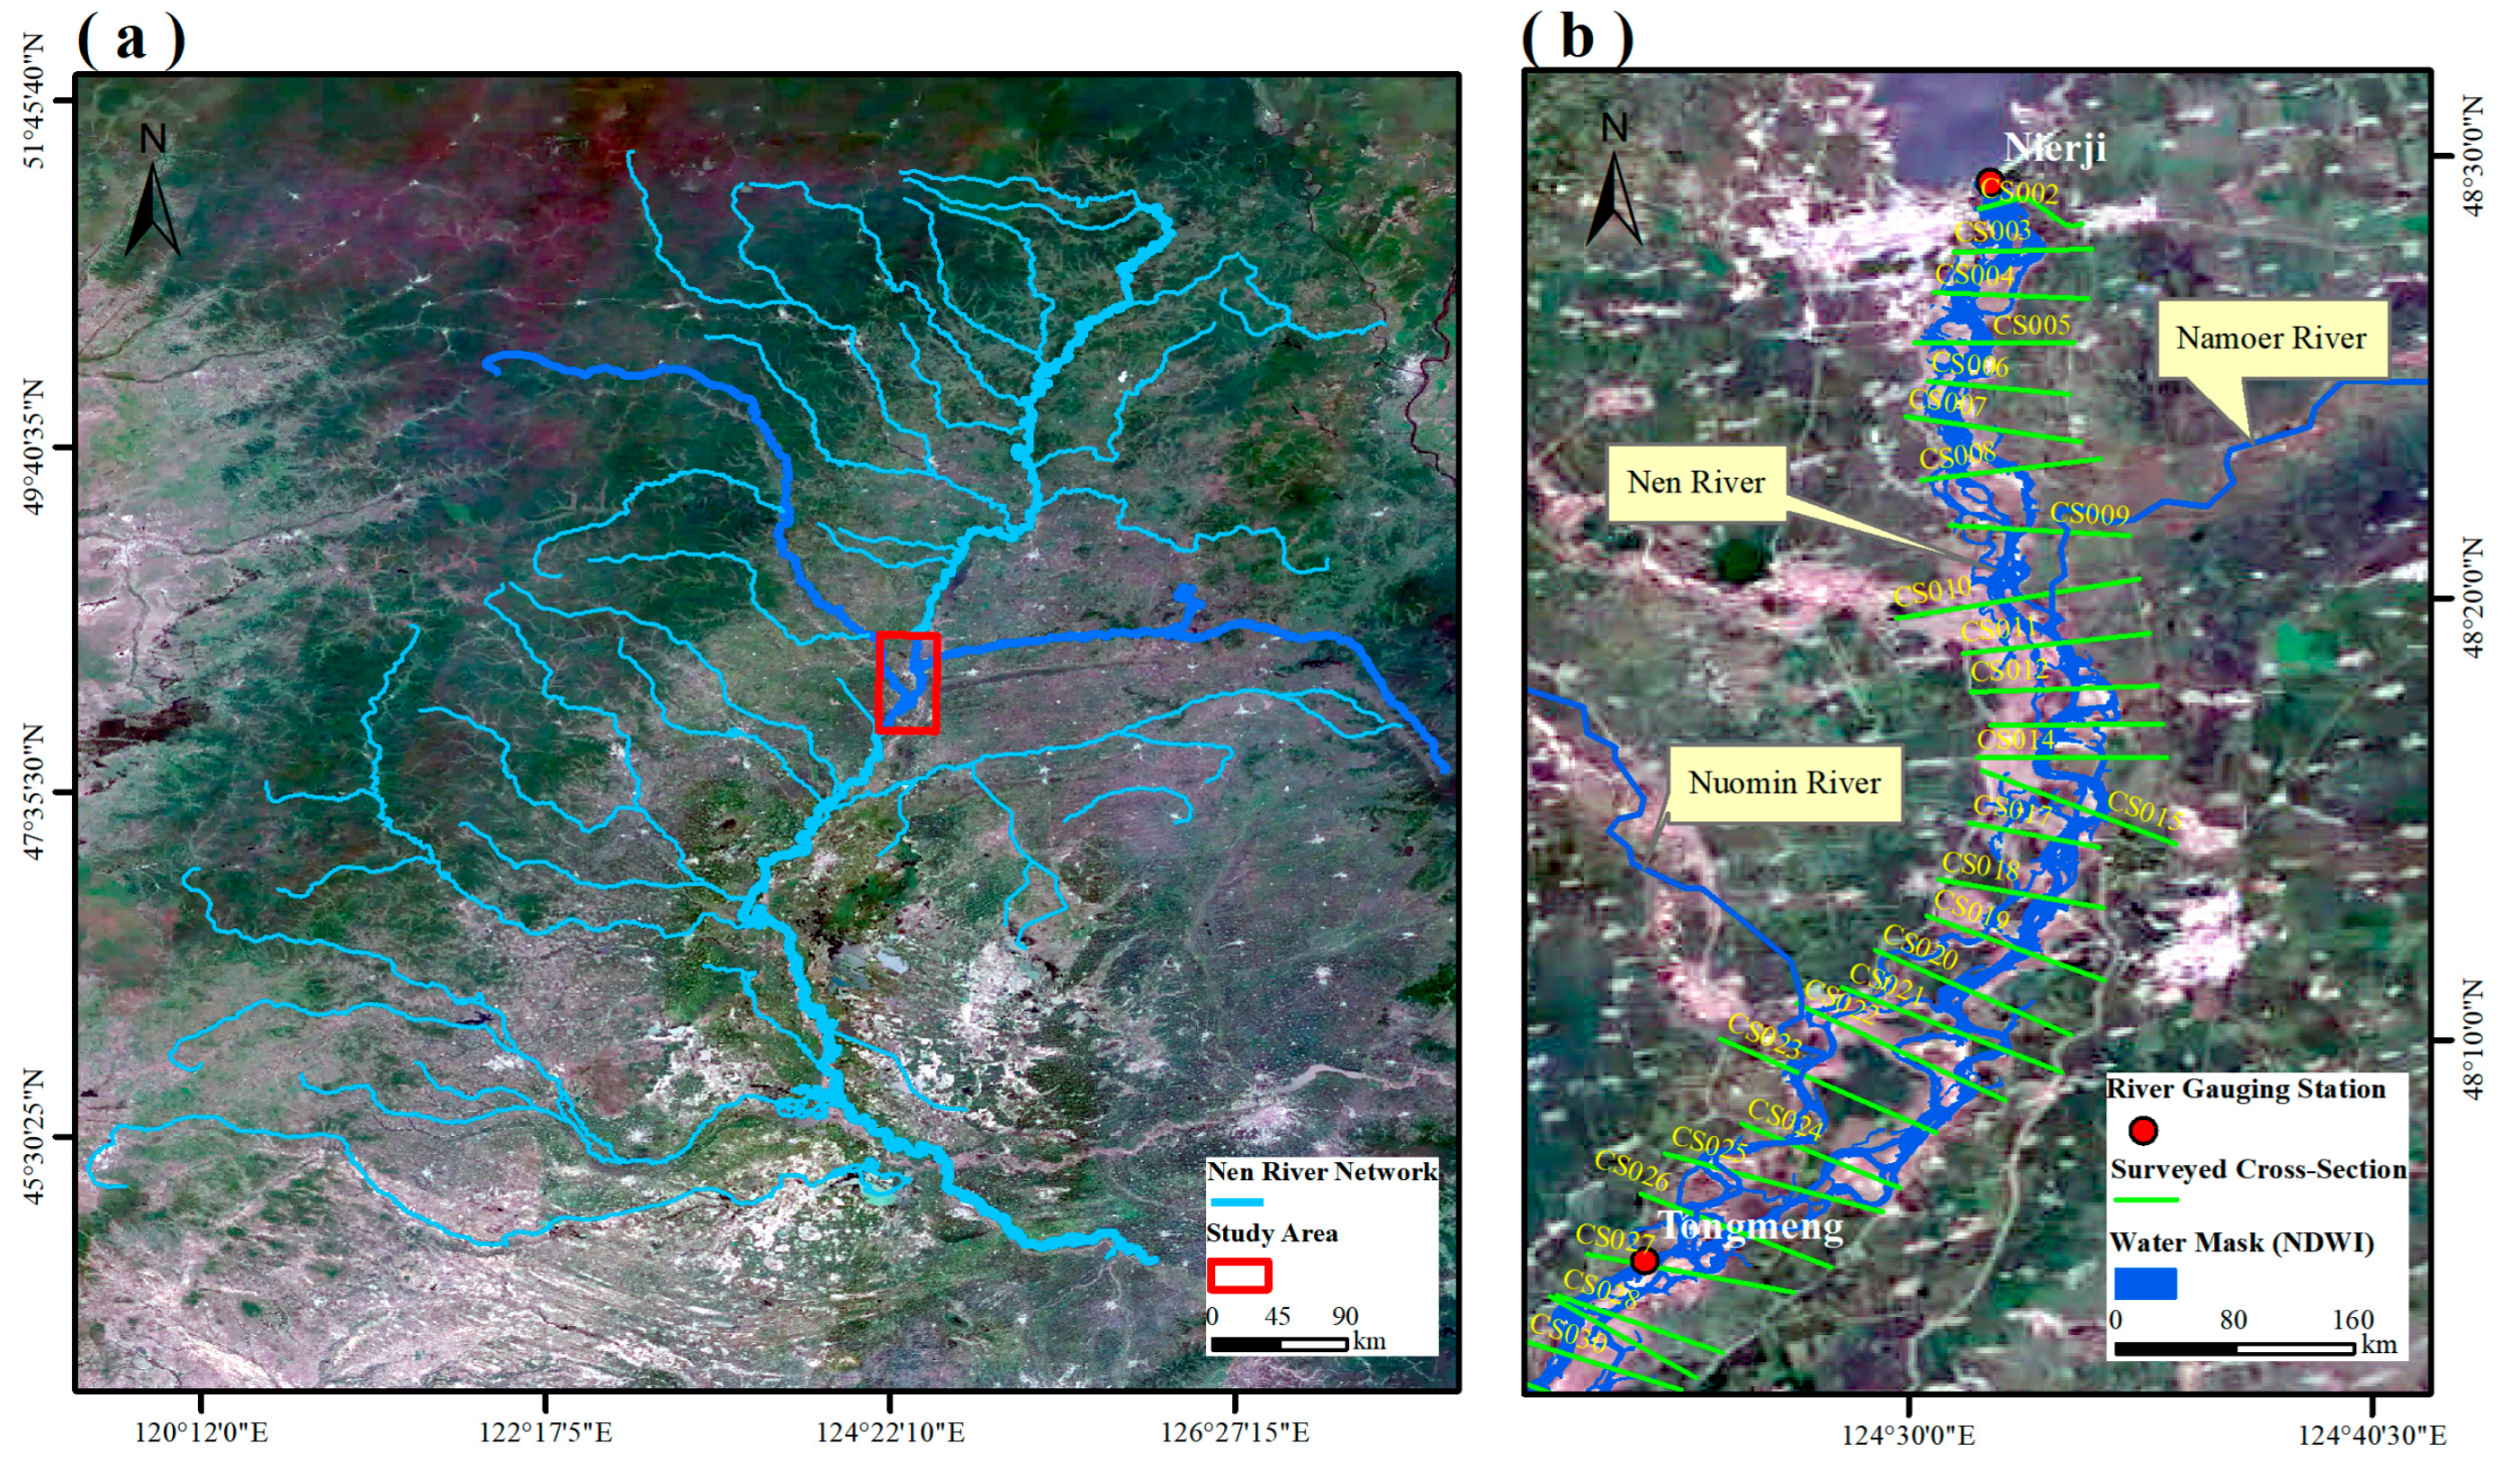
Nen River is the largest tributary of Songhua River and has a total length of 1370 km and an area of 297,000 km2 spanning from 119°15′ to 127°40′E longitude and from 44°26′ to 51°37′N latitude, with an average elevation of 1030 m (Figure 2). The region features a distinctive topography, characterized by higher elevations in the northwest and lower terrain in the east that transitions into the Songnen Plain. The main channel flows southward, passing through regions including multiple cities including Qiqihar, a major city with a population of approximately 1.24 million [18]. Nen River is regulated by the Nierji reservoir at the upstream for multi-objectives such as flood control, irrigation, power generation, and wetland protection [19]. This study primarily focuses on the lower reach of the Nen River, specifically between the downstream area of the Nierji reservoir and the Tongmeng stream gauge. This river reach has relatively flat and meandering channels with a channel slope of only 0.0225%. The width of the main channel is 480 m and the water depth is 4.65 m on average.
The climate of the study area is clearly seasonal, with an average annual precipitation of 400–600 mm. Rainfall is mainly concentrated between June and August, often leading to flooding in summer. In winter, low temperatures and frozen rivers affect the continuity of hydrological observations. The water releases of the Nierji reservoir help maintain the functionality of downstream ecosystems [20].

2.1.2. Streamflow Data

The 3-hr streamflow observations during 2018–2022 were obtained from the Nierji and Tongmeng stream gauges, which represent the inlet and outlet of the studied river reach. The time series were divided into the periods of 2018–2020 and 2021–2022 for calibration and validation, respectively. The water levels of the Nierji gauge range from 180 m to 186 m and streamflow varies up to 4230 m3/s. The water levels of the Tongmeng gauge range from 165 m to 170 m and the peak flow is 5410 m3/s.
The streamflow time series of the two tributaries (Namoer River and Nuomin River) were also collected. Their flows are added to the main stem, as additional upstream and downstream source terms, respectively, to conserve mass for river routing.
The streamflow time series are preprocessed to remove invalid data points. These implausible values (e.g., negative discharges or zero flows during high-flow periods) can be identified through cross-verification with upstream and downstream data.

2.1.3. Cross Section Surveys

A total of 25 cross sections were surveyed in 2021 along the studied river reach, with a total length of approximately 62.1 km and an average spacing of 2.59 km between cross sections. Most transects are evenly distributed along the river channel to capture the major geomorphic features. A few cross sections are placed at critical river bends with complex flow conditions.

2.1.4. Satellite Data

The on-board Advanced Terrain Laser Altimeter System (ATLAS) of the ICESat-2 satellite operates at 532 nm and emits 10,000 laser pulses per second to provide precise elevation measurements. Each pulse is divided into six beams (three pairs), while each pair consists of a strong and a weak beam (4:1 intensity ratio), allowing for fine terrain profiling and cross validation. Using photon time-of-flight measurements, it achieves sub-meter vertical accuracy, which greatly exceeds its predecessor in terms of spatial resolution and precision [15,21]. In this study, the ATLAS Level-3A Global Geolocated Photon Data (ATL03) during 2018–2022 were used to extract river water surface elevation.
The Sentinel-2B multispectral image collected on 13 August 2024, when the channel was relatively full at the high flow condition through 2018–2022, is used for water body extraction and channel width retrieval. Sentinel-2B was launched by the European Space Agency (ESA) in March 2017 and operated in a sun-synchronous orbit at an altitude of about 786 km covering 84°N–84°S [22]. Its pushbroom Multi-Spectral Imager (MSI) sensor (Airbus Defence and Space, Toulouse, France) captures 13 spectral bands, including four 10 m resolution bands (visible and near-infrared: B2, B3, B4, B8), six 20 m bands (red-edge and short-wave infrared: B5, B6, B7, B8A, B11, B12), and three 60 m atmospherically corrected bands (B1, B9, B10) [23]. The specific acquisition dates for all satellite data used in this study are provided in the Table S1.

2.2. Satellite Image Processing

2.2.1. Water Body Retrieval and Width Calculation

The Normalized Difference Water Index (NDWI) is applied to extract water body mask (Figure 2b):
N D W I = ρ G r e e n ρ N I R ρ G r e e n + ρ N I R ,
where ρ G r e e n and ρ N I R represent the reflectance values of Sentinel-2 images in the green band (B3, 560 nm) and near-infrared band (B8, 842 nm), respectively [24]. The NDWI values of the water body are presumed to be in the (0, 1] interval [25]. River width at each cross section is calculated in ArcGIS 10.6 based on the generated water body area. The river centerline is extracted by connecting the midpoints of transects on the water body mask.

2.2.2. Water Surface Elevation Retrieval

A Python 3.12 script is developed for automatically preprocessing and spatially filtering ICESat-2 ATL03 photon data. The NDWI-derived water body is used as the mask to extract the photons for the river surface, during which the geographic coordinates and elevation attributes of the photon events are looked up from the laser beam groups (e.g., gt1l, gt2l).
A 3 × 3 median filtering, as a nonlinear signal processing technique based on the theory of order statistics [26], is taken for impulse noise suppression while preserving edge information. Its nonlinear nature mitigates the blurring and contrast degradation problems often associated with linear filters [27].
The ICESat-2 water surface elevations are measured relative to the World Geodetic System 1984 (WGS84), while the observed riverbed elevations are relative to the China National Vertical Datum 1985 (CVD 1985). The former system is based on reference ellipsoid, while the latter is based on a geoid with a fixed zero point as the mean sea level at Qingdao tide gauge during 1952–1979 [28]. To reconcile the differences between the two reference systems, a conversion is conducted based on the Earth Gravity Model 2008 (EGM2008):
H o r t h o m e t r i c = H e l l i p s o i d N ,
where N is the height difference (8 m) between the orthometric height of the CVD 1985 geoid ( H o r t h o m e t r i c ) and the ellipsoid height referenced to WGS84 ( H e l l i p s o i d ), derived from EGM2008 [29].

2.3. Retrieving Riverbed Elevation

2.3.1. Hydrologic Routing

The Muskingum method, proposed by G.T. McCarthy in 1938, is used as the channel routing model. The model divides the river reach into segments and iteratively calculates the channel storage based on inflow and outflow:
d S d t = I t O t ,
where S is the water storage volume, I t is the inflow, O t is the outflow, and t is time. The relationship between storage and flows can be expressed as follows:
S = K i X i I + 1 X i O ,
where K i is storage time constant and X i is weighting factor of the ith river reach [30]. Both K i and X i of the ith river reach are optimized by a Genetic Algorithm (GA) framework implemented through the Distributed Evolutionary Algorithms in Python (DEAP) library in Python [31]. The empirical parameters of the two river reaches ( K i and X i ) are kept in use for every channel segment within the ith reach. The k j value for the jth channel segment within the ith reach is then ratioed by the relative length of the channel segment within the ith river reaches:
k j = K i × L j L i ,
where k j represents the Muskingum storage time for the jth channel segment, L j denotes the length of the jth channel segment, and L i denotes the total length of the corresponding river reach. The weighting factor X i remains constant for both reaches. The routing equation for the outflow is as follows:
O j + 1 = C 0 I j + 1 + C 1 I j + C 2 O j ,
where O j + 1 and I j + 1 are the outflow and inflow of the (j + 1)th channel segment, and O j and I j are the outflow and inflow of the jth channel segment. The remaining parameters are as follows:
C 0 = Δ t 2 K X 2 K 1 X + Δ t , C 1 = Δ t + 2 K X 2 K 1 X + Δ t , C 2 = 2 K 1 X Δ t 2 K 1 X + Δ t ,
where Δ t is the time step. The three coefficients must satisfy the requirement of C 0 + C 1 + C 2 = 1.

2.3.2. Developing Rating Curve

The rating curve, depicting the relationship between water level and discharge, is used to convert readily available water level observations into discharge time series based on the hypothetical rectangular channel [32]:
Q j = a ( H j h ) b ,
where Q j and H j are discharge and water surface elevation of the jth channel segment, h denotes the riverbed elevation, and a and b are empirical model parameters. The last three parameters are to be calibrated, based on the observed streamflow and water level at Tongmeng station, by the Levenberg–Marquardt algorithm with the root mean square error (RMSE) as the evaluation measure [33]. To facilitate calibration, the original equations were linearized by a logarithmic transformation. During calibration, h is iterated by a grid search algorithm over a predetermined range from 160.0 m to 165.5 m with a step size of 0.1 m, representing the actual elevation range within this reach. After h is iterated, the remaining a and b parameters are optimized. The optimal combination of h , a, and b of the last cross section, where the Tongmeng stream gauge provides long-term observations, are determined based on the minimum RMSE. The developed a and b are then used for the entire river to derive the riverbed elevation ( h j ) of other upstream cross sections (Figure 1).

2.3.3. Deriving Channel Geometry

Based on the derived rating curve as well as the retrieved water surface elevation, the bottom elevation of the cross section ( h j ) can be back-calculated (Figure 1). The discharge at each transect is estimated based on the Muskingum method. By inheriting the rating curve determined at the last cross section, the riverbed elevation can be solved for every cross section based on Equation (8). Combining the river width extracted from Sentinel-2 imagery, the channel geometry of the entire river can be developed, which is subject to the hydrodynamic validations by 1D and 2D models.

2.4. Hydrodynamic Validations

2.4.1. One-Dimensional Hydraulic Routing

Hydrologic Engineering Center’s River Analysis System (HEC-RAS) is adopted for both 1D and 2D hydrodynamic simulations and validations [34]. The 1D model is mainly used to simulate hydrodynamic processes in the direction of the river channel, while the lateral exchange of the water flow is ignored.

2.4.2. Two-Dimensional Inundation Mapping

The 2D model of HEC-RAS is used to examine the complex flow behavior based on the satellite-derived bathymetry. The model uses a 2D grid to spatially discretize the water flow, which takes into account both the vertical propagation and lateral expansion of the water flow [35].

2.5. Accuracy Evaluation

The coefficient of determination ( R 2 ), R M S E , Mean Absolute Percentage Error ( M A P E ), and Percentage Bias ( P B I A S ) are used to evaluate the accuracy of estimating riverbed elevation, river width, and river flow:
R 2 = 1 i ( y i y ^ i ) 2 i ( y i y ¯ ) 2 ,
R M S E = 1 n i y i y ^ i 2 ,
M A P E = 100 % n i = 1 n y i y ^ i y i ,
P B I A S = i = 1 n y ^ i y i i = 1 n y i × 100 ,
where y i and y ^ i are the observed and simulated values at the ith time step, y ¯ is the arithmetic mean of all observed values, and n is the number of records. Nash–Sutcliffe Efficiency ( N S E ) is adopted to assess the hydrodynamic simulations:
N S E = 1 i = 1 n ( Q o b s , i Q s i m , i ) 2 i = 1 n ( Q o b s , i Q o b s ¯ ) 2 ,
where Q o b s , i and Q s i m , i are the measured and simulated streamflow values at the ith time step, respectively, Q o b s ¯ is the mean of the observed streamflow values. All calculations are performed by the Scikit-learn library in Python.

3. Results

3.1. River Width Retrieval

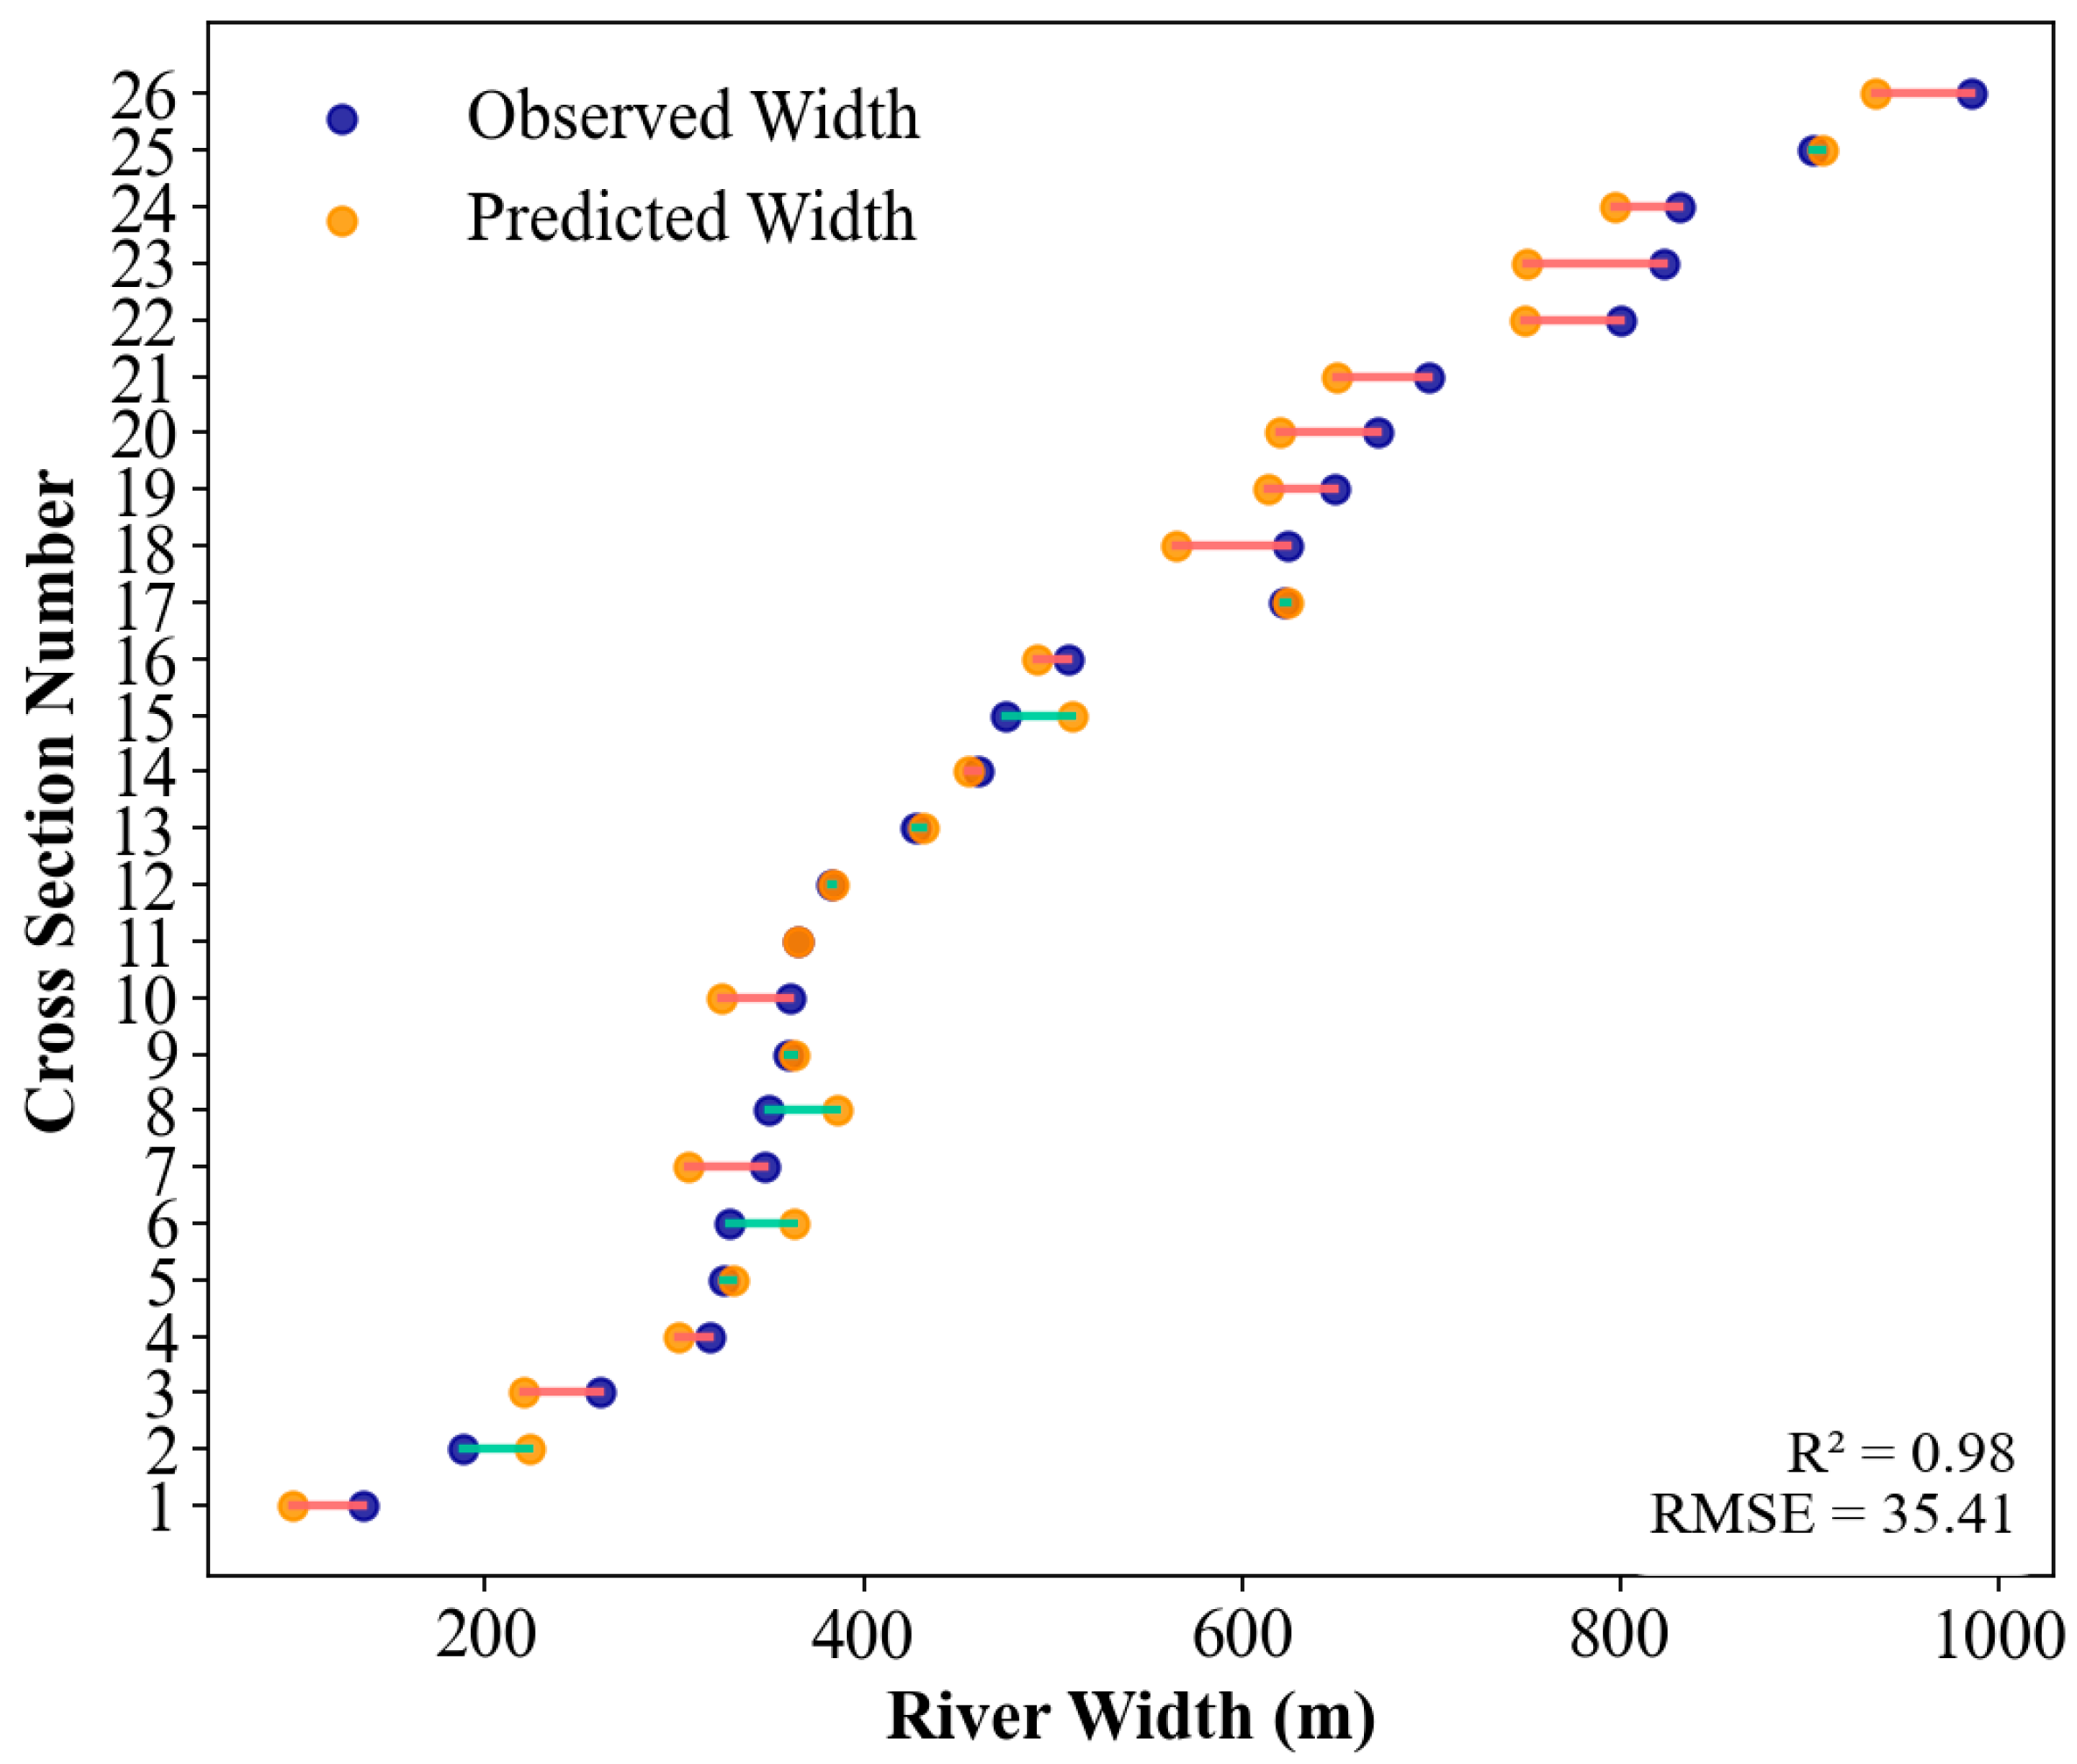
The water body area is initially extracted from Sentinel-2B images based on the NDWI values. Then, the channel width at the cross section is estimated at each selected cross section by geospatial operations. By comparing with river channel widths observed through ground surveying, the estimated river width demonstrates high accuracy, with a R 2 value of 0.98 and a RMSE of 35.41 m (Figure 3). This proves that Sentinel-2 images with high spatial resolution provide a reliable representation of large-scale channel boundaries.

3.2. Developed Rating Curve

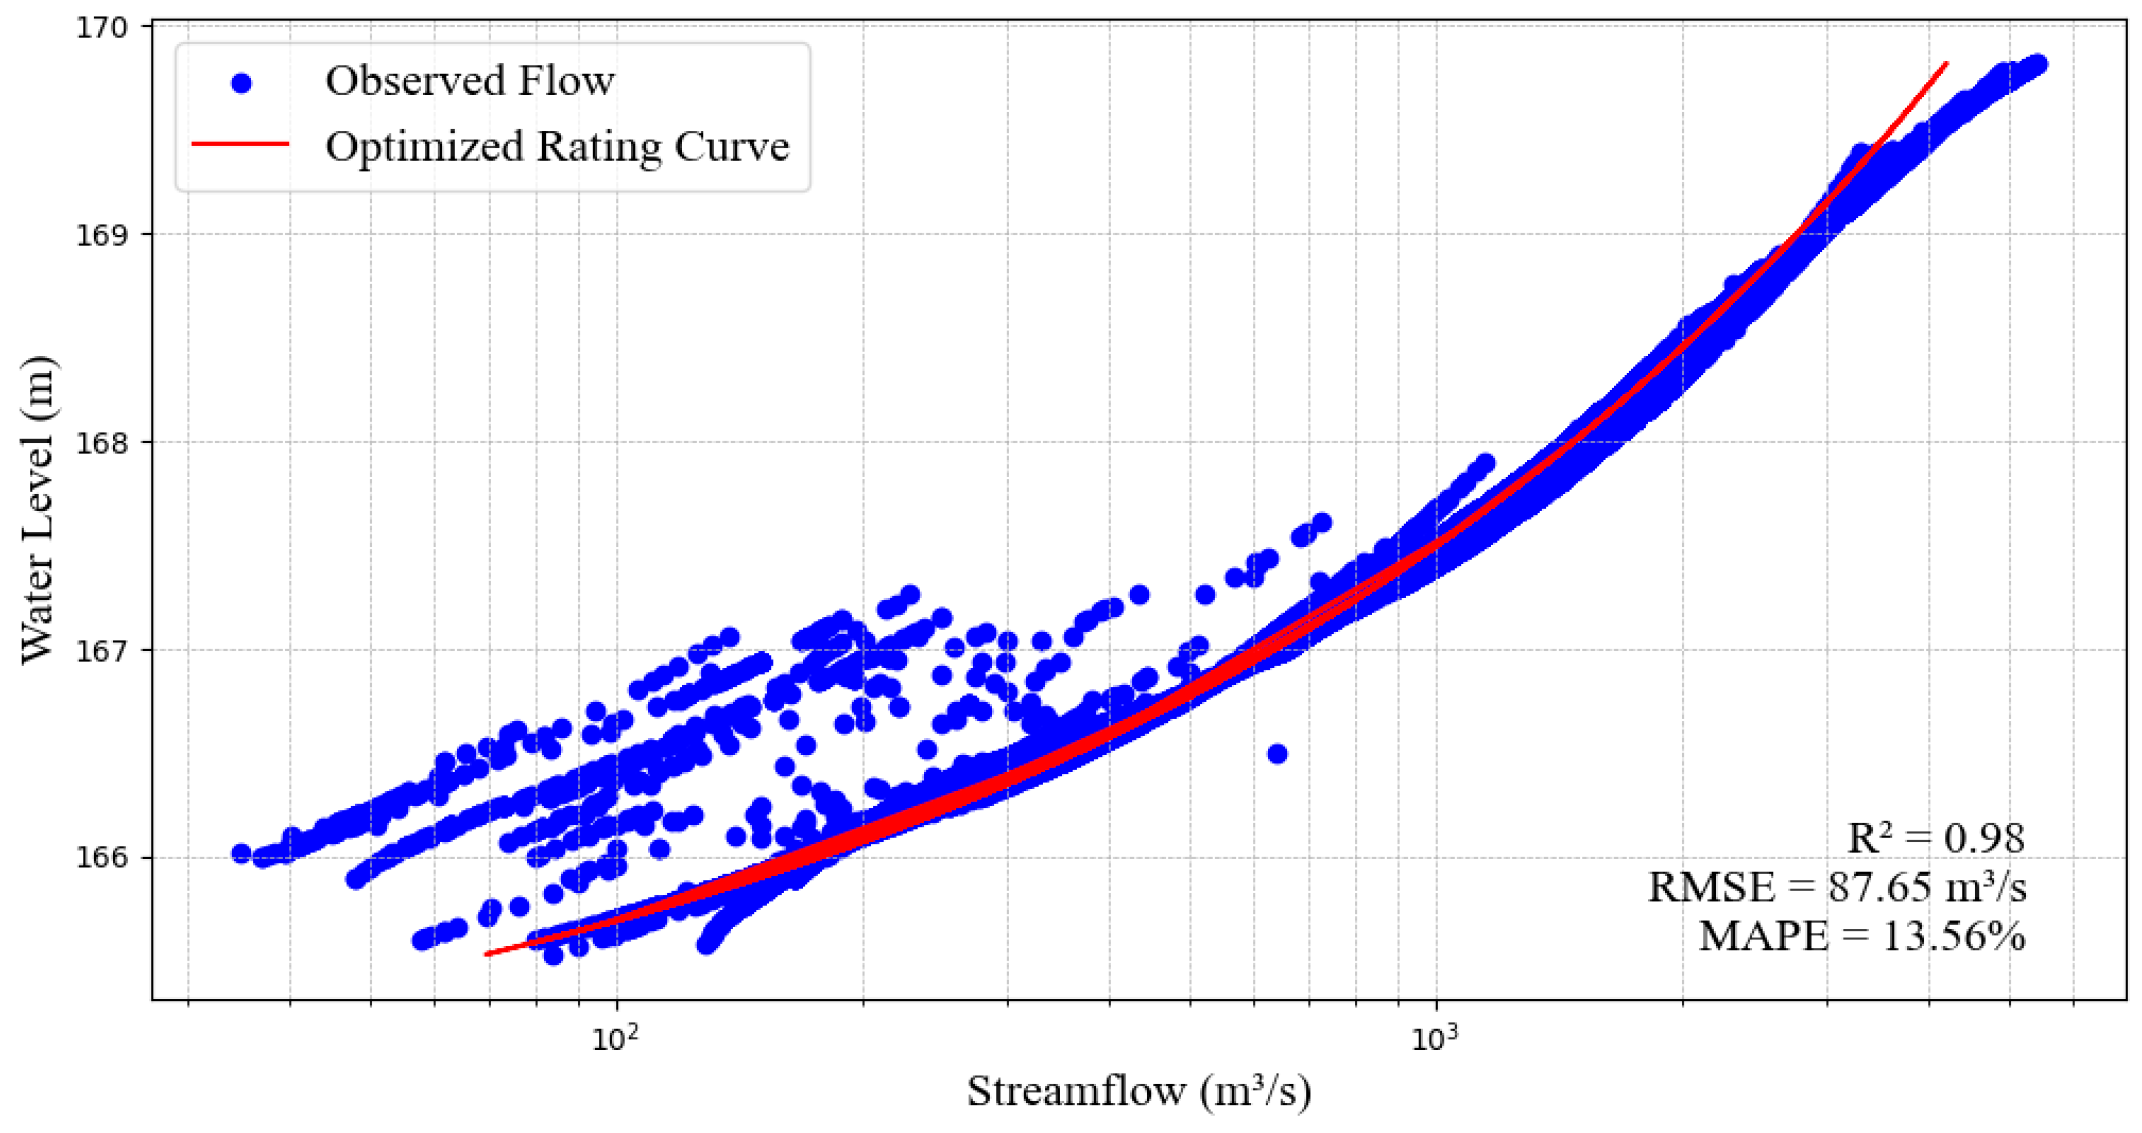
The rating curve is calibrated based on the observed time series of 2018–2022 at the Tongmeng stream gauge, and the developed empirical parameters ( a and b ) are applied through the corresponding river reach, since it is economically unlikely to set up stream gauges everywhere along a river reach, especially in the data-scarce region. The optimized parameters ( a = 64.48, b = 2.46) lead to a good fitting of the rating curve with the observed data, with the R 2 value of 0.98 (Figure 4).

3.3. Calibrated Muskingum Parameters

The entire river was divided into two reaches at the confluence of the Nuomin River (Figure 1 and Figure 2). Two pairs of Muskingum parameters for the upper reach ( K 1 = 25 h and X 1 = 0.1) and the lower reach ( K 2 = 4 h and X 2 = 0.1) are derived through calibration by the GA method, based on the streamflow observations at the Nierji reservoir and Tongmeng gauge during 2018–2020. The streamflow simulated by the calibrated model agrees well with the observations at the outlet with the NSE value of 0.89, while the validation period achieves an even higher NSE value of 0.96, indicating a robust calibration throughout multi-year datasets (Figure 5). The Muskingum K i was then extrapolated to the smaller river segments between the cross sections.

3.4. Back-Calculated Riverbed Elevations

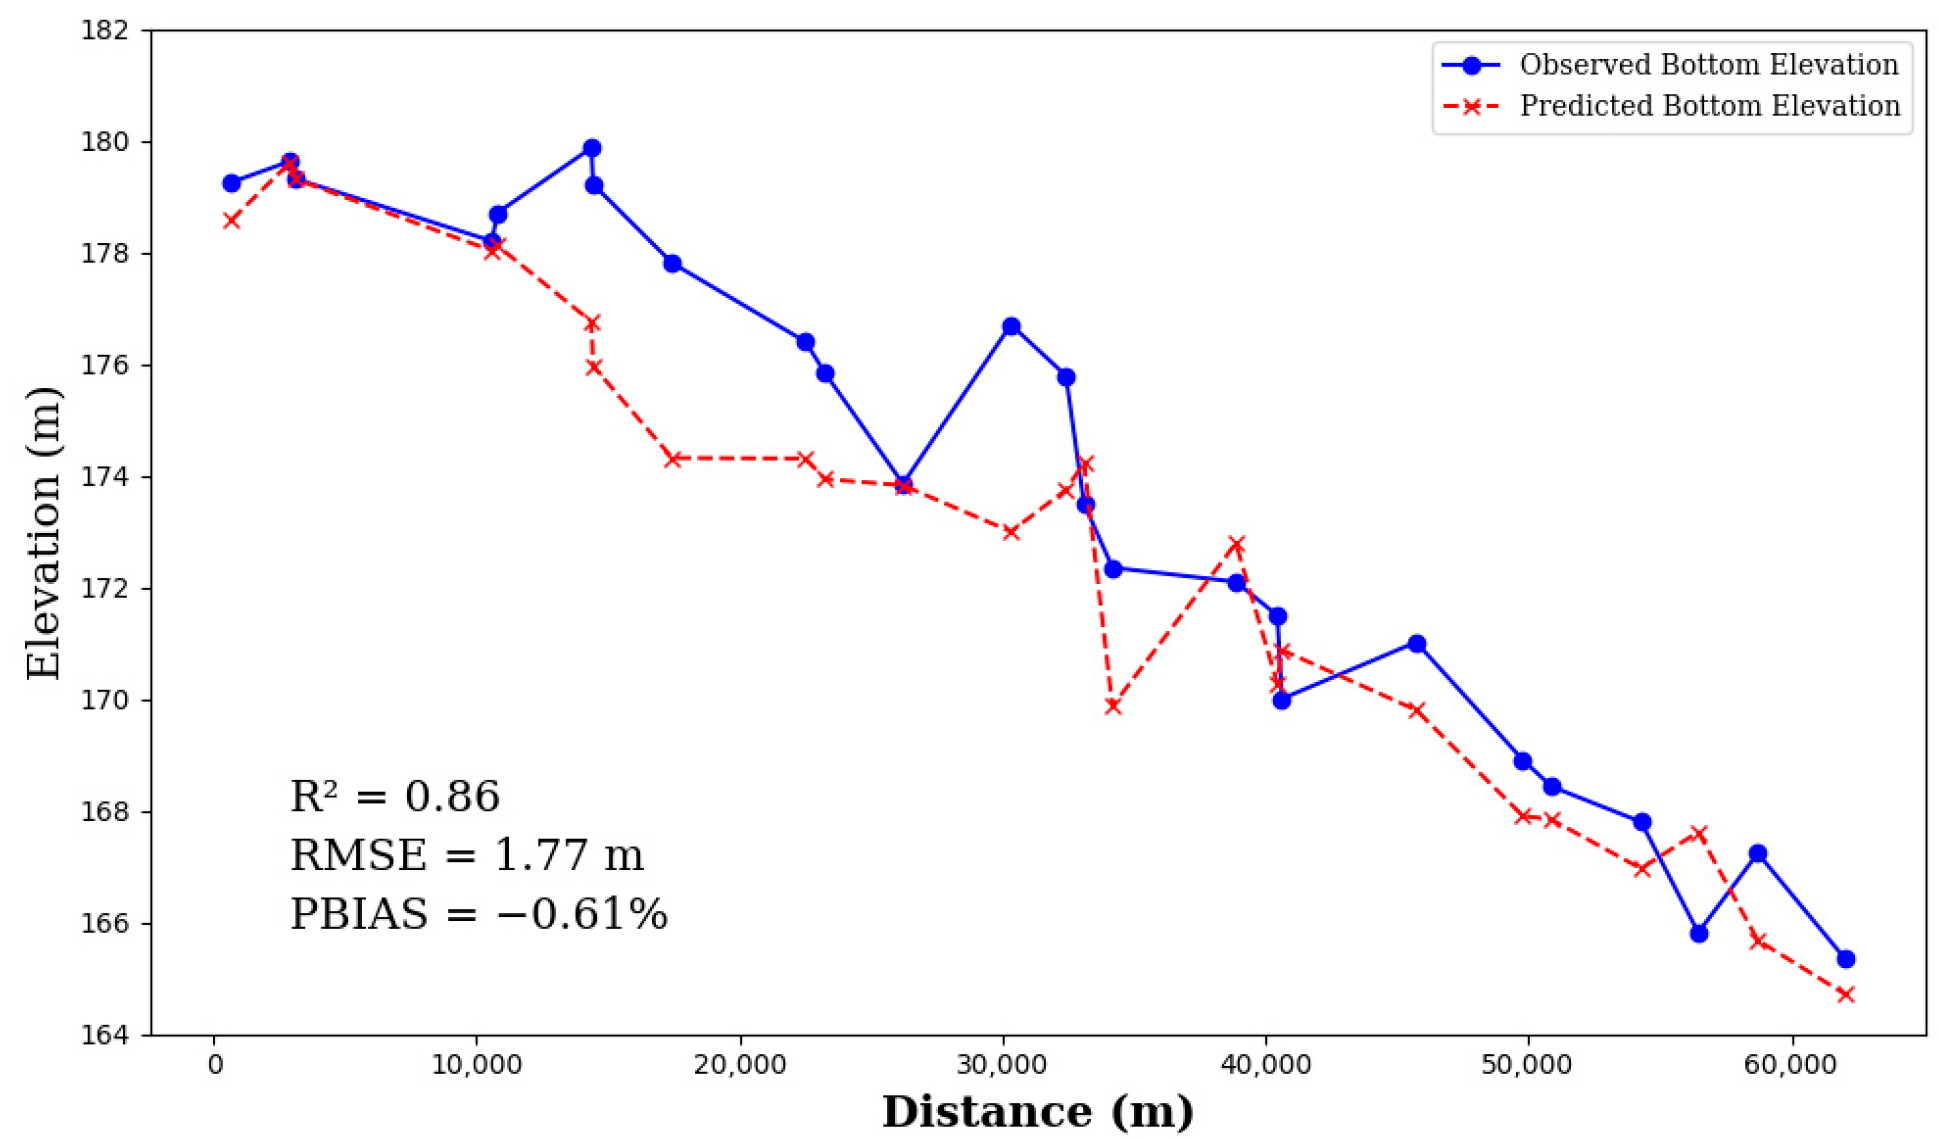
Based on the established water surface elevation, rating curve, and Muskingum parameters, the riverbed elevation of each river segment between a pair of adjacent cross sections can be back-calculated. The derived riverbed elevations are compared to observations longitudinally along the centerline of the channel (Figure 6). The corresponding statistical metrics ( R 2 = 0.86, R M S E = 1.77 m, P B I A S = −0.61%) indicate that the inverted riverbed elevations effectively reflect the longitudinal variations in the actual riverbed topography.

3.5. One-Dimensional Hydraulic Validation

The derived channel geometry in terms of the top width and bottom elevation is tested in the 1D hydraulic model for the entire period from 2018 to 2022. The derived channel geometry results in an overall good simulation of 1D flood propagation continuously through the 5-yr period in terms of peak magnitudes and timings, with the N S E value of 0.94 (Figure 7b), which is very close to the accuracy of the simulations based on the measured channel geometry (Figure 7a). This high level of consistency between the hydraulic simulations based on the observed and predicted channel geometries indicates that this developed method offers a promising workflow for predicting channel geometry in data-scarce river networks.
While the 1D model using the derived channel geometry captures the largest peak well, it has a 22% and 11% underestimation of the second and third largest flood peaks, respectively. In comparison, the 1D model using the surveyed channel geometry leads to a 1% and 18% overestimation for the same two events, respectively. The discrepancy may primarily stem from the assumption of rectangular channels. As the two models adopt the same settings except the channel geometry, the discrepancy of both models from the observed hydrographs indicates that both the surveyed and derived channel bathymetry do not fully capture the nonlinear shape transition between cross sections by various degrees. Such heterogeneous details between cross sections are lost through interpolation or smoothing, which is required to develop the continuous channel geometry for flood simulations. Employing cross section elevations with higher spatiotemporal resolution would constitute an effective approach to improve this situation. On occasions of rapid flood events, the hypothetical rectangular cross sections may suffer from misrepresenting the complex terrains, such as sharp bends or bottom terrain fluctuations, and then increase the errors of flood peaks and processes. This stresses the importance of river morphology in affecting the flow dynamics [36].

4. Discussion

4.1. Influence of Channel Geometry on 2D Inundation Mapping

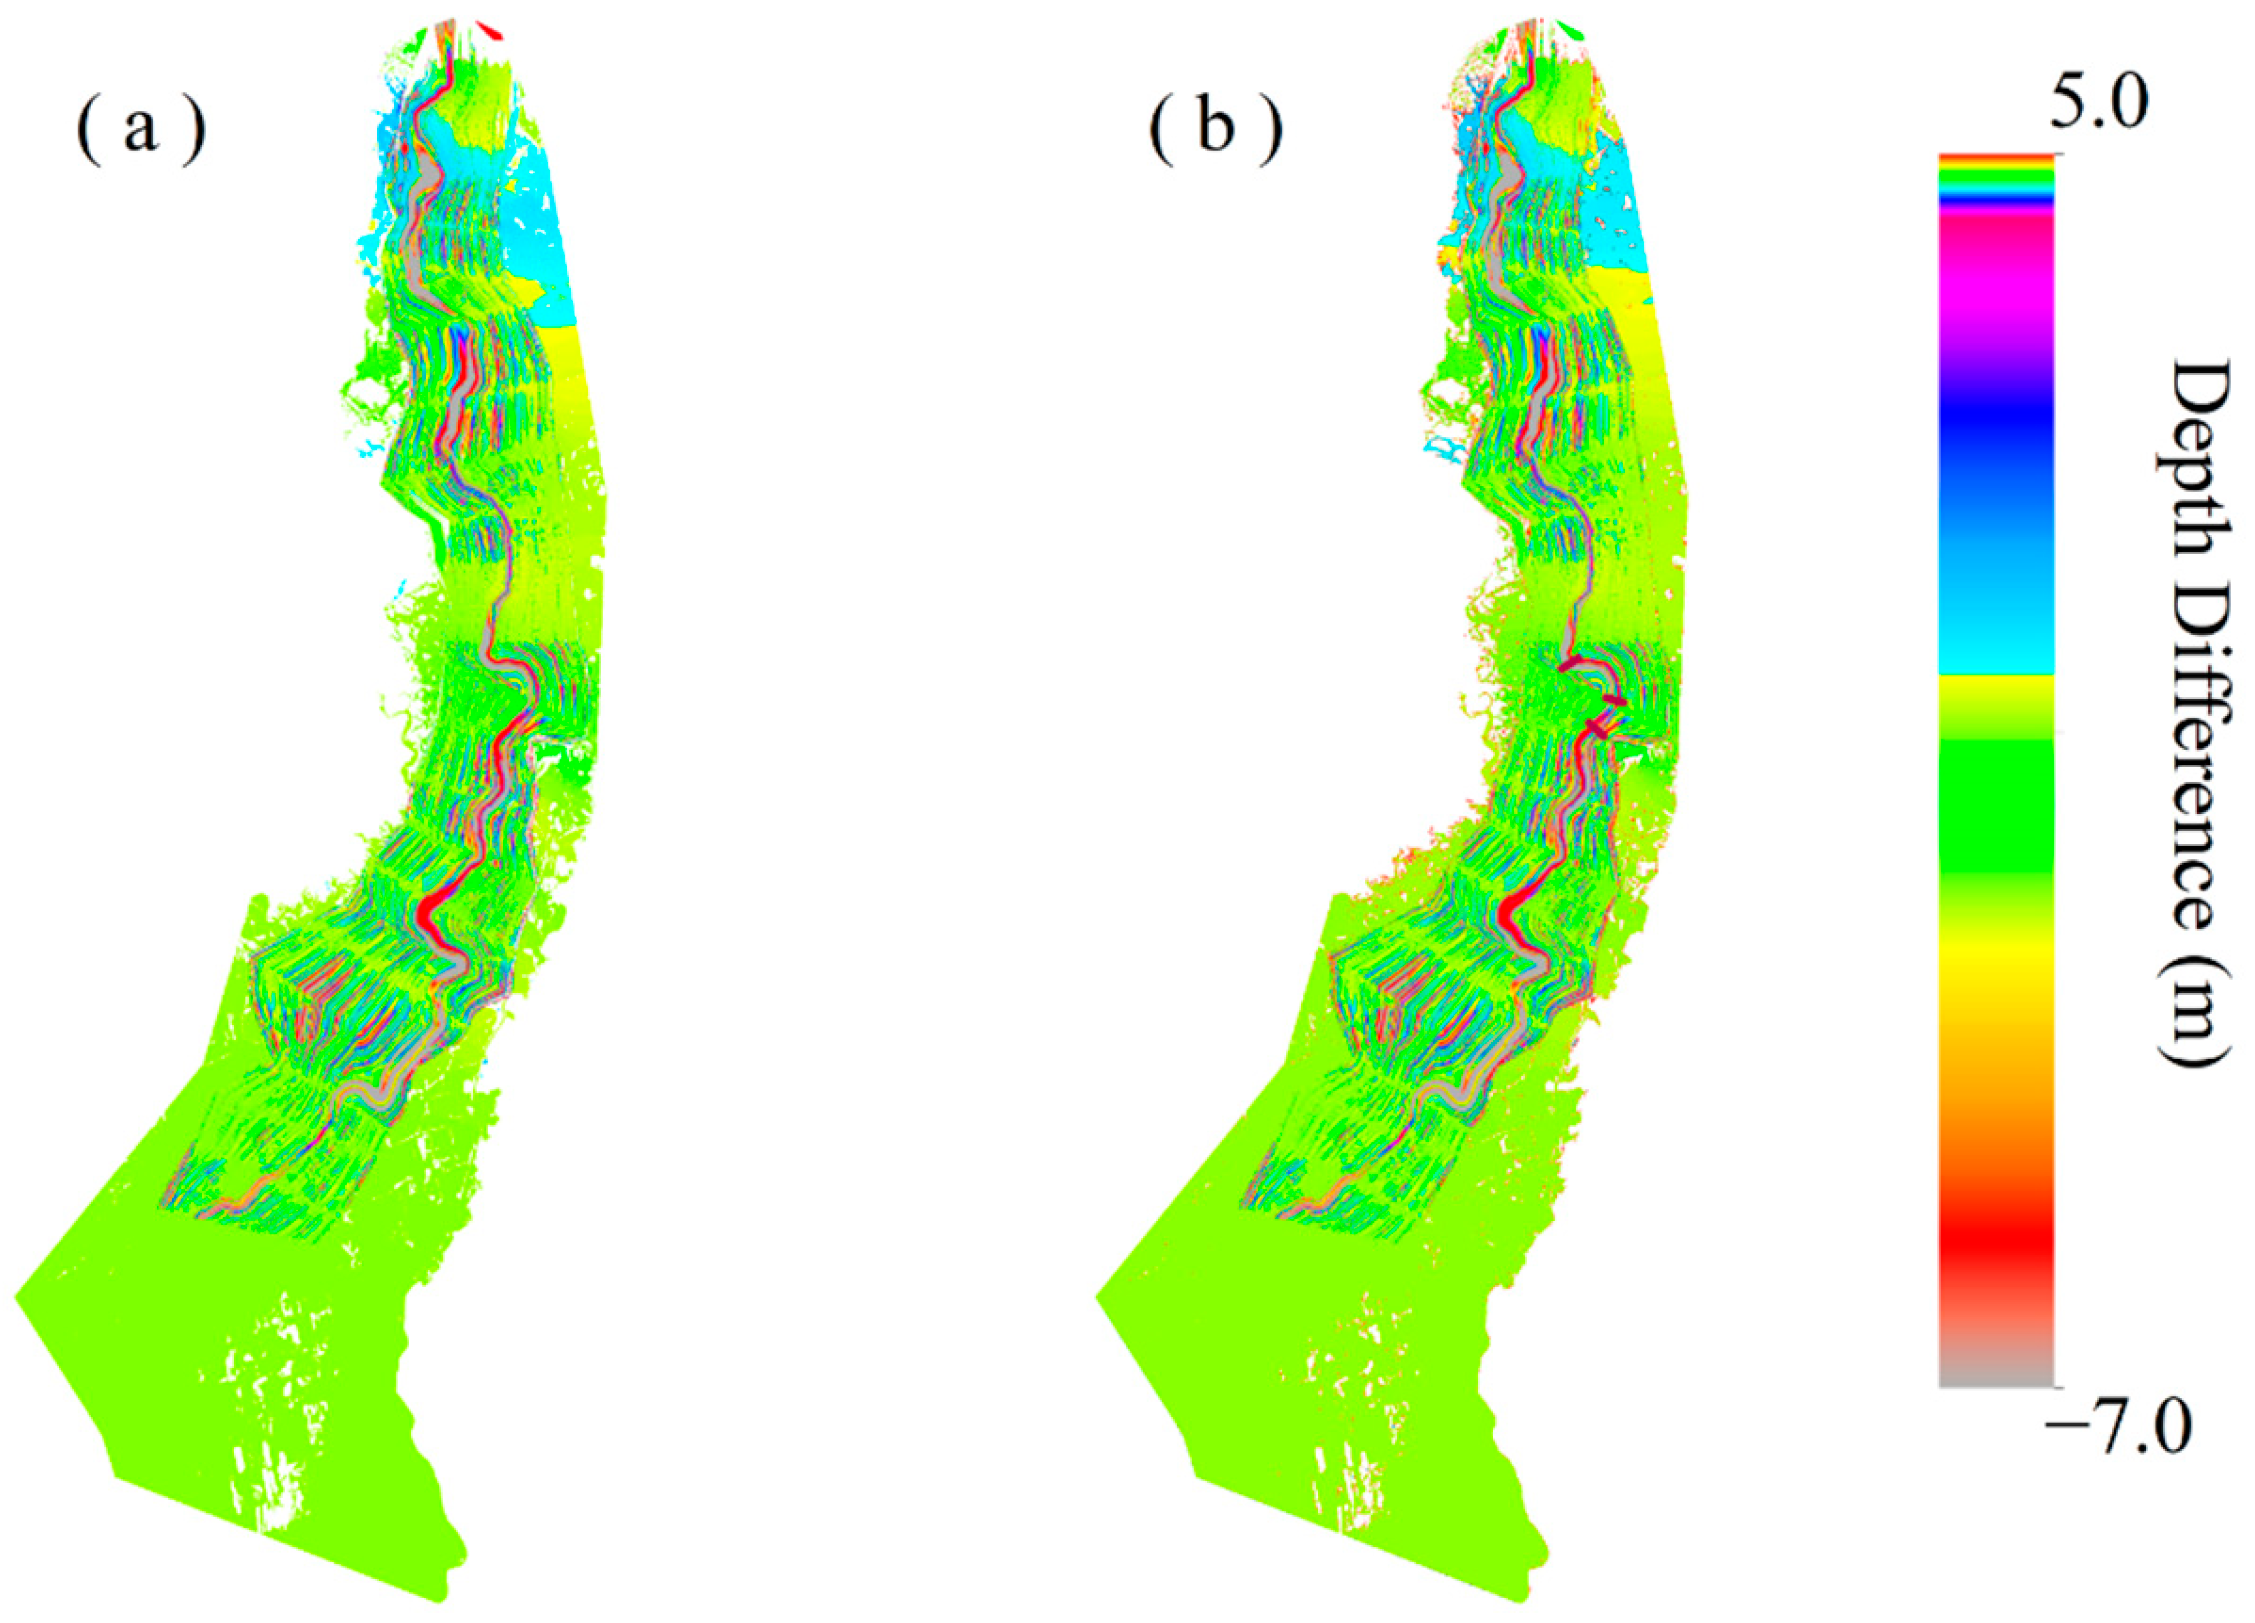
Owing to the low topographical gradient within the study area, the inundation simulated by the 2D HEC-RAS is sensitive to the channel geometry. The surveyed and satellite-derived channel geometry are burned into the digital elevation model (DEM) to develop the 2D terrains. Their respective inundation conditions simulated based on the surveyed and derived channel geometry are then compared for the 50-yr and 100-yr events (Figure 8). For the 100-yr flood, the predicted channel geometry results in a 0.38% smaller inundation area and 9.14% deeper water than those of the surveyed channel geometry. Similarly, for the 50-yr event, the predicted channel causes 0.52% smaller inundation area and 9.86% deeper channel water than the surveyed geometry. This seems to be due to the slightly larger conveyance of the satellite-derived channel geometry, which has 4.13% deeper riverbed elevation with 4.14% narrower top width than the surveyed channel. So, in complex areas, the hypothesis of rectangular channels may lead to underestimation in flow velocities and inundation areas.
The underestimation of the top width may arise from insufficient water existing in the channel during satellite revisits. In other words, the width of the channel water is essentially smaller than the bank-to-bank width; these two become equivalent only when the water just fills up the channel, while the former could even be larger during the riverine inundation. On the other hand, the underestimation of the riverbed elevation may stem from the hypothesis of this study that the rating curve of the outlet is suitable for the upstream cross sections. The width of the cross section at the outlet is 431.6 m, which is slightly lower than the average width of the entire river (measured as 509.52 m and satellite-derived as 488.44 m). Therefore, the rating curve at the outlet represents a relatively narrower yet deeper cross section. When it is applied to the upstream with a wider transect, the riverbed elevation, adopting the same relation of narrower width and deeper topography at the outlet, would, therefore, be underestimated. However, this underestimation tends to be negligible in this case. Further cautions would be needed for longer rivers with significant variations in the cross section shapes, when multiple representative rating curves for several relatively homogeneous river reaches may be more appropriate to use. These issues indicate the challenges for inferring channel geometry from remote sensing and particularly demand more detailed processing in the channel–bank transition zone [37,38].
Overall, this 2D validation proves the overall applicability of the proposed workflow in regional flood risk assessment, while width parameterization is identified as a key area for improvement, especially for extreme-event modeling [39,40,41].

4.2. Velocity Fields at the Channel Bend

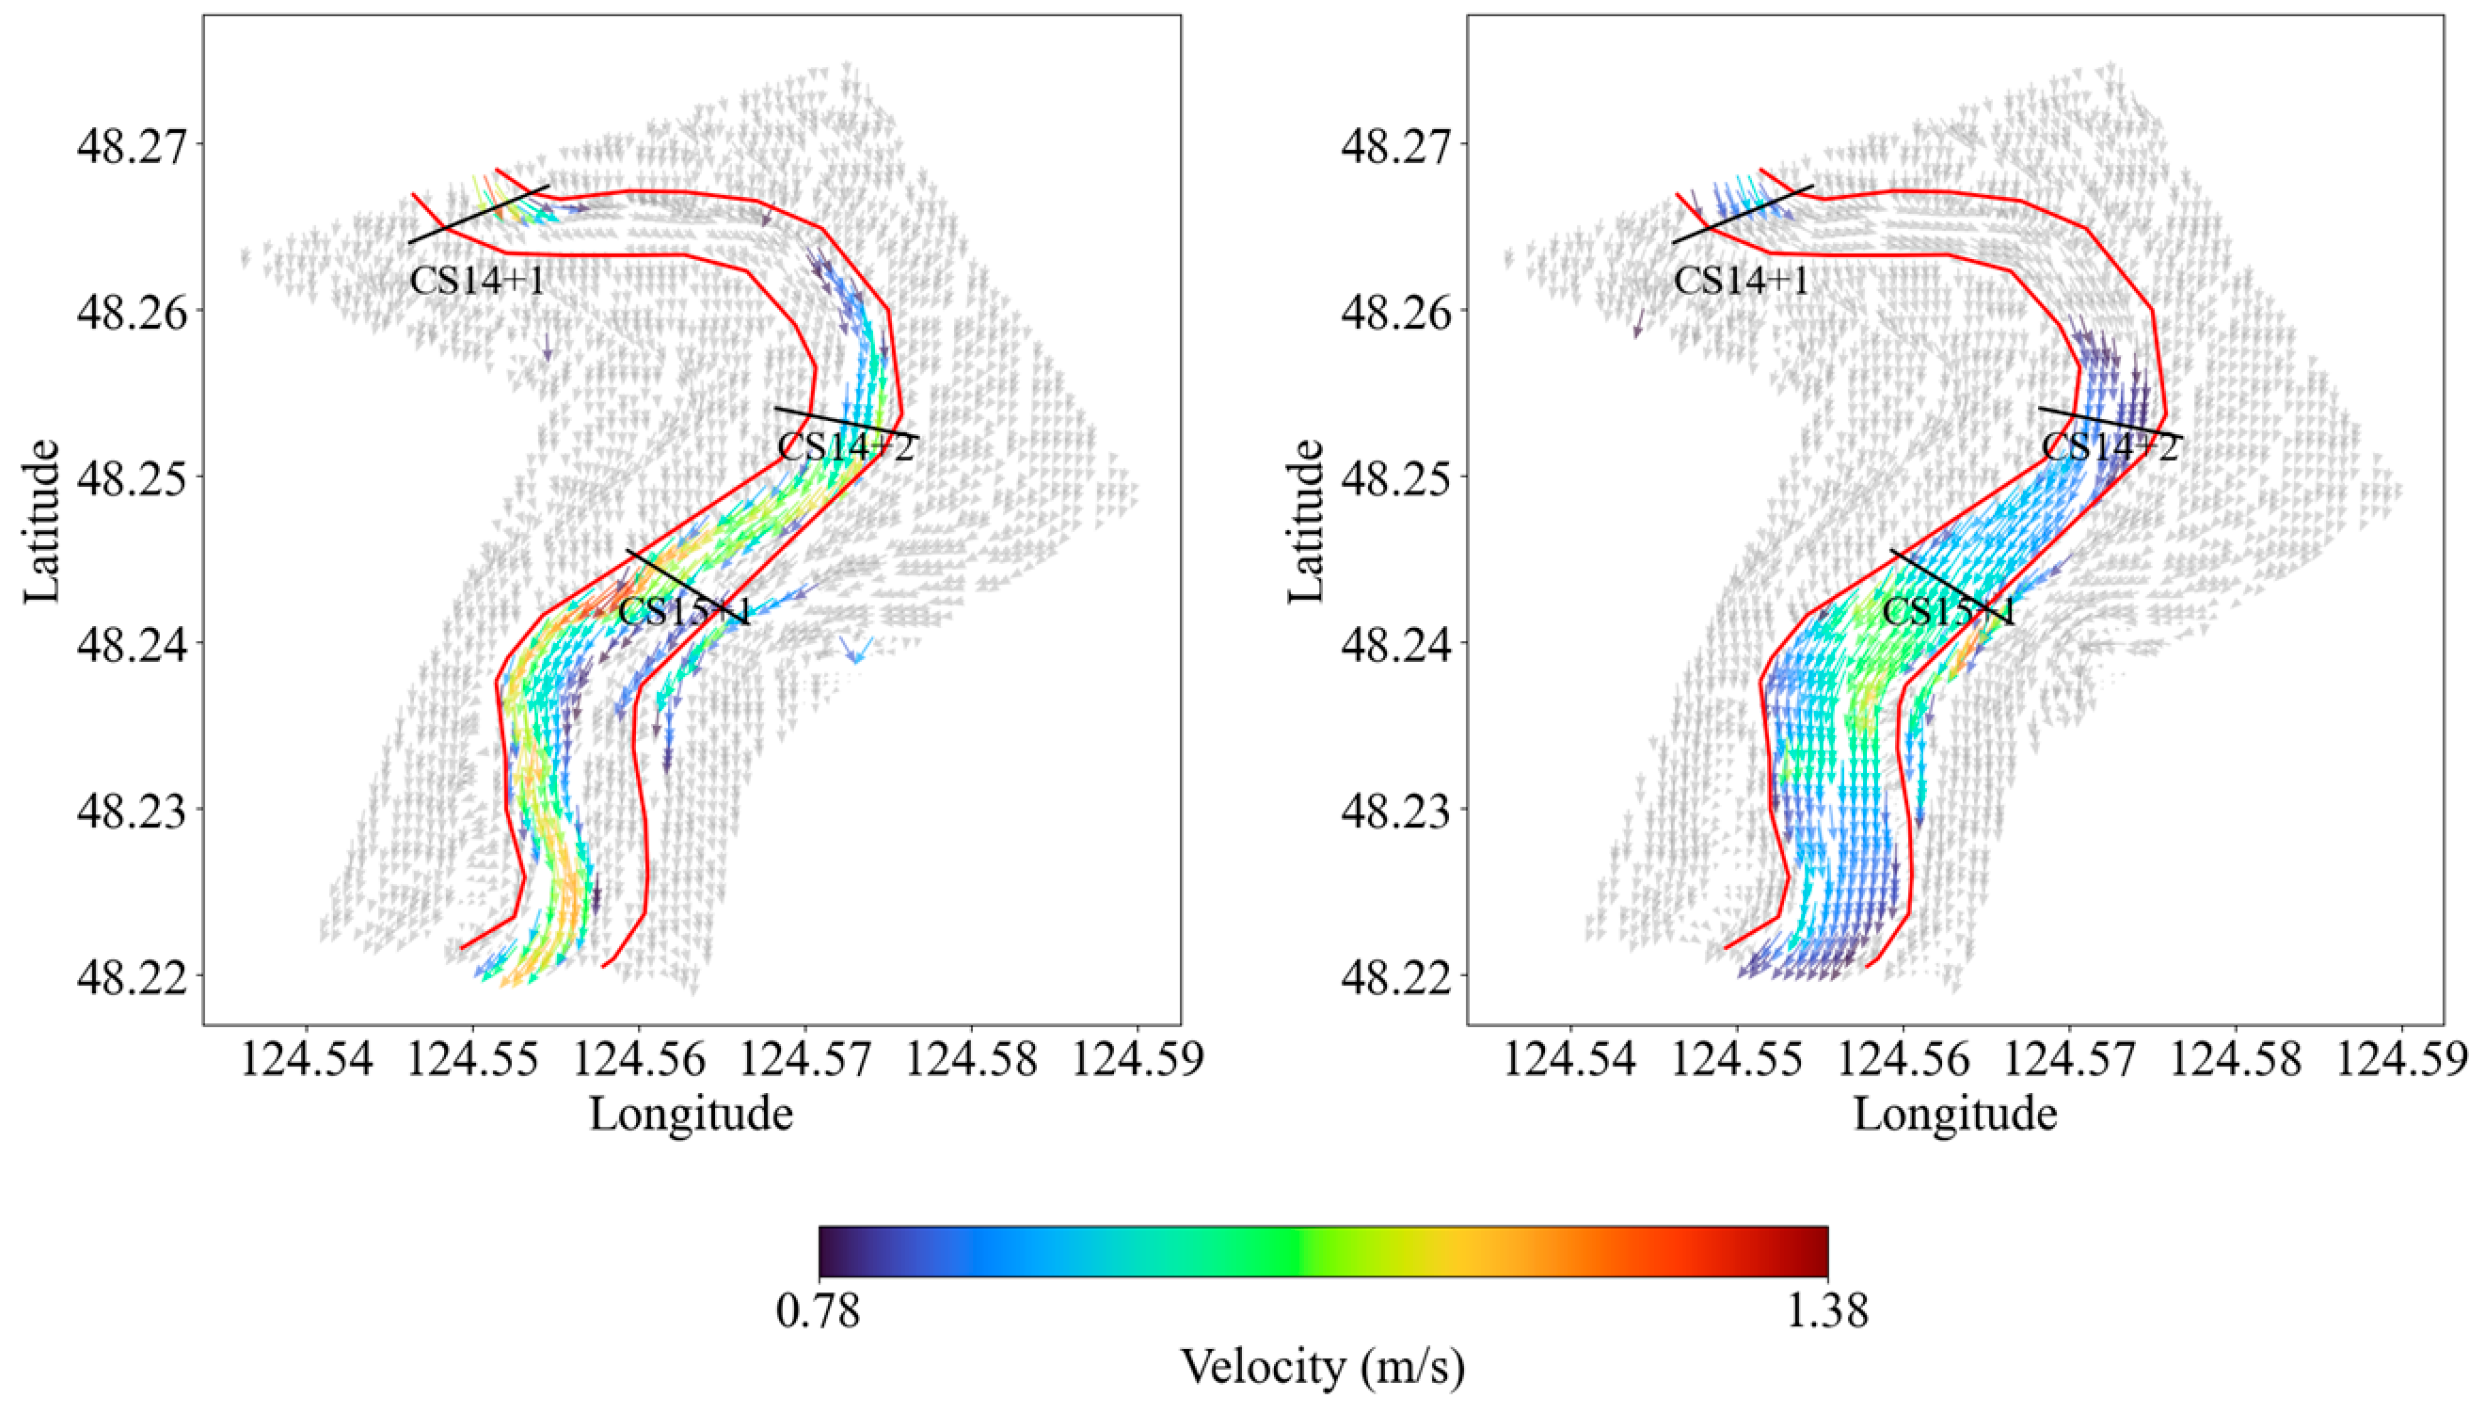
Based on the measured and satellite-derived channel geometry, the flow field through the 100-yr flood event at a 60° bend is carefully examined. Three intermediate cross sections (CS14+1, CS14+2, CS15+1) are selected between the main cross sections of CS14 and CS15 to assess the accuracy of the flow simulations (Figure 9). The irregular shape of their cross sections is due to the interpolation by the HEC-RAS. Although the main cross sections are purely rectangular, the HEC-RAS will interpolate the channel bathymetry between the provided cross sections, which tends to add irregularity into the interpolated cross sections in the area in-between. The velocity field of the satellite-derived channel geometry exhibits some discrepancy from that of the surveyed channel geometry yet remains within an acceptable range overall.
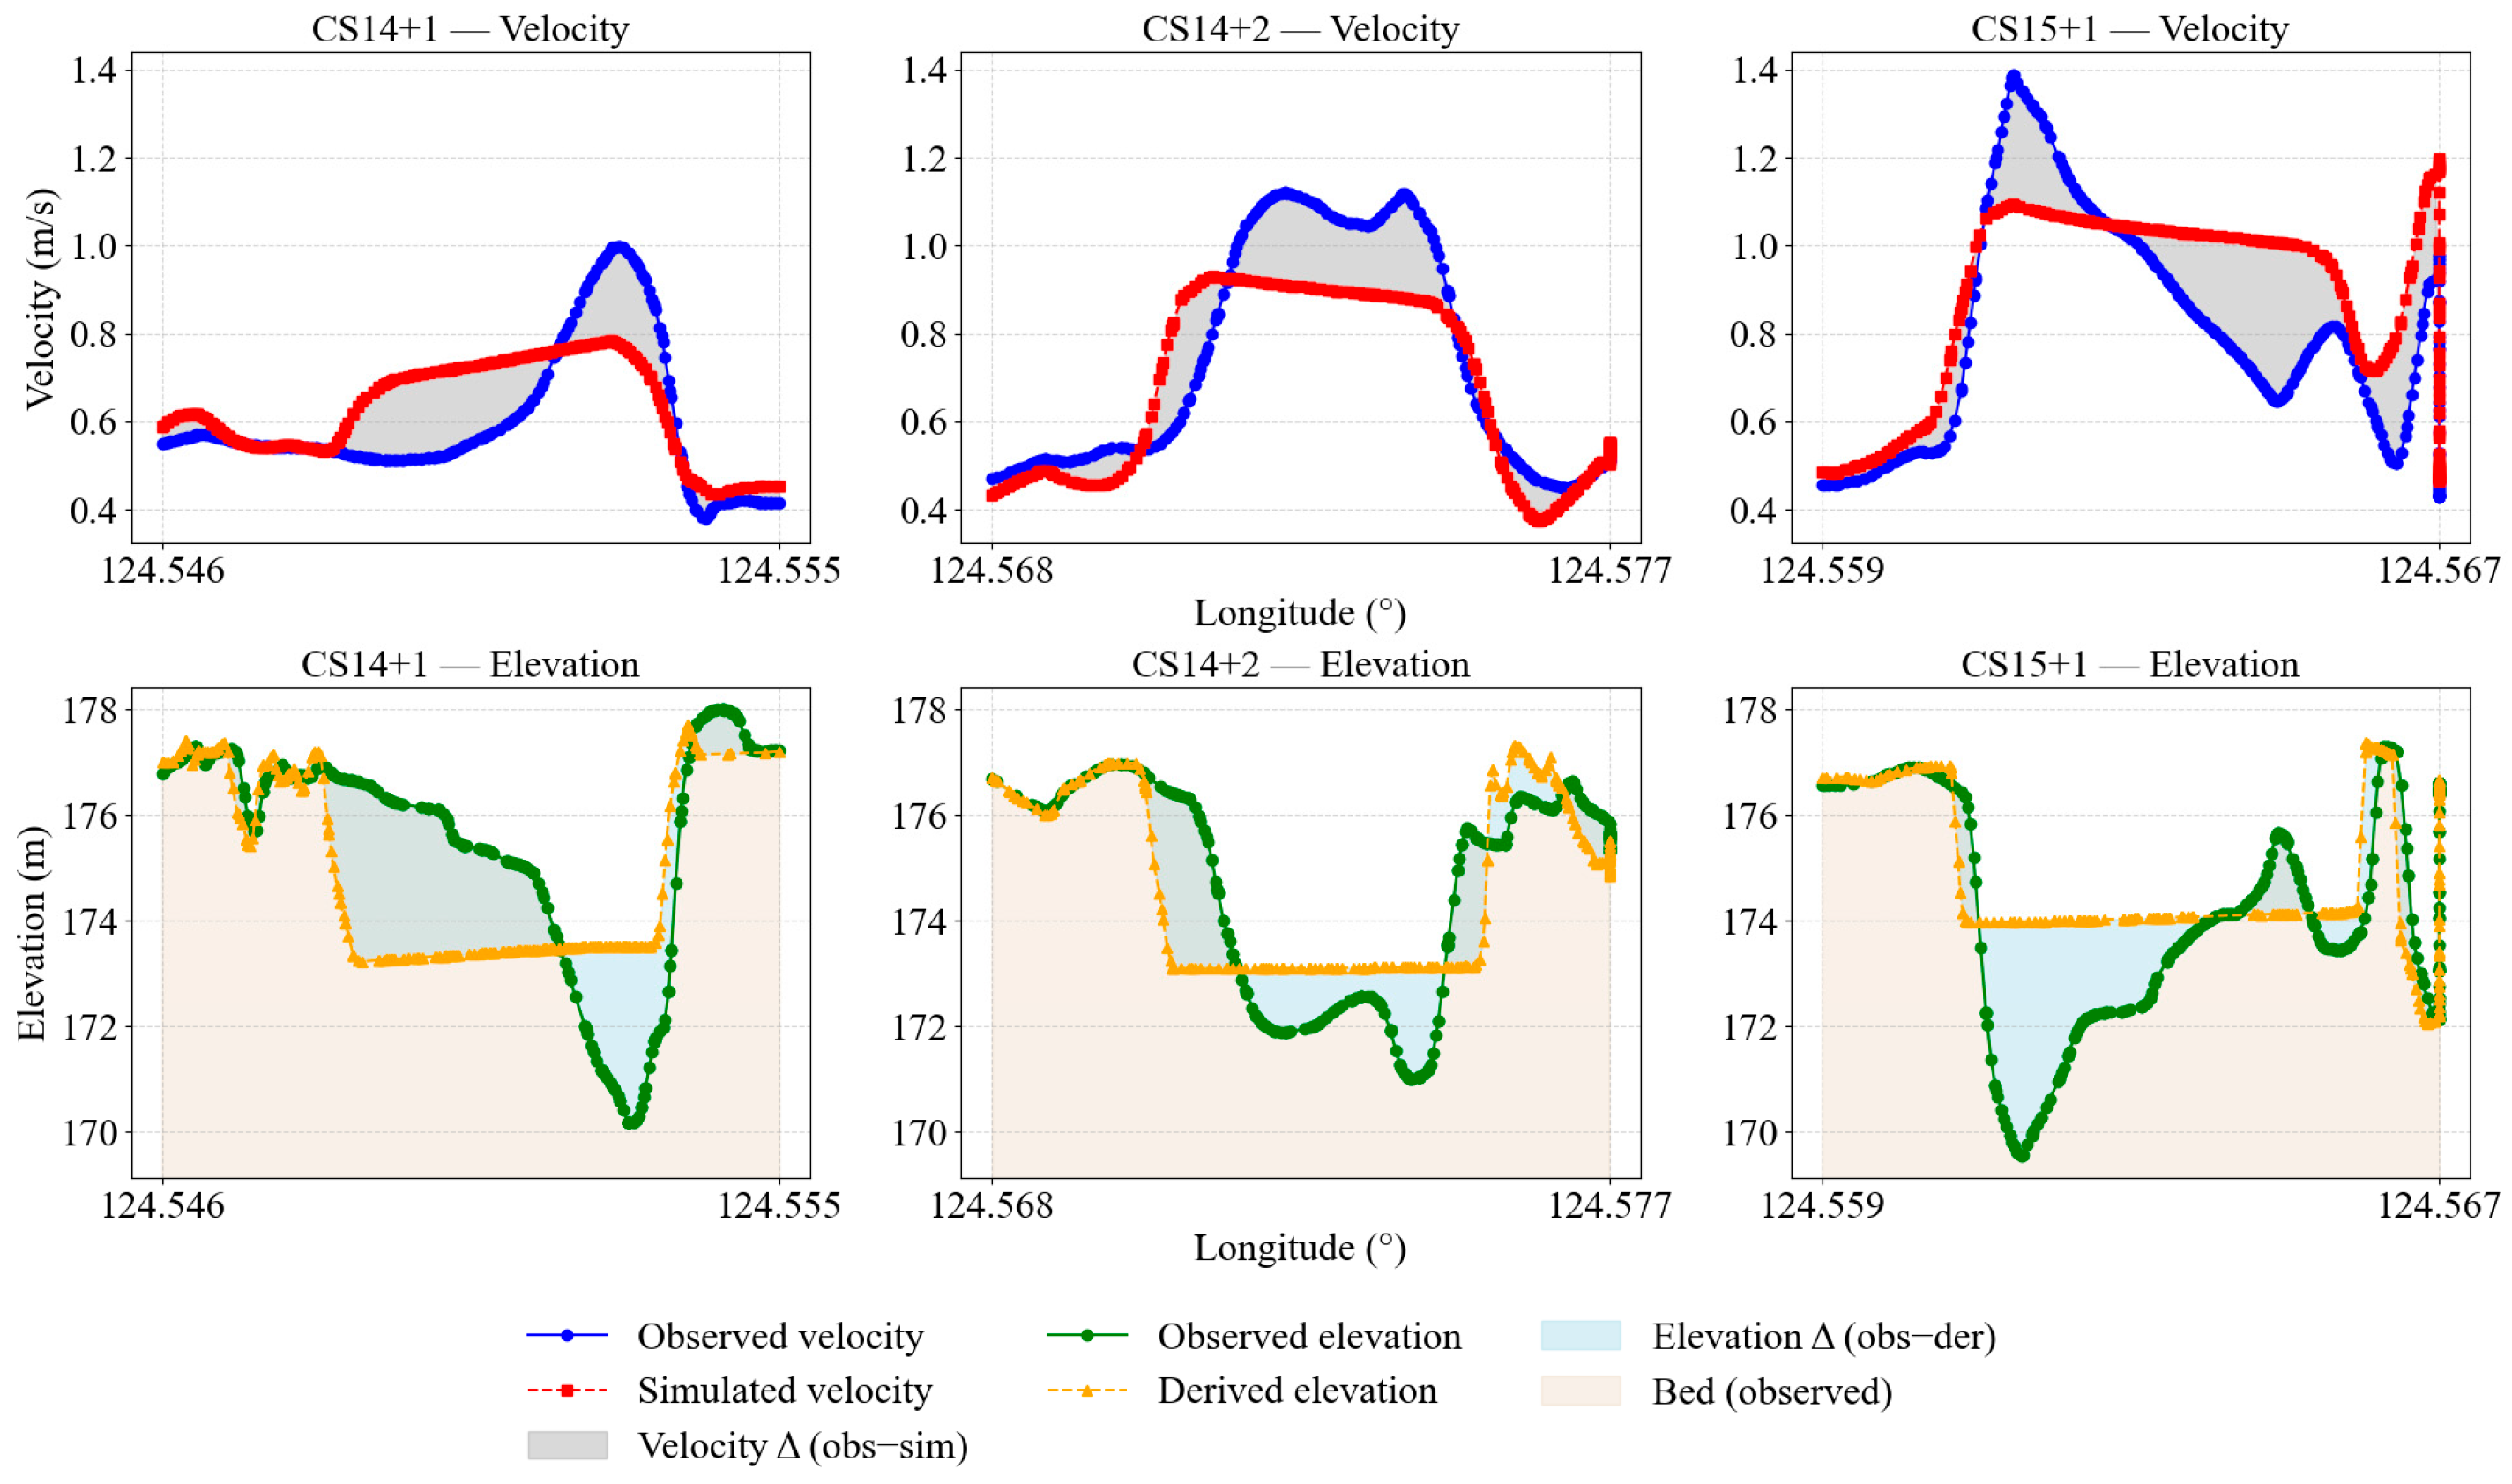
The assumption of the rectangular channel makes the velocity profile a distinct shape from that of the realistic channel (Figure 10). The asymmetrical velocity profile is leveled out by the hypothetically rectangular cross section. A wider cross section leads to a wider velocity area [42]. This explains why more abundant velocity vectors exist at the satellite-derived terrains than the surveyed terrains (Figure 9).
The flow rate, as the area under the velocity curve, corresponds to the shape of the channel area (Figure 10). The flow rates of the satellite-derived channel geometry are 11.30%, −11.58%, and −13.55% different from those of the measured channel terrains at the selected CS14+1, CS14+2, and CS15+1, respectively, indicating a higher uncertainty of this developed method for the 2D hydrodynamic simulations [36,43]. This is because the hypothetically rectangular channel causes more errors in determining the lateral inundation and channel spillage for the 2D simulations, which are constrained by the 1D simulations.
This can be reflected from the locations of the peak velocity along each of the cross sections. The peak velocities along CS14+1 and CS14+2, simulated based on the satellite-derived channel geometry, tend to be located close to the left and right banks, respectively, which match those along the surveyed cross sections (Figure 9). Yet, the peak velocity along CS15+1, simulated based on the derived channel geometry, is located on the left bank outside the channel, which is significantly different from that of the surveyed cross sections with the peak occurring close to the right bank within the channel (Figure 10). This seems to be because the predicted wider channel collects more overland flow from the upstream channel spillage and leads to a higher flow near the left bank. So, a higher resolution 2D inundation simulation would need a more realistic channel shape [44,45]. However, in data-scarce regions where the precise river topography is difficult to obtain, this satellite-based retrieval method provides a decent prediction of the channel geometry that constrains the flow discrepancy between −13.55% and 11.30% from the surveyed geometry.

4.3. Uncertainty Analysis

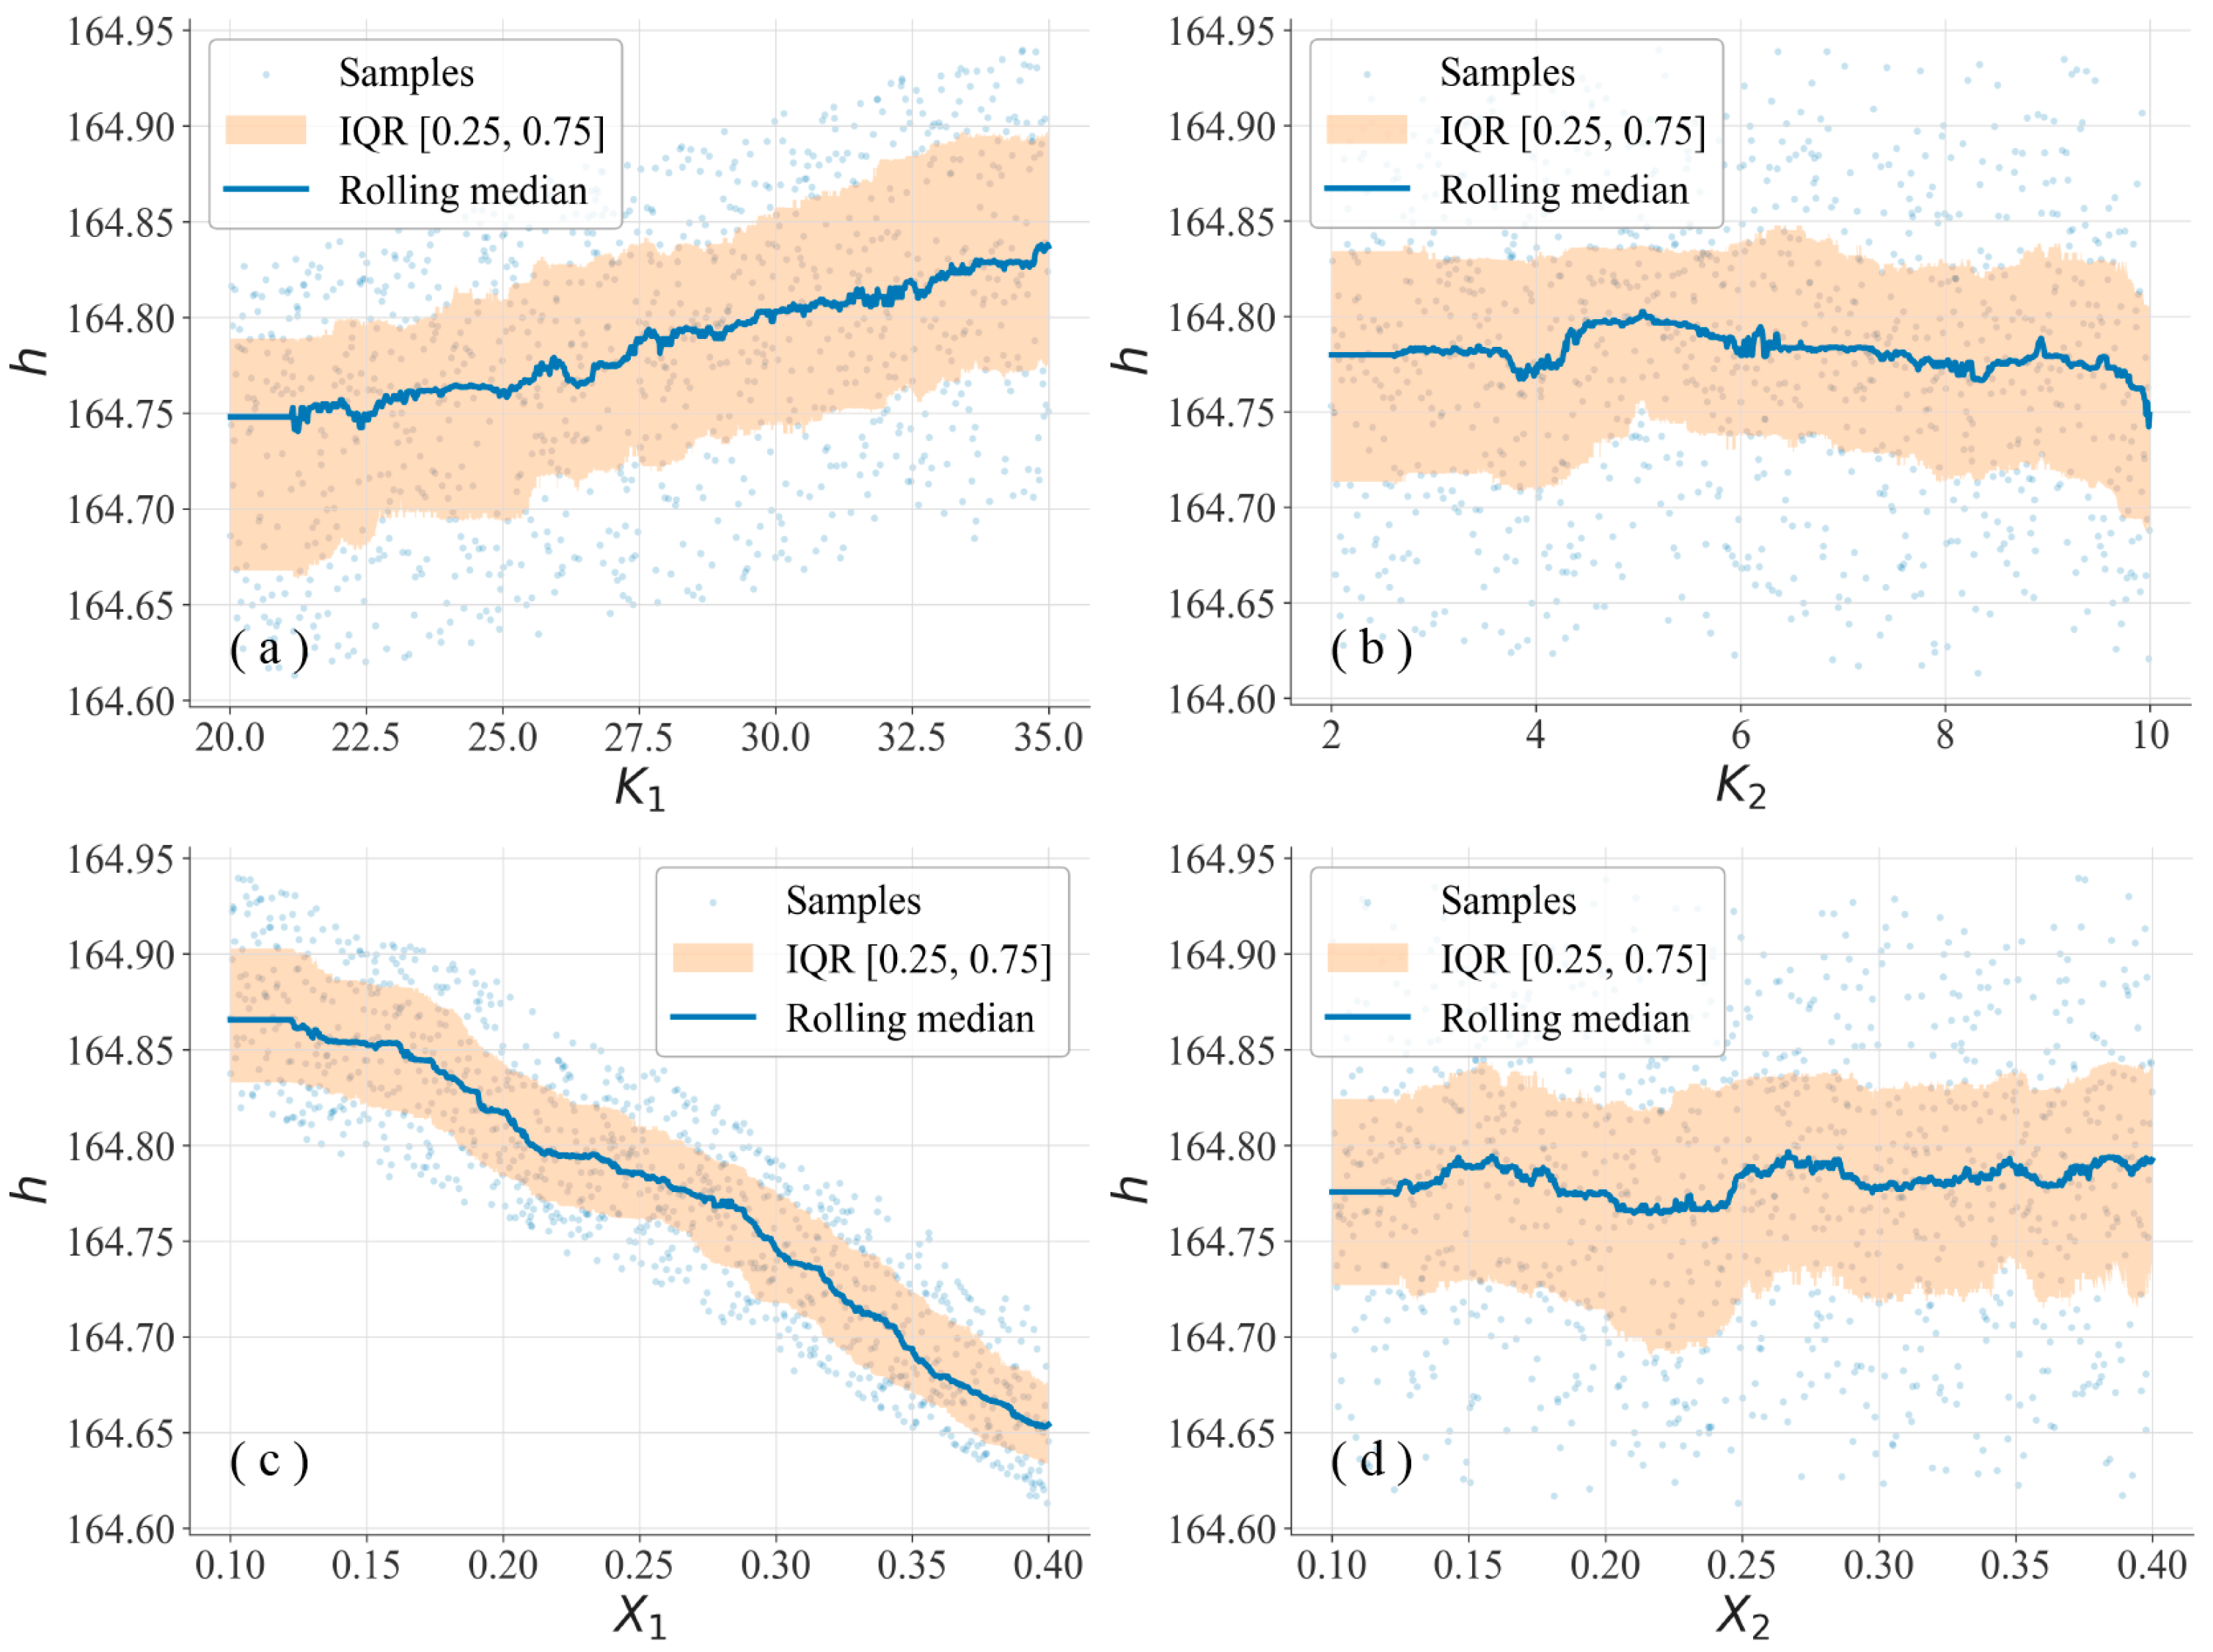
The statistical results indicate that the retrieved bed elevation exhibits significant differences across the four Muskingum parameters (Figure 11). The parameter X 1 exerts a strong negative relation with the riverbed elevation. The variations in K 1 tend to cause a wider uncertainty bound (interquartile range, or IQR) with a positive relation with riverbed elevation. The effects of K 2 and X 2 on the riverbed elevation are negligible, with the lines of their rolling medians remaining flat.
In spite of the large uncertainty ranges of both K i and X i , the overall IQR bound is only in the order of centimeters, which is smaller than measurement errors of water level observations or vertical errors in satellite-based altimetry [46]. This indicates that the uncertainty of Muskingum parameters does not induce substantial uncertainty in riverbed elevations. These results validate the robustness and interpretability of the proposed inversion approach.

5. Conclusions

Aiming at the difficulty of obtaining channel topography in the data-scarce areas, this study proposes an innovative method integrating multi-source satellite data and hydraulic modeling to develop channel geometry including top width and bed elevation. The method is validated based on the observed channel geometry and discharge at the main stem of the Nen River. Both channel width ( R 2 = 0.98, R M S E = 35.41 m) and riverbed elevation ( R 2 = 0.86, R M S E = 1.77 m, P B I A S = −0.61%) are well predicted.
The satellite-derived channel geometry is further tested for driving 1D and 2D hydrodynamic simulations. The derived channel geometry results in an overall good simulation of 1D flows through the 5-yr period in terms of peak magnitudes and timings, with the N S E value of 0.94, R M S E of 207.76 m3/s, and P B I A S of 6.19%.
The 2D inundation driven by the satellite-derived channel geometry burned into the DEM achieved only 0.52% and 0.38% smaller inundation area and 9.86% and 9.14% deeper water depth within the channel for the 50-yr and 100-yr events, respectively, indicating that the derived channel geometry leads to accurate hydrodynamic responses. However, for the channel bend with complicated flow regimes, the flow rates of the predicted channel terrains are −13.55% to 11.30% different from those of the surveyed channel topography due to the hypothesis of the rectangular channel.
This proposed method provides a simple but promising way to derive the satellite-based river bathymetry for hydrodynamic simulations in the data-scarce regions where precise river topography is difficult to obtain. The assumption of a rectangular shape serves to reduce the number of unknown parameters to just width and depth, which is shown to capture the general variations in the bathymetry ( R 2 = 0.86) and 1D flow simulations ( N S E = 0.94). The influence of this assumption on the inundation areas (<1%) and depths (<10%) of 2D simulations seems to be limited, which are comparable to other uncertainties coming from multi-source data and hydrodynamic modeling.
Notably, hydrodynamic simulations are sensitive to local topography, especially in flat or low-slope areas; in other words, if the studied reach is mostly hilly, then steep terrain tends to reduce the model’s sensitivity to elevation errors. Since this study is conducted in low-gradient river reaches, its workflow is expected to be also applicable for other regions with steeper slopes. Future research would need to improve the prediction of the top width for reaches with partially exposed side slopes.

Supplementary Materials

The following supporting information can be downloaded at: https://www.mdpi.com/article/10.3390/rs17223753/s1, Table S1: Data acquisition timeline for the ICESat-2 and Sentinel-2 datasets used in this study (available in .xlsx format).

Author Contributions

Conceptualization, Y.F. and J.L.; methodology, Y.F. and X.H.; software, X.H.; validation, Y.F., X.H. and R.C.; formal analysis, Y.F.; investigation, S.Z., D.M. and S.L.; resources, J.L. and D.M.; data curation, Y.F. and J.L.; writing—original draft preparation, Y.F. and J.L.; writing—review and editing, Y.F. and J.L.; visualization, R.C. and Y.F.; supervision, S.Z., S.L. and D.M.; project administration, Y.F.; funding acquisition, Y.F. All authors have read and agreed to the published version of the manuscript.

Funding

This research was funded by the Open Research Fund from State Key Laboratory of Hydraulic Engineering Intelligent Construction and Operation, Tianjin University, grant number HESS-2525.

Data Availability Statement

The remote sensing datasets utilized in this study are accessible via publicly available web services. The ICESat-2 data can be obtained from the National Snow and Ice Data Center website at https://nsidc.org/data/atl03 (accessed on 22 April 2025). Sentinel-2 data are available from the Copernicus Data Space at https://dataspace.copernicus.eu/data-collections/copernicus-sentinel-data/sentinel-2 (accessed on 16 April 2025).

Conflicts of Interest

Donghe Ma was employed by the company China Water Northeastern Investigation, Design and Research Company. The remaining authors declare that the research was conducted in the absence of any commercial or financial relationships that could be construed as a potential conflict of interest.

Abbreviations

The following abbreviations are used in this manuscript:
ICESat-2Ice, Cloud, and Land Elevation Satellite-2
ADCPAcoustic Doppler Current Profiler
ATLASAdvanced Terrain Laser Altimeter System
ATL03ATLAS Level-3A Global Geolocated Photon Data
CSCross Section
DEMDigital Elevation Model
EGM2008Earth Gravity Model 2008
HEC-RASHydrologic Engineering Center’s River Analysis System
MAPEMean Absolute Percentage Error
MSIMultispectral Instrument (Sentinel-2)
NDWINormalized Difference Water Index
NSENash–Sutcliffe Efficiency
PBIASPercent Bias
R2Coefficient of Determination
RMSERoot Mean Square Error
RTKReal-Time Kinematics
USVsUnmanned Surface Vehicles
1DOne-dimensional (hydrodynamic model)
2DTwo-dimensional (hydrodynamic model)
GAGenetic Algorithm
DEAPDistributed Evolutionary Algorithms in Python

References

  1. Neal, J.; Hawker, L.; Savage, J.; Durand, M.; Bates, P.; Sampson, C. Estimating River Channel Bathymetry in Large Scale Flood Inundation Models. Water Resour. Res. 2021, 57, e2020WR028301. [Google Scholar] [CrossRef]
  2. Zazo, S.; Rodríguez-Gonzálvez, P.; Molina, J.-L.; González-Aguilera, D.; Agudelo-Ruiz, C.A.; Hernández-López, D. Flood Hazard Assessment Supported by Reduced Cost Aerial Precision Photogrammetry. Remote Sens. 2018, 10, 1566. [Google Scholar] [CrossRef]
  3. Garzon, L.F.L.; Johnson, M.F.; Mount, N.; Gomez, H. Exploring the effects of catchment morphometry on overland flow response to extreme rainfall using a 2D hydraulic-hydrological model (IBER). J. Hydrol. 2023, 627, 130405. [Google Scholar] [CrossRef]
  4. Zhou, M.; Lee, A.C.; Alip, A.E.; Dieu, H.T.; Leong, Y.L.; Ooi, S.K. Robust Bathymetric Mapping in Shallow Waters: A Digital Surface Model-Integrated Machine Learning Approach Using UAV-Based Multispectral Imagery. Remote Sens. 2025, 17, 3066. [Google Scholar] [CrossRef]
  5. Zhao, L.; Bai, Y.; Paik, J.K. Optimal coverage path planning for USV-assisted coastal bathymetric survey: Models, solutions, and lake trials. Ocean Eng. 2024, 296, 116921. [Google Scholar] [CrossRef]
  6. Pavelsky, T.M.; Smith, L.C. RivWidth: A Software Tool for the Calculation of River Widths From Remotely Sensed Imagery. IEEE Geosci. Remote Sens. Lett. 2008, 5, 70–73. [Google Scholar] [CrossRef]
  7. Allen, G.H.; Pavelsky, T.M. Patterns of river width and surface area revealed by the satellite-derived North American River Width data set. Geophys. Res. Lett. 2015, 42, 395–402. [Google Scholar] [CrossRef]
  8. Allen, G.H.; Pavelsky, T.M. Global extent of rivers and streams. Science 2018, 361, 585–588. [Google Scholar] [CrossRef]
  9. Isikdogan, F.; Bovik, A.; Passalacqua, P. RivaMap: An automated river analysis and mapping engine. Remote Sens. Environ. 2017, 202, 88–97. [Google Scholar] [CrossRef]
  10. Yang, J.; Huang, X.; Tang, Q. Satellite-derived river width and its spatiotemporal patterns in China during 1990–2015. Remote Sens. Environ. 2020, 247, 111918. [Google Scholar] [CrossRef]
  11. Yamazaki, D.; O’Loughlin, F.; Trigg, M.A.; Miller, Z.F.; Pavelsky, T.M.; Bates, P.D. Development of the Global Width Database for Large Rivers. Water Resour. Res. 2014, 50, 3467–3480. [Google Scholar] [CrossRef]
  12. Wang, Z.; Li, J.; Lin, Y.; Meng, Y.; Liu, J. GrabRiver: Graph-Theory-Based River Width Extraction From Remote Sensing Imagery. IEEE Geosci. Remote Sens. Lett. 2022, 19, 1500505. [Google Scholar] [CrossRef]
  13. Lee, S.-J.; Kim, H.-S.; Yun, H.-S.; Lee, S.-H. Satellite-Derived Bathymetry Using Sentinel-2 and Airborne Hyperspectral Data: A Deep Learning Approach with Adaptive Interpolation. Remote Sens. 2025, 17, 2594. [Google Scholar] [CrossRef]
  14. Liu, Y.; Zhao, J.; Deng, R.; Liang, Y.; Gao, Y.; Chen, Q.; Xiong, L.; Liu, Y.; Tang, Y.; Tang, D. A downscaled bathymetric mapping approach combining multitemporal Landsat-8 and high spatial resolution imagery: Demonstrations from clear to turbid waters. ISPRS J. Photogramm. Remote Sens. 2021, 180, 65–81. [Google Scholar] [CrossRef]
  15. Jung, J.; Parrish, C.E.; Magruder, L.A.; Herrmann, J.; Yoo, S.; Perry, J.S. ICESat-2 bathymetry algorithms: A review of the current state-of-the-art and future outlook. ISPRS J. Photogramm. Remote Sens. 2025, 223, 413–439. [Google Scholar] [CrossRef]
  16. Guo, X.; Jin, X.; Jin, S. Shallow Water Bathymetry Mapping from ICESat-2 and Sentinel-2 Based on BP Neural Network Model. Water 2022, 14, 3862. [Google Scholar] [CrossRef]
  17. Fu, L.-L.; Pavelsky, T.; Cretaux, J.-F.; Morrow, R.; Farrar, J.T.; Vaze, P.; Sengenes, P.; Vinogradova-Shiffer, N.; Sylvestre-Baron, A.; Picot, N.; et al. The Surface Water and Ocean Topography Mission: A Breakthrough in Radar Remote Sensing of the Ocean and Land Surface Water. Geophys. Res. Lett. 2024, 51, e2023GL107652. [Google Scholar] [CrossRef]
  18. Feng, Y.; Zheng, R.; Ma, D.; Huang, X. Associating reservoir operations with 2D inundation risk and climate uncertainty. Water Supply 2024, 24, 2598–2613. [Google Scholar] [CrossRef]
  19. Feng, Y.; Huang, X.; Ma, D.; Gao, Z.; Liu, J. Shifting patterns of Pareto fronts for multi-objective reservoir operations in response to extreme flood events and uncertain climates. J. Water Clim. Change 2025, 16, 2134–2152. [Google Scholar] [CrossRef]
  20. Ma, F.; Chen, J.; Chen, J.; Wang, T.; Han, L.; Zhang, X.; Yan, J. Evolution of the hydro-ecological environment and its natural and anthropogenic causes during 1985–2019 in the Nenjiang River basin. Sci. Total Environ. 2021, 799, 149256. [Google Scholar] [CrossRef]
  21. Lian, W.; Zhang, G.; Cui, H.; Chen, Z.; Wei, S.; Zhu, C.; Xie, Z. Extraction of high-accuracy control points using ICESat-2 ATL03 in urban areas. Int. J. Appl. Earth Obs. Geoinf. 2022, 115, 103116. [Google Scholar] [CrossRef]
  22. Le, Y.; Hu, M.; Chen, Y.; Yan, Q.; Zhang, D.; Li, S.; Zhang, X.; Wang, L. Investigating the Shallow-Water Bathymetric Capability of Zhuhai-1 Spaceborne Hyperspectral Images Based on ICESat-2 Data and Empirical Approaches: A Case Study in the South China Sea. Remote Sens. 2022, 14, 3406. [Google Scholar] [CrossRef]
  23. Herrmann, I.; Pimstein, A.; Karnieli, A.; Cohen, Y.; Alchanatis, V.; Bonfil, D.J. LAI assessment of wheat and potato crops by VENμS and Sentinel-2 bands. Remote Sens. Environ. 2011, 115, 2141–2151. [Google Scholar] [CrossRef]
  24. Watson, C.S.; King, O.; Miles, E.S.; Quincey, D.J. Optimising NDWI supraglacial pond classification on Himalayan debris-covered glaciers. Remote Sens. Environ. 2018, 217, 414–425. [Google Scholar] [CrossRef]
  25. Zheng, Y.; Tang, L.; Wang, H. An improved approach for monitoring urban built-up areas by combining NPP-VIIRS nighttime light, NDVI, NDWI, and NDBI. J. Clean. Prod. 2021, 328, 129488. [Google Scholar] [CrossRef]
  26. Li, Y.; Shen, X.; Cao, L. An Advanced Terrain Vegetation Signal Detection Approach for Forest Structural Parameters Estimation Using ICESat-2 Data. Remote Sens. 2024, 16, 1822. [Google Scholar] [CrossRef]
  27. Nezhadarya, E.; Wang, Z.J.; Ward, R.K. Robust Image Watermarking Based on Multiscale Gradient Direction Quantization. IEEE Trans. Inf. Forensics Secur. 2011, 6, 1200–1213. [Google Scholar] [CrossRef]
  28. Wu, Q.; Wang, H.; Wang, B.; Chen, S.; Li, H. Performance Comparison of Geoid Refinement between XGM2016 and EGM2008 Based on the KTH and RCR Methods: Jilin Province, China. Remote Sens. 2020, 12, 324. [Google Scholar] [CrossRef]
  29. Pavlis, N.K.; Holmes, S.A.; Kenyon, S.C.; Factor, J.K. The development and evaluation of the Earth Gravitational Model 2008 (EGM2008). J. Geophys. Res. Solid Earth 2012, 117, B04406. [Google Scholar] [CrossRef]
  30. Sahoo, B.; Perumal, M.; Moramarco, T.; Barbetta, S. Rating Curve Development at Ungauged River Sites using Variable Parameter Muskingum Discharge Routing Method. Water Resour. Manag. 2014, 28, 3783–3800. [Google Scholar] [CrossRef]
  31. Hou, S.; Zhang, F.; Yu, L.; Cao, S.; Zhou, Y.; Wu, Y.; Hou, L. Optimization of a combined cooling, heating and power system using CO2 as main working fluid driven by gas turbine waste heat. Energy Convers. Manag. 2018, 178, 235–249. [Google Scholar] [CrossRef]
  32. Perumal, M.; Moramarco, T.; Sahoo, B.; Barbetta, S. On the practical applicability of the VPMS routing method for rating curve development at ungauged river sites. Water Resour. Res. 2010, 46, W03522. [Google Scholar] [CrossRef]
  33. Chen, J.; Jiang, Z.; Que, Y. Hierarchical recursive Levenberg–Marquardt algorithm for radial basis function autoregressive models. Inf. Sci. 2023, 647, 119506. [Google Scholar] [CrossRef]
  34. Karakaya, D.; Ozturk, B.; Elçi, S. Hydrokinetic power potential assessment of the Çoruh River Basin. Energy Sustain. Dev. 2024, 82, 101533. [Google Scholar] [CrossRef]
  35. Rather, A.F.; Ahmed, R.; Bansal, J.K.; Mir, R.A.; Ahmed, P.; Malik, I.H.; Varade, D. Glacial lake outburst flood risk assessment of a rapidly expanding glacial lake in the Ladakh region of Western Himalaya, using hydrodynamic modeling. Geomat. Nat. Hazards Risk 2024, 15, 2413893. [Google Scholar] [CrossRef]
  36. Mejia, A.I.; Reed, S.M. Evaluating the effects of parameterized cross section shapes and simplified routing with a coupled distributed hydrologic and hydraulic model. J. Hydrol. 2011, 409, 512–524. [Google Scholar] [CrossRef]
  37. Fereshtehpour, M.; Esmaeilzadeh, M.; Alipour, R.S.; Burian, S.J. Impacts of DEM type and resolution on deep learning-based flood inundation mapping. Earth Sci. Inform. 2024, 17, 1125–1145. [Google Scholar] [CrossRef]
  38. Nguyen, M.; Wilson, M.D.; Lane, E.M.; Brasington, J.; Pearson, R.A. Quantifying Uncertainty in Flood Predictions in Fixed Cartesian Flood Model Due To Arbitrary Conventions in Grid Alignment. Water Resour. Res. 2025, 61, e2024WR038919. [Google Scholar] [CrossRef]
  39. Muthusamy, M.; Casado, M.R.; Butler, D.; Leinster, P. Understanding the effects of Digital Elevation Model resolution in urban fluvial flood modelling. J. Hydrol. 2021, 596, 126088. [Google Scholar] [CrossRef]
  40. Hoch, J.M.; Eilander, D.; Ikeuchi, H.; Baart, F.; Winsemius, H.C. Evaluating the impact of model complexity on flood wave propagation and inundation extent with a hydrologic–hydrodynamic model coupling framework. Nat. Hazards Earth Syst. Sci. 2019, 19, 1723–1735. [Google Scholar] [CrossRef]
  41. Dey, S.; Saksena, S.; Winter, D.; Merwade, V.; McMillan, S. Incorporating Network Scale River Bathymetry to Improve Characterization of Fluvial Processes in Flood Modeling. Water Resour. Res. 2022, 58, e2020WR029521. [Google Scholar] [CrossRef]
  42. Demiral, D.; Boes, R.M.; Albayrak, I. Effects of Secondary Currents on Turbulence Characteristics of Supercritical Open Channel Flows at Low Aspect Ratios. Water 2020, 12, 3233. [Google Scholar] [CrossRef]
  43. Bali, M.; Kolahdoozan, M.; Zarrati, A.; Alaee, M. Vertical velocity in rectangular channel bends: Numerical study and development of a prediction formula. J. Braz. Soc. Mech. Sci. Eng. 2019, 41, 489. [Google Scholar] [CrossRef]
  44. Guan, M.; Wright, N.G.; Sleigh, P.A.; Ahilan, S.; Lamb, R. Physical complexity to model morphological changes at a natural channel bend. Water Resour. Res. 2016, 52, 6348–6364. [Google Scholar] [CrossRef]
  45. Khalid, Z.; de Souza de Lima, A.; Ruess, P.J.; Khalid, A.; Miesse, T.; Veronez, D.; Ferreira, C.M.; Kinter, J.L. DEMend: Automating Hydrological Correction of Digital Elevation Models for Enhanced Urban Flood Modeling. Water Resour. Manag. 2025, 39, 5751–5768. [Google Scholar] [CrossRef]
  46. Neal, J.; Schumann, G.; Bates, P. A subgrid channel model for simulating river hydraulics and floodplain inundation over large and data sparse areas. Water Resour. Res. 2012, 48, 1–16. [Google Scholar] [CrossRef]
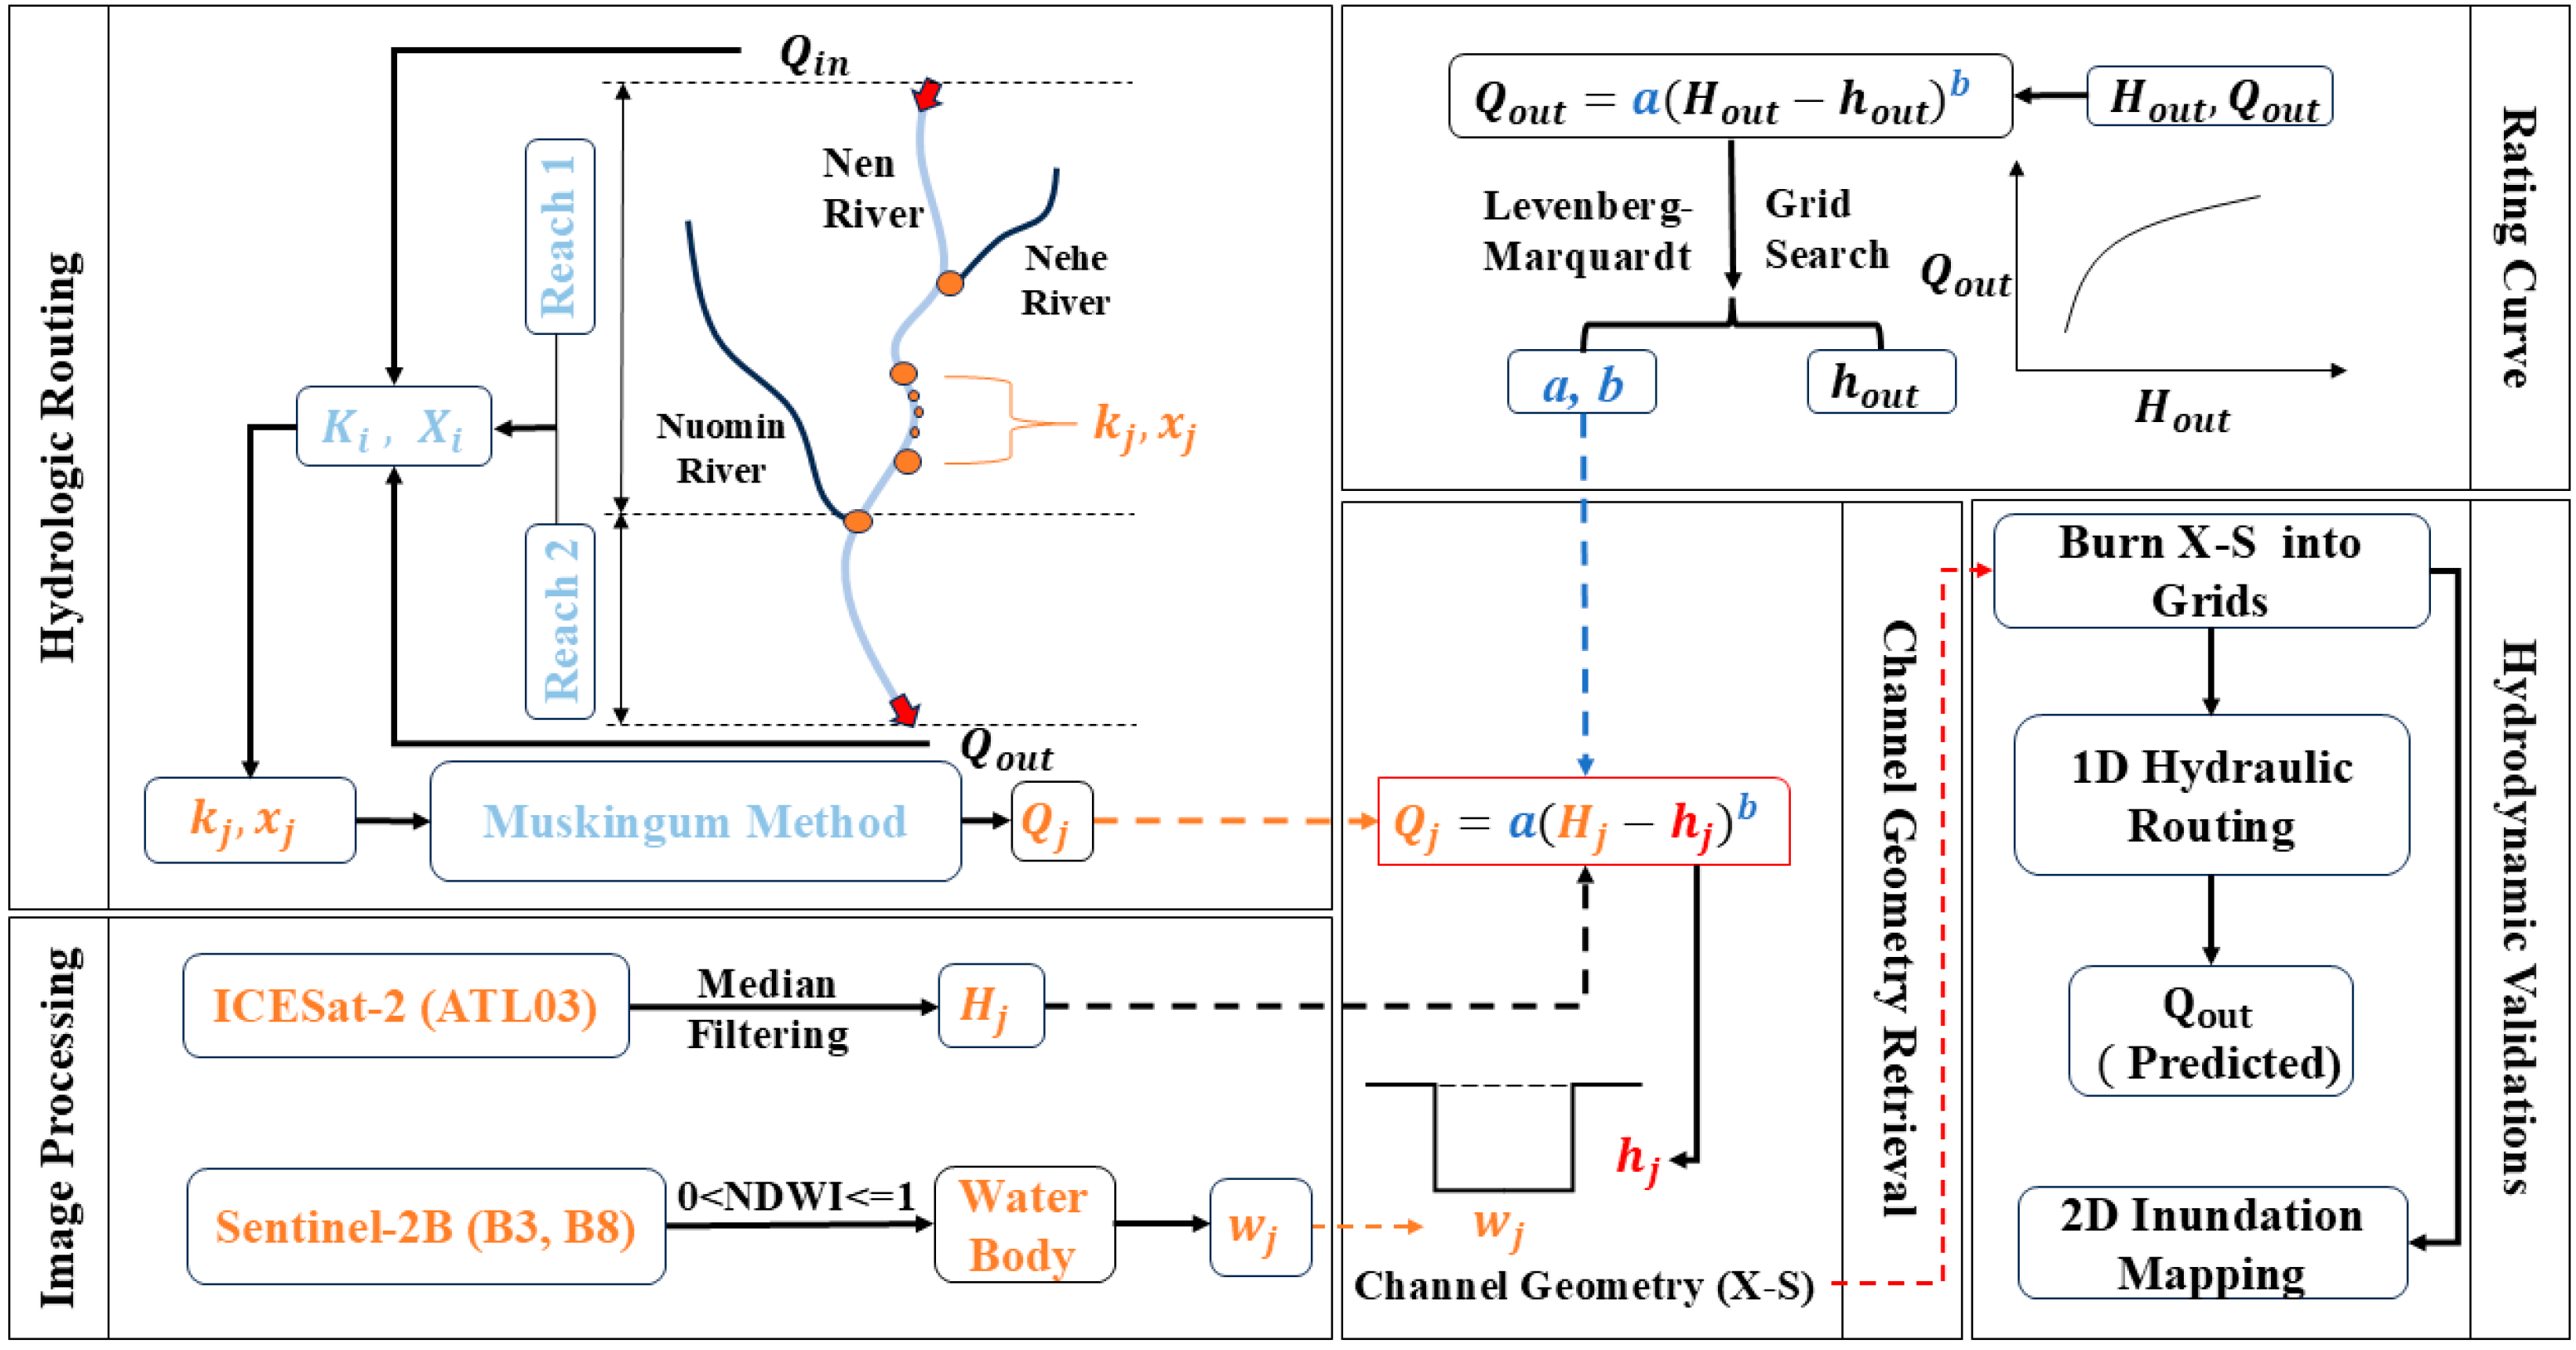
Figure 1. Overview of the workflow.
Remotesensing 17 03753 g001
Figure 2. Map of the study area: (a) the studied river reach (highlighted in red) within the Nen River network; (b) a zoomed view of the studied river reach including the main stem of Nen River, the Nierji reservoir in the upstream, the Tongmeng stream gauge in the downstream, the tributary of Namoer and Nuomin rivers, and the 25 surveyed cross sections (green lines). The water mask is extracted based on NDWI.
Remotesensing 17 03753 g002
Figure 3. Accuracy of river width prediction on 13 August 2024. Note: red and green lines denote underestimation and overestimation, respectively, with the line length representing the magnitude of discrepancy.
Remotesensing 17 03753 g003
Figure 4. Fitting of the rating curve based on 2018–2022 observations.
Remotesensing 17 03753 g004
Figure 5. Calibration (a) and validation (b) of the Muskingum method at Tongmeng gauge.
Remotesensing 17 03753 g005
Figure 6. Validation of the back-calculated riverbed elevations along the channel.
Remotesensing 17 03753 g006
Figure 7. The comparison of observed hydrographs and the simulated hydrographs based on the measured channel geometry (a) or on the satellite-derived channel geometry (b).
Remotesensing 17 03753 g007
Figure 8. Differences in simulated inundation depths between the measured and derived channel geometries for the 50-yr (a) and 100-yr (b) events.
Remotesensing 17 03753 g008
Figure 9. The velocity vectors around a 60° channel bend at the end of the fourth day of the 100-yr event, simulated based on the surveyed cross sections (left) and the satellite-derived cross sections (right). Note: the gray arrows represent the lower flow rates than 0.78 m/s; the red lines refer to the bank lines.
Remotesensing 17 03753 g009
Figure 10. The profiles of velocities (upper panel) and elevations (lower panel) at three intermediate cross sections (CS14+1, CS14+2, and CS15+1) based on measured and satellite-derived channel geometry for the 100-yr flood event.
Remotesensing 17 03753 g010
Figure 11. Interquartile ranges (IQRs) and rolling medians of the uncertainties of the derived riverbed elevations due to the sampling of Muskingum parameters: K 1 (a), K 2 (b), X 1 (c), and X 2 (d).
Remotesensing 17 03753 g011
Disclaimer/Publisher’s Note: The statements, opinions and data contained in all publications are solely those of the individual author(s) and contributor(s) and not of MDPI and/or the editor(s). MDPI and/or the editor(s) disclaim responsibility for any injury to people or property resulting from any ideas, methods, instructions or products referred to in the content.