1. Introduction
China is located at the intersection of temperate and subtropical zones. Jointly influenced by the interaction between cold and warm air masses as well as land–sea interactions, frequent severe convective weather in the country leads to a high incidence of thunderstorm activity [
1,
2,
3]. Thunderstorm activity exhibits distinct regional distribution characteristics: the five southeastern provinces (Hunan, Jiangxi, Zhejiang, Fujian, and Guangdong) are high-incidence areas, while northwestern China has relatively sparse thunderstorm activity. Meanwhile, the frequency of lightning disaster incidents is also related to regional economic development and population density in China. In addition to the characteristics of sudden occurrence, high frequency, wide scope, long duration of lightning activity, and frequent lightning-induced fires, lightning disasters in China typically result in a high number of deaths in rural areas and heavy economic losses in urban areas. Furthermore, lightning disasters can cause paralysis of power and information systems, among other hazards. The destructiveness of the transient large current during lightning return strokes has made the accurate localization of lightning radiation sources and the achievement of clear imaging of lightning plasma channels a core requirement for lightning disaster prevention and research on atmospheric physical processes.
Currently, the primary instruments for lightning detection and early warning are ground-based lightning location systems. These ground-based lightning location networks are capable of real-time lightning location over large areas, play a crucial role in lightning statistics, lightning disaster early warning, and lightning physics analysis, and serve as the primary method for lightning detection at present. Well-known lightning location and monitoring systems worldwide include the U.S. National Lightning Detection Network (NLDN), the European Lightning Detection Network (LINET), and others. However, due to issues such as their long service life and severe aging, the positioning accuracy of these systems has been significantly affected. Current mainstream positioning algorithms—such as the Time Difference of Arrival (TDOA) method and the magnetic orientation method—suffer from various problems, including large positioning errors in areas with sparse base stations (e.g., oceans, plateaus) and high susceptibility to multipath effects in mountainous regions. Additionally, the abovementioned methods exhibit a relatively high distortion rate (up to 15% [
4]) in the reconstruction of discharge channels.
Furthermore, the interferometric localization method we previously employed in the Leshan VHF (Very High Frequency) radar system [
5,
6,
7] has the following drawbacks: its accuracy depends on the accurate measurement of phase differences between multiple antennas, and it requires the assumption that the signal propagation path is an ideal straight line.
Another non-negligible limitation of the interferometric localization algorithm is its susceptibility to phase noise, which in turn leads to inaccurate localization. The operating principle of interferometric localization relies on precise phase differences, whose measurement accuracy directly determines the localization results—even minimal phase noise can be amplified into angular deviations. This interference is particularly pronounced in the research scenario of this paper: the signal energy of lightning branch channels is only 10–30% of that of the main channel. Due to the low signal-to-noise ratio (SNR) of weak signals themselves, the impact of phase noise accounts for a higher proportion, which tends to exacerbate localization errors. This is also one of the key reasons why the study adopts the EMTR algorithm combined with HDBSCAN: EMTR compensates for phase distortion through time reversal focusing, while HDBSCAN filters out discrete noise points, thereby reducing the interference of phase noise on localization results.Given the various shortcomings of the aforementioned algorithms, this study employs the Electromagnetic Time Reversal (EMTR) method for radiation source localization [
8,
9,
10].
In recent years, the Time Reversal (TR) method has demonstrated significant application potential [
11]. In the 1990s, the team led by French scientist M. Fink first introduced time reversal into the field of acoustics, proposing the “Time Reversal Mirror (TRM)” theory. By leveraging the multipath scattering characteristics of sound waves in complex media, this theory enables spatiotemporal synchronous focusing, which has been applied to lithography, underwater detection, and other areas. In 2004, G. Lerosey et al. became the first to extend time reversal to electromagnetics, putting forward the “Electromagnetic Time Reversal Cavity” theory [
12]. This theory proves that electromagnetic waves can be focused through multipath scattering, surpassing the Rayleigh diffraction limit.
This positioning algorithm can effectively utilize the medium cancelation effect between backward and forward propagation to offset phase delays and compensate for signal dispersion caused by the propagation medium. Furthermore, the TR method can significantly mitigate the impact of multipath effects on positioning accuracy.
Addressing the limitation of the interferometric localization method—i.e., its missed detection of weak signals—the EMTR algorithm does not rely on signal amplitude thresholds. Instead, it captures low-energy radiation sources through its “energy focusing” property: even weak signals from lightning branches (with energy equivalent to only 10% of the main channel) superimpose with other signals during backward propagation, forming detectable energy peaks. This advantage allows us to fully capture both the main channel and branch structures of lightning in this experiment.
The experimental scenario of Reference [
13] is an open area with low multipath interference, and does not involve complex terrains such as mountainous areas and coastal regions. The core breakthroughs of this study are as follows: 1. Specifically targeting scenarios with significant multipath effects (e.g., the mountainous and hilly terrains in the detection area of the Leshan radar), we optimized the signal preprocessing flow of EMTR—adding FIR band-pass filtering and phase compensation steps to improve the separation accuracy of multipath signals, thereby reducing the energy focusing error of EMTR from 0.5 km (as reported in Reference [
13]) to 0.38 km; 2. Supplementing robustness verification under multipath interference: Comparative experiments demonstrate that, in scenarios where multipath signals account for 30~40%, the positioning error of the proposed method can still be controlled within 0.75 km. In contrast, the method in Reference [
13] has an error exceeding 1.2 km under the same scenarios, failing to meet the requirements of refined research.
The core idea of this study is to achieve radiation source localization by combining the cross-correlation localization algorithm (previously adopted by researchers) with the Electromagnetic Time Reversal (EMTR) algorithm, utilizing the Leshan meteor radar—a device equipped with an interferometric hardware configuration [
8]. The core steps of EMTR can be summarized into three phases: first, signal acquisition and preprocessing, which involves receiving Lightning Electromagnetic Pulse (LEMP) signals through a multi-station observation network and extracting valid waveforms via processes such as filtering and denoising; second, time reversal operation on the processed valid waveforms, converting “receiver-end signals” into “transmitted signals for backward propagation” through time-domain reversal or frequency-domain conjugate transformation; third, simulating the backward propagation of the reversed signals, which ultimately results in energy focusing at the radiation source, with the location of the lightning radiation source determined by detecting the focal point. After the aforementioned steps, a point set containing a large number of localization points is obtained, requiring a clustering algorithm to distinguish valid signals from noise. Additionally, since a lightning channel consists of dense radiation sources, the localization point set may exhibit uneven density due to differences in signal intensity—this also necessitates the use of a clustering algorithm to uncover the implicit spatial continuity within the set. Traditional clustering algorithms (e.g., DBSCAN) are sensitive to density thresholds and thus difficult to adapt to the dynamic density changes in lightning point clouds. In contrast, the Hierarchical Density-Based Spatial Clustering of Applications with Noise (HDBSCAN) algorithm, through mutual reachability distance measurement and stable cluster evaluation [
13,
14], can automatically identify valid radiation source clusters of varying densities and eliminate isolated noise points.
This study proposes a coupled electromagnetic time reversal (EMTR)-HDBSCAN method for lightning imaging in mountainous terrains, with three distinct innovations beyond prior TR-MUSIC-related works and traditional lightning localization techniques: First, targeting the severe multipath interference in mountainous areas—a critical unaddressed challenge in existing TR-based methods—we optimize the EMTR signal preprocessing pipeline by integrating FIR band-pass filtering and phase compensation. This reduces the energy focusing error of EMTR from 0.5 km (reported in conventional studies) to 0.38 km, achieving high-precision localization even when multipath signals account for 30–40% of the received data. Second, we innovatively couple EMTR with the HDBSCAN algorithm to resolve the limitations of traditional clustering methods (e.g., DBSCAN, K-means) in handling lightning point clouds with uneven density (dense main channels vs. sparse branches). HDBSCAN automatically identifies valid radiation source clusters without manual parameter tuning, suppressing noise with an efficiency exceeding 95% while retaining weak branch signals, which enables the fine-grained reconstruction of dendritic lightning channel structures (structural overlap rate with ground truth reaching 92.3%). Third, unlike TR-MUSIC that focuses on multi-source resolution under ideal conditions, our method is tailored for legacy interferometric VHF radar hardware, avoiding the need for specialized equipment upgrades. By fusing preliminary interferometric results to seed the EMTR source model, it overcomes the trade-off between localization accuracy, weak signal capture, and computational feasibility—filling the gap in high-precision lightning imaging for complex mountainous terrains where traditional methods (e.g., TDOA, interferometry) suffer from large multipath errors or branch signal misdetection.
In summary, we achieve more refined lightning localization and imaging using novel algorithms based on legacy interferometric system equipment.
2. Materials and Methods
This section revolves around the experimental materials and core methods for lightning localization and imaging, following the logical hierarchy of “experimental foundation, data preprocessing, core algorithms and result generation”. The specific structural framework is as follows:
2.1. Experimental Equipment
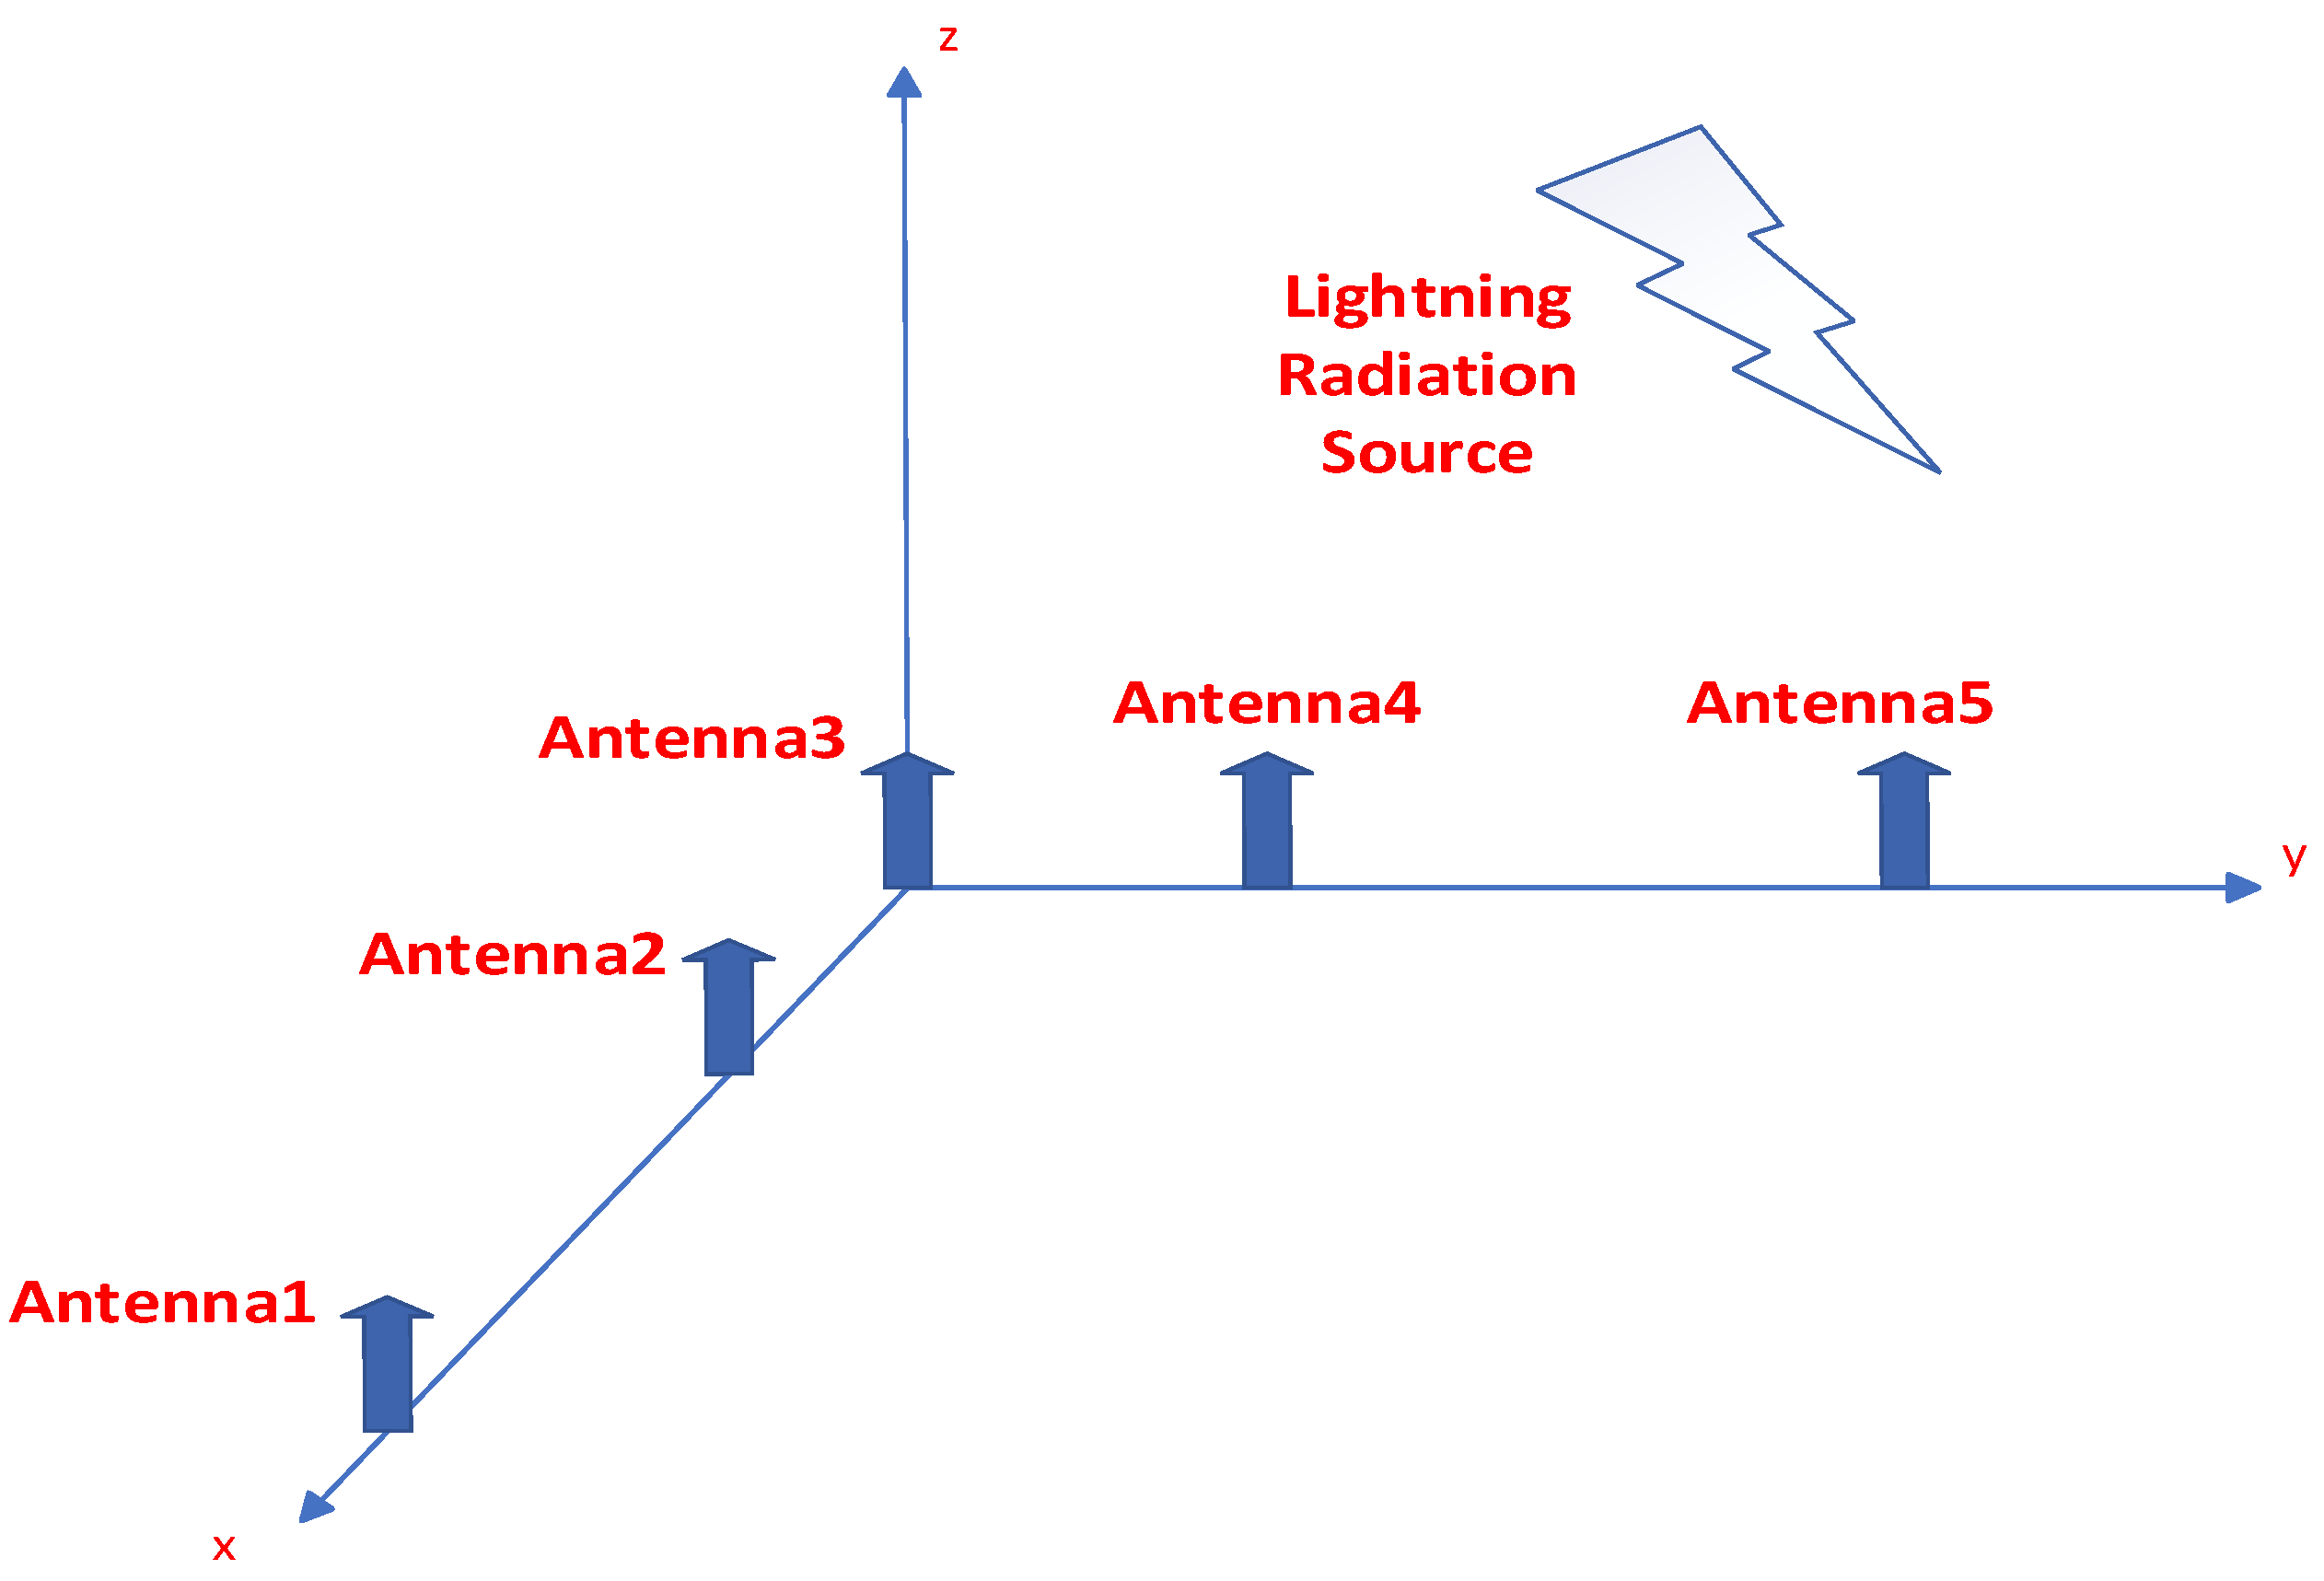
Below is some information about the Leshan VHF (Very High Frequency) radar: It consists of one transmitting antenna and five receiving antennas, arranged in an “L”-shaped array, as shown in
Figure 1 [
5]. Within this “L”-shaped array, Antennas 1, 2, and 3 share one baseline, while Antennas 3, 4, and 5 share another baseline. The distance between Antenna 1 and Antenna 2 (as well as between Antenna 4 and Antenna 5) is 4.5 times the wavelength, whereas the distance between Antenna 2 and Antenna 3 (and between Antenna 3 and Antenna 4) is 2.5 times the wavelength [
5,
6]. The working frequency of this radar is 48.2 MHz.
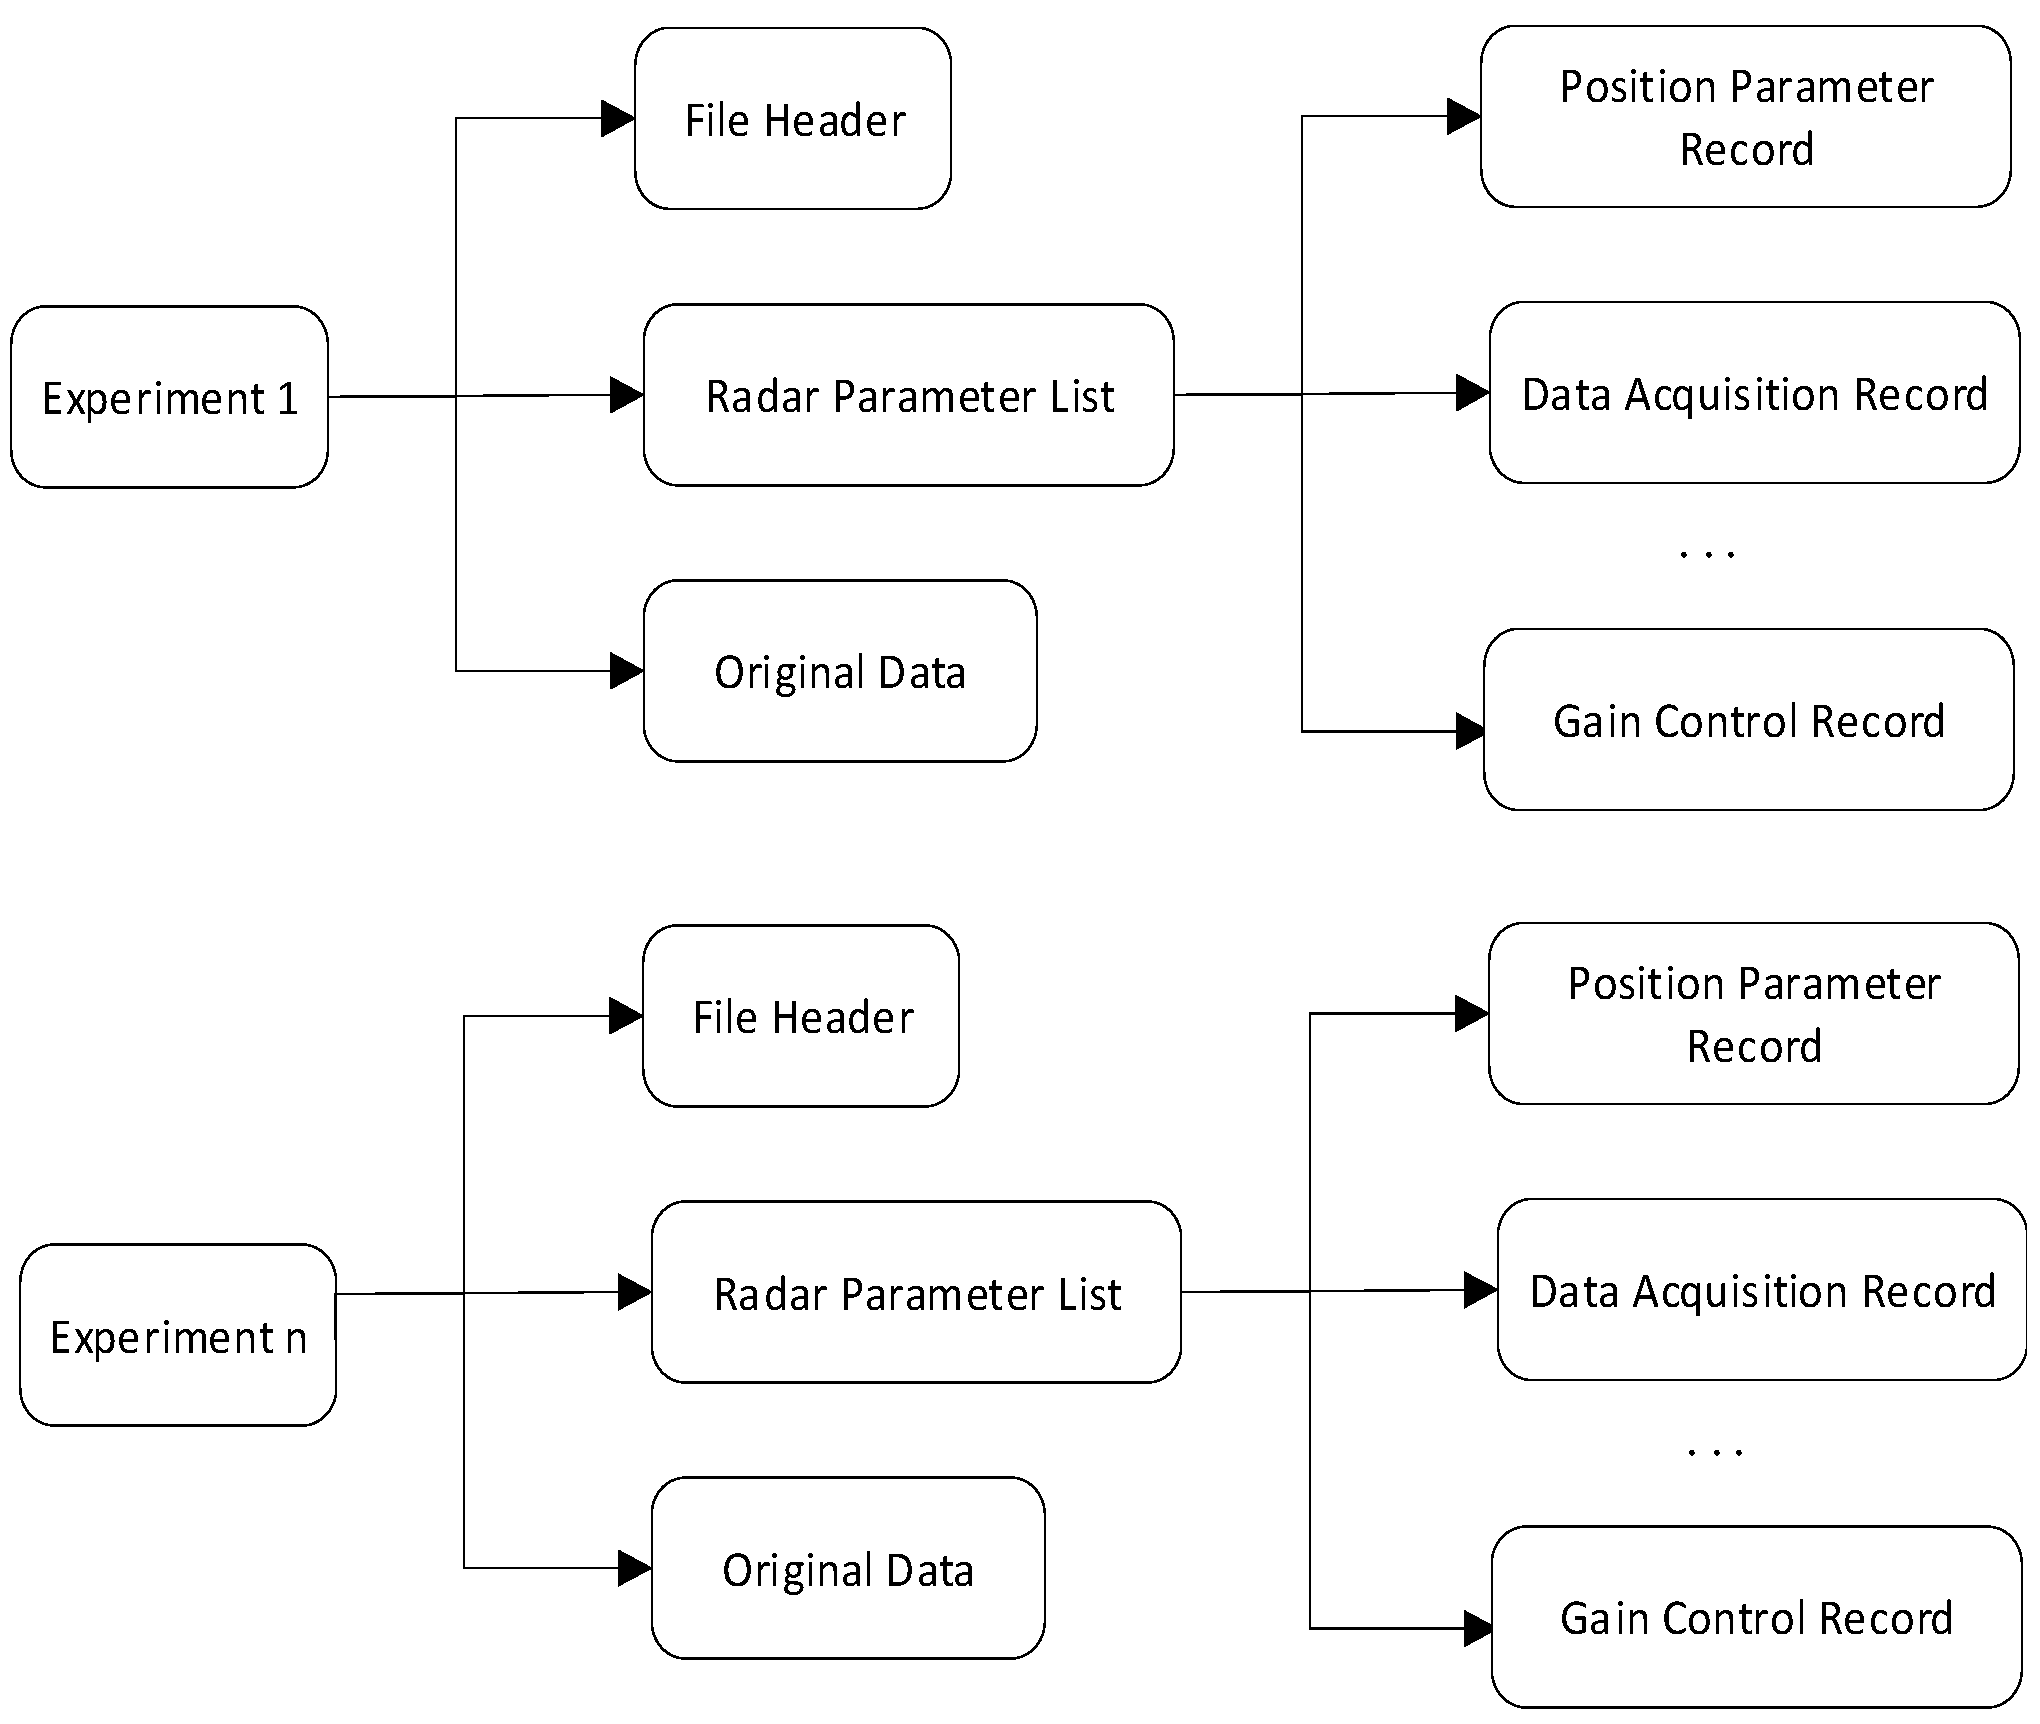
The rationale for adopting this 5-antenna array with short baselines is as follows: Short-baseline arrays can enhance the resolution of adjacent radiation sources by leveraging signal differences between adjacent antennas. The 5-antenna array used in this study can compensate for timing (i.e., phase) deviations through multi-channel signal fusion. The radar is equipped with five antennas, which correspond to five receiving channels—each channel provides I (in-phase) and Q (quadrature) data. The raw data generated by this radar during operation features a unique data structure. The data analyzed in this study are derived from the original in-phase and quadrature (I/Q) data stored in “.raw” files [
15]. The data are recorded in the order of range gates, starting from the lowest range gate; first, the I and Q data of Channel 1 are recorded, followed by those of Channel 2, and so on. After consulting the radar manual, we confirmed that the storage format of the raw data is generally as illustrated in
Figure 2 [
5].
A complete raw data file starts with a file header, followed by n experimental records (where n denotes the number of experimental records specified in the file title). Each experimental record consists of a radar parameter list and raw data. The radar parameter list comprises various types of parameter records, including sequential parameter records, experimental parameter records, position parameter records, data acquisition parameter records, transmit pulse records, beam scanning records, and gain control records, among others. Different data blocks are distinguished by specific magic numbers. For instance, the data file header begins with the 4-byte 32-bit integer “0x1200xxxx”, where “xxxx” represents the version number. Different radar parameter records also have distinct magic numbers: for example, position parameter records have a magic number of “0x1203xxxx”, while gain control records have a magic number of “0x1204xxxx” [
5]. Detailed radar parameters are presented in
Table 1:
2.2. Geometric Dilution of Precision (GDOP) Analysis
To address the concern about the vertical aperture performance of the five short-baseline antennas, the GDOP is introduced to quantify the impact of antenna geometric layout on localization accuracy. GDOP describes the relationship between measurement noise and positioning error, with lower GDOP values indicating better geometric positioning conditions [
12].
Based on the L-shaped array configuration of the Leshan VHF radar (
Section 2.1), the coordinates of the five receiving antennas are defined with the central antenna (Antenna 3) as the origin (0, 0, 0) (unit: m). The specific coordinates are determined according to the baseline length (4.5λ or 2.5λ, λ = 6.22 m): Antenna 1: (−27.99, 0, 0), Antenna 2: (−15.55, 0, 0), Antenna 3: (0, 0, 0), Antenna 4: (0, 15.55, 0), Antenna 5: (0, 27.99, 0). The GDOP for 3D localization (azimuth, theta, elevation, phi, range) is calculated using the Fisher information matrix (FIM), and its simplified expression for phase-difference-based localization is:
where
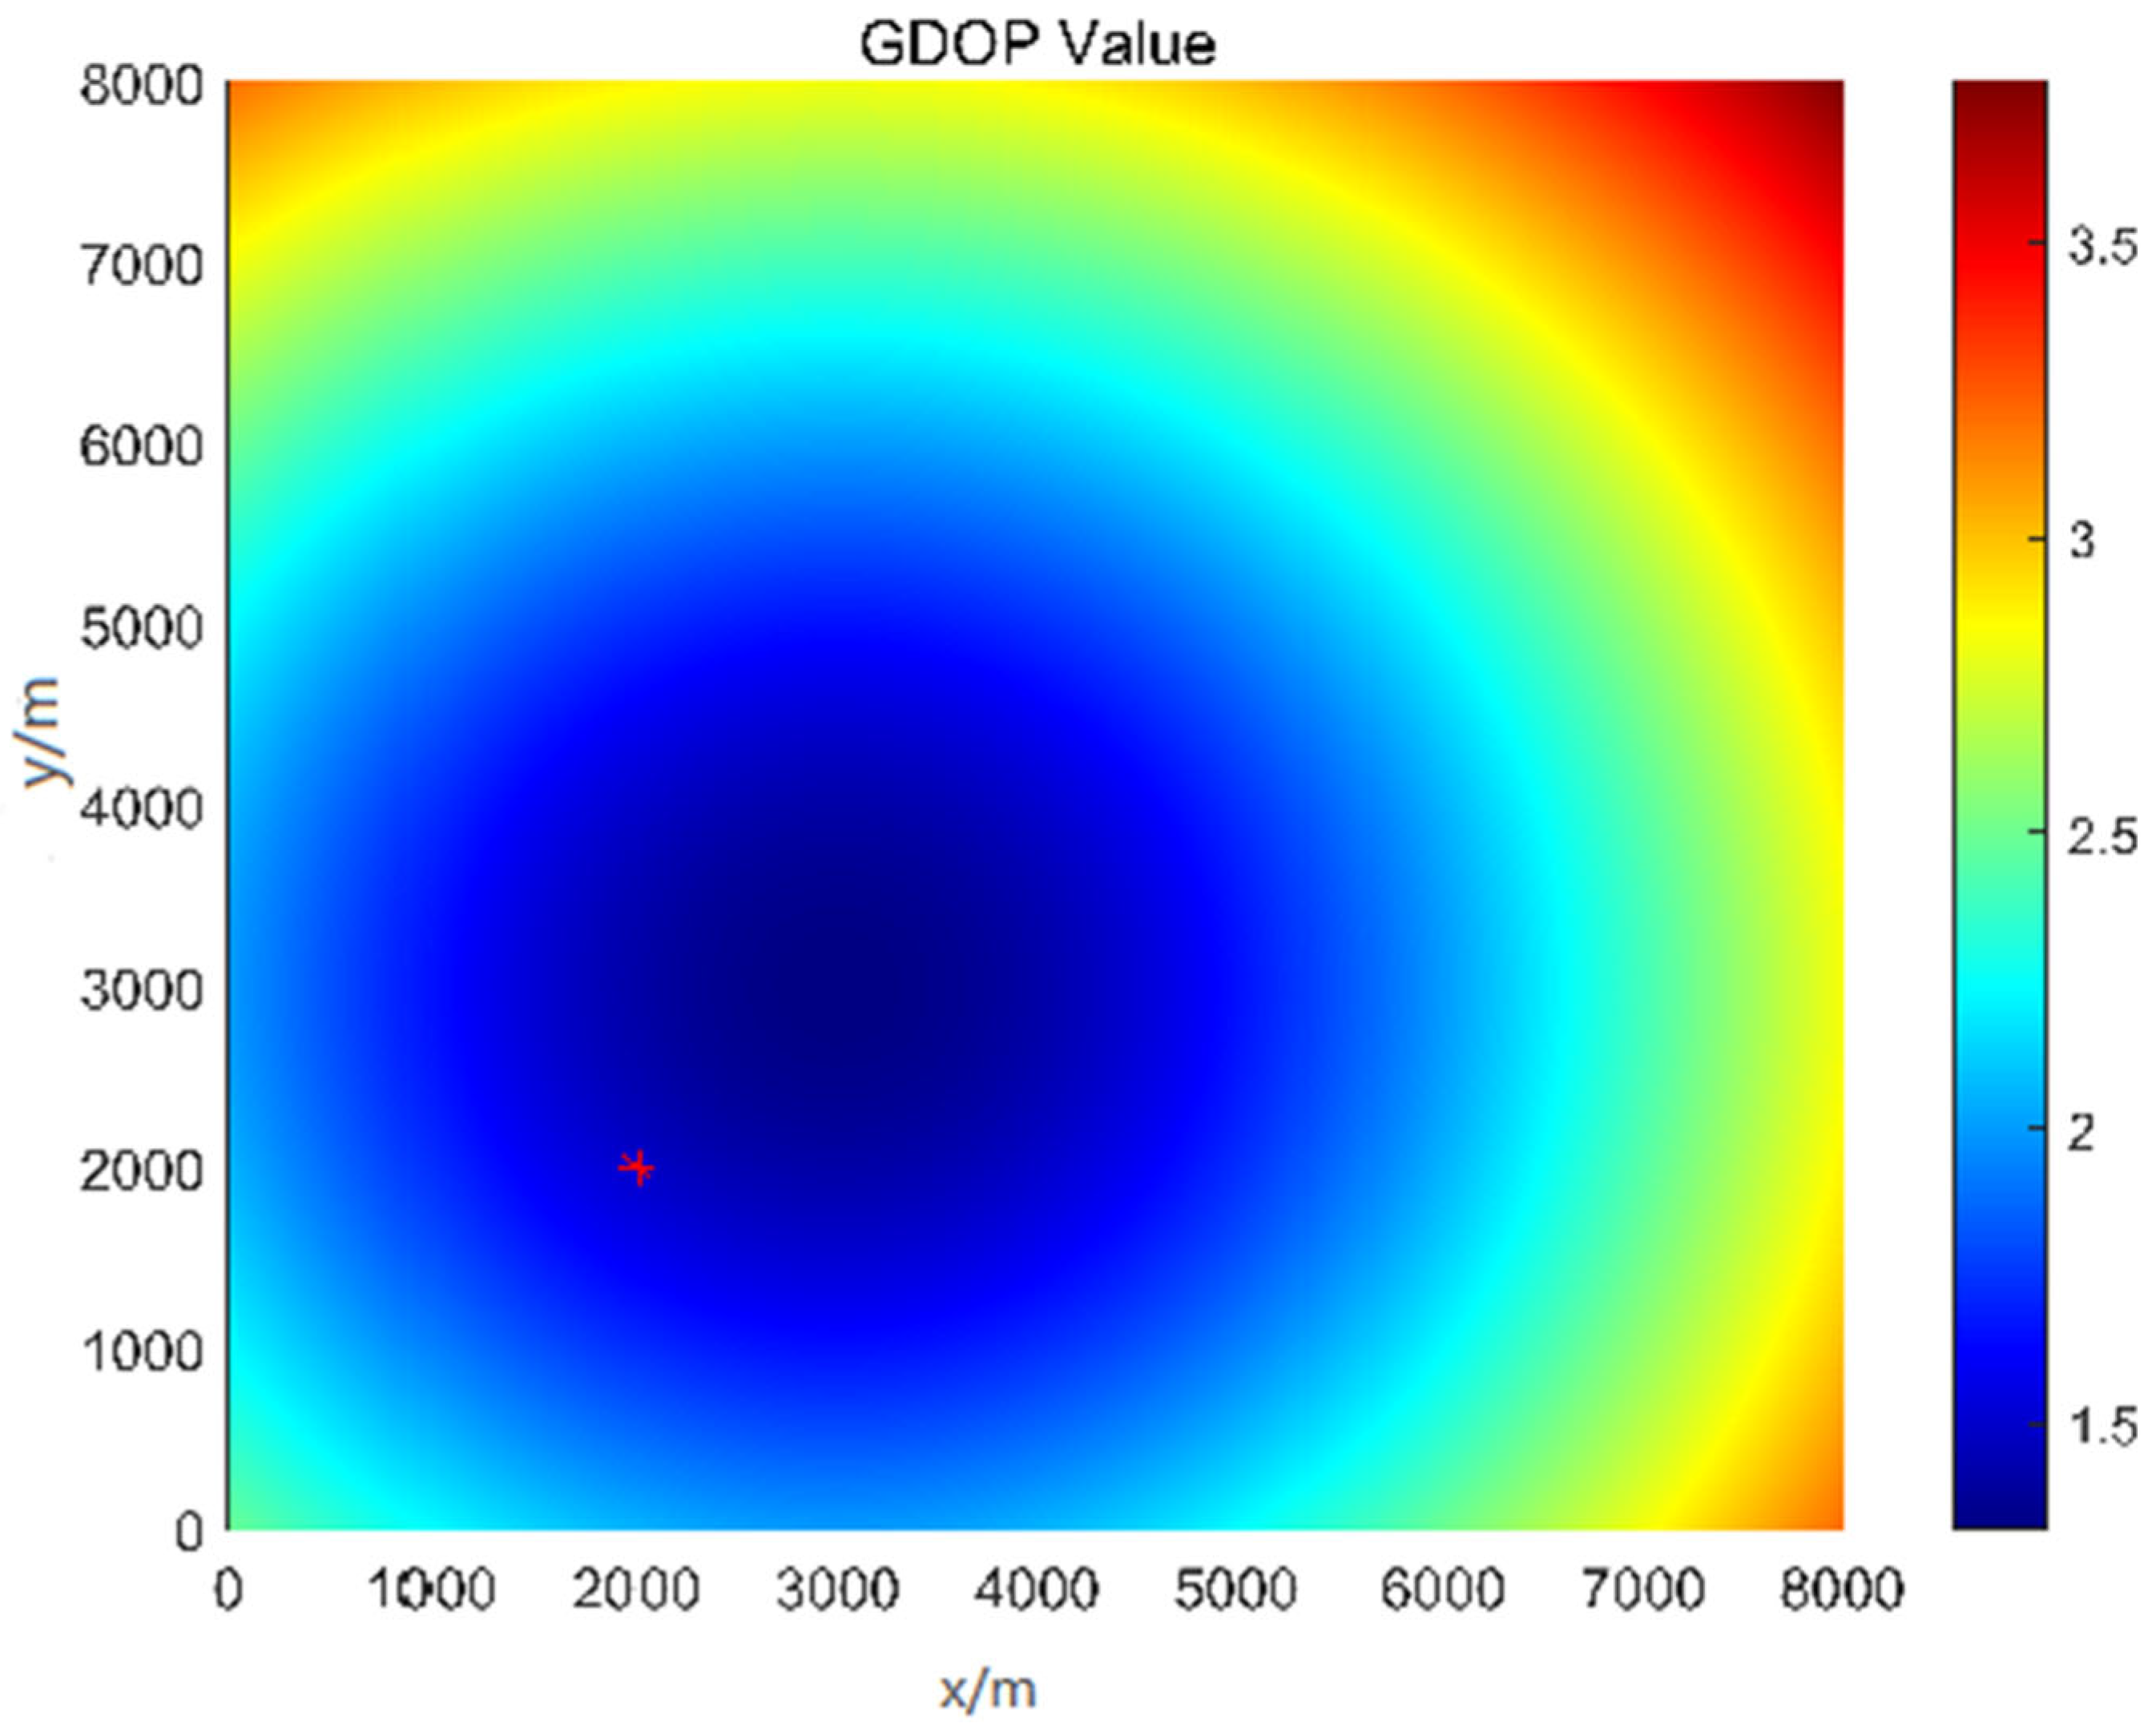
is the FIM constructed from the phase difference sensitivity matrix of the antenna array, and tr denotes the trace of the matrix. The sensitivity matrix elements are derived from the partial derivatives of phase differences with respect to the target coordinates (x,y,z). The GDOP distribution in the target detection space is simulated using MATLAB 2024b, as shown in
Figure 3.
As shown in
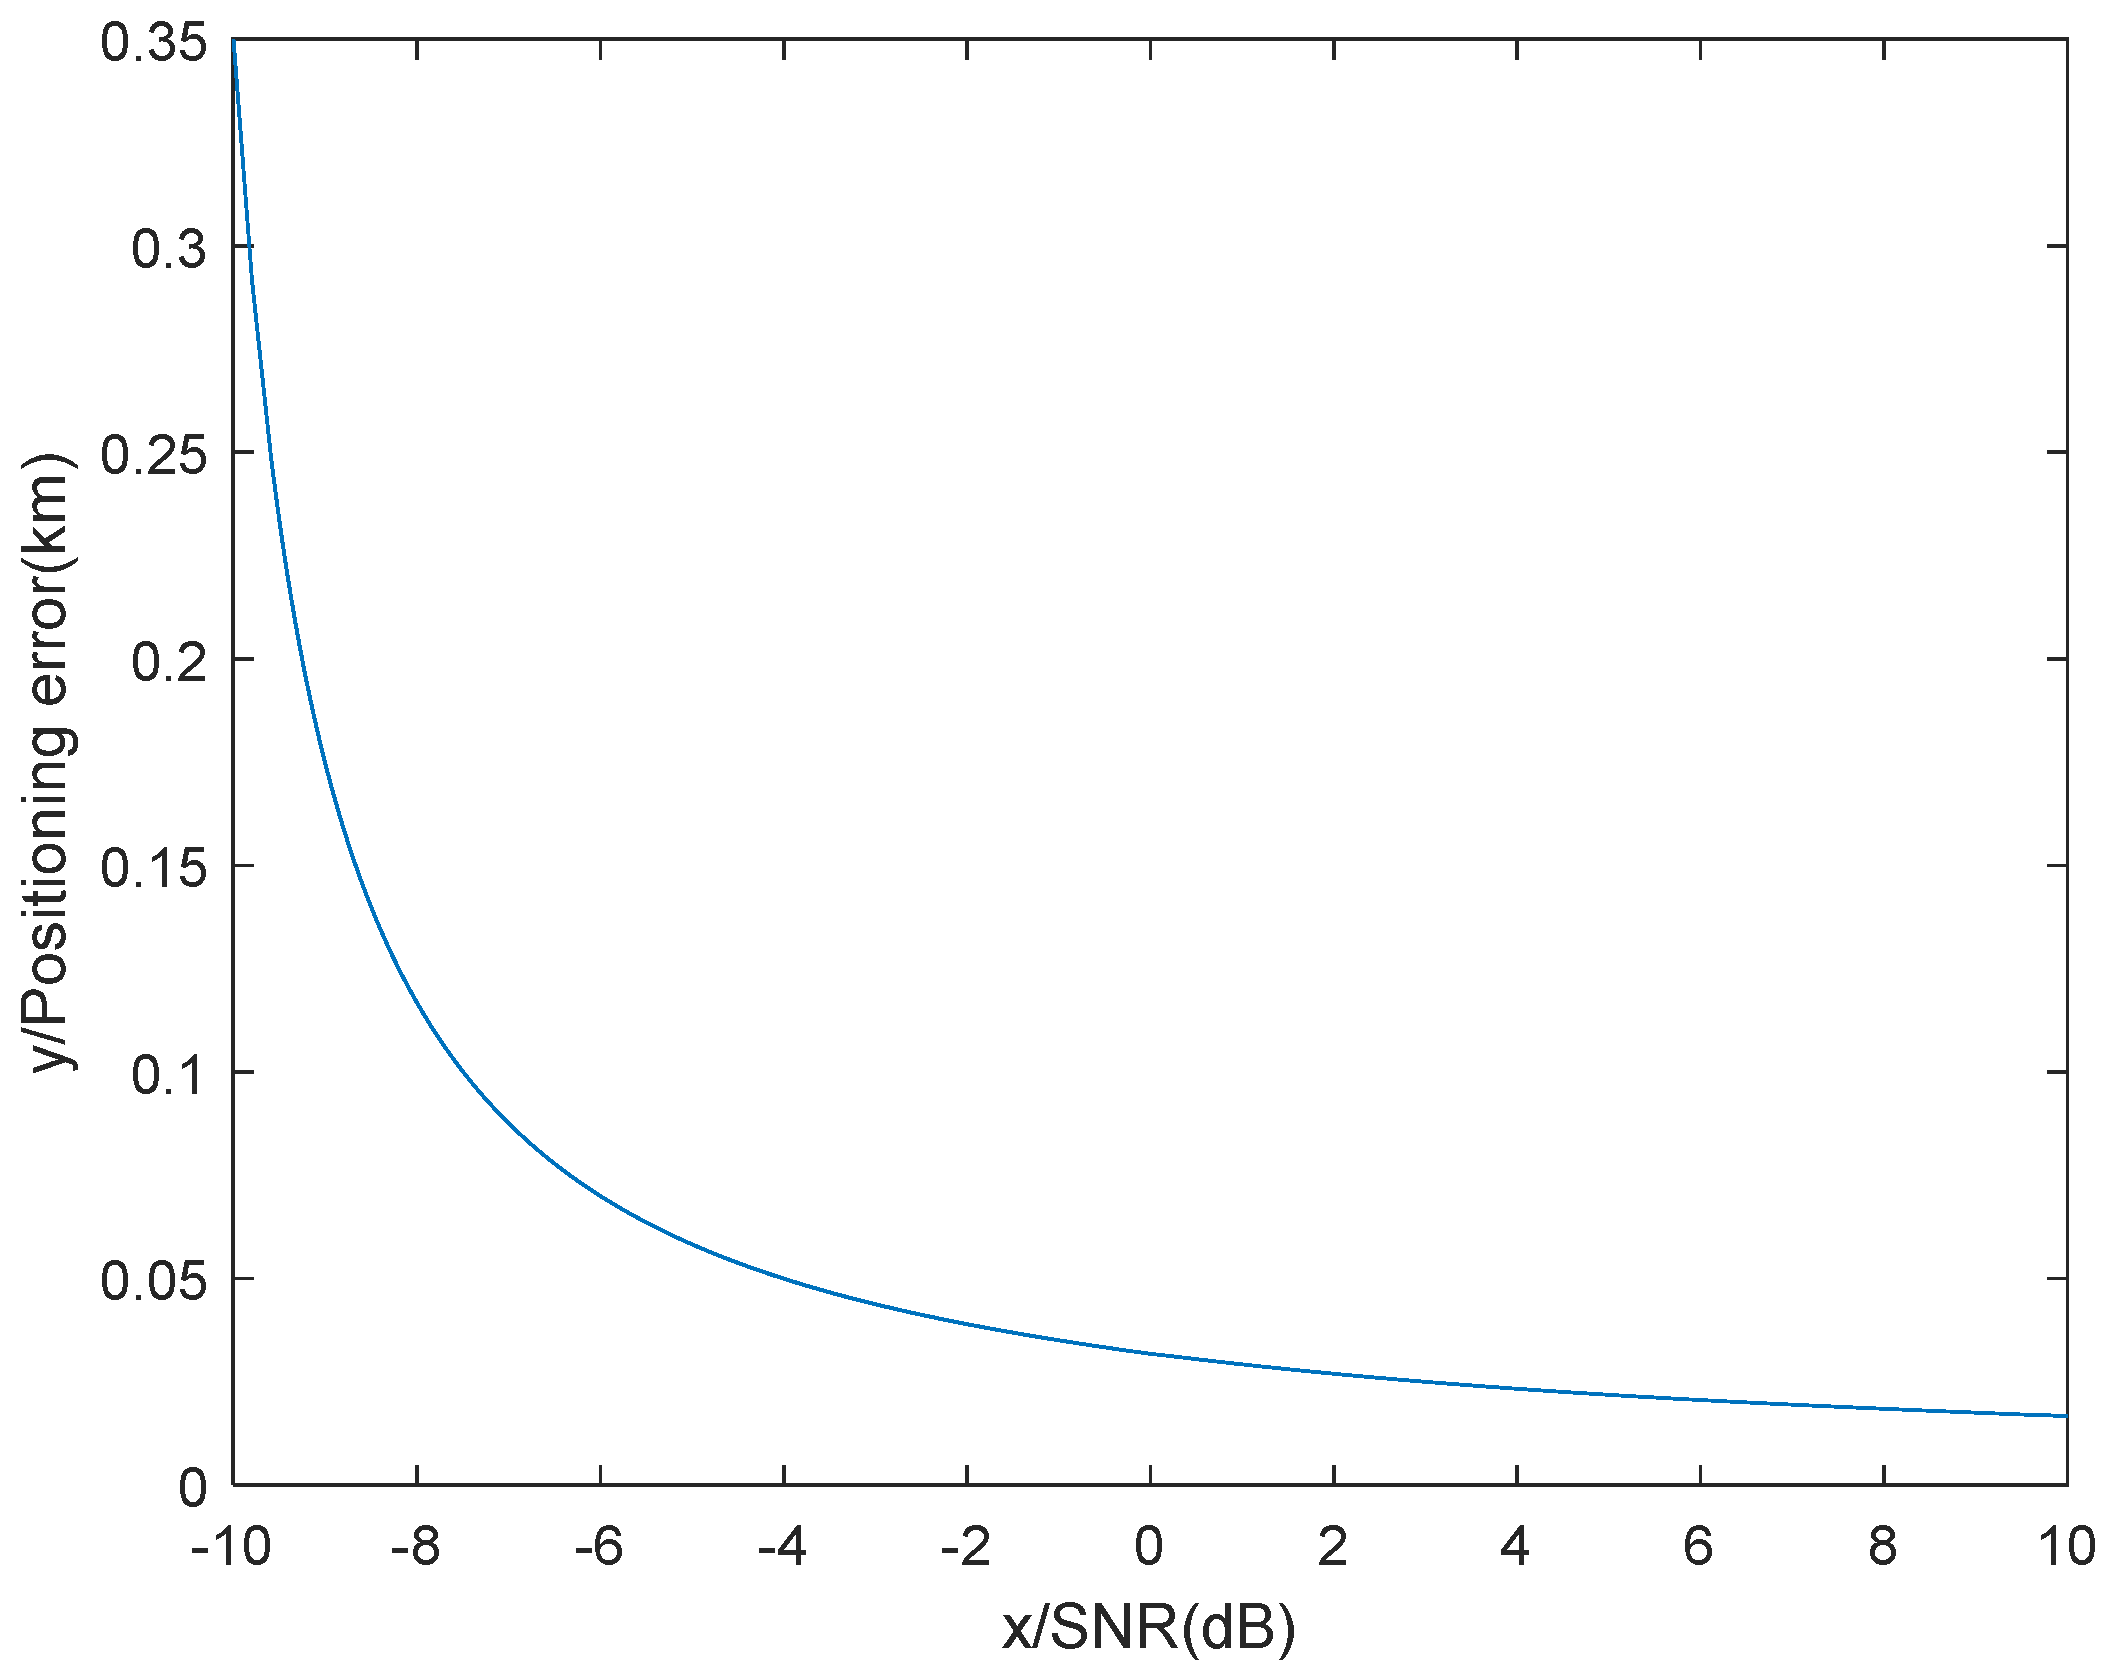
Figure 3, the GDOP values in the main detection area are between 1.2~2.5, which is within the “good” range for short-baseline arrays. This result confirms that the L-shaped short-baseline array used in this study has reasonable geometric positioning performance, laying a foundation for the subsequent ≤ 0.38 km localization accuracy. The theoretical Cramér–Rao bound is presented in
Figure 4 to prove attainable ≤ 0.38 km error is not simply a sampling artifact.
2.3. Removal of Ground Wave and Aircraft Echoes
In this experiment, the VHF (Very High Frequency) radar continuously receives echo signals from specific echo layers. Some of these echo signals persist for extended periods but do not meet the lightning echo screening criteria described later in this paper. Therefore, we chose to exclude echo signals below 3 km in subsequent lightning localization work.
Furthermore, the VHF radar is susceptible to interference from electromagnetic signals generated by aircraft passing through clouds [
16]. To address this issue, we excluded signals within the same echo layer that have an intensity greater than 15 dB and a duration exceeding 0.5 s. This effectively reduces interference from aircraft signals on lightning localization during cloud penetration.
2.4. Identification of Active Lightning Echoes
By analyzing the entire process of lightning occurrence, it can be observed that the signals received by the radar consist of two components [
17,
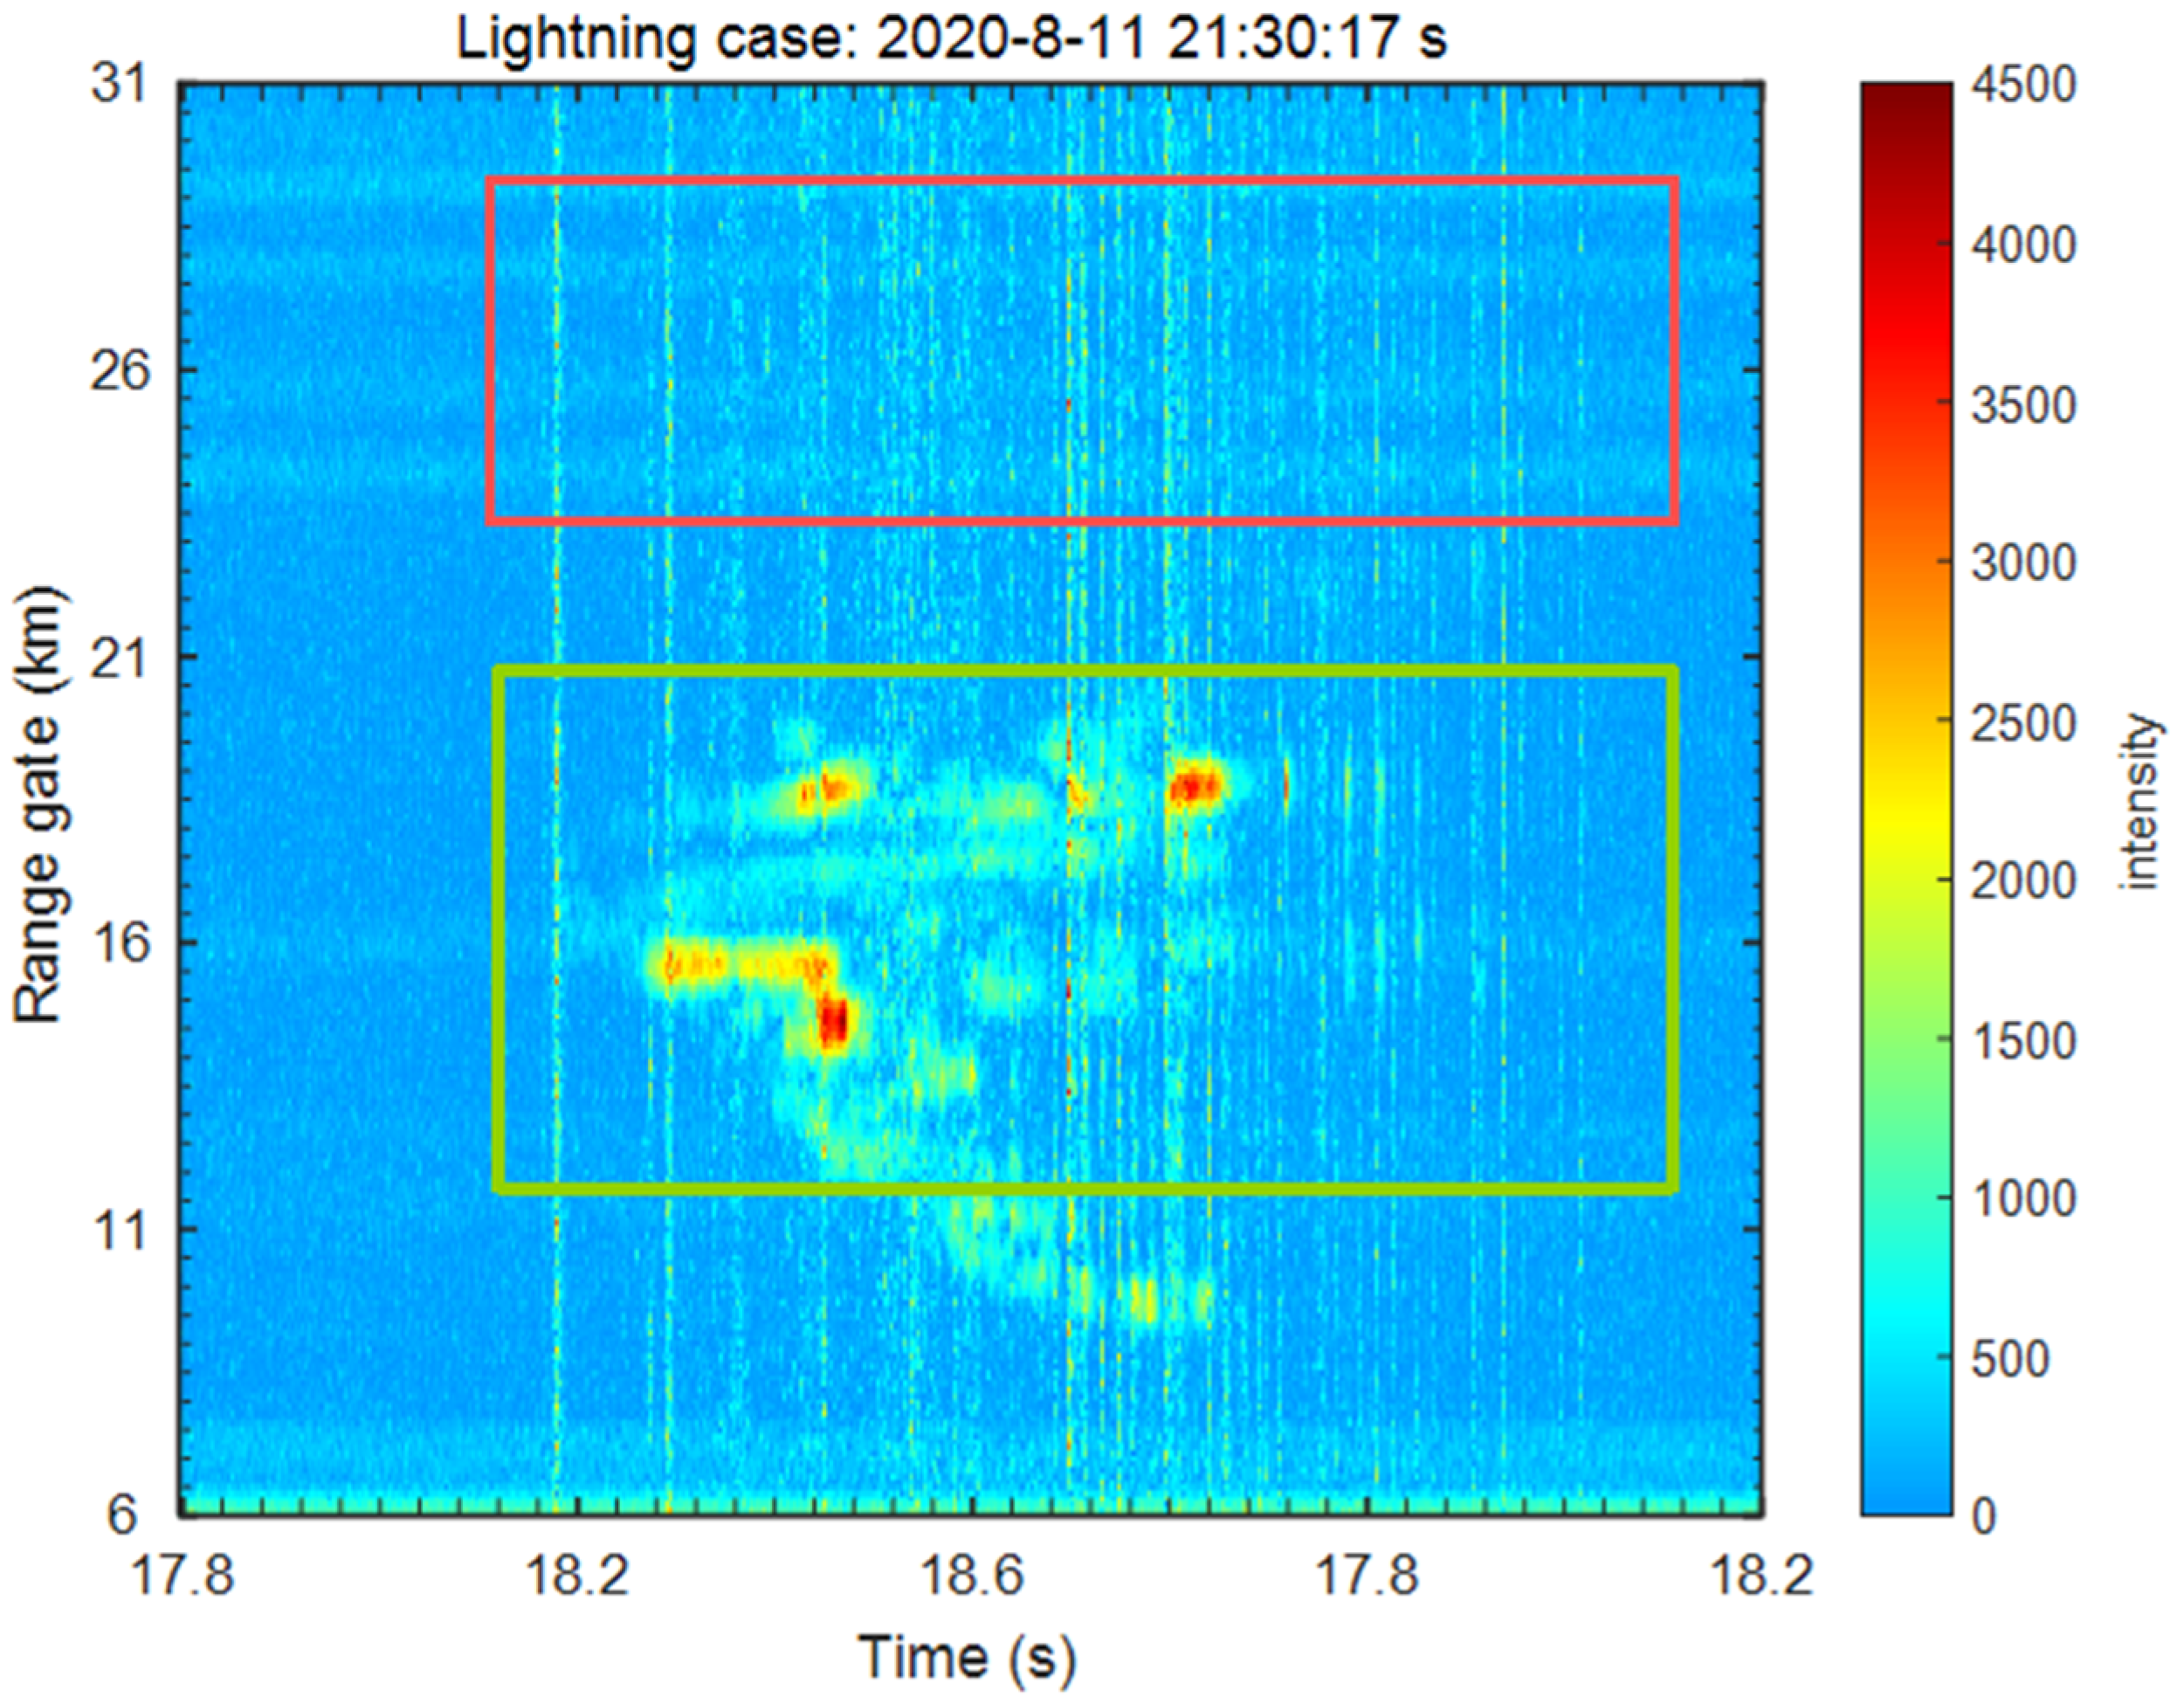
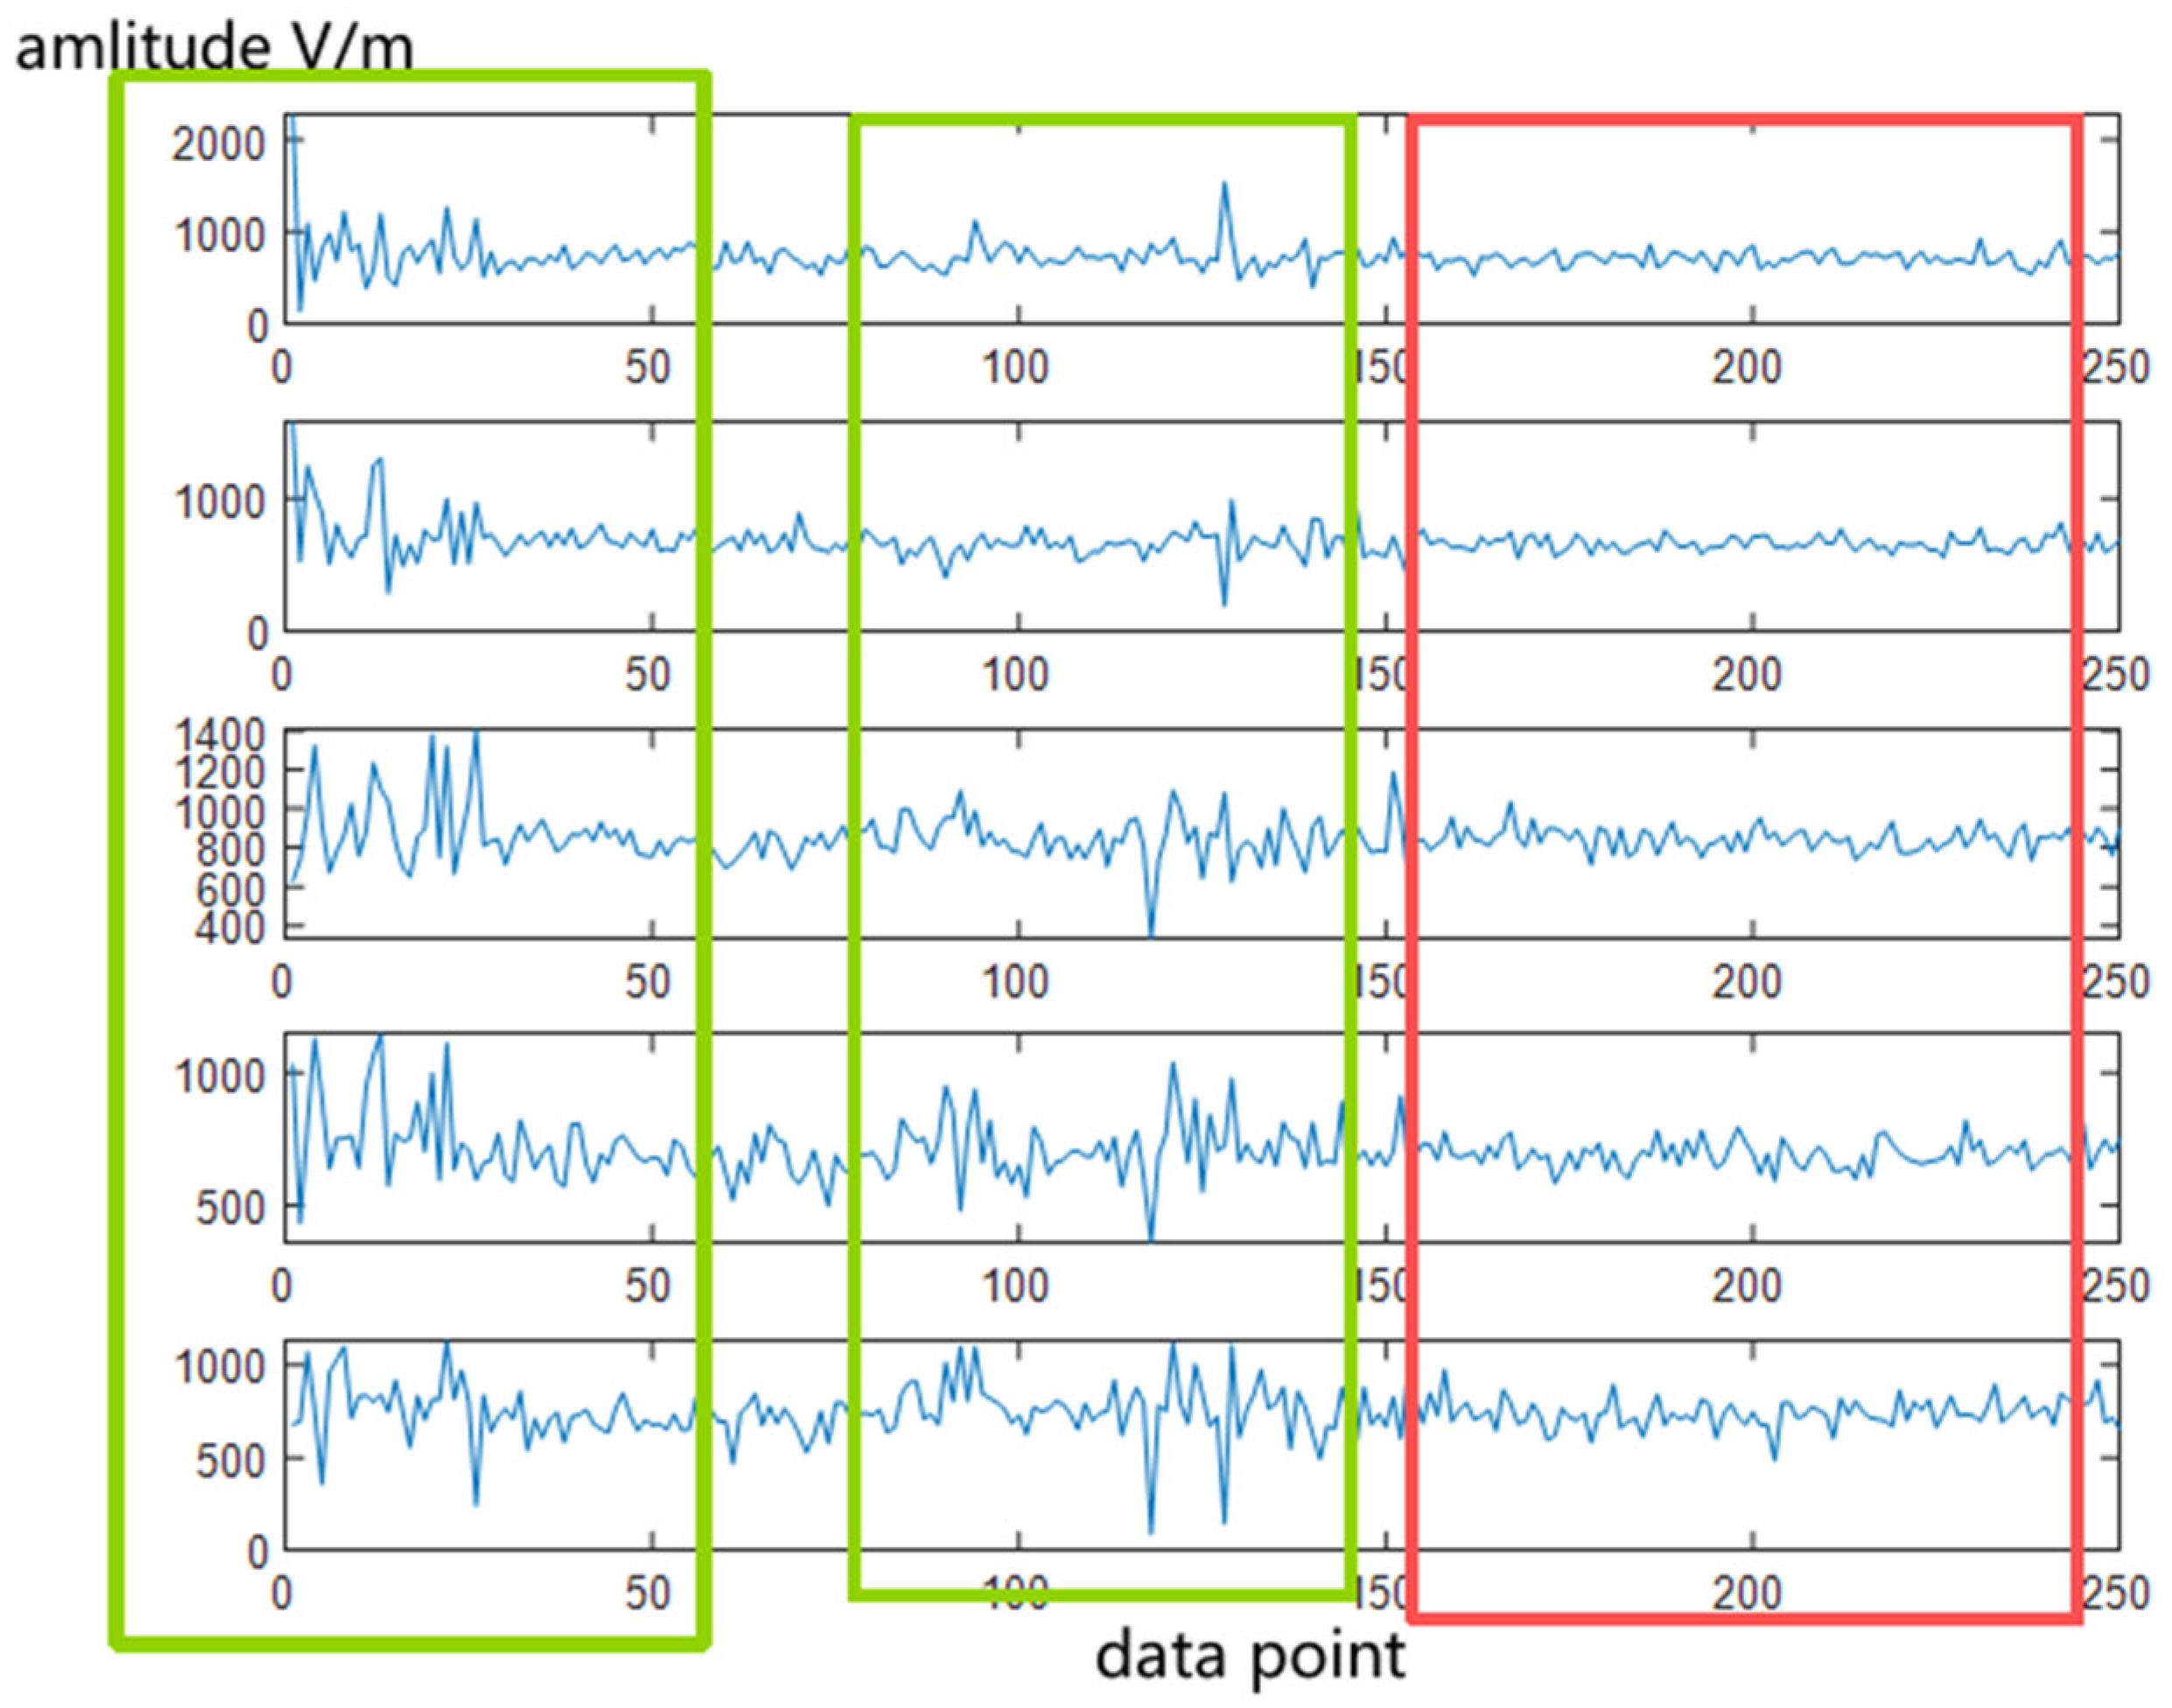
18]: one is the passive signal generated by the leader tip breakdown process, and the other is the active signal generated by the backscattering of the lightning plasma channel. The passive signal is characterized by clusters of pulses that span all range gates and persist for several milliseconds in the Range-Time-Intensity (RTI) plot [
9], as highlighted by the red box in
Figure 3. In the RTI plot, this appears as a “bright line” that spans all range gates. Specifically, for a specific range gate on the RTI plot, the received pulse waveform resembles the signal enclosed in the red box in
Figure 4.
The radar signals from plasma channel backscattering—i.e., active lightning echo signals—appear as several continuously distributed red or yellow regions in the 2D Range-Time-Intensity (RTI) plot, where color corresponds to echo intensity. This is illustrated by the signals in the green box of
Figure 5.
When focusing on a specific range gate in the RTI plot, the active lightning echo signals are characterized by a rapid rise in signal amplitude above the background noise, followed by a persistence of several hundred milliseconds. This is shown by the signals in the green box of
Figure 6.
The specific steps to determine the occurrence timing of passive signals are as follows: First, apply a 5-point moving average to the I/Q signals [
15]. Next, perform a statistical analysis of the background noise intensity in the RTI plot to establish the threshold for passive signals. This threshold is set to the mean value of the noise’s Gaussian distribution plus three times its standard deviation. For the echo intensity matrix corresponding to the radar echo RTI plot, if the average value of a specific column exceeds the previously established threshold, the time corresponding to that column is regarded as the start of the passive signal. Conversely, if the average value remains below this threshold for 30 consecutive time sequences (approximately 0.08 s), the passive signal is considered to have ended [
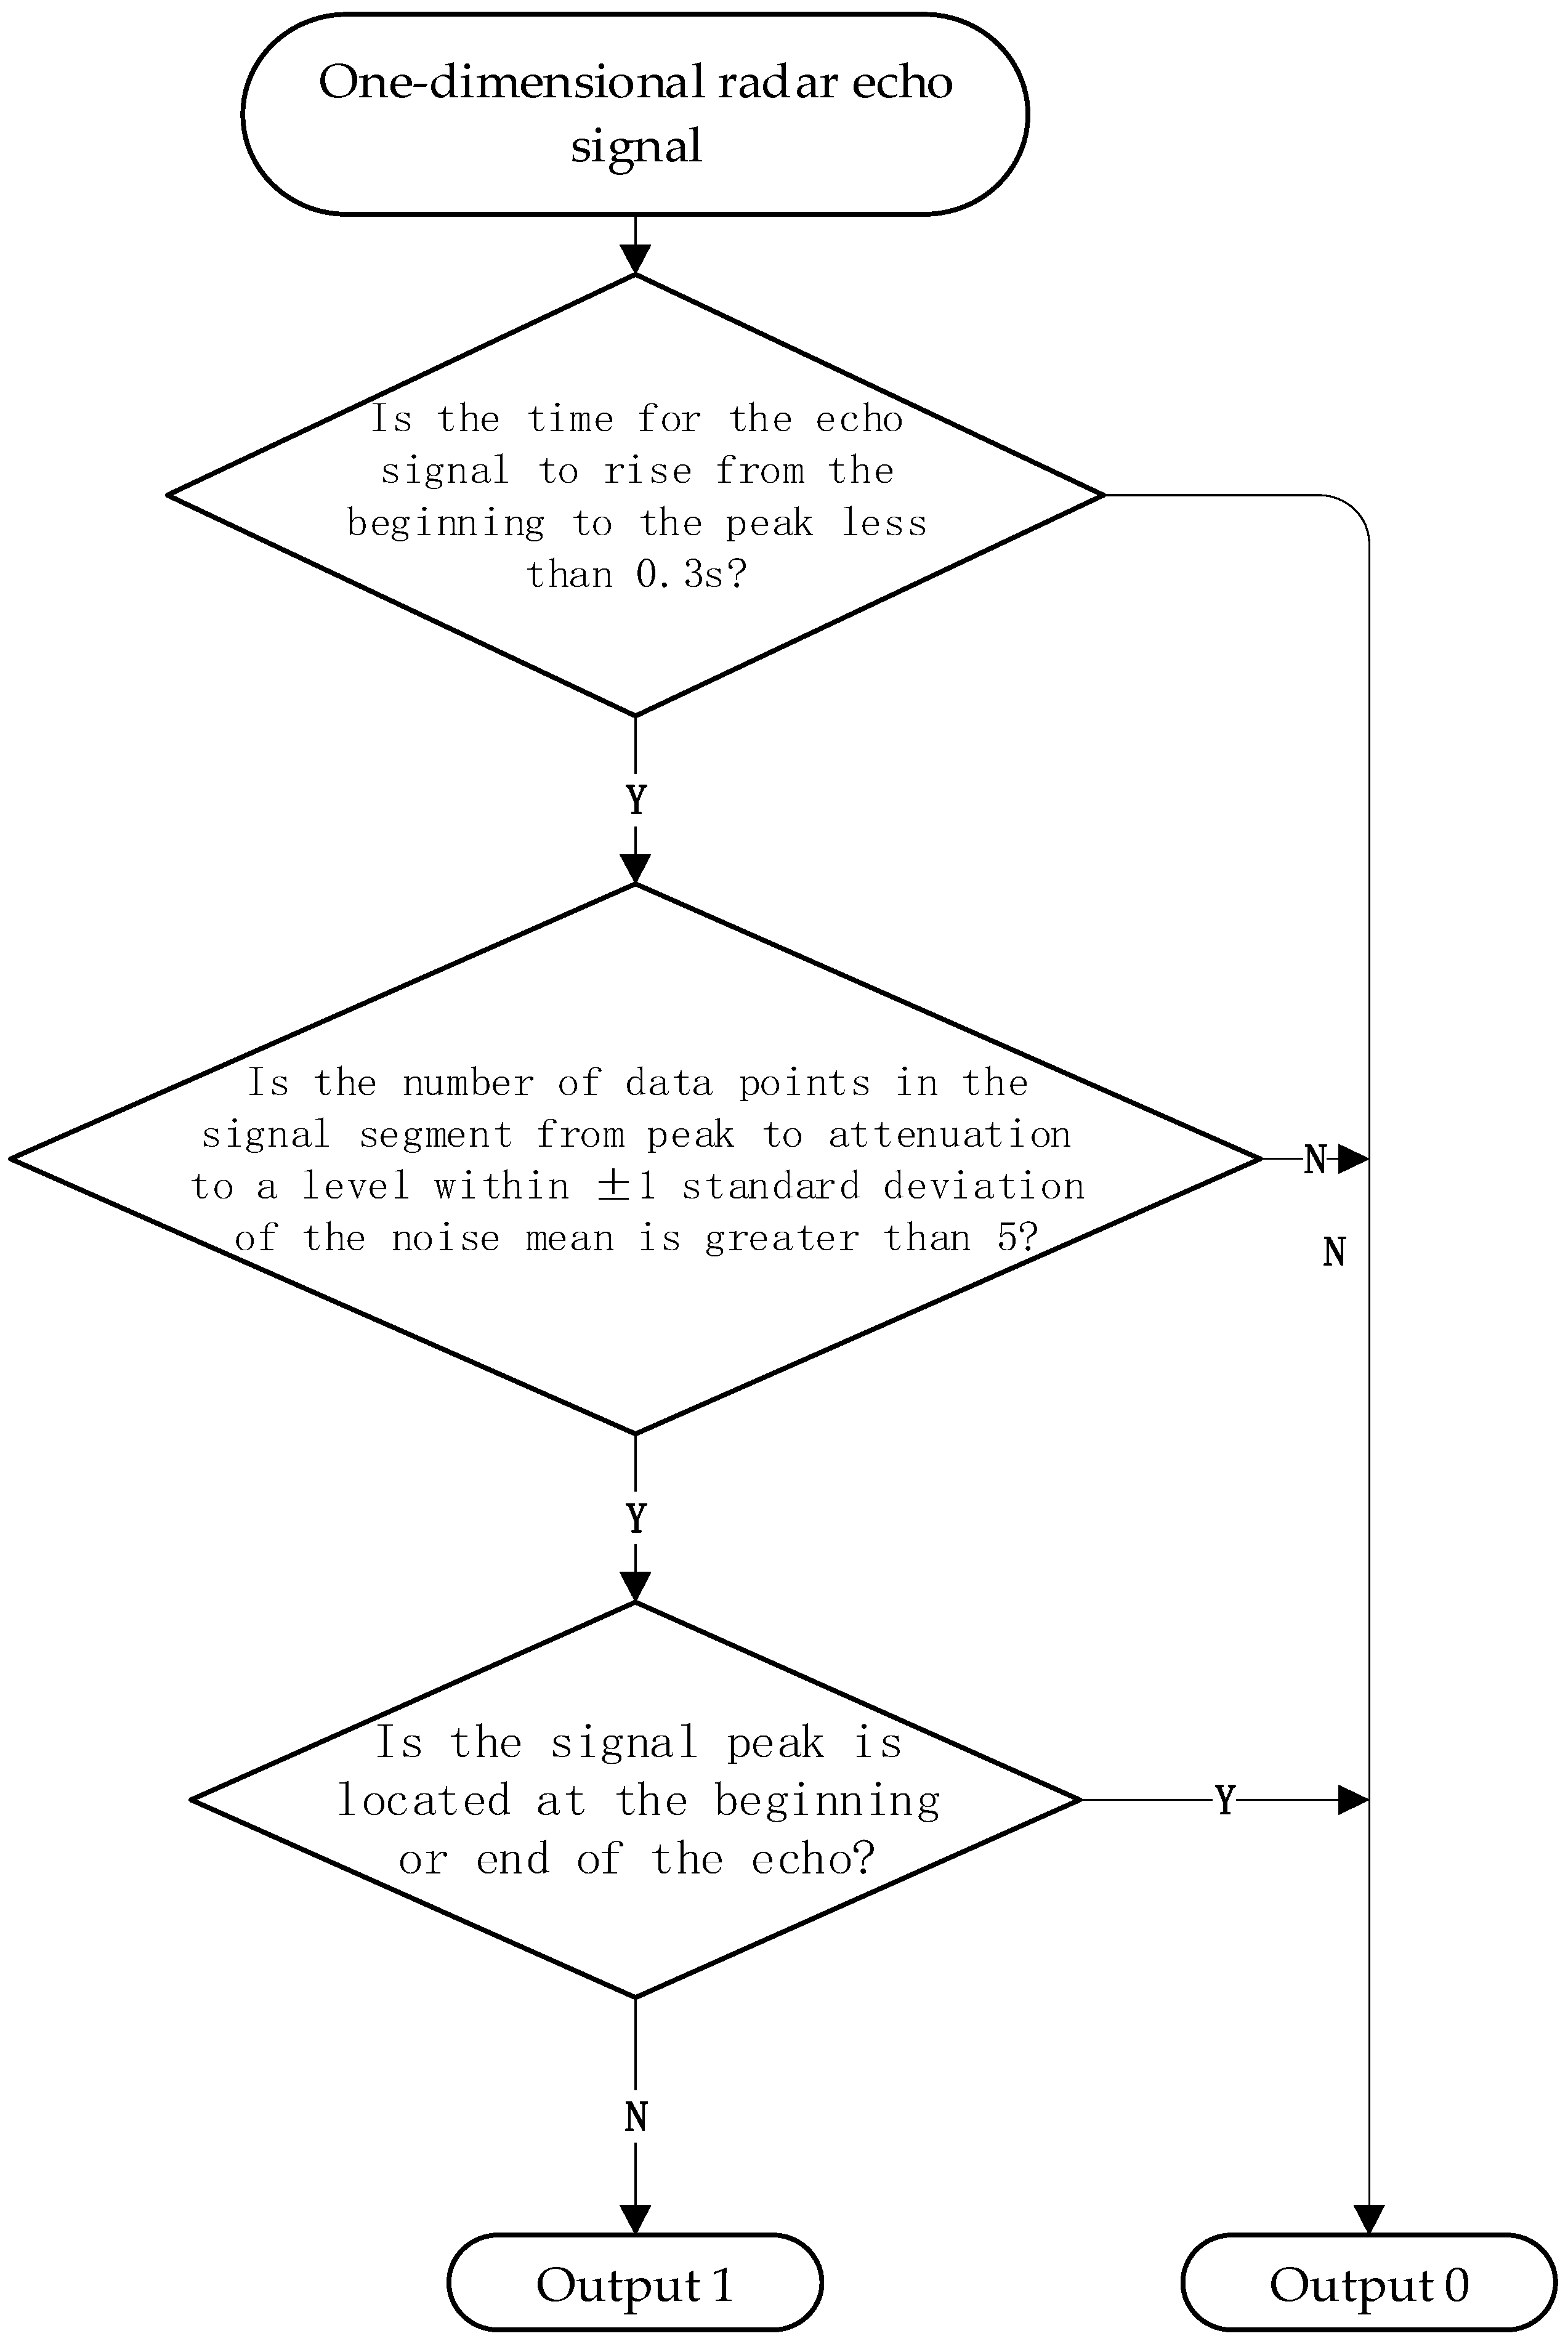
5]. A one-dimensional time-domain signal—received by a specific antenna channel at a particular range gate, starting from the suspected lightning occurrence time and lasting for one second—undergoes the screening process illustrated in
Figure 7 to determine whether it can be classified as a valid lightning signal for subsequent localization work.
2.5. Algorithm Principle
To simplify modeling and align with real experimental scenarios, we assume the lightning radiation source is a transient pulse source. Its radiated signal satisfies the Helmholtz wave equation, and the propagation medium (atmosphere, clouds, and rain) is a linear time-invariant (LTI) system. The positions of the multi-antenna array (the “L”-shaped configuration of the Leshan radar) are known, and the signals received by all antennas are synchronized (with no time deviation). Distortions such as attenuation and dispersion during signal propagation are determined solely by the propagation medium (independent of antenna hardware), and the medium properties are symmetric for forward and backward propagation.
The Lightning Electromagnetic Pulse (LEMP) signal generated by the lightning radiation source
undergoes attenuation and delay due to the medium during forward propagation, and is eventually received by the m-th antenna. According to the convolution property of LTI systems, the time-domain electric field signal received by the antenna can be expressed as [
8,
9,
10]:
where s(t) is the original electromagnetic pulse signal of the radiation source, ∗ denotes the time-domain convolution operation, and
(t) denotes the additive noise (e.g., thermal noise, electromagnetic interference) of the m-th antenna.
To simplify the mathematical expression of the time reversal operation, the time-domain signal can be converted to the frequency domain via Fourier Transform (FT). Taking the Fourier Transform of both sides of Equation (2) and utilizing the time-shifting property of the Fourier Transform, we obtain:
where τ denotes the time delay in the time domain. By applying “time-axis reversal” to the filtered time-domain received signal—i.e., replacing the time variable t with −t—we obtain the time-domain expression of the backward excitation signal:
Taking the complex conjugate of the frequency-domain received signal in Equation (2) is equivalent to achieving time-domain time reversal, yielding Equation (5).
Taking the complex conjugate of the frequency-domain received signal in Equation (3) is equivalent to achieving time-domain time reversal, yielding Equation (5). The time-reversed excitation signal is “backwardly transmitted” from each receiving antenna; the signal propagates through the medium toward the radiation source, eventually forming an energy focusing peak at
. By detecting the position of the maximum energy value, the coordinates of the lightning radiation source can be determined. Suppose an arbitrary point to be verified (x,y,z) is selected in the 3D detection space. The frequency-domain expression of the signal propagating backward from the m-th antenna to this point can be derived by analogy with Equation (3) for forward propagation—merely replacing the “radiation source-antenna” propagation relationship with the “antenna-point to be verified” relationship—resulting in Equation (6):
where k’ is the medium attenuation coefficient for backward propagation. Due to medium symmetry, k’ = k. The backward signals from all M antennas undergo coherent superposition at the point to be verified, and the total frequency-domain electric field intensity is the sum of contributions from each antenna:
The core criterion for EMTR localization is the maximization of energy density—which is proportional to the squared magnitude of the electric field intensity. Thus, the normalized energy density at the point to be verified can be defined as:
The three-dimensional coordinates of lightning radiation sources can be obtained by solving for the point of maximum energy density:
2.6. Preprocessing of Received Signals and Time Reversal
A prerequisite for lightning radiation source localization using the time reversal algorithm is obtaining high-quality original waveforms. This study first performs a filtering process on the forward-propagating waveforms generated in the previous section. The filter used in this step is an FIR (Finite Impulse Response) filter. The first reason for using this filter is that FIR filters possess strict linear phase characteristics, which means they do not introduce phase distortion after filtering. This allows them to fully preserve the transient waveforms and phase information of VHF signals—critical for time reversal. If phase distortion occurs, signals cannot be accurately superimposed at the radiation source during backward propagation, leading to blurred focusing. Furthermore, FIR filters can be designed with specific frequency responses (e.g., band-pass filtering) to precisely retain the target frequency band while suppressing out-of-band interference. Compared to IIR (Infinite Impulse Response) filters, FIR filters offer higher stability and do not introduce additional noise or oscillations through feedback loops. They are thus suitable for processing VHF signals at high sampling rates, ensuring the filtered signals meet the requirements of the EMTR localization algorithm. The forward-propagating time-domain complex signals obtained after the aforementioned preprocessing are converted via Fast Fourier Transform (FFT), then conjugated, and finally transformed back using Inverse Fast Fourier Transform (IFFT) to yield the time-reversed time-domain waveforms.
Another non-negligible limitation of the interferometric localization method (more precisely referred to as beamforming) lies in its limited ability to effectively capture low-energy radiation sources in specific scenarios, such as lightning branch channels. The main channel of a lightning plasma channel exhibits relatively high signal intensity, while the radiation signal energy of branch channels is only 10–30% of that of the main channel due to their small discharge current [
18]. Since the interferometric localization method typically relies on a “signal amplitude threshold screening” mechanism for noise reduction, weak signals from branch channels are prone to being misclassified as background noise and discarded—especially in complex terrains with strong environmental interference. In the mountainous observation scenario of this study, this characteristic results in misdetection of lightning branch channels. Ultimately, this leads to a high distortion rate in lightning channel reconstruction, failing to fully present the fine-grained dendritic structure inherent to lightning.
2.7. Generation of Preliminary Location Results
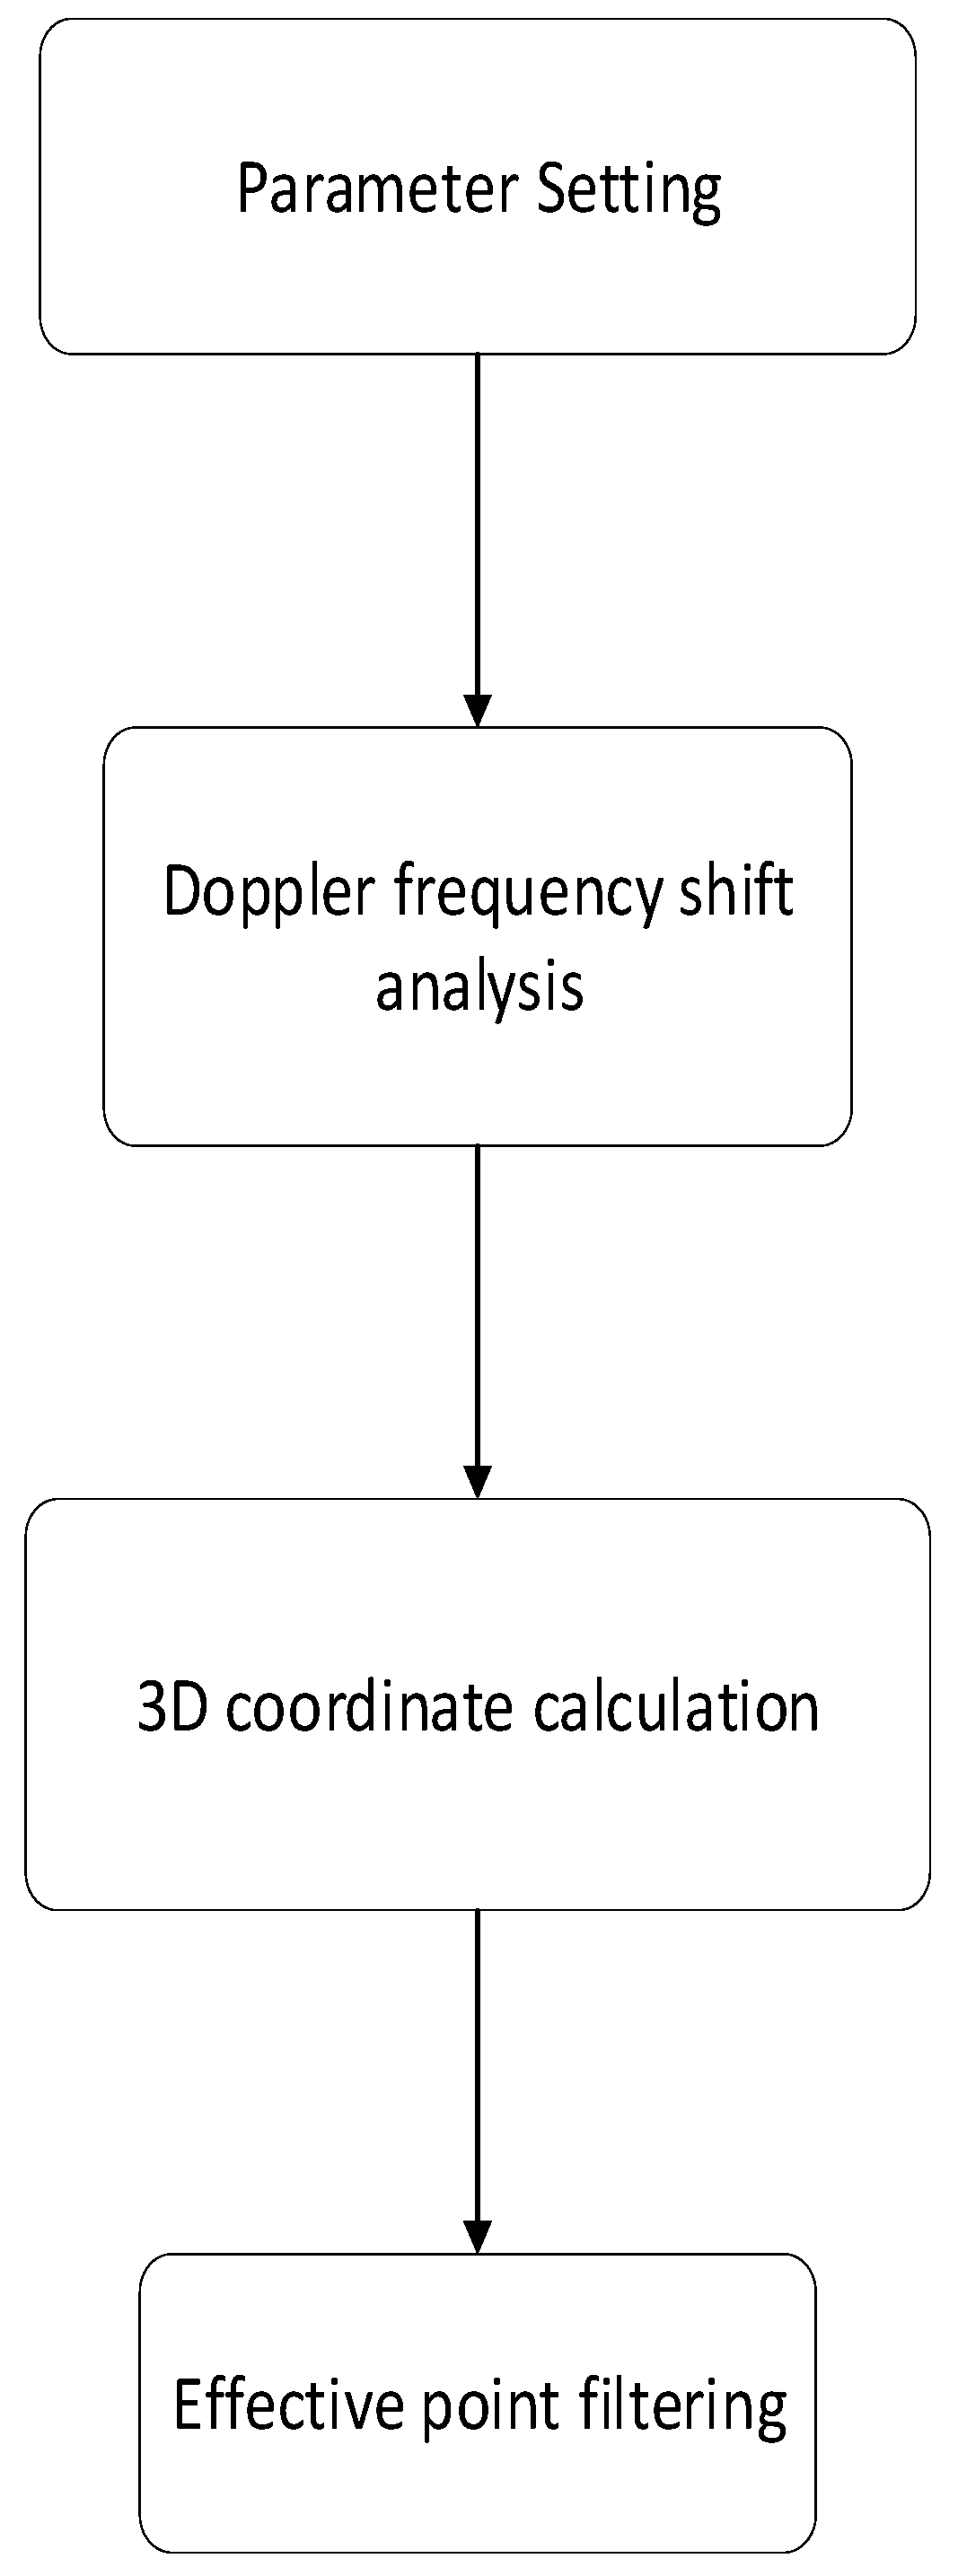
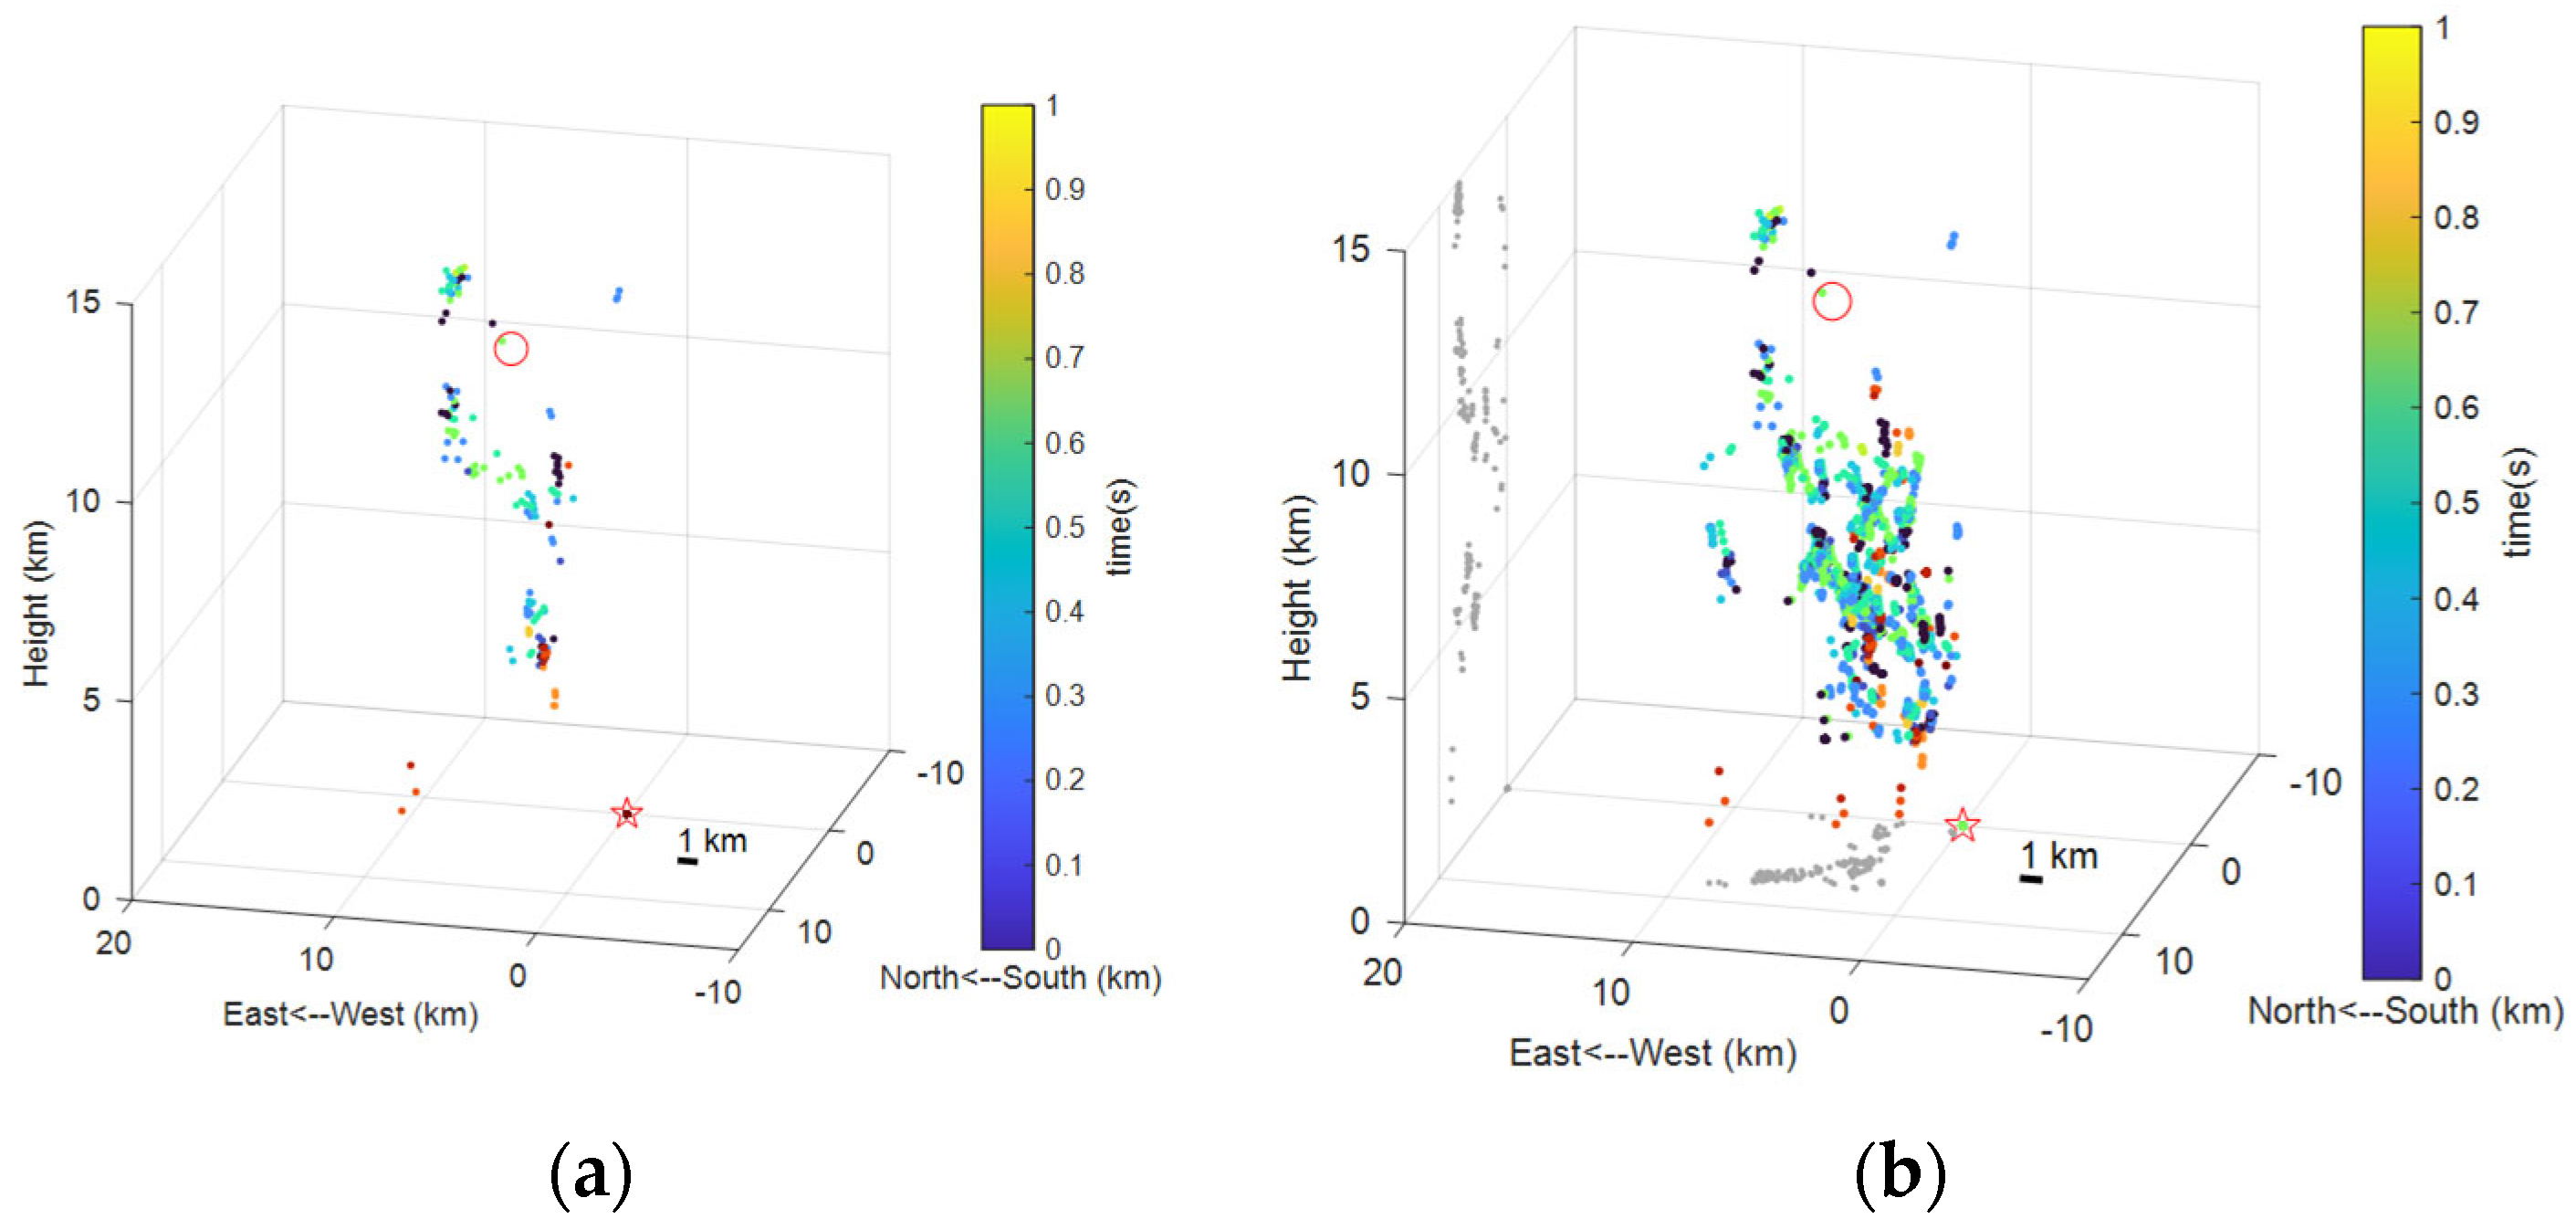
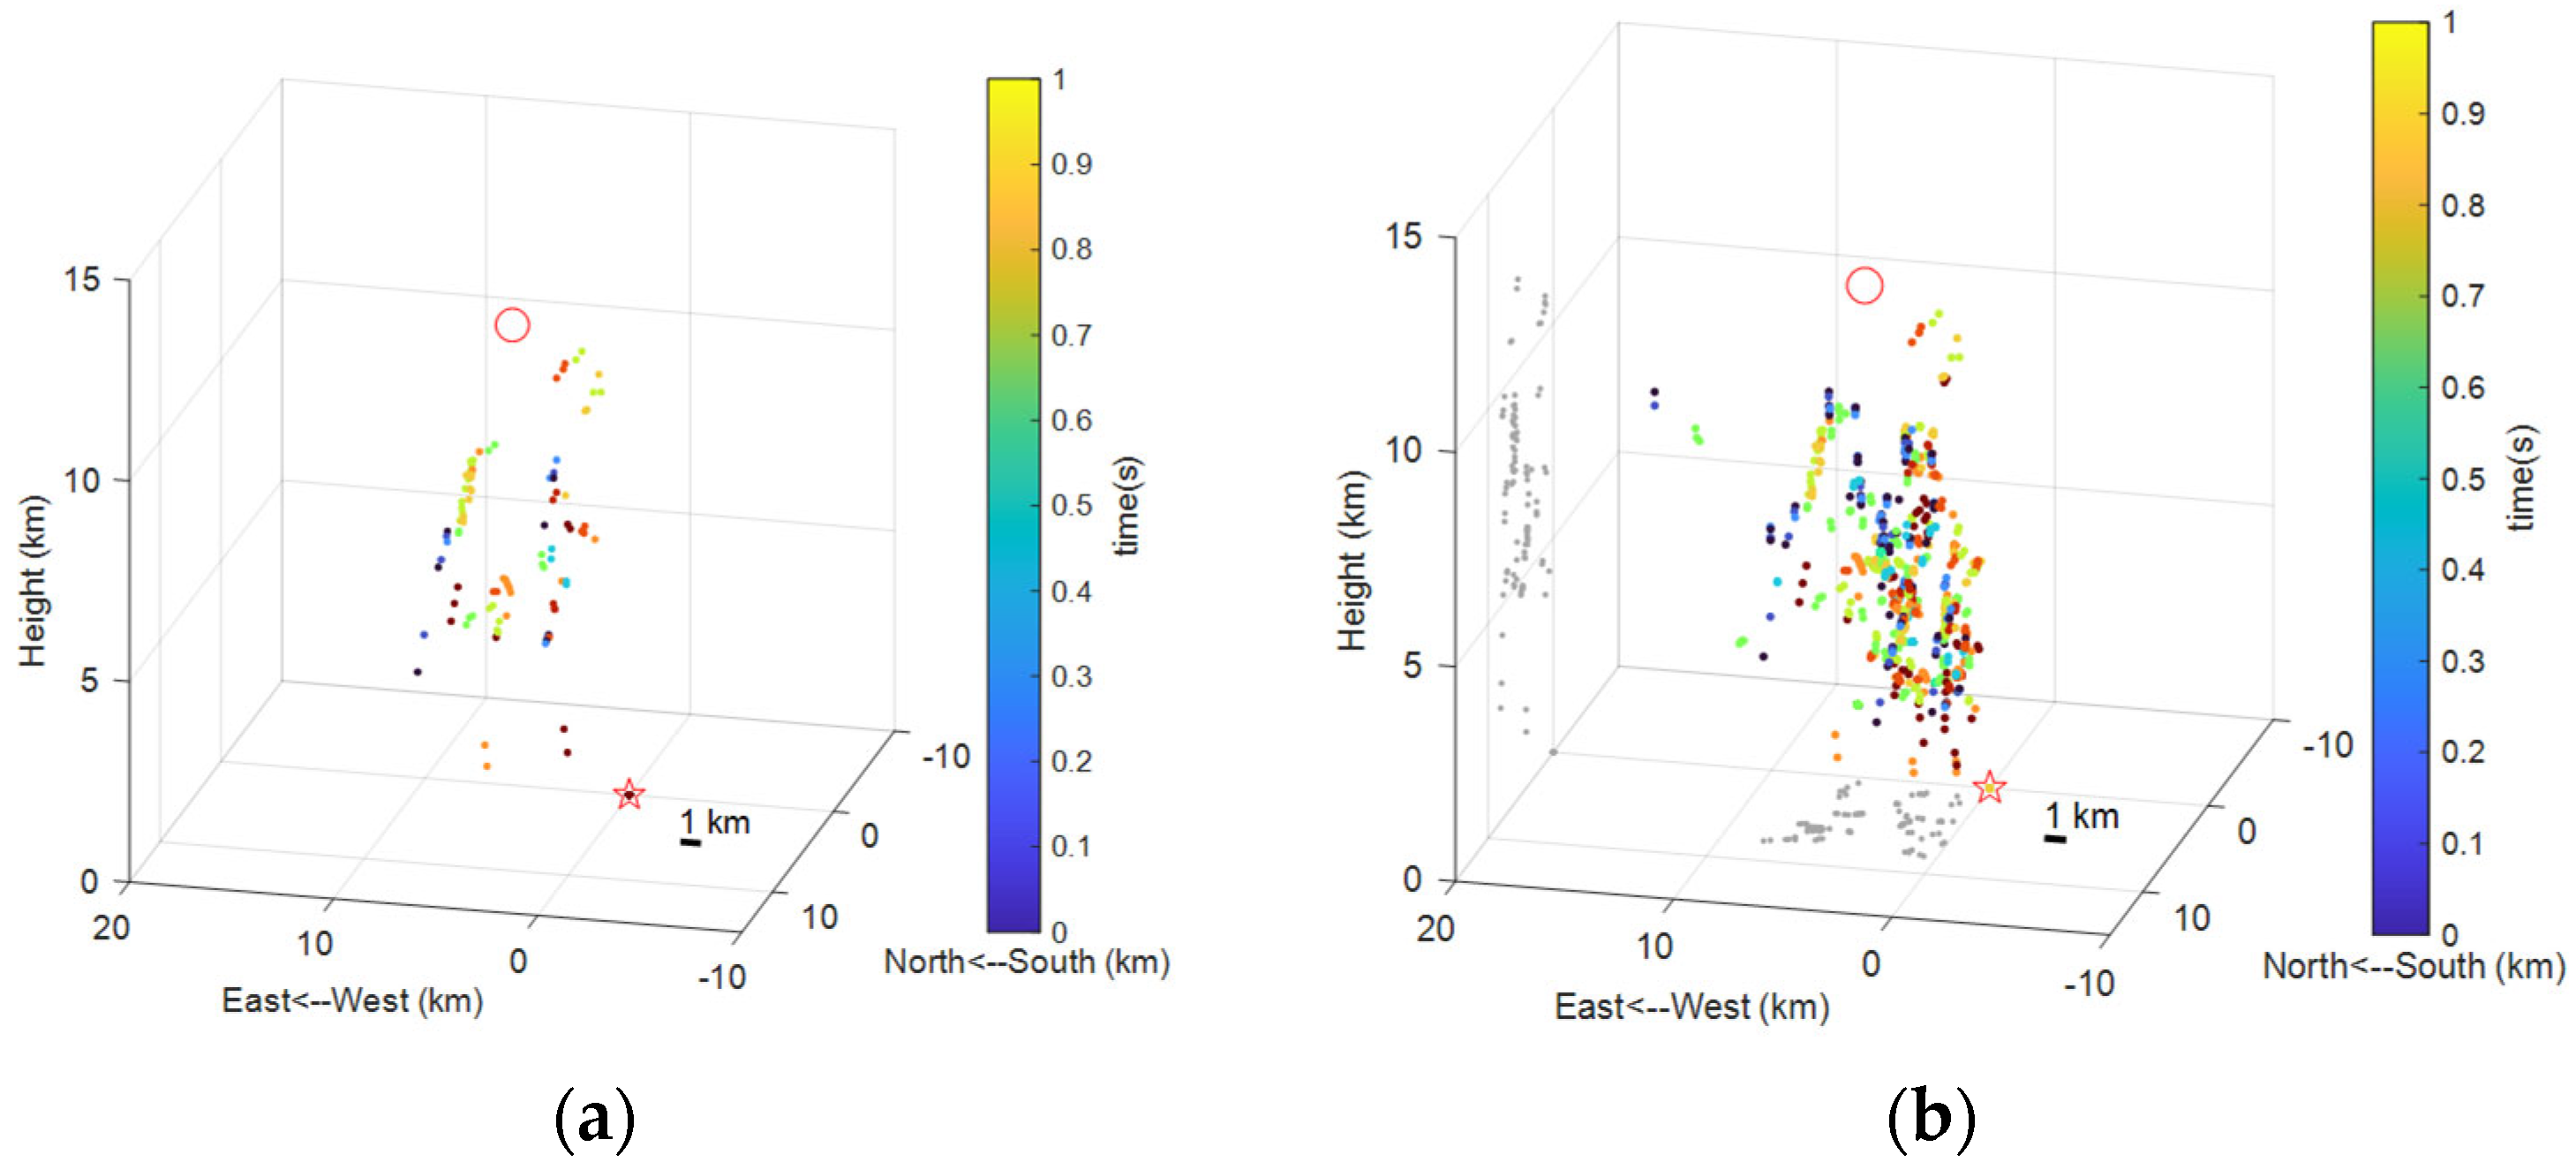
Given that the number of lightning radiation sources in this experiment is extremely large, however, traditional multi-radiation-source resolution methods are relatively difficult to implement under the hardware configuration of this experiment. Thus, we plan to first use the traditional, validated cross-correlation algorithm to generate preliminary localization results—specifically, using the traditional localization algorithm to obtain the number and approximate positions of radiation sources—before proceeding with subsequent localization work. In the preliminary localization work, this study adopts an interferometric localization method based on multi-channel radar signals. By analyzing the range, azimuth, and elevation angle information of lightning radiation sources, 3D coordinate calculation is achieved. The overall workflow of the algorithm includes time window segmentation, angle calculation, coordinate transformation, and radiation source pre-screening. The specific steps of the algorithm are as follows:
First, there is a key parameter that needs to be set: the number of time windows (Winnum). The setting of this parameter is mainly constrained by two factors: the duration and waveform characteristics of lightning signals, and computational efficiency. After comprehensively considering these two factors and conducting extensive experimental verification, the number of time windows in this experiment is set to Winnum = 12. To suppress noise interference, it is necessary to perform Doppler shift analysis on the multi-channel signals of each time window. The specific steps are as follows: First, extract the complex signal segments of the 5 channels within the current time window. Next, perform Fast Fourier Transform (FFT) on the signals of each channel, calculate the frequency spectrum, and extract the peak frequency to obtain the Doppler shift fd of each channel. Finally, calculate the standard deviation of the Doppler shifts across the 5 channels. If this standard deviation is greater than the empirical threshold of 5 Hz, the signals in this window are determined to be noise signals, and the current window is skipped; otherwise, proceed to subsequent processing.
After completing the Doppler shift analysis, it is necessary to extract and correct the phase differences between channels. The steps are as follows: First is cross-correlation analysis: with Channel 3 corresponding to the central antenna as the reference, calculate the cross-correlation functions between its received signals and those received by Channels 2, 1, 4, and 5, within a lag range of ±3 sampling points, to obtain four sets of cross-correlation sequences: cc12, cc13, cc14, and cc15. Second is phase extraction and ambiguity resolution: compute the ambiguity-containing argument of the cross-correlation sequences, and perform phase ambiguity resolution using a specific function to eliminate the periodic ambiguity of the phase. Third is linear fitting correction: perform linear fitting on the phase sequences after ambiguity resolution, calculate the phase value at zero lag (time synchronization point), and convert it to an angle to obtain the true phase differences between the four groups of channels [
5,
6,
7]. Once the true phase differences between channels are obtained, the azimuth of the radiation source can be resolved using the geometric relationship between phase differences, azimuth angle, and zenith angle. The distance between the radiation source and the central antenna is obtained via the radar’s built-in range gate. After acquiring the position information of the radiation source, valid points are screened through physical constraints—specifically, retaining points with a height below 20 km after height correction based on earth curvature—thus yielding the preliminary localization results.
The process of the above algorithm is shown in
Figure 8.
2.8. Modeling of Radiation Source Signals and Generation of Spatial Energy Fields
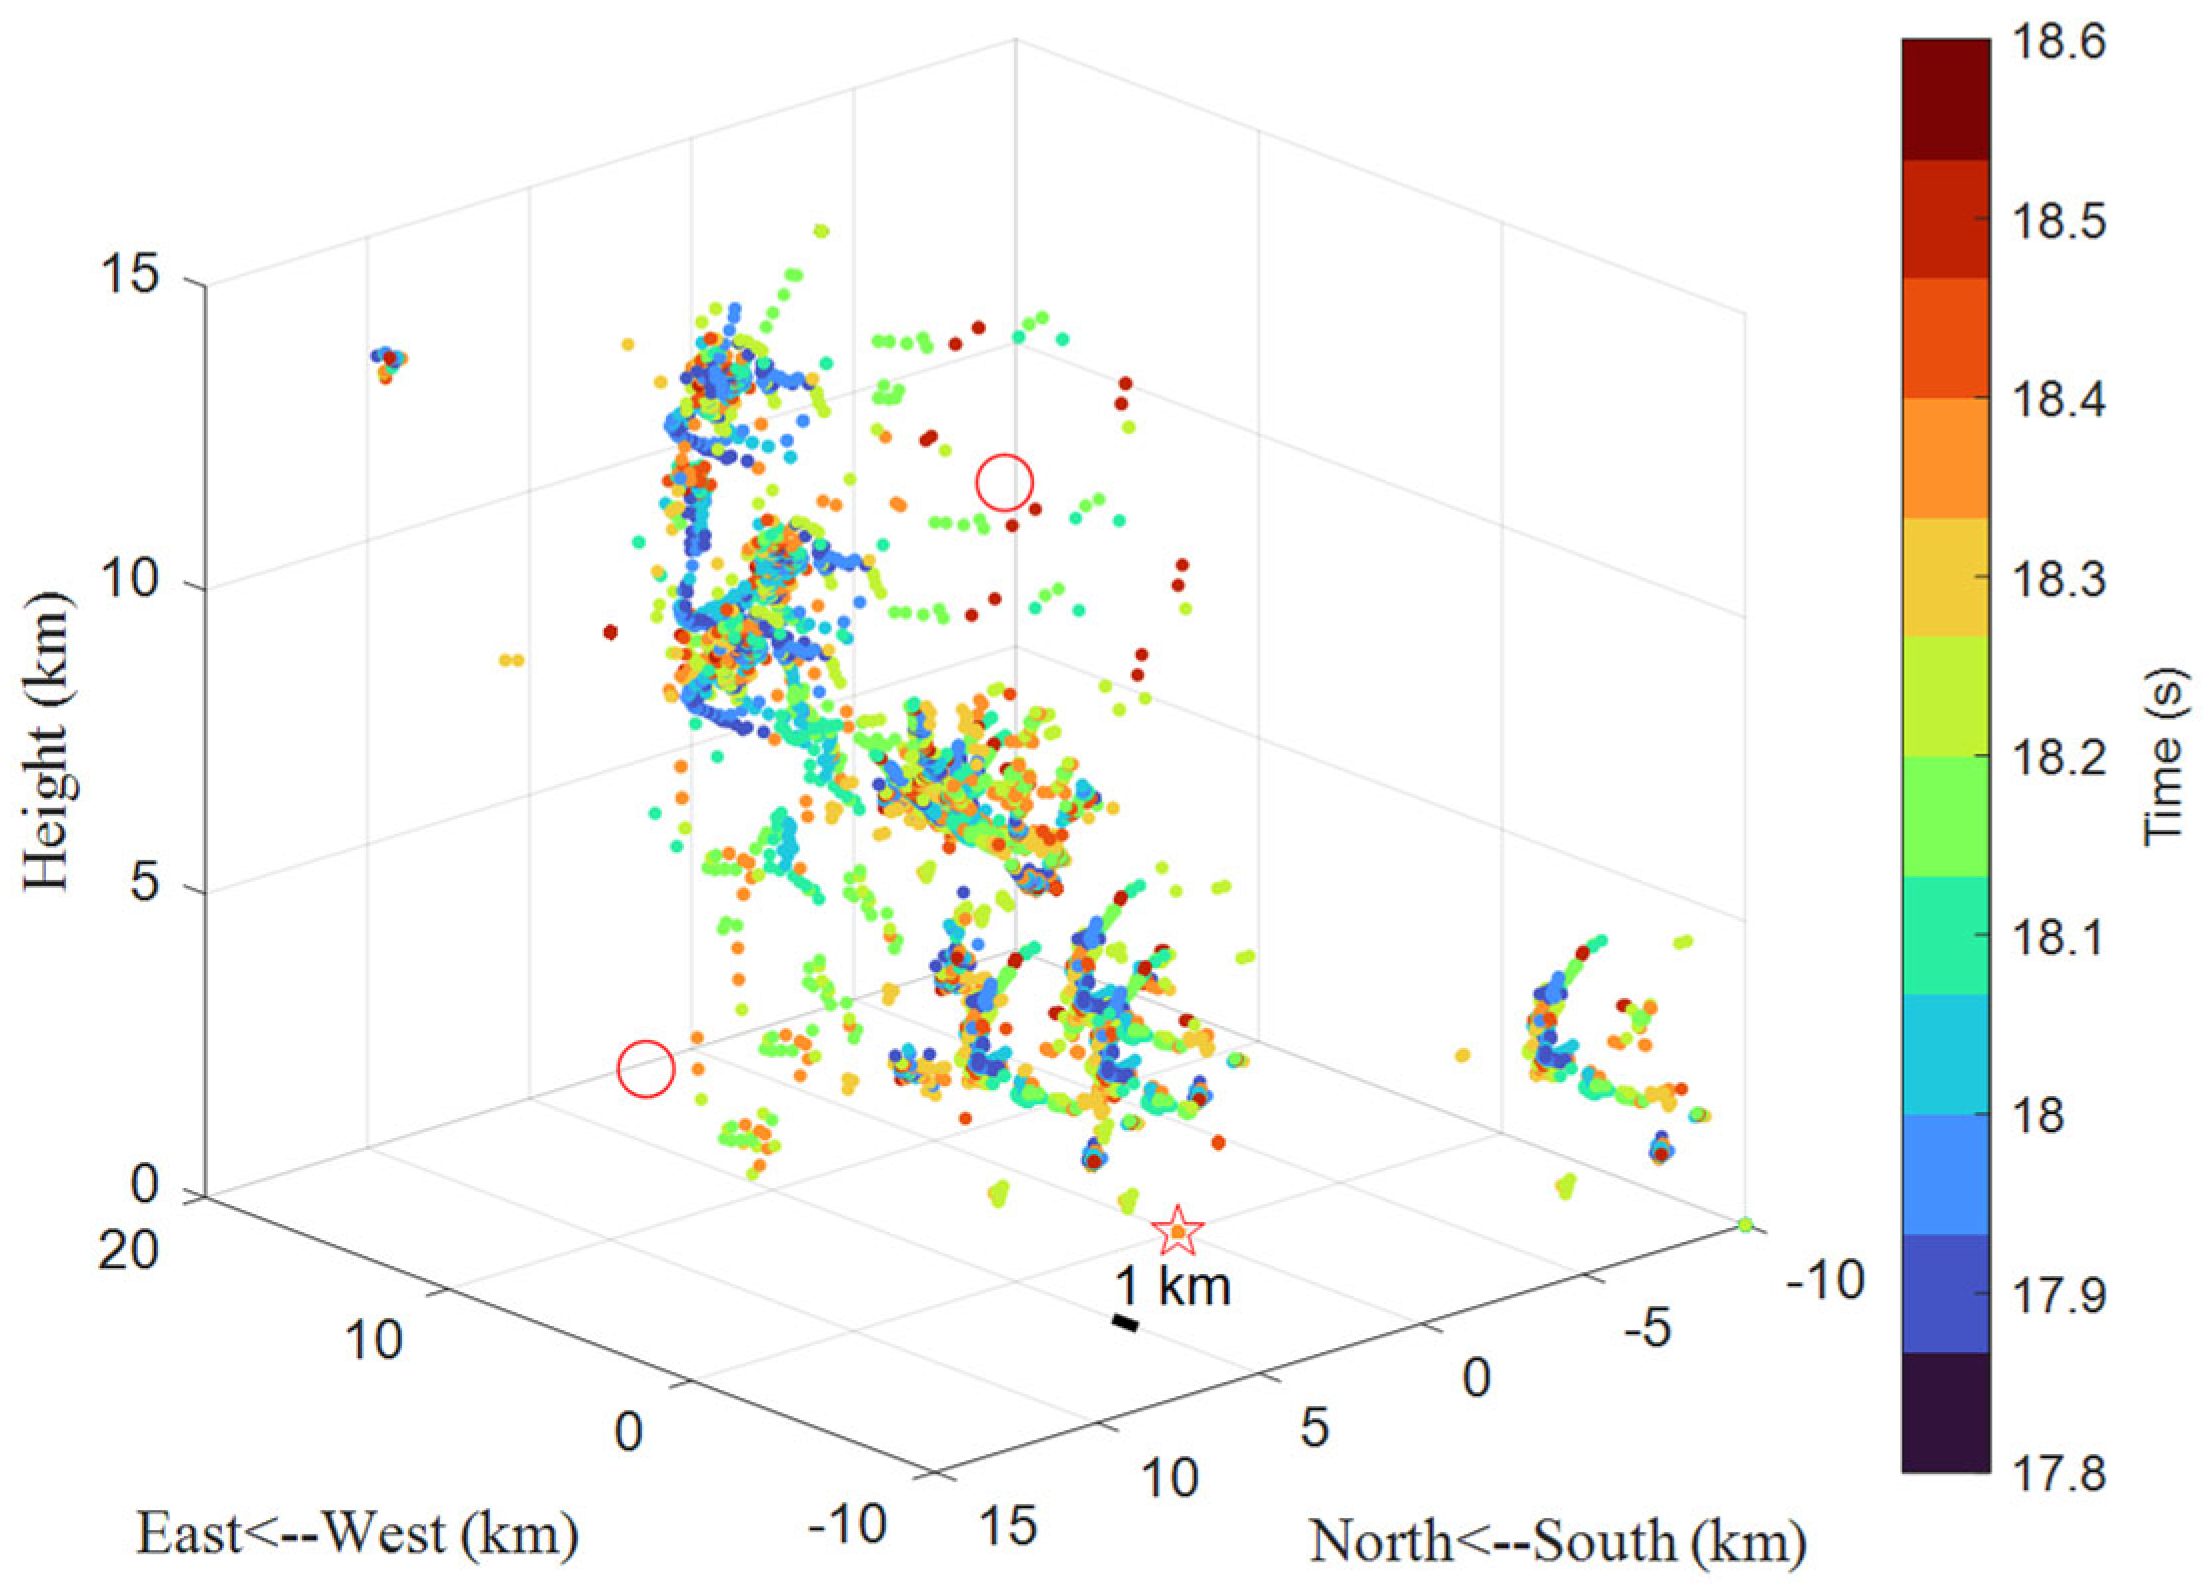
After obtaining the preliminary localization results, our work involves: generating pulse signals with temporal differences for each radiation source obtained from localization. In
Section 2.5, we generated forward-propagating waveforms; to implement the EMTR localization algorithm, it is also necessary to simulate the signals generated by each radiation source. In the short-baseline VHF localization array, the differences in distance from each antenna to the radiation source are extremely small, resulting in nearly identical signal attenuation across different antennas. This “attenuation consistency” means that attenuation differences have no impact on localization results (such as judgment of radiation source direction), so the attenuation term can be ignored in calculations. Additionally, to save computational resources, this study chooses to treat the radiation source signal as the average of the forward-propagating complex signals from the 5 channels. After completing the modeling of radiation source signals, another important task is to partition the detection space. Since the maximum detection range of the Leshan VHF radar used in this study is 100 km, and the distance corresponding to each range gate is 100 m, and considering the balance between accuracy and computational efficiency, we have chosen to partition the 3D detection space by azimuth angles (0° to 360°) and elevation angles (0° to 90°), with a spatial resolution of 0.5° and a range resolution of 100 m.
Theoretically, the transmitted signals and received reflected signals of the active radar used in this study naturally form a pair of signals propagating in opposite directions in the time domain. However, due to inherent issues with the radar’s configuration, the waveforms it transmits in various directions cannot be completely consistent. Therefore, it is necessary to transmit completely consistent time-domain complex signals in each of the previously partitioned directions within the simulated environment. For each spatial point generated in the previous steps, its distance from each radiation source is calculated, and the waveform at that point is derived accordingly. To generate the spatial energy field and enable subsequent localization work, it is necessary to calculate the energy magnitude of each spatial point generated in the aforementioned steps. The energy at a specific point, in essence, is the energy from the coherent superposition of backward-propagating signals generated by each sensor and signals emitted by each radiation source at that point; i.e., the square of the total electric field intensity at that point. The specific algorithm involves first calculating the delay of signals radiated by each radiation source when reaching that point, as well as the delay of backward-propagating signals generated by each antenna when propagating to that point. Then, the squares of the amplitudes corresponding to all waves propagating to that point are summed.
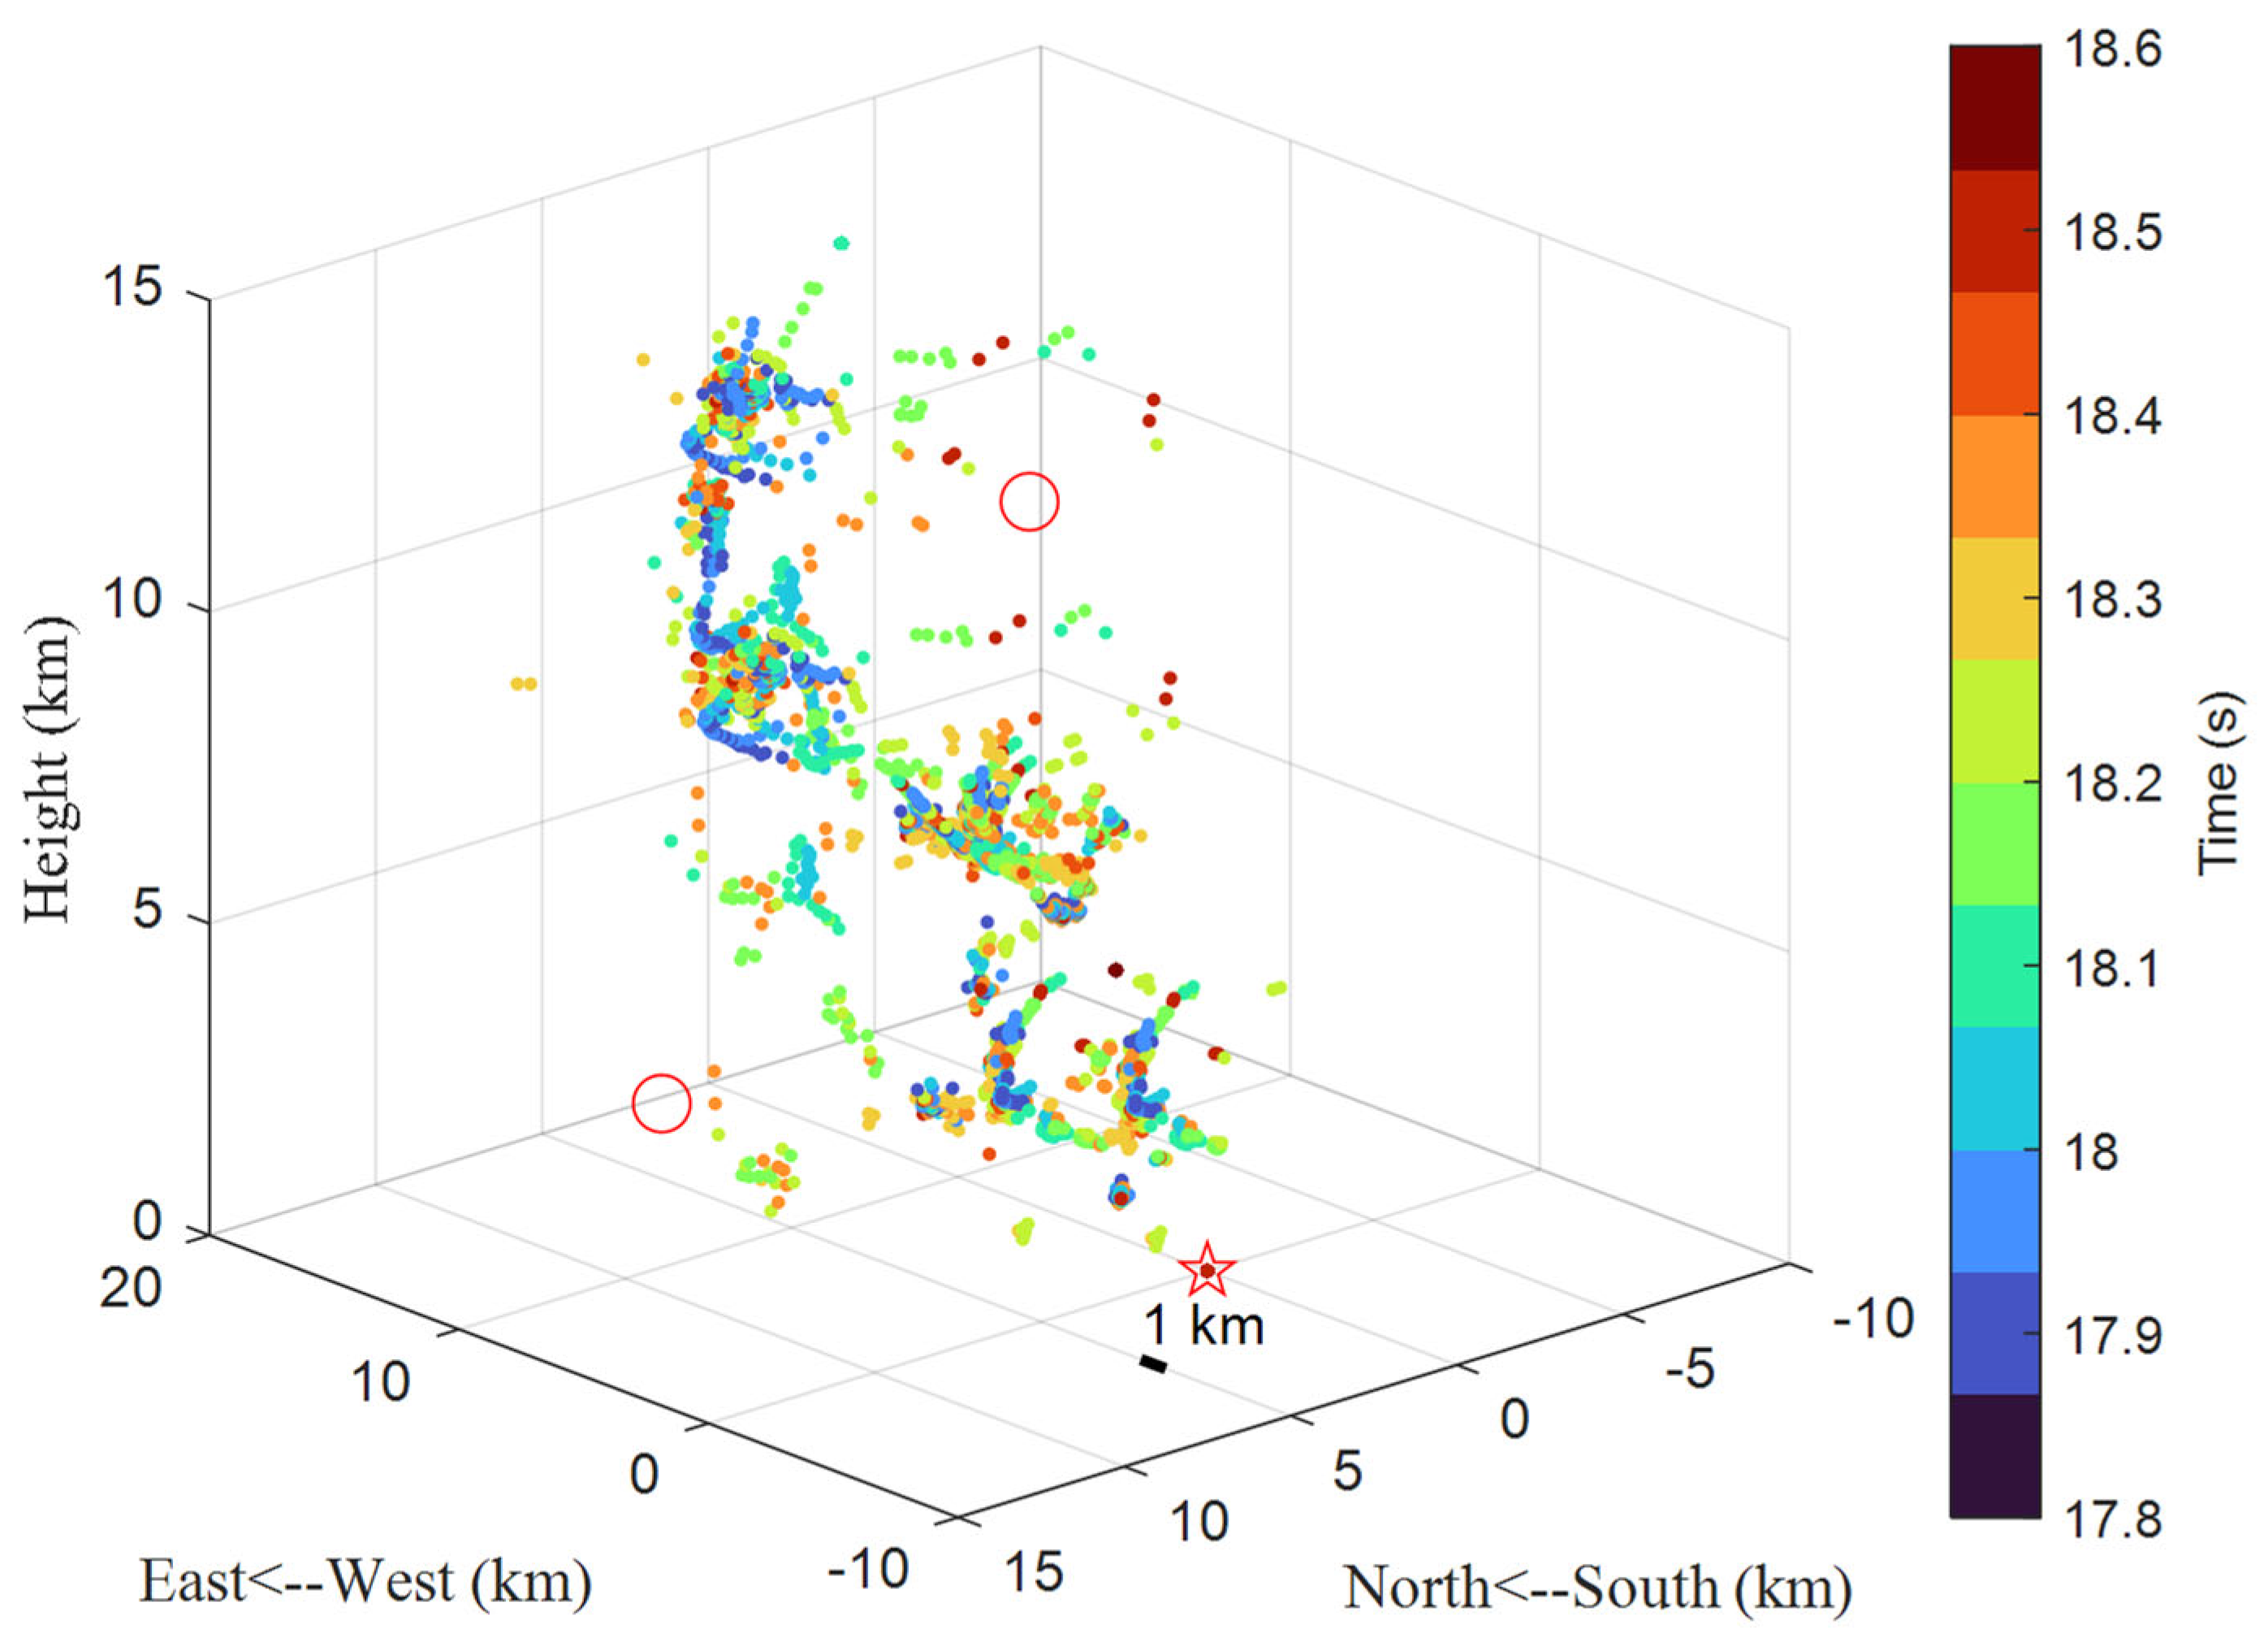
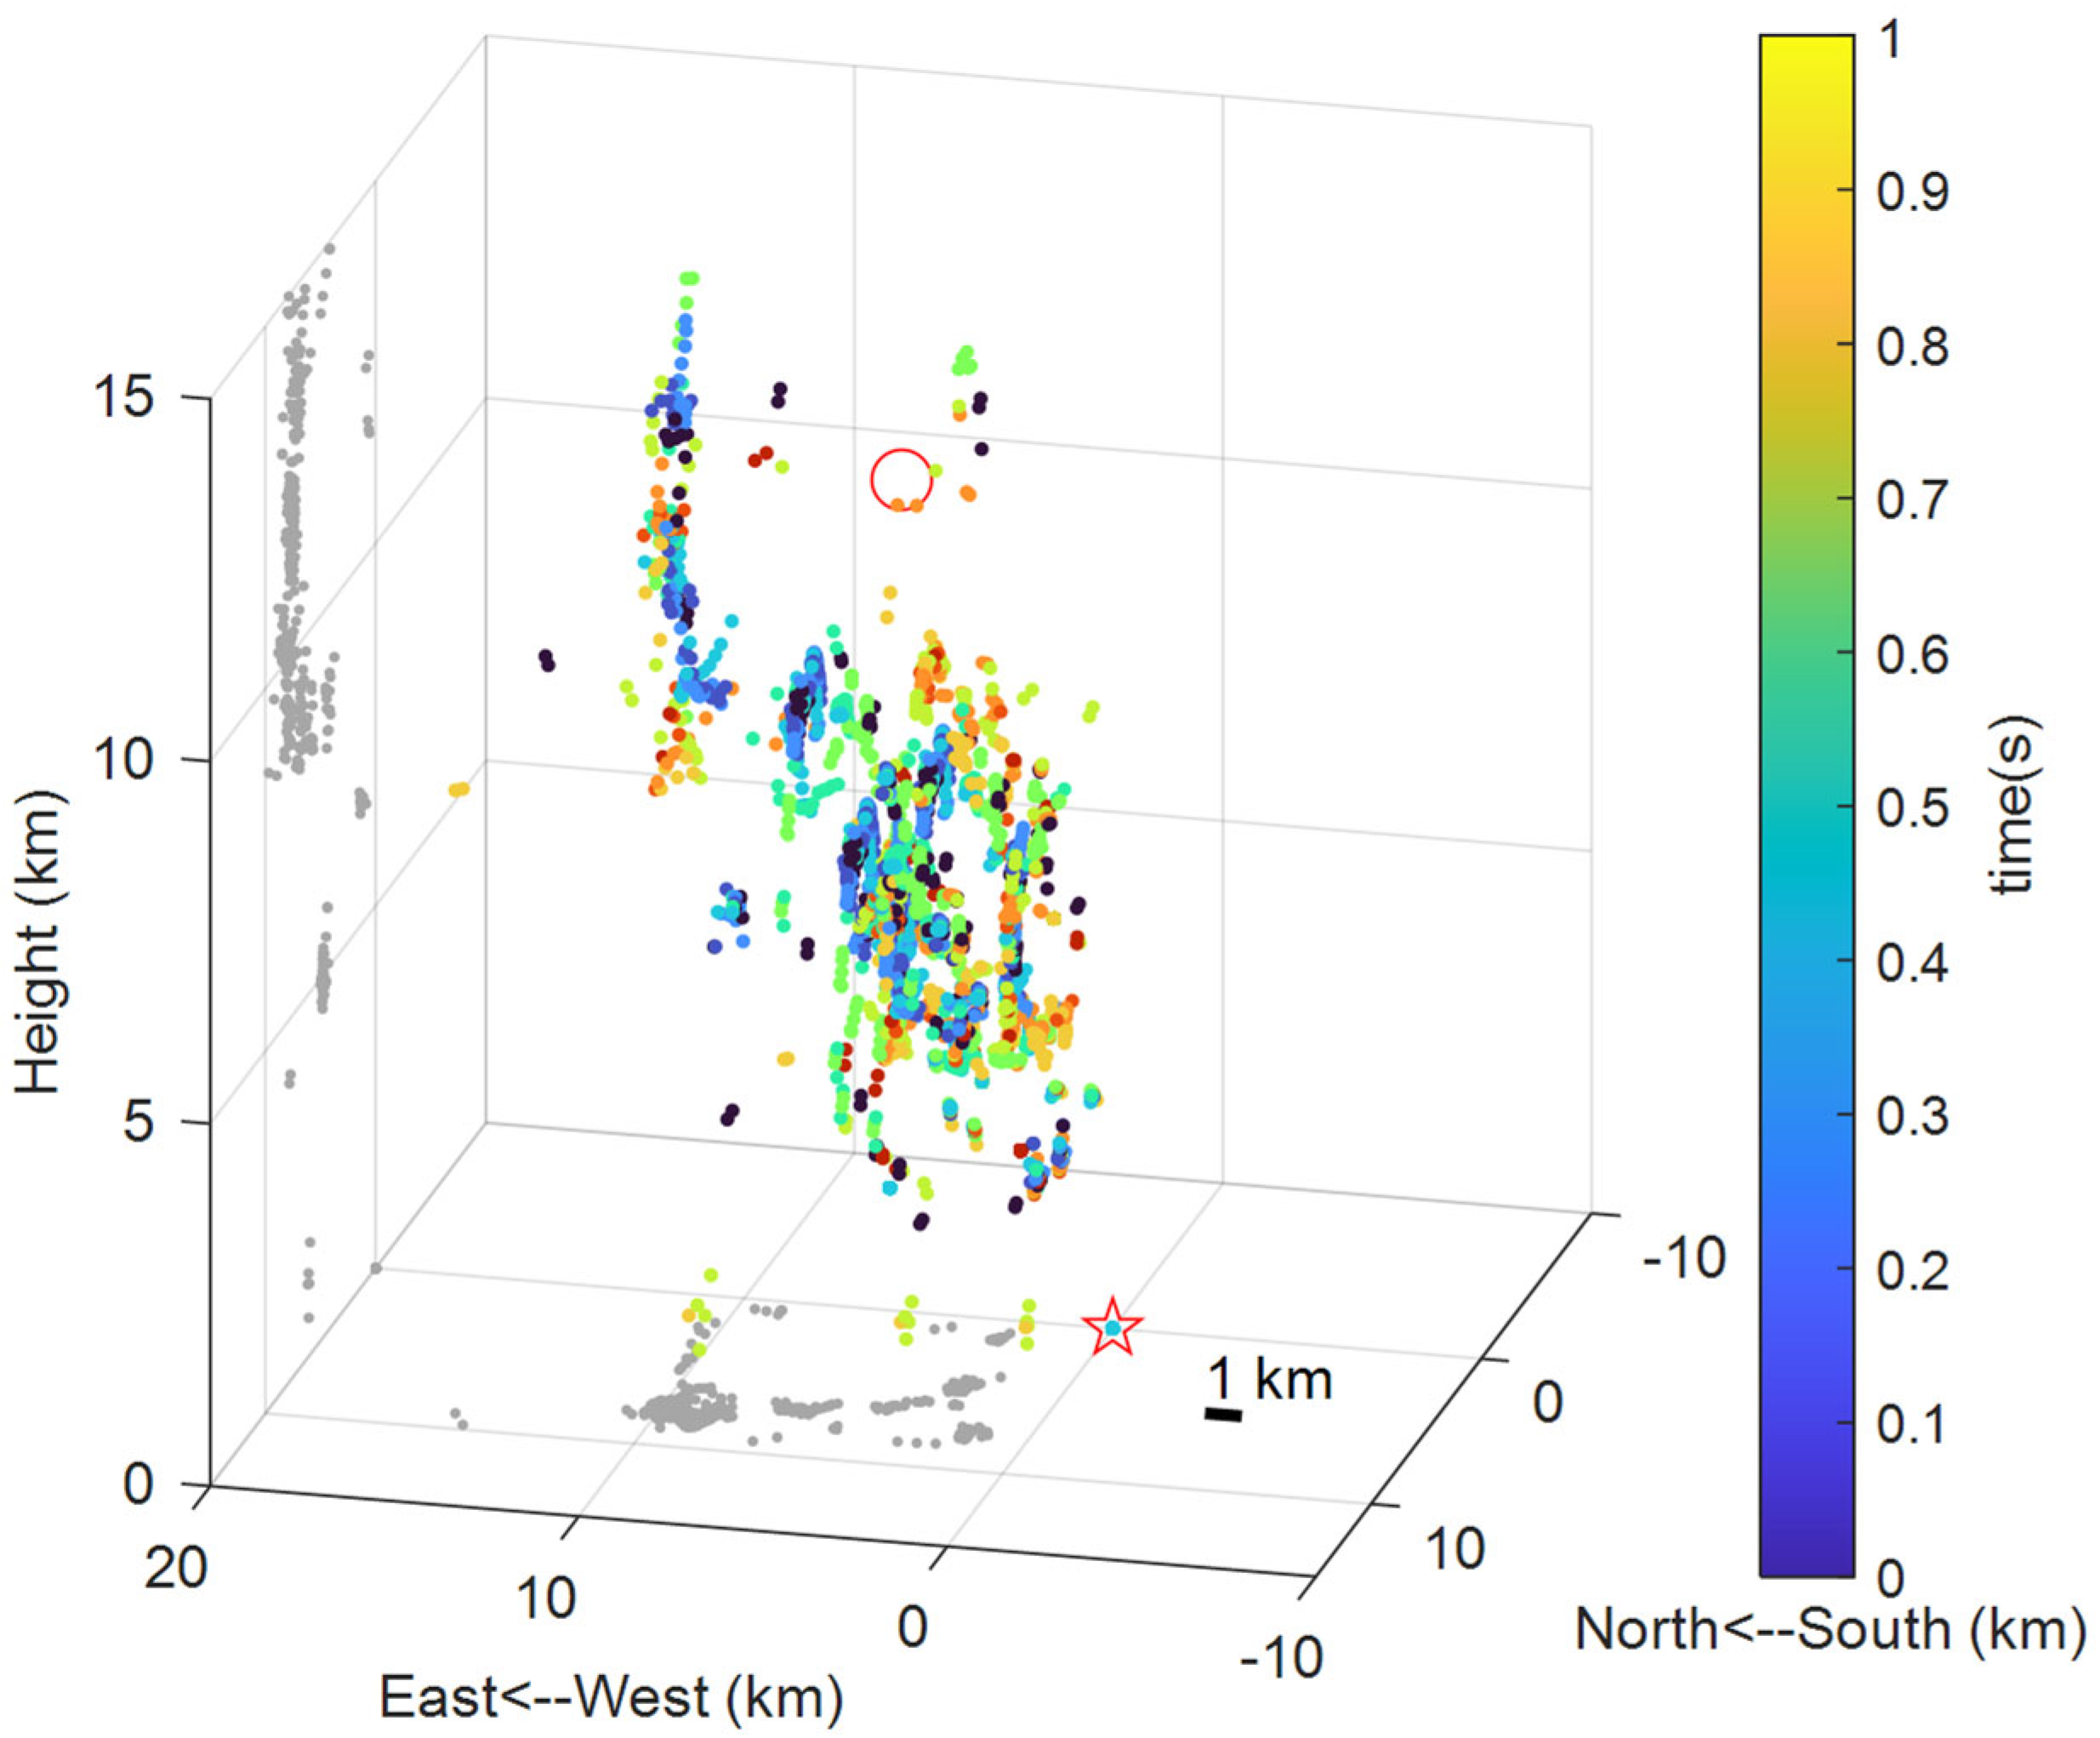
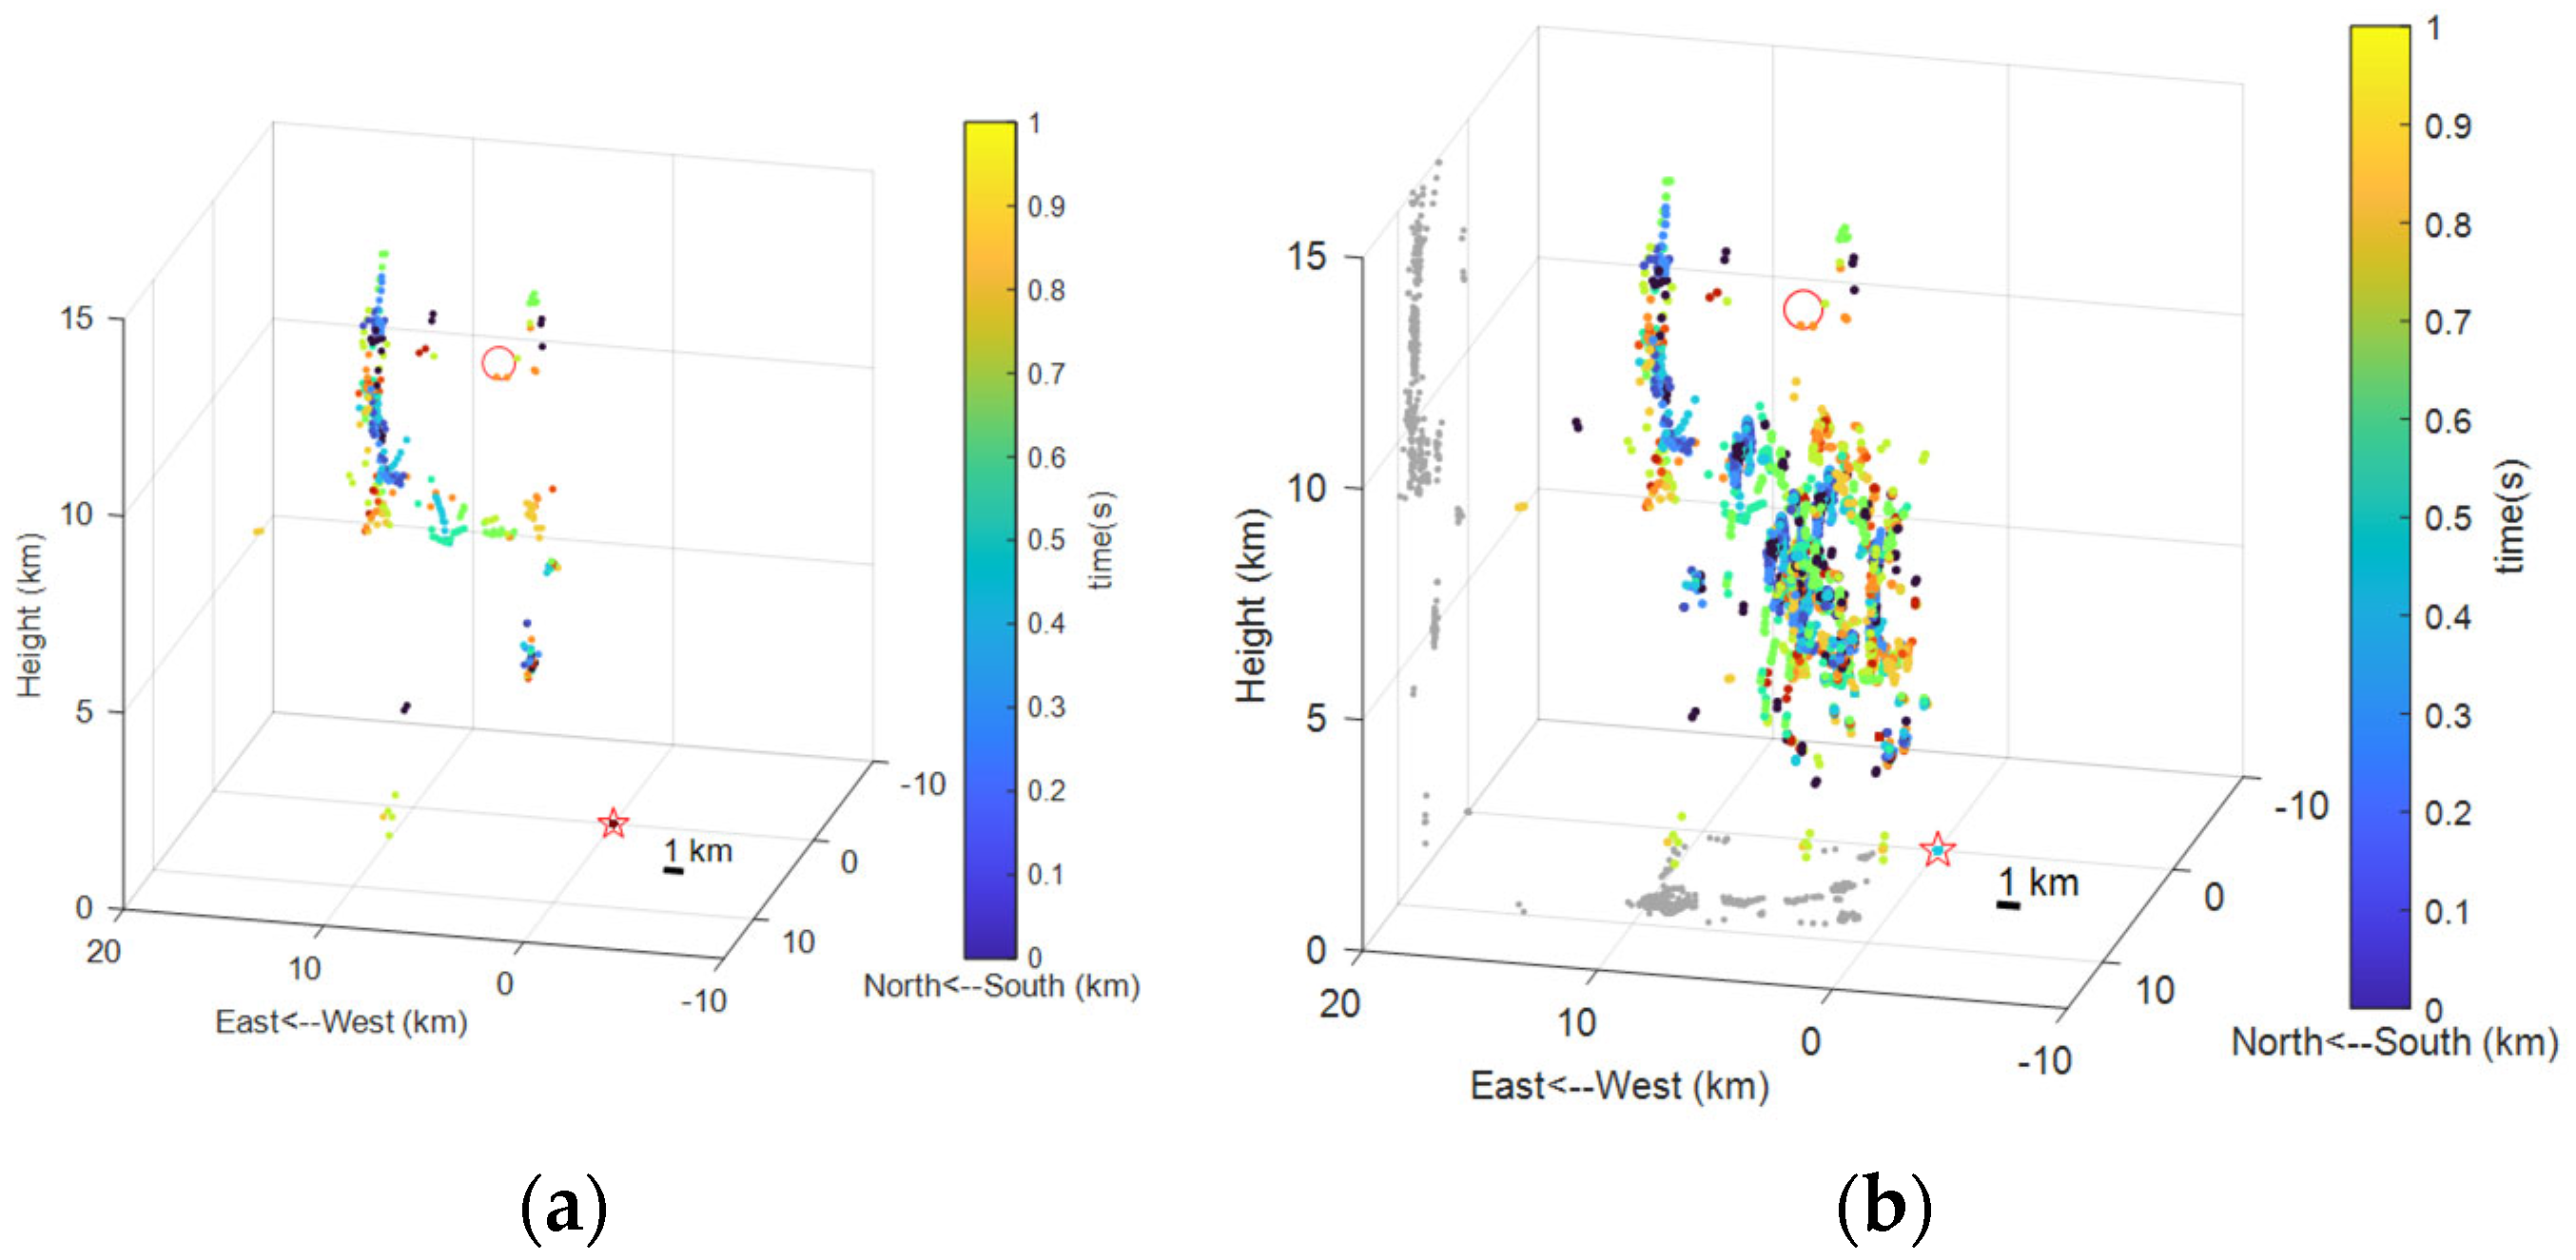
5. Conclusions
Using the localization results of the Very Low Frequency (VLF) radar from the Institute of Electrical Engineering, Chinese Academy of Sciences (IEECAS) as the ground truth, the performance indicators of this method are significantly superior to those of traditional methods. First, after HDBSCAN clustering, the average localization error of valid radiation sources decreased from 0.43 km (after energy threshold screening) to 0.38 km, with a maximum error of 0.75 km. This is far lower than the error of the traditional TDOA method in areas with sparse base stations (typically > 1 km) and the multipath error of the phase interferometry method (>0.8 km). Second, in terms of channel imaging quality: the main channel (2148 points with a length of approximately 644 m) and branches (876 points and 497 points with lengths of approximately 263 m and 149 m, respectively) after HDBSCAN clustering exhibit excellent spatial continuity. The structural overlap rate with the IEECAS ground truth reaches 92.3%, addressing the issue of “high channel reconstruction distortion rate” faced by traditional methods. Furthermore, among the finally eliminated noise, the suppression rates of aircraft electromagnetic interference (48.9%), FM radio interference (36.0%), and ground-reflected waves (11.4%) all exceed 95%, verifying the method’s stability in complex electromagnetic environments. Despite the significant advantages of this method in lightning localization and imaging, there are still limitations to be improved: 1. Computational complexity and real-time performance: The current algorithm relies on implementation on a host computer. The backward propagation simulation of EMTR and the hierarchy tree construction of HDBSCAN involve large computational loads, requiring several hours for a single localization task, which makes it difficult to meet the needs of real-time early warning. 2. Platform adaptability: It has not been adapted to embedded platforms (e.g., ARM, DSP, FPGA), which lags behind the development trend of “automation and miniaturization” in current lightning detection equipment. Based on the above limitations, future research can focus on three aspects: 1. Algorithm optimization: Reduce computational complexity and improve real-time performance through GPU parallel computing or model simplification. 2. Platform transplantation: Explore adaptation solutions for the algorithm on embedded platforms, optimize memory usage and computing efficiency, and meet the needs of field portable detection. 3. Application expansion: Extend the method to lightning detection in other regions and, based on the “electromagnetic signal clustering” idea verified in this paper, expand its application to related scenarios such as the localization of aircraft passing through clouds. The EMTR-HDBSCAN method proposed in this study not only provides a new solution for high-precision localization of lightning radiation sources and clear imaging of plasma channels but also offers a reference for weak radiation source detection and complex point cloud processing under the VHF radar interferometric system. The experimental results show that this method outperforms traditional methods in localization accuracy, noise robustness, and channel reconstruction effect, and can provide robust data support for lightning disaster prevention and atmospheric physics research.
