Article

Sediment-Deficit Sink-Zone Morphodynamics in Oceanic Island Dune Systems: Integration of Field Data and Remote Sources in the Macaronesian Region

by
Abel Sanromualdo-Collado
1,
Néstor Marrero-Rodríguez
1,2,
Carlos Avigdor Suárez-Pérez
1,
María José Sánchez-García
3,
Albert Taxonera
2,
Luis Hernández-Calvento
1 and
Leví García-Romero
1,*
1
Grupo de Geografía, Medio Ambiente y Tecnologías de la Información Geográfica (GEOTIGMA), Instituto de Oceanografía y Cambio Global (IOCAG), Universidad de Las Palmas de Gran Canaria (ULPGC), 35214 Telde, Spain
2
Associação Projeto Biodiversidade, Santa María 4111, Sal, Cape Verde
3
Grupo de Geología Aplicada y Regional (GEOGAR), Instituto de Oceanografía y Cambio Global (IOCAG), Universidad de Las Palmas de Gran Canaria (ULPGC), 35214 Telde, Spain
*
Author to whom correspondence should be addressed.
Remote Sens. 2025, 17(22), 3731; https://doi.org/10.3390/rs17223731 (registering DOI)
Submission received: 15 October 2025 / Revised: 6 November 2025 / Accepted: 8 November 2025 / Published: 17 November 2025
(This article belongs to the Special Issue Coastal Dynamics Monitoring Using Remote Sensing Data)

Highlights

What are the main findings?
  • The sink area of dune systems on oceanic islands, such as those in Macaronesia, reflects the sediment deficit inherited from actions carried out throughout the systems.
  • The integration of field data and remote sources has facilitated the identification of erosional trends across diverse spatiotemporal scales.
What are the implications of the main findings?
  • Management and protection measures aimed at addressing sediment deficits in sink areas of dune systems must consider the entire system to ensure the efficacy of the approach.
  • The methodology can be replicated for the identification of erosional trends in sink areas of other oceanic island dune systems.

Abstract

Coastal erosion has become a significant problem in the context of global warming and sea level rise. The combination of these factors which, in some cases, produces sedimentary deficit, is causing flooding problems that affect coastal ecosystems such as dune systems. This problem is of particular concern in the context of oceanic islands, where sandy coasts and dune systems are considered to be of significant value. As terminal areas of encapsulated sedimentary systems, sink areas are subject to the downwind effects of current and historical management and uses developed throughout the entire system. The objective of this research is to analyze the evolution of the Sink Zones (they mainly demonstrate behaviors akin to those exhibited by beaches), in various dune systems in Macaronesia, with a particular focus on the Canary Islands (Maspalomas in Gran Canaria, Jandía in Fuerteventura and La Graciosa Island) and Cabo Verde (Costa Fragata-Ponta Preta in Sal Island). A multiscale spatio-temporal approach was employed, utilizing historical and contemporary orthophotos and topographic data (obtained from LiDAR flights with airplanes and photogrammetric flights with drones) to analyze the evolution of the coastline using DSAS software (version 6.0). In the specific instance of the island of La Graciosa, these data were integrated with detailed fieldwork data on wind conditions and sediment characterization. This methodology was utilized to ascertain the morphodynamical response of the aforementioned Sink Zones. The results obtained from the analyses reveal the presence of erosion processes, thus prompting a comprehensive discussion concerning the management and utilization of these natural systems, in addition to the potential impact of climate change.

1. Introduction

Coastal erosion is a pervasive issue impacting sandy beach systems globally, exacerbated by rising sea levels and intense storm events [1]. In coastal dune systems, erosion, flooding, and sediment deficits are closely interconnected. The reduction in sediment supply, caused by river regulation, coastal urbanization, or protective infrastructure, limits the dunes’ ability to recover after storm events [2,3]. This imbalance accelerates foredune erosion and weakens their natural function as buffers against wave energy and marine flooding, thereby increasing the vulnerability of both the dune system and adjacent developed areas [4,5,6,7].
According to the IPCC’s Sixth Assessment Report (AR6) [8], island territories, due to their geographical and natural characteristics, are among the most vulnerable to the effects of climate change, with serious consequences such as sea level rise which, among other areas, would directly affect coastal ecosystems. In this sense, coastal erosion has become a key problem in the context of global warming and rising sea levels [9]. The combination of these factors is generating flooding problems that affect ecosystems, infrastructures and people’s daily lives [10,11]. Sandy coasts are the most affected by these processes given their greater fragility and speed of change in the face of these processes. These dynamic environments, characterized by the perpetual interaction of sediment, wind, currents, and waves, are particularly susceptible to morphological changes driven by climatic and anthropogenic forcings [12,13]. The degradation or potential loss of these vital coastal resources raises considerable concerns among governmental bodies, businesses, and the public due to their significant socioeconomic and ecological roles [14].
In the context of oceanic islands, sandy coasts are an even more precious asset, as the volcanic origin of the islands produces rocky coasts and limits the development of sedimentary coasts with sandy beaches and coastal dune systems. For example, in the case of the Canary Islands, theoretically, the dune systems and the sediment origin lie in the erosion of volcanic rocks (comprising 5–70% of sand composition), which reach the insular shelves intermittently through ravines (as opposed to year-round rivers commonly found on continents), coastal erosion, and ancient fossil dune systems [15]. These ravines show limitations because they currently function seasonally, meaning fluvial action capable of transporting sediment occurs only on days with sufficient rainfall, and sometimes not at all during dry years, which is common in the Canary Islands and Cabo Verde as an arid or semiarid region. In addition to the limitations of islands due to their surface area [16], the volcanic periods that form the islands also reduce sand supply for a long time, completely interrupting sand pathways [17]. Additionally, biogenic production significantly contributes to the sediment found in the dune systems [18] to between 30 and 95%, as determined through calcium carbonate content analysis [19]. Thus, the dune systems’ development in volcanic islands is conditioned by three fundamental natural factors: (i) the availability and transfer of sand from the seabed to the land; (ii) the likelihood of sediment accumulation in the form of beaches, and (iii) the presence of climatic and topographic conditions that favor aeolian transport [20]. However, dune systems are showing signs of sand deficit, a phenomenon detected in these coastal ecosystems worldwide [21] is that also is occurring in Canary Islands [22].
Reference [23] described a conceptual model offered for how island-encapsulating aeolian sedimentary systems form and evolve. These systems consist of three phases: (i) upwind sand sources (often beaches); (ii) transport corridors (either crossing the island via topographic lows or running around island margins); and (iii) downwind depocentres or Sink zones where sand is deposited (dunefields, prograding beaches or beach ridges). The dune morphologies in these components vary, including, e.g., nebkha or hummock dunes, sand sheets, barchanoid or transverse dunes, depending on topography and sediment supply. Geological and geographical factors enable their development: long island exposure due to slow subsidence in thick lithosphere, steady littoral sediment supply (including biogenic sources), and arid to semi-arid climate with strong, asymmetrical wind regimes (trade winds). This research presented examples such as Boa Vista (Cabo Verde), which was later supported by [24], and Jandía and El Jable in the Canary Islands, showing rates of dune migration in some cases >10–20 m/year. In this sense, the Sink zones or downwind side of the system, where dunes migrate seawards and return the sand to the littoral zones [25] (Short and Jackson, 2013), has also been referred to as the zone of output of sediments [22,26], output beach [27], export area [22] or output system [20]. It is important to emphasize that understanding the system is important for managing downwind effects: modifying any part (e.g., source, transport, or sink) can affect beaches, dunes or coastal stability.
In this regard, the sedimentary systems of the Canary Islands have been extensively utilized for the study of the impact of human activity on the morphodynamics of these systems, and the knowledge acquired about them is frequently used as a proxy for systems located in other arid regions of the world, such as South Australia [28] or northwestern Africa [29,30]. Consequently, it is anticipated that the results from the output dune systems of the Canary Islands and Cabo Verde will be relevant even beyond the Macaronesia.
However, the majority of these studies have thus far concentrated on the input areas of the systems and on sediment transport corridors, while the sink zones have received less attention. In beach-dune systems located at the sources of sediment in the Canary Islands’ aeolian sedimentary systems, several effects derived from human activity have been described [22,31], including the artificial stabilization of the coastline by mechanical methods [27], the appearance of erosive surfaces [32,33], a reduction in key plant species [34], and the creation of coastal lagoons [35,36]. These effects increase the geomorphological vulnerability of beach-dune systems [37]. The impact of human activity on the morphodynamics of sediment transport corridors in the dune systems of the Canary Islands is multifaceted. It encompasses the obstruction of space due to physical occupation [38,39], alterations to wind flows [40,41], and the stabilization of sediments by vegetation [42,43].
The objective of this study is to examine the morphodynamical evolution of diverse sink zones in coastal dune systems across the islands of Macaronesia (Canary Islands and Cabo Verde). The present study proposes a two-scale methodology that uses remote sources to investigate the long-medium term evolution of the systems at Costa Fragata-Ponta Preta (Sal, Cabo Verde), Maspalomas (Gran Canaria, Spain), Jandía (Fuerteventura, Spain) and La Graciosa (Spain). The methodology incorporates fieldwork at La Graciosa to characterize in the medium-short term the current conditions of an eroded output system subjected to coastal flooding.

2. Study Area

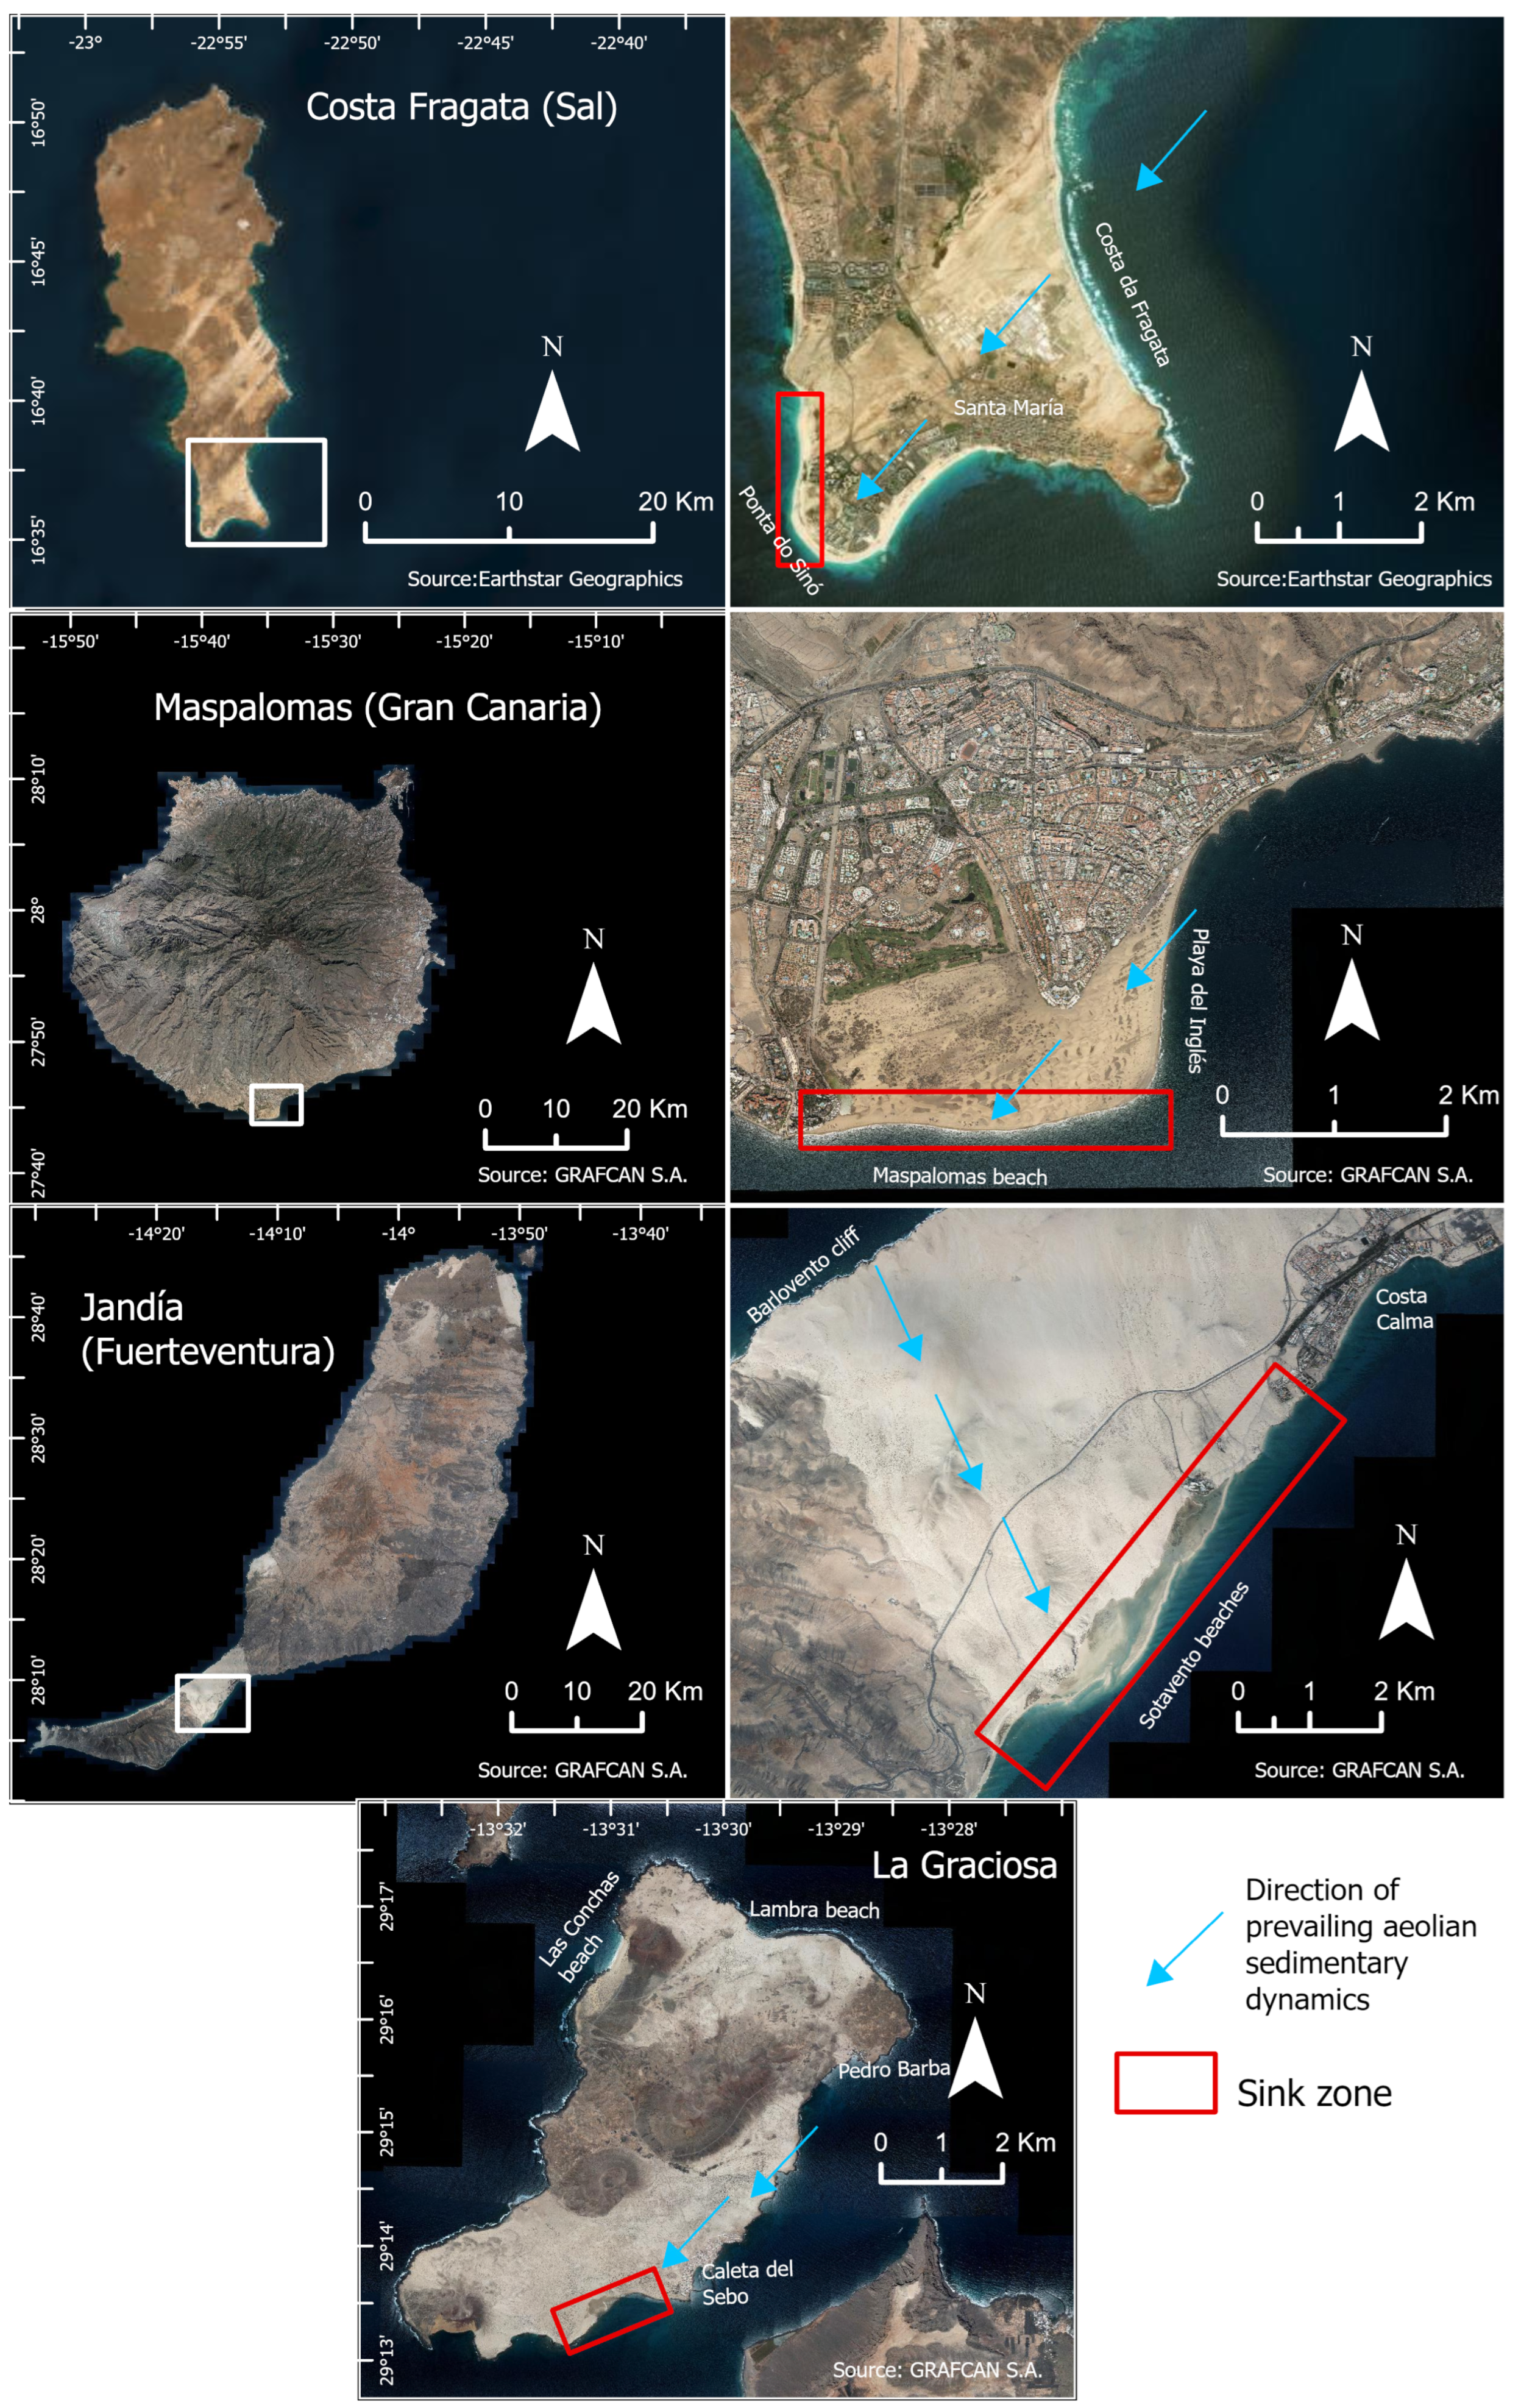
The Macaronesia region encompasses the North Atlantic archipelagos of the Azores, Madeira, Salvajes, Canary Islands, and Cabo Verde, in addition to a substantial African coastal strip extending from Morocco to Senegal (Figure 1). This extensive biogeographical unit is located between the geographical coordinates of the northernmost island, Corvo (Azores) (39°45′N, 31°17′W) and the geographical coordinates of the southernmost island, Brava (Cabo Verde) (14°49′N, 24°42′W). Conversely, Flores (Azores) is the most distant island, situated 900 km from the mainland European coastline, while Fuerteventura (Canary Islands) is the closest, located 96 km from the African coastline [44].
The Macaronesian archipelagos can be considered of oceanic origin, which signifies that they materialized subsequent to successive underwater eruptions of predominantly basic magma (basalt) through fractures and weak areas in the oceanic crust. Coastal morphology is characterized by a distinct volcanic origin, exhibiting features such as steep cliffs, abrasion platforms and lava-rock deltas. This geomorphology is attributed to the region’s hotspot origin and the interplay between volcanic eruptions and marine dynamics [45]. However, there are clear differences between them. The younger islands, such as some of the Cabo Verde islands, have more rugged coasts and are less developed in terms of sandy beaches and sedimentary accumulation systems. In contrast, in archipelagos with greater lithological diversity and intermediate age, such as the Canary Islands, there is greater coastal geomorphological variety, with a greater presence of sedimentary systems [46]. At the social level, similarities are expressed in the strong historical dependence on coastal resources, the importance of artisanal fishing, the use of the port as an economic hub, and the growing centrality of coastal tourism as an engine of development [47]. While the Canary Islands are experiencing significant urban and tourist pressure on the coastline, with associated processes of artificialization and habitat loss, development in the Azores has remained relatively more balanced, and in Cabo Verde there are contrasts between a still largely urbanized coastline and the tensions arising from tourist expansion on certain islands [48].

2.1. Costa Fragata-Ponta Preta (Sal)—Cabo Verde

The Costa Fragata-Ponta Preta aeolian sedimentary system (16°37′7.28″N, 22°54′15.93″W) is located in the south-eastern part of the island of Sal in Cabo Verde (Figure 2). The system’s initial coverage spanned an area of 11.48 km2, situated in proximity to the town of Santa María. However, due to the impact of tourism development and the subsequent construction of associated infrastructure, the system has undergone fragmentation, resulting in the disconnection of certain areas.
The coastline is predominantly composed of beaches, which have given rise to a multitude of aeolian sedimentary landforms. Its trajectory is oriented from north-easterly to south-westerly, aligning with the prevalence of north-easterly trade winds. The island of Sal is characterized by a mild climate, with annual averages between 23 °C and 24.1 °C. Rainfall is scarce and irregular, with the rainy season occurring between August and February, and annual totals generally not exceeding 155 mm [49]. In general, due to the frequency and distribution of temperatures and rainfall, the island exhibits an arid desert climate (BWk) according to the Köppen–Geiger classification (1928) [50]. The study area exhibits a semi-diurnal and microtidal regime, characterized by a maximum tidal range of approximately 1.4 m [51]. The mean offshore wave regime, as determined by a hindcast wave dataset located northward of the archipelago (Latitude: 17°15′N; Longitude: 22°45′W) from 2005 to 2017, exhibited a significant wave height of 2.1 m, a peak period of 10.1 s, and waves that typically approached from the north-northeast and north-northwest directions [24]. With regard to its socio-economic characteristics, these are contingent on climatic conditions, which have resulted in the economy being oriented towards the service sector, particularly sun and beach tourism [52], water sports such kite surfing, and wildlife observation, including nesting sea turtles (Caretta caretta). A plethora of excursions, encompassing quad bike, jeep safari, horse and bicycle outings, are initiated from this tourist center. These expeditions traverse the aeolian sedimentary system, thereby exerting considerable pressure on it. Furthermore, a portion of the eolian sedimentary system is presently utilized for salt flats in production. The system has implemented numerous protective measures, including the establishment of the Ponta Sinó Nature Reserve, the Costa Nature Reserve, and the Las Salinas de Santa María Protected Landscape.

2.2. Maspalomas (Gran Canaria)—Canary Islands

The Maspalomas Dunes Special Natural Reserve (27°44′26.05″N, 15°34′30.34″W) is a 360.9 ha transgressive dune field located in the south of the island of Gran Canaria (Figure 2). Dunes move from NE to SW, from the access to the system through the beach-dune system of Playa del Inglés to the output system of Maspalomas beach, following the effective prevailing winds from NE, ENE and E [53]. The mean annual rainfall in Maspalomas is less than 100 mm and the mean annual temperature is 21 °C, with only slight variation throughout the year [20]. The tidal regime is semidiurnal meso-tidal, with a range of 1.8 m during neap tides and up to 2.6 m during spring tides. The wave regime exhibits a bidirectional pattern, predominantly comprising SW oceanic swell and NE local sea-wind waves. The annual regime is characterized by significant offshore wave height (Hs) ranging between 0.5 m and 1 m, and peak wave period (Tp) between 4 and 8 s, with a north-easterly prevailing wave direction. The majority of storm waves are typically observed to originate from the north-eastern direction. However, it is noteworthy that the highest recorded waves have been identified as emanating from the south-western direction [54]. The area is characterized by a scarcity of vegetation, with the presence of Traganum moquinii specimens of variable height. These specimens are responsible for the formation of individual dunes, which are part of the foredune [55,56]. The dune field of Maspalomas is a space with year-round intensive tourism, which has resulted in an occupation of the sedimentary system. Since 1961, there has been a significant loss of several landforms, with some even becoming completely extinct, as a result of urban and tourist development in the vicinity of the dune field [22]. This urbanization has also produced perturbations on the airflow and sediment transport patterns in the dune field evolution, thereby increasing stabilization in shadow zones but accelerating erosion in exposed areas [40]. Furthermore, the presence of artificial beach structures associated with urban-tourist development (e.g., sunbeds or kiosks) [32], the intensity of certain services (i.e., beach cleaning machinery) [27] and the activities carried out by users (i.e., stone stacking) [33] on the input beach-dune system has resulted in deleterious effects that affect the biogeomorphological processes of the Maspalomas dune system.

2.3. Jandía (Fuerteventura)—Canary Islands

The Jandía Isthmus (28°10′53.00″N, 14°14′3.00″W), covering an area of 54 km2, is located on the southern coast of Fuerteventura (Figure 2), between the ancient massifs of Jandía and Betancuria. This area is characterized by its low elevation and gently undulating relief, in contrast to the surrounding highlands. The basement, formed between 20.7 and 14.2 million years ago, consists of alkaline basaltic lava and pyroclastic deposits resulting from Miocene volcanic activity of the Jandía stratovolcano [57]. The isthmus surface is largely covered by biogenic sand that undergoes nearly continuous aeolian transport driven by dominant NE winds. The principal dune morphologies include nebkhas, a large ramping dune at the southern limit of the windward side, and two falling dunes at Sotavento [58]. The main source of transported sediment is the erosion of aeolianite deposits and Quaternary calcareous crusts in the central part of the isthmus, while minor sandy contributions derive from modern beaches or from the erosion of cliff materials at Barlovento [58]. Aeolian transport predominantly occurs toward the SSE [59].
The regional climate is classified as warm desert, characterized by pronounced aridity [60]. Rainfall is scarce and highly irregular, typically concentrated within a few days each year. High temperatures (annual averages around 20 °C), intense solar radiation, and frequent strong winds promote high evaporation rates [58]. The study area is distinguished by waves originating from the ENE and NE directions, with minimal wave heights (Hs < 1 m) and low peak period values (5–10 s). This phenomenon is attributed to the proximity of the African continent, which results in a short fetch of wind waves. Stormy weather conditions are sporadic, with events primarily occurring during the winter months when the predominant wave direction is from the south-west [61].
Vegetation cover is sparse and generally limited to low shrub layers. Three main vegetation types occur in the isthmus, reflecting habitat differentiation: psammophytes in mobile sand areas, halophytes along the backshore zones of Sotavento where salinity and tidal flooding are intense, and Chenopodiaceae thickets on calcareous crusts and rocky outcrops [62].
Historically, the Jandía Isthmus was used exclusively as pastureland from around 600 BCE [63] until approximately 1850, when references to the extraction of fuel from this area first appeared in historical records. These traditional practices declined with the onset of tourism on the island in the 1960s, which initiated sand extraction for construction and the development of infrastructures and tourist facilities across the isthmus [61,64]. Today, the area includes two main urban centers, Costa Calma and La Pared, as well as several isolated hotels located south of the Sotavento beaches.

2.4. La Graciosa—Canary Islands

The island of La Graciosa (29°15′16.78″N, 13°30′16.92″W) is located north of Lanzarote and forms part of a group of islets, La Graciosa being the largest of them all, with an area of 27.05 km2 (Figure 2). With the exception of the populations of Caleta del Sebo and Pedro Barba, their lands were assigned to the Autonomous National Parks Agency in 2002. The Spanish state is the proprietor of these lands, which are subject to a range of different protective figures. Tide range at the Caleta del Sebo harbor is around 1 m. The island of La Graciosa is subject to wave action from both the first and fourth quadrants throughout the year, with the latter being more prevalent due to the influence of the north-westerly wind and the long fetch of waves from the British Isles. The waves typically range from 1 to 2 m in height, with heights of up to 3 m being common in stormy conditions and rarely exceeding 4 m. The impact of storms originating from the south and south-east is mitigated by the protective barrier provided by the island of Lanzarote [65].
Presently, a substantial portion of the island is covered by loose wind-blown sand of Holocene origin [19]. The sand dunes under consideration occupy a significant area (13.96 km2) in both the northern and southern regions of the island. These sand dunes have undergone significant changes throughout their history as a result of human intervention. Following a phase of deforestation associated with traditional uses such as grazing and the extraction of plant fuel, the subsequent protection of the area and the importation of fossil fuels led to a period of spontaneous vegetation succession [66]. Consequently, the area is now characterized by the presence of sand mantles of varying thickness, which are driven by the prevailing north-easterly winds and frequently give rise to mound dunes (nebkhas) that are often associated with vegetation. The majority of these deposits are stabilized by vegetation, which is characterized by shrub scrub combining halophilic, psammophilic and xerophilic species.

3. Methodology

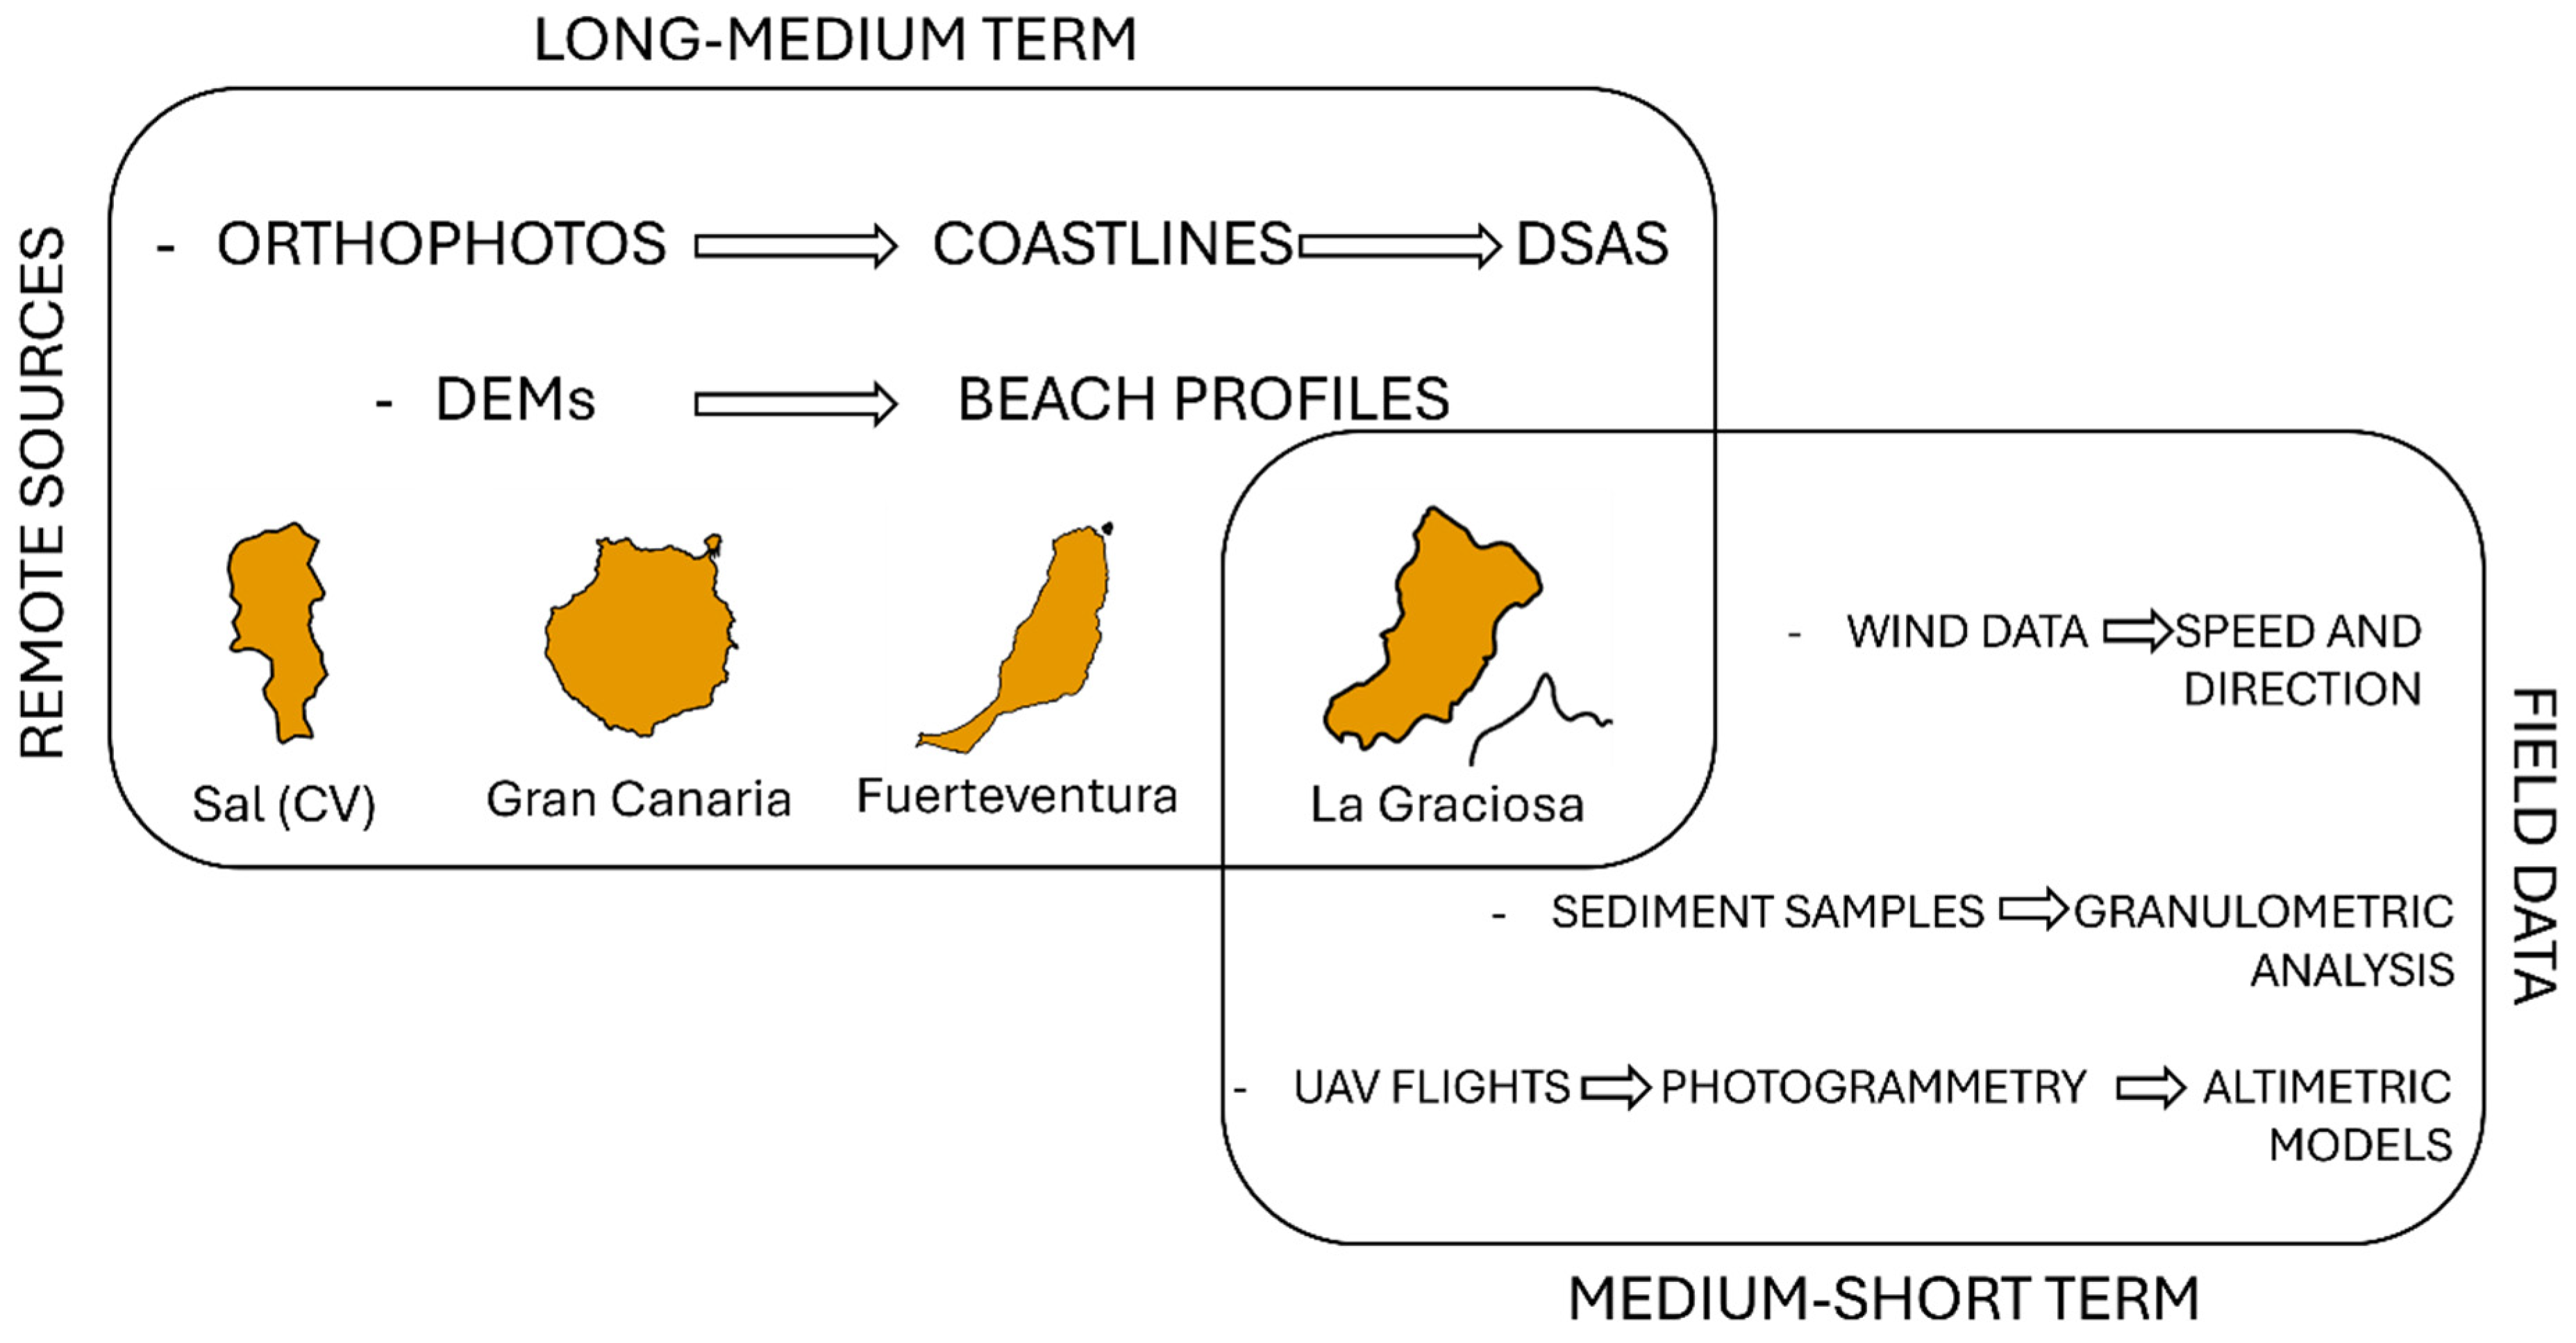
The methodology underlying this study encompasses two approaches with differing spatiotemporal scales (Figure 3). Firstly, the long-medium term evolution of the sink zones of the dune systems at Costa Fragata (Sal, Cabo Verde), Maspalomas (Gran Canaria, Spain), Jandía (Fuerteventura, Spain) and La Graciosa (Spain) was investigated by means of the utilization of historical and contemporary orthophotos and topographic data sources. Subsequently, the integration of fieldwork data pertaining to wind conditions and sediment characterization in the output system of La Graciosa was undertaken, with the objective of delineating the prevailing conditions of an eroded output system that is subject to coastal flooding.

3.1. Long-Medium Term

For the medium- to long-term analysis, the most reliable information available from remote sources for each study area was selected and collated (Table 1). For study area located in Canary Island, historical aerial photographs and orthophotos through Web Map Server-WMS, and Digital Elevation Models (DEMs) were obtained from various remote sources for those years for which data of sufficient resolution were available from public sources (Spatial Data Infrastructures-SDI of the Canary Islands Government or Spanish Geographical Institute-IGN) with reference system UTM (28-N) with the WGS84 datum (EPSG code: 32628). In the case of the Google Earth images that were used to analyze the study area located on Sal Island (Cabo Verde), the available images with highest spatial resolution were downloaded as orthophotos using SAS Planet software (version 2025), with spatial resolution ranges shown in Table 1, and subsequently projected onto the UTM (27-N) with the WGS84 datum (EPSG code: 32627) as reference system.

3.1.1. Shoreline Identification and DSAS Analysis

The study areas were identified based on previous publications produced in recent years in Maspalomas [26,27,67], Jandía [61,64] and La Graciosa [66]. These works revealed common patterns that are further explored in the present study, which also incorporates new locations where similar processes have been observed. Consequently, this research provides a more comprehensive and cross-cutting analysis than those conducted to date.
This study introduces an approach by conducting an analysis of shoreline change using the Digital Shoreline Analysis System created by [68,69,70] and updated by [71]. The methodology employs a baseline-transect approach: a seaward baseline (positioned 300–500 m offshore) serves as the reference from which perpendicular transects are cast at 5–30 m intervals (with closer intervals applied to smaller or more complex beaches and wider intervals to larger, more linear beaches). Shoreline positions were extracted from satellite imagery (in the case of the Google Earth images), historical aerial photographs, and historical or current orthophotos, with all shorelines consistently digitized along the wet-dry line following standard coastal mapping protocols [70]. Positional uncertainty was assigned a default value of 10 m as specified by the DSAS system (version 6.0), accounting for satellite spatial resolution, tidal stage uncertainty, and digitization error. For each transect, in this study, DSAS calculates three metrics: End Point Rate (EPR): Average annual rate calculated by dividing the total distance between the first and last year by the number of years; Net Shoreline Movement (NSM): The total distance (not averaged per year) between the oldest and most recent shoreline position in meters; Shoreline Change Envelope (SCE): The maximum distance recorded between the most seaward and most landward shoreline positions during the entire study period. Together, these indicators allow for a robust assessment of both the magnitude and the temporal trends of coastal erosion and accretion processes within the study areas.

3.1.2. Morphological Evolution

Altimetric data have been utilized over long–medium-term scale for the morphological evolution of the systems located in the Canary Islands. The beach profiles located in the studied sink zones have been obtained and then compared using Geographical Information Systems (GIS). The three unique LiDAR flights generated by the National Plan for Aerial Orthophotography (PNOA, Spain), offered openly by the National Geographic Institute (IGN, Government of Spain), corresponding to the years 2009 (1st coverage), 2015 (2nd coverage) and 2023 (3rd coverage), were used.
With regard to Cabo Verde, in the absence of direct sources from which to estimate volumetric changes in the outlet sector, photo-interpretation was employed as the primary analytical tool. The procedure involved the digitization of various geomorphological and land-use elements that characterize the spatial evolution of the area. Specifically, four categories were delineated: inundated surfaces, vegetated dunes, unvegetated dunes, and urbanized areas. The distinction among these units responds to their relevance in the environmental dynamics and transformation processes of the sector, thus providing a cartographic basis that enables temporal comparison and the analysis of trends in land occupation and landscape modification.

3.2. Medium-Short Term

In order to conduct a more detailed spatiotemporal scale analysis, the La Graciosa output system has been selected as a case study of a sediment-deficit sink zone of an aeolian sedimentary system in oceanic islands. The objective at this scale was to evaluate the response of an eroded outlet system to flooding events due to equinoctial tides, resulting in the formation of an intertidal lagoon exclusively colonized by Arthrocaulom macrostachyum.
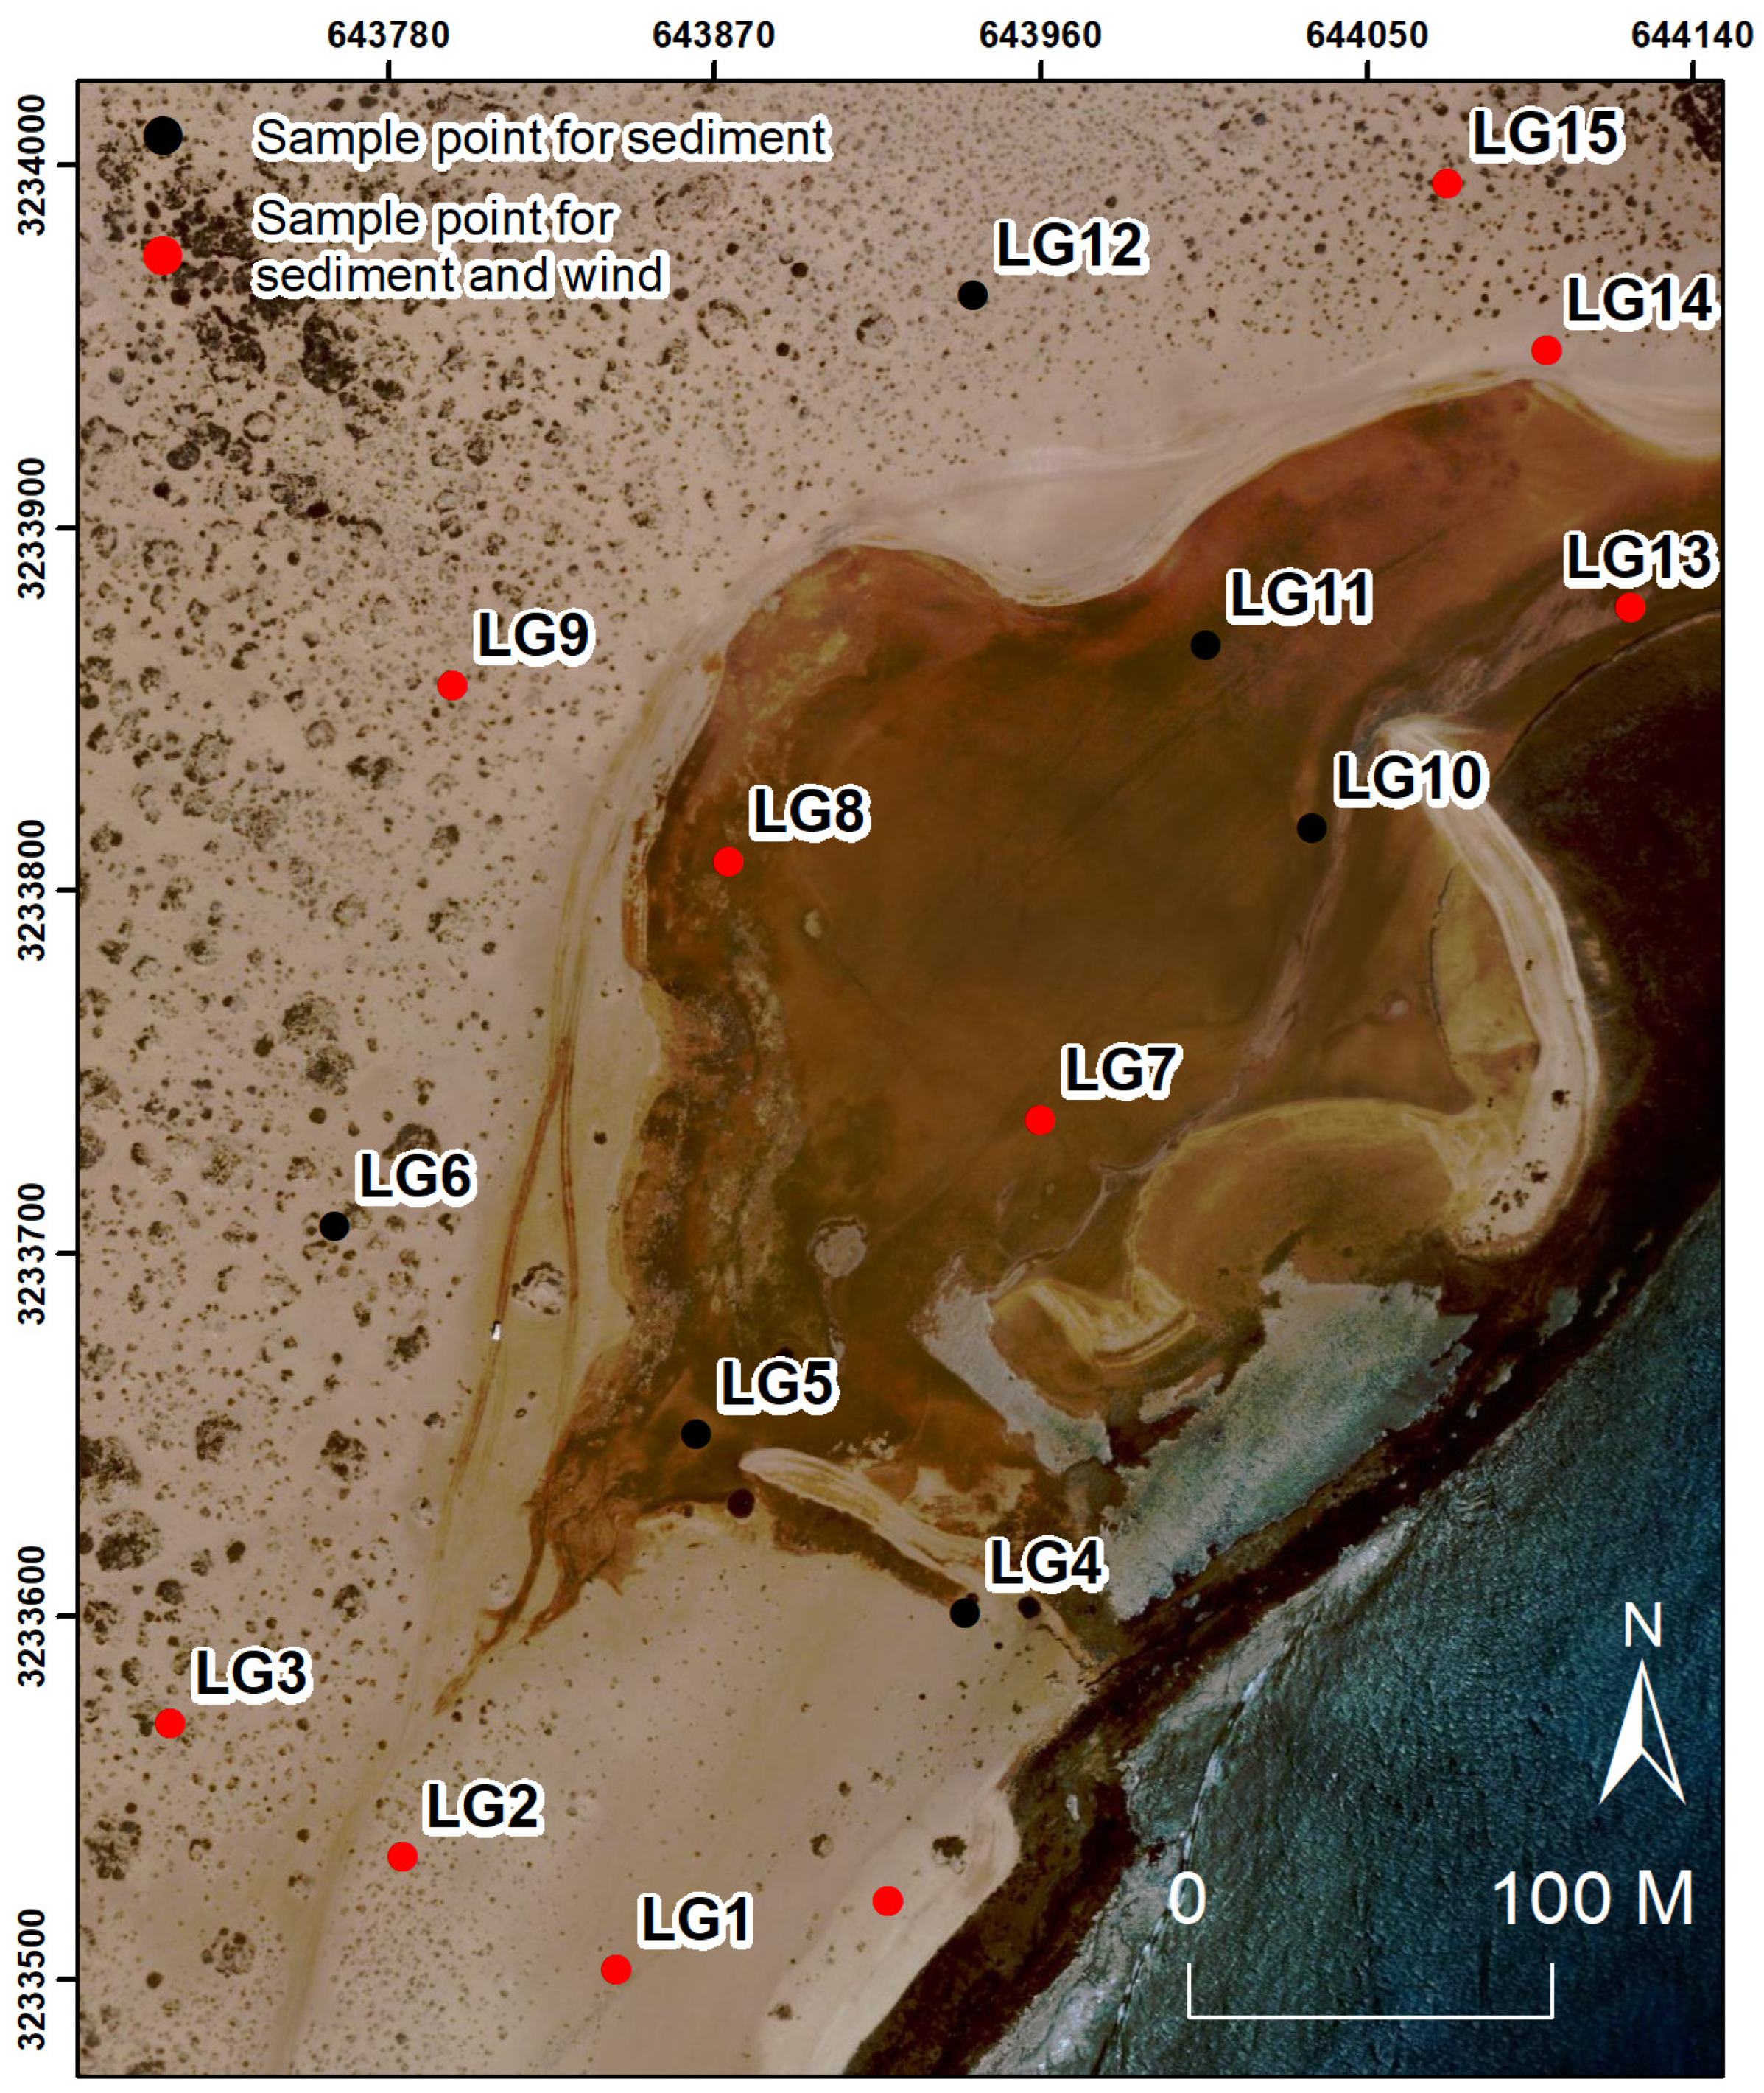
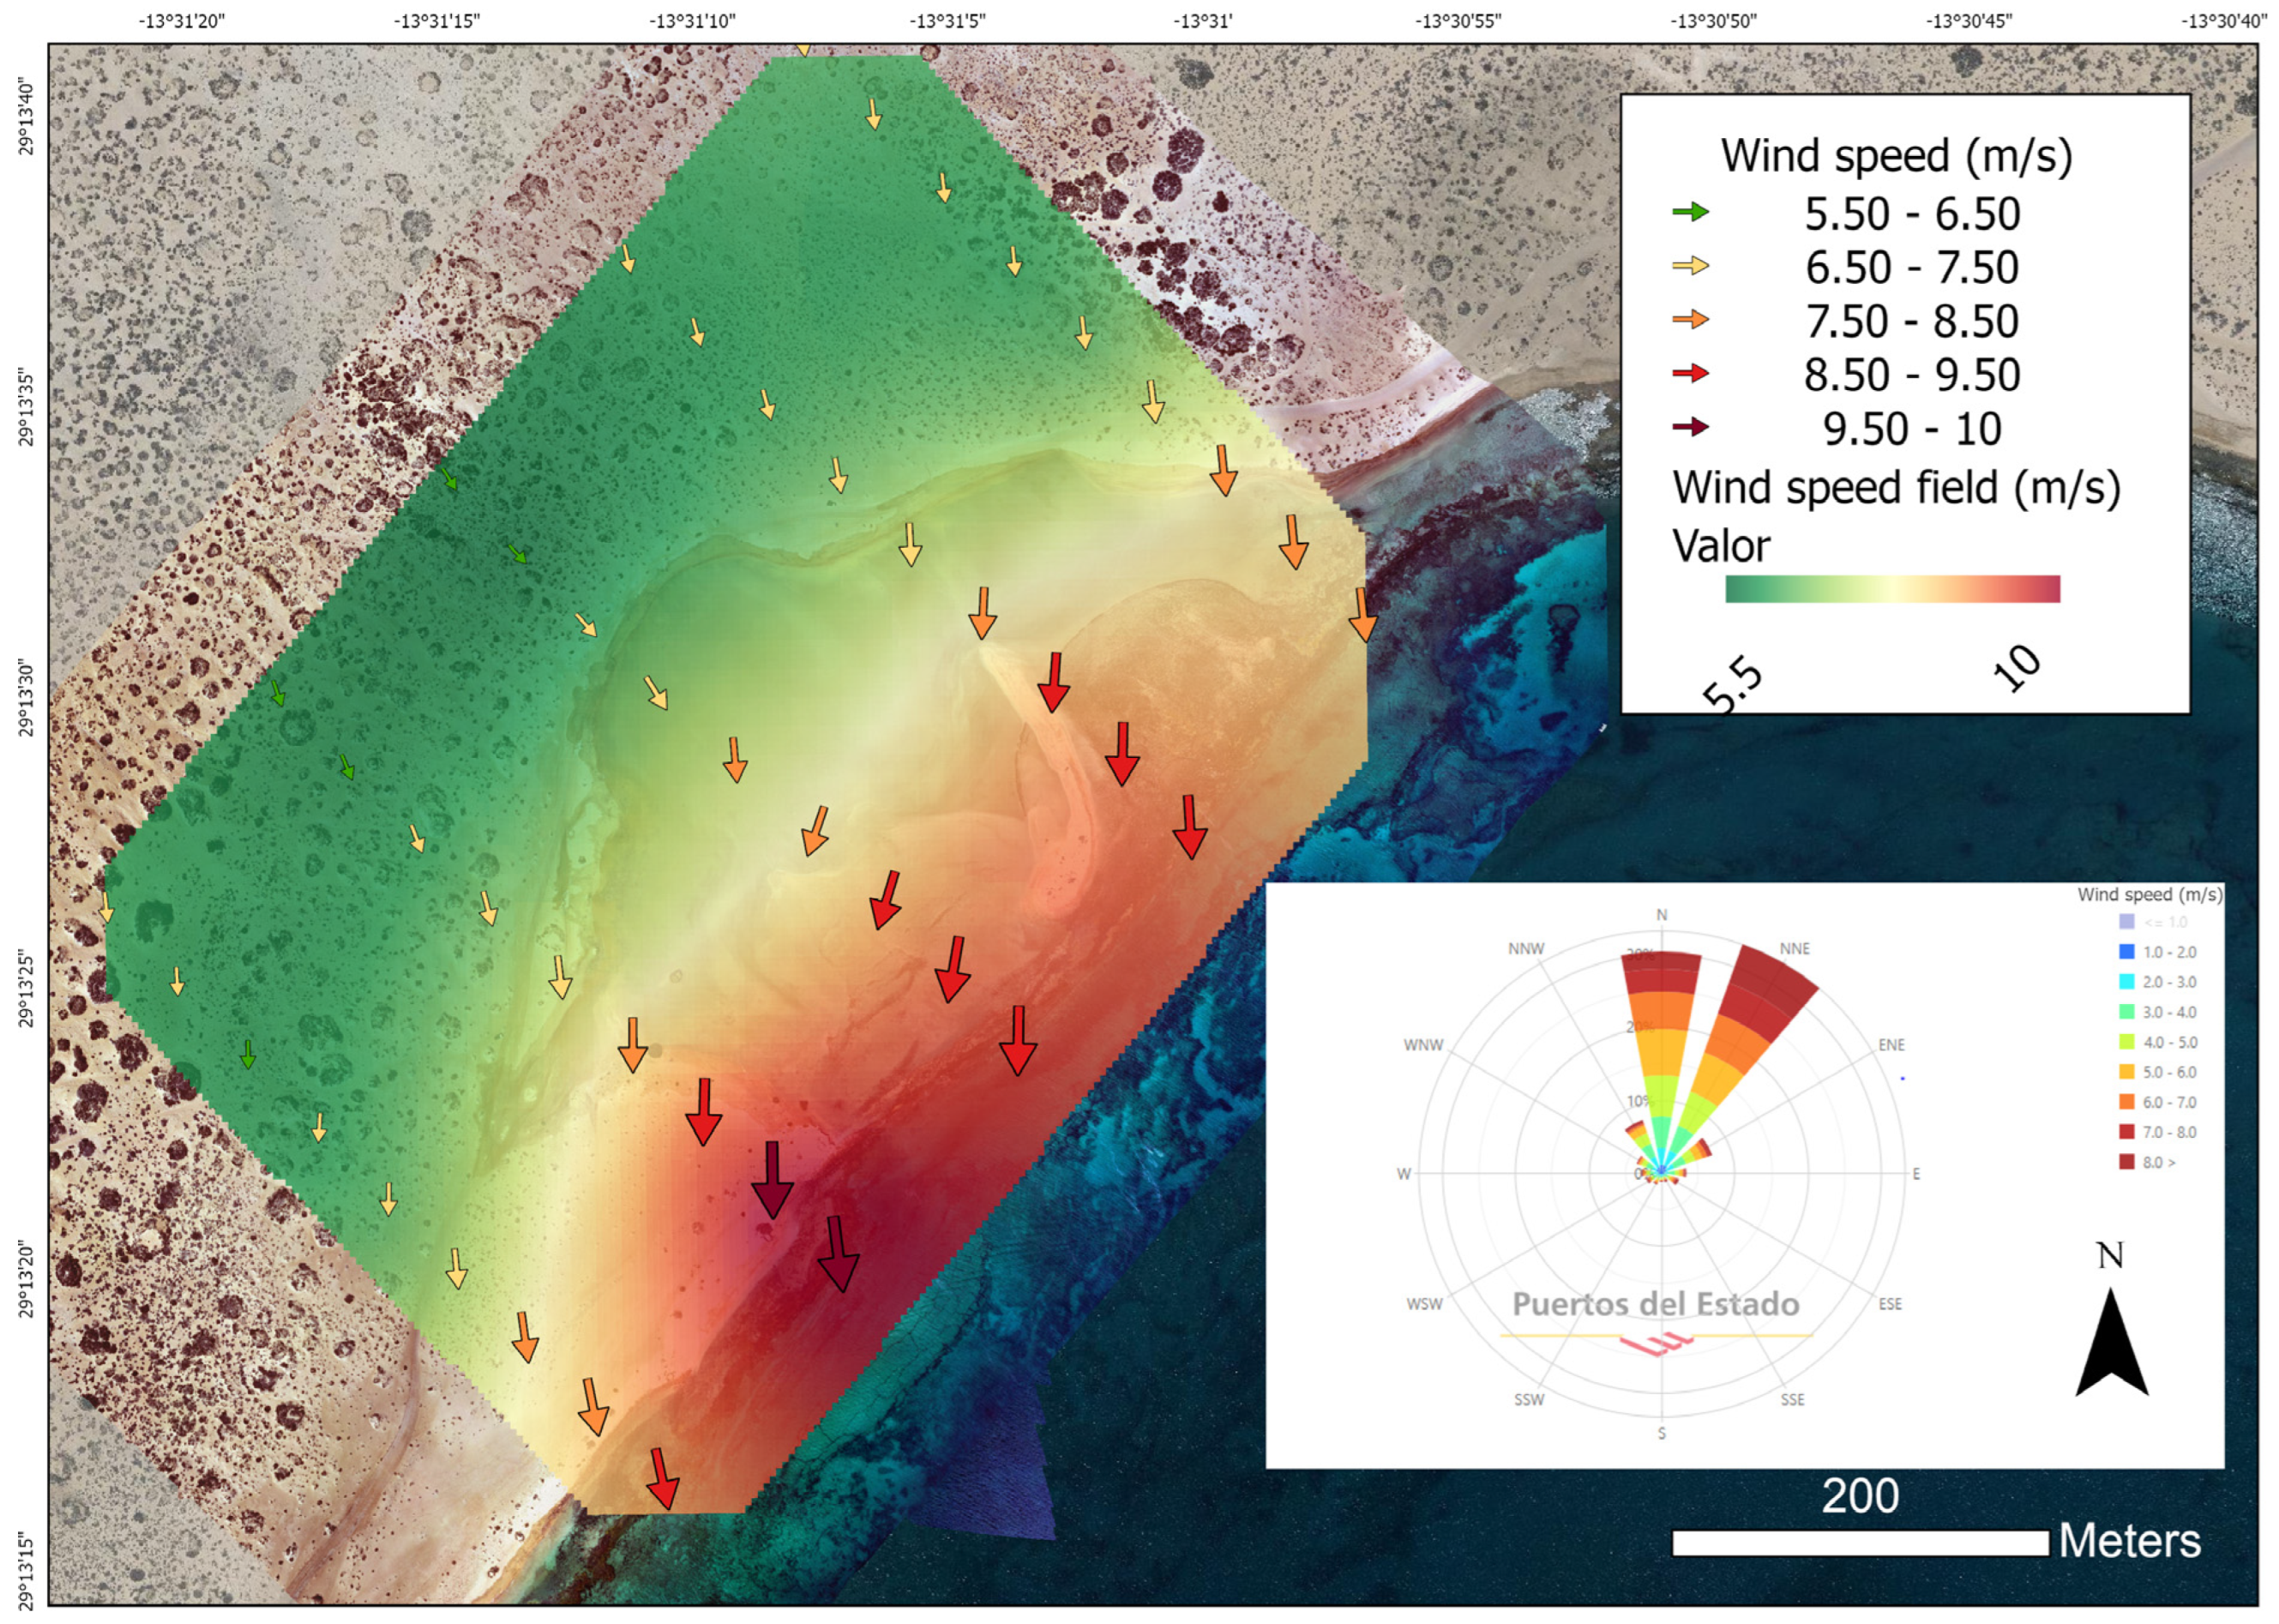
To this end, a field campaign was conducted on 17 and 18 September 2024, capitalizing on the equinoctial tides and high tide maxima (1.5 m). During the field campaign, data were collected for altimetric modeling, sediment samples were collected for granulometric characterization in the laboratory, and wind speed and direction data were recorded at strategic locations in the study area (Figure 4).

3.2.1. Altimetric Models

Comparisons of altimetric data around the coastal lagoon have been used to detect interannual transformations in the sink zone. A comprehensive altimetric analysis was conducted utilizing Digital Elevation Models (DEMs) of Differences (DoDs), in conjunction with a substantial spatiotemporal volumetric analysis. This approach was employed to detect interannual transformations within the study area encompassing La Graciosa Island. The aforementioned LiDAR series was completed with the LiDAR flights available through the GRAFCAN shop (public company of the Canary Islands Government) for the years 2010, 2011, 2014, 2018, and 2020. In order to accomplish this objective, the .LAZ files were decompressed, converted to .LAS format, and finally incorporated into their respective datasets. The point cloud was filtered using code 2, which corresponds to “Land” according to the American Society for Photogrammetry and Remote Sensing (ASPRS) classification. Using LAS format dataset conversion to raster and IDW interpolation algorithms, homogeneous DEMs with a 2 m spatial resolution were finally obtained for the sedimentary coast under study for the years indicated above. This resolution is explained by the lowest density of points in the data obtained, that is, 0.5 points/m2, which implies an average of one topographic elevation every 2 m2. Finally, erosion and accumulation volumes were also calculated between 2009 and 2023 from the DoDs using the methodology (Geomorphic Change Detection software, version 6.1.14) developed by [72,73], where DoD error range (%) of the erosion: 7.45–12.34 and the accumulation: 7.55–10.9 from LiDAR data were obtained.
In addition to remote sources, during the course of the campaigns, low- and high-tide scenarios were meticulously documented through the utilization of an Unmanned Aerial Vehicle (UAV), namely the DJI Mavic 3E, equipped with Real-Time Kinematic (RTK) positioning technology, offering an accuracy of 1 cm + 1 ppm (horizontal) and 1.5 cm + 1 ppm (vertical). Flights were scheduled at an altitude between 40 and 50 m, and it was ensured that there was an 80% overlap between the photographs obtained so that digital terrain models could be generated through photogrammetric techniques using Structure-from-Motion (SfM) software [74,75,76]. Agisoft Metashape (version 2.2.1, Professional Edition) has been identified as a prevalent software solution within the domain of coastal geomorphology across various spatial scales [33,77,78]. Three-dimensional point clouds were generated from the superposition of the images, from which digital terrain models and orthophotos were derived with a spatial resolution of 0.05 m. Adjustments in the software for photo alignment were high (>95%), while mean errors were less than 0.003 m.

3.2.2. Collection of Wind Data

Four wind data collection stations were utilized concurrently. The stations are composed of a wind vane and anemometer, located 0.4 m above the ground, and a data logger with wireless communication to record data every 2 s [79]. The collection of data on wind speed and direction at nine sampling points, installed in the intertidal and upper beach of the study area, was undertaken by these stations (Figure 4). During the process of data recording, one station was maintained in a fixed position at the upper intertidal zone and remained unobstructed during the entirety of the data collection process, thereby serving as a control element. For the collection, three periods of simultaneous data acquisition were conducted for a duration of 20 min at each designated position. These data were then subjected to an aggregation process at 30 s intervals, thereby yielding mean values that could be spatially compared across the designated periods. The mean values were then subjected to normalization, whereby they were adjusted to align with the means obtained at the control station for the corresponding period. The utilization of normalization facilitated the establishment of a basis for comparison between the various temporal periods during which data collection took place within the study area [80]. The operation of the system dictates that the data recording must be synchronous for all stations; consequently, the entire study area was covered in three series of records throughout the campaign.

3.2.3. Collection of Sediment Samples and Laboratory Analysis

A total of 15 samples of sediment were taken (Figure 4). Approximately 400 g of surface sediment was collected at each point using a shovel and placed in labeled plastic bags. The location of the sampling points was determined by GPS. The samples were then taken to the University of Las Palmas de Gran Canaria (ULPGC) laboratories for granulometric analysis.
Initially, the samples were subjected to a washing process to eliminate any organic matter and salts that could potentially compromise the accuracy of the subsequent particle size measurements. The samples were washed in triplicate with distilled water, allowing the sediment to settle and removing the water using a suction tube to avoid losing the finest fractions. After the process of washing, the samples were subjected to oven drying at a temperature of 60 °C for the requisite duration. Subsequently, the samples were subjected to cooling and stored in labeled bags.
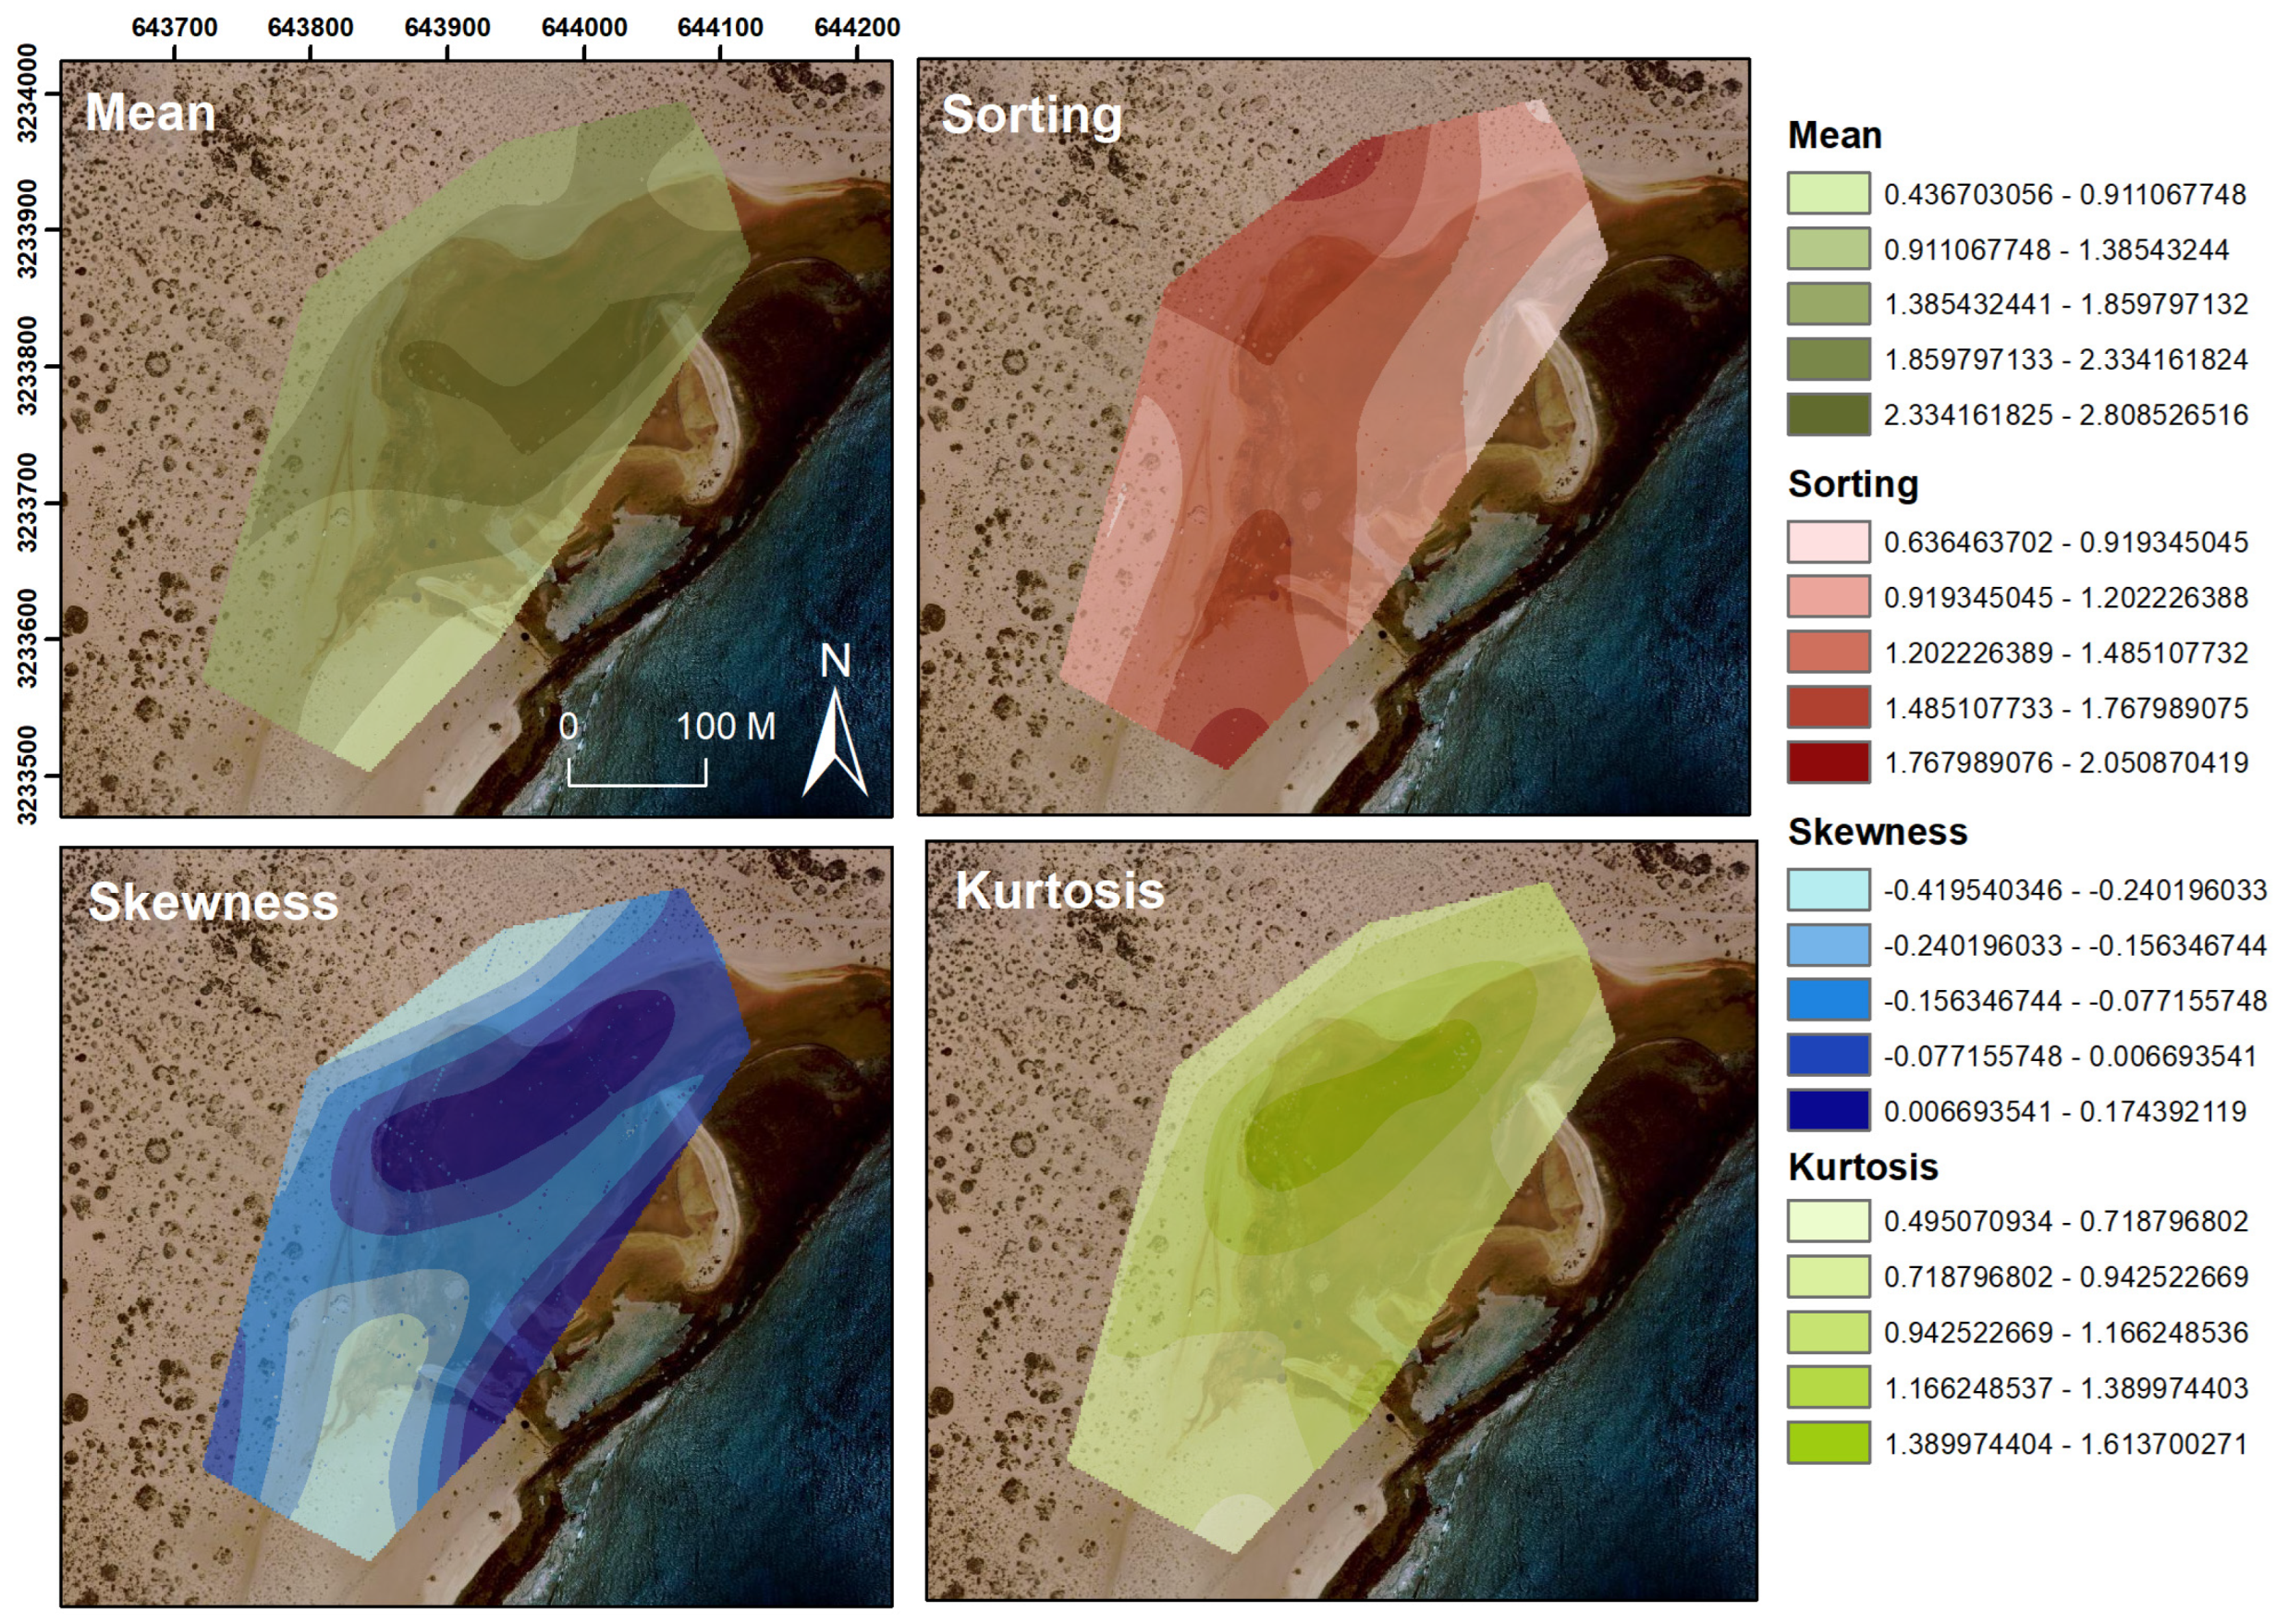
The sieving of the samples for particle size analysis requires 100 ± 20 g of sediment, which must be quartered in advance to ensure its representativeness. The weight of the initial amount of sieved sediment was recorded with a precision balance. Subsequently, the material was introduced into a dry sieve shaker, which consists of a column of eight sieves, plus the bottom, with mesh size intervals of each Φ ranging from 8 to 0.063 mm. The sieving process was conducted for a duration of 10 min, with each cycle lasting 5 s. Following the process of sieving, the sediment retained on each sieve was weighed on a precision balance. The subsequent analysis of the results was conducted utilizing the GRADISTAT program [81], with the objective of deriving the most pertinent parameters. The characteristics of these parameters are based on the geometric method of [82].

4. Results and Discussion

4.1. Long-Medium Term

4.1.1. Shoreline Variation and Morphological Evolution

Costa Fragata-Ponta Preta (Sal)—Cabo Verde
The aeolian sedimentary system of Costa Fragata was historically used as a source of fuelwood for domestic consumption, likely representing the first recorded anthropogenic use of the system, and there is little evidence of other exploitations during this period. The small local population suggests that fuel extraction was a marginal activity, primarily associated with household use.
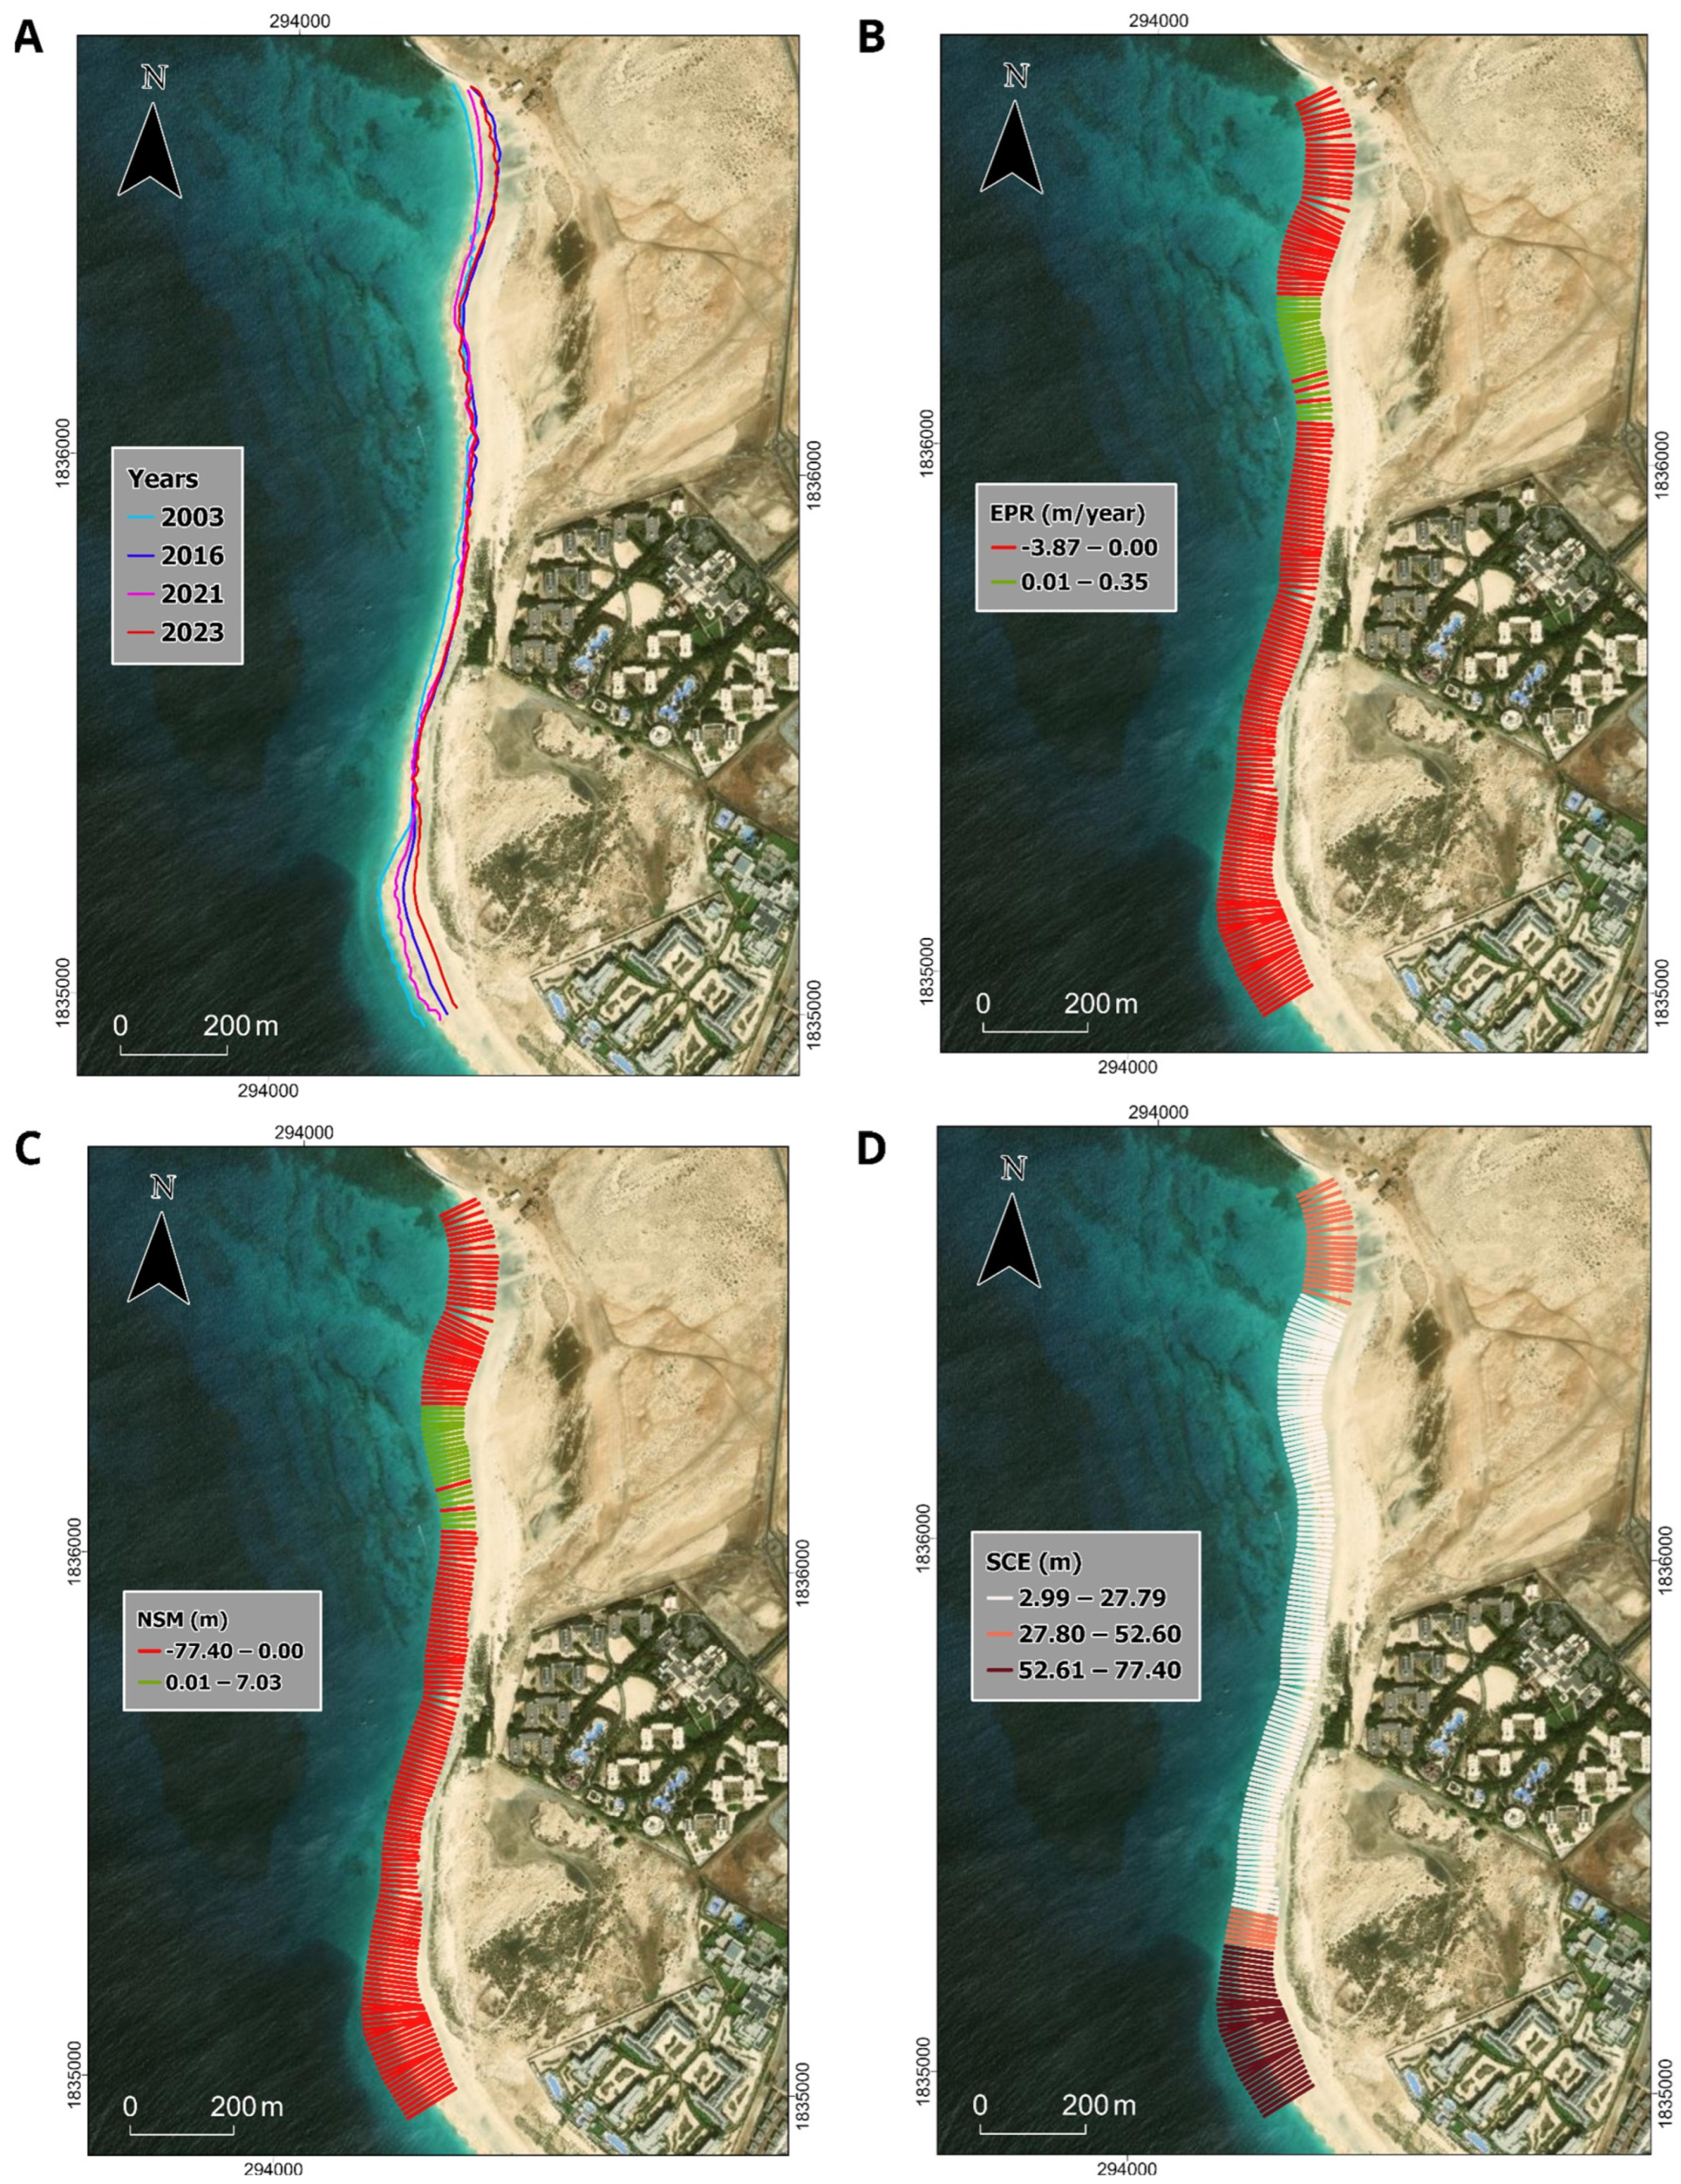
The EPR (End Point Rate) demonstrates intense and persistent erosion in the southern sector, with an average rate of −1.29 ± 0.71 m/year and reaching −3.87 m/year where shoreline retreat is most critical. Whilst the majority of the coastline exhibits intermediate erosional values, a limited section displays relative stability or localized accretion (maximum 0.35 m/year) (Figure 5B). A similar pattern is observed for the NSM (Net Shoreline Movement), with highly negative values in the urbanized southern sector (−77.40 m), contrasting with a central section showing relative stability (Figure 5C). The SCE (Shoreline Change Envelope) highlights that the southern sector appears most eroded, with the highest values of shoreline mobility (52.61 to 77.40 m), while the rest of the coastline shows lower variability (Figure 5D). Altogether, these indicators reveal a heterogeneous morphodynamic response along the coast, likely shaped by a combination of sediment availability, wave exposure, and human pressures such as urbanization, but it shows a clear erosive trend (Figure 5A).
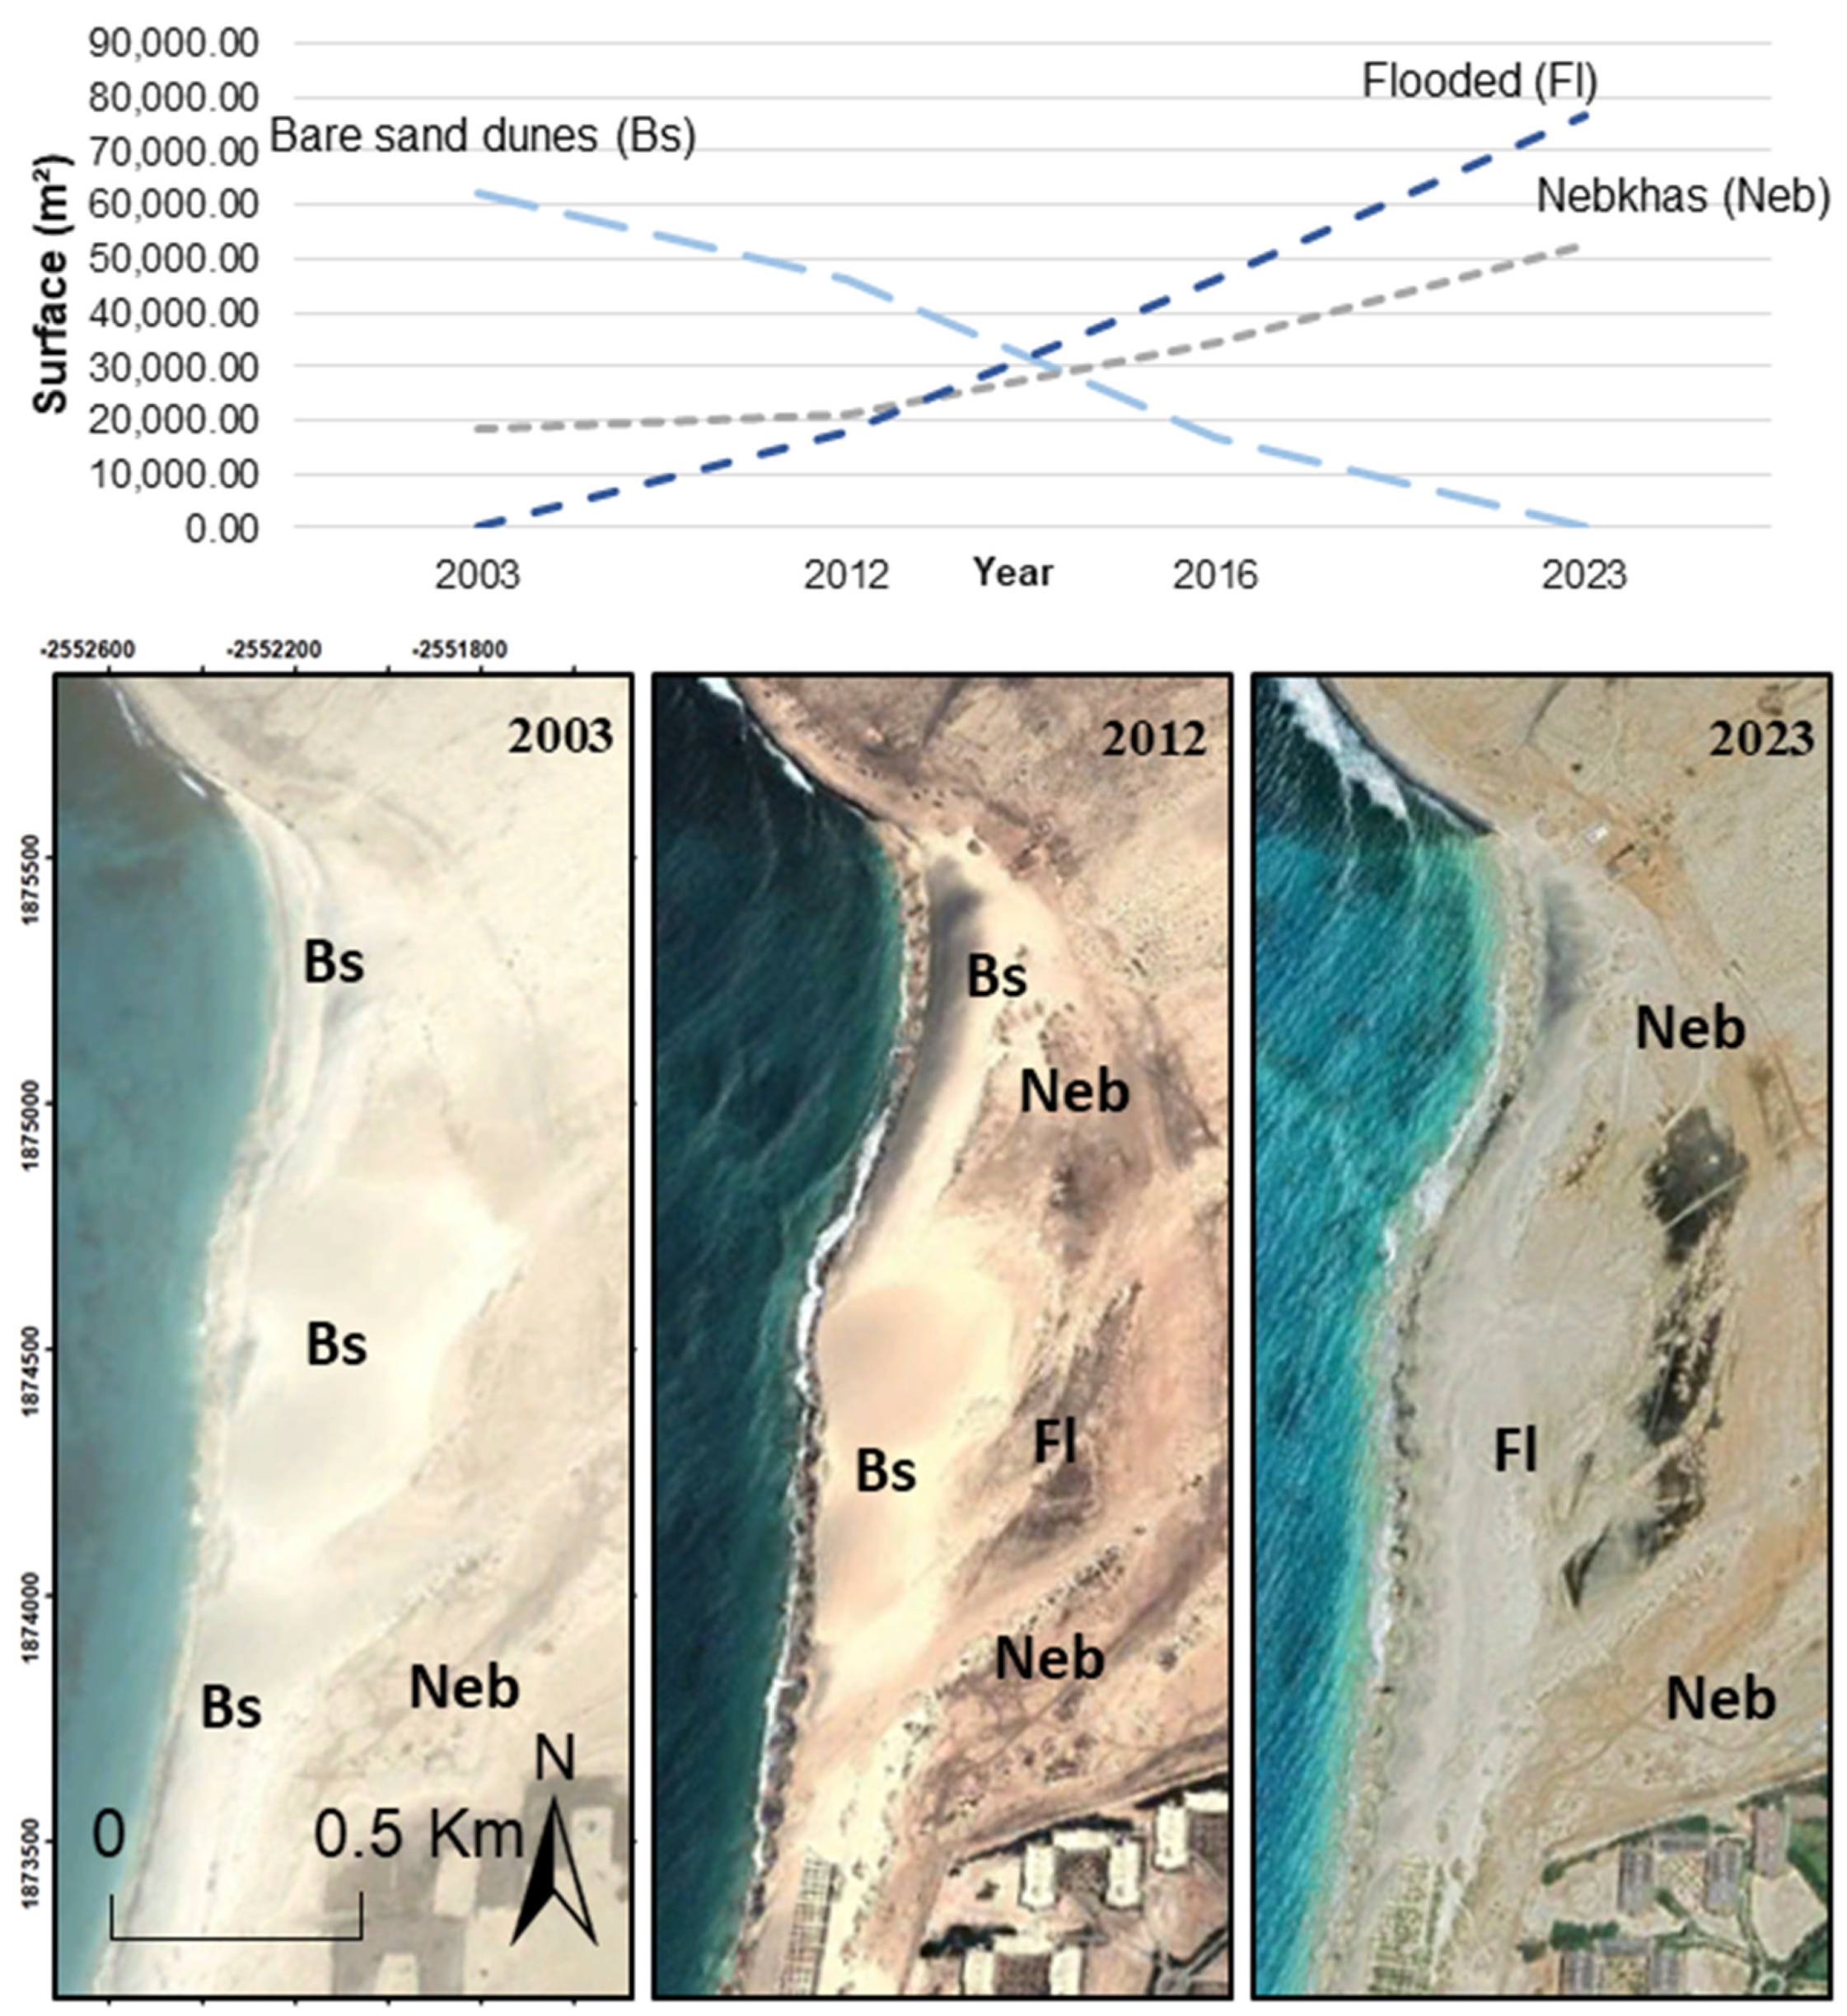
The first significant impact on the system is linked to the development of salt pans, which occupied a substantial portion of the dunes and psammophilous vegetation. Large salt ponds were excavated for their construction, and it is likely that the extracted sand was deposited nearby and subsequently transported by wind toward the Punta Preta area through the sand corridor. This process may have generated notable accumulation in that sector and the formation of slip-face dunes, which are now almost entirely lost (Figure 6). However, precise spatial information regarding changes prior to 1952 is lacking, the year of the earliest available aerial photographs. By that time, the salt pan area covered 1.35 km2; it later increased to 1.51 km2 in 1978 before declining to the current 0.62 km2. This reduction is primarily attributed to economic factors linked to the rise of the service sector, although the construction of tourism infrastructure caused the most drastic interruption of the connection between the dune system and the beach.
These results support and are comparable to a phenomenon which has been observed in the Ponta de Praia de Cabral and Ponta Varandinha sectors on the island of Boa Vista (Cabo Verde), where the sink zones of the aeolian corridors described by [23] are located, and in the downwind direction of the urban-tourist development of the island’s capital (Sal Rei). In this regard, ref. [24] detected a 4 m retreat of the coastline as the most consistent indicator between 1968 and 2010.
Additionally, sand extraction has contributed decisively to the current sediment deficit and exerted a considerable impact on the system. Between 2003 and 2023, the area of bare sand dunes decreased from 0.06 km2 to complete disappearance, while the extent of flooded areas increased to 0.08 km2 and nebkha-covered surfaces reached 0.05 km2 in 2023. According to oral sources, these activities were carried out intensively, resulting in the uprooting of adult specimens of Tamarix senegalensis and the removal of large volumes of sand from the area. At the sediment entry point, a toll booth was present, and it is recalled by local residents that there were extensive queues of trucks engaged in the extraction of materials for the construction of tourist infrastructure.
Maspalomas (Gran Canaria)—Canary Islands
The Maspalomas dune field has undergone a comprehensive transformation since the 1960s, which is associated with the urban tourist development of the island of Gran Canaria [38,83]. The original sedimentary dynamics have been modified by urbanization in the surrounding area of the dune system. This has resulted in alterations to the speed and direction of wind-blown sediment transport [40,41], as well as the stabilization of mobile dunes [43]. Whitin the system, various actions associated with human activity have had a significant impact on the natural dynamics of the space, leading to the generation and perpetuation of areas of deflation in the foredune of the sand source [32,33], artificially stabilizing the beach profile [27] and leading a notable reduction in the populations of species that are key to dune formation [34]. The consequences of these actions have resulted in observable effects within the sink area of Maspalomas beach. A mid-term beach loss and trend of shoreline retreat have been documented in Maspalomas beach from 1961 [67], reaching losses of more than 100 m of retreatment under conditions of SSW-WSW storm events [26].
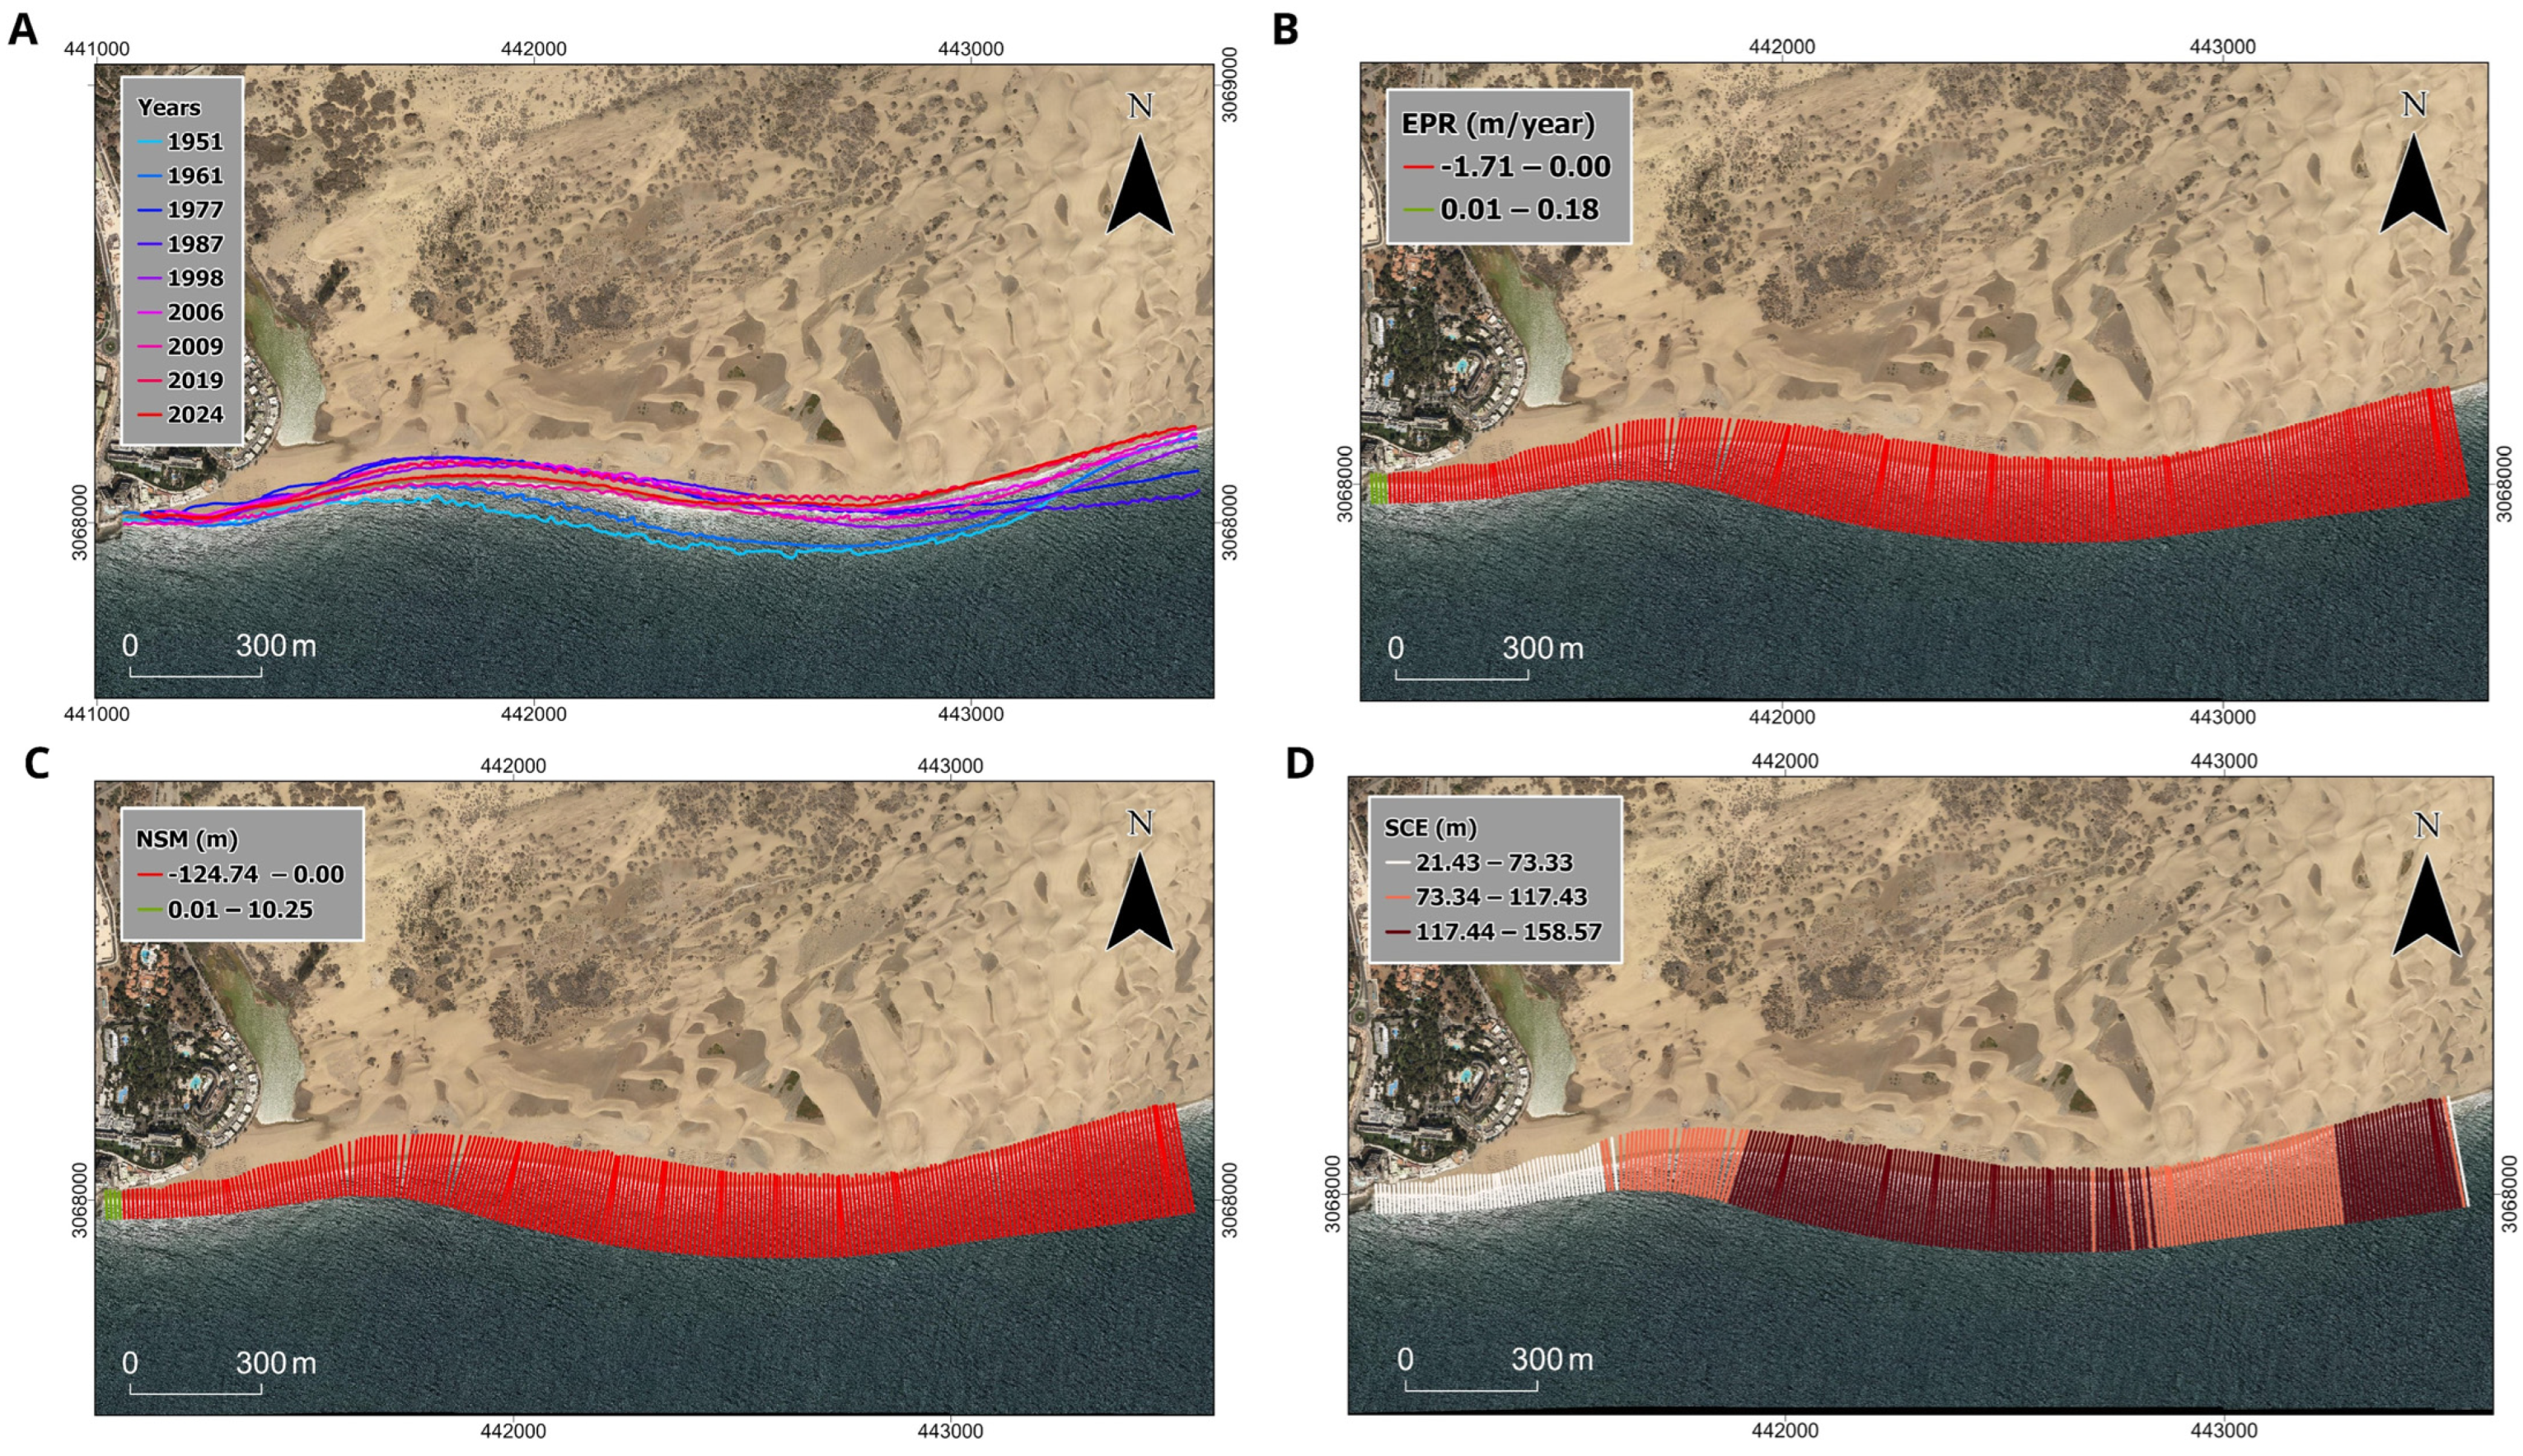
The analyses of coastline variation in the sink area of the system between 1957 and 2024 are consistent with the results of previous studies. The erosive trend observed on Maspalomas beach is substantiated (Figure 7), manifesting more prominently in the central section of the beach, where maximum cross-shore distances (SCE) of around 150 m were found, with more than 120 m of net retreat (NSM) between 1957 and 2024. The mean EPR is −0.95 ± 0.19, reaching more than 1.7 m of loss per year (EPR).
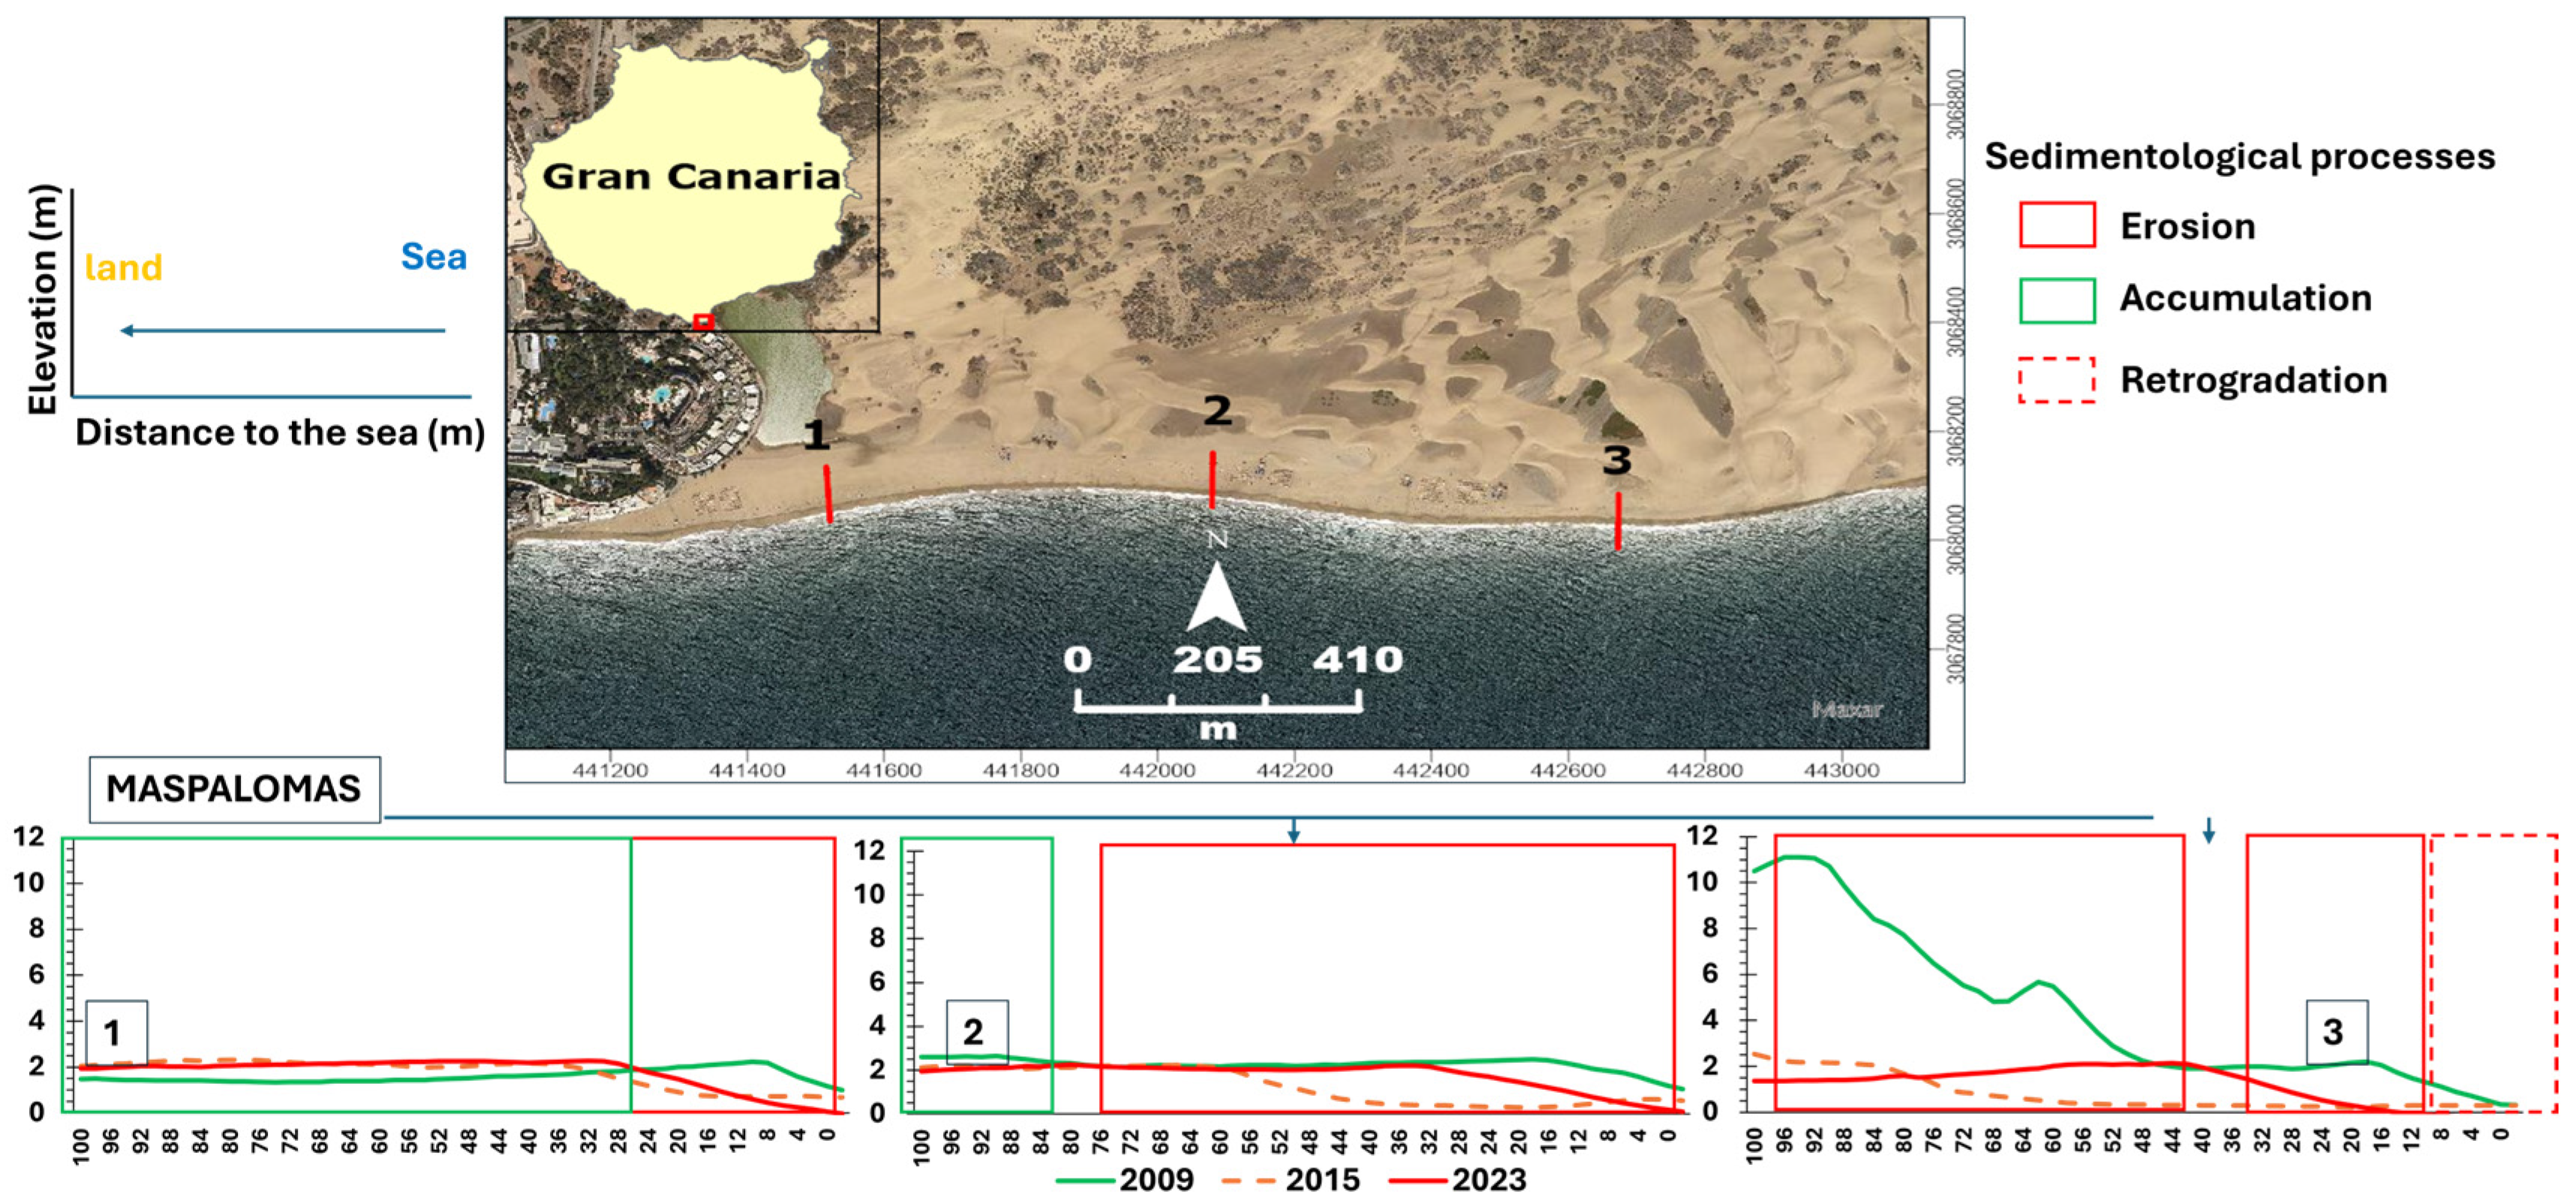
The LiDAR-derived coastal profiles from Maspalomas beach (Gran Canaria) reveal significant erosion across all profiles, leading to coastal retrogradation, although localized accumulations occurred intermittently (Figure 8). The analysis demonstrated that the central part of the Maspalomas beach (profile No. 2) is once again experiencing severe erosion. Profile No. 3 is particularly noteworthy in this regard, as it demonstrates the impact of erosion not only on the beach but also on the first dunes, which, in 2009, were over 10 m in height and appear to have disappeared by 2023.
Jandía (Fuerteventura)—Canary Islands
Historically, the Jandía Isthmus has been subject to significant anthropogenic pressures that shaped its sedimentary dynamics. According to [64], for nearly two centuries (1750–1950), intensive livestock grazing and the extraction of fuelwood for lime kilns led to the removal of vegetation cover. This process enhanced sand remobilization, triggering the progradation of lee-side dunes at sediment outlet zones as well as the advance of leeward beaches. The subsequent abandonment of these traditional practices facilitated vegetation recovery but coincided with the onset of sand mining activities to supply construction materials for emerging tourism infrastructure. Although aerial photographs indicate that erosional processes began prior to the establishment of hotels, the authors highlight that large volumes of sand were shipped to Gran Canaria, where they contributed to the development of coastal resorts [64]. Ultimately, the construction of hotels and a coastal road further exacerbated the pre-existing situation by creating physical barriers that hindered natural sediment transport.
The shoreline within the study area exhibits a predominantly erosive pattern over the analyzed period, although spatial and temporal variability is evident (Figure 9). South of the Costa Calma tourist complex, erosion is particularly pronounced, with beach retreat reaching 250 m—this being the sector with the greatest landward displacement. As a result, the sandbar has progressively migrated southwards, leading to a reduction in the lagoon’s surface area. The sandbar apex represents the most dynamic point along the coast, where the largest changes are recorded. Unlike the general erosive trend, this sector shows evidence of slight progradation, reflecting net sediment accretion. In contrast, the southernmost tip of the system reveals stability, as its shoreline position remains unchanged since 1956.
Quantification of coastal changes was carried out using digitized shorelines, allowing the calculation of surface area variation across the study period. Between 1956 and 2018, the coastal sector lost nearly 800,000 m2 of surface, equivalent to an average of 13,000 m2 per year. From a volumetric perspective, the mean sediment deficit was estimated at around 96,000 m3 annually, comparable to values reported by previous studies applying alternative approaches [60,61]. The cumulative sediment loss over the 62-year interval amounts to approximately 5.9 million m3. Overall, erosion dominates nearly the entire area, with the most acute impacts concentrated between the sandbar system and the mouths of the Pecenescal and other southern ravines. The sole exception to this widespread erosional behavior is the sandbar apex, where accretion results from the redistribution of sediments eroded from adjacent sectors. In this case, the EPR (End Point Rate) indicates an erosive trend, with strongly negative average values of −5.96 ± 0.21 m/year. This rate is found to be −11.95 m/year in the most erosive sectors (Figure 9B). This pattern is consistent with the NSM (Net Shoreline Movement), which records very high negative values (−800.58 m), (Figure 9C). These extremely high erosion rates are in line with those reported through alternative methodologies by [61]. Finally, the SCE (Shoreline Change Envelope) further highlights that the central sector of the lagoon is experiencing the highest erosion, showing the largest shoreline mobility (818.89 m), while the southern sector exhibits relatively lower retreat (Figure 9D).
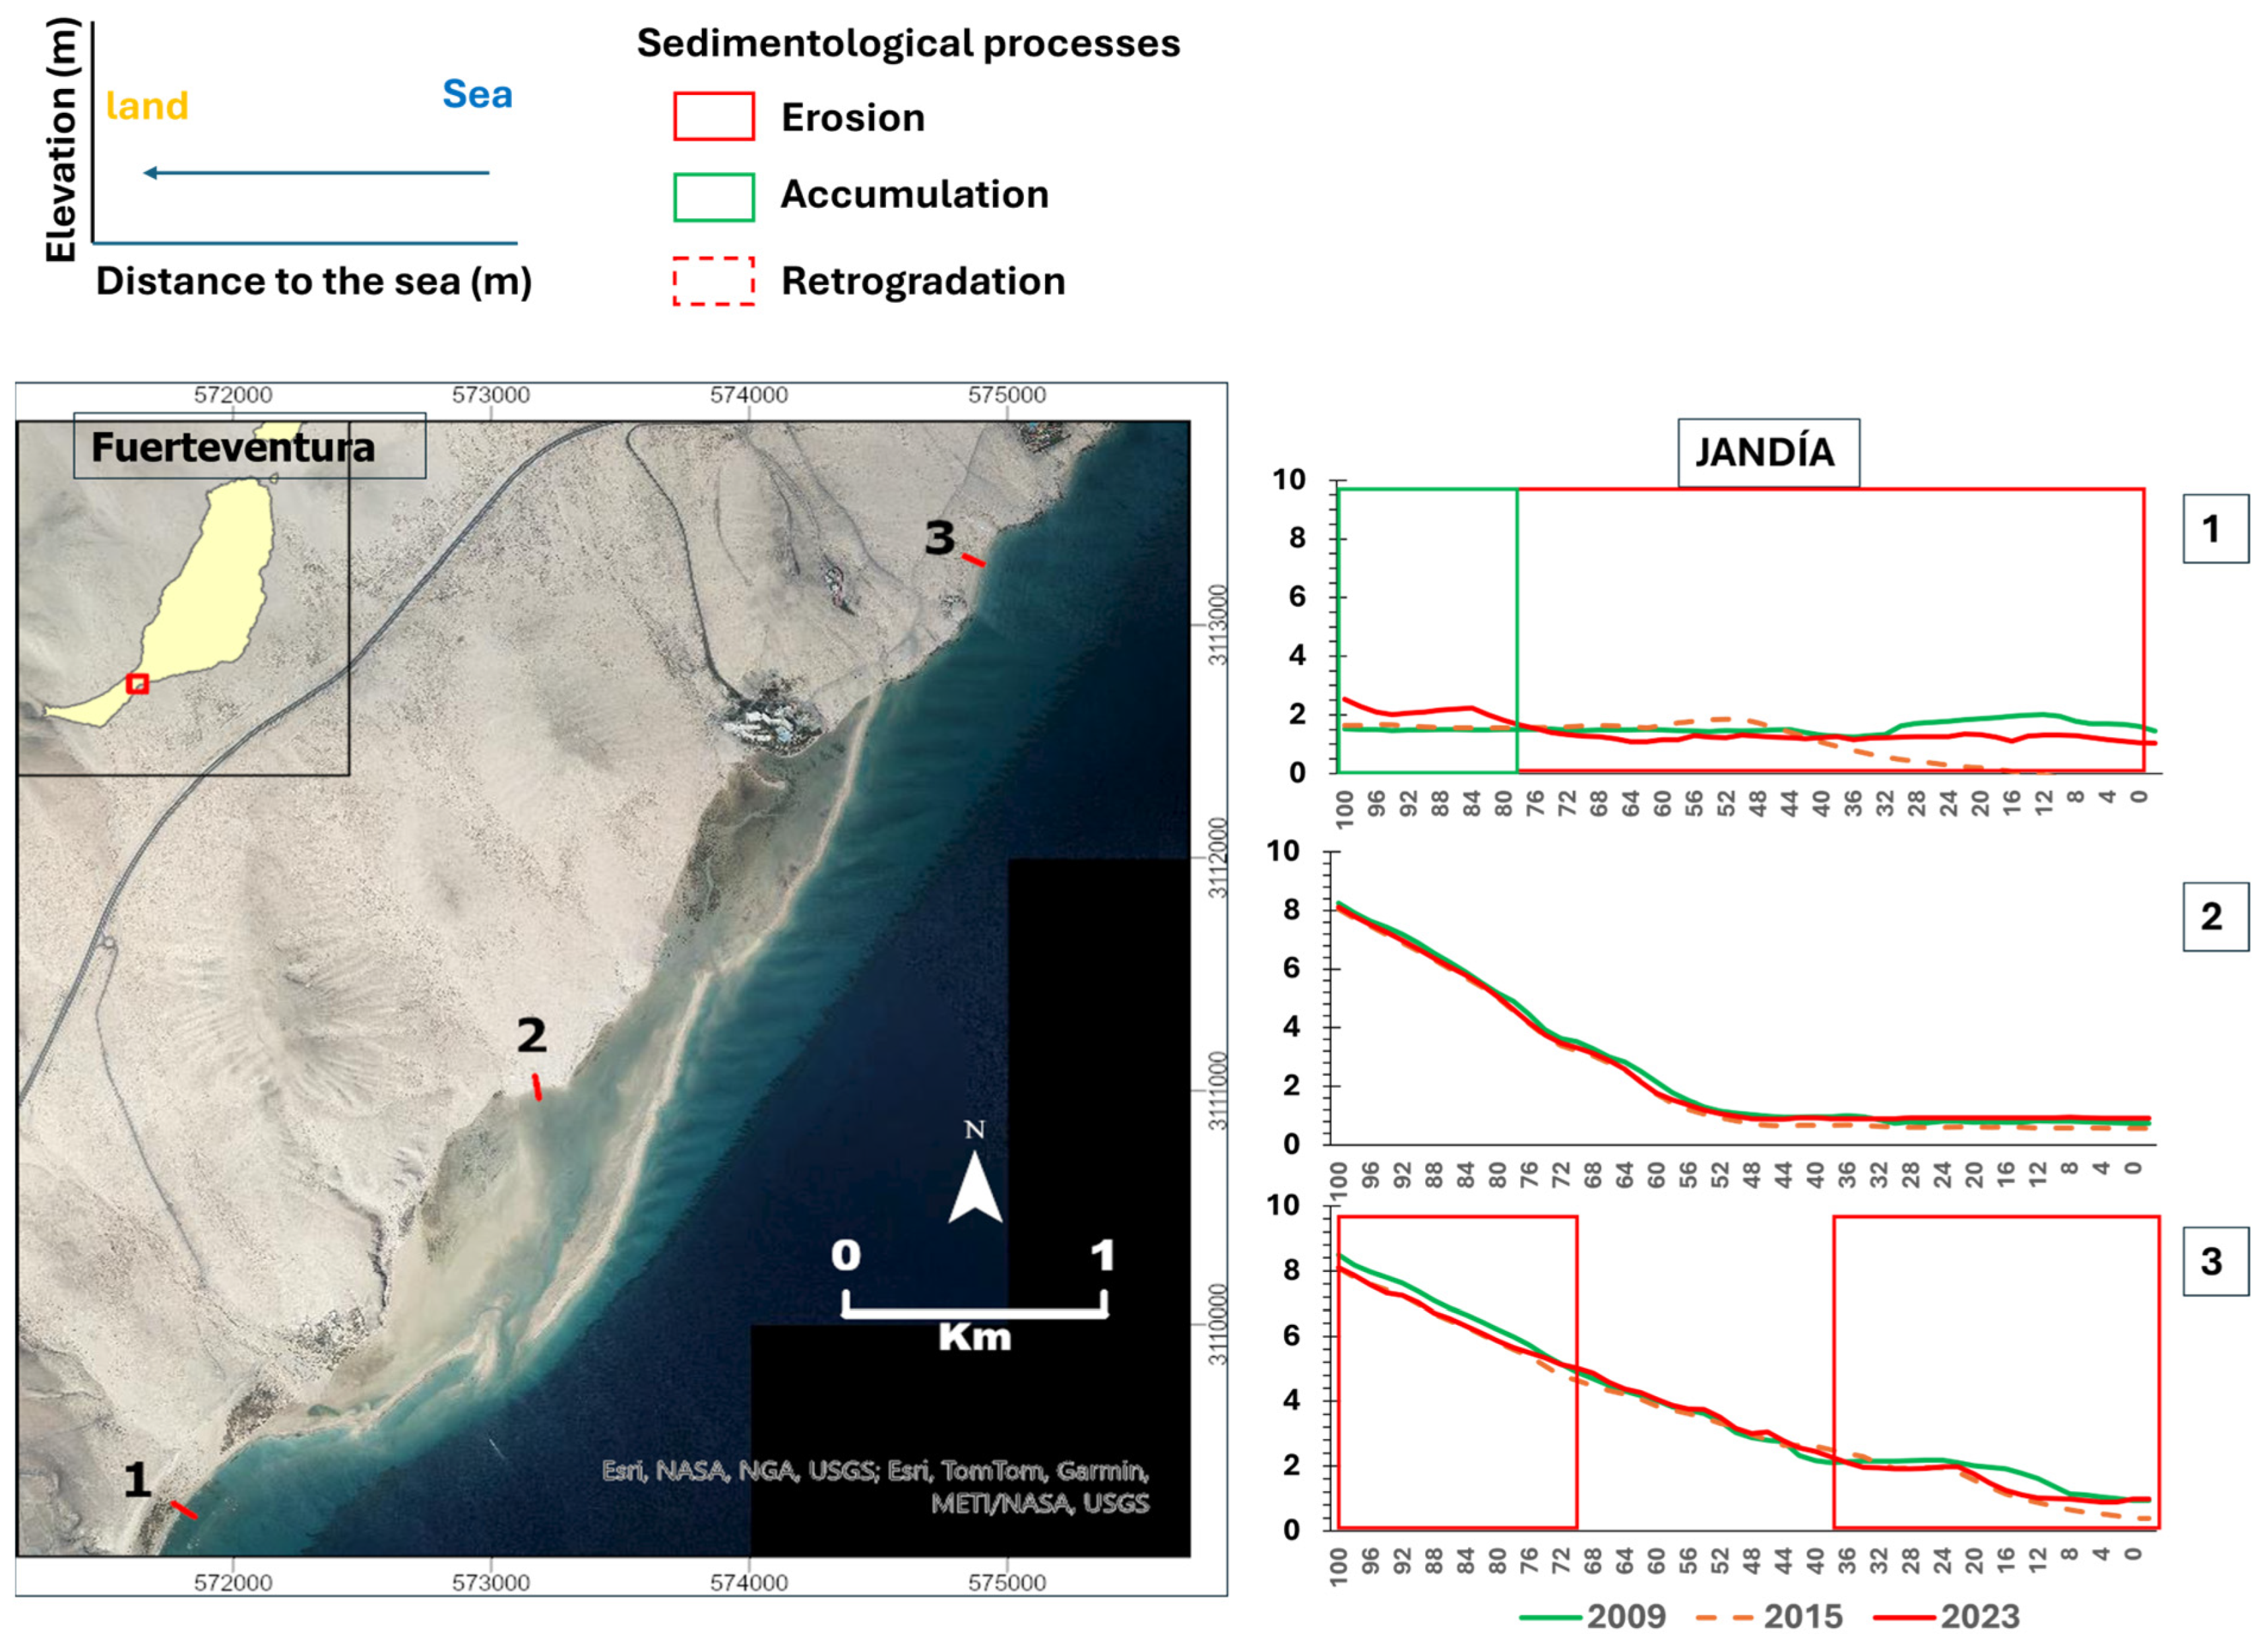
The LiDAR-derived coastal profiles from Jandía displays the most erosive behavior, with all profiles exhibiting shoreline recession and only minor short-term accumulations (Figure 10).
La Graciosa—Canary Islands
A detailed analysis of the evolution of the coastline in the sink area of the La Graciosa aeolian sedimentary system, extending from 1957 onwards, has been undertaken (Figure 11). This analysis has revealed the appearance and subsequent growth of a coastal lagoon, which is sheltered by a rocky coastal barrier. Ref. [66] proposed that the removal of vegetation for use as fuel triggered a remobilization of sand sheets in this area. The introduction of fossil fuels and the shift in the island’s economic activities during the 1960s led to the abandonment of traditional practices and the cessation of vegetation harvesting. Consequently, plant cover recovered, reducing sand transport. This historical process may have produced two possible outcomes: (i) progradation of the sandy shoreline in this sector, potentially infilling a previously existing intertidal lagoon, which is now recovering from past anthropogenic impacts; or (ii) shoreline progradation followed by the cessation of sediment surplus, leading to the emergence of the intertidal lagoon as a landform shaped by erosion.
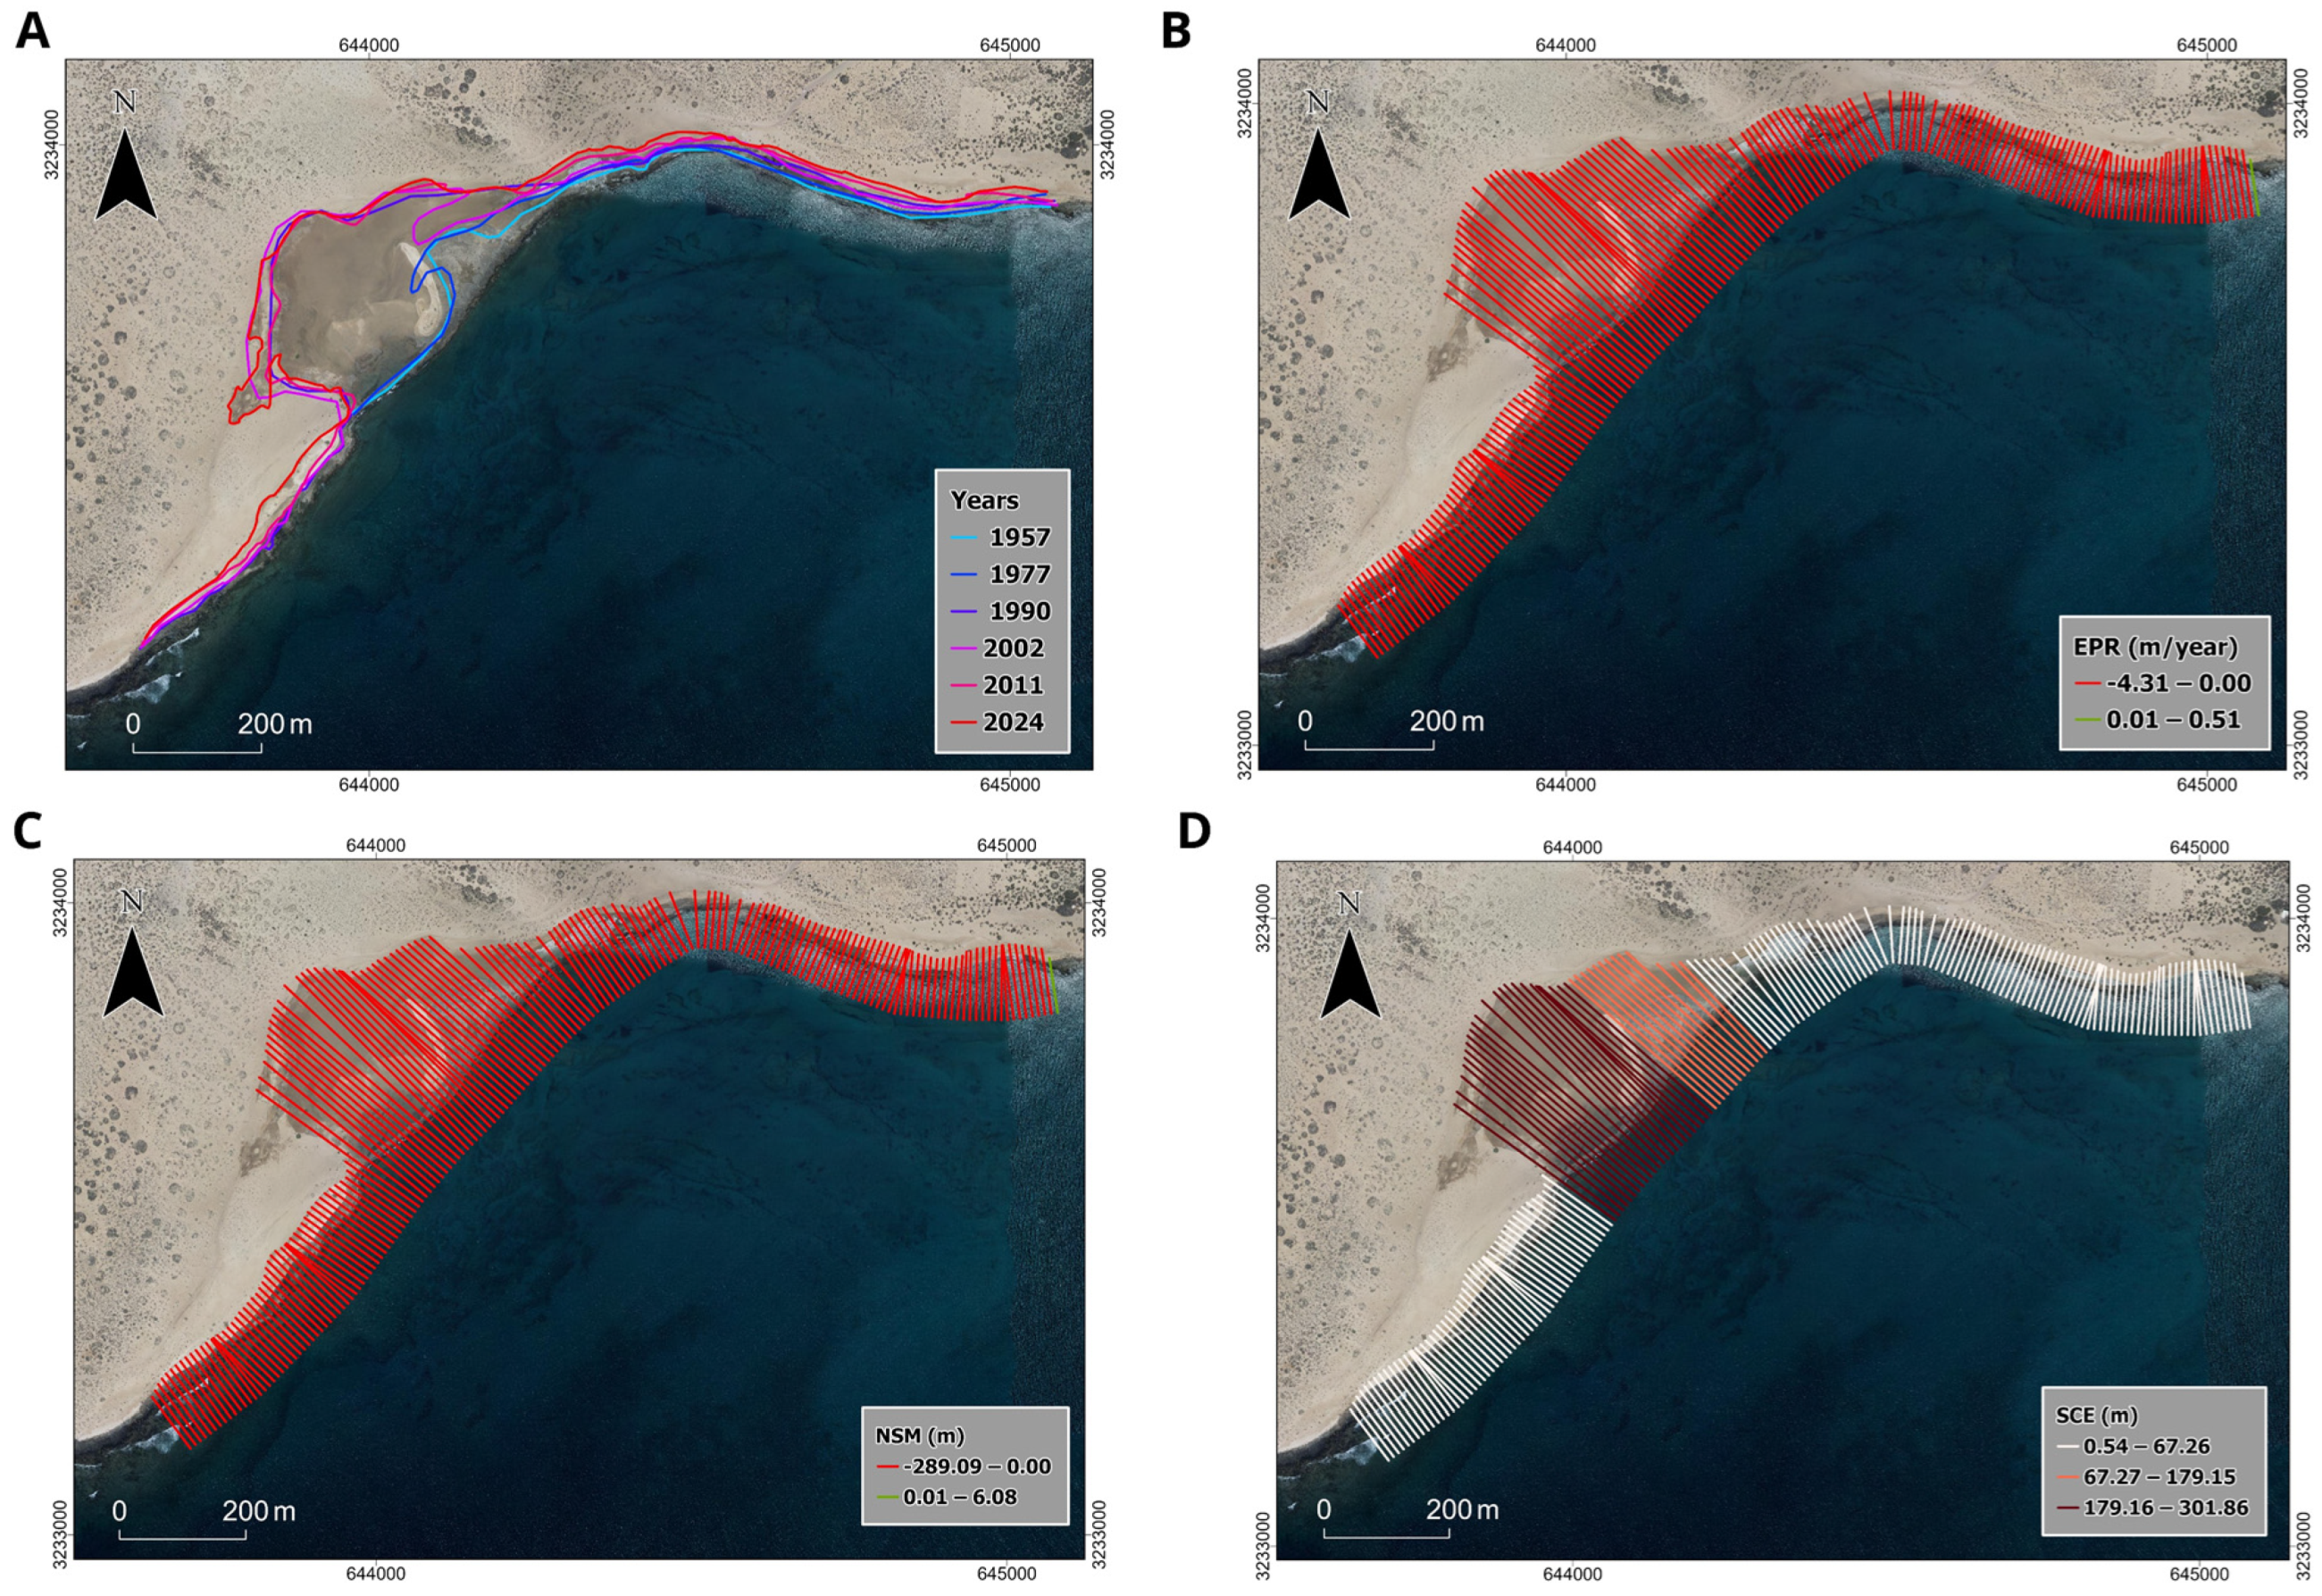
The intertidal lagoon area exhibited the most significant cross-shore variations during the study period, with maximum differences (NSM and SCE) reaching 300 m and erosion rates exceeding 4 m/year, with a mean rate of −1.28 ± 0.22 m/year. To the east of the lagoon, the significant coastal erosion dynamics previously documented by [84] persist, a consequence of both historical [66] and recent anthropogenic alterations [22]. These alterations can be associated with the effect of construction in Caleta del Sebo and the alteration of coastal dynamics due to the expansion of port infrastructure. In the southern region of the lagoon, alterations to the coastline are less pronounced due to the presence of a rocky substrate.
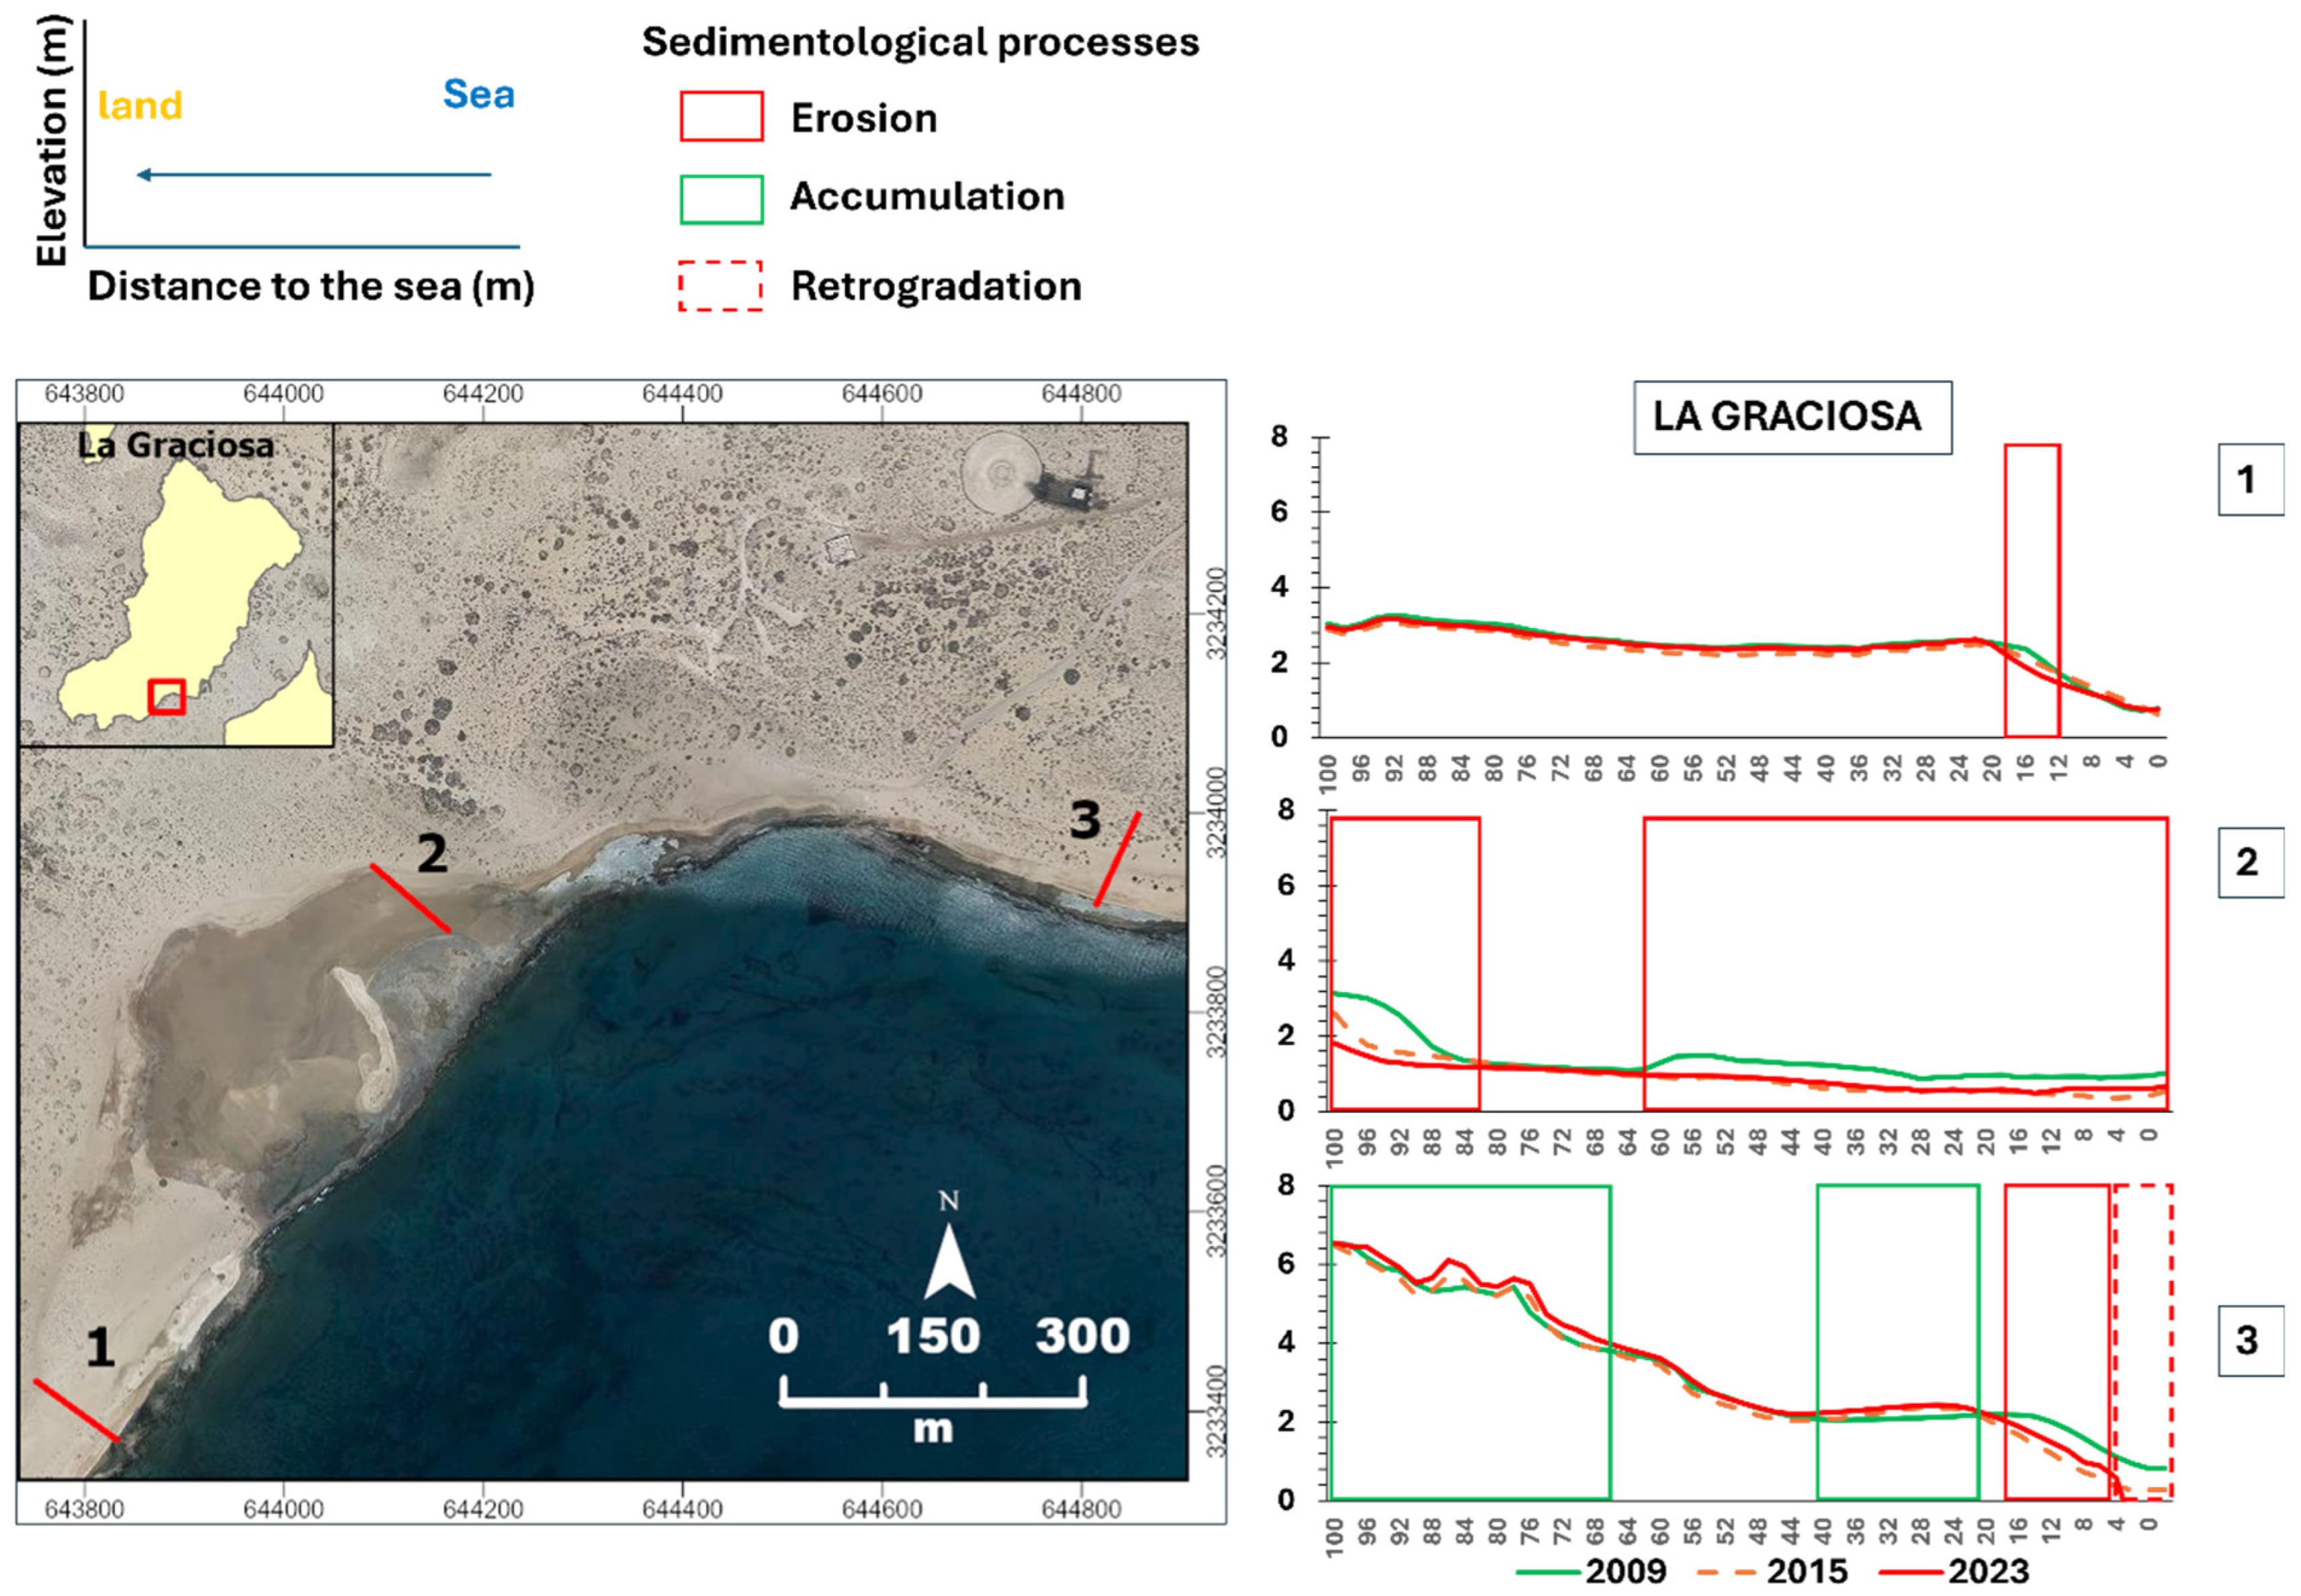
The topographical evolution of beach profiles derived from LiDAR in La Graciosa shows relative stability in certain profiles, yet erosion–accretion alternations indicate a gradual tendency toward retreat (Figure 12). Profile No. 2, situated within the lagoon, exhibits the most significant erosion, characterized by a reduction in the height of the dunes within its designated land limit and an augmentation in the floodable area.

4.2. Medium-Short Term. Sink Zone of La Graciosa Dune System

This section presents detailed results regarding the topographical evolution of the coastal lagoon formed in the sink zone of the dune system on the island of La Graciosa, as well as the characterization of its wind dynamics and sedimentology.

4.2.1. Topographical Evolution

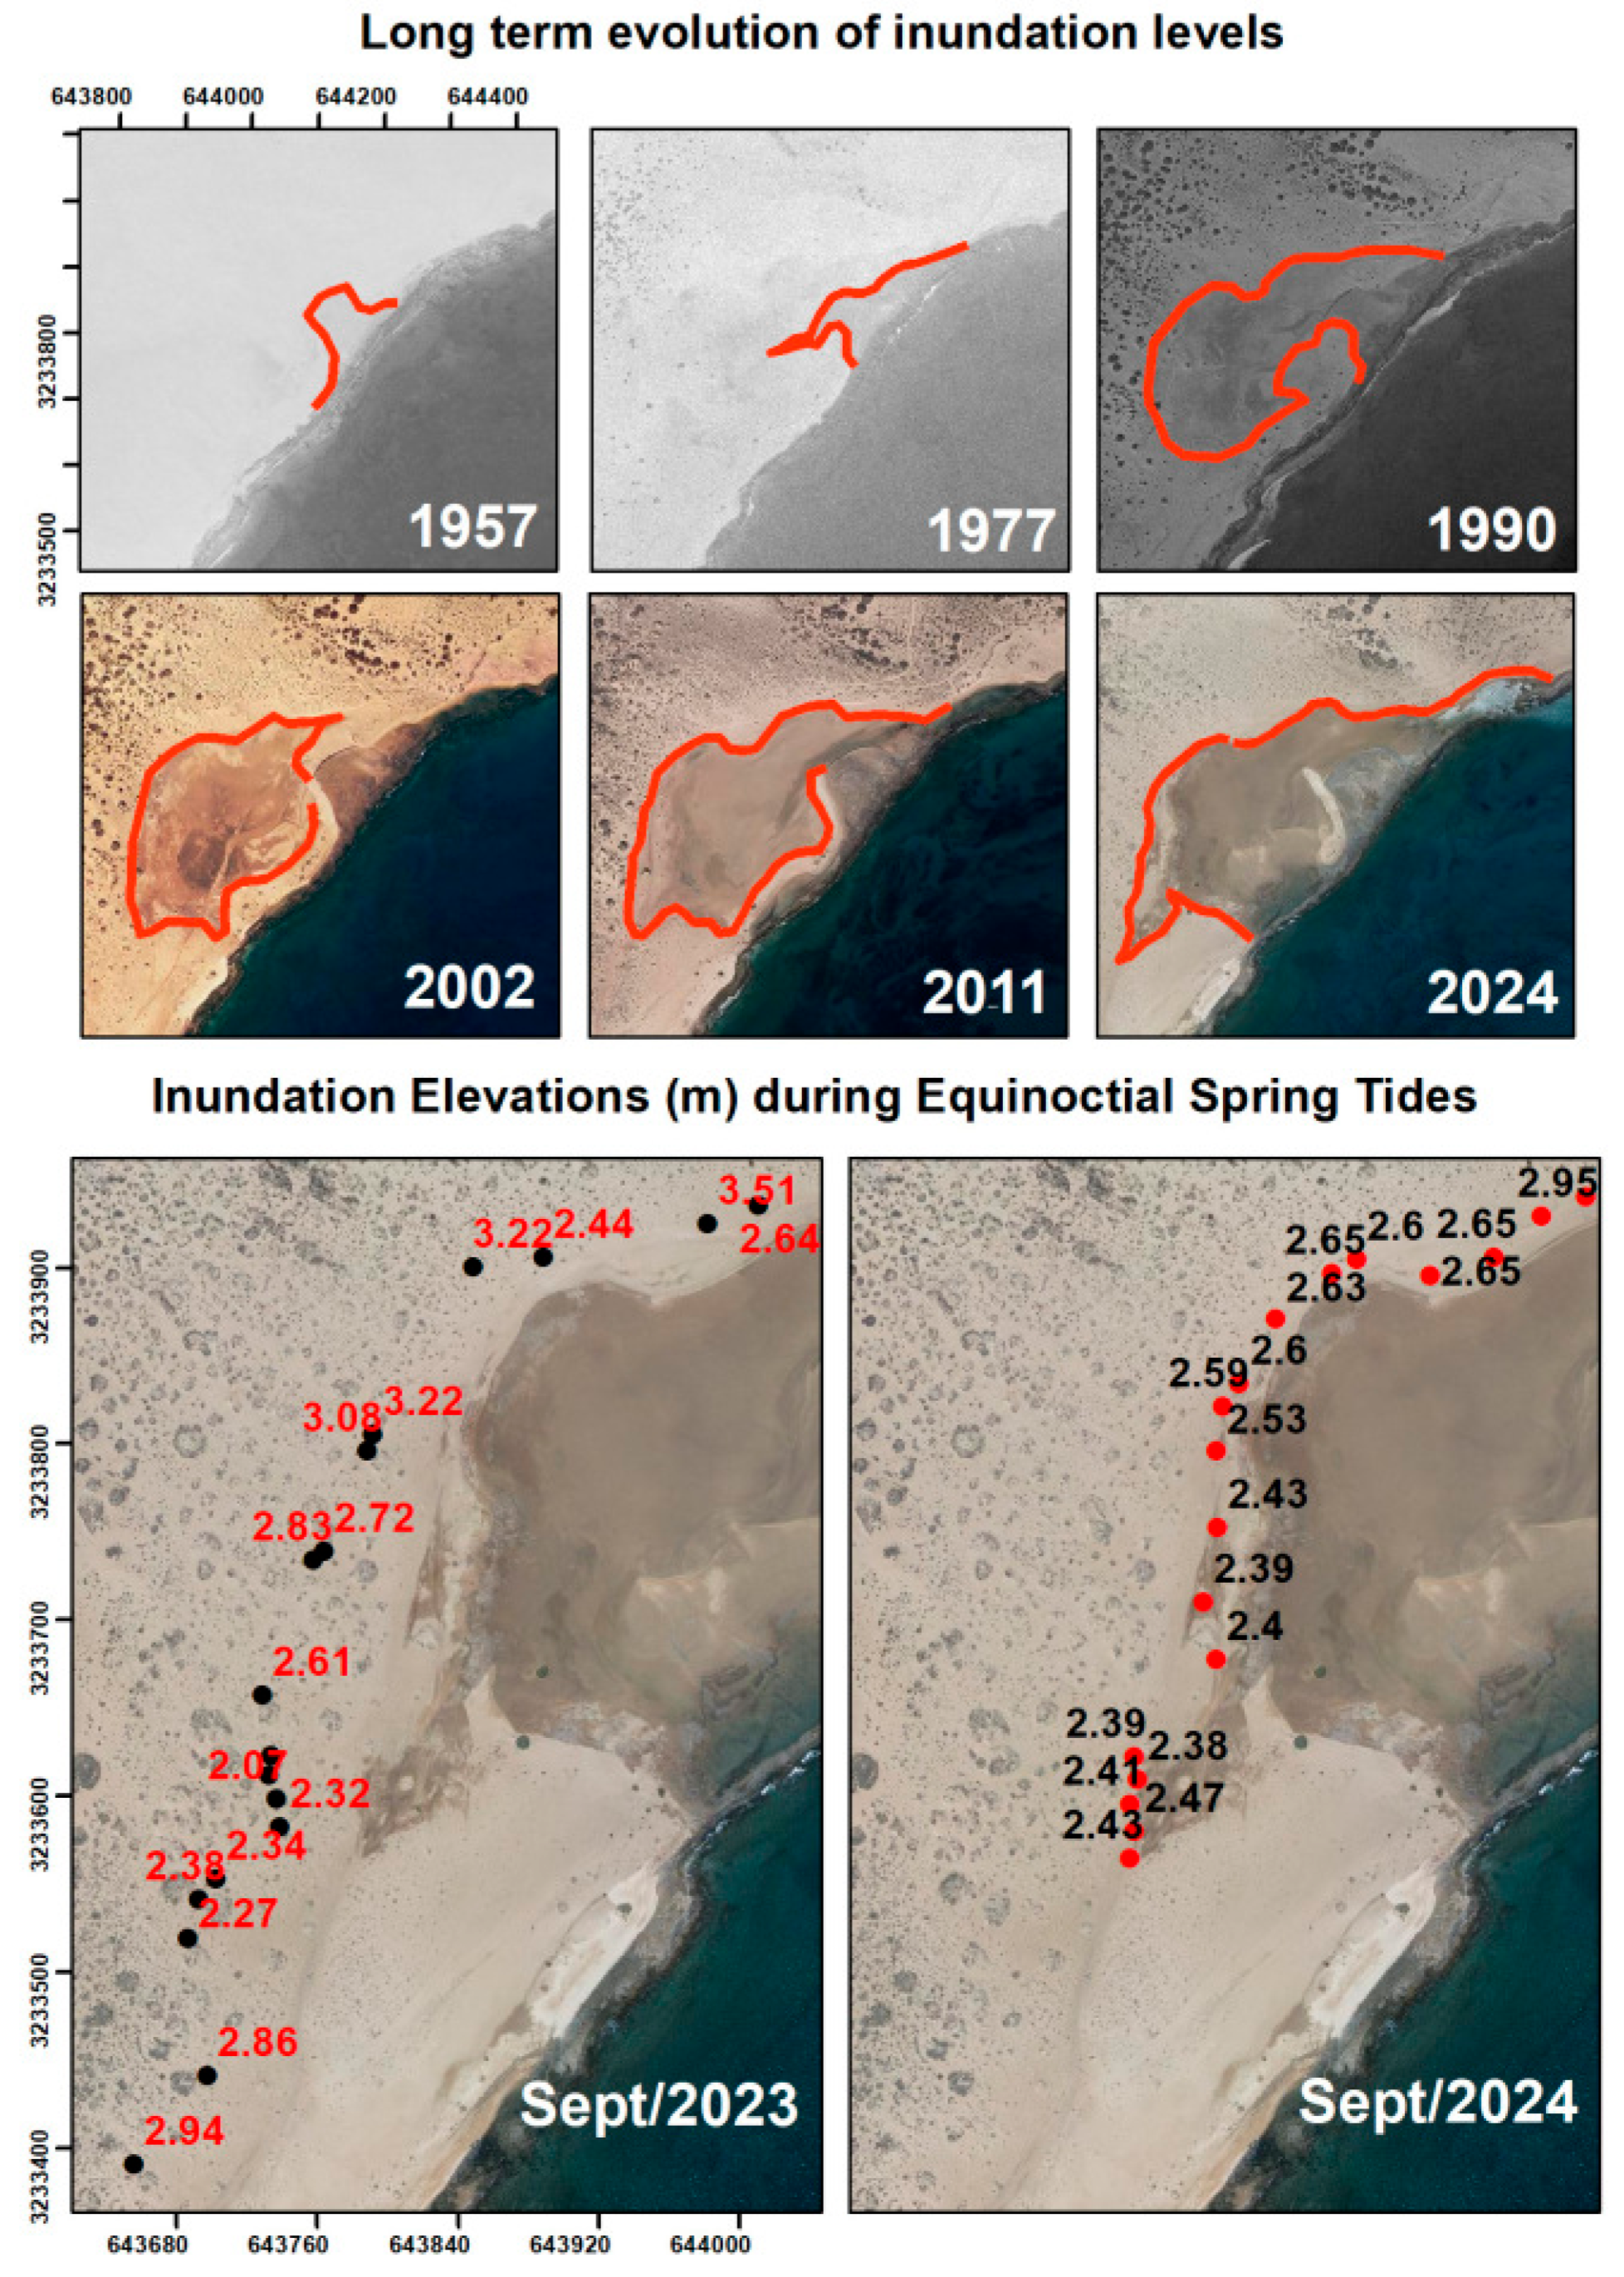
Aerial photographs from 1957 reveal the progressive erosional trend affecting the intertidal lagoon (Figure 13). This erosion appears to be linked to the recovery of vegetation, which has reduced aeolian transport on La Graciosa Island [66]. The decline in wind-driven sand supply has exposed rocky substrates along the shoreline within the study area. This trend seems to be the primary cause of the lagoon’s formation: in 1957 there was no evidence of a wet area, whereas from 1977 onwards, a flooded zone progressively emerged and expanded. Furthermore, the sandy barrier enclosing the lagoon has become increasingly narrow and discontinuous, a pattern commonly associated with sediment deficit. This sector lies outside the influence of dominant swell, receiving only residual suspended sediment under very specific conditions, as long-shore drift is virtually unsignificant. It can therefore be assumed that the shortage of aeolian sediment transport is the main driver behind the lagoon’s origin and development, as well as the retreat of the sandy shoreline. The diachronic analysis of the land–sea interface in the tidal lagoon reveals a marked increasing trend associated with the intensification of erosive processes. In 1957, the contact line measured 336 m, rising to 551.18 m in 1977 and experiencing a substantial increase in 1990, when it reached 1224.82 m. A relative contraction was observed in 2002 (1122.75 m), followed by a new expansion phase in 2011 (1290.92 m) and a slight decrease in 2024 (1246.78 m). Overall, the temporal sequence indicates a progressive expansion interrupted by intermittent fluctuations, highlighting the complexity of the morphodynamic processes governing the evolution of this coastal system.
The lagoon shows an erosive trend extending southward, likely reflecting the zone most affected by sand deficit. Likewise, the coast north of the lagoon has undergone significant retreat (Figure 13). Field measurements collected during September 2023 equinoctial spring tides recorded flood elevations of 3.51 m in the northern sector, 3.22 m in the central sector, and 2.34 m in the southern sector, with wave heights of approximately 1.5 m. In September 2024, during comparable spring tides, flood elevations ranged from 2.95 m (north) to 2.65 m (central) and 2.47 m (south). These data suggest that significant inundations can occur without the need for exceptionally high waves.
Particular attention was paid to the wave conditions typically observed in September. Around the Canary Islands, this month is generally characterized by calm seas, with waves of 2–3 m occasionally recorded and little variation in direction, predominantly from the fourth quadrant. Over the past six years, no storm events have been reported in September. Coastal storms mainly occur between October and February, outside the period of equinoctial spring tides, with wave heights exceeding 4 m. During the last five full years (2019–2023), no events combining equinoctial spring tides and waves of 2.11–2.61 m have been documented [65]. Nevertheless, the study site may be located within a wave-shadow zone, partially sheltered from the dominant swell. During storms, however, not only directly exposed coasts are affected by increased wave energy; adjacent areas may also experience storm set-up [85], a rise in sea level caused by low atmospheric pressure and strong winds, which can increase flooding risk even on shores not directly impacted by the waves.
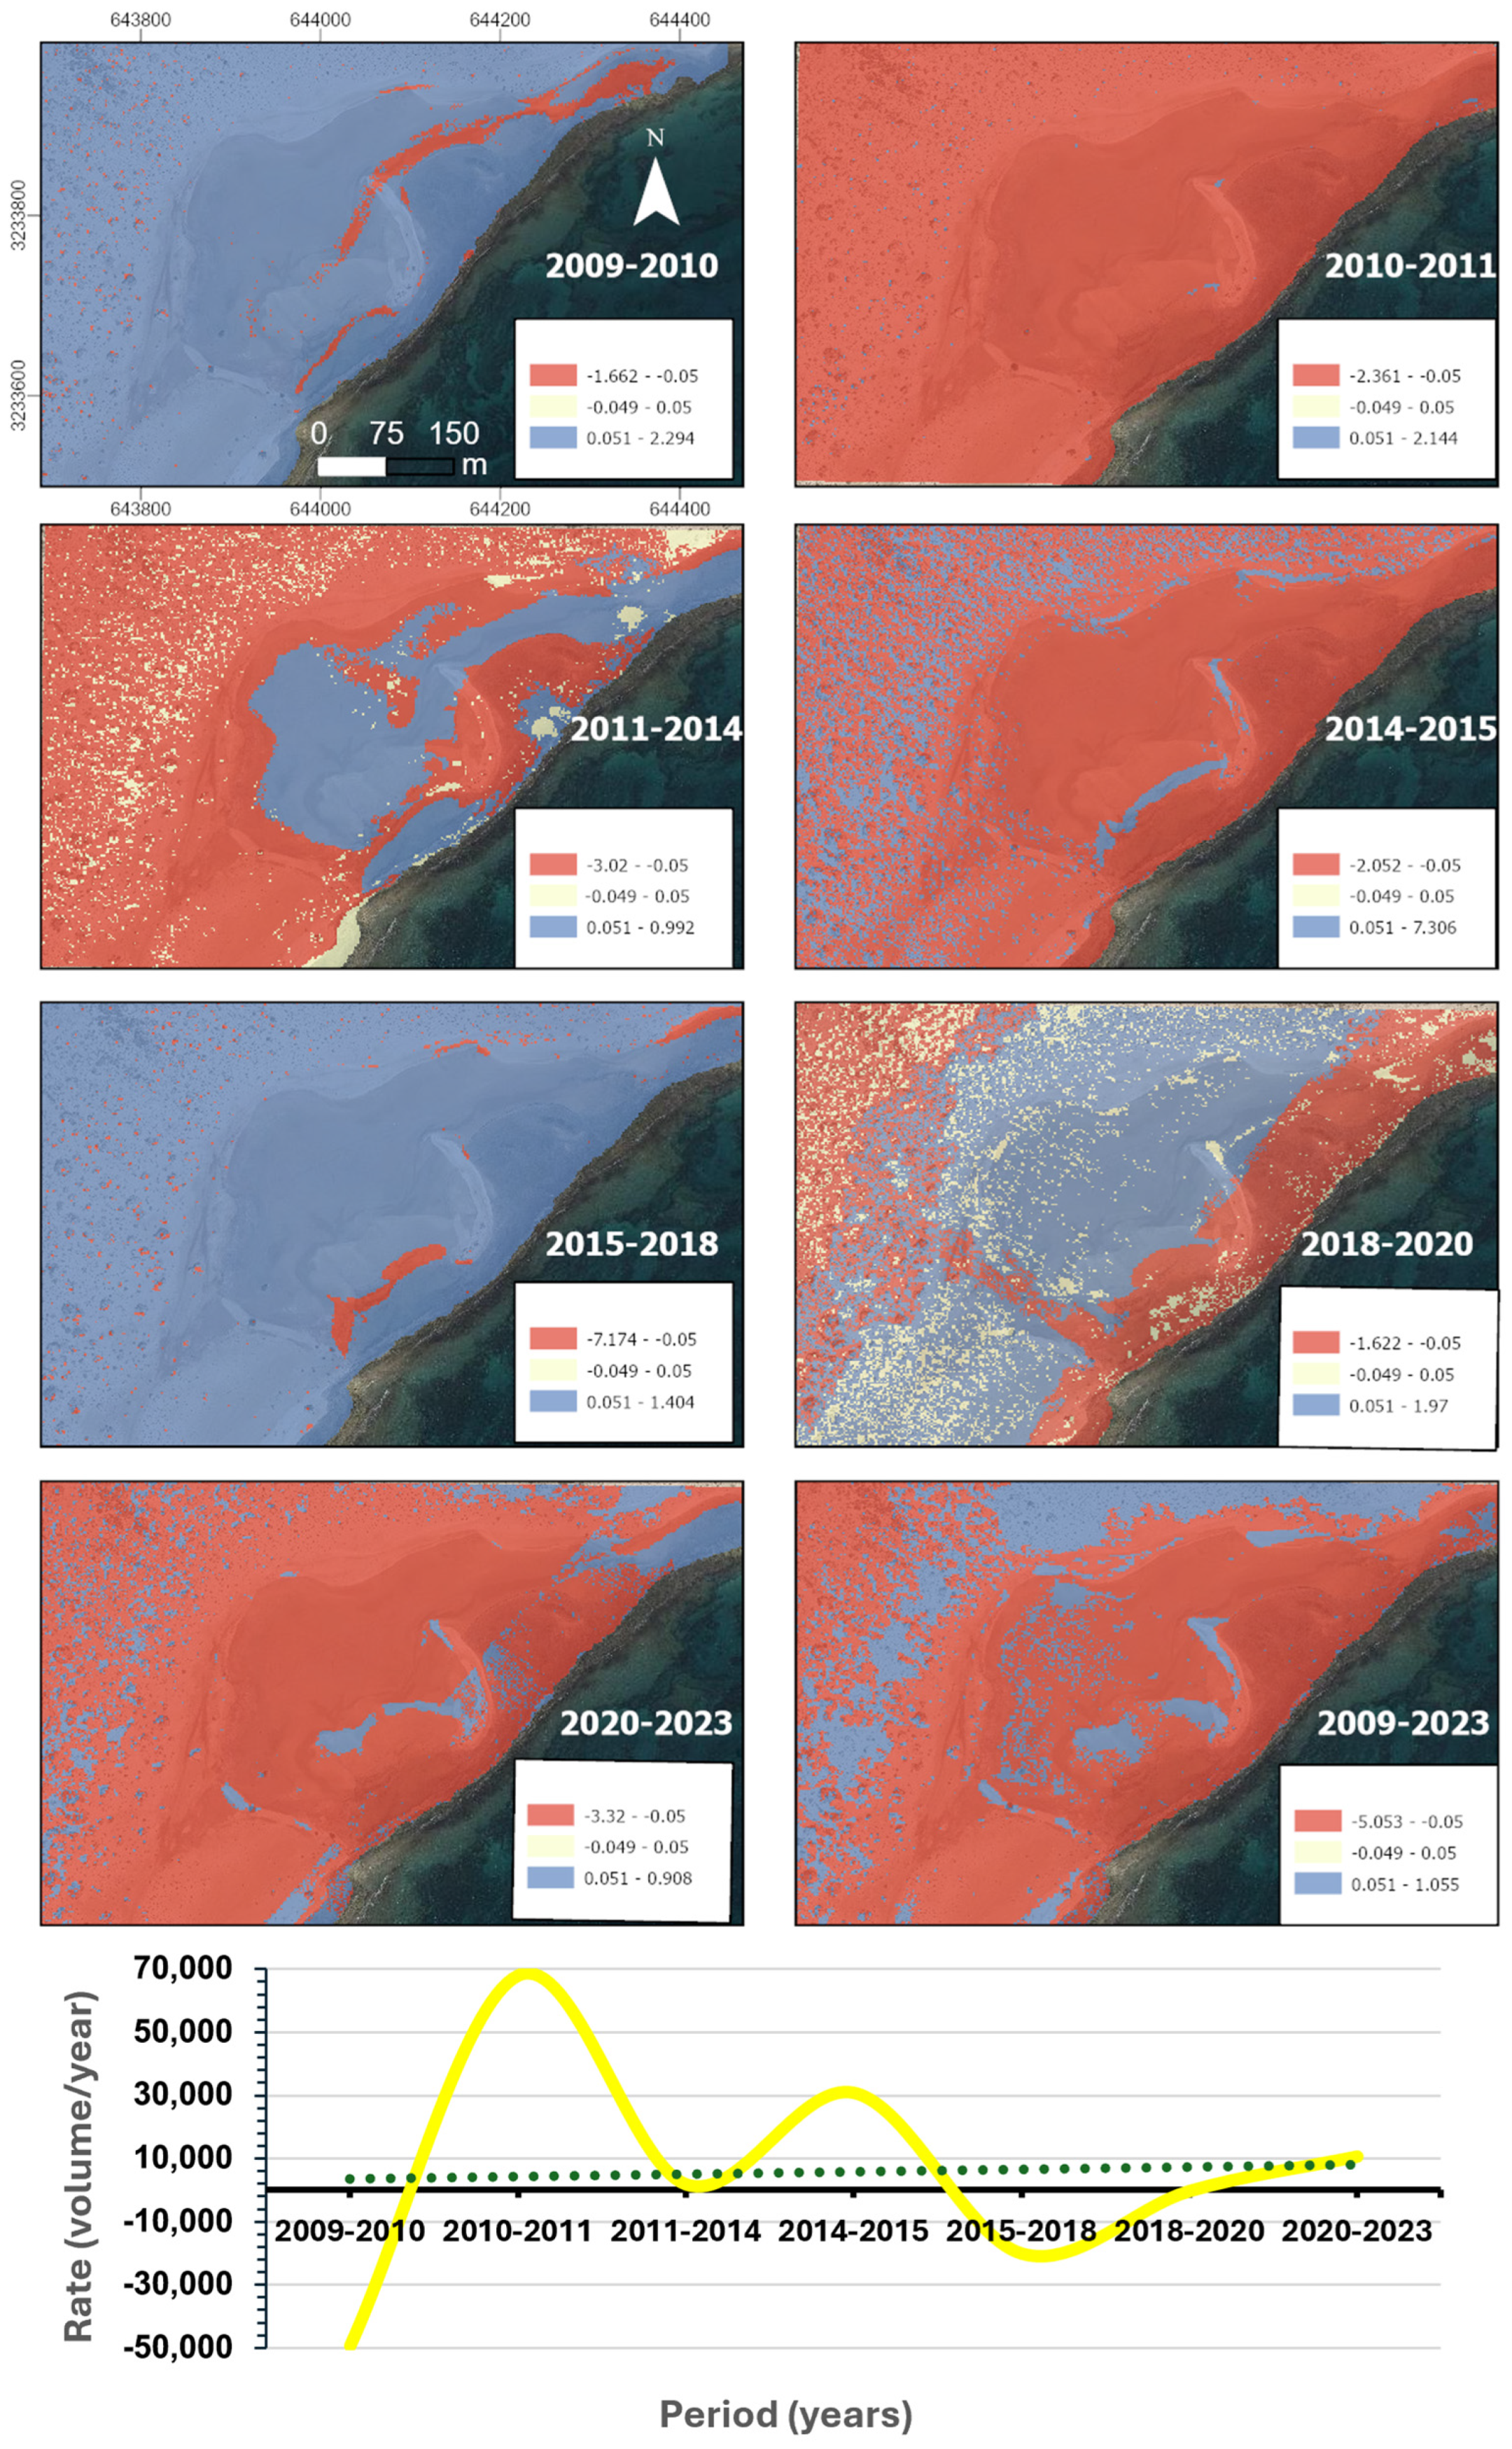
The topographical evolution of the lagoon boundaries that currently constitute the area affected by medium-term erosion processes, obtained through LiDAR flights (Figure 14), shows that sediment dynamics respond to a cyclical model. Consequently, this is an area characterized by irregular dynamics, wherein periods of predominant sediment accumulation (indicated by blue colors) alternate with periods of reduced sediment accumulation (indicated by red), as evidenced by the data collected between 2010 and 2011 and 2011–2014. In this final period, evidence of sediment accumulation has been observed in areas where minor ravines empty into the sea. This phenomenon may be a contributing factor to the observed sedimentation, along with wind-blown sediment transport. Conversely, there are discernible periods of considerable stability, typified by yellow colors, which occurred in the 2014–2015 and 2018–2020 periods. Furthermore, it has been observed that the sector towards the interior of the study area (the zone most distant from the sea and with greater vegetation cover) is where greater stability or even accumulation processes occur, with these areas being where morphologies associated with plant individuals appear. This phenomenon can be attributed to the capacity of vegetation to reduce dune displacement rates and promote sediment accumulation. A notable example is Traganum moquinii, which has been observed to exhibit both horizontal and vertical colonization patterns, resulting in a distinctive sand accumulation pattern. This species demonstrates a positive response to burial and is prevalent in dune areas exhibiting variable heights. T. moquinii has been found in wet slacks near the coast (upwind sand sources) and in sink zones where sediment flows into the sea [42,55]. This is also the case in the study area, where 185 individuals have been counted [65].

4.2.2. Wind Flow Dynamics

In order to analyze the spatial pattern of wind flow distribution in the sink zone of the dune system, the wind field in the study area was represented for a moment representative of the prevailing trade wind conditions affecting the island of La Graciosa (N-NNE direction) and with an average speed at the control station of 9.54 m/s (±1.68 m/s) (Figure 15).
Following the direction of the wind, the vegetation to the north of the food zone acts as a windbreak. This has two key effects: firstly, it limits transport, and secondly, it promotes the deposition of sediment that feeds the dune formations [86,87,88]. Once the sediments have been expelled from the area protected by vegetation, where the wind speed is relatively uniform between 5.5 and 7.5 m/s, and have reached the surroundings of the floodplain, where there is practically no vegetation, they accelerate to 10 m/s and are deposited in the lagoon area, where they are retained. The proximity of the lagoon, where the sediment is moistened and cannot be remobilized, limits the inland migration of aeolian sands and the reintroduction of sediment into the system, contributing to the stability of the erosional trend of the sink zone despite the persistent action of wind forces.

4.2.3. Sedimentological Characterization

The spatial distribution of granulometric parameters reveals marked heterogeneity within the study area (Figure 16). Mean grain size shows a distinct gradient, with finer sediments concentrated in the southern sector, whereas coarser fractions dominate inside the flooding area. This phenomenon can be attributed to the lagoon’s function as a sediment trap, where the accumulation of sand grains renders them resistant to removal by wind action.
Sorting patterns emphasize these contrasts. Poorly sorted sediments in the southern sector suggest a mixing of grain-size fractions due to localized deposition under variable conditions. The restricted mobility of wind within the lagoon, attributable to the presence of a salt crust, moisture, or the water surface itself, and, most significantly, anthropogenic processes, impedes the natural arrangement of sediments and consequently results in their misclassification. Instead, other agents predominate, such as waves, which redistribute sediments, or human action, especially the movement of people and vehicles, which removes and mixes materials, contributing to greater heterogeneity in grain size. In contrast, the lagoon zone demonstrates superior sorting, which is indicative of prolonged reworking by both hydrodynamic forcing and wind-driven processes. These processes have the tendency to sift out fine sediments and concentrate coarser, more uniform fractions. The skewness and kurtosis values provide additional insights into these dynamics, showing a recurring pattern in the lagoon’s morphology, characterized by a propensity for larger grains that approximate the mean size.
Overall, the observed patterns indicate that the dynamics of sediment in the study area are predominantly influenced by the interplay between coastal hydrodynamics and wind activity. The sector of the lagoon that has experienced the most exposure is characterized by the presence of coarse sediments, which are well sorted and symmetrically distributed, indicative of high-energy restructuring. Conversely, the southern zone functions as a deposition zone, where finer, poorly sorted sediments accumulate with a negative asymmetric distribution due to reduced hydrodynamic energy and the trapping of wind-blown material.

5. General Discussion

The topographical evolution of the study areas reveals consistent patterns of sediment deficit and shoreline retreat in the sink zones of several dune systems in the Macaronesia region. These results align with existing literature highlighting the fragility of dune systems as sediment sinks with limited replenishment from volcanic, biogenic, or offshore sources [20,24]. Episodic storm events and extreme waves can accelerate sand losses [89], while human pressures such as coastal development and sand extraction further disrupt sediment pathways [90]. In addition, climate change and sea level rise are expected to exacerbate these erosional trends [8]. Similar retrogradation patterns have been documented in other coastal dune systems under sediment-starved conditions [91,92]. The phenomenon of sediment deficit and coastal erosion cannot be attributed to a single cause; therefore, it is essential to consider the supply of sand and the transport of sediment in a broader context [93]. The persistence of sediment deficits in Canary Island dune systems underscores the need for “Source to Sink” approaches to identify disrupted pathways and inform sustainable management strategies that safeguard both ecosystem functions and socio-economic services.
Although management strategies employing a “Source to Sink” approach are not yet widespread, they have been implemented in some oceanic island systems. Specifically, in the Maspalomas study area, a project to restore the dune system based on this approach was initiated in 2018. The MASDUNAS project, developed by the Council of Gran Canaria, was initiated with the objective of identifying suitable methods to halt the environmental degradation process that has been affecting the dune system for the last 50 years. The project tasks, which are intended to achieve a number of objectives, including the mitigation of erosion in the sink zone of Maspalomas beach, encompass actions that have been carried out on the system’s upwind sand source and in the transport corridor. In order to address this issue, 60,000 m3 of sand were reintroduced to the beach at the point of entry to the system [32]. Furthermore, action was taken on the transport corridor, including the removal of stone obstacles [33] and the planting of specimens of T. moquinii, in addition to sand collectors and opaque screens, in both the foredune and the inland areas of the system [94].
Some coastal shorelines currently display sectors of apparent sediment accumulation, primarily sustained by inputs derived from adjacent erosional areas, which reflect the transient nature of sediment redistribution processes. Nevertheless, these depositional patterns should be interpreted as inherently unstable, since the persistence of accumulation depends on continuous sediment supply. In the absence of such inputs, or under shifting hydrodynamic conditions, depositional zones are highly likely to evolve into erosional sectors, as evidenced in Jandía [61]. This emphasizes the inherent instability of sediment balance in coastal systems, where localized accumulation frequently signifies a transient phase within a broader erosional trajectory.
The four study areas seem to exhibit comparable historical trajectories, initially characterized by significant disturbances of the aeolian sheets driven by traditional land-use practices. These included vegetation clearance through grazing, plant collection for fuel, and the exploitation of sand resources for saltpan construction, which often entailed systematic sediment extraction [61,64,66]. The subsequent decline and eventual abandonment of such activities promoted system stabilization, expressed through an increase in vegetation cover and a concomitant reduction in aeolian transport, ultimately leading to sedimentary deficit conditions. Within this framework, it is plausible that landform predating anthropogenic interventions are undergoing partial recovery. Nevertheless, these dynamics are increasingly modulated by contemporary stressors, such as the enhanced frequency and intensity of southerly storm events [95], ongoing sea level rise [96,97], and the sediment deficit at inlet sectors [98,99], therefore representing a structural limitation affecting most of these systems and exerting direct influence on the sink zone.

Limitations and Data Uncertainty

At the methodological level, the comparative analysis between case studies in Cabo Verde and the Canary Islands is subject to several limitations. One of the primary constraints pertains to the disparate availability of historical aerial photographs, which exerts a direct influence on the temporal extent and resolution of shoreline reconstructions [100]. It is important to note that the quality and availability of information sources in Cabo Verde are lower than in other study regions. This limitation restricts the temporal coverage of the data and consequently leads to greater uncertainty. However, the overall findings point to a negative sediment balance across insular dune systems, consistent with the broader vulnerability of sandy coasts in arid island environments. Despite the lower coverage and quality of information sources for the Cabo Verde study area in comparison to other areas analyzed, their inclusion is imperative to avoid obscuring environmental dynamics that affect contexts in the Global South. This is especially pertinent in regions where countries with significant socio-economic disparities coalesce, as evidenced in the case of Macaronesia. The focus of environmental research is typically oriented towards regions that possess well-established scientific infrastructure. This phenomenon gives rise to geographical biases in the extant evidence [101]. The incorporation of territories with limited information facilitates greater external validity of results and promotes more equitable knowledge production [102]. In order to achieve this objective, there is a necessity for the advancement of low-cost tools that do not necessitate an excess of scientific specialization or that serve to mitigate the uncertainty associated with the limitations of the sources, particularly in the case under consideration, given that the countries with the highest percentage of occupation of their aeolian sedimentary systems are also those with a low growth development rate [103].
The absence of precise information regarding the acquisition date of the images hindered the adjustment of uncertainty according to the tide level or the resolution of each source. The uncertainty surrounding the shoreline position, stemming from the constraints of the available information sources, which incorporates errors from georeferencing, projection, digitization and tide level definition, was addressed by assigning a positional uncertainty of 10 m to all coastlines. This approach aligns with a commonly adopted reference value when specific estimates by date or source are not available [70]. While homogenization impacts the confidence intervals of the EPR, affecting statistical accuracy and limiting the interpretative confidence of the rates obtained, it does not affect the validity of the results, which clearly indicate a trend towards sedimentary deficit in the study areas. In this regard, future studies seeking to increase the quantitative accuracy and statistical significance of the rates of change obtained through regression should incorporate specific estimates of uncertainty derived from spatial resolution, tide level at the time of imaging, and local beach slope.
Regarding the socio-economic differences in the study area, the advent of tourism development manifested at disparate temporal points across the sites, signifying that the processes propelling coastal change are not strictly coeval and must be interpreted within their respective historical contexts. The availability of resources differed considerably among the islands, resulting in divergent trajectories in land-use and sediment dynamics. In the most arid and desert-like environments, such as Jandía and La Graciosa, vegetation was highly valued and subject to intensive exploitation. In Sal, the presence of livestock was limited by extreme aridity, which also sustained human settlement, which often remained intermittent over long periods. Conversely, Maspalomas followed a markedly different historical pathway, as its relatively greater abundance of resources allowed for a distinct socio-ecological evolution compared to the more resource-scarce islands. Despite these differences, all the studied ecosystems converge at a critical turning point marked by the arrival of tourism. This process unfolded at different stages: the expansion of Maspalomas commenced during the 1960s, while Fuerteventura underwent significant tourism-driven transformations in the 1980s. In contrast, La Graciosa and Sal did not experience comparable levels of transformation until the early 2000s. This temporal discrepancy underscores the necessity of adopting a contextualized perspective when comparing sedimentary and ecological dynamics across the various islands.
The present study establishes new avenues for research, with the objective of facilitating a more profound comprehension of the findings. In particular, further investigation into changes in land-use and the ecological history of the Costa Fragata-Ponta Preta dune system would be of significant value, as it could assist in the precise identification of the factors driving the current erosion trends. In other systems of the Canary Islands, previous studies have explored these aspects in greater depth [64,66]; therefore, it would be valuable to complement these findings with an analysis of the situation in Cabo Verde. Furthermore, novel prospects for research endeavors aimed at ensuring the comprehensive management of dune systems in oceanic islands to prevent or mitigate erosion in sink zones emerge, drawing insights from the findings of this research.

6. Conclusions

The present study has combined a multiscale approach, incorporating remote sources in the long-medium term with fieldwork in the short term, to evaluate the morphodynamical response of sink zones in arid aeolian sedimentary systems of Macaronesia. The findings of this study can be summarized as follows:
The study consistently demonstrates significant and widespread shoreline retreat and erosional trends across all investigated sink zones of arid beach dune systems in the Macaronesia region, including Costa Fragata-Ponta Preta (Cabo Verde) and Maspalomas, Jandía, and La Graciosa (Canary Islands).
Human activities have been identified as a primary driver of the observed sediment deficits and morphological changes. Historical land-use practices and widespread tourism-driven urbanization and infrastructure construction have profoundly disrupted natural sediment dynamics, resulting in the current erosive state of these coastal systems.
The dynamics of sediment within these systems, as evidenced in La Graciosa, are governed by a multifaceted interaction of coastal hydrodynamics (waves, tides), wind activity, and vegetation, thereby influencing the heterogeneity of sedimentological characteristics. Human activities and uses have been demonstrated to alter the aforementioned factors, thereby reducing wind-blown sediment transport, stabilizing mobile dunes, creating physical barriers to natural sediment movement and leading to the disappearance of sandy surfaces in sink zones.
The persistent sediment deficits in sink zones necessitate “Source to Sink” approaches and strategies for the effective management of the arid dune systems in oceanic islands.

Author Contributions

Conceptualization, A.S.-C., N.M.-R., L.H.-C. and L.G.-R.; methodology, A.S.-C., N.M.-R. and L.G.-R.; validation, A.S.-C., N.M.-R. and L.G.-R.; formal analysis, A.S.-C., N.M.-R. and L.G.-R.; investigation, A.S.-C., N.M.-R. and L.G.-R.; resources, M.J.S.-G., A.T., L.H.-C. and L.G.-R.; data curation, A.S.-C., N.M.-R., C.A.S.-P., M.J.S.-G. and L.G.-R.; writing—original draft preparation, A.S.-C., N.M.-R. and L.G.-R.; writing—review and editing, A.S.-C., N.M.-R. and L.G.-R.; visualization, A.S.-C., N.M.-R., C.A.S.-P. and L.G.-R.; supervision, M.J.S.-G., A.T., L.H.-C. and L.G.-R.; project administration, A.T., L.H.-C. and L.G.-R.; funding acquisition, L.H.-C. and L.G.-R. All authors have read and agreed to the published version of the manuscript.

Funding

This research has been carried out in accordance with a contract between the FPCT-ULPGC Foundation and the Spanish Ministry for Ecological Transition and Demographic Challenge (Autonomous Agency of National Parks) through the project “PIMA 2024. Study of alternatives to the route of the track running alongside the coastal lagoon and the Habitats of Community Interest 2120 and 2130 * on La Graciosa Island”, which was led by LG-R. This publication is a contribution of R+D+i project PID2021-124888OB-I00, funded by MCIN (Spanish Ministry of Science and Innovation)/AEI (Spanish State Research Agency) and by “ERDF A way of making Europe”, from PRECOMP01 SD-24/03 research project funded by Las Palmas de Gran Canaria University and from the project IMPLACOST 1/MAC/2/2.4/0009: 85% by the Interreg VI Madeira-Azores-Canarias (MAC) 2021–2027 Territorial Cooperation Program of the European Regional Development Fund (ERDF), and the remaining 15% from regional and national funds of the participating territories. This includes contributions from the regional governments of Madeira (Portugal), the Azores (Portugal), and the Canary Islands (Spain). NM-R is beneficiary of a contract at Project Biodiversity Terrestrial Program funded by McPike-Zima Foundation. CAS-P is a predoctoral researcher (FPI2024010106), with a contract funded by the Department of Universities, Science, Innovation and Culture of the Government of the Canary Islands and the European Social Fund Plus (ESF+). LG-R is beneficiary of the ‘Catalina Ruiz 2022’ postdoctoral contract program funded by the Canary Island Government and the European Social Fund (APCR2022010005).

Data Availability Statement

Data will be made available upon request.

Acknowledgments

The authors are grateful to Carolina Peña Alonso, Lorena Naranjo Almeida and Briana Bombana for their help and support during field work. The authors would like to thank the Spanish Ministry for Ecological Transition and Demographic Challenge and the Autonomous Agency of National Parks for providing the data on flood points during the equinoctial spring tides in 2023 for La Graciosa and funding the fieldwork carried out in 2024.

Conflicts of Interest

The authors declare no conflicts of interest. The funders had no role in the design of the study; in the collection, analysis, or interpretation of data; in the writing of the manuscript; or in the decision to publish the results.

References

  1. Calkoen, F.; Luijendijk, A.; Rivero, C.R.; Kras, E.; Baart, F. Traditional vs. Machine-Learning Methods for Forecasting Sandy Shoreline Evolution Using Historic Satellite-Derived Shorelines. Remote Sens. 2021, 13, 934. [Google Scholar] [CrossRef]
  2. Lämmle, L.; Perez Filho, A.; Donadio, C.; Arienzo, M.; Ferrara, L.; Santos Cde, J.; Souza, A.O. Anthropogenic Pressure on Hydrographic Basin and Coastal Erosion in the Delta of Paraíba do Sul River, Southeast Brazil. J. Mar. Sci. Eng. 2022, 10, 1585. [Google Scholar] [CrossRef]
  3. Foti, G.; Barbaro, G.; Barillà, G.C.; Mancuso, P.; Puntorieri, P. Shoreline erosion due to anthropogenic pressure in Calabria (Italy). Eur. J. Remote Sens. 2023, 56, 2140076. [Google Scholar] [CrossRef]
  4. Hesp, P. Foredunes and blowouts: Initiation, geomorphology and dynamics. Geomorphology 2002, 48, 245–268. [Google Scholar] [CrossRef]
  5. Martínez, M.L.; Psuty, N.P.; Lubke, R.A. A perspective on coastal dunes. In Coastal Dunes: Ecology and Conservation; Springer: Berlin/Heidelberg, Germany, 2004; pp. 3–10. [Google Scholar]
  6. Houser, C.; Hamilton, S. Sensitivity of post-hurricane beach and dune recovery to event frequency. Earth Surf. Process. Landf. 2009, 34, 613–628. [Google Scholar] [CrossRef]
  7. Psuty, N.P.; Silveira, T.M. Global climate change: An opportunity for coastal dunes? J. Coast. Conserv. 2010, 14, 153–160. [Google Scholar] [CrossRef]
  8. Intergovernmental Panel on Climate Change. Climate change 2023: Synthesis report. In Contribution of Working Groups I, II and III to the Sixth Assessment Report of the Intergovernmental Panel on Climate Change; Core Writing Team, Lee, H., Romero, J., Eds.; IPCC: Geneva, Switzerland, 2023; pp. 35–115. [Google Scholar] [CrossRef]
  9. Gracia, A.; Rangel-Buitrago, N.; Oakley, J.A.; Williams, A.T. Use of ecosystems in coastal erosion management. Ocean Coast. Manag. 2018, 156, 277–289. [Google Scholar] [CrossRef]
  10. Islam, M.S.; Crawford, T.W.; Shao, Y. Evaluation of predicted loss of different land use and land cover (LULC) due to coastal erosion in Bangladesh. Front. Environ. Sci. 2023, 11, 1144686. [Google Scholar] [CrossRef]
  11. Lansu, E.M.; Reijers, V.C.; Höfer, S.; Luijendijk, A.; Rietkerk, M.; Wassen, M.J.; Lammerts, E.J.; van der Heide, T. A global analysis of how human infrastructure squeezes sandy coasts. Nat. Commun. 2024, 15, 432. [Google Scholar] [CrossRef]
  12. Ranasinghe, R. Assessing climate change impacts on open sandy coasts: A review. Earth-Sci. Rev. 2016, 160, 320–332. [Google Scholar] [CrossRef]
  13. Bozzeda, F.; Ortega, L.; Costa, L.L.; Fanini, L.; Barboza, C.A.M.; McLachlan, A.; Defeo, O. Global patterns in sandy beach erosion: Unraveling the roles of anthropogenic, climatic and morphodynamic factors. Front. Mar. Sci. 2023, 10, 1270490. [Google Scholar] [CrossRef]
  14. Cabezas-Rabadán, C.; Pardo-Pascual, J.E.; Palomar-Vazquez, J.; Cooper, A. A remote monitoring approach for coastal engineering projects. Sci. Rep. 2025, 15, 2955. [Google Scholar] [CrossRef]
  15. Meco, J.; Stearns, C.E. Emergent littoral deposits in the Eastern Canary Islands. Quat. Res. 1981, 15, 199–208. [Google Scholar] [CrossRef]
  16. Mimura, N.; Nurse, L.; McLean, R.F.; Agard, J.; Briguglio, L.; Lefale, P.; Payet, R.; Sem, G. Small islands. Climate change 2007: Impacts, adaptation and vulnerability. In Contribution of Working Group II to the Fourth Assessment Report of the Intergovernmental Panel on Climate Change; Parry, M.L., Canziani, O.F., Palutikof, J.P., van der Linden, P.J., Hanson, C.D., Eds.; Cambridge University Press: Cambridge, UK, 2007; pp. 687–716. [Google Scholar]
  17. Roettig, C.B.; Kolb, T.; Zöller, L.; Zech, M.; Faust, D. A detailed chrono-stratigraphical record of canarian dune archives—Interplay of sand supply and volcanism. J. Arid. Environ. 2020, 183, 104240. [Google Scholar] [CrossRef]
  18. Brooke, B. The distribution of carbonate eolianite. Earth-Sci. Rev. 2001, 55, 135–164. [Google Scholar] [CrossRef]
  19. Mangas, J.; Pérez-Chacón Espino, E. Composition and provenance of beach sands in La Graciosa, Lanzarote, Fuerteventura and Gran Canaria Islands (eastern Canary Islands, Spain): A review. Environ. Earth Sci. 2023, 82, 102. [Google Scholar] [CrossRef]
  20. Hernández-Cordero, A.I.; Peña-Alonso, C.; Hernández-Calvento, L.; Ferrer-Valero, N.; Santana-Cordero, A.M.; García-Romero, L.; Pérez-Chacón Espino, E. Aeolian Sedimentary Systems of the Canary Islands. In The Spanish Coastal Systems; Morales, J.A., Ed.; Springer International Publishing: Berlin/Heidelberg, Germany, 2019; pp. 699–725. [Google Scholar] [CrossRef]
  21. Gao, J.; Kennedy, D.M.; Konlechner, T.M. Coastal dune mobility over the past century: A global review. Prog. Phys. Geogr. 2020, 44, 814–836. [Google Scholar] [CrossRef]
  22. García-Romero, L.; Hernández-Cordero, A.I.; Fernández-Cabrera, E.; Peña-Alonso, C.; Hernández-Calvento, L.; Pérez-Chacón, E. Urban-touristic impacts on the aeolian sedimentary systems of the Canary Islands: Conflict between development and conservation. Isl. Stud. J. 2016, 11, 91–112. [Google Scholar] [CrossRef]
  23. Hernández-Calvento, L.; Jackson, D.W.T.; Cooper, A.; Pérez-Chacón, E. Island-Encapsulating Eolian Sedimentary Systems of the Canary and Cape Verde Archipelagos. J. Sediment. Res. 2017, 87, 117–125. [Google Scholar] [CrossRef]
  24. Gomes, C.; Silva, A.N.; Taborda, R.; Santos, F.; Rebelo, L.; Medina, A. Drivers of island beach evolution: Insights from an island-scale study at Boa Vista (Cabo Verde). Earth Surf. Process. Landf. 2019, 44, 2810–2822. [Google Scholar] [CrossRef]
  25. Short, A.D.; Jackson, D.W.T. Beach Morphodynamics. In Treatise on Geomorphology; Elsevier Ltd.: Amsterdam, The Netherlands, 2013; Volume 10. [Google Scholar] [CrossRef]
  26. Fontán-Bouzas, Á.; Alcántara-Carrió, J.; Albarracín, S.; Baptista, P.; Silva, P.A.; Portz, L.; Manzolli, R.P. Multiannual Shore Morphodynamics of a Cuspate Foreland: Maspalomas (Gran Canaria, Canary Islands). J. Mar. Sci. Eng. 2019, 7, 416. [Google Scholar] [CrossRef]
  27. Pinardo-Barco, S.; Sanromualdo-Collado, A.; García-Romero, L. Can the long-term effects of beach cleaning heavy duty machinery on aeolian sedimentary dynamics be detected by monitoring of vehicle tracks? An applied and methodological approach. J. Environ. Manag. 2023, 325, 116645. [Google Scholar] [CrossRef] [PubMed]
  28. García-Romero, L.; Hesp, P.A.; Peña-Alonso, C.; da Silva, G.M.; Hernández-Calvento, L. Climate as a control on foredune mode in Southern Australia. Sci. Total Environ. 2019, 694, 133768. [Google Scholar] [CrossRef] [PubMed]
  29. Hesp, P.A.; Hernández-Calvento, L.; Hernández-Cordero, A.I.; Gallego-Fernández, J.B.; García-Romero, L.; da Silva, G.M.; Ruz, M.-H.; Miot da Silva, G.; Ruz, M.-H. Nebkha development and sediment supply. Sci. Total Environ. 2021, 773, 144815. [Google Scholar] [CrossRef]
  30. Hesp, P.A.; Hernández-Calvento, L.; Gallego-Fernández, J.B.; Miot da Silva, G.; Hernández-Cordero, A.I.; Ruz, M.-H.; García-Romero, L. Nebkha or not? -Climate control on foredune mode. J. Arid. Environ. 2021, 187, 104444. [Google Scholar] [CrossRef]
  31. Cabrera-Vega, L.L.; Cruz-Avero, N.; Hernández-Calvento, L.; Hernández-Cordero, A.I.; Fernández-Cabrera, E. Morphological changes in dunes as an indicator of anthropogenic interferences in arid dune fields. J. Coast. Res. 2013, 165, 1271–1276. [Google Scholar] [CrossRef]
  32. Sanromualdo-Collado, A.; García-Romero, L.; Peña-Alonso, C.; Hernández-Cordero, A.I.; Ferrer-Valero, N.; Hernández-Calvento, L. Spatiotemporal analysis of the impact of artificial beach structures on biogeomorphological processes in an arid beach-dune system. J. Environ. Manag. 2021, 282, 111953. [Google Scholar] [CrossRef]
  33. Sanromualdo-Collado, A.; García-Romero, L.; Viera-Pérez, M.; Delgado-Fernández, I.; Hernández-Calvento, L. Effects of stone-made wind shelter structures over an arid nebkha foredune. Sci. Total Environ. 2023, 894, 164934. [Google Scholar] [CrossRef]
  34. García-Romero, L.; Hernández-Cordero, A.I.; Hesp, P.A.; Hernández-Calvento, L.; del Pino, Á.S. Decadal monitoring of Traganum moquinii’s role on foredune morphology of an human impacted arid dunefield. Sci. Total Environ. 2021, 758, 143802. [Google Scholar] [CrossRef]
  35. Marrero-Rodríguez, N.; García-Romero, L.; Peña-Alonso, C.; Hernández-Cordero, A.I. Biogeomorphological responses of nebkhas to historical long-term land uses in an arid coastal aeolian sedimentary system. Geomorphology 2020, 368, 107348. [Google Scholar] [CrossRef]
  36. Sanromualdo-Collado, A.; Marrero-Rodríguez, N.; García-Romero, L.; Delgado-Fernández, I.; Viera-Pérez, M.; Domínguez-Brito, A.C.; Cabrera-Gámez, J. Foredune responses to the impact of aggregate extraction in an arid aeolian sedimentary system. Earth Surf. Process. Landf. 2022, 47, 2709–2725. [Google Scholar] [CrossRef]
  37. Peña-Alonso, C.; Gallego-Fernández, J.B.; Hernández-Calvento, L.; Hernández-Cordero, A.I.; Ariza, E. Assessing the geomorphological vulnerability of arid beach-dune systems. Sci. Total Environ. 2018, 635, 512–525. [Google Scholar] [CrossRef]
  38. Hernández-Calvento, L. Diagnóstico Sobre la Evolución del Sistema de Dunas de Maspalomas: (1960–2000); Cabildo Insular de Gran Canaria: Las Palmas de Gran Canaria, Spain, 2006.
  39. Santana-Cordero, A.M.; Monteiro-Quintana, M.L.; Hernández-Calvento, L. Reconstruction of the land uses that led to the termination of an arid coastal dune system: The case of the Guanarteme dune system (Canary Islands, Spain), 1834–2012. Land Use Policy 2016, 55, 73–85. [Google Scholar] [CrossRef]
  40. Smith, A.B.; Jackson, D.W.T.; Cooper, J.A.G.; Hernández-Calvento, L. Quantifying the role of urbanization on airflow perturbations and dunefield evolution. Earth’s Future 2017, 5, 520–539. [Google Scholar] [CrossRef]
  41. García-Romero, L.; Delgado-Fernández, I.; Hesp, P.A.; Hernández-Calvento, L.; Viera-Pérez, M.; Hernández-Cordero, A.I.; Cabrera-Gámez, J.; Domínguez-Brito, A.C. Airflow dynamics, vegetation and aeolian erosive processes in a shadow zone leeward of a resort in an arid transgressive dune system. Aeolian Res. 2019, 38, 48–59. [Google Scholar] [CrossRef]
  42. Hernández-Cordero, A.I.; Hernández-Calvento, L.; Pérez-Chacón Espino, E. Relationship between vegetation dynamics and dune mobility in an arid transgressive coastal system, Maspalomas, Canary Islands. Geomorphology 2015, 238, 160–176. [Google Scholar] [CrossRef]
  43. Hernández-Cordero, A.I.; Hernández-Calvento, L.; Pérez-Chacón Espino, E. Vegetation changes as an indicator of impact from tourist development in an arid transgressive coastal dune field. Land Use Policy 2017, 64, 479–491. [Google Scholar] [CrossRef]
  44. García-Talavera, F. La Macaronesia. Consideraciones geológicas, biogeográficas y paleoecológicas. In Ecología y Cultura en Canarias; Fernández-Palacios, J.M., Bacallado, J.J., Belmonte, J.A., Eds.; Múseo de la Cien-cia, Cabildo Insular de Tenerife: Santa Cruz de Tenerife, Spain, 1999; pp. 39–63. [Google Scholar]
  45. Ferrer-Valero, N.; Hernández-Calvento, L.; Hernández-Cordero, A.I. Insights of long-term geomorphological evolution of coastal landscapes in hot-spot oceanic islands. Earth Surf. Process. Landf. 2019, 44, 565–580. [Google Scholar] [CrossRef]
  46. Ferrer-Valero, N. Observaciones de la Estructura Geomorfológica de los Paisajes Costeros Macaronésicos: Implicaciones para el Conocimiento de su Evolución en Amplias Escalas Espacio-Temporales. Ph.D. Thesis, Universidad de Las Palmas de Gran Canaria, Las Palmas de Gran Canaria, Spain, 2019. [Google Scholar]
  47. Fernández-Palacios, J.M.; Esquivel, J.L.M. (Eds.) Naturaleza de las Islas Canarias: Ecología y Conservación; Publicaciones Turquesa: Santa Cruz de Tenerife, Spain, 2001. [Google Scholar]
  48. Dorta Antequera, P.; López Díez, A.; Díaz Pacheco, J.; Máyer Suárez, P.; Romero Ruiz, C. Turismo y amenazas de origen natural en la Macaronesia. Análisis Comparado. Cuad. Tur. 2020, 45, 61–92. [Google Scholar] [CrossRef]
  49. INECV—Instituto Nacional de Estatística. Estatisticas do Ambiente—2016; INECV—Instituto Nacional de Estatística: Praia, Republic of Cabo Verde, 2018; p. 80.
  50. Delgado Neves, D.J.; de Paulo Rodrigues Silva, V.; Rodrigues Almeida, R.S.; de Assis Salviano de Sousa, F.; da Silva, B.B. Aspectos gerais do clima do arquipélago de Cabo Verde. Ambiência 2017, 13, 59–73. [Google Scholar]
  51. Gomes, N.; Neves, R.; Kenov, I.A.; Campuzano, F.J.; Pinto, L. Tide and tidal currents in the Cape Verde archipelago. J. Integr. Coast. Zone Manag. 2015, 15, 395–408. [Google Scholar] [CrossRef]
  52. Eusébio, C.; Vieira, A.L.; Lima, S. Place attachment, host–tourist interactions, and residents’ attitudes towards tourism development: The case of Boa Vista Island in Cape Verde. J. Sustain. Tour. 2018, 26, 890–909. [Google Scholar] [CrossRef]
  53. Máyer Suárez, P.; Pérez-Chacón Espino, E.; Cruz-Avero, N.; Hernández-Calvento, L. Características del viento en el campo de dunas de Maspalomas (Gran Canaria, islas Canarias, España). Nimbus 2012, 29–30, 381–397. [Google Scholar]
  54. Alcántara-Carrió, J.; Fontán, A. Factors controlling the morphodynamics and geomorphologic evolution of a cuspate foreland in a volcanic intraplate Island (Maspalomas, Canary Islands). J. Coast. Res. 2009, 56, 683–687. [Google Scholar]
  55. Hernández-Cordero, A.I.; Pérez-Chacón Espino, E.; Hernández-Calvento, L. Vegetation, distance to the coast, and aeolian geomorphic processes and landforms in a transgressive arid coastal dune system. Phys. Geogr. 2015, 36, 60–83. [Google Scholar] [CrossRef]
  56. Viera-Pérez, M. Estudio Detallado de la duna Costera de Maspalomas (Gran Canaria, Islas Canarias): Interacción “Traganum Moquinii”—Dinámica Sedimentaria Eólica en un Entorno Intervenido. Recomendaciones de cara a su Gestión. Ph.D. Thesis, Universidad de Las Palmas de Gran Canaria, Las Palmas de Gran Canaria, Spain, 2015. [Google Scholar]
  57. Coello, J.; Cantagrel, J.M.; Hernán, F.; Fuster, J.M.; Ibarrola, E.; Ancoechea, E.; Casquet, C.; Jamond, C.; Díaz de Terán, J.R.; Cendrero, A. Evolution of the eastern volcanic ridge of the Canary Islands based on new K-Ar data. J. Volcanol. Geothecnics Res. 1992, 53, 251–345. [Google Scholar] [CrossRef]
  58. Alcántara-Carrió, J.; Bilbao, I.A. INFLUENCIA DE LOS FACTORES AMBIENTALES SOBRE LA DINÁMICA SEDIMENTARIA EOLICA EN EL ISTMO DE JANDIA (FUERTEVENTURA). In Libro de resúmenes del XIII Congreso Bienal de la Real Sociedad Española de Historia Natural: Conservación Ambiental; Servicio de Publicacións da Universidade de Vigo: Vigo, Spain, 1998; Volume 138. [Google Scholar]
  59. Alcantará-Carrió, J.; Alonso, I. Measurement and prediction of aeolian sediment transport at Jandía isthmus (Fuerteventura, Canary Islands). J. Coast. Res. 2002, 18, 300–315. [Google Scholar]
  60. Alonso, I.; Hernández-Calvento, L.; Alcántara-Carrió, J.; Cabrera, L.; Yanes, A. Los grandes campos de dunas actuales de Canarias. In Las Dunas de España; Sanjaume, E., Gracia, J., Eds.; Sociedad Española de Geomorfología: Zaragoza, Spain, 2011; pp. 467–496. [Google Scholar]
  61. Marrero-Rodríguez, N.; Casamayor, M.; Sánchez-García, M.J.; Alonso, I. Can long-term beach erosion be solved with soft management measures? Case study of the protected Jandía beaches. Ocean. Coast. Manag. 2021, 214, 105946. [Google Scholar] [CrossRef]
  62. Martín Esquivel, J.L.; García, H.; Redondo, C.E.; García, I.; Carralero, I. La Red Canaria de Espacios Naturales Protegidos; Gobierno de Canarias, Viceconsejería de Medio Ambiente: Santa Cruz, CA, USA, 1995; p. 412.
  63. Cabrera, J.C. Poblamiento e impacto aborigen. In Naturaleza de las Islas Canarias, Ecología y Conservación; Fernández-Palacios, J.M., Martín-Esquivel, J.L., Eds.; Editorial Turquesa: Santa Cruz de Tenerife, Spain, 2001; pp. 241–245. [Google Scholar]
  64. Marrero-Rodríguez, N.; García-Romero, L.; Sánchez-García, M.J.; Hernández-Calvento, L.; Pérez-Chacón Espino, E. An historical ecological assessment of land-use evolution and observed landscape change in an arid aeolian sedimentary system. Sci. Total Environ. 2020, 716, 137087. [Google Scholar] [CrossRef]
  65. García-Romero, L.; Marrero-Rodríguez, N.; Sanromualdo-Collado, A.; Peña-Alonso, C.; Naranjo-Almeida, L.; Suárez-Pérez, C.A.; Hernández-Cordero, A.I.; Ferrer, N.; Pérez-Chacón Espino, E.; Hernández-Calvento, L.; et al. PIMA 2024. Estudio de Alternativas al Trazado de la Pista que Discurre Junto al Lagoon Costero y los Hábitats de Interés Comunitario 2120 y 2130 en la isla de La Graciosa: Informe Final; Organismo Autónomo de Parques Nacionales (OAPN-MITECO), Universidad de Las Palmas de Gran Canaria: Las Palmas de Gran Canaria, Spain, 2024; p. 81. [Google Scholar]
  66. Santana-Cordero, A.M.; Monteiro Quintana, M.L.; Hernández-Calvento, L.; Pérez-Chacón Espino, E.; García-Romero, L. Long-term Human Impacts on the Coast of La Graciosa, Canary Islands. Land Degrad. Dev. 2016, 27, 479–489. [Google Scholar] [CrossRef]
  67. Di Paola, G.; Rodríguez, G.; Rosskopf, C.M. Short- to mid-term shoreline changes along the southeastern coast of Gran Canaria Island (Spain). Rend. Lincei. Sci. Fis. Nat. 2020, 31, 89–102. [Google Scholar] [CrossRef]
  68. Thieler, E.R.; Danforth, W.W. Historical shoreline mapping (I): Improving techniques and reducing positioning errors. J. Coast. Res. 1994, 10, 549–563. [Google Scholar]
  69. Thieler, E.R.; Danforth, W.W. Historical shoreline mapping (II): Application of the digital shoreline mapping and analysis systems (DSMS/DSAS) to shoreline change mapping in Puerto Rico. J. Coast. Res. 1994, 10, 600–620. [Google Scholar]
  70. Thieler, E.R.; Himmelstoss, E.A.; Zichichi, J.L.; Ergul, A. The Digital Shoreline Analysis System (DSAS) Version 4.0—An ArcGIS Extension for Calculating Shoreline Change (No. 2008–1278); US Geological Survey: Reston, VA, USA, 2009.
  71. Himmelstoss, E.A.; Henderson, R.E.; Farris, A.S.; Kratzmann, M.G.; Bartlett, M.K.; Ergul, A.; McAndrews, J.; Cibaj, R.; Zichichi, J.L.; Thieler, E.R. Digital Shoreline Analysis System, Version 6.0; U.S. Geological Survey Software Release: Reston, VA, USA, 2024. [CrossRef]
  72. Wheaton, J.M.; Brasington, J.; Darby, S.E.; Merz, J.; Pasternack, G.B.; Sear, D.; Vericat, D. Linking geomorphic changes to salmonid habitat at a scale relevant to fish. River Res. Appl. 2010, 26, 469–486. [Google Scholar] [CrossRef]
  73. Wheaton, J.M.; Brasington, J.; Darby, S.E.; Sear, D.A. Accounting for uncertainty in DEMs from repeat topographic surveys: Improved sediment budgets. Earth Surf. Process. Landf. 2010, 35, 136–156. [Google Scholar] [CrossRef]
  74. Smith, M.W.; Carrivick, J.L.; Quincey, D.J. Structure from motion photogrammetry in physical geography. Prog. Phys. Geogr. 2015, 40, 247–275. [Google Scholar] [CrossRef]
  75. van Puijenbroek, M.E.B.; Nolet, C.; de Groot, A.V.; Suomalainen, J.M.; Riksen, M.J.P.M.; Berendse, F.; Limpens, J. Exploring the contributions of vegetation and dune size to early dune development using unmanned aerial vehicle (UAV) imaging. Biogeosciences 2017, 14, 5533–5549. [Google Scholar] [CrossRef]
  76. Grottoli, E.; Biausque, M.; Rogers, D.; Jackson, D.W.T.; Cooper, J.A.G. Structure-from-Motion-Derived Digital Surface Models from Historical Aerial Photographs: A New 3D Application for Coastal Dune Monitoring. Remote Sens. 2020, 13, 95. [Google Scholar] [CrossRef]
  77. Costas, S.; de Sousa, L.B.; Gallego-Fernández, J.B.; Hesp, P.; Kombiadou, K. Foredune initiation and early development through biophysical interactions. Sci. Total Environ. 2024, 940, 173548. [Google Scholar] [CrossRef]
  78. Poppema, D.W.; Wijnberg, K.M.; Mulder, J.P.M.; Hulscher, S.J.M.H. Scale experiments on aeolian deposition and erosion patterns created by buildings on the beach. In Coastal Sediments 2019; Wang, P., Rosatie, J.D., Vallee, M., Eds.; World Scientific: London, UK, 2019; pp. 1693–1707. [Google Scholar] [CrossRef]
  79. Domínguez-Brito, A.C.; Cabrera-Gámez, J.; Viera-Pérez, M.; Rodríguez-Barrera, E.; Hernández-Calvento, L. A DIY low-cost wireless wind data acquisition system used to study an arid coastal foredune. Sensors 2020, 20, 1064. [Google Scholar] [CrossRef] [PubMed]
  80. Delgado-Fernández, I.; Jackson, D.W.T.; Cooper, J.A.G.; Baas, A.C.W.; Beyers Meiring Lynch, K. Field characterization of three-dimensional lee-side airflow patterns under offshore winds at a beach-dune system. J. Geophys. Res. Earth Surf. 2013, 118, 706–721. [Google Scholar] [CrossRef]
  81. Blott, S.J.; Pye, K. GRADISTAT: A grain size distribution and statistics package for the analysis of unconsolidated sediments. Earth Surf. Process. Landf. 2001, 26, 1237–1248. [Google Scholar] [CrossRef]
  82. Folk, R.L.; Ward, W. Brazos River Bar: A Study in the Significance of Grain Size Parameters. J. Sediment. Petrol. 1957, 27, 3–26. [Google Scholar] [CrossRef]
  83. Hernández-Cordero, A.I.; Hernández-Calvento, L.; Hesp, P.A.; Pérez-Chacón, E. Geomorphological changes in an arid transgressive coastal dune field due to natural processes and human impacts. Earth Surf. Process. Landf. 2018, 43, 2167–2180. [Google Scholar] [CrossRef]
  84. Pérez-Chacón, E.; Hernández-Calvento, L.; Fernández-Negrín, E.; Máyer, P.; Hernández-Cordero, A.; Cabrera, L.; Cruz, N.; Fernández-Cabrera, E.; García Romero, L.; Peña, C.; et al. Evolución reciente del sistema sedimentario eólico de La Graciosa (Archipiélago canario): Claves para su diagnóstico ambiental. In Informe Final. Centro ‘Isla de La Graciosa’ (OAPN-Ministerio de MAMRM); University of Las Palmas de Gran Canaria: Las Palmas de Gran Canaria, Spain, 2012; p. 151. [Google Scholar]
  85. Kim, S.Y.; Yasuda, T.; Mase, H. Wave set-up in the storm surge along open coasts during Typhoon Anita. Coast. Eng. 2010, 57, 631–642. [Google Scholar] [CrossRef]
  86. Buckley, R. The effect of sparse vegetation on the transport of dune sand by wind. Nature 1987, 325, 426–428. [Google Scholar] [CrossRef]
  87. Dupont, S.; Bergametti, G.; Simoëns, S. Modeling aeolian erosion in presence of vegetation. J. Geophys. Res. Earth Surf. 2014, 119, 168–187. [Google Scholar] [CrossRef]
  88. Mayaud, J.R.; Webb, N.P. Vegetation in Drylands: Effects on Wind Flow and Aeolian Sediment Transport. Land 2017, 6, 64. [Google Scholar] [CrossRef]
  89. Short, A.D.; Hesp, P.A. Wave, beach and dune interactions in southeastern Australia. Mar. Geol. 1982, 48, 259–284. [Google Scholar] [CrossRef]
  90. Nordstrom, K.F. Beaches and Dunes of Developed Coasts; Cambridge University Press: Cambridge, UK, 2000. [Google Scholar]
  91. Fitzgerald, D.M.; Fenster, M.S.; Argow, B.A.; Buynevich, I.V. Coastal impacts due to sea-level rise. Annu. Rev. Earth Planet. Sci. 2008, 36, 601–647. [Google Scholar] [CrossRef]
  92. Jackson, N.L.; Nordstrom, K.F. Aeolian sediment transport and landforms in managed coastal systems: A review. Aeolian Res. 2011, 3, 181–196. [Google Scholar] [CrossRef]
  93. Woodroffe, C.D.; Evelpidou, N.; Delgado-Fernandez, I.; Green, D.; Sengupta, D.; Karkani, A.; Ciavola, P. Coastline changes: A reconsideration of the prevalence of recession on sandy shorelines. Camb. Prism. Coast. Futures 2025, 3, e18. [Google Scholar] [CrossRef]
  94. Martínez Pérez, M.; Viera Pérez, M.; León Alemán, F.; Padrón García, J.; Segura Hernández, Y. Traganum moquinii, balancón, clave en la formación dunar en el proyecto MASDUNAS. Conserv. Veg. 2023, 27, 23–27. [Google Scholar] [CrossRef]
  95. Yanes Luque, A.; Rodríguez-Báez, J.A.; Máyer Suárez, P.; Dorta Antequera, P.; López-Díez, A.; Díaz-Pacheco, J.; Pérez-Chacón, E. Marine storms in coastal tourist areas of the Canary Islands. Nat. Hazards 2021, 109, 1297–1325. [Google Scholar] [CrossRef]
  96. Ferrer, N.; Toimil, A.; Losada, I.; Herrera, G. Impacts of sea level rise on the cultural heritage of oceanic islands: Modeling twenty-first century scenarios in the Canary archipelago. J. Isl. Coast. Archaeol. 2024, 20, 545–562. [Google Scholar] [CrossRef]
  97. González, A.G.; Peña-Alonso, C.; González-Dávila, M.; Santana-Casiano, J.M.; González-Santana, D.; Ferraro, G.; Naranjo-Almeida, L.; García-Romero, L. Governance Challenges for the Adaptation to Sea-Level Rise in the Canary Islands: A Multilevel Approach. Ocean. Soc. 2025, 2, 10505. [Google Scholar] [CrossRef]
  98. Enríquez, A.R.; Marcos, M.; Falqués, A.; Roelvink, D. Assessing beach and dune erosion and vulnerability under sea level rise: A case study in the Mediterranean Sea. Front. Mar. Sci. 2019, 6, 4. [Google Scholar] [CrossRef]
  99. Barbaro, G.; Foti, G.; Barillà, G.C.; Frega, F. Beach and dune erosion: Causes and interventions, case study: Kaulon archaeological site. J. Mar. Sci. Eng. 2021, 10, 14. [Google Scholar] [CrossRef]
  100. Caldareri, F.; Sulli, A.; Parrino, N.; Dardanelli, G.; Todaro, S.; Maltese, A. On the shoreline monitoring via earth observation: An isoradiometric method. Remote Sens. Environ. 2024, 311, 114286. [Google Scholar] [CrossRef]
  101. Ghosh, B.; Ramos-Mejía, M.; Machado, R.C.; Yuana, S.L.; Schiller, K. Decolonising transitions in the Global South: Towards more epistemic diversity in transitions research. Environ. Innov. Soc. Transit. 2021, 41, 106–109. [Google Scholar] [CrossRef]
  102. Büyüm, A.M.; Kenney, C.; Koris, A.; Mkumba, L.; Raveendran, Y. Decolonising global health: If not now, when? BMJ Glob. Health 2020, 5, e003394. [Google Scholar] [CrossRef] [PubMed]
  103. García-Romero, L.; Hernández-Cordero, A.I.; Hernández-Calvento, L.; Espino, E.P.-C.; López-Valcarcel, B.G. Procedure to automate the classification and mapping of the vegetation density in arid aeolian sedimentary systems. Prog. Phys. Geogr. Earth Environ. 2018, 42, 330–351. [Google Scholar] [CrossRef]
Figure 1. Location of the Canary and Cabo Verde islands within the Macaronesia region. The islands colored orange are those where sedimentary systems have been selected for study. Sources: Esri, TomTom, Garmin, FAO, NOAA, USGS, © OpenStreetMap contributors, and the GIS User Community.
Remotesensing 17 03731 g001
Figure 2. Location of the sink zones of the aeolian sedimentary systems selected as study areas.
Remotesensing 17 03731 g002
Figure 3. Methodological flowchart.
Remotesensing 17 03731 g003
Figure 4. Distribution of sand and wind sampling points in La Graciosa study area.
Remotesensing 17 03731 g004
Figure 5. Shoreline evolution (A) and long-medium-term DSAS ((B): EPR, (C): NSM and (D): SCE) in the sink zone of the Costa Fragata-Ponta Preta dune system.
Remotesensing 17 03731 g005
Figure 6. Morphological evolution in the sink zone of Costa Fragata—Ponta Sino dune system between 2003 and 2023.
Remotesensing 17 03731 g006
Figure 7. Shoreline evolution (A) and long-medium term DSAS ((B): vEPR, (C): NSM and (D): SCE) in the sink zone of the Maspalomas dune system.
Remotesensing 17 03731 g007
Figure 8. Topographical evolution of beach profiles in the sink zone of the Maspalomas dune system.
Remotesensing 17 03731 g008
Figure 9. Shoreline evolution (A) and long-medium-term DSAS ((B): EPR, (C): NSM and (D): SCE) in the sink zone of the Jandía dune system.
Remotesensing 17 03731 g009
Figure 10. Topographical evolution of beach profiles in the sink zone of the Jandía dune system.
Remotesensing 17 03731 g010
Figure 11. Shoreline evolution (A) and long-medium term DSAS ((B): EPR, (C): NSM and (D): SCE) in the sink zone of the La Graciosa dune system.
Remotesensing 17 03731 g011
Figure 12. Topographical evolution of beach profiles in the sink zone of the La Graciosa dune system.
Remotesensing 17 03731 g012
Figure 13. Evolution of the inundation level in the study site between 1957 and 2024; Flood levels for two spring-tide conditions with different wave heights.
Remotesensing 17 03731 g013
Figure 14. Differences in altitude (gains in blue, stability in yellow and losses in red) and sedimentary rates within the sandy substrates around the sink zone of the La Graciosa sedimentary system during the following interannual periods: 2009–2010, 2010–2011, 2011–2014, 2014–2015, 2015–2018, 2018–2020 and 2009–2020.
Remotesensing 17 03731 g014
Figure 15. Wind speed field and spatial distribution of wind flow (m/s) in the study area for a typical situation at the speed control station 9.54 (±1.68 m/s) and N-NNE component.
Remotesensing 17 03731 g015
Figure 16. Spatial distribution of sedimentary characteristics.
Remotesensing 17 03731 g016
Table 1. Sources and characteristics of remote data.
Source TypeStudy AreaSource Time Series (Date) Resolution (m)RMS (m)
Historical aerial photographs/OrthophotosCosta Fragata (Sal) Google Earth 2003, 2012, 2016, 2023 0.15–1.5-
Maspalomas (GC) IGN and GRAFCAN1957, 1961, 1977, 1987,1998, 2009, 2019, 20240.12–10.12–1.3
Jandía (FV) IGN and GRAFCAN1956, 1969, 1981, 1994, 2002, 2009, 2018, 20240.2–10.15–1.3
La Graciosa GRAFCAN1957, 1977, 1990, 2002, 2011 and 2024 40–50 cm/pixel <1.5
Digital Elevation Models (DEMs)Costa Fragata (Sal) ----
Maspalomas (GC) PNOA2009, 2015, 20230.5–5 points/m2<0.2
Jandía (FV) PNOA2009, 2015, 20230.5–5 points/m2<0.2
La Graciosa * PNOA, ** GRAFCAN2009 *, 2010 **, 2011 **, 2014 **, 2015 *, 2018 **, 2020 **, 2023 * 0.5–5 points/m2<0.2
PNOA: National Aerial Orthophoto Plan (Spanish Government) through IGN: Spanish National Geographic Institute; GRAFCAN: Cartográfica de Canarias S.A. (Canary Government-SDI); - not applicable or missing data. *: PNOA; **: GRAFCAN.
Disclaimer/Publisher’s Note: The statements, opinions and data contained in all publications are solely those of the individual author(s) and contributor(s) and not of MDPI and/or the editor(s). MDPI and/or the editor(s) disclaim responsibility for any injury to people or property resulting from any ideas, methods, instructions or products referred to in the content.