Article

Automatic Ghost Noise Labeling for 4D mmWave Radar Data in Underground Mine Environments Using LiDAR as Reference

1
School of Environment and Spatial Informatics, China University of Mining and Technology, Xuzhou 221116, China
2
Department of Mine Surveying and Geodesy, TU Bergakademie Freiberg, 09599 Freiberg, Germany
3
State Key Laboratory of Earthquake Dynamics and Forecasting, Institute of Geology, China Earthquake Administration, Beijing 100029, China
*
Author to whom correspondence should be addressed.
Remote Sens. 2025, 17(22), 3732; https://doi.org/10.3390/rs17223732 (registering DOI)
Submission received: 7 October 2025 / Revised: 8 November 2025 / Accepted: 11 November 2025 / Published: 17 November 2025
(This article belongs to the Special Issue Applications of Photogrammetry and Lidar Techniques in Mining Areas)

Highlights

What are the main findings?
  • Proposes a LiDAR-assisted two-stage ghost noise automatic labeling method for 4D mmWave radar data, combining distance threshold filtering and density-based clustering analysis (DBSCAN), which demonstrates superior performance compared to single-method approaches.
  • Designs a complete automated labeling workflow tailored for underground mining environments, significantly reducing the cost and complexity of manual labeling while addressing current data annotation bottlenecks in research.
What are the implications of the main findings?
  • Validates the proposed method’s efficiency and robustness in ghost noise detection across three typical underground mining scenarios (straight tunnels, straight tunnels with side tunnels, and cross-tunnel turns), providing a practical solution for optimizing radar data quality in complex confined environments.
  • Lays an important foundation for the application of 4D mmWave radar in underground mining environments and provides new technical means for studying ghost noise labeling issues, with potential applications in similar industrial settings.

Abstract

In underground mining environments, 4D mmWave radar performance is severely constrained by ghost noise issues resulting from multipath reflections, metal structure interference, and complex terrain, creating significant challenges for target detection, mapping, and autonomous navigation tasks. Existing research lacks efficient automated methods and technical workflows for ghost point labeling in these scenarios. This paper presents a LiDAR-assisted two-stage ghost noise automatic labeling method. The technical workflow first achieves precise mapping between radar and LiDAR point clouds through multi-sensor spatiotemporal alignment (time synchronization and spatial registration) and then labels ghost points using a two-stage strategy that combines distance threshold filtering with density-based clustering analysis (DBSCAN). Experiments covering three typical underground mining scenarios (straight tunnels, straight tunnels with side tunnels, and cross-tunnel turns) demonstrate that the proposed method significantly outperforms single distance threshold or clustering methods in terms of precision (95.15%, 98.81%, and 98.85%, respectively), recall (97.44%, 94.68%, and 98.03%, respectively, slightly lower than distance threshold methods in straight tunnels and cross-tunnel turns), and F1 Score (95.48%, 96.70%, and 98.01%, respectively). The method exhibits efficient ghost noise detection capability and robustness in underground mining environments, providing a practical solution for optimizing radar data quality in complex confined scenarios, with potential for application in similar industrial settings.

1. Introduction

1.1. Background and Motivation

Underground mining environments are characterized by their complexity and variability, featuring narrow spaces, irregular terrain, extremely low lighting conditions, and harsh attributes of high humidity and high dust levels [1,2]. These factors impose exceptionally high requirements on environmental perception technologies, making these environments one of the scenarios that traditional sensors struggle to effectively address. In the field of mining automation, environmental perception serves as the foundational technology for implementing autonomous navigation [3], target detection [4], and safety obstacle avoidance [5], core tasks where sensor selection directly impacts system reliability and efficiency [6]. Against this backdrop, 4D mmWave radar has emerged as an essential tool for environmental perception tasks in underground mining environments due to its strong penetration capabilities, interference resistance, and all-weather operational characteristics. Compared to conventional radar systems, 4D mmWave radar incorporates the additional dimension of height, providing three-dimensional spatial information and doppler velocity data about targets [7] (Figure 1a), thereby enabling powerful target detection, motion tracking, and environmental mapping [8]. These functionalities are critical for applications such as automated mining vehicles, collision prevention systems, and real-time hazard detection [9].
However, the application of 4D mmWave radar in underground mines also faces significant challenges, with ghost noise being the most prominent issue. Ghost noise consists of false point cloud data generated by multipath reflections [10,11], antenna interference, or environmental complexity factors. These data points do not exist in the actual environment but are misidentified by the radar as real objects (Figure 1b,c). Particularly in underground mines, the complex characteristics of metal support structures, mining carts, and irregular rock surface walls create severe multipath reflection phenomena, resulting in substantial ghost noise generation [12]. These false point clouds not only significantly degrade the quality of 4D mmWave radar point cloud data but also directly interfere with target detection, mapping, and autonomous navigation tasks, potentially introducing safety risks. Consequently, accurately identifying and removing ghost noise points has become one of the core challenges in enhancing 4D mmWave radar data quality.

1.2. Related Work

The existing research on ghost noise detection and automated labeling can be broadly categorized into two main streams: methods operating at the radar signal processing stage and techniques for automated point cloud labeling. This subsection provides a comprehensive review of these approaches and identifies the gaps that motivate our research.

1.2.1. Ghost Noise Detection at the Signal Processing Stage

Most current methods for labeling and removing ghost noise operate at the radar signal processing stage [10,11,13], before point cloud generation. Liu et al. [14] developed a multipath propagation model for frequency-modulated continuous wave (FMCW) automotive radar, analyzing its impact on target detection while designing a simple yet effective algorithm to eliminate ghost targets, with performance validated through numerical simulation. Cheng et al. [15] focused on millimeter-wave radar point cloud generation, proposing a novel point cloud generation method and evaluation metrics to address radar point cloud sparsity and ghost target issues, demonstrating advantages in enhancing environmental perception capabilities through experimental validation. Luo et al. [13] proposed a multipath ghost identification method for sparse multiple-input multiple-output (MIMO) radar based on differences in direction of departure (DOD) and direction of arrival (DOA), utilizing multi-frame data accumulation and the linear distance relationship of multipath signals to accurately identify first-order and second-order multipath signals, with effectiveness verified experimentally.
While these signal processing-based approaches have demonstrated effectiveness in controlled scenarios, these methods are limited to identifying ghost noise at the radar signal processing stage, relying on specific signal models and environmental assumptions, making it difficult to completely eliminate higher-order multipath or noise in dynamic environments, potentially affecting subsequent point cloud generation and target detection accuracy. Moreover, these methods typically require access to raw radar signals and deep understanding of radar hardware configurations, which may not always be feasible in practical applications. Therefore, direct processing of radar point clouds is equally crucial, as it contains rich spatial and geometric information that complements the limitations of signal processing stages.

1.2.2. Automated Point Cloud Labeling Techniques

Regarding automated labeling methods for point cloud data, despite various automatic labeling techniques proposed in the LiDAR point cloud processing field, their application to 4D mmWave radar data remains limited. For instance, rule-based labeling methods [16] struggle to adapt to the complexity of mining environments and the inherent sparsity of 4D mmWave radar point cloud data, while deep learning-based labeling methods depend on large amounts of high-quality annotated data [17], which is particularly scarce in mining scenarios.
The fundamental challenge lies in the distinct characteristics of 4D mmWave radar point clouds compared to LiDAR point clouds. Radar point clouds exhibit higher sparsity, lower spatial resolution, and unique noise patterns that are not adequately addressed by existing LiDAR-oriented labeling methods. Consequently, research on 4D mmWave radar ghost noise labeling remains insufficient, especially in underground mining contexts. Currently, publicly available 4D mmWave radar datasets [18,19,20] generally lack high-quality data with ghost noise labels, and existing ghost noise labeling methods mostly rely on manual annotation. This manual labeling approach is not only time-consuming, labor-intensive, and costly, but also susceptible to subjective factors, making it difficult to meet the large-scale, diverse data requirements of mining environments. Furthermore, the lack of standardized labeling protocols and evaluation metrics for ghost noise in radar point clouds hinders the development and validation of automated labeling methods. This dual deficiency in data and methods severely hinders the further application and optimization of 4D mmWave radar in underground mining environments.

1.2.3. Research Gaps

Based on the above review, several critical research gaps can be identified. First, existing ghost noise detection methods predominantly focus on either the signal processing stage or generic point cloud processing, lacking specialized solutions that can effectively handle the unique challenges of underground mining environments where severe multipath effects and environmental complexity prevail. Second, there is a notable absence of methods that can leverage the complementary strengths of multiple sensors, particularly the combination of high-precision LiDAR and robust 4D mmWave radar, for automated ghost noise labeling. Third, the scarcity of high-quality labeled datasets specifically for 4D mmWave radar in mining scenarios creates a bottleneck for both method development and performance evaluation. These identified gaps present significant opportunities for advancing the state-of-the-art in 4D mmWave radar data processing for underground mining applications. Therefore, developing an automated ghost noise labeling method suitable for underground mining environments has become an urgent research need.

1.3. Contributions

To address these challenges, there is a pressing need for an efficient, automated ghost noise labeling method to replace manual labeling and meet the requirements for high-precision, large-scale annotation. In this context, LiDAR, with its high point cloud accuracy and strong anti-interference capabilities, emerges as an ideal reference tool. LiDAR point clouds can provide reliable three-dimensional spatial information in complex environments [21], and by comparing them with 4D mmWave radar point clouds, false ghost noise points can be effectively identified. Therefore, designing a LiDAR-assisted automatic labeling method for 4D mmWave radar ghost noise not only significantly improves labeling efficiency but also provides essential data foundations for subsequent ghost noise removal research.
This paper aims to propose an automatic labeling method for 4D mmWave radar ghost noise points based on LiDAR, which can be used to generate 4D mmWave radar datasets with ghost noise labels (Figure 2). By leveraging the high-precision characteristics of LiDAR point clouds as a labeling reference, combined with algorithms such as the distance threshold method and clustering analysis, this approach achieves efficient detection and labeling of ghost noise to address current data annotation bottlenecks in research and provide important support for radar data denoising research in underground mining environments. The main contributions of this paper include the following two aspects:
(1)
A lightweight two-stage ghost noise detection method is proposed, combining the distance threshold method with clustering analysis, which breaks the dependency on traditional signal processing and achieves efficient detection at the point cloud level: first using the distance threshold method to quickly screen candidate noise points, then further verifying through clustering analysis, thereby enhancing the accuracy and robustness of ghost noise point detection.
(2)
An automatic labeling workflow tailored for underground mining environments is designed: from data preprocessing to noise detection and labeling, to validation, this paper designs a complete automated workflow that significantly reduces the cost and complexity of manual labeling.
Through the above research work, this paper not only provides new technical means for the study of 4D mmWave radar ghost noise labeling issues but also lays an important foundation for the application of 4D mmWave radar in complex underground mining scenarios.

2. Methodology

2.1. Data Preprocessing

In the data preprocessing stage prior to labeling, time synchronization and spatial alignment are crucial steps for achieving consistency between data from both sensors. To ensure spatiotemporal consistency between LiDAR and 4D mmWave radar data, this paper adopts a standardized data preprocessing workflow to provide high-quality input data for the subsequent ghost noise detection algorithm.

2.1.1. Time Synchronization

The objective of time synchronization is to align LiDAR and 4D mmWave radar data under the same time reference, enabling paired usage of point cloud data from both sensors. Although the data used in this paper achieved preliminary synchronization with the recording computer through hardware synchronization, timestamp discrepancies may still occur due to different sampling frequencies between LiDAR and 4D mmWave radar. Therefore, this paper employs a software synchronization method based on nearest neighbor timestamp matching on top of the hardware synchronization to further enhance the precision of temporal alignment.
The principle of timestamp-based nearest neighbor matching is as follows: Assume that the timestamp sequence of the LiDAR point cloud is TL, and the timestamp sequence of the 4D mmWave radar is TR. For each frame of the LiDAR point cloud, its corresponding synchronized 4D mmWave radar point cloud needs to satisfy the minimum absolute difference between timestamps. That is, for the LiDAR timestamp TL[i], find the closest 4D mmWave radar timestamp TR[j] that satisfies:
j = a r g   m i n T L i T R j
where TL[i] represents the timestamp of the i-th frame of the LiDAR point cloud, and TR[j] represents the timestamp of the j-th frame of the 4D mmWave radar point cloud.
To achieve time synchronization of LiDAR and 4D mmWave radar point cloud data, the timestamp of each frame of point cloud is first extracted from the raw data of the two sensors. Then, for each LiDAR data timestamp TL[i], the 4D mmWave radar timestamp sequence TR[j] is traversed to find the 4D mmWave radar timestamp TR[j] that satisfies Equation (1). Finally, the LiDAR and 4D mmWave radar point cloud data with the closest timestamps are paired to form synchronized data pairs (TL[i], TR[j]). This method can effectively solve the time alignment problem caused by the different sampling frequencies of the two sensors, providing consistency for subsequent automatic labeling work.

2.1.2. Spatial Alignment

To achieve spatial consistency between LiDAR and 4D mmWave radar point cloud data, the point clouds from both sensors are uniformly converted to the base coordinate system (Base coordinate system) of the acquisition device. Through the calibration process, the extrinsic parameter information of the LiDAR and 4D mmWave radar relative to the base coordinate system, including the rotation quaternion and translation vector, has been obtained. On this basis, the coordinate transformation of point clouds can be performed through linear transformation using rotation matrices and translation vectors. Let the coordinate system of the LiDAR be L, the coordinate system of the 4D mmWave radar be R, and the base coordinate system be B. The point cloud coordinates in the LiDAR coordinate system are (xL, yL, zL), the point cloud coordinates in the 4D mmWave radar coordinate system are (xR, yR, zR), and the point cloud coordinates in the base coordinate system are (xB, yB, zB). For the relationship between the point cloud coordinates of the two sensors and the base coordinate system, this paper adopts the following linear transformation formulas:
Coordinate transformation formula for LiDAR point cloud:
x B y B z B = R L B x L y L z L + t L x t L y t L z
Coordinate transformation formula for 4D mmWave radar point cloud:
x B y B z B = R R B x R y R z R + t R x t R y t R z
where R L B and R R B are the rotation matrices of the LiDAR and 4D mmWave radar, respectively, and t L x     t L y   t L z T and t R x     t R y   t R z T are the translation vectors of the LiDAR and 4D mmWave radar, respectively.
Through spatial alignment, the point cloud data of the LiDAR and 4D mmWave radar are unified into the same coordinate system. This process ensures the geometric spatial consistency of the two sensors, thus avoiding the accumulation of errors caused by coordinate system deviations and providing high-quality point cloud input for subsequent labeling tasks.

2.2. Ghost Noise Detection

2.2.1. Distance Threshold Method

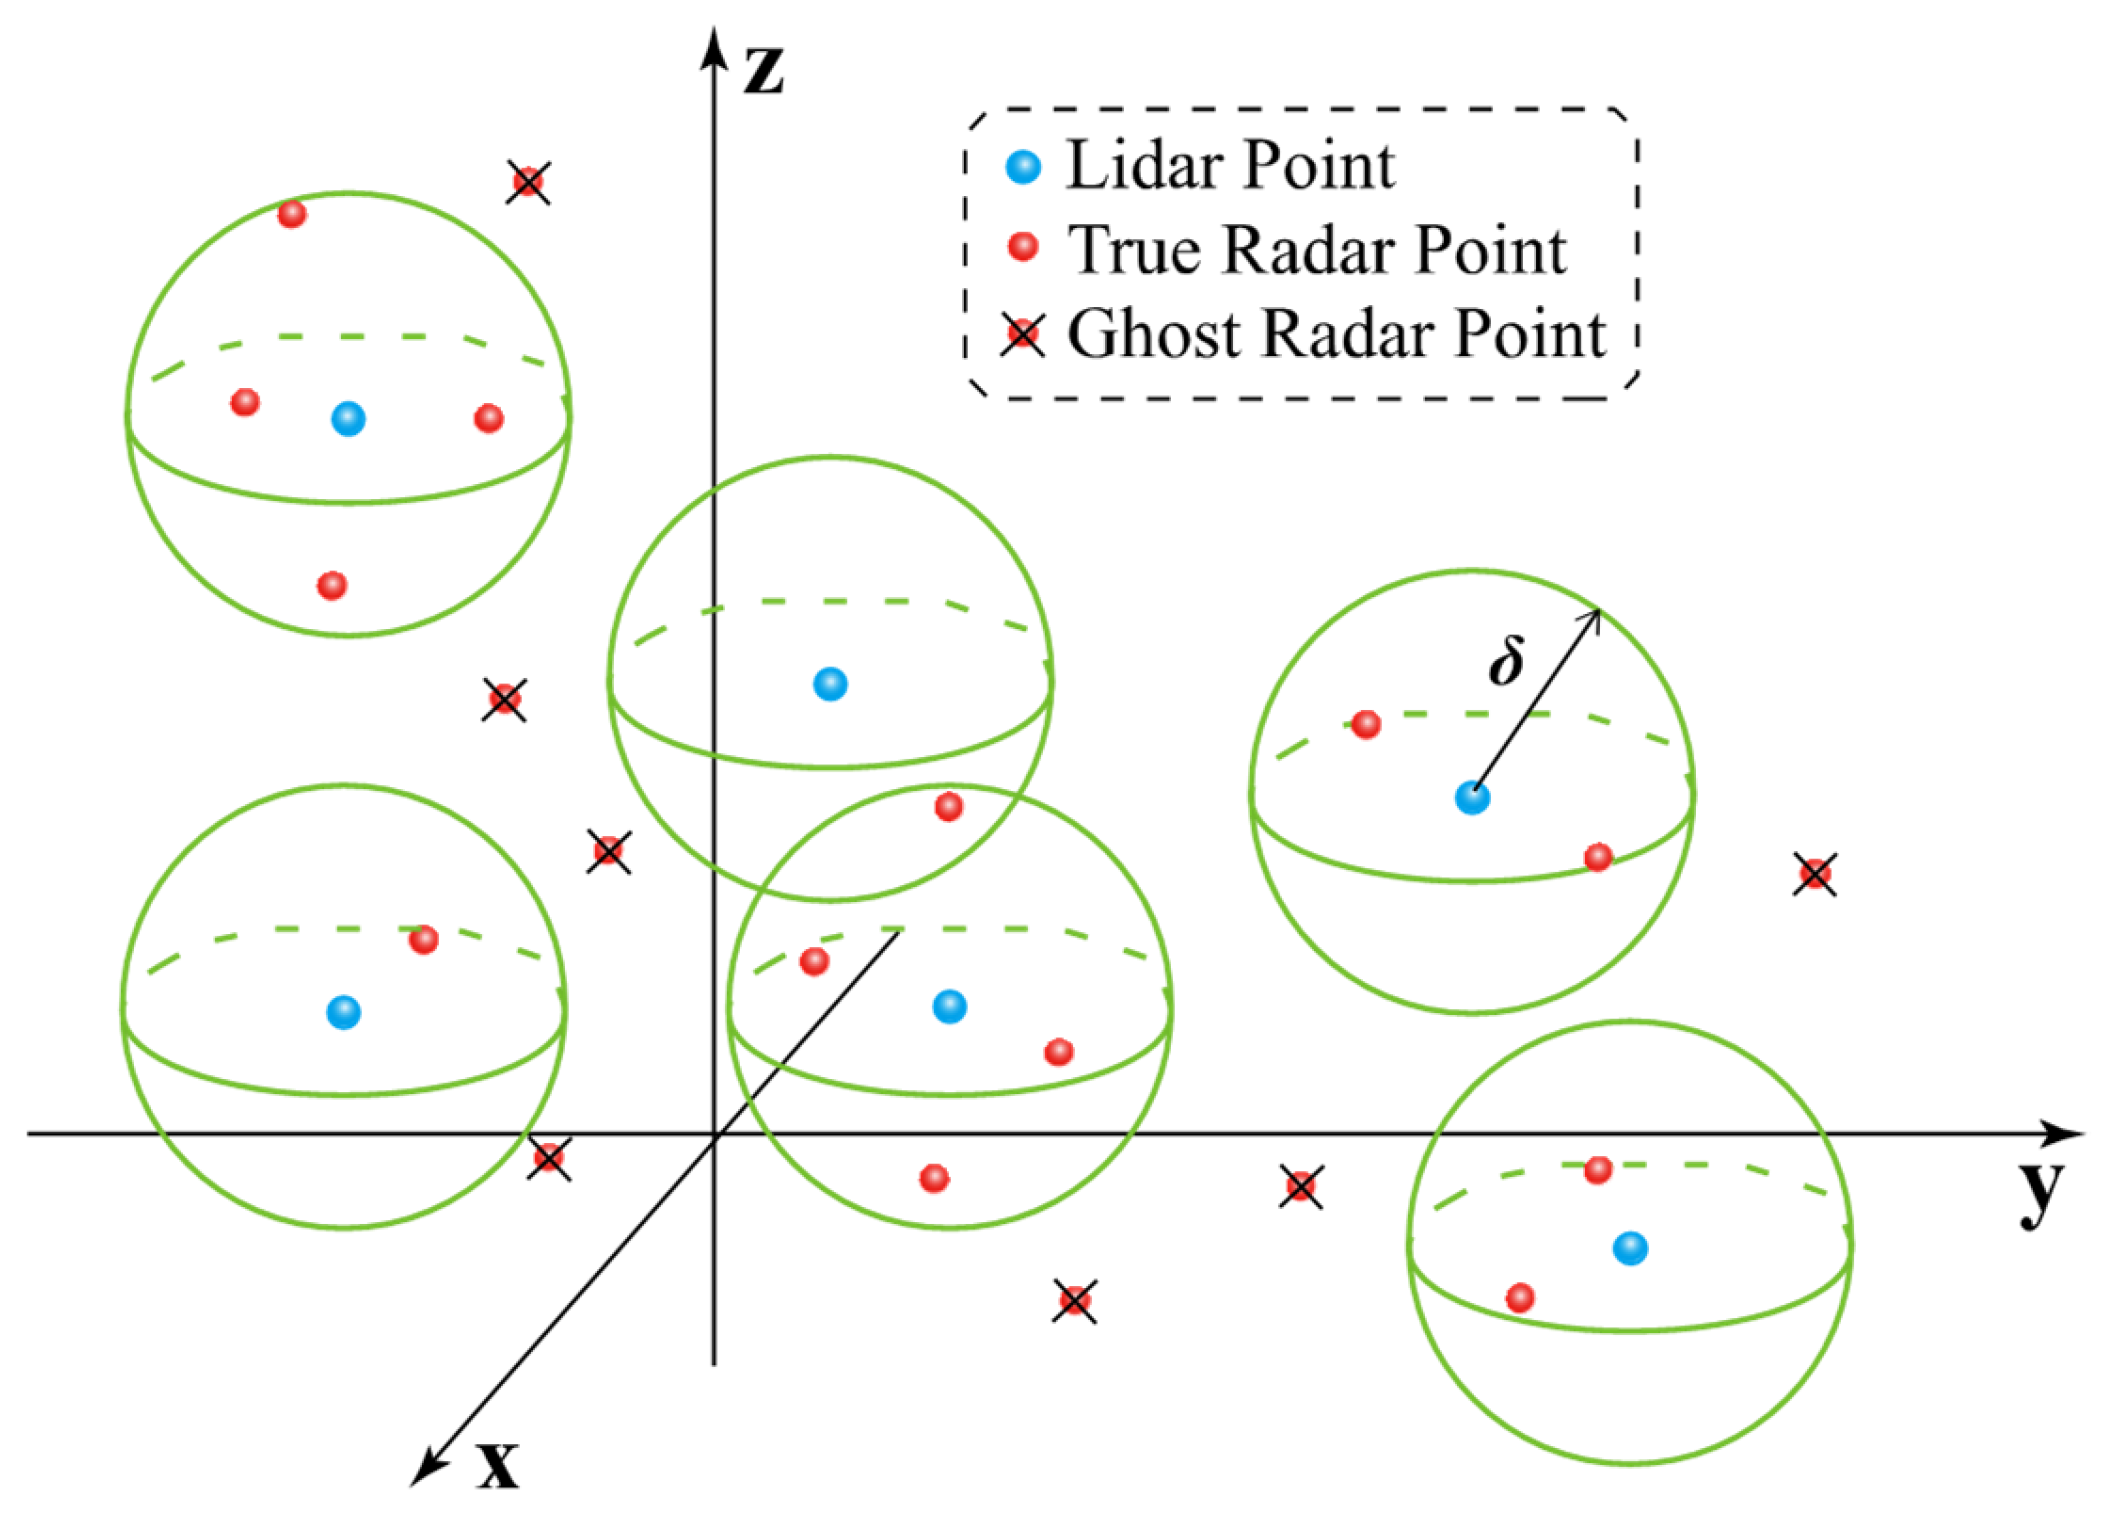
The core idea of the distance threshold method [22,23] is to discriminate based on the spatial characteristics of ghost noise points (Figure 3). The significant feature of ghost noise points is that they usually have no corresponding relationship with real objects in the 4D mmWave radar point cloud and have no matching points in the LiDAR point cloud. Therefore, by calculating the distance between each point in the 4D mmWave radar point cloud and the nearest point in the LiDAR point cloud, it can be effectively determined whether it is a ghost noise point. If the distance between a point and the nearest point in the LiDAR point cloud exceeds a set threshold, the point is labeled as a ghost noise point.
The mathematical description of this method is as follows: Let the 4D mmWave radar point cloud be the set N R = P R i | P R i = x R i , y R i , z R i , and the LiDAR point cloud be the set N L = P L j | P L j = x L j , y L j , z L j . For each 4D mmWave radar point P R i N R , its Euclidean distance to the nearest point in the LiDAR point cloud is defined as:
d P R i , N L = m i n P L j N L P R i P L j
where represents the Euclidean distance. If a point satisfies d P R i , N L > δ , where δ is a preset distance threshold, then the point P R i is labeled as a ghost noise point. The selection of the distance threshold δ needs to be optimized based on the sensor accuracy and actual environmental characteristics to balance the accuracy and robustness of the detection.

2.2.2. Clustering Analysis Method

The clustering analysis method [24,25] detects ghost noise points through the global distribution characteristics of point clouds (Figure 4). Real objects in point clouds usually exhibit clusters with a certain spatial distribution, while ghost noise points are often isolated or cannot form meaningful clusters. Based on this property, ghost noise points can be detected through clustering analysis. The specific method is to perform clustering on the LiDAR point cloud and the 4D mmWave radar point cloud separately, and then identify points without corresponding relationships through cluster matching, thereby labeling them as ghost noise points.
The mathematical description is as follows: Let the LiDAR point cloud and the 4D mmWave radar point cloud be divided into several clusters C L = C L 1 , C L 2 , , C L m and C R = C R 1 , C R 2 , , C R n , respectively, after being processed by the clustering algorithm, where each cluster C represents a subset of the point cloud. For each cluster C R k C R in the 4D mmWave radar point cloud, calculate the distance to the nearest cluster in the LiDAR point cloud cluster set C L :
D C R k , C L = m i n C L j C L m i n P R C R k , P L C L j P R P L
where ‖⋅‖ represents the Euclidean distance, and P R and P L represent the 4D mmWave radar point and the LiDAR point, respectively. If a cluster C R k satisfies D C R k , C L > λ , where λ is the distance threshold between clusters, then all points in the cluster C R k are considered to be ghost noise points.

2.2.3. Two-Stage Method

The distance threshold method is simple to compute and efficient, capable of quickly filtering out noise points that have no corresponding relationship with the LiDAR point cloud. However, in scenarios with uneven point cloud density or complex environments, this method may have the risk of false positives and false negatives, thus requiring further verification methods to improve detection accuracy. The clustering analysis method utilizes the global distribution characteristics of point clouds and can effectively detect sparsely distributed noise points while avoiding misjudgments that may occur when only using local point cloud density. Nevertheless, its computational complexity is relatively high, especially when the amount of point cloud data is large, and the time cost of clustering analysis is significant. Therefore, using the clustering analysis method alone may not be suitable for scenarios with high real-time requirements. To balance detection efficiency and accuracy, this paper combines the distance threshold method with the clustering analysis method and proposes a two-stage ghost noise detection approach. First, the distance threshold method is used to preliminarily filter the 4D mmWave radar point cloud and quickly remove obvious noise points; then, the clustering analysis method is applied to the remaining candidate points for further verification, improving the accuracy and robustness of the detection.
  • Stage 1: Preliminary filtering
In the preliminary filtering stage, the distance threshold method is used to calculate the nearest neighbor distance d P R i , N L between each 4D mmWave radar point P R i N R and the LiDAR point cloud. This paper uses KD-Tree to accelerate the computation in the nearest neighbor search. By constructing the spatial index structure of the LiDAR point cloud N L , the nearest neighbor point of each 4D mmWave radar point cloud point P R i can be quickly found, significantly reducing the computational complexity. If a point satisfies d P R i , N L > δ , where δ is the distance threshold, it is labeled as a candidate noise point set G R c a n d i d a t e . Mathematically, the candidate noise point set is defined as:
G R c a n d i d a t e = P R i N R d P R i , N L > δ
The distance threshold δ should be selected based on the combined uncertainties from radar range resolution, LiDAR point accuracy, and multi-sensor calibration errors. In practice, a value in the range of 0.5–0.8 m is recommended for typical automotive 4D Radar-LiDAR systems, which accommodates measurement errors while effectively identifying ghost points displaced by multipath reflections.
  • Stage 2: Clustering verification
In the further verification stage, clustering analysis is performed on the candidate point set G R c a n d i d a t e to validate whether its distribution characteristics match the features of ghost noise points. This paper employs the DBSCAN algorithm [26] to cluster the candidate points and optimizes the clustering effect by adjusting the key parameters eps (neighborhood radius) and min_samples (minimum number of cluster points). DBSCAN can automatically identify sparsely distributed noise points based on the density characteristics of the point cloud while distinguishing the point cloud clusters of real objects. The candidate point set G R c a n d i d a t e is partitioned into clusters C c a n d i d a t e = C c a n d i d a t e 1 , C c a n d i d a t e 2 , , C c a n d i d a t e k through DBSCAN clustering. For each cluster C c a n d i d a t e i C c a n d i d a t e , the minimum distance to the LiDAR point cloud clusters C L is computed:
D c l u s t e r C c a n d i d a t e i , C L = m i n C L j C L m i n P R C c a n d i d a t e i , P L C L j P R P L
If a cluster satisfies D c l u s t e r C c a n d i d a t e i , C L > λ , where λ is the inter-cluster distance threshold, all points in C c a n d i d a t e i are labeled as ghost noise points. The final ghost noise point set is:
G R g h o s t = C c a n d i d a t e i : D c l u s t e r C c a n d i d a t e i , C L > λ C c a n d i d a t e i
The DBSCAN neighborhood radius eps should be set slightly larger than δ (typically 0.6–0.9 m) to allow candidate points from the same ghost phenomenon to be grouped together. The minimum cluster size min_samples is typically set to 2–3, as ghost points from multipath reflections appear as isolated points or very sparse clusters, distinguishing them from real objects that generate denser point groups. If some points in certain clusters fail to match the clusters of the LiDAR point cloud, they are labeled as ghost noise points.

3. Experimental Results

3.1. Dataset Description

The data used in this paper is from the underground mine data section of the mine-and-forest-radar-dataset in the literature [27]. The dataset was collected from the underground tunnel environment of the Kvarntorp test mine in Sweden and contains point cloud data from LiDAR and 4D mmWave radar (Figure 5). The dataset is relatively large in scale. The LiDAR used is the Ouster OS1-32 lidar, which collects high-resolution point cloud data at a frequency of 10 Hz. The 4D mmWave radar used is the Sensrad Hugin A3 radar, which collects data at a frequency of 16 Hz, with a maximum detection range of 42 m, a horizontal resolution of 1.25°, and a vertical resolution of 1.7° (Table 1). The data features include complex reflections, occlusions, and multipath effects. The mine tunnel environment includes straight tunnels and side tunnels. The data was collected through a sensor suite installed on the roof of a pickup truck (including LiDAR, mmWave radar, IMU, and camera), traveling 4500 m at an average speed of 21 km/h. The raw data is saved as ROS bag files.

3.2. Evaluation Metrics

To evaluate the performance of the method, this paper adopts some classic classification evaluation metrics, including Precision, Recall, and F1 Score [29]. These metrics can reflect the performance of the algorithm in detecting ghost noise points from different perspectives, providing a more comprehensive performance analysis.

3.2.1. Precision

Precision represents the proportion of samples labeled as ghost noise points that are truly ghost noise points. Precision reflects the accuracy of the algorithm in labeling ghost noise points. The higher the precision, the more accurate the method is in identifying noise points, with a lower false positive rate. The calculation formula is:
P r e c i s i o n = T P T P + F P
where TP is the number of correctly labeled ghost noise points, and FP is the number of incorrectly labeled ghost noise points.

3.2.2. Recall

Recall represents the proportion of all true ghost noise points that are correctly labeled. Recall reflects the completeness of the algorithm in detecting ghost noise points. A high recall rate means that the method can more comprehensively detect all noise points.
R e c a l l = T P T P + F N
where TP is the number of correctly labeled ghost noise points, FP is the number of incorrectly labeled ghost noise points, and FN is the number of incorrectly labeled real points.

3.2.3. F1 Score

The F1 Score is the harmonic mean of precision and recall, used to comprehensively evaluate the performance of the algorithm. The higher the F1 Score, the better the balance achieved by the algorithm between accuracy and completeness. The calculation formula is:
F1_Score = 2 × P r e c i s i o n × R e c a l l P r e c i s i o n + R e c a l l

3.3. Results

To comprehensively evaluate the performance of the proposed ghost noise detection method, we conducted experiments in three typical underground mine scenarios in the dataset: straight tunnels, straight tunnels with side tunnels, and cross-tunnel turns. The experiments compared the performance of different methods: the Distance Threshold method, the DBSCAN Clustering method, the K-medoids clustering method, the Statistical Outliers Removal (SOR) method, and the proposed two-stage Hybrid method. The evaluation metrics included Precision, Recall, and F1 Score, and a quantitative comparison was made with the manually labeled results. Table 2 presents the performance comparison results of different methods in different scenarios.
The proposed hybrid method in this paper demonstrates superior performance in all scenarios, with F1 Scores significantly higher than other methods, proving that it achieves a good balance between Precision and Recall. In comparison, the DBSCAN clustering method performs poorly in Recall, resulting in lower F1 Scores. The K-Medoids method shows unstable performance across different scenarios, with particularly low Recall in complex environments such as cross-tunnel turns (2.54%). The SOR method demonstrates moderate Precision in straight tunnels (94.12%) but suffers from extremely low Recall across all scenarios, leading to poor overall F1 Scores. In terms of Precision, the proposed hybrid method consistently outperforms the other four methods in all scenarios, effectively reducing the false alarm rate. In the straight tunnel with side tunnels scenario, the Precision of our method reaches 98.81%, significantly higher than the distance threshold method (24.56%) and the clustering analysis method (89.06%), the K-Medoids method (36.08%), and the SOR method (60.93%). Regarding Recall, the distance threshold method performs well, especially in the straight tunnel scenario, achieving 97.44%. However, due to the lack of subsequent verification steps, it has a high false alarm rate and low Precision. Our proposed hybrid method maintains a high level of Recall (94.68–97.18%) by further verifying the candidate points.
To evaluate the computational efficiency of different methods for practical deployment in automated dataset annotation, we analyzed the runtime performance across the three scenarios. Table 3 presents the processing time and speed for each method. The distance threshold method demonstrates the fastest processing speed, particularly in the straight tunnels with side tunnels scenario (349,093 points/s), due to its simple computational process. The DBSCAN clustering method also shows high processing speed (138,990–236,941 points/s) across all scenarios. In comparison, our proposed two-stage hybrid method requires more processing time due to its sequential filtering steps, with speeds ranging from 16,316 to 36,157 points/s depending on scenario complexity. The K-Medoids and SOR methods show intermediate performance. While our method has longer processing times, it remains highly efficient for automated dataset labeling of 4D Radar point clouds, significantly reducing the time and labor costs compared to manual annotation. The computational trade-off is justified by the significantly superior detection accuracy demonstrated in Table 2, making it a practical solution for generating high-quality labeled datasets.
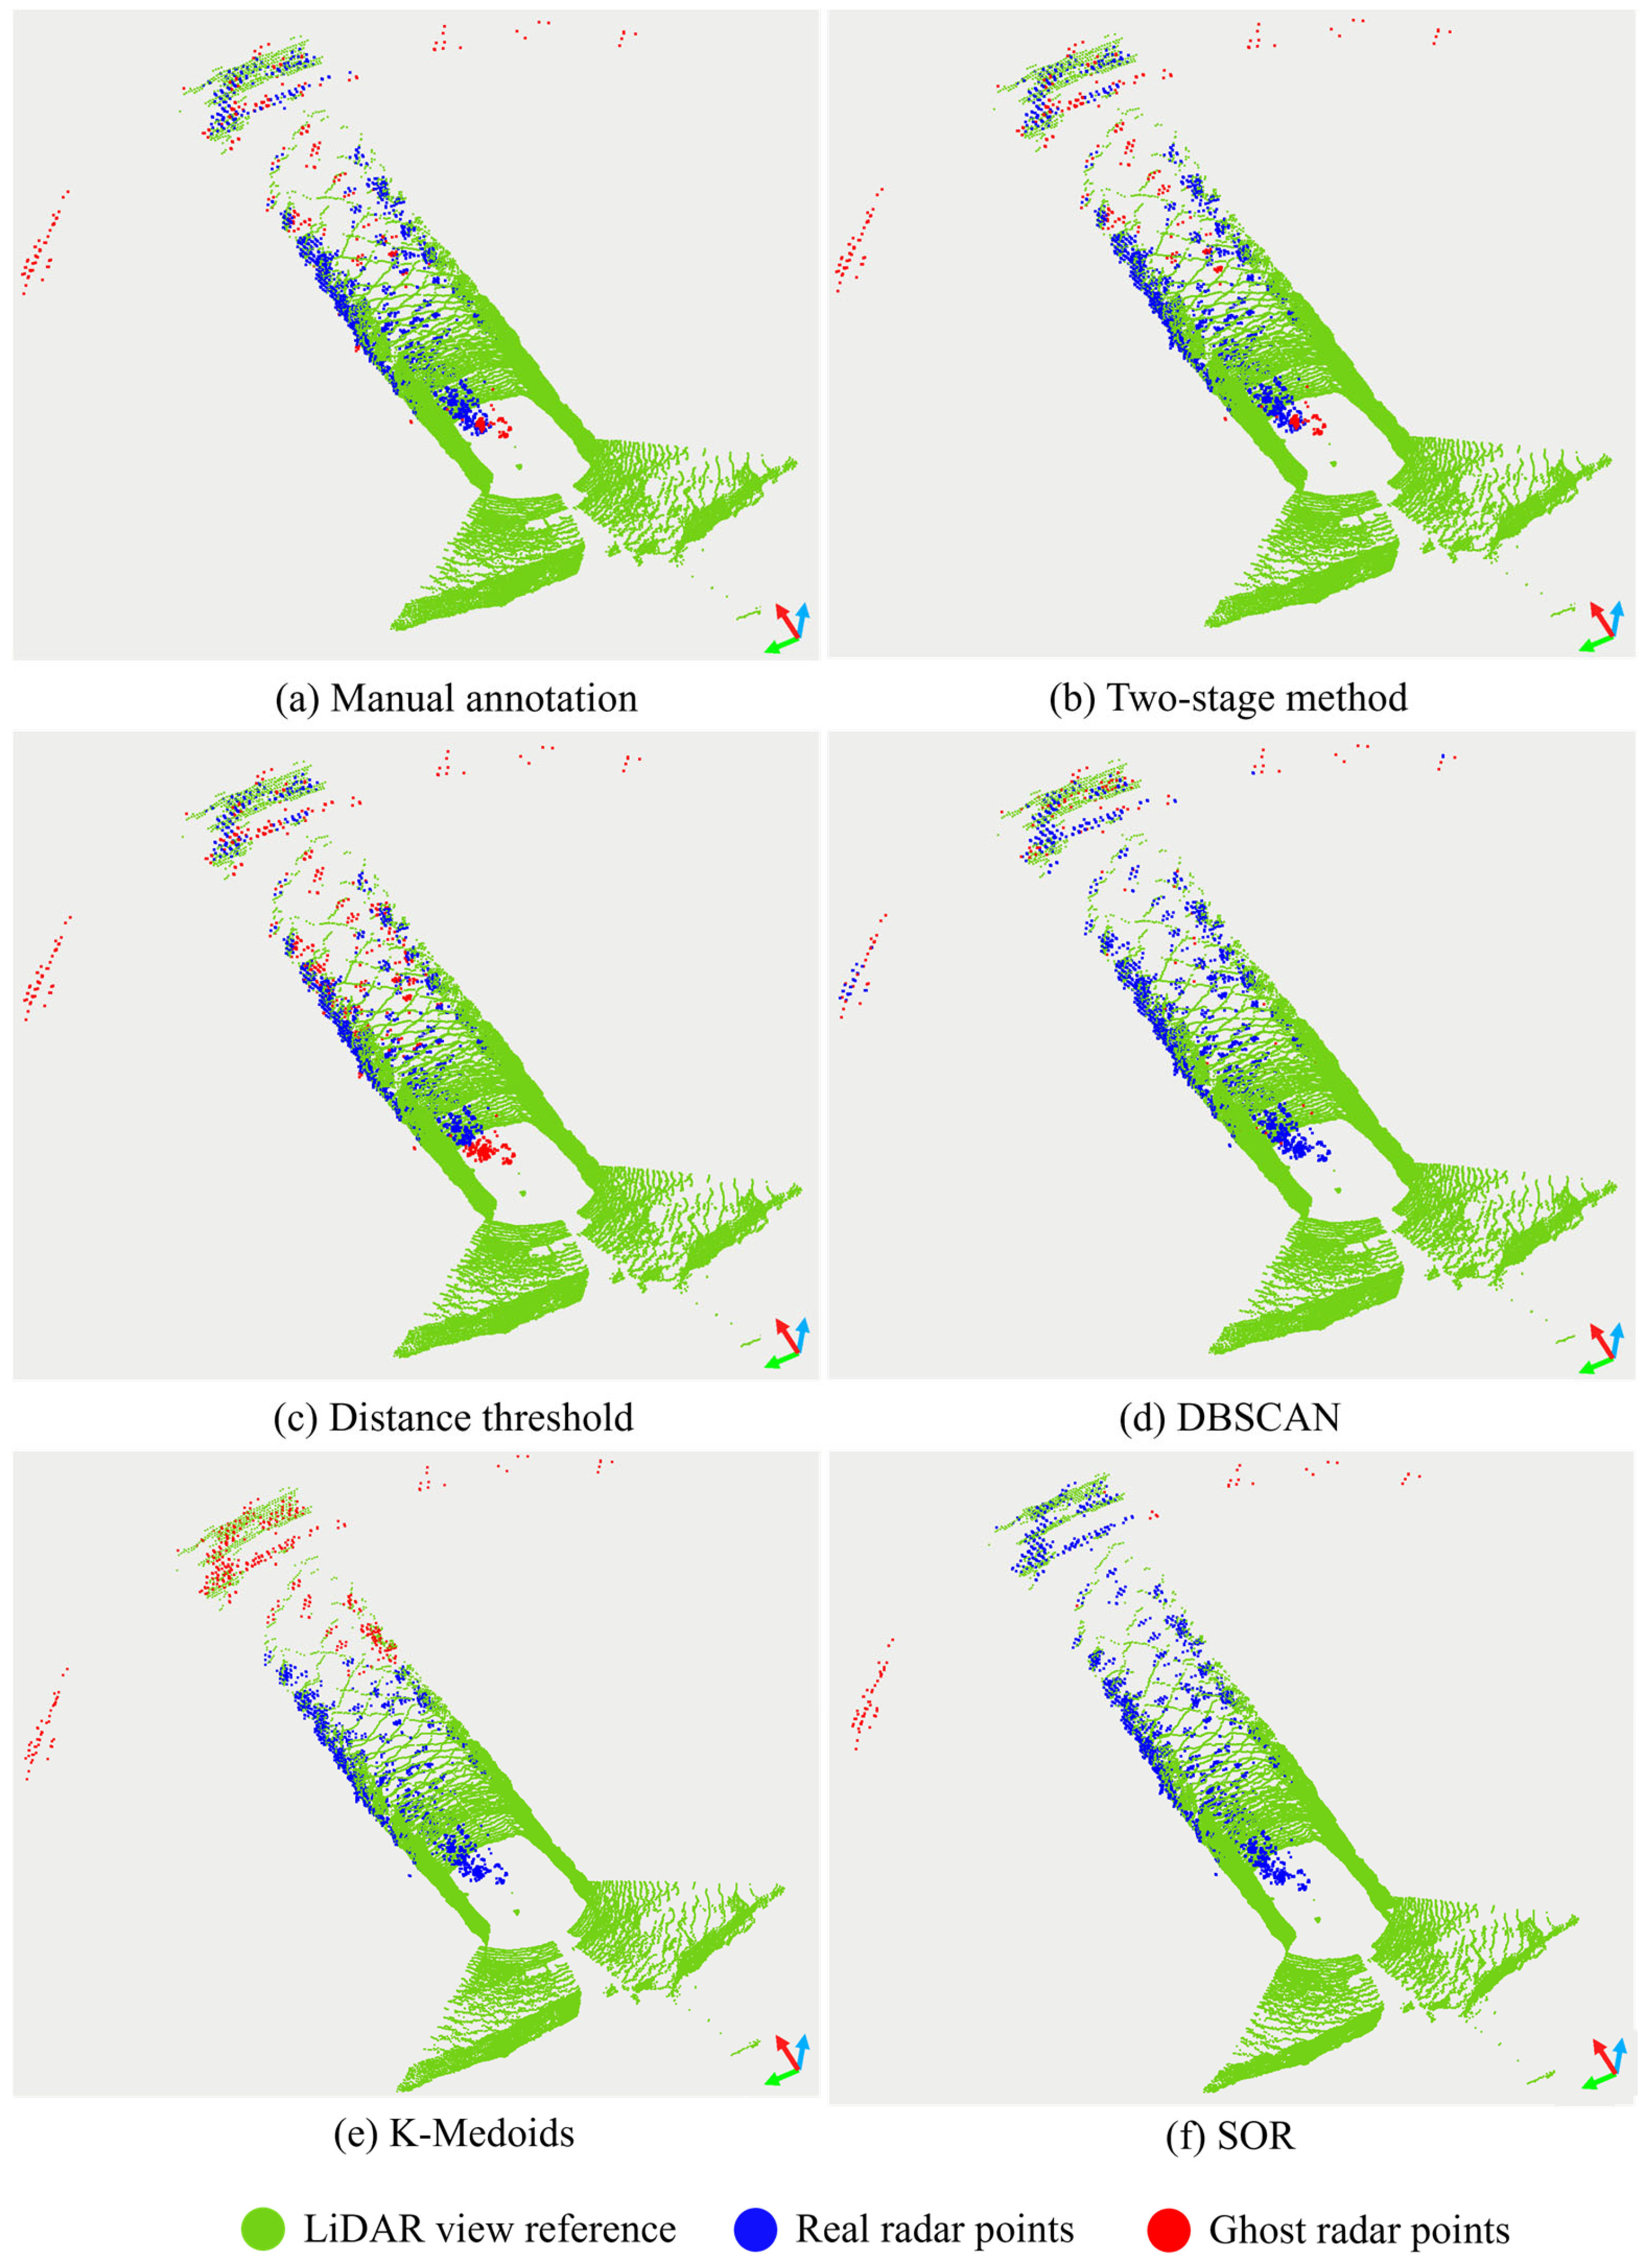
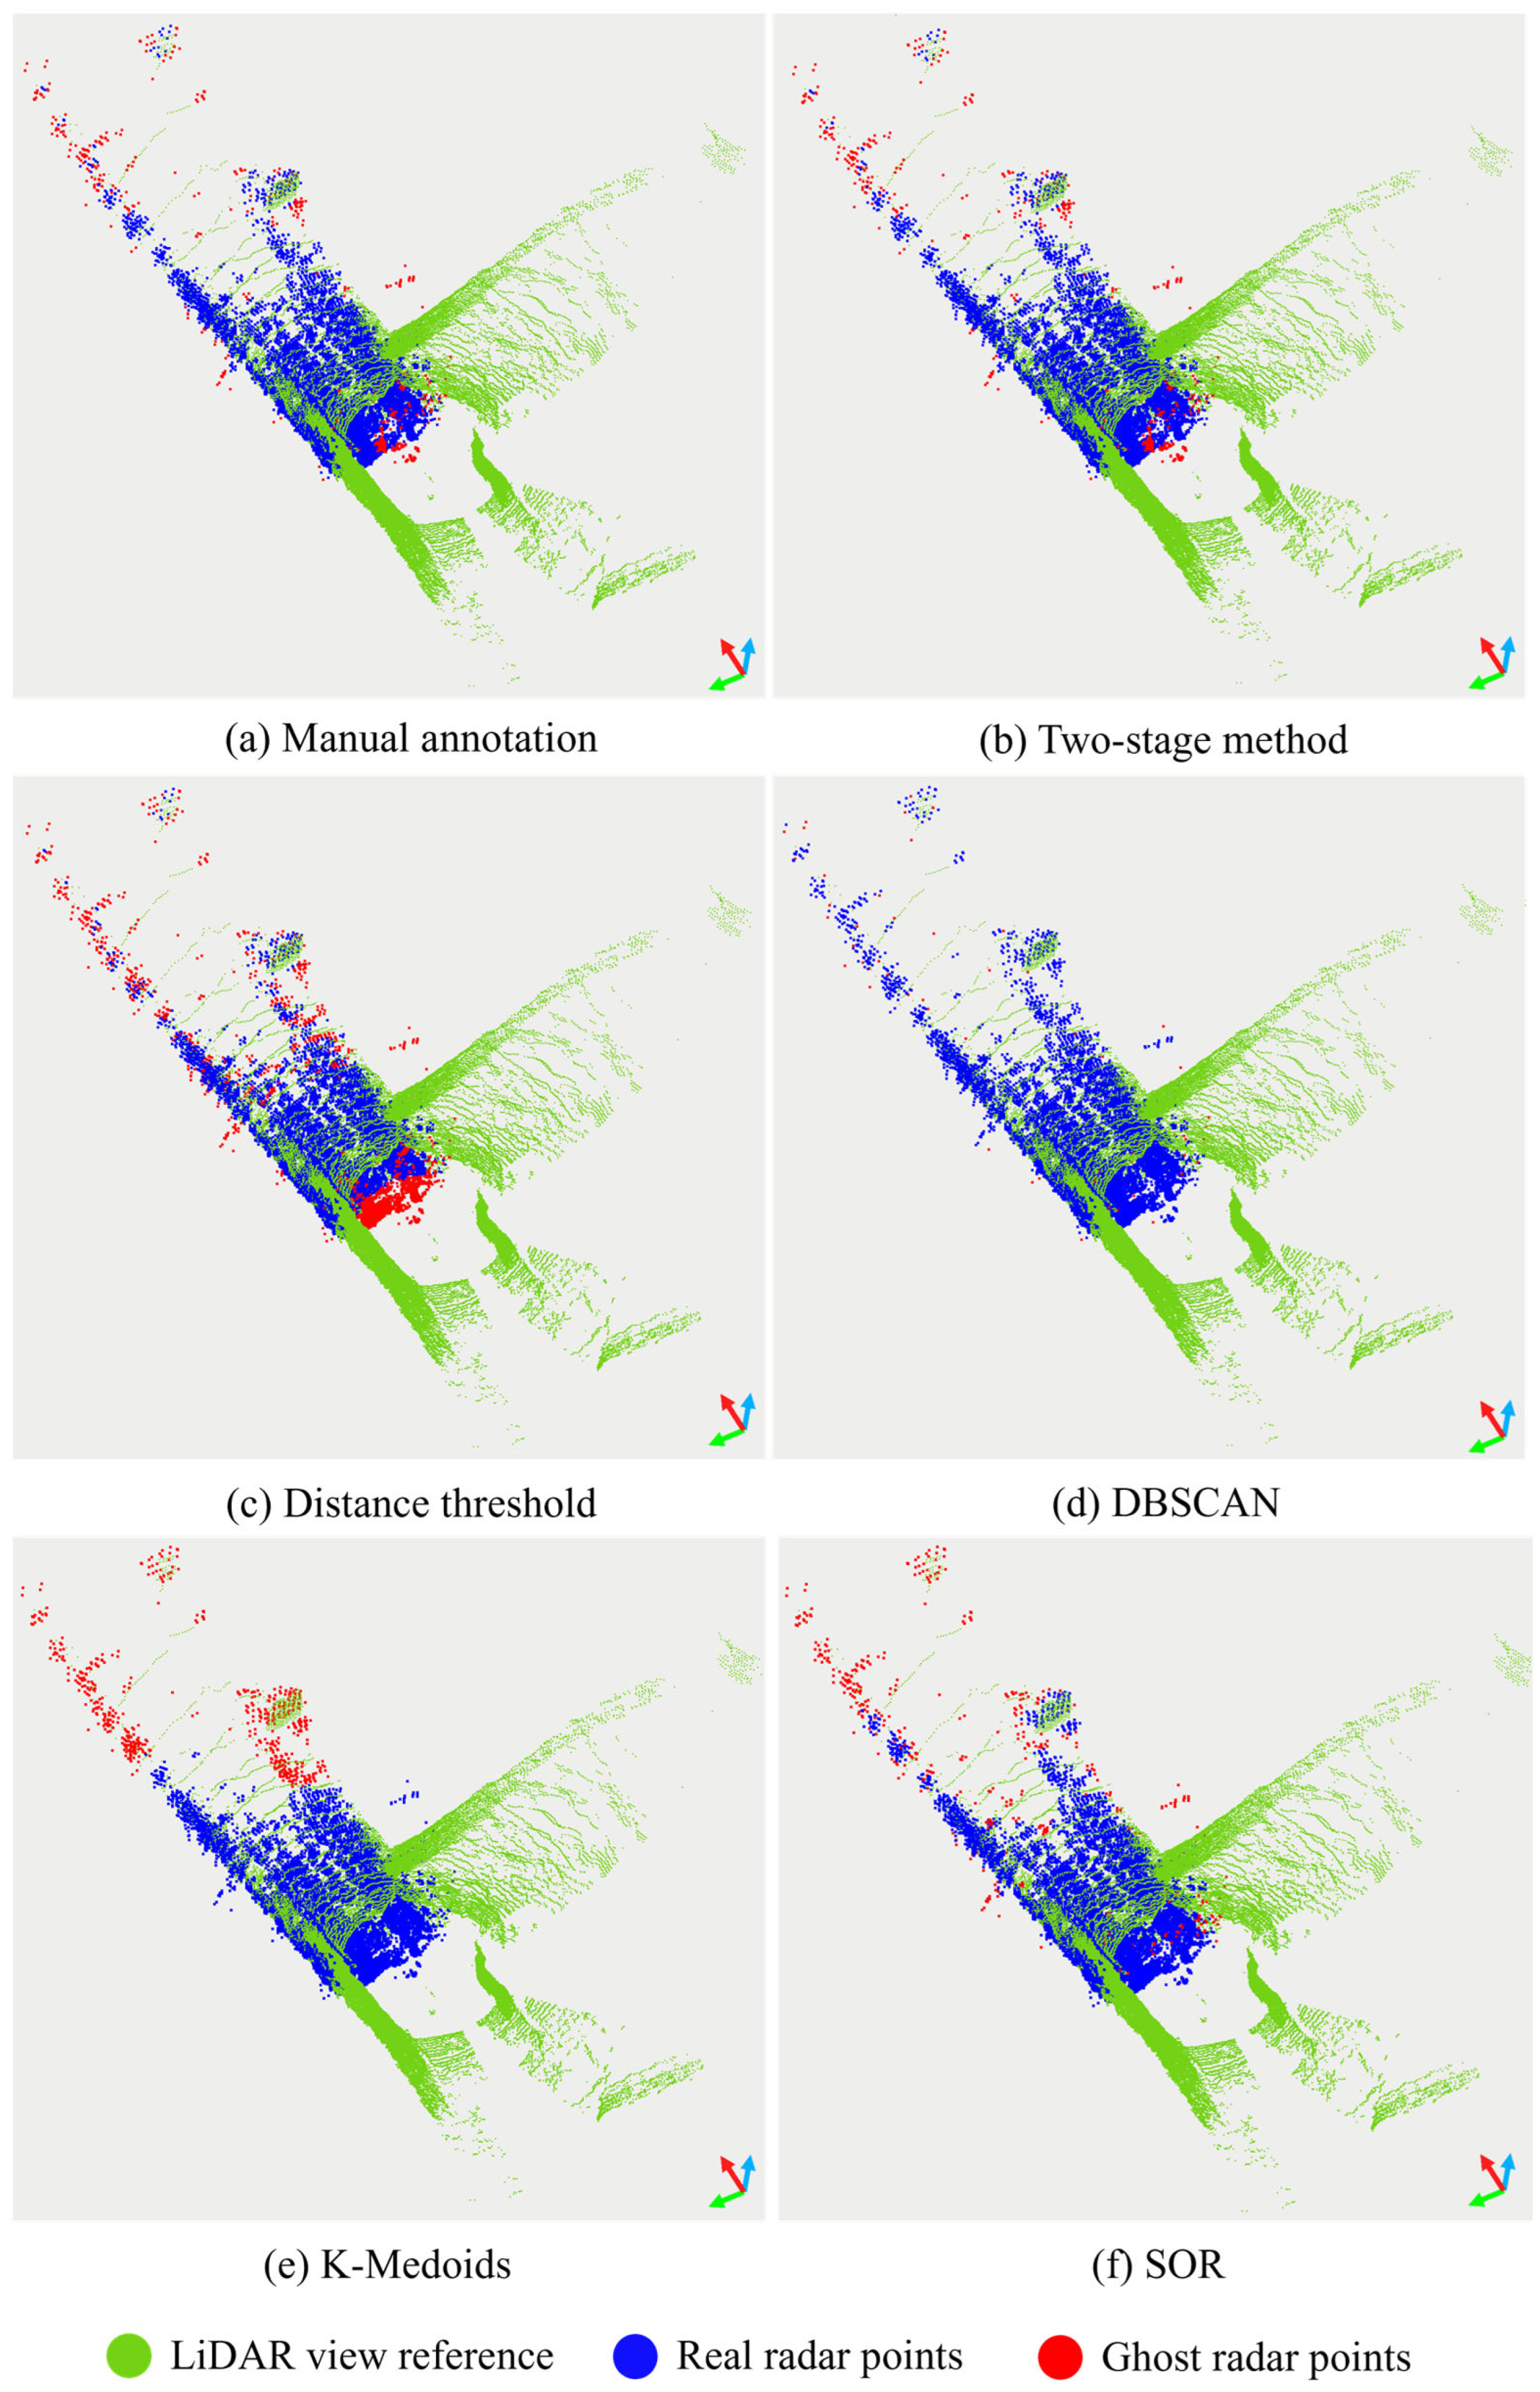
From the comparison of the labeled results, it can be observed that in the straight tunnel scenario (Figure 6), the hybrid method can accurately identify real points and noise points, exhibiting the best performance due to the relatively simple environment. In the straight tunnel with side tunnels scenario (Figure 7), the distance threshold method tends to generate more false alarms and has low Precision due to the complex side tunnels’ reflection signals. The K-Medoids method also struggles with the complex reflections, achieving only 32.70% Recall. The SOR method, while showing improved Precision, still fails to achieve satisfactory Recall (43.09%). In contrast, the hybrid method effectively eliminates most noise points through clustering verification. At the cross-tunnel turn (Figure 8), the complexity of multipath reflections and structural complexity increases. The DBSCAN clustering method is sensitive to parameters, resulting in poor Recall and F1 Score performance. The K-Medoids method performs worst in this scenario with an F1 Score of only 2.63%, while the SOR method achieves slightly better but still unsatisfactory results with a 20.48% F1-Score. However, the hybrid method maintains high accuracy through the two-stage filtering process. In summary, the proposed two-stage method demonstrates high robustness in complex scenarios (such as straight tunnels with side tunnels and cross-tunnel turns), effectively detecting ghost noise points and reducing false detections.

4. Discussion

4.1. Performance Comparison and Analysis of Different Methods

The distance threshold method demonstrates excellent Recall performance, indicating that it can detect most of the ghost noise points. However, its Precision is relatively low, suggesting that the method has a high false detection rate, which is particularly evident in complex scenarios (such as a straight tunnel with side tunnels and cross-tunnel turns). The low F1 Score indicates that the method fails to achieve a good balance between Precision and Recall. On the other hand, the DBSCAN clustering analysis method exhibits the opposite behavior. It performs well in terms of Precision, indicating that the method can effectively reduce false detections. However, its Recall is extremely low, suggesting that the method misses a large number of ghost noise points, and the F1 Score is also low. The proposed hybrid method (Hybrid) achieves superior Precision and Recall, indicating that it can effectively detect ghost noise points while reducing false detections. The F1 Score is significantly higher than other methods, indicating that the method achieves a good balance between Precision and Recall. It exhibits high robustness in different scenarios, especially in complex scenarios (such as a straight tunnel with side tunnels and cross-tunnel turns).
The distance threshold method achieves excellent Recall because its core idea is to determine whether a noise point is a ghost noise point by setting a fixed distance threshold. This method is highly sensitive and can capture potential ghost noise points as much as possible. Especially in straight tunnels and cross-tunnel turns, its detection capability for ghost noise is nearly complete. However, this method has a wide detection range, which also leads to a high false detection rate, particularly in complex scenarios (such as a straight tunnel with side tunnels and cross-tunnel turns), where normal points are easily misclassified as ghost noise points. Therefore, although the Recall is high, the Precision is low, indicating that the detection results contain a large number of false alarms and lack specificity.
In contrast, the DBSCAN clustering analysis method achieves higher Precision, which benefits from its ability to more accurately distinguish between ghost noise points and normal points through density-based clustering. As this method relies on the density distribution characteristics of points, it is more targeted in detecting noise points in complex scenarios, significantly reducing the occurrence of false detections. However, this highly density-dependent characteristic also results in an extremely low Recall, especially in complex scenarios, where many ghost noise points are missed due to their sparse distribution or failure to meet the clustering conditions. Although DBSCAN achieves high Precision, its detection range is limited, and it misses a large number of ghost noise points.
The proposed hybrid method is specifically designed to optimize the strengths and weaknesses of the above two methods. By combining the distance threshold method and the DBSCAN clustering analysis method, it fully utilizes their complementary characteristics. On the one hand, the high Recall of the distance threshold method ensures comprehensive detection of ghost noise points. On the other hand, the high Precision of the DBSCAN clustering method effectively reduces the false detection rate. The proposed hybrid method achieves a good balance between Precision and Recall, significantly improving the F1 Score while exhibiting high robustness in different scenarios, especially in complex scenarios. This design not only overcomes the limitations of individual methods but also provides a more comprehensive and effective solution for ghost noise detection and labeling. This advancement is particularly significant for the development of 4D millimeter-wave radar datasets in underground mining environments. By automating the ghost noise labeling process, the proposed hybrid method can effectively replace manual annotation, thereby accelerating dataset construction and improving data quality for training and validating radar-based perception algorithms.

4.2. Limitations and Future Directions

However, the proposed method still has some limitations. Firstly, it may have adaptability issues in certain extreme environments. Although the method performs well in most underground mine scenarios, it may miss detections or generate false detections in certain extreme environments (such as severe occlusions or strong reflective surfaces). For example, when the density of real points is similar to that of noise points, clustering analysis may incorrectly assign noise points to real point clusters. Secondly, the method’s performance depends on the optimization of distance threshold and DBSCAN parameters, which may require manual adjustment for different scenarios. In the future, we will investigate dynamic parameter adjustment methods based on scenario characteristics to reduce the reliance on manual parameter tuning. We will also incorporate data from other sensors (such as infrared cameras and ultrasonic radar) to further enhance the adaptability in certain extreme environments. If possible, we can also introduce deep learning models to learn point cloud features, further improving the accuracy and robustness of noise point detection. Addressing these limitations will further enhance the automation and reliability of ghost noise labeling, which is essential for building high-quality 4D millimeter-wave radar datasets at scale. Ultimately, these improvements will contribute to the broader advancement of perception technologies for autonomous systems in underground mining environments.

5. Conclusions

This paper addresses the ghost noise problem in 4D mmWave radar data in underground mine environments and proposes an automatic labeling method assisted by LiDAR. By combining the distance threshold method with clustering analysis, the proposed method can efficiently and accurately identify and label ghost noise points, providing an important foundation for subsequent 4D mmWave radar data denoising research and its application in underground mines.
The core contribution of this work lies in achieving the automation and efficiency of ghost noise labeling, which not only significantly reduces the cost and complexity of manual annotation but also provides a feasible solution for the application of 4D mmWave radar in complex scenarios. Experimental results demonstrate that the proposed method exhibits superior performance and high robustness and adaptability in various typical underground mine scenarios, such as straight tunnels, straight tunnels with side tunnels, and cross-tunnel turns.
Despite the research progress made in this paper, there are still some issues that require further exploration, such as the analysis of the dynamic characteristics of ghost noise points and multi-sensor fusion methods in more complex scenarios. Future research directions include dynamic parameter adjustment, deep learning-assisted labeling, and multi-sensor fusion to further improve the data quality and reliability of 4D mmWave radar in practical applications. In summary, this research provides important technical support for the application of 4D mmWave radar in underground mine environments and offers new solutions for the ghost noise labeling problem in complex scenarios. Through this work, we hope to promote the further application of 4D mmWave radar in underground mine environments and provide valuable references for related fields of research.

Author Contributions

Conceptualization, H.L. and Z.Z.; methodology, H.L.; formal analysis, H.L. and Z.Z.; investigation, H.L. and J.Y.; data curation, H.L.; writing—original draft preparation, H.L.; writing—review and editing, H.L., Z.Z., G.C., J.Y. and J.B.; visualization, H.L. and J.Y.; supervision, G.C. and J.B.; funding acquisition, Z.Z. and G.C. All authors have read and agreed to the published version of the manuscript.

Funding

This research was funded by the National Natural Science Foundation of China (Grant No. 42501547), the Natural Science Foundation of Jiangsu Province (Grant No. BK20241646), the National Natural Science Foundation of China (Grant No. 42274048), and the Ministry of Natural Resources of the People’s Republic of China (Grant No. 2024ZD1004101).

Data Availability Statement

Data will be made available upon request.

Conflicts of Interest

The authors declare no conflicts of interest.

References

  1. Paluchamy, B.; Mishra, D.P. Measurement and analysis of airborne dust generation and dispersion from low-profile dump truck haulage in underground metalliferous mines. Measurement 2024, 227, 114252. [Google Scholar] [CrossRef]
  2. Luo, Y.; Hu, Q.; Wang, L.; Cheng, Y.; Li, S. Reconfigurable intelligent surface in underground mines radio localization: A review. Measurement 2025, 251, 117312. [Google Scholar] [CrossRef]
  3. Mansouri, S.S.; Kanellakis, C.; Kominiak, D.; Nikolakopoulos, G. Deploying MAVs for autonomous navigation in dark underground mine environments. Rob. Auton. Syst. 2020, 126, 103472. [Google Scholar] [CrossRef]
  4. Jin, H.; Ren, S.; Li, S.; Liu, W. Research on mine personnel target detection method based on improved YOLOv8. Measurement 2025, 245, 116624. [Google Scholar] [CrossRef]
  5. Imam, M.; Baïna, K.; Tabii, Y.; Ressami, E.M.; Adlaoui, Y.; Benzakour, I.; Abdelwahed, E.H. The Future of Mine Safety: A Comprehensive Review of Anti-Collision Systems Based on Computer Vision in Underground Mines. Sensors 2023, 23, 4294. [Google Scholar] [CrossRef]
  6. Ralston, J.; Reid, D.; Hargrave, C.; Hainsworth, D. Sensing for advancing mining automation capability: A review of underground automation technology development. Int. J. Min. Sci. Technol. 2014, 24, 305–310. [Google Scholar] [CrossRef]
  7. Shi, W.; Tong, P.; Bi, X. Moving-Least-Squares-Enhanced 3D Object Detection for 4D Millimeter-Wave Radar. Remote Sens. 2025, 17, 1465. [Google Scholar] [CrossRef]
  8. Gong, B.; Sun, J.; Lin, C.; Liu, H. Space occupancy rectangle-based multivehicle localization and tracking using roadside 4D millimeter-wave radar. Measurement 2025, 247, 116859. [Google Scholar] [CrossRef]
  9. Wan, Q.; Peng, H.; Liao, X.; Li, W.; Liu, K.; Mao, J. A Point Cloud Improvement Method for High-Resolution 4D mmWave Radar Imagery. Remote Sens. 2024, 16, 2856. [Google Scholar] [CrossRef]
  10. Zheng, L.; Long, J.; Lops, M.; Liu, F.; Hu, X.; Zhao, C. Detection of Ghost Targets for Automotive Radar in the Presence of Multipath. IEEE Trans. Signal Process. 2024, 72, 2204–2220. [Google Scholar] [CrossRef]
  11. Jin, F.; Cao, S. Automotive Radar Interference Mitigation Using Adaptive Noise Canceller. IEEE Trans. Veh. Technol. 2019, 68, 3747–3754. [Google Scholar] [CrossRef]
  12. Hu, Q.; Luo, Y.; Wang, L.; Cheng, Y.; Yuan, S.; Zhang, Y. A NLOS position estimation method for T-shaped tunnel based on corrected ghost point. Measurement 2025, 253, 117428. [Google Scholar] [CrossRef]
  13. Luo, H.; Zhu, Z.; Jiang, M.; Guo, S.; Cui, G. An Effective Multipath Ghost Recognition Method for Sparse MIMO Radar. IEEE Trans. Geosci. Remote Sens. 2023, 61, 5111611. [Google Scholar] [CrossRef]
  14. Liu, C.; Liu, S.; Zhang, C.; Huang, Y.; Wang, H. Multipath propagation analysis and ghost target removal for FMCW automotive radars. In Proceedings of the IET International Radar Conference (IET IRC 2020), Online, 4–6 November 2020; pp. 330–334. [Google Scholar] [CrossRef]
  15. Cheng, Y.; Su, J.; Jiang, M.; Liu, Y. A Novel Radar Point Cloud Generation Method for Robot Environment Perception. IEEE Trans. Rob. 2022, 38, 3754–3773. [Google Scholar] [CrossRef]
  16. Huang, H.; Brenner, C. Rule-based roof plane detection and segmentation from laser point clouds. In Proceedings of the 2011 Joint Urban Remote Sensing Event, Munich, Germany, 11–13 April 2011; pp. 293–296. [Google Scholar] [CrossRef]
  17. Guo, Y.; Wang, H.; Hu, Q.; Liu, H.; Liu, L.; Bennamoun, M. Deep Learning for 3D Point Clouds: A Survey. IEEE Trans. Pattern Anal. Mach. Intell. 2021, 43, 4338–4364. [Google Scholar] [CrossRef]
  18. Kramer, A.; Harlow, K.; Williams, C.; Heckman, C. ColoRadar: The direct 3D millimeter wave radar dataset. Int. J. Rob. Res. 2022, 41, 351–360. [Google Scholar] [CrossRef]
  19. Zheng, L.; Ma, Z.; Zhu, X.; Tan, B.; Li, S.; Long, K.; Sun, W.; Chen, S.; Zhang, L.; Wan, M.; et al. TJ4DRadSet: A 4D Radar Dataset for Autonomous Driving. In Proceedings of the 2022 IEEE 25th International Conference on Intelligent Transportation Systems (ITSC), Macau, China, 8–12 October 2022; pp. 493–498. [Google Scholar] [CrossRef]
  20. Zhang, X.; Wang, L.; Chen, J.; Fang, C.; Yang, G.; Wang, Y.; Yang, L.; Song, Z.; Liu, L.; Zhang, X.; et al. Dual Radar: A Multi-modal Dataset with Dual 4D Radar for Autononous Driving. Sci. Data 2025, 12, 439. [Google Scholar] [CrossRef]
  21. Wang, J.; Wang, L.; Peng, P.; Jiang, Y.; Wu, J.; Liu, Y. Efficient and accurate mapping method of underground metal mines using mobile mining equipment and solid-state lidar. Measurement 2023, 221, 113581. [Google Scholar] [CrossRef]
  22. Park, J.I.; Jo, S.; Seo, H.T.; Park, J. LiDAR Denoising Methods in Adverse Environments: A Review. IEEE Sens. J. 2025, 25, 7916–7932. [Google Scholar] [CrossRef]
  23. Song, P.; Jin, F.; Ji, M.; Liang, T.; Li, Q. Denoising algorithm for inclined tunnel point cloud data based on irregular contour features. Meas. Sci. Technol. 2024, 35, 095203. [Google Scholar] [CrossRef]
  24. Aggarwal, C.C.; Reddy, C.K. Data Clustering: Algorithms and Applications, 1st ed.; Chapman and Hall/CRC: New York, NY, USA, 2018. [Google Scholar] [CrossRef]
  25. Zhou, F.; Gao, Y.; Li, A.; Xing, M. Indoor personnel detection and tracking of millimeter-wave radar based on improved DBSCAN algorithm. Eng. Res. Express 2025, 7, 025220. [Google Scholar] [CrossRef]
  26. Khan, K.; Rehman, S.U.; Aziz, K.; Fong, S.; Sarasvady, S. DBSCAN: Past, present and future. In Proceedings of the Fifth International Conference on the Applications of Digital Information and Web Technologies (ICADIWT 2014), Bangalore, India, 17–19 February 2014; pp. 232–238. [Google Scholar] [CrossRef]
  27. Kubelka, V.; Fritz, E.; Magnusson, M. Do we need scan-matching in radar odometry? In Proceedings of the 2024 IEEE International Conference on Robotics and Automation (ICRA), Yokohama, Japan, 13–17 May 2024; pp. 13710–13716. [Google Scholar] [CrossRef]
  28. Magnusson, M.; Lilienthal, A.; Duckett, T. Scan registration for autonomous mining vehicles using 3D-NDT. J. Field Rob. 2007, 24, 803–827. [Google Scholar] [CrossRef]
  29. Hand, D.J. Assessing the Performance of Classification Methods. Int. Stat. Rev. 2012, 80, 400–414. [Google Scholar] [CrossRef]
  30. Park, H.-S.; Jun, C.-H. A simple and fast algorithm for K-medoids clustering. Expert Syst. Appl. 2009, 36, 3336–3341. [Google Scholar] [CrossRef]
  31. Balta, H.; Velagic, J.; Bosschaerts, W.; De Cubber, G.; Siciliano, B. Fast Statistical Outlier Removal Based Method for Large 3D Point Clouds of Outdoor Environments. IFAC-PapersOnLine 2018, 51, 348–353. [Google Scholar] [CrossRef]
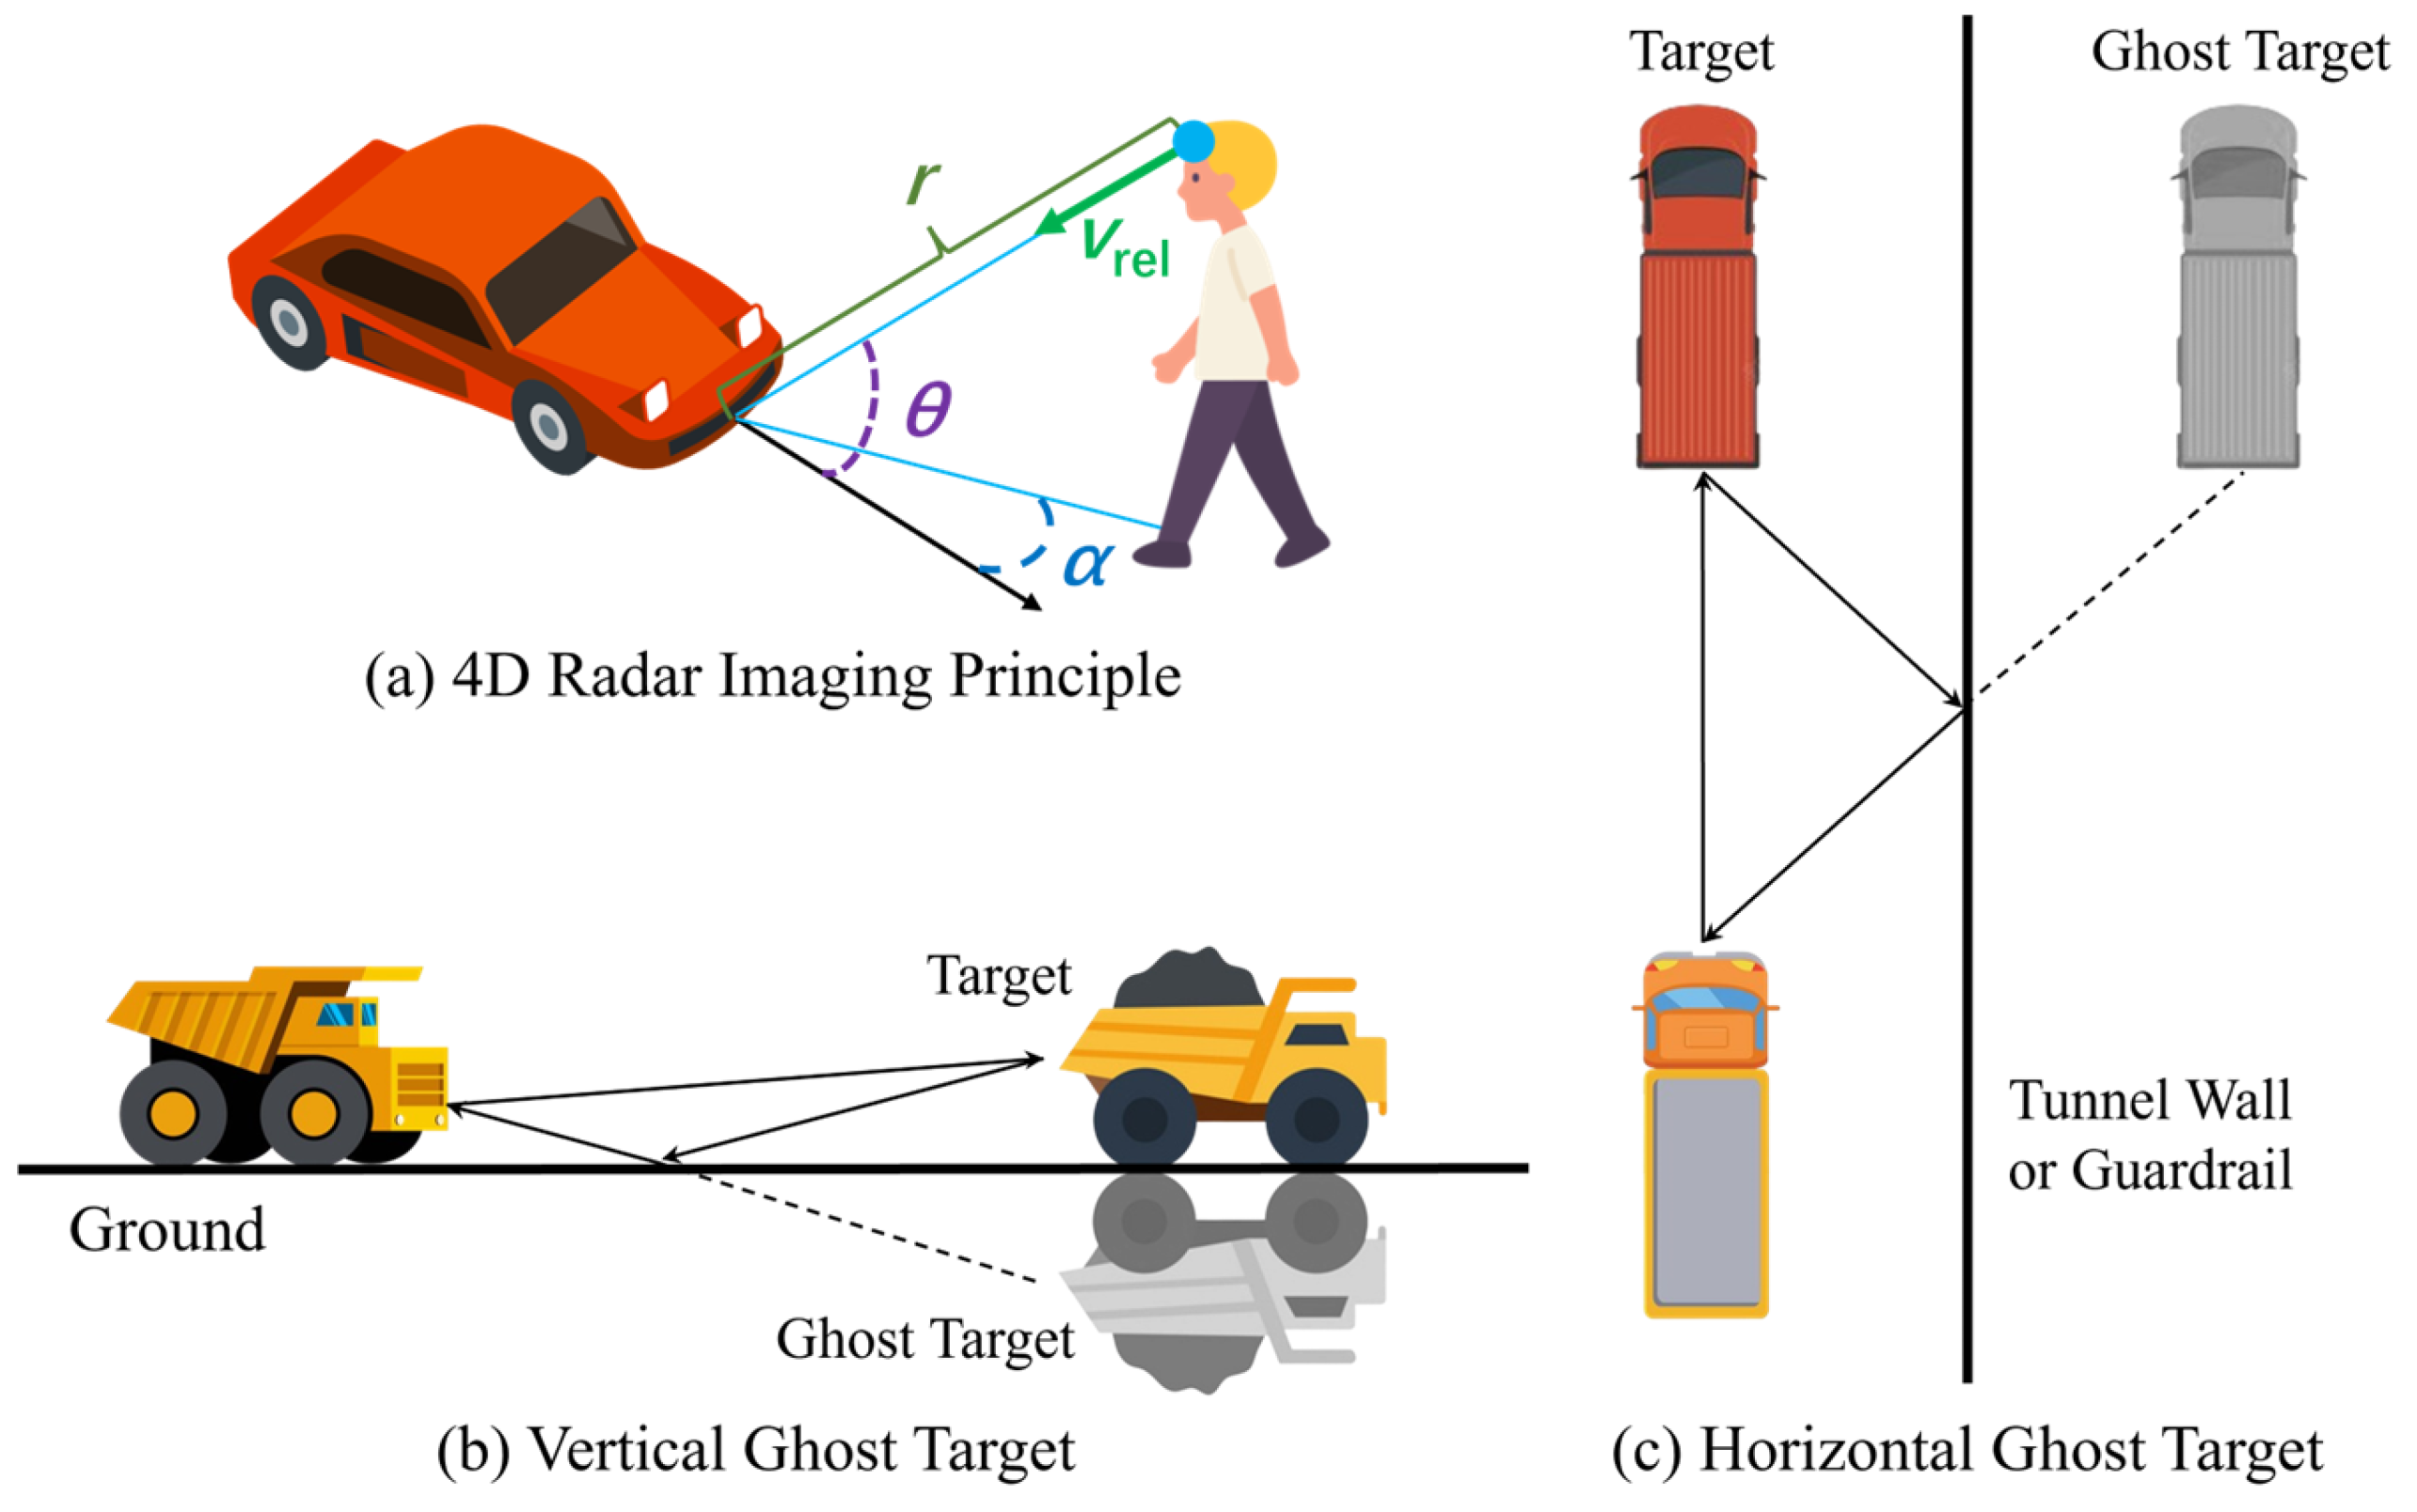
Figure 1. Four-dimensional millimeter-wave radar imaging and ghost targets caused by multipath propagation. (a) Schematic diagram of 4D millimeter-wave radar imaging, where the four dimensions represent range r, azimuth α, elevation θ, and radial velocity vrel. (b) Ghost target generated by multipath propagation in the vertical plane. (c) Ghost target generated by multipath propagation in the horizontal plane.
Remotesensing 17 03732 g001
Figure 2. Ghost target noise labeling procedure.
Remotesensing 17 03732 g002
Figure 3. Schematic diagram of the distance threshold method.
Remotesensing 17 03732 g003
Figure 4. Schematic diagram of the clustering analysis method.
Remotesensing 17 03732 g004
Figure 5. Multi-source sensing platform and environment in the Kvarntorp mine. (a) One of the tunnels in the Kvarntorp mine [28]. (b) The pickup truck equipped with multi-source sensors in the mine [27]. (c) The multi-source sensors detail [27].
Remotesensing 17 03732 g005
Figure 6. Comparison of annotation results in the straight tunnel scenario.
Remotesensing 17 03732 g006
Figure 7. Comparison of annotation results in the straight tunnel with side tunnels scenarios.
Remotesensing 17 03732 g007
Figure 8. Comparison of annotation results in the cross-tunnel turn scenario.
Remotesensing 17 03732 g008
Table 1. Key specifications of sensors.
SensorsModelMain ParametersSampling Frequency
4D RadarSensrad Hugin A3-SampleHFoV, VFoV 80° × 30°, the horizontal and vertical resolution is 1.25° and 1.7°, the highest range resolution of 0.1 m16 Hz
LiDAROuster OS1-64HFoV 360°, VFoV 45°, range 120 m10 Hz
IMUXsens MTi-30Roll (0.5°), Pitch (0.5°), Yaw (2°)400 Hz
Table 2. Comparative evaluation metrics of annotation results for different methods under different scenarios.
ScenariosMethodsPrecisionRecallF1 Score
Straight tunnelsDistance threshold [22,23]57.55%97.44%72.37%
DBSCAN clustering [25]53.85%14.65%23.03%
K-Medoids [30]37.95%38.84%38.39%
SOR [31]94.12%14.88%25.70%
Two-stage method (we propose)95.15%95.81%95.48%
Straight tunnels with side tunnelsDistance threshold [22,23]24.56%92.65%38.83%
DBSCAN clustering [25]89.06%7.22%13.36%
K-Medoids [30]36.08%32.70%34.31%
SOR [31]60.93%43.09%50.48%
Two-stage method (we propose)98.81%94.68%96.70%
Cross-tunnel turnsDistance threshold [22,23]28.59%98.03%44.27%
DBSCAN clustering [25]78.57%3.10%5.96%
K-Medoids [30]2.74%2.54%2.63%
SOR [31]45.19%13.24%20.48%
Two-stage method (we propose)98.85%97.18%98.01%
Table 3. Runtime performance comparison of different ghost noise detection methods across three underground mining scenarios.
ScenariosMethodsTotal PointsProcessing Time (s)Speed (points/s)
Straight tunnelsDistance threshold25310.018140,611
DBSCAN clustering25310.011230,090
K-Medoids25310.06936,681
SOR25310.04457,522
Two-stage method (we propose)25310.07036,157
Straight tunnels with side tunnelsDistance threshold15,0110.043349,093
DBSCAN clustering15,0110.108138,990
K-Medoids15,0110.091164,956
SOR15,0110.24162,286
Two-stage method (we propose)15,0110.92016,316
Cross-tunnel turnsDistance threshold40280.036111,889
DBSCAN clustering40280.017236,941
K-Medoids40280.05080,560
SOR40280.06462,938
Two-stage method (we propose)40280.18921,312
Disclaimer/Publisher’s Note: The statements, opinions and data contained in all publications are solely those of the individual author(s) and contributor(s) and not of MDPI and/or the editor(s). MDPI and/or the editor(s) disclaim responsibility for any injury to people or property resulting from any ideas, methods, instructions or products referred to in the content.