Article

Spatial and Temporal Patterns of Mangrove Forest Change in the Mekong Region over Four Decades Based on a Remote Sensing Data-Driven Approach

1
Department of Civil Engineering, Faculty of Engineering, Mahasarakham University, Kantharawichai District, Maha Sarakham 44150, Thailand
2
Institute of Geomatics, Department of Ecosystem Management, Climate and Biodiversity, BOKU University, 1190 Vienna, Austria
3
Department of Geography, Faculty of Humanities and Social Sciences, Mahasarakham University, Kantharawichai District, Maha Sarakham 44150, Thailand
4
Faculty of Marine Technology, Burapha University, Chanthaburi Campus, 57 Moo.1 Chon Pratan Road, Kamong, Tha Mai District, Chanthaburi 22170, Thailand
5
Faculty of Technology and Environment, Phuket Campus, Prince of Songkla University, Phuket 83120, Thailand
6
Department of Survey Engineering, Faculty of Engineering, Chulalongkorn University, Bangkok 10330, Thailand
7
School of Life Sciences, University of Technology Sydney, Sydney, NSW 2007, Australia
*
Author to whom correspondence should be addressed.
Remote Sens. 2025, 17(22), 3728; https://doi.org/10.3390/rs17223728 (registering DOI)
Submission received: 24 September 2025 / Revised: 7 November 2025 / Accepted: 14 November 2025 / Published: 16 November 2025

Highlights

What are the main findings?
  • Random Forest classification achieved a mapping accuracy of 86.2% to 88.8%.
  • Mangrove extent was mapped from 1984 to 2023 in the Mekong region.
What are the implications of the main findings?
  • Thailand’s mangrove area increased by 12.9% and Vietnam’s by 28.4% since 1984.
  • Mangrove areas in Cambodia and Myanmar declined by about 14.6% and 22.7%, respectively.

Abstract

Mangrove forests are critical coastal ecosystems that store carbon, support marine life, and serve as natural barriers, protecting shorelines from erosion and reducing the impact of storms by absorbing wave energy. However, the rise of human activities and sea levels has led to their destruction over the past decades. It is important to know how the areas of mangrove forests change and adapt every year to plan for their restoration and protection and to support future trends like using carbon credits to help developing countries generate income. This study aims to map and monitor mangrove forest area changes over four decades in the Mekong region, comprising Myanmar, Thailand, Cambodia, and Vietnam, from 1984 to 2023 using a time series of Landsat data together with random forest (RF) classification. This analysis implemented multiple approaches, including creating stabilized Landsat imagery composites from the LandTrendr algorithm, Otsu edge detection, Minimum Mapping Unit (MMU), and RF classifier. The study found the map accuracy based on the RF model classifier achieved an overall accuracy between 86.2% and 88.8%, providing reliable data for analysis. Country-level analysis revealed increasing mangrove forest cover in Thailand (12.9%) and Vietnam (28.4%) since 1984. Conversely, mangrove areas in Cambodia and Myanmar have decreased significantly from 1984 to 2023 by about 14.6% and 22.7%, respectively. These findings have significant implications for resource allocation, investment strategies, and the development of carbon credits to support mangrove conservation efforts. This comprehensive dataset offers valuable insights for stakeholders involved in mangrove management and restoration in the Mekong region. By understanding the spatial-temporal distribution patterns of mangrove forest change, decision-makers can make informed decisions to safeguard these critical ecosystems for future generations.

1. Introduction

Mangroves are vital coastal ecosystems thriving in the intertidal zones of tropical and subtropical regions. They are unique in how they can survive in salty and anaerobic circumstances [1]. These ecosystems are dominated by salt-tolerant trees, shrubs, and other vegetation, creating a vital interface between inland and sea [2]. Mangroves are important for maintaining sustainable livelihoods, offering residence for a wide variety of marine and terrestrial animals and shielding coastlines from erosion and storm surges. Mangrove forests represent a significant element of coastal ecosystems in the Mekong region, offering an array of ecological, economic, and social advantages. These forests are found along the coastlines of countries such as Thailand, Myanmar, Cambodia, and Vietnam. In the Mekong region, mangroves serve as essential habitats for diverse marine and terrestrial species, support local livelihoods, and mitigate climate change impacts [3,4]. Resources such as timber, firewood, and medicinal plants have been valued at about USD 1.6 billion in ecosystem services annually [5].
Despite their ecological importance, mangroves face numerous threats, including deforestation, pollution, natural hazards (tsunamis) and climate change, highlighting the need for their conservation and sustainable management. Mangroves in three Southeast Asian countries—Thailand, Myanmar, and Cambodia—were assessed by Baltezar et al. [6], who mapped their extent from 1972 to 1977 at approximately 15,420 km2. By 2020, this area had declined by about 6830 km2, representing a 44% loss since the 1970s. In addition, Tinh et al. [7] studied mangrove distribution in Vietnam between 1995 and 2019. It was found that Vietnam lost 13, 261 ha (7.3%) at a rate of 0.3% per year of its mangrove forest during the study period. However, mangrove extent in Vietnam showed variability, such as during the years 1995 to 2010, when mangrove extent decreased by about 24,966 ha, but it increased by 11,705 ha from 2010 to 2019. Moreover, Sharma et al. [1] mentioned that in Southeast Asia, where 60% of the global mangrove extent area is found [8,9], over 114,000 ha of mangroves—about 2.5—had been turned into aquaculture ponds, oil palm plantations or rice fields between 2000 and 2012 [10]. Also, Giri et al. [11] investigated the distribution and dynamics of mangrove forests from 1975 to 2005 in the tsunami-affected regions of Asia, observing their conversion to other land use types. They reported an annual deforestation rate of approximately 1% in Myanmar. Additionally, Thampanya et al. [12] found that 80–90% of the mangrove forests along the Gulf of Thailand have disappeared over the past 30 years.
Mangrove forest areas have inevitably been dynamic over the years, depending on the conservation planning of each country. Mangrove mapping helps identify the extent and distribution of this forest, which is essential for conservation efforts. This enables monitoring changes over time and aids in crafting sustainable management plans. To achieve this task, remote sensing techniques play a crucial role in mapping and monitoring long-term mangrove forests over a large scale [13].
Nowadays, remote sensing has revolutionized monitoring and management practices across various sectors such as agriculture [14,15,16], aquaculture [17,18], forestry [19], water quality [20,21], and climate change [22]. In addition, remote sensing is incredibly valuable for monitoring inaccessible coastal ecosystems, such as mangroves, for instance, in tracing long-term historical changes over decades [23]. This technology provides cost-effective and accurate results. For instance, Chan-Bagot et al. [24] applied Landsat-8 OLI, Sentinel-1, and Sentinel-2 to monitor mangrove forests in Guyana annually with a high overall accuracy of 95%. Pirasteh et al. [25] used Landsat imagery to demonstrate mangrove biomass assessment and mapping on the coast of the Persian Gulf. The result indicated that the OA values of separating tall and dwarf mangroves were between 96% and 97%. However, to increase the reliability of mangrove classification results, machine learning and deep learning have been widely adopted. Sun et al. [26] utilized the U-net segmentation model to map mangroves in Beibu Gulf, China. The OA of mangrove segmentation delivers detailed information about object boundaries and regions, whereas detection emphasizes identifying specific objects and their locations. Du et al. [27] achieved an OA of approximately 89.84% for mangrove segmentation.
In addition, Zhang et al. [23] applied a random forest (RF) approach to monitor the mangrove dynamics in China on an annual basis for the period 2016 to 2020, and the OA of the mangrove mapping was > 88%. Chan-Bagot et al. [24] also utilized the RF approach to map mangrove forests in Guyana, with OA of results ranging from 88 to 95%. Several research studies [28,29,30] confirmed that a conventional machine learning approach such as RF can be used for mapping mangrove forests with highly reliable and excellent results. The same algorithm was also used to distinguish between mangrove species based on drone data in Southern Iran [31].
Freely available products about mangrove extent, such as Global Mangrove Watch (GMW), provide useful information on a global scale. However, such products have their limitations, and to our best knowledge, these datasets have some errors in the Mekong region. This may be caused by cloud cover, and it is challenging to employ clear scenes such as Landsat satellite imagery in the tropical zone. The LandTrendr algorithm has been proposed by Kennedy et al. [32]. This algorithm can address missing data, cloud cover, and shadow issues, as well as detect forest disturbance and recovery trends. For instance, Shimizu et al. [33] applied LandTrendr to create an imagery composite for mapping land use land cover (LULC) in forest disturbance in Vietnam, which is a tropical area, and [34] also integrated LandTrendr and ML to classify land cover change with high accuracy. Yin and co-workers [35] showed that the LandTrendr algorithm can enhance satellite imagery, particularly when using yearly composites in the tropical zone. In addition, Otsu and Canny edge detection can differentiate classes by converting images to binary classes and delineating certain areas by a threshold value to exclude irrelevant targets. For example, Zhang et al. [36] demonstrated automated coastline detection using Landsat TM based on water index by Otsu and Canny edge detection. The result indicated that this method achieved an accuracy of about 92%. To capture and monitor long-term changes in mangrove forests over a four-decade period (1984–2023), Landsat imagery was selected due to its consistent and extensive archive dating back to the 1980s. The long operational history of the Landsat program makes it well-suited for broad-scale, temporal analysis. Although Sentinel-2 provides higher spatial resolution, its limited temporal coverage—beginning only in 2015—renders it less suitable for long-term trend analysis.
To our review and experience, no research studies provide rich information on mangrove mapping, such as yearly spatiotemporal distribution patterns over four decades, for use in sustainable management, supporting strategic planning and providing information on mangrove restoration, which supports climate change adaptation and development, particularly in the Mekong region. The main goal of this study is to map mangrove forests from 1984 to 2023 at the pixel scale by integrating a time series of Landsat data and a conventional machine-learning approach. This study aims to (i) construct the RF models using stabilized spectral datasets from the LandTrendr algorithm; (ii) map mangrove forests in the Mekong region from 1984 to 2023 at the pixel scale using integrated time series of Landsat data and an optimal RF model; (iii) analyze the long-term spatiotemporal dynamics and trends of mangrove forest extent over the 40-year period at the country level.
This study presents several significant findings, contributions, and innovations in understanding mangrove forest areas over 40 years in the Mekong region, providing a valuable tool for forest management and mitigation strategies.

2. Materials and Methods

2.1. Study Area and Data Collection

2.1.1. Study Areas

The study focuses on assessing mangrove areas along the coast of Cambodia, Laos, Myanmar, Thailand, and Vietnam. These countries are known for their ecological significance and biodiversity. Laos is excluded due to its landlocked nature, which reduces the likelihood of existing mangrove areas. The studied area spans latitudes from approximately 5° to 25° N and longitudes from 90° to 110°E, characterized by diverse landscapes including river deltas, wetlands, and coastal areas (Figure 1). The Mekong region experiences a tropical monsoon climate, with high temperatures and wet and dry seasons. Average temperatures of the region range from 25 °C to 30 °C, with the hottest months typically occurring between March and May. The wet season between May and October is marked by heavy rainfall, which is crucial for the region’s agriculture and biodiversity. Conversely, the dry season, spanning from November to April, is characterized by lower precipitation levels.

2.1.2. Reference Dataset

The data collection was manually generated on CEO (https://www.collect.earth accessed on 15 May 2024). CEO is a web-based tool developed by the Food and Agriculture Organization of the United Nations (FAO) [37]. The monitoring system is specifically designed to track changes in land use and land cover, leveraging high-resolution imagery from Planet Scope. Over 10,000 sampling points of both mangrove and non-mangrove areas were generated to create a balanced dataset (5000 samples of each class), ensuring reliability for modeling purposes. Non-mangrove datasets were randomly selected based on land use classes belonging to coastlines such as pond, evergreen, deciduous, bare land, water body, village, and others. This dataset was a highly reliable sample for modeling, as presented in Table 1.
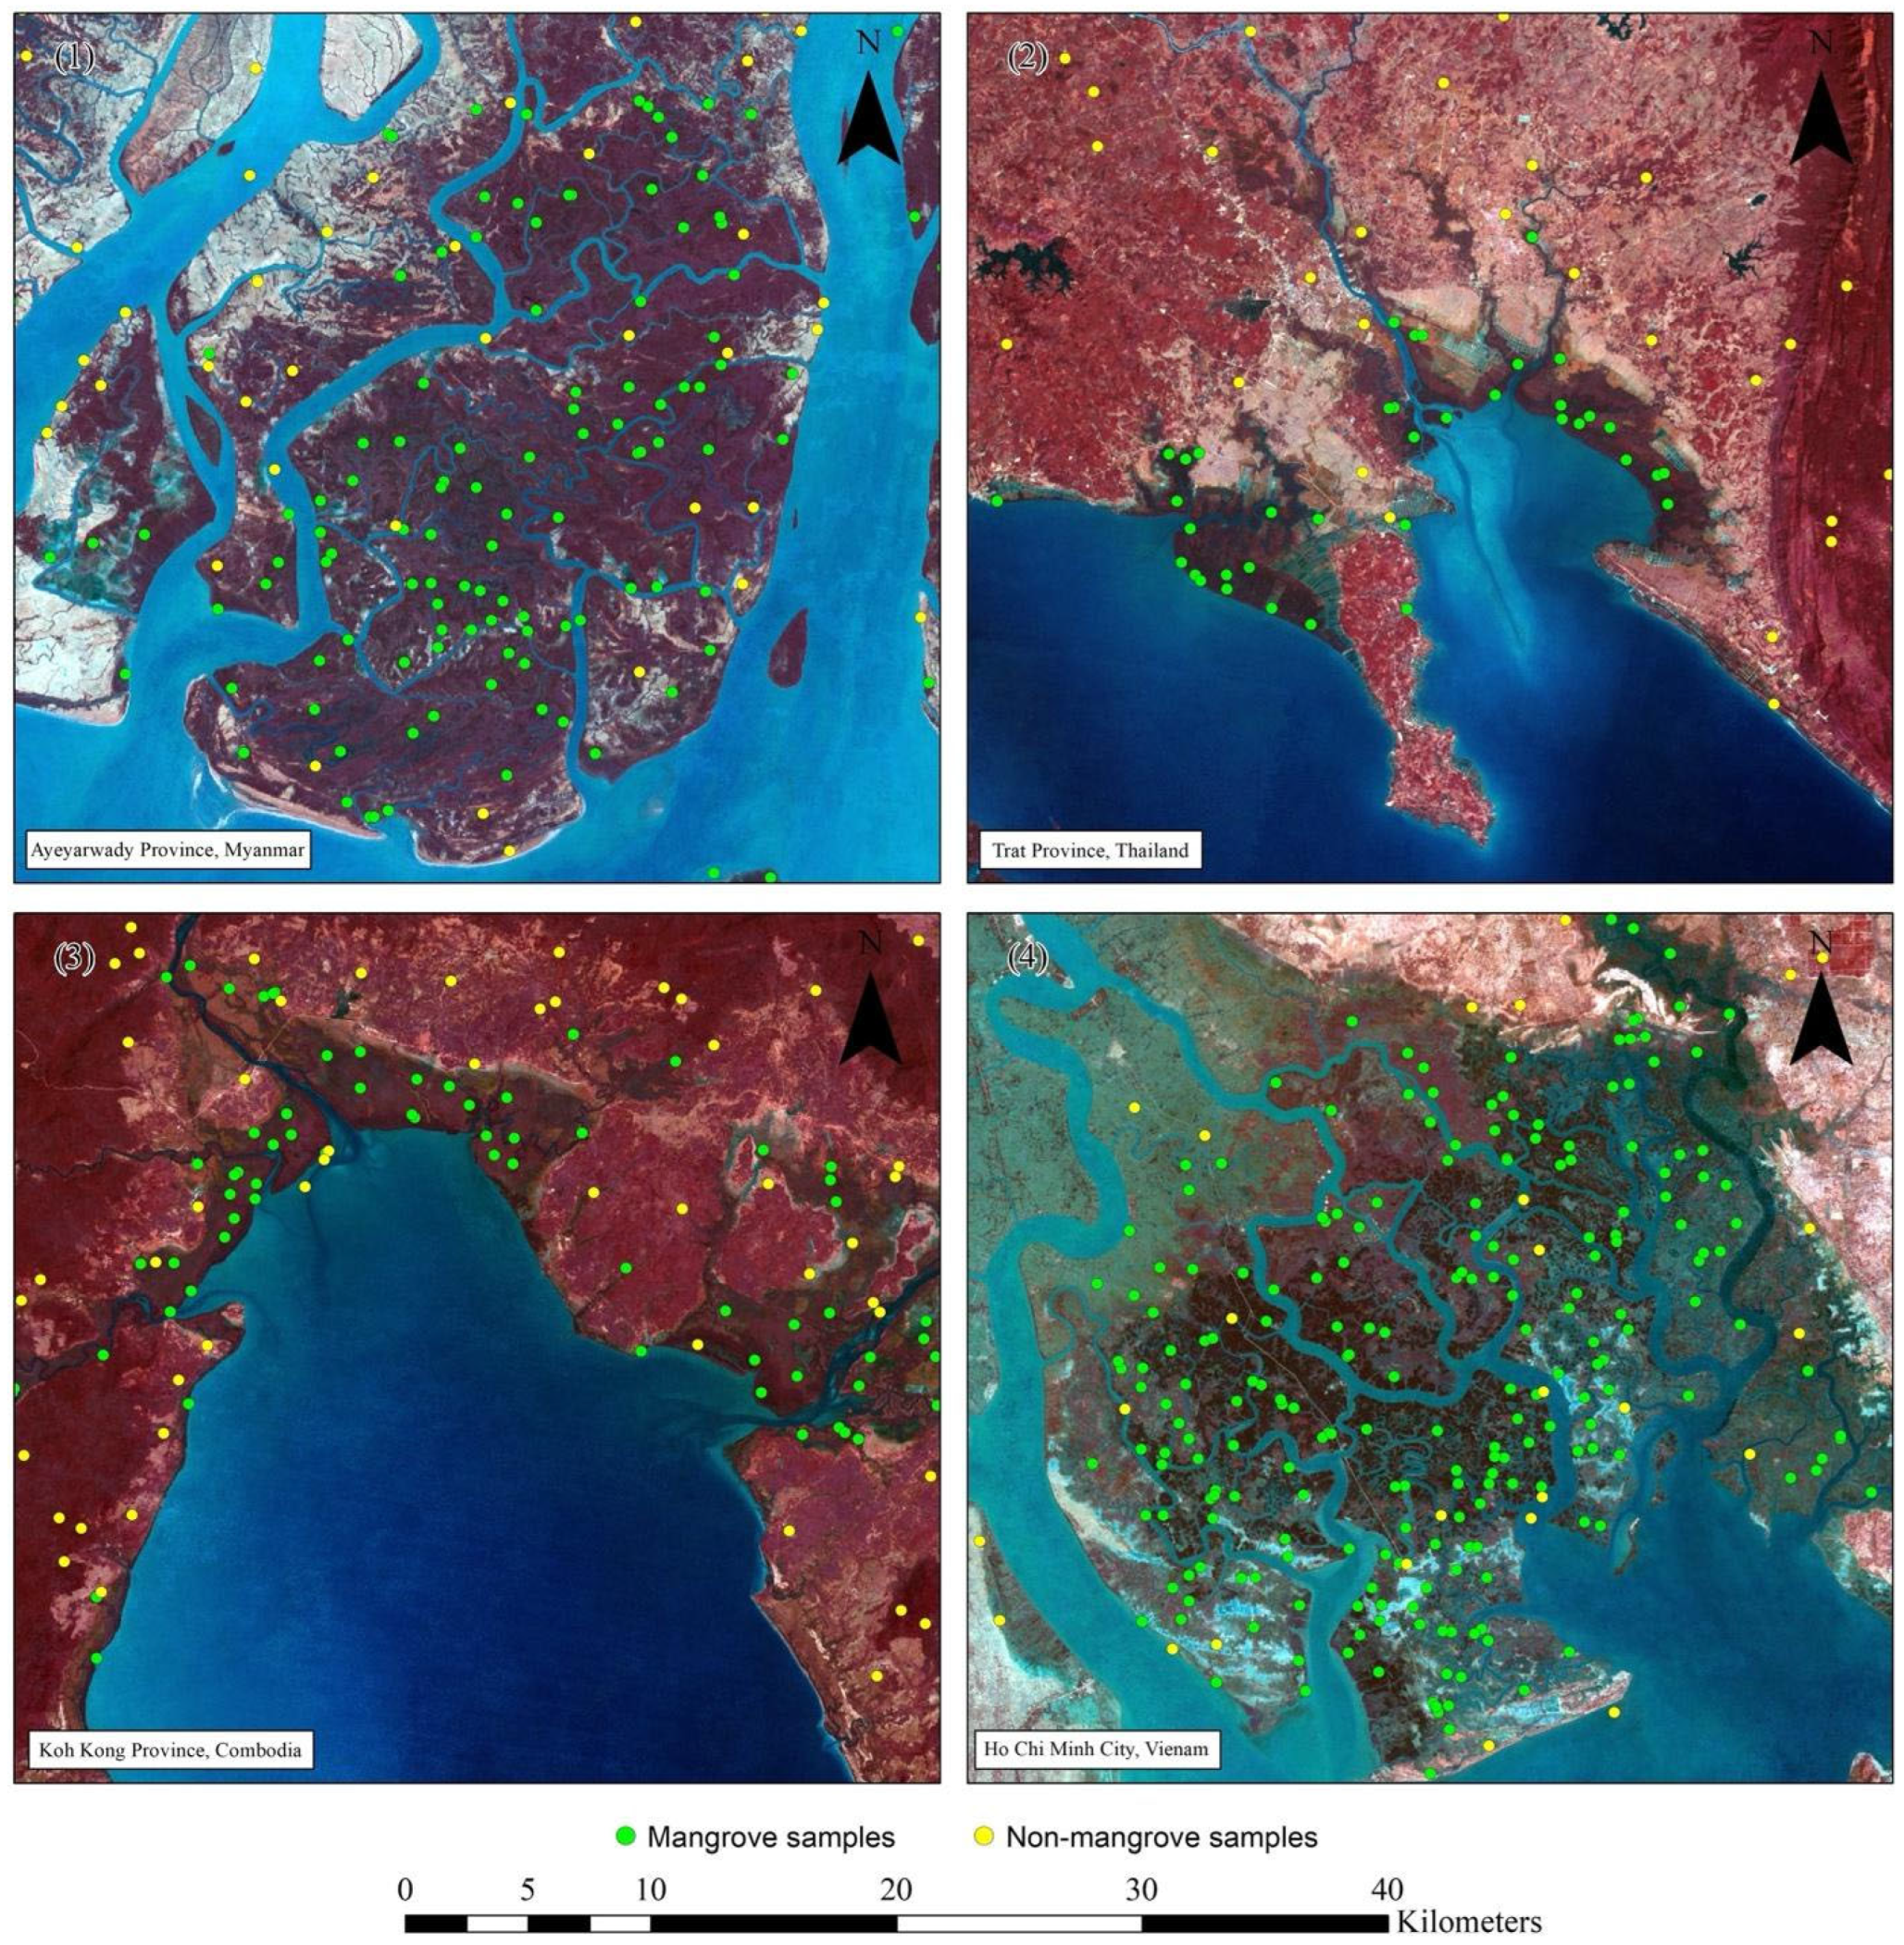
In this study, mangrove observations were collected using the CEO platform, leveraging high spatial resolution to ensure high-quality observations. A total of about 10,000 points were manually and randomly collected across mangrove and non-mangrove locations, as presented in Figure 2. These observations were overlaid on Landsat imagery, with mangrove areas highlighted in dark red on a false composite color (FCC) basis. The mangrove samples obtained from PlanetScope imagery aligned well with Landsat images, indicating a high level of consistency and reliability in the samples used for this study. The CEO platform enables users to access high-resolution PlanetScope imagery and generate false-color composites, enhancing visual interpretation. In this study, we randomly sampled data on multiple temporal images across entire years from 2015 to 2023. The functionality of CEO allows precise identification of points of interest (POIs), making it easier to distinguish between mangrove and non-mangrove areas through detailed visual analysis. However, it is important to acknowledge that some mangrove samples were located on small patches of mangrove, which could potentially impact the model and classification results. Despite this limitation, such samples were accepted for modeling to ensure the suitability and reliability of the classification model.
Moreover, non-mangrove samples were randomly distributed across various typologies such as ponds, evergreen forests, deciduous forests, bare lands, water bodies, villages, buildings, and others that were not mangroves, as described in Table 1. Mangrove areas can be found close to evergreen forests, such as in Trat province, Thailand, and the Tanintharyi region, Myanmar, which posed challenges in model classification due to potential boundary effects. However, post-processing techniques, including Minimum Mapping Unit (MMU), helped mitigate such errors.

2.1.3. Remote Sensing Data Acquisition

Time series remotely sensed data were obtained from Landsat 4, 5, 7, 8, and 9 images (Level-2) via the Google Earth Engine (GEE) platform (https://earthengine.google.com). The total number of images analyzed was 31,468 scenes that were used to create yearly composites based on the LandTrendr algorithm. The Level-2 product contains Bottom of Atmosphere (BOA) reflectance images that did not require further radiometric pre-processing. These images are in their original form at about a 30 m grid size. However, uneven cloud cover distribution posed challenges to obtaining regular time series with consistent temporal resolutions. To address this issue, we applied a more comprehensive pre-processing step, which is explained in detail in Section 2.2. For all available datasets, spectral information corresponding to the VNIR (Visible and Near-Infrared) and SWIR (short-wave infrared) bands was selected and extracted, and additional indices were calculated. These indices are associated with different biological and physiological plant conditions, including growth status, vegetation coverage, pigmentation content, chlorophyll levels, biomass, and water status (Table 2).

2.1.4. Auxiliary Datasets

The study applied GMW version 3.0 from 1996 to 2020 [47] and high-resolution global mangrove forests (HGMF) in 2020 [48] to scope the extent of mangrove in the Mekong region by aggregation. Additionally, this study considered other key parameters relevant to mangrove characteristic location: Digital Elevation Model (DEM), distance from the coastline, and slope. The ALOS-World 3D-30 m (AW3D30) is a global DEM with a horizontal resolution of approximately 30 m, equivalent to a 1-arcsecond mesh. The dataset is based on the DEM dataset at the finer resolution of 5 m mesh, providing comprehensive 3D topographic data [49] at a 95% confidence level. In addition, slope data was calculated from the DEM in the potential mangrove regions. Also, the distance from the coastline was digitized from the shoreline and a five-kilometer buffer (inner) inland. However, mangrove forests influenced by seawater were the focus of this study. The study utilized global surface water mapping provided by the Joint Research Centre (JRC) to filter the water-masked boundary. The JRC dataset generated from 4,716,475 scenes captured by Landsat 5, 7, and 8 satellites between 16th March 1984 and 31st December 2021 was utilized to mask out water bodies, ensuring precise identification of mangrove habitats [50]. In addition, all raster images that did not match the spatial resolution of Landsat were resampled to 30 m resolution using the bicubic interpolation mode, providing smoother and more visually appealing results compared to simpler methods like nearest-neighbor or bilinear interpolation [51], in GEE.

2.2. The Mangrove Classification

To achieve our objectives, we implemented the mangrove forest classification using a time series of Landsat imagery and other geographical datasets, together with reference points of the target classes. Ideally, the topographic area and LULC are classified or transferred into common typologies such as mangrove to aquaculture or pond, wetland, village, and others [11]. This study demonstrates a common machine learning (ML) model using a diverse sample dataset spanning multiple years (2015–2023) to map mangrove extent in the Mekong region as a “single model”. Therefore, the logical framework of the methodology was presented in steps. The details of each of the three steps are described here: (i) Landsat data spanning from 1984 to 2023 was processed using the LandTrendr algorithm; (ii) the RF-classification model was constructed; and (iii) the mangrove map results were assessed using an independent validation dataset (as shown in Figure 3) involving a multi-stage approach integrating data sources, such as mangrove observations, satellite imagery and topographic datasets. Image pre-processing was conducted using the LandTrendr algorithm to analyze time-series Landsat imagery data, filling gaps caused by cloud cover and shadow. In addition, Otsu edge detection was applied to delineate potential mangrove extents [52], while water-masked areas were removed using the JRC Global Surface Water dataset with an occurrence threshold greater than 90%, ensuring accurate boundary extraction from the stabilized imagery. Furthermore, we extracted parameters of remote sensing data and topographic data, including about 48 indicators, and applied the RF classifier to calculate feature importance and filter less important features. After the model classifier was derived, this study predicted mangrove forest area at the pixel scale and applied the post-processing step to minimize the error of mangrove area classification. Lastly, the OA was conducted, and mangrove forests were mapped from 1984 to 2023, as well as the estimated extent of mangroves in each country (as shown in Figure 3). The details of each step are described here in three stages.
  • Step 1: Image pre-processing
Time-series Landsat imagery from Landsat 4, 5, 7, 8, and 9 spanning from 1984 to 2023 was processed using the LandTrendr algorithm and set parameters similar to the original paper [32]. To enhance Landsat imagery, the LandTrendr algorithm was proposed for analyzing time-series satellite imagery data, particularly from sensors such as Landsat [32]. It uses a technique called “Trend Analysis of Landsat Imagery” to detect and characterize land surface changes over time. This algorithm analyzes time-series satellite imagery data to detect and characterize land surface changes over time. In addition, the algorithm mitigates issues related to missing data, cloud cover, and shadows by generating stabilized imagery through interpolation-based gap filling [32], which enhances the temporal consistency and reliability of long-term mangrove mapping. In addition, the stabilized imagery from six bands was used to calculate the spectral indices as input parameters (as shown in Table 2). Mangrove boundaries were delineated using a combination of the HGMF-2020 and GMW datasets. A 1.5 km buffer was applied to the merged mangrove extent to define the area of interest for satellite image acquisition. To enhance classification accuracy, the study area was divided into tiles, and visual inspection was conducted to identify additional potential mangrove areas not represented in the original datasets, ensuring more complete spatial coverage.
  • Step 2: Spectral extraction and potential mangrove area
In the second step, samples were generated from the CEO plots as described in Section 2.1.2, distinguishing between mangrove and non-mangrove areas. Topographic and stabilized image datasets were extracted based on CEO plot locations. The extracted CEO plots were randomly split into two datasets: 7000 points (70%) for training and 3000 points for testing (30%).
To generate a potential mangrove forest area, Otsu’s method and Canny edge detection [53] were applied in this study. Otsu’s method, coupled with Canny edge detection, was employed to define potential mangrove forest areas by separating pixels into two classes based on intensity values. In addition, the JRC dataset was used to remove water-masked areas from potential mangrove forest regions. Also, DSM was masked out where the elevation was higher than 40 m [6].
  • Step 3: Modeling
In this study, the RF classifier was employed for mangrove mapping and modeling. Feature optimization was achieved by evaluating feature importance using overall accuracy and F1-score as performance metrics. The feature set that achieved the highest metric performance was selected for model development. The dataset was split into 70% for training and 30% for validation, following a 90–10% cross-validation scheme to ensure model robustness.
The RF classifier was implemented in GEE to generate annual mangrove maps. Post-classification refinement was applied to reduce misclassifications using the aggregation shapefile produced in the first step. To ensure spatial reliability, a Minimum Mapping Unit (MMU) was applied, defining the smallest mappable area that can be confidently distinguished as an independent land cover unit [54]. Incorporating the MMU improved the accuracy and consistency of the resulting mangrove maps [55].
Model optimization was conducted through grid-search parameter tuning. A sensitivity analysis was first performed on the number of decision trees (ntree), varying from 10 to 50 in increments of 10. The OA was calculated for each configuration, and the best-performing ntree value was selected. Subsequently, recursive feature evaluation was used to determine the optimal number of features, ensuring a balance between model stability and computational efficiency. This tuning approach allowed us to identify the most stable model configuration while minimizing computational cost.
The accuracy of both mangrove and non-mangrove classes was validated using separate testing datasets, which performed with a confidence interval of 95% employing the Wilson score method outlined by Wallis [56] (Table 3) alongside F1-score metrics. The classifier model was used to predict the presence or absence of mangrove areas across the Mekong region and estimate the area of mangroves between 1984 and 2023. This comprehensive approach ensured the reliability and validity of the classification results.

2.3. Accuracy Assessment

We assessed the potential of mapped results over four decades (from 1984 to 2023) using measurement methods including conventional OA, OA within a 95% interval, F1-score, and other metrics, as outlined in Table 3.

3. Results

3.1. Optimal Feature Selection

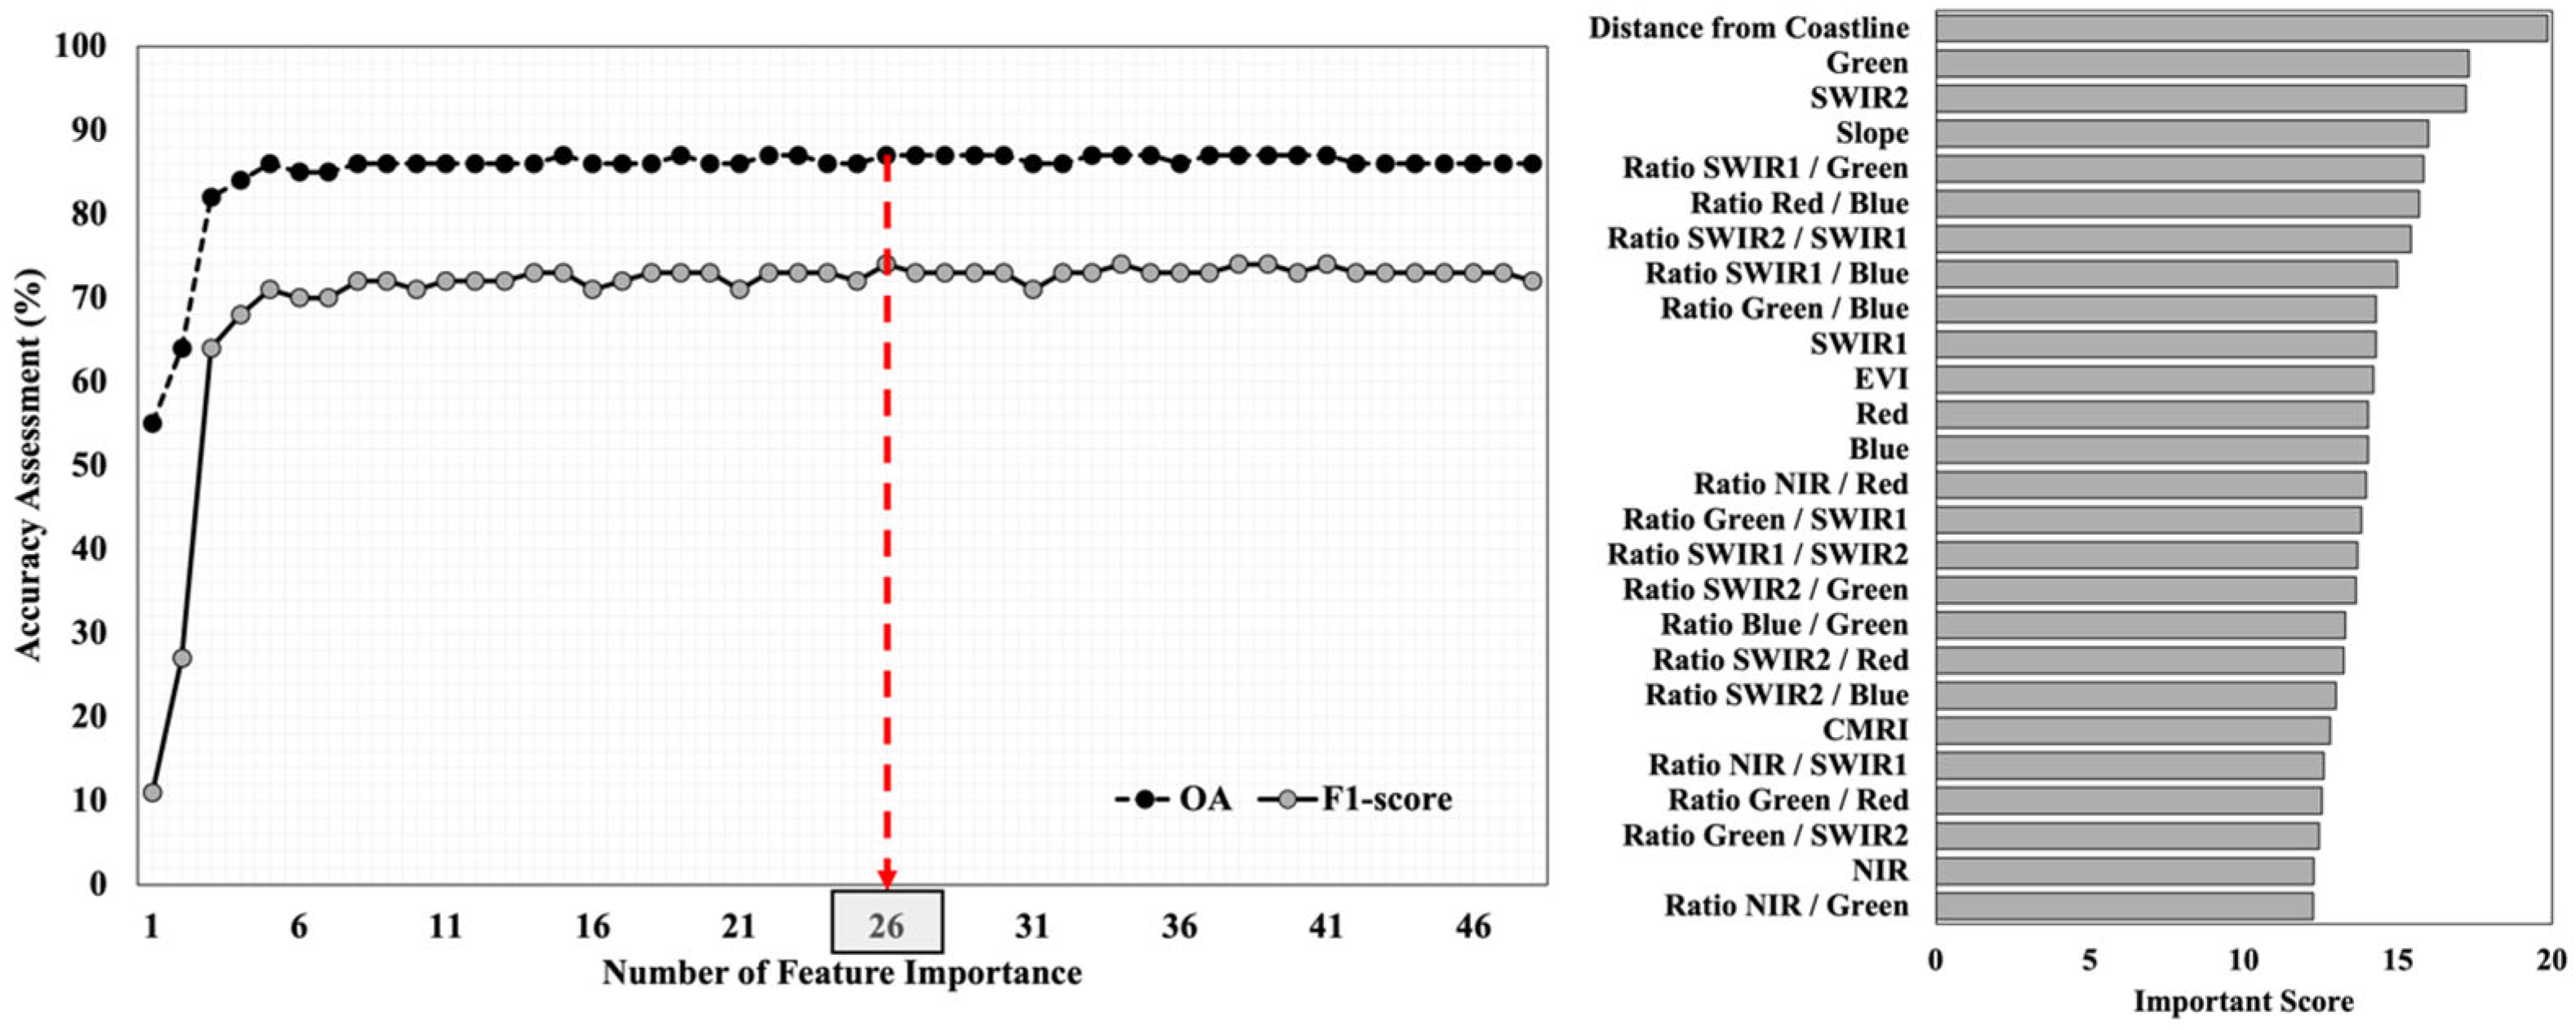
Following the preliminary feature selection, 26 out of 48 features were retained, as they provided the highest accuracy for subsequent analysis. These features included two topographic variables (distance from the coastline and slope), 16 spectral band ratios, six original spectral bands, and two vegetation indices—EVI and CMRI (Figure 4). A 10-fold cross-validation approach was employed to assess OA and F1-score. Further iterative feature importance analysis involved sorting features based on their importance scores and progressively removing one feature at a time to derive optimal feature selection while maintaining high accuracy assessment. The study aimed to achieve a high OA and F1-score for use in the final modeling process.
There was a strong correlation between OA and F1-score in the accuracy assessment. For instance, employing a total of 48 variables yielded an OA and F1-score of approximately 86% and 72%, respectively. However, utilizing 26 features resulted in OA and F1-score of approximately 87% and 74%, respectively. Conversely, when the five least important features were utilized, OA and F1-score declined significantly, as shown in Figure 4.

3.2. Validated Mangrove Mapping

The performance of the RF model in mangrove presence prediction using remote sensing datasets is presented in Table 4. The model achieved its highest OA and F1-score of 87.3% and 87.4%, respectively, when utilizing 26 indicators. The confusion matrix of mangrove classification was also investigated to provide a detailed statistical assessment. In this study, we obtained acceptable accuracy, as there was less confusion or a high chance of assessment between each class, as observed with the diagonal of the matrix. Validation samples, comprising approximately 3000 points or 30% of the total samples, were utilized to assess the model’s performance. The number of correct predictions between mangrove and non-mangrove classes was about 2620 out of 3000, with a misclassification rate of 12.7%, or an OA of about 87.3%.
A comprehensive overview of model classification indicates acceptable OA, with a 95% confidence interval ranging from 86.1% to 88.5% (as shown in Table 4). This suggests a high potential to map mangrove and non-mangrove areas in diverse mangrove ecosystems. Moreover, the average user’s accuracy (UA) and producer’s accuracy (PA) values were found to be 87.4% and 87.3%, respectively.
The RF model demonstrated robust classification performance, highlighting its effectiveness in accurately distinguishing between mangrove and non-mangrove areas. Consequently, a map of mangrove presence in the region of interest was produced (Figure 5 and Figure 6).

3.3. Mangrove Mapping and Mangrove Area Assessment
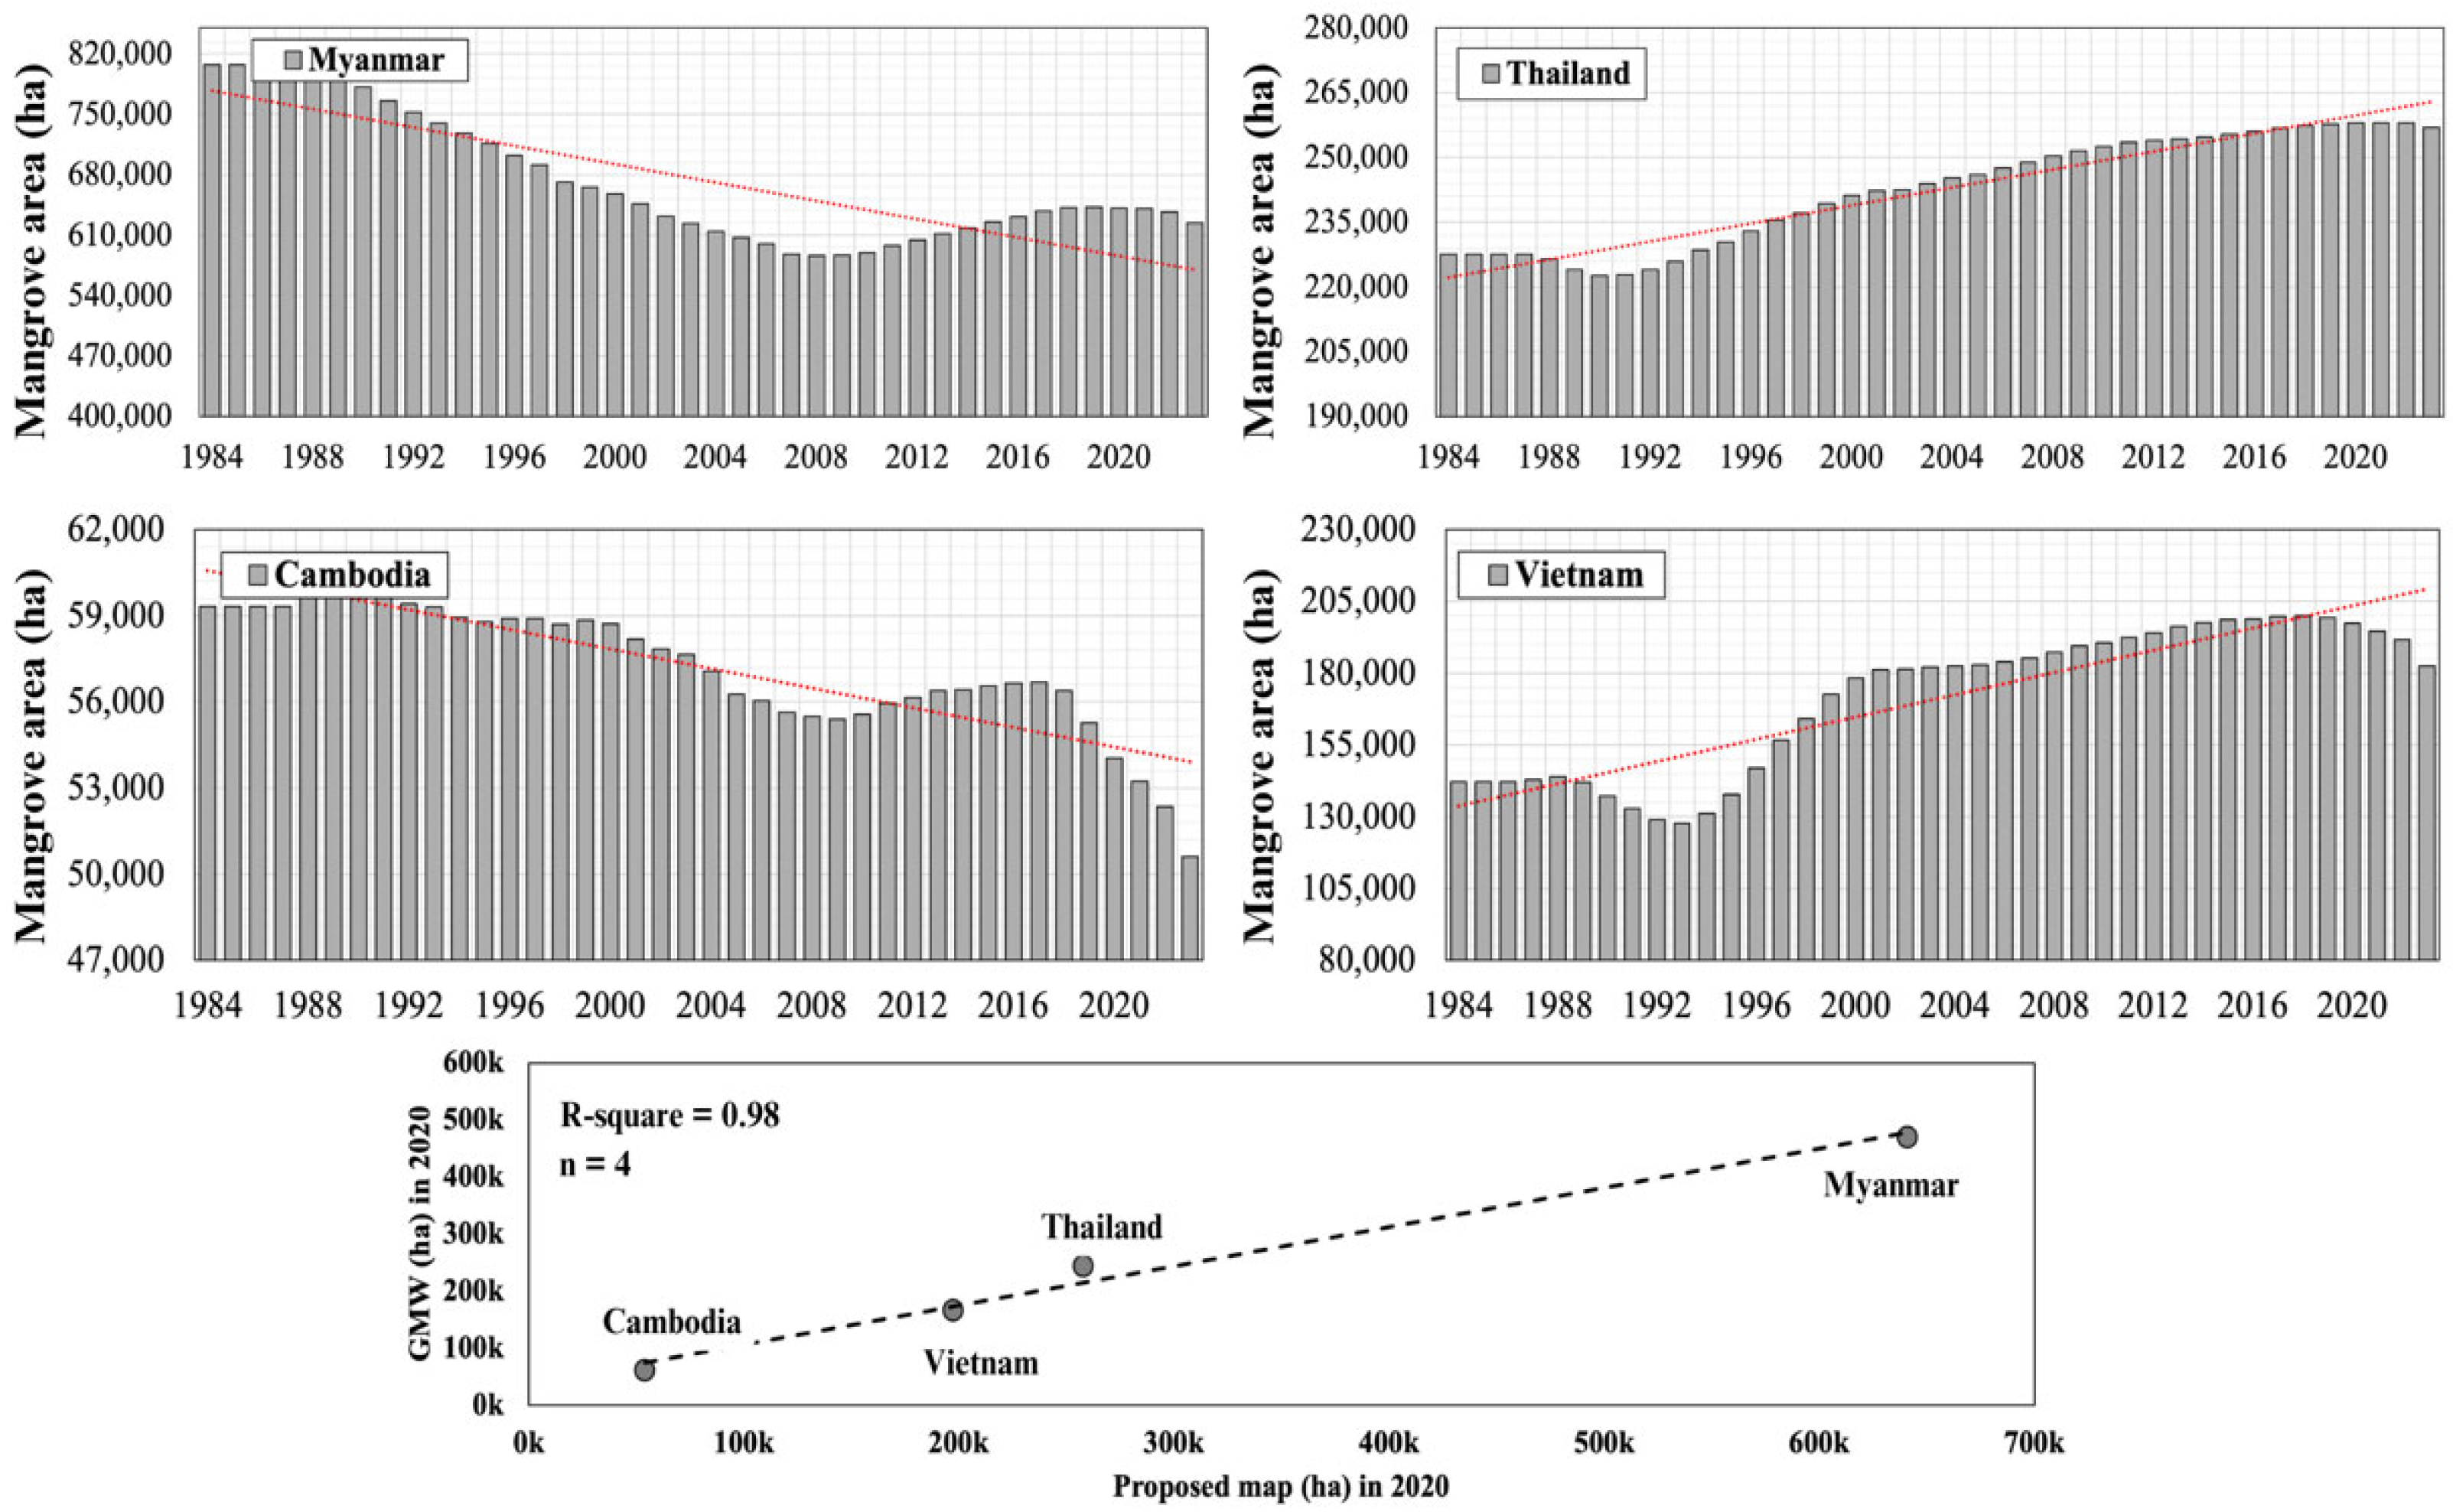
In this study, a methodology was proposed to map mangrove forest extent over 40 years, from 1984 to 2023. It was found that mangrove area coverage in Myanmar exhibited a decreasing trend from around 807,286 ha in 1984 to approximately 586,509 ha in 2008, indicating a general decline over the observed period. Generally, mangrove forest areas in Myanmar showed a decreasing trend over time. Similarly, the mangrove area in Cambodia has also fluctuated over time, with a general decrease. It started at around 59,317 ha in 1984, reached a high of 60,154 ha in 1989, and was approximately 50,624 ha in 2023, as presented in Figure 5.
Figure 5. Annual mangrove forest area in the Mekong region from 1984 to 2023 and comparison between GMW and the proposed map in 2020.
Remotesensing 17 03728 g005
Conversely, Thailand demonstrated a consistent pattern of growth in mangrove coverage, with the area expanding from approximately 227,579 ha in 1984 to nearly 256,873 ha in 2023. Vietnam also showed a notable increase in mangrove areas, rising from around 142,106 ha in 1984 to just under 182,407 ha in 2023. Despite some years where the coverage decreased slightly, the general trend shows a robust increase in mangrove areas over the studied period. Additionally, when comparing the GMW product with the proposed map for 2020, a strong agreement was observed at the country scale (n = 4), with a coefficient of determination (R2) of approximately 0.98.
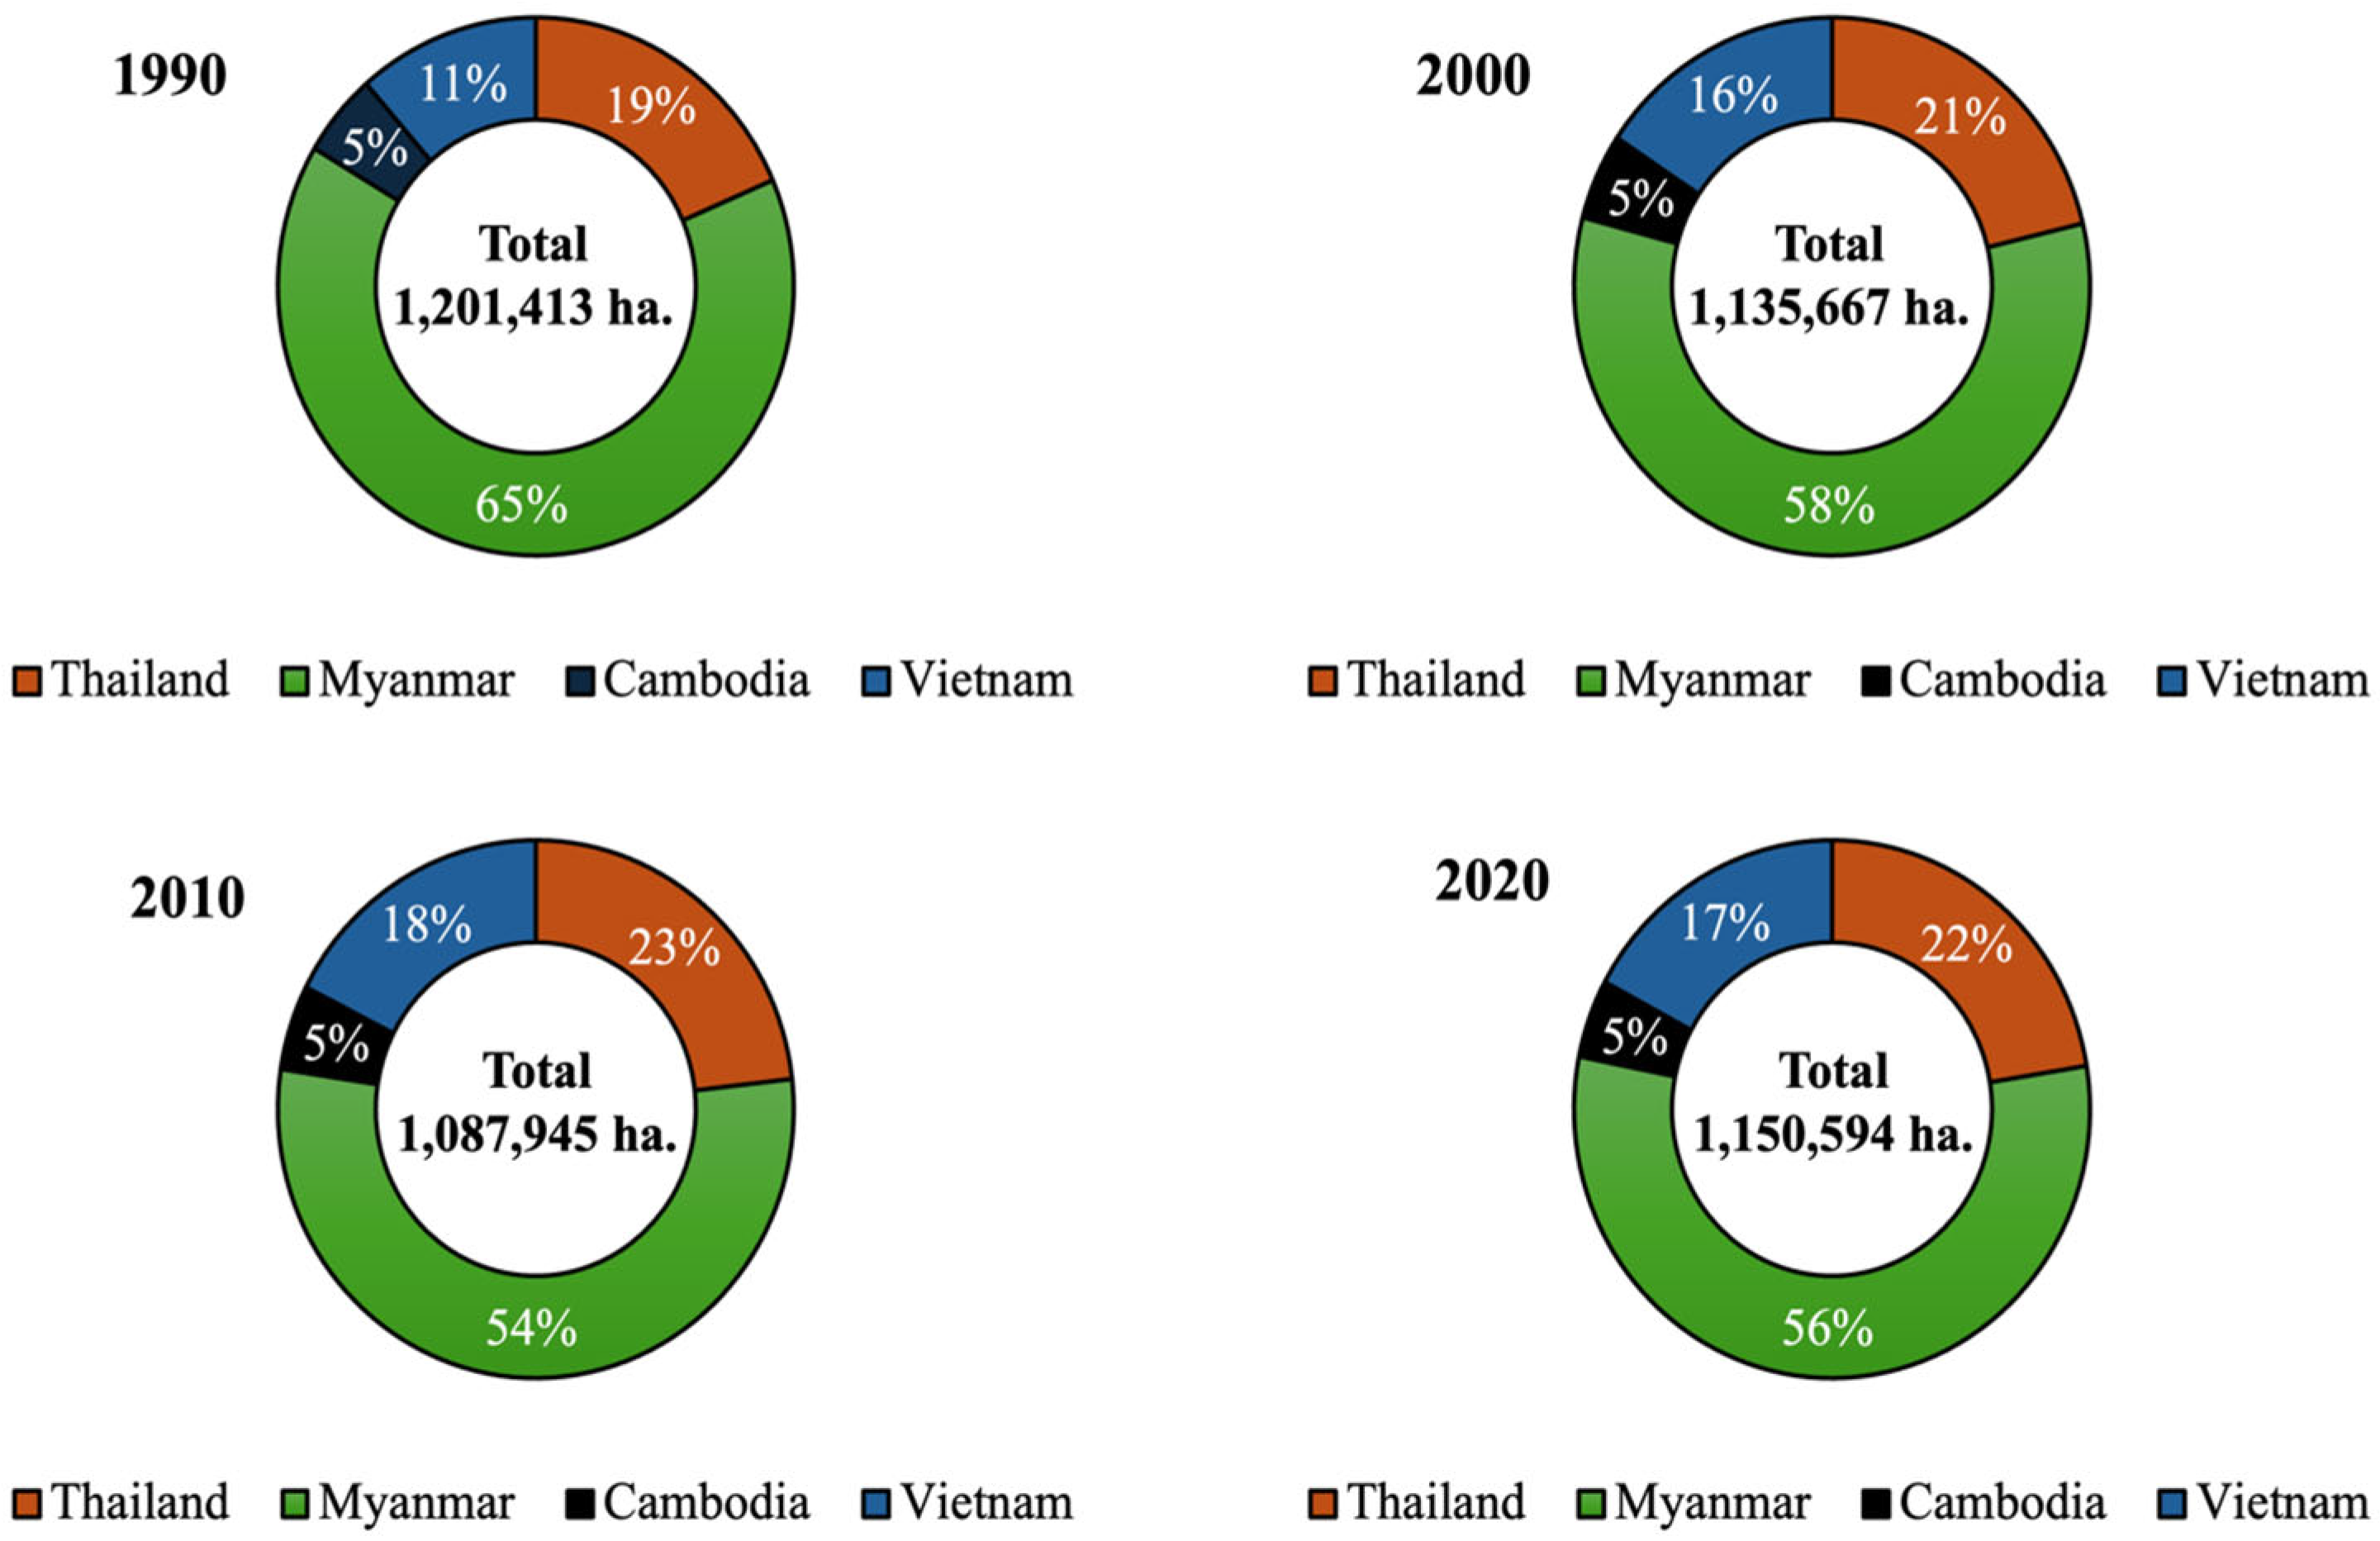
The variation in total mangrove forest area every decade in the Mekong region, separated for each of the countries, is presented in Figure 6. In 1990, the total mangrove coverage was 1,201,413 ha, with the majority in Myanmar, accounting for 65% of the total area of mangrove. Thailand contributed 19% and Vietnam 11%. This distribution of mangrove extent from Myanmar shows the significant share of the mangrove coverage within the region during this period. In the year 2000, there was a slight shift in the distribution, although the total area increased marginally to 1,135,667 ha. Myanmar’s proportion decreased to 58%, while Vietnam’s share expanded to 16%.
Figure 6. Variation in total mangrove forest extent every decade in each Mekong region.
Remotesensing 17 03728 g006
By 2010, Myanmar’s share dropped further to 54%, while Vietnam continued to increase its proportion to 18%. Thailand’s share also decreased to 23%. In 2020, the total mangrove area recorded was 1,150,594 ha, indicating a return to the levels seen in 2000. Vietnam’s share continued to grow to a notable 17%, suggesting effective conservation and/or expansion efforts. Myanmar maintained the majority with 56%, albeit with a marginal increase, and Thailand’s share stabilized at 22%. Cambodia’s contribution persisted at 5%, which was consistently the least across the four decades. The charts in Figure 6 collectively highlight a dynamic shift in mangrove distribution in the region, with Vietnam showing a significant increase in mangrove coverage over the decades, contrasting with the other countries, where the proportions have varied slightly or remained consistent.
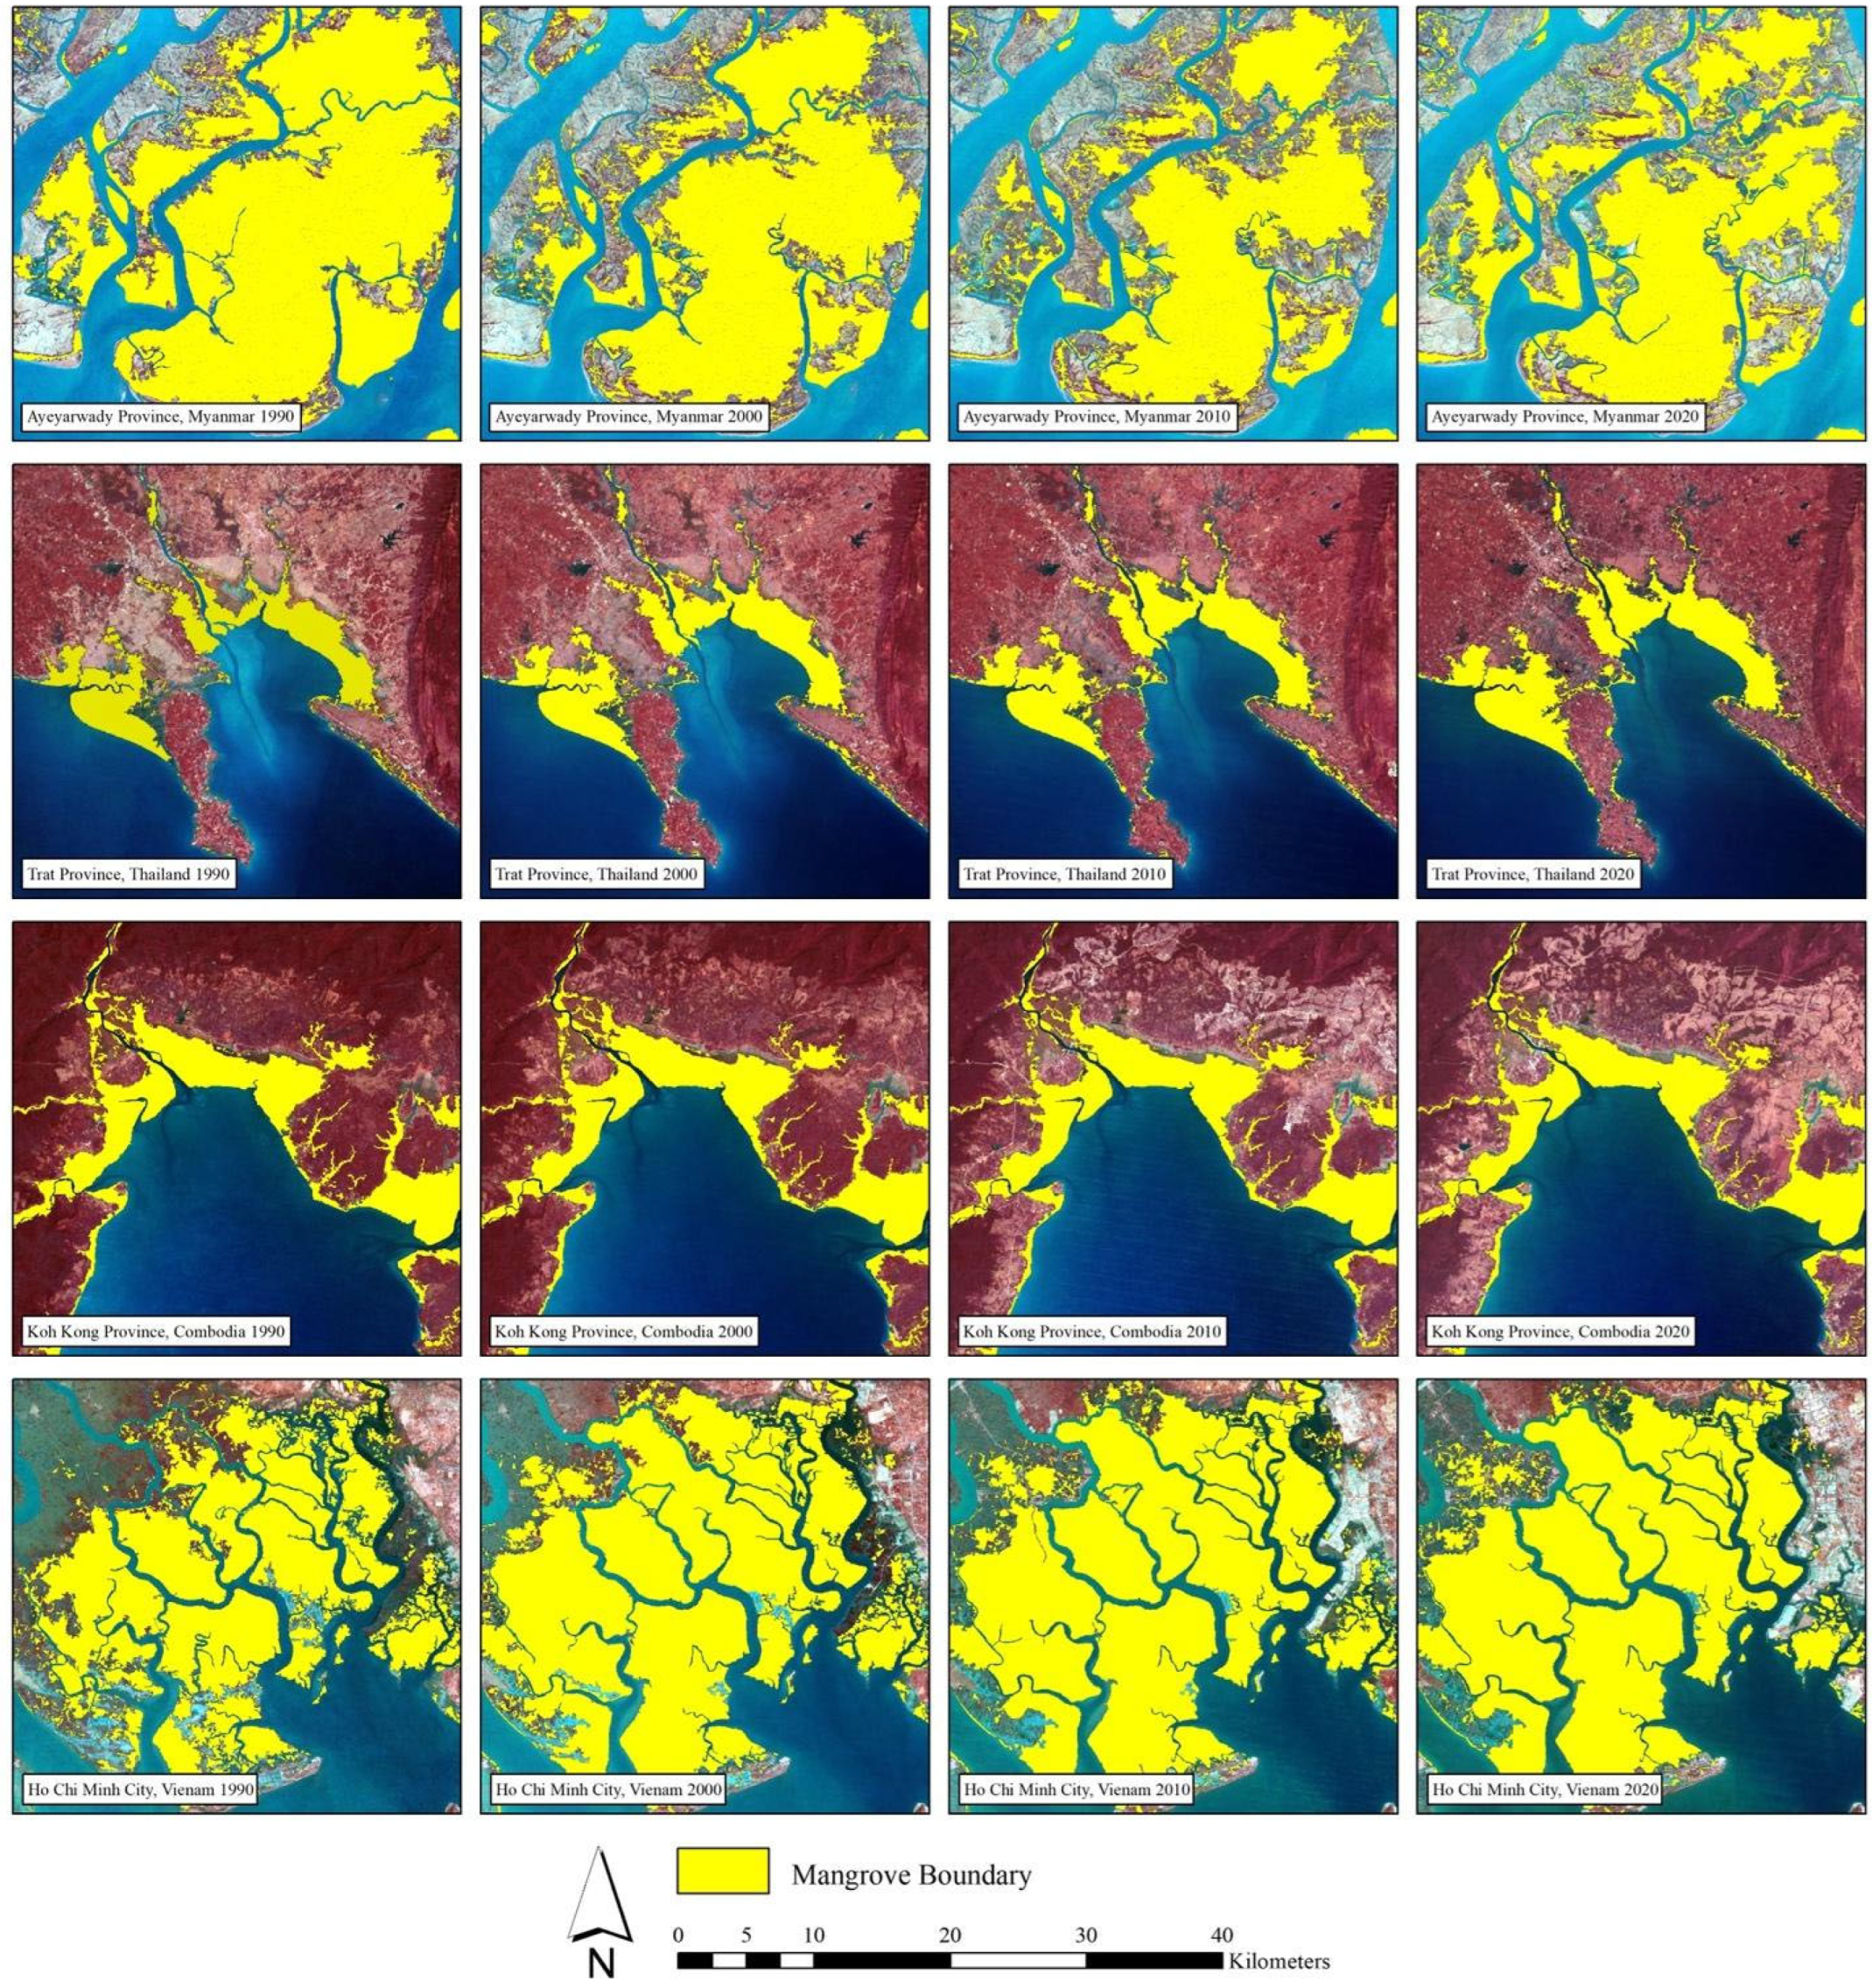
In Figure 7, the series of satellite images provides showcases of the classification of mangrove areas across four distinct time points, 1990, 2000, 2010, and 2020, in the countries of Myanmar, Thailand, Cambodia, and Vietnam. These classifications were achieved through the best RF algorithm, a robust method for predictive modeling and classification in remote sensing. In Figure 7, areas classified as mangroves are highlighted in yellow, standing out against the non-mangrove regions. The progression over four decades reveals significant changes in the extent and distribution of mangrove forests within each country. For Myanmar, the images display a trend of decreasing mangrove coverage, most notably after 2000, with the retreat of yellow areas, which are especially visible along the coastlines. In Thailand, the mangrove coverage appears relatively stable, with slight variations, suggesting effective conservation measures may be in place. Cambodia’s mangrove coverage shows fluctuations, with some years presenting more significant yellow coverage than others, indicating potential regrowth or loss. Vietnam demonstrated a remarkable increase in mangrove coverage, particularly from 2000 onwards, with the expansion of yellow areas, which might reflect successful reforestation and conservation initiatives.

4. Discussion

4.1. Spectral Reflectance of Mangrove Forest in Each Country and Feature Selection

The analysis of normalized reflectance values across different spectral bands for both mangrove and non-mangrove classes in the four countries provides valuable insights into the spectral characteristics of mangrove vegetation and its distinction from other types of non-mangrove vegetation. One clear observation is that the reflectance profiles for mangroves are distinct from those of non-mangrove vegetation across almost all spectral bands (Figure 8). This distinction is crucial for the effective application of remote sensing in identifying mangrove regions. In all countries, mangrove vegetation exhibits higher reflectance in the NIR band. This is consistent with the general characteristics of healthy vegetation [59] due to its cellular structure that leads to high reflection of NIR light [60].
The red band, which is sensitive to chlorophyll absorption [61], shows a relatively weak distinction between mangrove and non-mangrove areas (Figure 8), likely due to spectral mixing effects among multiple land cover types. However, mangroves typically exhibit higher reflectance in the NIR band due to their dense canopy and high chlorophyll concentration, which absorb more light for photosynthesis [43]. Furthermore, the short-wave infrared (SWIR1 and SWIR2) bands display relatively low reflectance for mangroves compared to non-mangroves, which is similar to the report of Yang et al. [62]. These bands are particularly sensitive to the water content [63] in vegetation and can indicate the unique adaptation of mangroves to their saline and water-logged habitats.
When examining country-specific profiles, Myanmar, Thailand, and Vietnam exhibited more pronounced differences in the NIR band compared to Cambodia, possibly due to the density and health of mangrove forests or species composition [43]. For Cambodia, the reflectance profiles exhibited similarities between the two classes, presenting challenges for classification. This may necessitate the use of more sophisticated analysis techniques.
In four countries, the reflectance profiles of mangrove and non-mangrove areas were quite similar across the spectral bands, especially in the SWIR2 band. This similarity could pose a challenge for classification and may necessitate more sophisticated analysis, such as the use of texture or other spectral indices. The reflectance profiles from Vietnam show a significant difference between the two classes in the NIR band, which is not as evident in the other countries. This difference could be useful for distinguishing mangroves in Vietnam, perhaps due to the specific characteristics of the mangroves or the background land cover in the sampled areas. The error bars on the graphs indicate some variability in the spectral signatures within the sampled datasets. This variability needs to be considered in the classification algorithms to ensure robustness and minimize the risk of misclassification.
In conclusion, the spectral signatures presented in these graphs underscore the potential of using multispectral remote sensing data for mangrove classification. However, they also highlight the need for careful consideration of the spectral properties unique to each country’s mangrove ecosystems. Additionally, ground-truthing and validation with in situ data are essential to calibrate and verify the remote sensing models.

4.2. Predictive Model Performances

Many studies have showcased the effectiveness of employing diverse techniques for mangrove mapping. Object-Based Image Analysis (OBIA) stands out as one such method that segments neighboring pixels into objects based on their spatial, spectral, and contextual characteristics [64]. Lombard et al. [65] applied OBIA and linear spectral unmixing to map mangrove forests in Senegal with Landsat imagery, achieving accuracy assessment that ranged from 0.8 to 0.83. However, this approach may have limitations, such as a margin of error of up to 20%, potentially underestimating the densification of mangrove species like Rhizophora mangle.
U-Net segmentation has emerged as another widely used method for mangrove mapping [66]. Maung et al. [67] found that the U-Net model, when coupled with multisource remote sensing datasets, yields a high OA of about 94.1% based on high-spatial-resolution data. Nonetheless, this method requires extensive data training and substantial computational resources for large-scale mapping, posing challenges for regional or country-scale applications [68]. Additionally, pixel-based classification is suitable for mapping dynamic land use areas. However, segmentation methods may not accurately fit or delineate small areas, such as mangroves and fragmented forests. Both techniques still require post-processing to minimize errors or over-classification, especially since mangrove extents have shifted over the years, as demonstrated in this study.
Combining multisensory data has also been explored, with [69] leveraging the RF algorithm to map mangrove ecosystems by combining Sentinel-1 and Sentinel-2 images. The study reveals that the pixel-based RF classifier yielded an accurate mangrove ecosystem map, boasting an average OA of 93.2% and a Kappa coefficient of 0.92. Notably, high producer’s and user’s accuracies exceeding 90% were achieved for all classes except aerial roots. However, it is important to note that the suitability of multisensory combinations for long-term monitoring of mangrove dynamics may vary depending on various factors and should be carefully evaluated.
Several studies have conducted extensive mangrove monitoring using Landsat datasets with 30 m spatial resolution and the RF approach [26,70]. For example, Purwanto et al. [71] illustrated the efficacy of the RF classification method in mapping mangroves within Sembilang National Park, Indonesia, utilizing Landsat-7 ETM+ and Landsat-8 OLI imagery. Their study revealed that the RF algorithm outperformed the classical decision tree approach, with all model parameters yielding higher producer accuracies in mapping mangrove forests. The OA of the present study was about 87.4%, which is similarly high.
However, there are alternative tree-based models such as Extreme Gradient Boosting (XGBoost) and Categorical Boosting (CatBoost) that have demonstrated strong performance in structured data classification and regression tasks. For instance, [15] evaluated several algorithms for early prediction of crop disease onset and found that XGBoost outperformed other models, including RF and support vector machine (SVM), achieving the highest prediction accuracy with a success rate of 61.5%. Similarly, Fu et al. [72] employed an ensemble learning framework comprising XGBoost, CatBoost, RF, LightGBM, and AdaBoost to map mangrove extent, with XGBoost contributing the highest importance in the ensemble model. Despite their promising performance, these advanced models often require extensive hyperparameter tuning—such as optimizing learning rate, maximum tree depth, and regularization terms—which can be computationally demanding and time-consuming. Furthermore, they are not natively supported within the GEE environment, limiting their operational feasibility for large-scale geospatial applications. SVMs, while effective in certain scenarios, are highly sensitive to kernel selection and input feature scaling, adding further complexity when applied across broad spatial domains [73].
Given these considerations, the RF model was chosen for its balance between accuracy, ease of implementation, and operational robustness. Moreover, the compatibility of RF with cloud computing platforms such as GEE has facilitated efficient processing and analysis of large-scale remote sensing datasets for mangrove mapping purposes [29,74]. This made RF a practical and scalable solution for regional-scale land cover classification in our study.

4.3. Comparison of Mangrove Mapping with Existing Studies

The results demonstrated the effectiveness of the employed method for accurately mapping and delineating mangrove extents. Consequently, the mangrove extents obtained from the proposed method were compared with those from existing sources. For example, Jia et al. [48] created a global mangrove forest dataset at 10 m spatial resolution from Sentinel-2 imagery, namely HGMF-2020, using an OBIA approach and RF classification. The result indicated that they achieved an OA of 93.6%, with a 95% confidence interval (CI95) ranging from 91.4% to 95.7%. Furthermore, the user’s accuracy and producer’s accuracy for mangrove forest classification were reported as 92.0% (with a CI95 range of 90.2% to 93.8%) and 91.0% (with a CI95 range of 89.6% to 92.3%), respectively, surpassing the accuracy levels attained in the study by approximately 6.2%. However, the mangrove extent reported by [48] also provided misclassification in some majority regions, as shown in Figure 9 (HGMW-2020). One study [47] introduced the GMW version 3.0 dataset, which tracked global mangrove extent changes from 1996 to 2020. The resulting mangrove extent maps had an estimated accuracy of 87.4% (86.2 ± 88.6% of CI95), which was aligned with the result. However, the details of mangrove extent in 1996 were underestimated compared to this study’s findings, which relied on FCC-1996, representing mangrove forest extent (Figure 9) (GMW-1996).
Nevertheless, the proposed method from the present study has some errors when the mangrove forest is distributed in small areas. This limitation may stem from the medium spatial resolution of the imagery used or could be addressed in future research through post-processing methods. Moreover, the results from this study may overclassify if nearby uncertain objects show similar criteria to mangrove characteristics.

4.4. Limitations and Outlook

A significant challenge in long-term mangrove mapping using Landsat imagery lies in maintaining data consistency across four decades. Variations in sensor design, calibration, and processing algorithms can introduce inconsistencies that affect the accuracy of trend analyses. Additionally, the 30 m spatial resolution of Landsat may not sufficiently capture small or fragmented mangrove patches, leading to mixed pixel effects and reduced classification precision. Persistent cloud cover and atmospheric interference further complicate data availability, causing temporal gaps and uncertainties. Although the LandTrendr algorithm was applied to mitigate these issues and generate stabilized annual composites, some residual errors remained, especially in persistently cloud-obscured regions.
Despite these challenges, the RF classification achieved high performance, with an OA of 87.3% and an F1-score of 87.4%. However, classification errors were still observed, particularly in distinguishing mangroves from spectrally similar land cover types such as evergreen and wetland forests. These misclassifications, as indicated in the confusion matrix (Table 4), likely resulted from spectral mixing and limitations in spatial resolution. By demonstrating the effectiveness of long-term Landsat time series and region-specific classification, this study provides evidence that regional assessments can enhance the robustness of global mangrove inventories and strengthen the scientific foundation for conservation and policy initiatives. In addition, our findings indicate that future iterations of the GMW should integrate regionally calibrated methods and localized reference data to improve mapping precision in small or fragmented coastal systems where global models have limitations.
To enhance future mangrove classification efforts, incorporating higher-resolution datasets (e.g., Sentinel-2 or PlanetScope) [75], topographic variables (e.g., slope, elevation), and tidal data could help better delineate mangrove boundaries. Advanced methods such as object-based image analysis or deep learning models may further reduce confusion among closely related land cover classes. Additionally, stratified and expanded validation sampling across ecological gradients could improve model robustness and generalizability.
In addition, tidal fluctuations, especially the differences between high and low tide during satellite image acquisition, can impact the spectral signatures of mangrove ecosystems and nearby intertidal areas. High tide conditions may submerge portions of the mangrove canopy or surrounding mudflats, which can obscure critical features and result in underrepresentation of mangrove extent. In contrast, images captured at low tide may reveal exposed substrates that resemble vegetation in spectral properties, potentially causing misclassification. Although this study employed annual Landsat composites created using the LandTrendr algorithm to reduce atmospheric and cloud-related noise, the composites are derived from images taken at various tidal phases. As a result, some classification inconsistencies may remain, particularly in coastal zones where mangrove distribution is patchy or confined to narrow strips.
Looking ahead, improvements in satellite sensor technology, data harmonization techniques, and multisource data integration will enhance the consistency and accuracy of long-term mangrove monitoring. Moreover, future research should consider integrating tidal stage data—such as from tide gauge records—to filter or weight image selection based on tidal conditions. While newer platforms like Sentinel-2 offer higher spatial resolution, their limited temporal coverage constrains long-term trend analysis. Additionally, incorporating in situ observations would further enhance the robustness and generalization of mangrove mapping. Field-based validation across different countries would provide more reliable reference data for model calibration and accuracy assessment, thereby improving the overall quality and reliability of future mangrove mapping efforts. However, the large amount of reference data is collected across several countries, which is time-consuming and very expensive. This study developed an excellent alternative method for high-quality data collection across a large region, leveraging the GWM dataset and PlanetScope high-resolution imagery. Nonetheless, combining Sentinel-2 data with Landsat and historical archives can support more detailed recent-period assessments and strengthen conservation and restoration planning. Continued advancements in remote sensing will play a key role in supporting evidence-based decision-making for the sustainable management of mangrove ecosystems.

5. Conclusions

In this study, a predictive model for annual mangrove forest monitoring by remote sensing has been developed, utilizing high-quality observations at the pixel level from 1984 to 2023. To achieve this, the LandTrendr algorithm was utilized to minimize cloud cover in the study area and create time-series-stabilized imagery from Landsat 4, 5, 7, 8, and 9. The RF classifier was employed with various sets of optimized predictive remote sensing features in four different countries in the Mekong region.
The study found that the mangrove forest extent derived from the RF classification largely aligns with and is consistent with existing sources of mangrove spatial distribution. However, smaller mangrove patches, below the spatial resolution, may not be classified accurately when compared with studies using data with higher spatial resolution, such as Sentinel-2 data or even airborne or drone data. Additionally, topographic datasets used in this study are very important to distinguish mangrove and non-mangrove areas, such as distance from the coastline and slope. These factors are key to minimizing the error of misclassification when mangrove areas are close to other evergreen forest areas. Spectral bands and band ratios also help enhance the classification model, resulting in confidence intervals ranging from 86.1% to 88.5% at a 95% confidence level.
The analysis revealed that the mangrove forest area in Myanmar has shown a consistent decline, representing approximately 9% of the overall mangrove forests in the Mekong region spanning 1990 to 2020, with a further slight decrease observed subsequently. Similarly, the mangrove forest area in Cambodia was the lowest when compared with others, and it has also declined by approximately 8693 ha. Conversely, mangrove areas in Thailand and Vietnam exhibited an increasing distribution, potentially compensating for the mangrove loss in the other two countries, thereby mitigating climate change and reducing greenhouse gas emissions.
The study findings hold practical significance in mangrove mapping and provide rich information for future strategic planning in the Mekong region. The spatiotemporal mangrove area information in this study can contribute to the formulation of restoration plans for mangrove forests and support initiatives for carbon credits to generate more income for developing countries. Finally, future research should focus on mapping mangrove areas in other countries and scrutinizing climatic conditions to improve model classification.

Author Contributions

Conceptualization, A.C. and S.K.; methodology, A.C.; validation, A.C., M.I. and J.S.-a.; formal analysis, A.C.; investigation, W.L., W.K., A.H. and C.V.; data curation, A.C.; writing—original draft preparation, A.C.; writing—review and editing, M.I., J.S.-a., A.K., S.K., W.L., W.K., C.V. and A.H.; visualization, A.C. and R.K.; supervision, S.K.; funding acquisition, S.K. All authors have read and agreed to the published version of the manuscript.

Funding

This research project was financially supported by Mahasarakham University.

Data Availability Statement

The raw data supporting the conclusions of this article will be made available by the authors upon request.

Acknowledgments

The authors express their sincere thanks to the anonymous reviewers whose insightful comments and suggestions helped improve and clarify this manuscript.

Conflicts of Interest

The authors declare no conflicts of interest.

References

  1. Sharma, S.; MacKenzie, R.A.; Tieng, T.; Soben, K.; Tulyasuwan, N.; Resanond, A.; Blate, G.; Litton, C.M. The Impacts of Degradation, Deforestation and Restoration on Mangrove Ecosystem Carbon Stocks across Cambodia. Sci. Total Environ. 2020, 706, 135416. [Google Scholar] [CrossRef] [PubMed]
  2. Lu, Y.; Wang, L. How to Automate Timely Large-Scale Mangrove Mapping with Remote Sensing. Remote Sens. Environ. 2021, 264, 112584. [Google Scholar] [CrossRef]
  3. Rahman; Ceanturi, A.; Tuahatu, J.W.; Lokollo, F.F.; Supusepa, J.; Hulopi, M.; Permatahati, Y.I.; Lewerissa, Y.A.; Wardiatno, Y. Mangrove Ecosystems in Southeast Asia Region: Mangrove Extent, Blue Carbon Potential and CO2 Emissions in 1996–2020. Sci. Total Environ. 2024, 915, 170052. [Google Scholar] [CrossRef] [PubMed]
  4. Hamdan, O.; Khali Aziz, H.; Mohd Hasmadi, I. L-Band ALOS PALSAR for Biomass Estimation of Matang Mangroves, Malaysia. Remote Sens. Environ. 2014, 155, 69–78. [Google Scholar] [CrossRef]
  5. Polidoro, B.A.; Carpenter, K.E.; Collins, L.; Duke, N.C.; Ellison, A.M.; Ellison, J.C.; Farnsworth, E.J.; Fernando, E.S.; Kathiresan, K.; Koedam, N.E.; et al. The Loss of Species: Mangrove Extinction Risk and Geographic Areas of Global Concern. PLoS ONE 2010, 5, e10095. [Google Scholar] [CrossRef]
  6. Baltezar, P.; Murillo-Sandoval, P.J.; Cavanaugh, K.C.; Doughty, C.; Lagomasino, D.; Tieng, T.; Simard, M.; Fatoyinbo, T. A Regional Map of Mangrove Extent for Myanmar, Thailand, and Cambodia Shows Losses of 44% by 1996. Front. Mar. Sci. 2023, 10, 1127720. [Google Scholar] [CrossRef]
  7. Tinh, P.H.; MacKenzie, R.A.; Hung, T.D.; Hanh, N.T.H.; Hanh, N.H.; Manh, D.Q.; Ha, H.T.; Tuan, M.S. Distribution and Drivers of Vietnam Mangrove Deforestation from 1995 to 2019. Mitig. Adapt. Strat. Glob. Chang. 2022, 27, 29. [Google Scholar] [CrossRef]
  8. Spalding, M.; Kainuma, M.; Collins, L. Book Review: World Atlas of Mangroves; Wetlands; Routledge: London, UK, 2010; Volume 31. [Google Scholar]
  9. FAO; UNDP; UNEP. Land Degradation in South Asia: Its Severity, Causes and Effects upon the People; FAO: Rome, Italy, 1994; Volume 78. [Google Scholar]
  10. Richards, D.R.; Friess, D.A. Rates and Drivers of Mangrove Deforestation in Southeast Asia, 2000–2012. Proc. Natl. Acad. Sci. USA 2016, 113, 344–349. [Google Scholar] [CrossRef]
  11. Giri, C.; Zhu, Z.; Tieszen, L.L.; Singh, A.; Gillette, S.; Kelmelis, J.A. Mangrove Forest Distributions and Dynamics (1975–2005) of the Tsunami-affected Region of Asia. J. Biogeogr. 2008, 35, 519–528. [Google Scholar] [CrossRef]
  12. Thampanya, U.; Vermaat, J.E.; Sinsakul, S.; Panapitukkul, N. Coastal Erosion and Mangrove Progradation of Southern Thailand. Estuar. Coast. Shelf Sci. 2006, 68, 75–85. [Google Scholar] [CrossRef]
  13. Pimple, U.; Simonetti, D.; Peters, R.; Berger, U.; Podest, E.; Gond, V. Enhancing Monitoring of Mangrove Spatiotemporal Tree Diversity and Distribution Patterns. Land. Degrad. Dev. 2023, 34, 1265–1282. [Google Scholar] [CrossRef]
  14. Alexopoulos, A.; Koutras, K.; Ben Ali, S.; Puccio, S.; Carella, A.; Ottaviano, R.; Kalogeras, A. Complementary Use of Ground-Based Proximal Sensing and Airborne/Spaceborne Remote Sensing Techniques in Precision Agriculture: A Systematic Review. Agronomy 2023, 13, 1942. [Google Scholar] [CrossRef]
  15. Chaiyana, A.; Khiripet, N.; Ninsawat, S.; Siriwan, W.; Shanmugam, M.S.; Virdis, S.G.P. Early Prediction of Cassava Mosaic Disease Onset Based on Remote Sensing and Climatic Data. Comput. Electron. Agric. 2025, 230, 109836. [Google Scholar] [CrossRef]
  16. Chaiyana, A.; Kumari, A.; Jagadish, S.V.K. Crop Field Segmentation and Irrigation Water Source Attribution for Groundwater Monitoring and Projection toward Conservation in the Texas High Plains. Sci. Total Environ. 2025, 994, 180031. [Google Scholar] [CrossRef] [PubMed]
  17. Cui, B.; Fei, D.; Shao, G.; Lu, Y.; Chu, J. Extracting Raft Aquaculture Areas from Remote Sensing Images via an Improved U-Net with a PSE Structure. Remote Sens. 2019, 11, 2053. [Google Scholar] [CrossRef]
  18. Chatziantoniou, A.; Charalampis Spondylidis, S.; Stavrakidis-Zachou, O.; Papandroulakis, N.; Topouzelis, K. Dissolved Oxygen Estimation in Aquaculture Sites Using Remote Sensing and Machine Learning. Remote Sens. Appl. 2022, 28, 100865. [Google Scholar] [CrossRef]
  19. Dadkhah, H.; Rana, D.; Ghaderpour, E.; Mazzanti, P. Analyzing Wildfire Patterns and Climate Interactions in Campania, Italy: A Multi-Sensor Remote Sensing Study. Ecol. Inf. 2025, 90, 103249. [Google Scholar] [CrossRef]
  20. Yang, H.; Kong, J.; Hu, H.; Du, Y.; Gao, M.; Chen, F. A Review of Remote Sensing for Water Quality Retrieval: Progress and Challenges. Remote Sens. 2022, 14, 1770. [Google Scholar] [CrossRef]
  21. Sun, Y.; Wang, D.; Li, L.; Ning, R.; Yu, S.; Gao, N. Application of Remote Sensing Technology in Water Quality Monitoring: From Traditional Approaches to Artificial Intelligence. Water Res. 2024, 267, 122546. [Google Scholar] [CrossRef]
  22. Hussain, S.; Lu, L.; Mubeen, M.; Nasim, W.; Karuppannan, S.; Fahad, S.; Tariq, A.; Mousa, B.G.; Mumtaz, F.; Aslam, M. Spatiotemporal Variation in Land Use Land Cover in the Response to Local Climate Change Using Multispectral Remote Sensing Data. Land 2022, 11, 595. [Google Scholar] [CrossRef]
  23. Zhang, R.; Jia, M.; Wang, Z.; Zhou, Y.; Mao, D.; Ren, C.; Zhao, C.; Liu, X. Tracking Annual Dynamics of Mangrove Forests in Mangrove National Nature Reserves of China Based on Time Series Sentinel-2 Imagery during 2016–2020. Int. J. Appl. Earth Obs. Geoinf. 2022, 112, 102918. [Google Scholar] [CrossRef]
  24. Chan-Bagot, K.; Herndon, K.E.; Puzzi Nicolau, A.; Martín-Arias, V.; Evans, C.; Parache, H.; Mosely, K.; Narine, Z.; Zutta, B. Integrating SAR, Optical, and Machine Learning for Enhanced Coastal Mangrove Monitoring in Guyana. Remote Sens. 2024, 16, 542. [Google Scholar] [CrossRef]
  25. Pirasteh, S.; Mafi-Gholami, D.; Li, H.; Fang, Z.; Nouri-Kamari, A.; Khorrami, B. Precision in Mapping and Assessing Mangrove Biomass: Insights from the Persian Gulf Coasts. Int. J. Appl. Earth Obs. Geoinf. 2024, 128, 103769. [Google Scholar] [CrossRef]
  26. Sun, Z.; Jiang, W.; Ling, Z.; Zhong, S.; Zhang, Z.; Song, J.; Xiao, Z. Using Multisource High-Resolution Remote Sensing Data (2 m) with a Habitat–Tide–Semantic Segmentation Approach for Mangrove Mapping. Remote Sens. 2023, 15, 5271. [Google Scholar] [CrossRef]
  27. Du, S.; Du, S.; Liu, B.; Zhang, X. Mapping Large-Scale and Fine-Grained Urban Functional Zones from VHR Images Using a Multi-Scale Semantic Segmentation Network and Object Based Approach. Remote Sens. Environ. 2021, 261, 112480. [Google Scholar] [CrossRef]
  28. Aviña-Hernández, J.; Ramírez-Vargas, M.; Roque-Sosa, F.; Martínez-Rincón, R.O. Predictive Performance of Random Forest on the Identification of Mangrove Species in Arid Environments. Ecol. Inf. 2023, 75, 102040. [Google Scholar] [CrossRef]
  29. Aji, M.A.P.; Kamal, M.; Farda, N.M. Mangrove Species Mapping through Phenological Analysis Using Random Forest Algorithm on Google Earth Engine. Remote Sens. Appl. 2023, 30, 100978. [Google Scholar] [CrossRef]
  30. Zhao, C.; Jia, M.; Wang, Z.; Mao, D.; Wang, Y. Identifying Mangroves through Knowledge Extracted from Trained Random Forest Models: An Interpretable Mangrove Mapping Approach (IMMA). ISPRS J. Photogramm. Remote Sens. 2023, 201, 209–225. [Google Scholar] [CrossRef]
  31. Miraki, M.; Sohrabi, H.; Immitzer, M. Tree Species Mapping in Mangrove Ecosystems Using UAV-RGB Imagery and Object-Based Image Classification. J. Indian. Soc. Remote Sens. 2023, 51, 2095–2103. [Google Scholar] [CrossRef]
  32. Kennedy, R.E.; Yang, Z.; Gorelick, N.; Braaten, J.; Cavalcante, L.; Cohen, W.B.; Healey, S. Implementation of the LandTrendr Algorithm on Google Earth Engine. Remote Sens. 2018, 10, 691. [Google Scholar] [CrossRef]
  33. Shimizu, K.; Murakami, W.; Furuichi, T.; Estoque, R.C. Mapping Land Use/Land Cover Changes and Forest Disturbances in Vietnam Using a Landsat Temporal Segmentation Algorithm. Remote Sens. 2023, 15, 851. [Google Scholar] [CrossRef]
  34. Parracciani, C.; Gigante, D.; Mutanga, O.; Bonafoni, S.; Vizzari, M. Land Cover Changes in Grassland Landscapes: Combining Enhanced Landsat Data Composition, LandTrendr, and Machine Learning Classification in Google Earth Engine with MLP-ANN Scenario Forecasting. GIsci Remote Sens. 2024, 61, 2302221. [Google Scholar] [CrossRef]
  35. Yin, X.; Chen, B.; Gu, X.; Yun, T.; Wu, Z.; Chen, Y.; Lai, H.; Kou, W. Rapid Monitoring of Tropical Forest Disturbance in Hainan Island Based on GEE Platform and LandTrendr Algorithm. J. Geo-Inf. Sci. 2023, 25, 220691. [Google Scholar] [CrossRef]
  36. Zhang, X.K.; Zhang, X.; Lan, Q.Q.; Ali Baig, M.H. Automated Detection of Coastline Using Landsat TM Based on Water Index and Edge Detection Methods. In Proceedings of the 2nd International Workshop on Earth Observation and Remote Sensing Applications, EORSA 2012, Shanghai, China, 8–11 June 2012. [Google Scholar]
  37. Saah, D.; Johnson, G.; Ashmall, B.; Tondapu, G.; Tenneson, K.; Patterson, M.; Poortinga, A.; Markert, K.; Quyen, N.H.; San Aung, K.; et al. Collect Earth: An Online Tool for Systematic Reference Data Collection in Land Cover and Use Applications. Environ. Model. Softw. 2019, 118, 166–171. [Google Scholar] [CrossRef]
  38. Huete, A.; Didan, K.; Miura, T.; Rodriguez, E.P.; Gao, X.; Ferreira, L.G. Overview of the Radiometric and Biophysical Performance of the MODIS Vegetation Indices. Remote Sens. Environ. 2002, 83, 195–213. [Google Scholar] [CrossRef]
  39. Rouse, J.W.; Haas, R.H.; Schell, J.A.; Deering, D.W. Monitoring Vegetation Systems in the Great Plains with ERTS; NASA Special Publication; NASA: Washington, DC, USA, 1974; Volume 24. [Google Scholar]
  40. Gitelson, A.A.; Kaufman, Y.J.; Merzlyak, M.N. Use of a Green Channel in Remote Sensing of Global Vegetation from EOS- MODIS. Remote Sens. Environ. 1996, 58, 289–298. [Google Scholar] [CrossRef]
  41. Huete, A. A Soil-Adjusted Vegetation Index (SAVI). Remote Sens. Environ. 1988, 25, 295–309. [Google Scholar] [CrossRef]
  42. Roujean, J.L.; Breon, F.M. Estimating PAR Absorbed by Vegetation from Bidirectional Reflectance Measurements. Remote Sens. Environ. 1995, 51, 375–384. [Google Scholar] [CrossRef]
  43. Baloloy, A.B.; Blanco, A.C.; Raymund Rhommel, R.R.C.; Nadaoka, K. Development and Application of a New Mangrove Vegetation Index (MVI) for Rapid and Accurate Mangrove Mapping. ISPRS J. Photogramm. Remote Sens. 2020, 166, 95–117. [Google Scholar] [CrossRef]
  44. Gao, B.C. NDWI—A Normalized Difference Water Index for Remote Sensing of Vegetation Liquid Water from Space. Remote Sens. Environ. 1996, 58, 257–266. [Google Scholar] [CrossRef]
  45. Gupta, K.; Mukhopadhyay, A.; Giri, S.; Chanda, A.; Datta Majumdar, S.; Samanta, S.; Mitra, D.; Samal, R.N.; Pattnaik, A.K.; Hazra, S. An Index for Discrimination of Mangroves from Non-Mangroves Using LANDSAT 8 OLI Imagery. MethodsX 2018, 5, 1129–1139. [Google Scholar] [CrossRef]
  46. Chandrasekar, K.; Sesha Sai, M.V.R.; Roy, P.S.; Dwevedi, R.S. Land Surface Water Index (LSWI) Response to Rainfall and NDVI Using the MODIS Vegetation Index Product. Int. J. Remote Sens. 2010, 31, 3987–4005. [Google Scholar] [CrossRef]
  47. Bunting, P.; Rosenqvist, A.; Hilarides, L.; Lucas, R.M.; Thomas, N.; Tadono, T.; Worthington, T.A.; Spalding, M.; Murray, N.J.; Rebelo, L.M. Global Mangrove Extent Change 1996–2020: Global Mangrove Watch Version 3.0. Remote Sens. 2022, 14, 3657. [Google Scholar] [CrossRef]
  48. Jia, M.; Wang, Z.; Mao, D.; Ren, C.; Song, K.; Zhao, C.; Wang, C.; Xiao, X.; Wang, Y. Mapping Global Distribution of Mangrove Forests at 10-m Resolution. Sci. Bull. 2023, 68, 1306–1316. [Google Scholar] [CrossRef]
  49. Tadono, T.; Ishida, H.; Oda, F.; Naito, S.; Minakawa, K.; Iwamoto, H. Precise Global DEM Generation by ALOS PRISM. ISPRS Ann. Photogramm. Remote Sens. Spat. Inf. Sci. 2014, II–4, 71–76. [Google Scholar] [CrossRef]
  50. Pekel, J.F.; Cottam, A.; Gorelick, N.; Belward, A.S. High-Resolution Mapping of Global Surface Water and Its Long-Term Changes. Nature 2016, 540, 418–422. [Google Scholar] [CrossRef] [PubMed]
  51. Triwijoyo, B.K.; Adil, A. Analysis of Medical Image Resizing Using Bicubic Interpolation Algorithm. J. Ilmu Komput. 2021, 14, 20–29. [Google Scholar] [CrossRef]
  52. Goh, T.Y.; Basah, S.N.; Yazid, H.; Aziz Safar, M.J.; Ahmad Saad, F.S. Performance Analysis of Image Thresholding: Otsu Technique. Measurement 2018, 114, 298–307. [Google Scholar] [CrossRef]
  53. Sekehravani, E.A.; Babulak, E.; Masoodi, M. Implementing Canny Edge Detection Algorithm for Noisy Image. Bull. Electr. Eng. Inform. 2020, 9, 1837. [Google Scholar] [CrossRef]
  54. Colditz, R.R.; Acosta-Velázquez, J.; Díaz Gallegos, J.R.; De Vázquez Lule, A.; Rodríguez-Zúñiga, M.T.; Maeda, P.; Cruz López, M.I.; Ressl, R. Potential Effects in Multi-Resolution Post-Classification Change Detection. Int. J. Remote Sens. 2012, 33, 6426–6445. [Google Scholar] [CrossRef]
  55. Bunting, P.; Rosenqvist, A.; Lucas, R.M.; Rebelo, L.M.; Hilarides, L.; Thomas, N.; Hardy, A.; Itoh, T.; Shimada, M.; Finlayson, C.M. The Global Mangrove Watch—A New 2010 Global Baseline of Mangrove Extent. Remote Sens 2018, 10, 1669. [Google Scholar] [CrossRef]
  56. Wallis, S. Binomial Confidence Intervals and Contingency Tests: Mathematical Fundamentals and the Evaluation of Alternative Methods. J. Quant. Linguist. 2013, 20, 178–208. [Google Scholar] [CrossRef]
  57. Congalton, R.G. A Review of Assessing the Accuracy of Classifications of Remotely Sensed Data. Remote Sens. Environ. 1991, 37, 35–46. [Google Scholar] [CrossRef]
  58. Chicco, D.; Jurman, G. The Advantages of the Matthews Correlation Coefficient (MCC) over F1 Score and Accuracy in Binary Classification Evaluation. BMC Genom. 2020, 21, 6. [Google Scholar] [CrossRef]
  59. Lum, C.; Mackenzie, M.; Shaw-Feather, C.; Luker, E.; Dunbabin, M. Multispectral Imaging and Elevation Mapping from an Unmanned Aerial System for Precision Agriculture Applications. In Proceedings of the 13th International Conference on Precision Agriculture 2016, St. Louis, MO, USA, 31 July–3 August 2016. [Google Scholar]
  60. Huete, A.R. Remote Sensing for Environmental Monitoring. In Environmental Monitoring and Characterization; Elsevier: Amsterdam, The Netherlands, 2004; pp. 183–206. [Google Scholar]
  61. Zhang, H.; Li, J.; Liu, Q.; Lin, S.; Huete, A.; Liu, L.; Croft, H.; Clevers, J.G.P.W.; Zeng, Y.; Wang, X.; et al. A Novel Red-Edge Spectral Index for Retrieving the Leaf Chlorophyll Content. Methods Ecol. Evol. 2022, 13, 2771–2787. [Google Scholar] [CrossRef]
  62. Yang, G.; Huang, K.; Sun, W.; Meng, X.; Mao, D.; Ge, Y. Enhanced Mangrove Vegetation Index Based on Hyperspectral Images for Mapping Mangrove. ISPRS J. Photogramm. Remote Sens. 2022, 189, 236–254. [Google Scholar] [CrossRef]
  63. Ghulam, A.; Li, Z.L.; Qin, Q.M.; Tong, Q.X.; Wang, J.H.; Kasimu, A.; Zhu, L. A Method for Canopy Water Content Estimation for Highly Vegetated Surfaces-Shortwave Infrared Perpendicular Water Stress Index. Sci. China Ser. D Earth Sci. 2007, 50, 1359–1368. [Google Scholar] [CrossRef]
  64. Pasaribu, R.A.; Aditama, F.A.; Setyabudi, P. Object-Based Image Analysis (OBIA) for Mapping Mangrove Using Unmanned Aerial Vehicle (UAV) on Tidung Kecil Island, Kepulauan Seribu, DKI Jakarta Province. IOP Conf. Ser. Earth Environ. Sci. 2021, 944, 012037. [Google Scholar] [CrossRef]
  65. Lombard, F.; Andrieu, J. Mapping Mangrove Zonation Changes in Senegal with Landsat Imagery Using an Obia Approach Combined with Linear Spectral Unmixing. Remote Sens. 2021, 13, 1961. [Google Scholar] [CrossRef]
  66. Dang, K.B.; Nguyen, M.H.; Nguyen, D.A.; Phan, T.T.H.; Giang, T.L.; Pham, H.H.; Nguyen, T.N.; Van Tran, T.T.; Bui, D.T. Coastal Wetland Classification with Deep U-Net Convolutional Networks and Sentinel-2 Imagery: A Case Study at the Tien Yen Estuary of Vietnam. Remote Sens. 2020, 12, 3270. [Google Scholar] [CrossRef]
  67. Maung, W.S.; Tsuyuki, S.; Guo, Z. Improving Land Use and Land Cover Information of Wunbaik Mangrove Area in Myanmar Using U-Net Model with Multisource Remote Sensing Datasets. Remote Sens. 2023, 16, 76. [Google Scholar] [CrossRef]
  68. Fu, C.; Song, X.; Xie, Y.; Wang, C.; Luo, J.; Fang, Y.; Cao, B.; Qiu, Z. Research on the Spatiotemporal Evolution of Mangrove Forests in the Hainan Island from 1991 to 2021 Based on SVM and Res-UNet Algorithms. Remote Sens. 2022, 14, 5554. [Google Scholar] [CrossRef]
  69. Ghorbanian, A.; Zaghian, S.; Asiyabi, R.M.; Amani, M.; Mohammadzadeh, A.; Jamali, S. Mangrove Ecosystem Mapping Using Sentinel-1 and Sentinel-2 Satellite Images and Random Forest Algorithm in Google Earth Engine. Remote Sens. 2021, 13, 2665. [Google Scholar] [CrossRef]
  70. Goldberg, L.; Lagomasino, D.; Thomas, N.; Fatoyinbo, T. Global Declines in Human-Driven Mangrove Loss. Glob. Chang. Biol. 2020, 26, 5844–5855. [Google Scholar] [CrossRef]
  71. Purwanto, A.D.; Wikantika, K.; Deliar, A.; Darmawan, S. Decision Tree and Random Forest Classification Algorithms for Mangrove Forest Mapping in Sembilang National Park, Indonesia. Remote Sens. 2023, 15, 16. [Google Scholar] [CrossRef]
  72. Fu, B.; He, X.; Yao, H.; Liang, Y.; Deng, T.; He, H.; Fan, D.; Lan, G.; He, W. Comparison of RFE-DL and Stacking Ensemble Learning Algorithms for Classifying Mangrove Species on UAV Multispectral Images. Int. J. Appl. Earth Obs. Geoinf. 2022, 112, 102890. [Google Scholar] [CrossRef]
  73. Tsai, C.A.; Chang, Y.J. Efficient Selection of Gaussian Kernel SVM Parameters for Imbalanced Data. Genes 2023, 14, 583. [Google Scholar] [CrossRef]
  74. Yancho, J.M.M.; Jones, T.G.; Gandhi, S.R.; Ferster, C.; Lin, A.; Glass, L. The Google Earth Engine Mangrove Mapping Methodology (Geemmm). Remote Sens. 2020, 12, 3758. [Google Scholar] [CrossRef]
  75. Fauzi, A.I.; Immitzer, M.; Atzberger, C. Exploring New Mangrove Horizons: A Scalable Remote Sensing Approach with Planet-NICFI and Sentinel-2 Images. Ecol. Inf. 2025, 88, 103152. [Google Scholar] [CrossRef]
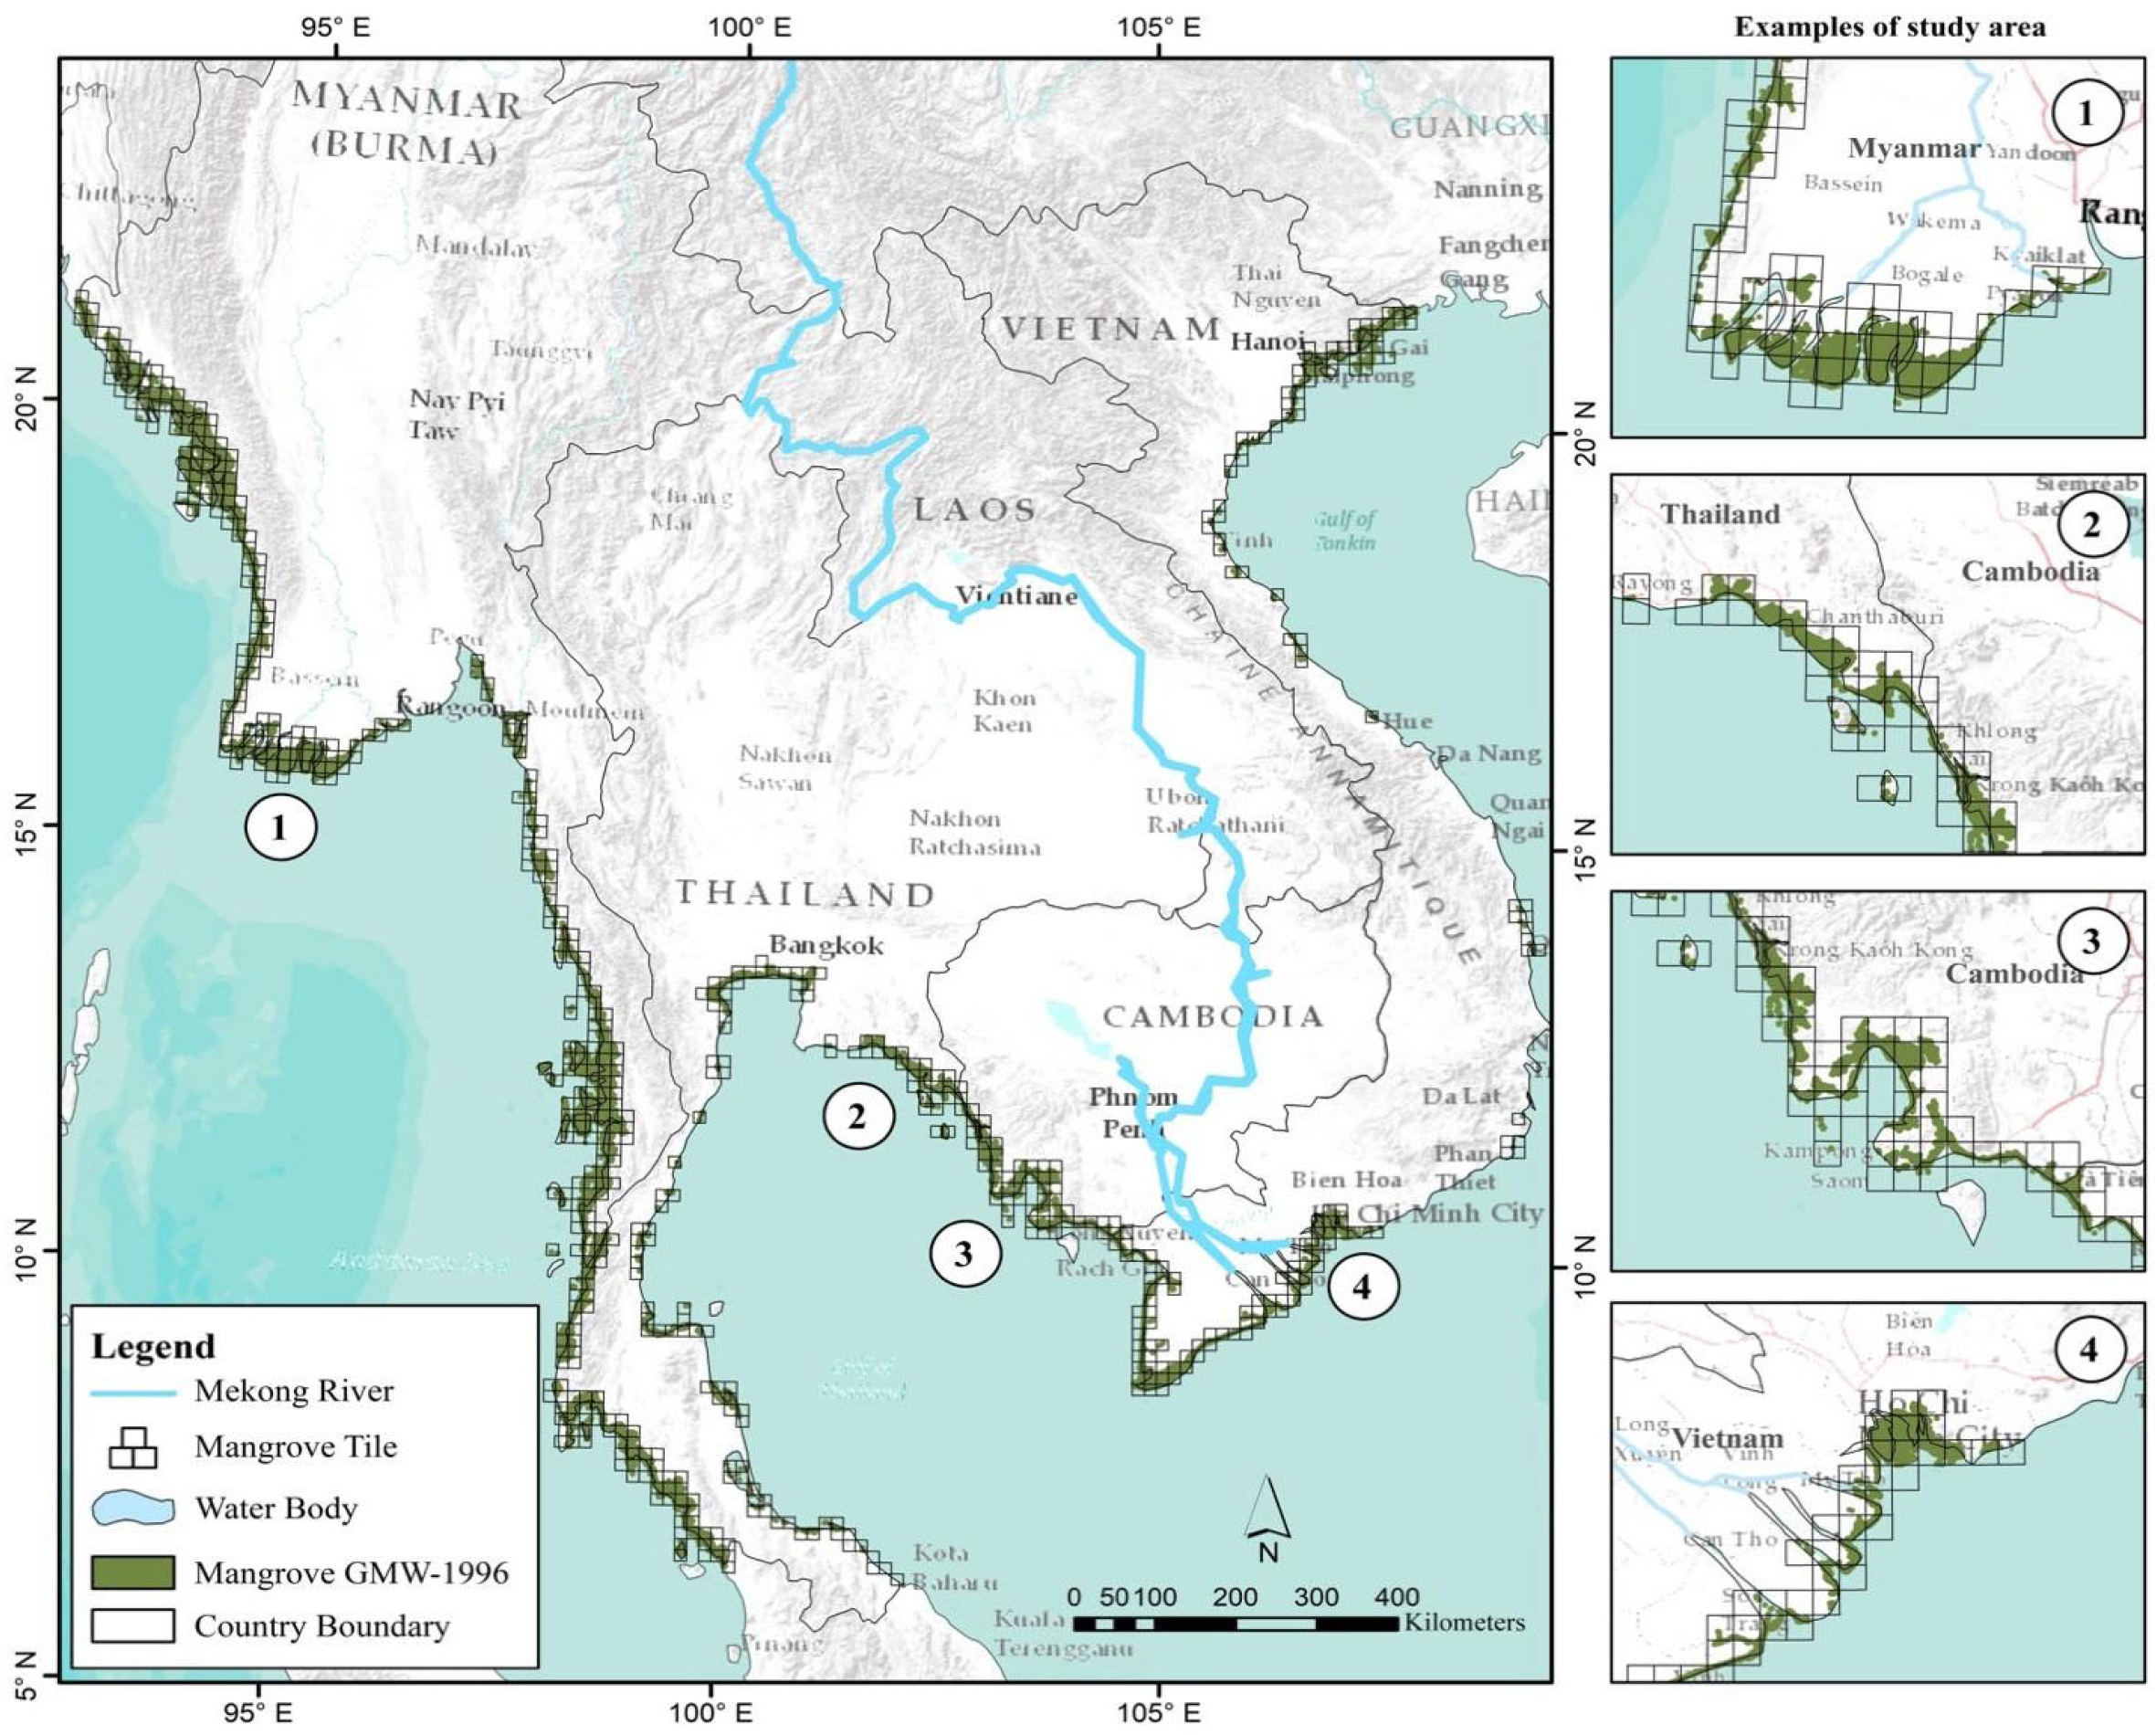
Figure 1. Study area and mangrove sampling dataset from Global Mangrove Watch (GMW) in 1996. The mangrove areas in the Mekong region include four countries: Myanmar, Thailand, Cambodia, and Vietnam, listed as examples 1 through 4, respectively. The square tiles indicated mangrove extent from Global Mangrove Watch from 1996 to 2020 to narrow down the study area.
Remotesensing 17 03728 g001
Figure 2. An example of mangrove observations from four distinctive locations on false composite color (Swir1, Red, and Green channels). Green dots refer to mangrove samples and yellow dots refer to non-mangrove samples.
Remotesensing 17 03728 g002
Figure 3. Flow chart of the research process. The schematic framework is divided into three main sections: Image pre-processing; Data collection, Spectral Extraction and Potential mangrove area; Data modeling, Validation and mapping.
Remotesensing 17 03728 g003
Figure 4. Optimal feature selection from RF classification and the importance score. The red dotted line was represented between highest accuracy assessment and optimal number of features.
Remotesensing 17 03728 g004
Figure 7. Example of mangrove classification showing the majority extent within selected regions of each country by decade.
Remotesensing 17 03728 g007
Figure 8. Reflectance of mangrove and non-mangrove areas from distinctive areas based on 6 spectral bands of Landsat from data collection samples. The standard error bar indicates the mean normalized reflectance calculated country by country.
Remotesensing 17 03728 g008
Figure 9. Comparison between existing mangrove extent sources and the proposed method. FCC refers to false color composite; yellow color is the classification from this study; and green and red colors are mangrove forest extent from high-resolution global mangrove forests (HGMF) and Global Mangrove Watch (GMW), respectively.
Remotesensing 17 03728 g009
Table 1. The data collection of mangrove and non-mangrove classes based on PlanetScope data from 2015 to 2023.
YearMangroveNon-Mangrove
PondEvergreenDeciduousBare LandWaterbodyVillageBuildingOthers
20158864589892083618044
201612286588686863905666
20174907670676771747064
20185016874743074678160
20193446035687264608275
20207127161896082666967
20214016481816445798667
20222206881686362877484
20232188050788484667487
Total5000597629682528628650672614
Table 2. The details of the additional indices derived from Landsat datasets for mapping mangrove forests.
No. VegetationEquationReference
1Enhanced Vegetation Index (EVI)   2.5 × ( N I R R e d N I R + 6 × R e d 7.5 × B l u e + 1 ) [38]
2Normalized Difference Vegetation Index (NDVI)   N I R R e d N I R + R e d [39]
3Green Normalized Difference Vegetation Index (GNDVI) N I R G r e e n N I R + G r e e n [40]
4Soil Adjusted Vegetation Index (SAVI) ( N I R R e d ) × 1.5 N I R + R e d × 0.5 [41]
5Re-Normalized Difference Vegetation Index (RDVI) N I R R e d N I R + R e d [42]
6Mangrove Vegetation Index (MVI) N I R G r e e n S W I R 1 + G r e e n [43]
7Normalized Difference Water Index (NDWI) G r e e n N I R G r e e n + N I R [44]
8Combined Mangrove Recognition Index (CMRI) N I R R e d N I R + R e d G r e e n N I R G r e e n + N I R [45]
9Land Surface Water Index (LSWI) N I R S W I R 1 N I R + S W I R 1 [46]
Note that NIR is near-infrared, and SWIR refers to short-wave infrared.
Table 3. Summary of the accuracy assessment approaches used in this study.
No.DefinitionEquationReference
1Overall Accuracy (OA) O A = T P + T N T P + T N + F P + F N × 100 [57]
2User’s Accuracy (UA) U A o r   P r e c i s i o n = T P T P + F P × 100
3Producer’s accuracy (PA) P A o r   r e c a l l = T P T P + F N  
4OA of confidence Interval (CI) at 95% C I = 1 1 + z 2 n ( p ^ + z 2 2 n ± p ^ ( 1 p ^ n + z 2 4 n 2 ) [56]
5F1-score F 1 s c o r e = 2 ·   P r e c i s i o n * R e c a l l P r e c i s i o n + R e c a l l = 2 · T P 2 · T P + F P + F N [58]
Table 4. Confusion Matrix of RF classification results based on the independent validation dataset (n = 3000).
ClassMangroveNon-MangroveRow TotalUA (%)OA (%)F1-Score (%)CI95 (OA%)
Mangrove1305195150087.187.387.486.1–88.5
Non-mangrove1851315150087.6
Column Total149015102620-
PA (%)87.687.1
Note that the validation samples were randomly selected and evenly distributed across the years 2015 to 2023.
Disclaimer/Publisher’s Note: The statements, opinions and data contained in all publications are solely those of the individual author(s) and contributor(s) and not of MDPI and/or the editor(s). MDPI and/or the editor(s) disclaim responsibility for any injury to people or property resulting from any ideas, methods, instructions or products referred to in the content.