Article

Analysis of the Current Situation of CO2 Satellite Observation

1
State Key Laboratory of Climate System Prediction and Risk Management (CPRM), School of Reading Academy, School of Atmospheric Science, Nanjing University of Information Science and Technology, Nanjing 210044, China
2
Division of Geological and Planetary Sciences, California Institute of Technology, Pasadena, CA 91125, USA
*
Author to whom correspondence should be addressed.
Remote Sens. 2025, 17(21), 3635; https://doi.org/10.3390/rs17213635
Submission received: 10 September 2025 / Revised: 26 October 2025 / Accepted: 28 October 2025 / Published: 3 November 2025

Highlights

What are the main findings?
  • Compared with observations, OCO-2 and GOSAT satellites exhibit a general neg-ative bias over land with the best accuracy in spring.
  • Satellites showed limited performance in tropical regions and biases in sub-regions like East and South Asia; ocean measurements had the largest spring biases and seasonal errors.
What is the implication of the main finding?
  • Seasonal and regional biases, influenced by topography and aerosols, highlight the need for targeted corrections to improve CO2 monitoring.
  • Better satellite retrievals over deserts suggest surface type impacts accuracy, guiding improvements in data interpretation for carbon flux research.

Abstract

Accurate quantification of carbon dioxide (CO2) sources and sinks is becoming a key aspect in recent carbon flux research; yet our understanding of satellite performance on regional scales remains insufficient. In this work, the column-averaged dry-air mole fraction of CO2 retrieved from OCO-2 v11.1r and GOSAT v03.05 was evaluated against CarbonTracker (CT) using data from March 2022 to August 2023. Also, the satellite data were validated against those from the Total Carbon Column Observing Network (TCCON) for March 2022 to February 2024. Comparison with CT revealed that both satellites had a general negative bias over land and the best performance in spring. In Southern Hemisphere land regions, the satellites captured monthly variability reliably, with OCO-2 obtaining the most accurate monthly concentrations. In Northern Hemisphere land regions, CT demonstrated the best performance, although both satellites accurately quantified monthly variations in some regions. In tropical land regions, none of the satellites showed superior performance. OCO-2 data showed bias features in sub-regional areas such as East and South Asia. For ocean regions, the bias was the largest in spring. Phase offset, slight underestimation of concentrations, and seasonal biases were found over several ocean regions in OCO-2 time series, whereas GOSAT was unable to provide reasonable results. When comparing TCCON with OCO-2 and GOSAT data, we found systematic errors of −0.12 and −0.56 ppm and root mean square errors of 1.08 and 1.70 ppm, respectively, mainly contributed by topographic variation and aerosol load. The errors were the smallest in spring and larger in summer and winter. Both CT- and TCCON-based analyses indicated that current satellite products may have better performance in desert surfaces. Clouds, aerosols, and surface pressure still challenged OCO-2 retrieval, while the bias-correction process can be emphasized for GOSAT.

1. Introduction

As one of the most important greenhouse gases (GHGs) exacerbating climate change [1], carbon dioxide (CO2) accounts for the largest global warming effect, with an effective radiative forcing of 2.16 W m−2 in 2019 reported by the IPCC [2]. During the preindustrial period, CO2 concentration increased slowly [3]. Since the industrial era, however, human activities have led to significant CO2 emissions, which can impose severe climatic impacts, including frequent extreme weather events [4], ocean acidification [5], and rising sea levels [6]. Increasing CO2 concentrations may even directly threaten human health [7]. Therefore, accurate detection of global CO2 sources and sinks is an urgent need for mitigating climate change.
Various measurements can be used to detect CO2 dynamics. As a traditional observation technique that has been developed for a relatively long time, ground-based observation (e.g., the Total Carbon Column Observing Network; TCCON) can offer highly accurate and precise measurements [8,9,10]. Airborne observation is another common method. It has the capability of high-density detection [11] and monitoring CO2 over small areas in a short period of time [12]. However, the former has limited spatial coverage and representativeness [13], while the latter, due to the high costs and restricted duration of aircraft missions, is also not suitable to provide continuous long-term observations [14]. This indicates that these observations cannot fully satisfy the demands of CO2 observation. Nevertheless, thanks to space-based remote sensing technology, satellite detection has become an important and powerful approach for observing the column-averaged dry-air mole fraction of atmospheric CO2 (XCO2). Compared with ground-based and airborne observations, the primary advantage of space-based remote sensing lies in long-term observations on global scales [9].
With the development of satellite remote sensing, there has been a transition from early observations in the thermal infrared wavelength range to specifically designed measurements in the shortwave infrared (SWIR) wavelength range [15]. This new technique was first utilized by the Environment Satellite (ENVISAT-2002-9A), launched by the European Space Agency (ESA) in 2002 [16]. The first satellite dedicated to monitoring atmospheric CO2 concentrations, the Greenhouse Gases Observing Satellite (GOSAT), then entered space in 2009 [17,18,19]. Subsequently, the Orbiting Carbon Observatory-2 (OCO-2) was launched by the NASA in 2014 [20,21,22]. The Carbon Dioxide Observation Satellite (TanSat) and Atmospheric Environment Monitoring Satellite (DQ-1) were launched in 2016 and 2022, respectively [15]. However, the TanSat data is only available up to January 2020, and DQ-1, as a recently launched satellite, has only a short observation period. Thus, GOSAT and OCO-2 remain important tools for observing the global CO2 distribution.
Despite advancements in satellite retrieval, research indicates that satellite observations may not always be accurate. Clouds and aerosols can directly affect satellite observations [18,23,24,25] and are the largest sources of errors [21]. Satellite observations can also be influenced by surface characteristics (e.g., surface albedo), which are highly dependent on the type of surface, such as rainforests [26,27], snow surfaces [28], and deserts [20,24]. The accuracy of a priori and parametric bias correction, e.g., surface pressure, in the retrieval process has also been emphasized [29,30]. Furthermore, because of the degradation of detection instruments [19,31,32], errors become increasingly severe over time [27,32,33]. Therefore, with the operation of satellites and upgrades of retrieval algorithms [18,19,20,21,22,29,30,34], evaluating the satellite products and identifying the sources of error are continuous work.
Previous studies primarily utilized TCCON measurements to validate OCO-2 and GOSTA retrievals [19,20,27,30,33,34,35]. These studies mostly collected data from available TCCON sites and considered the comparison as the global-scale evaluation result, or diagnosed the sources of errors on a local scale and thereby improved retrieval algorithms or bias correction related to retrieval parameters. Through continuous and constructive efforts, satellite observations on global scales have reached a relatively high level of confidence [32,35,36] in scientific applications such as CO2 flux inversion [9,37,38,39], especially for OCO-2 [38,39]. However, because of the unbalanced spatial distribution and limited coverage of TCCON stations, one can hardly evaluate the satellite performance on regional scales in a reasonable manner.
On the other hand, there have been much fewer studies comparing models with data from the two satellites, and most of these studies focused on global [32] or continental scales [40]. It is worth noting that the regional-scale evaluations are still limited, yet, importantly, this is the scale on which space-based observations and CO2 flux inversion may become controversial [9,41,42], typically in tropical regions [38,42] and over oceans [38,43].
Thus, this study aimed at (1) exploring the advantages and disadvantages of recent versions of satellite products relative to CarbonTracker (CT) data on regional scales and investigating sources of differences, as well as (2) utilizing TCCON measurements to validate recent versions of satellite retrievals and diagnose the causes of errors on local scales. The remainder of this paper is structured as follows: In Section 2, we introduce data and matching methods in detail. In Section 3, we compare monthly averaged concentrations over regional scale against CT data and daily concentrations against TCCON data while identifying potential causes of discrepancies. In Section 4, we discuss our findings to relate them to previous work and provide suggestions for future validation and application. Finally, we conclude the study in Section 5.

2. Data and Methods

2.1. Data

2.1.1. GOSAT

GOSAT, as the first satellite dedicated to monitoring GHGs [19], was launched in January 2009 under cooperation of the Ministry of the Environment, the National Institute for Environmental Studies (NIES), and the Japan Aerospace Exploration Agency [17,19]. It uses the Thermal and Near-intrinsic Sensor for Carbon Observation (TANSO) to measure carbon across the Earth for a period of 3 days [17]. The TANSO consists of the Fourier Transform Spectrometer (FTS) and the Cloud and Aerosol Imager (CAI). The FTS observes four bands (0.758–0.775, 1.56–1.72, 1.92–2.08, and 5.5–14.3 µm) of the Earth’s reflected radiation, while the CAI detects aerosols and clouds for filtering and correction [17,18,34]. The instantaneous field of view of the nadir scan gives a 10.5-km (spatial resolution) diameter circle footprint with an acquisition time of 4 s (temporal resolution) [17,32]. In this study, we used the GOSAT TANSO-FTS SWIR Level 2 CO2 V03.05 bias-corrected product [19,44], focusing on data from March 2022 to February 2024. The data were downloaded from the GOSAT Data Archive Service (https://data2.gosat.nies.go.jp/, last accessed on 15 August 2024) [45].

2.1.2. OCO-2

OCO-2 is a remote-sensing satellite that was launched by NASA in July 2014 and specifically designed to study CO2 [20]. It uses three high-resolution spectrometers to observe most of the Earth’s surface every 16 days, measuring reflected sunlight in the near-infrared CO2 bands at 1.61 and 2.06 µm and the molecular oxygen band at 0.76 µm [20,21,29]. The instruments produce a narrow nadir swath of up to eight cross-track samples every 0.333 s (temporal resolution) [31], with each individual footprint projecting a 2.4-km along-track coverage with a 1.25-km cross-track coverage (spatial resolution) [13]. In this study, we used the OCO-2 Level 2 bias-corrected XCO2 dataset and other selected fields (such latitude, longitude, xco2_quality_flag and so on) from the full-physics retrieval aggregated as daily files using Retrospective Processing V11.1r (OCO2_L2_Lite_FP v11.1r) [30,46,47]. The studied data cover a period from March 2022 to February 2024 and were obtained from NASA’s Goddard Earth Science Data and Information Services Center (https://doi.org/10.5067/8E4VLCK16O6Q, last accessed on 15 June 2024) [46]. According to the quality flag, only good-quality data were used in this study.

2.1.3. CarbonTracker

CT is a CO2 reanalysis product developed by the National Oceanic and Atmospheric Administration (NOAA). It combines an observation network and models to assimilate CO2 sources and sinks. The CT Near-Real-Time version 2024-1 Global Mole Fraction (CT-NRT.v2024-1 [48]) was used in this study, covering the interval from March 2022 to August 2023. The CT-NRT.v2024-1 is an extension of the CT2022 product [49] and uses a specific configuration of CT 2022 (see [48] for more details). By using a more statistically optimal prior than CT 2022 [48], CT-NRT.v2024-1 provides relatively accurate global CO2 estimations at 34 pressure levels, with a spatial resolution of 3° × 2° (longitude × latitude) and a temporal resolution of 3 h. We compared it with satellite observations after processing the original data to XCO2 (see Section 2.2.1). The dataset was downloaded from the Global Monitoring Laboratory CT Archive (https://doi.org/10.15138/3RE5-3Y28, last accessed on 5 September 2024) [48].

2.1.4. TCCON

TCCON is a network of ground-based FTS. It measures multiple GHGs via capturing direct solar near-infrared radiation. TCCON sites are capable of accurately recording the column abundance of GHGs (such as CO2) in the atmosphere using solar spectrum analysis [8,10]. Due to its reliability, TCCON has been regarded as the baseline for satellite validation in previous studies [20,22,27,33,35]. In this study, the latest version of GGG2020 data [10] was used to validate retrievals and diagnose sources of errors. Within the two-year period from March 2022 to February 2024, we selected as many available TCCON data as possible, and 21 ground-based sites were finally utilized. The start and end dates of data series for each site differed owing to the different validity of data across these sites. Detailed information (including location and coverage time period) for these sites is provided in Figure 1 and Table 1. The TCCON dataset is available at the TCCON Data Archive (https://tccondata.org/, last accessed on 15 August 2024) [50].

2.2. Methods

2.2.1. Spatiotemporal Matching with CT

Satellites and CT provide different forms of CO2 information. To ensure comparability, linear interpolation was applied to obtain the weight function for each pressure layer, which was then used to calculate the weighted average and transform total atmospheric CO2 (original CT data) to XCO2. Following the spatial resolution of CT (3° longitude × 2° latitude), satellite data within each grid cell were collected. We used the monthly averages to analyze satellite observations on regional scales. CT reanalysis is a temporally consistent dataset, and averaging is straightforward. However, for satellite data, the number of valid retrievals can largely differ by day. Thus, we first computed the daily means of satellite data and then used them to calculate monthly means.

2.2.2. TransCom Region Mask

The regional boundaries in Section 3.1 were defined according to the Intercomparison of Atmospheric CO2 Inversion Models (TransCom 3) project [72]. It divides the globe into 11 land regions and 11 ocean regions. The land regions are characterized by vegetation with similar seasonal structure and carbon exchange, while the ocean regions are classified by circulation features [72]. The regional-scale evaluation based on TransCom regions can therefore benefit the carbon flux inference, which is an important application of satellite observations [39,42]. The TransCom region mask was archived from the Global Monitoring Laboratory CT Archive (https://gml.noaa.gov/ccgg/carbontracker/download.php, last accessed on 28 June 2025) [73]. To match the resolution of the CT data, the original 1° × 1° grid mask was resampled to a 3° × 2° grid network by aggregating every 3 grids longitudinally and every 2 grids latitudinally. For each 3° × 2° cell containing 6 TransCom region identifiers, the TransCom region with the highest number of identifiers was selected as the representative region.

2.2.3. Spatiotemporal Matching with TCCON

To match the satellite data with TCCON data, we used spatiotemporal matching criteria as the following steps. (1) Spatial matching: Satellite retrievals from Level 2 daily files over an area of 2° longitude × 2° latitude centered on each TCCON site were first collected to ensure the maximum amount of satellite data in our comparison. Considering the role of diurnal variation in CO2 concentrations on local scales and its dependence on surface properties and seasons [74,75], one should carefully address temporal representativeness when comparing satellite and ground-based measurements. (2) Temporal matching: For each retrieval, TCCON data within ±30 min were collected and averaged to minimize the noise in TCCON measurements and obtain a sufficiently reliable reference value. Due to the different spatiotemporal resolutions between two satellites (see Section 2.1.1 and Section 2.1.2), much more data pairs were matched for OCO-2 than for GOSAT, especially for the target-mode measurements over validation stations [31]. As a result, OCO-2 data were more affected by noise at this stage. We therefore conducted (3) final averaging: Multiple satellite retrievals were averaged if they corresponded to the same ±30-min-averaged TCCON reference value.
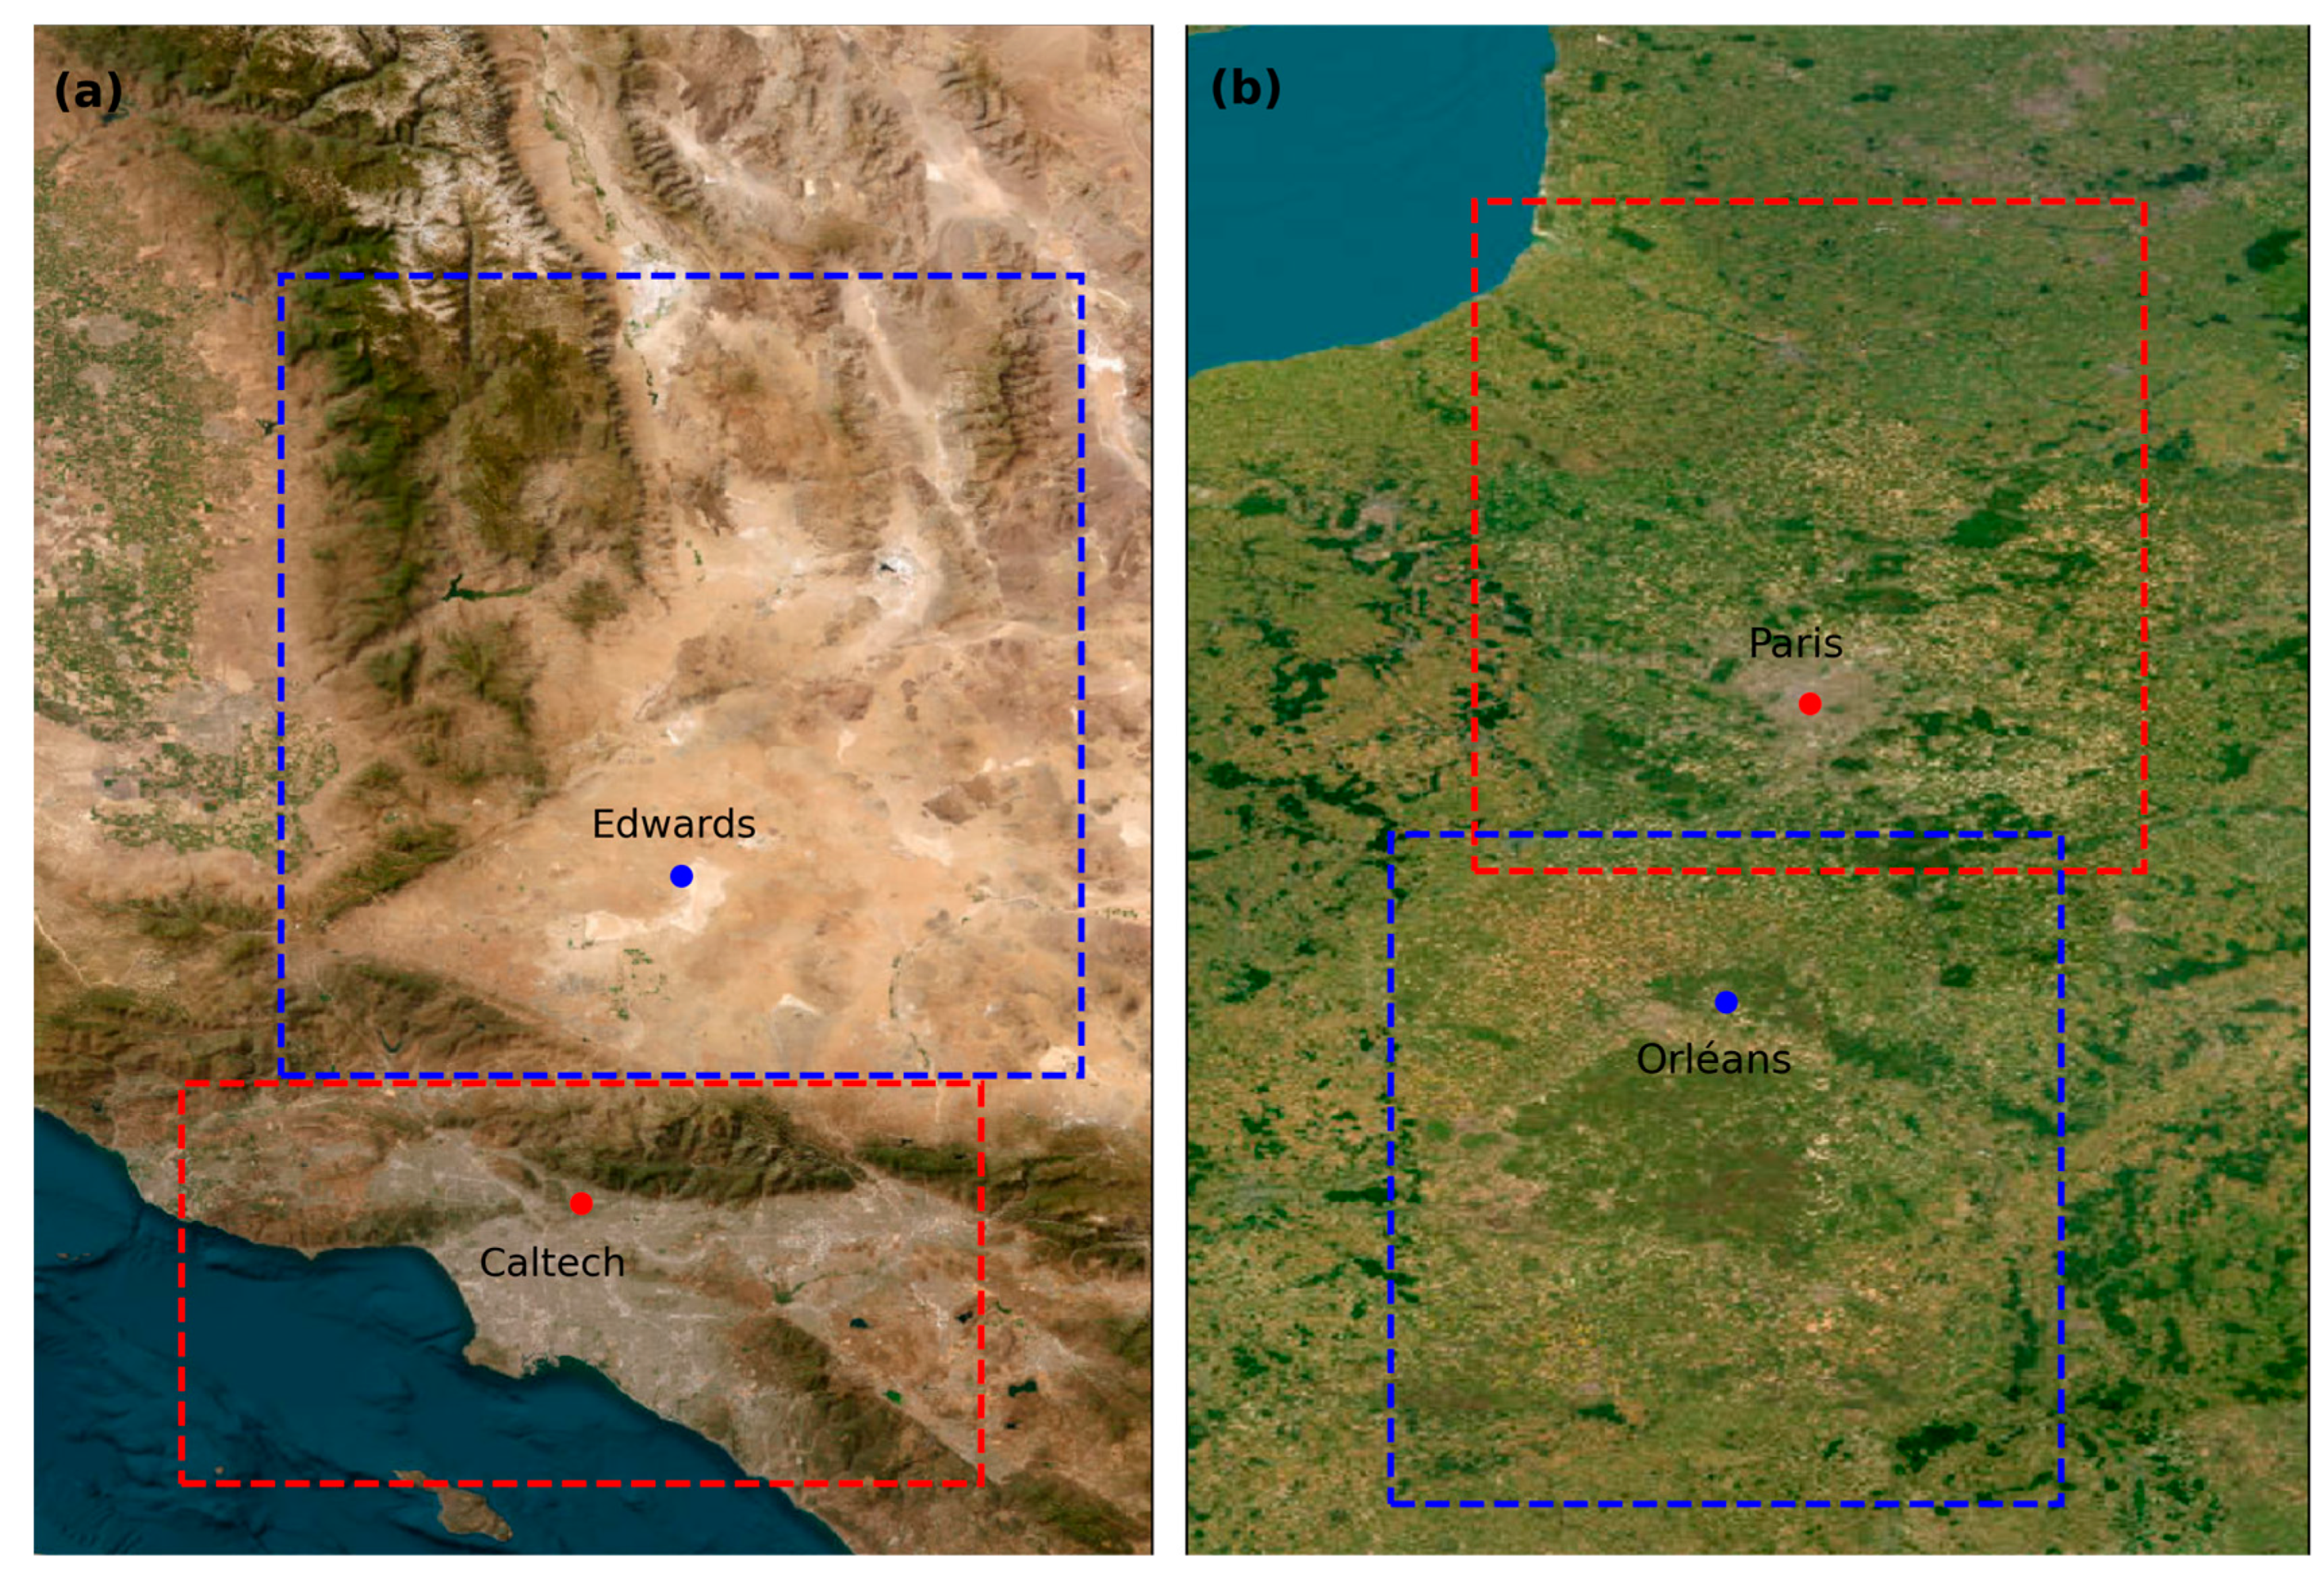
Notably, Caltech and Edwards, as well as Paris and Orléans, share close geographic locations (see Table 1). However, the Caltech site is located in the highly populated Los Angeles Basin, being adjacent to the San Gabriel Mountains, whereas Edwards is in a bright desert with sparse population and a relatively flat surface. Similarly, the Paris site is situated in a high-pollution area, while the Orléans site is surrounded by agricultural land. To ensure representativeness and avoid overlap of key features such as cities, slightly different collocation criteria were used for these four stations, shown as Figure 2 and Table 2.

2.2.4. Statistical Metrics

We statistically analyzed the data using bias, standard deviation (SD), root mean square error (RMSE), correlation coefficient (R), and determination coefficient (R2). These metrics can be mathematically expressed as follows:
B i a s = 1 n i = 1 n S i T i ,
S D = 1 n i = 1 n ( S i S ¯ ) 2 ,
R M S E = 1 n i = 1 n S i T i 2 ,
R ( τ ) = 1 i = 1 n T i + τ T ¯ S i S ¯ i = 1 n T i + τ T ¯ 2 i = 1 n S i S ¯ 2 ,
R 2 = 1 i = 1 n T i S i 2 i = 1 n T i T ¯ 2 ,
where n is the total number of matching points, S i is the satellite data, T i represents the reference data (i.e., TCCON or CT data), and S ¯ and T ¯ are the mathematical expectations for S i and T i , respectively. When comparing two time series, Equation (4) can be used as a diagnostic of lagged correlation by incorporating a time lag τ , which can be zero, positive, or negative. Notably, the S ¯ and T ¯ will change accordingly when τ is not zero, i.e., they are only the average of overlapping elements. Here, a positive τ indicates that the satellite time series leads the reference (e.g., CT) time series by τ months, and vice versa. Based on this, one can objectively obtain the best lag that leads to the highest cross-correlation between two time series.

3. Results

3.1. Monthly Averaged Comparison Between Satellites and CT on the Regional Scale

In this section, the recent performance of monthly XCO2 detection across the Earth’s surface from the OCO-2 and GOSAT is evaluated against CT. Considering that both satellites apply the nadir mode over land and the glint mode over the oceans [20,31], the comparison is divided into two subsections—land (Section 3.1.1) and ocean (Section 3.1.2). For regional and monthly analysis, we investigated the agreement of time series to identify advantages and disadvantages of satellite observations relative to the CT model. Moreover, we focused on the bias to better diagnose potential uncorrected systematic errors in satellite Level 2 products, while also avoiding the drawback of CT reanalysis which tends to smooth the features on smaller spatial scales. The standard deviation of differences served as a supplementary metric of the spatial consistency of differences on the regional scale. In Section 3.1.3, the causes of differences over land regions are analyzed.

3.1.1. Statistical Analysis over Land Regions

On land, surface properties are relatively variable, which can influence the satellite detection of XCO2. Therefore, we performed a simple quality control to mitigate spatial representation errors: For each region, months with a spatial coverage of satellite monthly means less than 20% were filtered out.
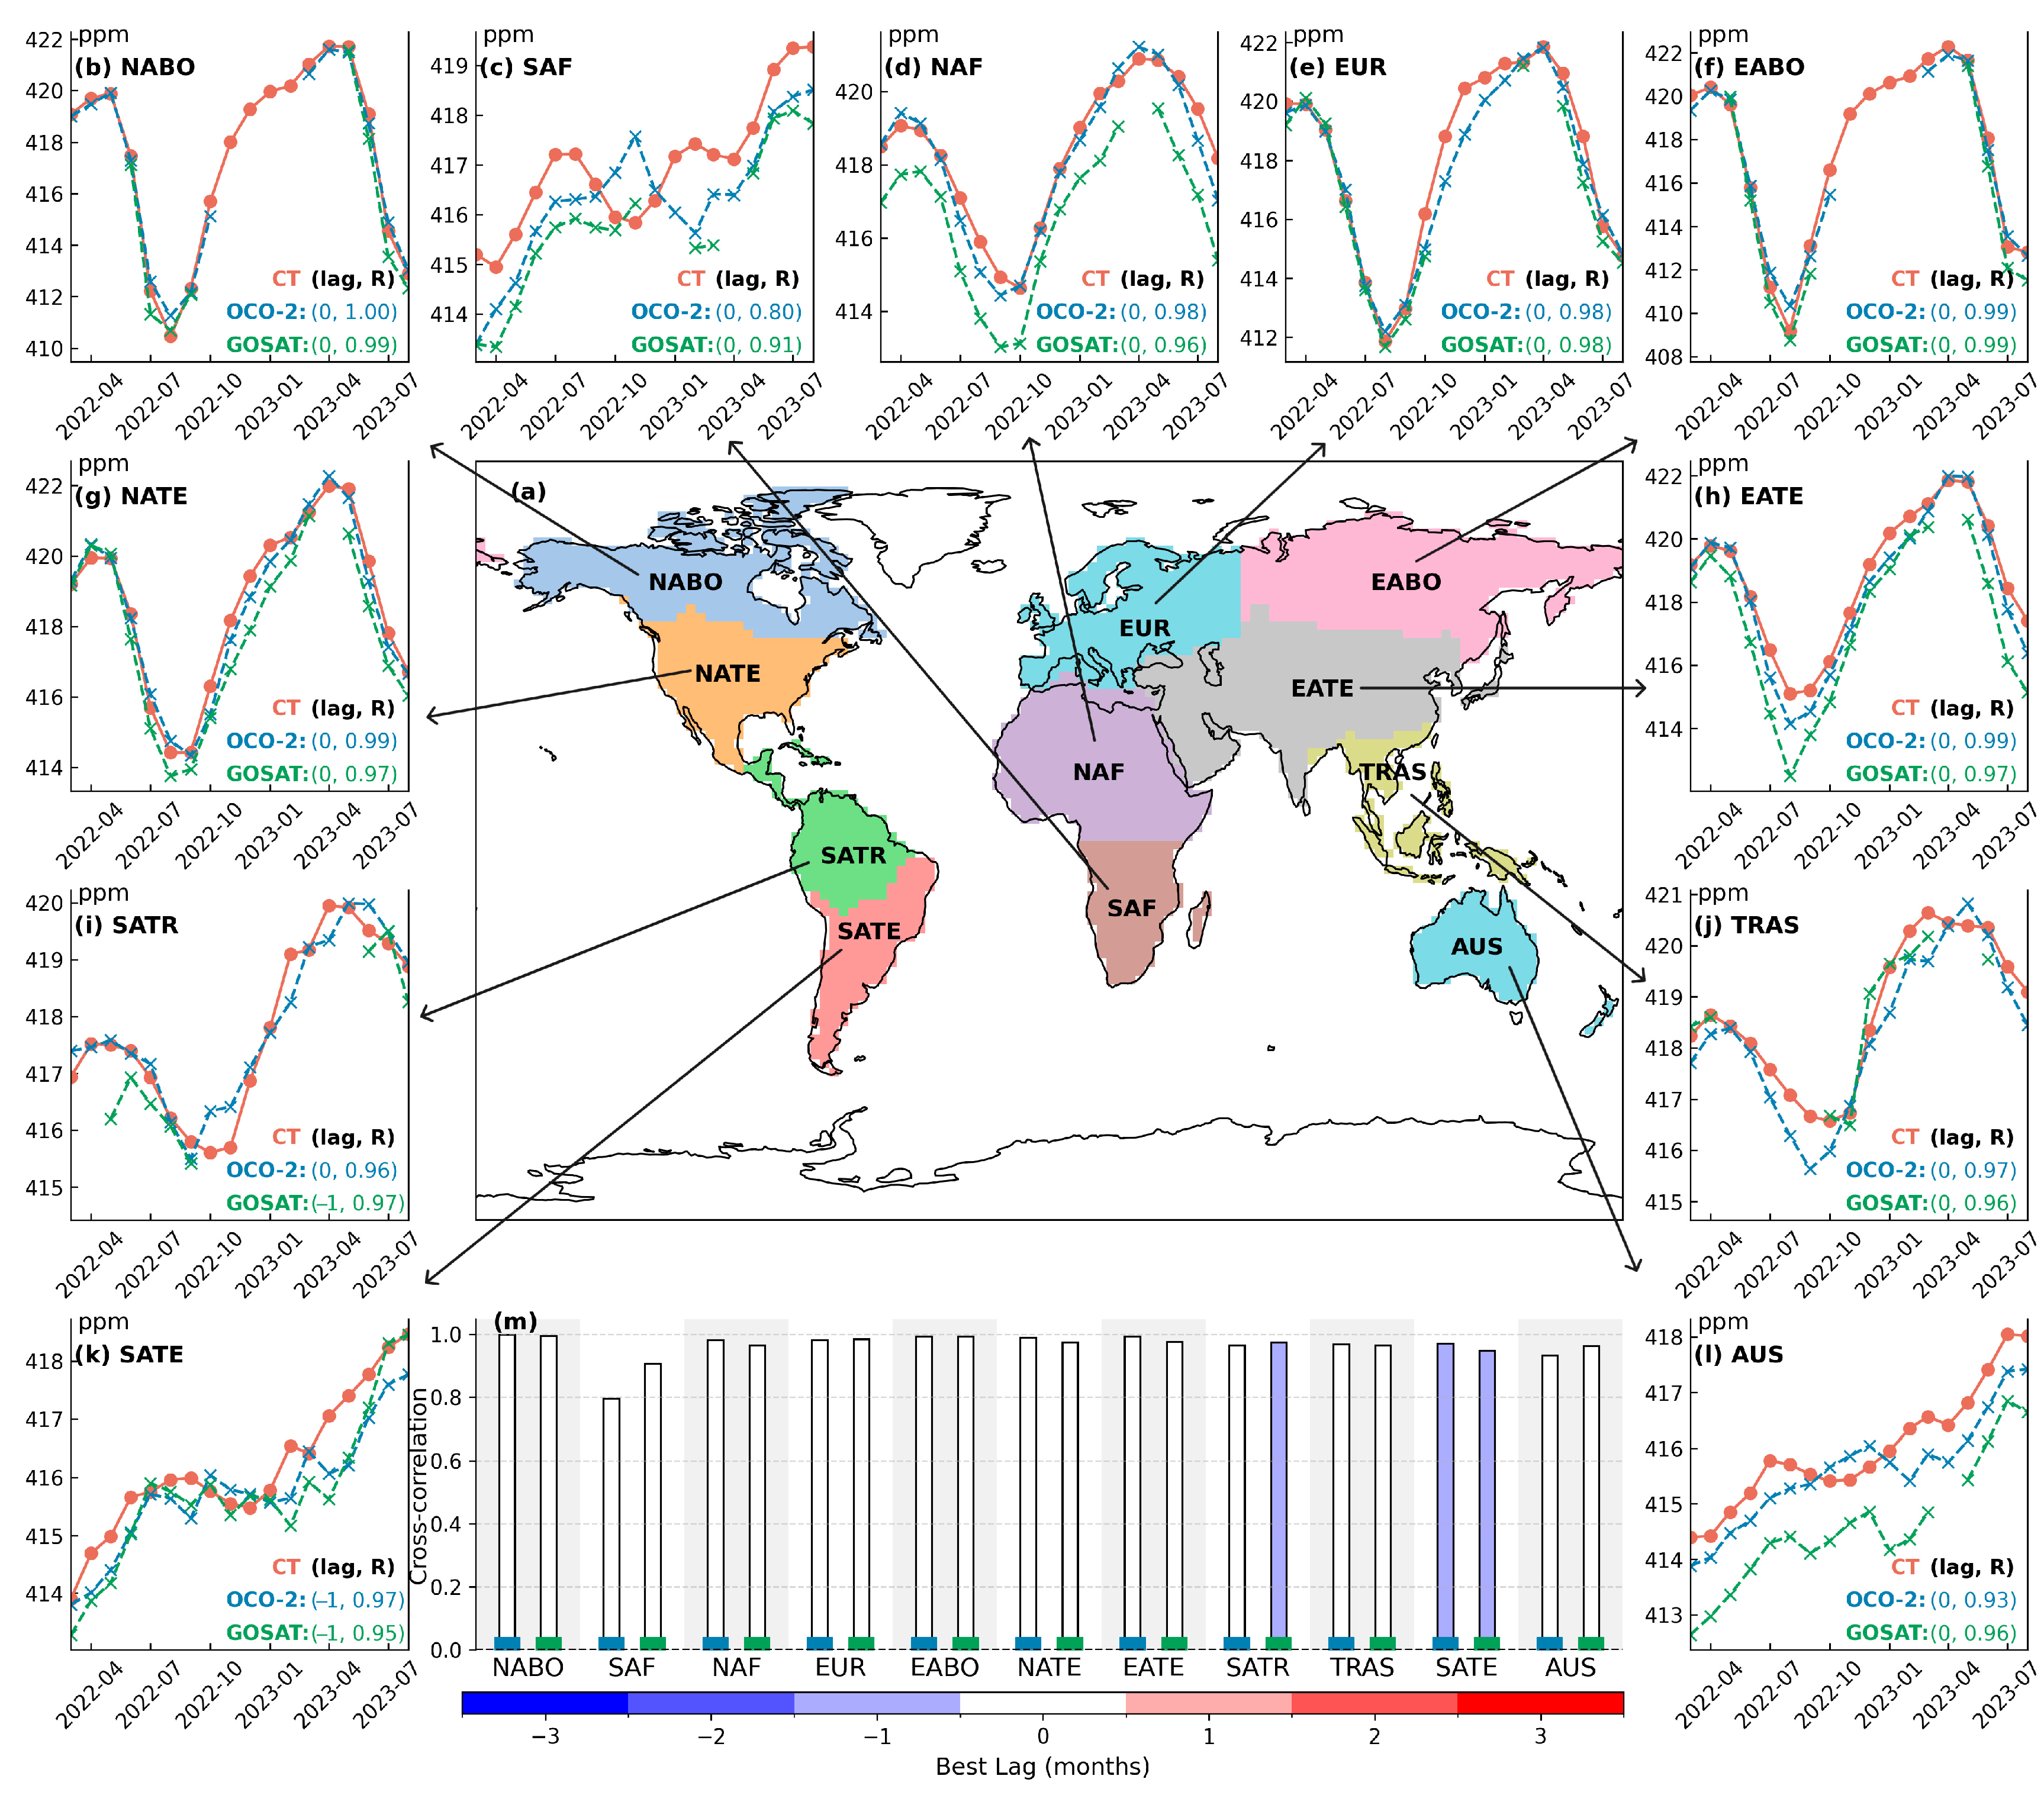
Figure 3 compares the regional monthly mean XCO2 time series between the two satellites and CT over land.
Except for the Eurasia Temperate (EATE) region, the regional monthly mean time series of satellite observations and CT reanalysis showed the highest consistency over non-tropical regions in the Northern Hemisphere (NH), shown as Figure 3b,e–g. In these regions, the highest correlations between satellite and CT time series occurred without monthly time lag, with correlation coefficients all exceeding 0.97. For the EATE region (Figure 3h), satellite and CT data showed good phase agreement; however, both satellites’ data present larger variation amplitude. OCO-2 underestimated the seasonal minimum between summer and autumn but aligned well with CT in spring. In contrast, GOSAT consistently underestimated XCO2 throughout the entire study period.
In the two tropical regions (Figure 3i,j), although the correlation coefficients stayed at high value (0.96–0.97), the discrepancies between satellite and CT time series were more obvious. For the South American Tropical (SATR) region (Figure 3i), OCO-2 and CT captured similar variation amplitude; however, the minimum XCO2 in the OCO-2 time series appeared one month earlier than that in CT, while the maximum occurred one month later. From February to April 2023, a noticeable one-month delay in the increasing trend could be observed in OCO-2 XCO2 compared to those for CT. GOSAT, however, performed worse with severe data gaps in this region, and did not provide useful information to help determine which dataset captures the more realistic variability. For the Tropical Asia (TRAS) region (Figure 3j), OCO-2 underestimated the minimum and showed a two-month delay in the occurrence of the maximum compared to CT, whereas GOSAT showed better agreement with the phase and amplitude. However, there were still large data gaps in the GOSAT time series.
In the Northern Africa (NAF) region (Figure 3d), the data from both satellites showed highly similar variation amplitudes and high correlation coefficients (0.98 for OCO-2 and 0.96 for GOSAT) compared with CT without monthly time lag. The OCO-2 retrieval closely reproduced the time series of CT, whereas the GOSAT retrieval had a consistent negative bias throughout the study period.
In the three Southern Hemisphere (SH) land regions (Figure 3c,k,l), the largest disagreements between two satellites and CT data are found. For the South American Temperate (SATE) region (Figure 3k), both satellite time series lagged one month behind CT reanalysis and maintained high correlation coefficients for this lag (0.97 for OCO-2 and 0.95 for GOSAT). However, the variation (indicating both concentration and variability) in CO2 captured by the two satellites was highly consistent, indicating the high reliability of satellite observations. Thus, this temporal shift may suggest that the CT reanalysis in this region has a phase offset on regional and monthly scales, potentially failing to capture the actual timing of CO2 variability as observed by the satellites. As for the Southern African (SAF) and Australia (AUS) regions (Figure 3c,l), the region monthly mean time series between satellites and CT showed the lowest correlation coefficients, especially for the SAF region (Figure 3c). Specifically, the variability in the data from the two satellites aligned well with each other in the three regions, but the CT simulates an opposite variability in spring and summer for the SAF and AUS regions, potentially indicating the advantage of satellites in accurately reproducing land carbon exchange in SH land regions relative to CT reanalysis. From the biosphere perspective, active photosynthesis in summer should correspond to CO2 absorption and stronger carbon sinks, also suggesting that the variability obtained by satellite retrieval is more realistic.
Figure 4 shows the monthly mean differences against CT averaged over grids with valid satellite data within each region (hereafter referred to as regional monthly bias), as well as the corresponding standard deviation (hereafter referred to as regional standard deviation of the monthly bias). By averaging the regional monthly biases and the regional standard deviations of the monthly bias over 18 months from March 2022 to August 2023, Figure 4m summarizes the general XCO2 differences over the 11 TransCom land regions. Notably, the regional monthly bias in Figure 4 does not exactly correspond to the difference between the regional monthly means of different datasets shown in Figure 3 because the differences in Figure 4 were computed only using grid cells where both satellite and CT data were available.
It can be clearly found that the two satellites tended to underestimate CO2 concentrations on land compared with CT (Figure 4m), indicating the potential of uncorrected negative biases over land in the products. For OCO-2, it showed relatively low biases in the North American Boreal and Temperate (NABO and NATE; Figure 4b,g), SATR (Figure 4i), NAF (Figure 4d), and Eurasia Boreal (EABO; Figure 4f) regions, with values of −0.11, −0.11, −0.04, −0.17, and −0.16 ppm, respectively. The absolute biases in other regions were also not larger than 0.50 ppm, suggesting reliable XCO2 detection of OCO-2 on the regional scale. Regarding GOSAT, we noticed relatively large biases over the SAF (Figure 4c), NAF (Figure 4d), EATE (Figure 4h), and AUS (Figure 4l) regions, with magnitudes of −1.07, −1.57, −1.12, and −1.39 ppm, respectively, while in other regions, the absolute biases did not exceed 0.73 ppm. The biases against CT of both satellites showed a noticeable seasonal correlation. In non-tropical land regions (i.e., excluding SATR, TRAS, SAF, NAF regions), both satellites tended to show the smallest biases during their spring seasons in both hemispheres, especially for GOSAT.
We also observed that both satellites exhibited low precision in high-latitude regions, such as the EABO (Figure 4f), NABO (Figure 4b), and EUR (Figure 4e) regions. Three potential reasons can account for this: (1) The atmospheric circulation (Ferrel cell and Polar cell) leads to fewer cloud-free measurements in these regions; (2) spatially sparse observations in these regions, which are reflected by long gaps in time series because of the quality control process, cause higher uncertainty; and (3) large zenith angles make the optical path longer, therefore causing more disturbance in the spectral signal. However, over the AUS and NAF regions, both satellites showed high precision. These two regions are characterized by high albedo surfaces [19] (e.g., desert), which can enhance the signal-to-noise ratio and therefore benefit the precision on monthly and regional scales.
Notably, for the SATE region (Figure 4k), the time series of regional monthly biases for the two satellites were nearly the same across the study period. Also, their average regional standard deviations of the monthly bias were the smallest compared to other temperate regions (Figure 4g,h), suggesting stable detection. This may result from the sparse observations in the SATE region in CT assimilation. In this case, the biases may not necessarily indicate true regional monthly biases in the satellite products; instead, they may reflect that the CT model fails to capture sufficiently accurate regional monthly CO2 concentrations over that region, whereas the satellite observations were able to provide more information that the CT model does not represent.

3.1.2. Statistical Analyses over Ocean Regions

We selected 9 low- and mid-latitude ocean regions out of the 11 TransCom ocean regions, excluding the Northern Ocean and Southern Ocean regions. This is because of their large solar zenith angle, resulting in very limited usable retrievals. Notably, due to the fact that ocean observation might be somewhat untrustworthy [38,39,42,76], we simply regarded the CT data as the reference proxy. When calculating statistical metrics, we only excluded GOSAT data in April 2023 due to its extremely severe data gaps (see Figure S2h). Different from land, which has more complex carbon sources and sinks as well as variable surface properties, ocean surface properties are fairly uniform. Consequently, although satellite observations over some ocean regions in several other months may also be sparse, we still considered these data to be reliable enough to represent the statistics on regional scale.
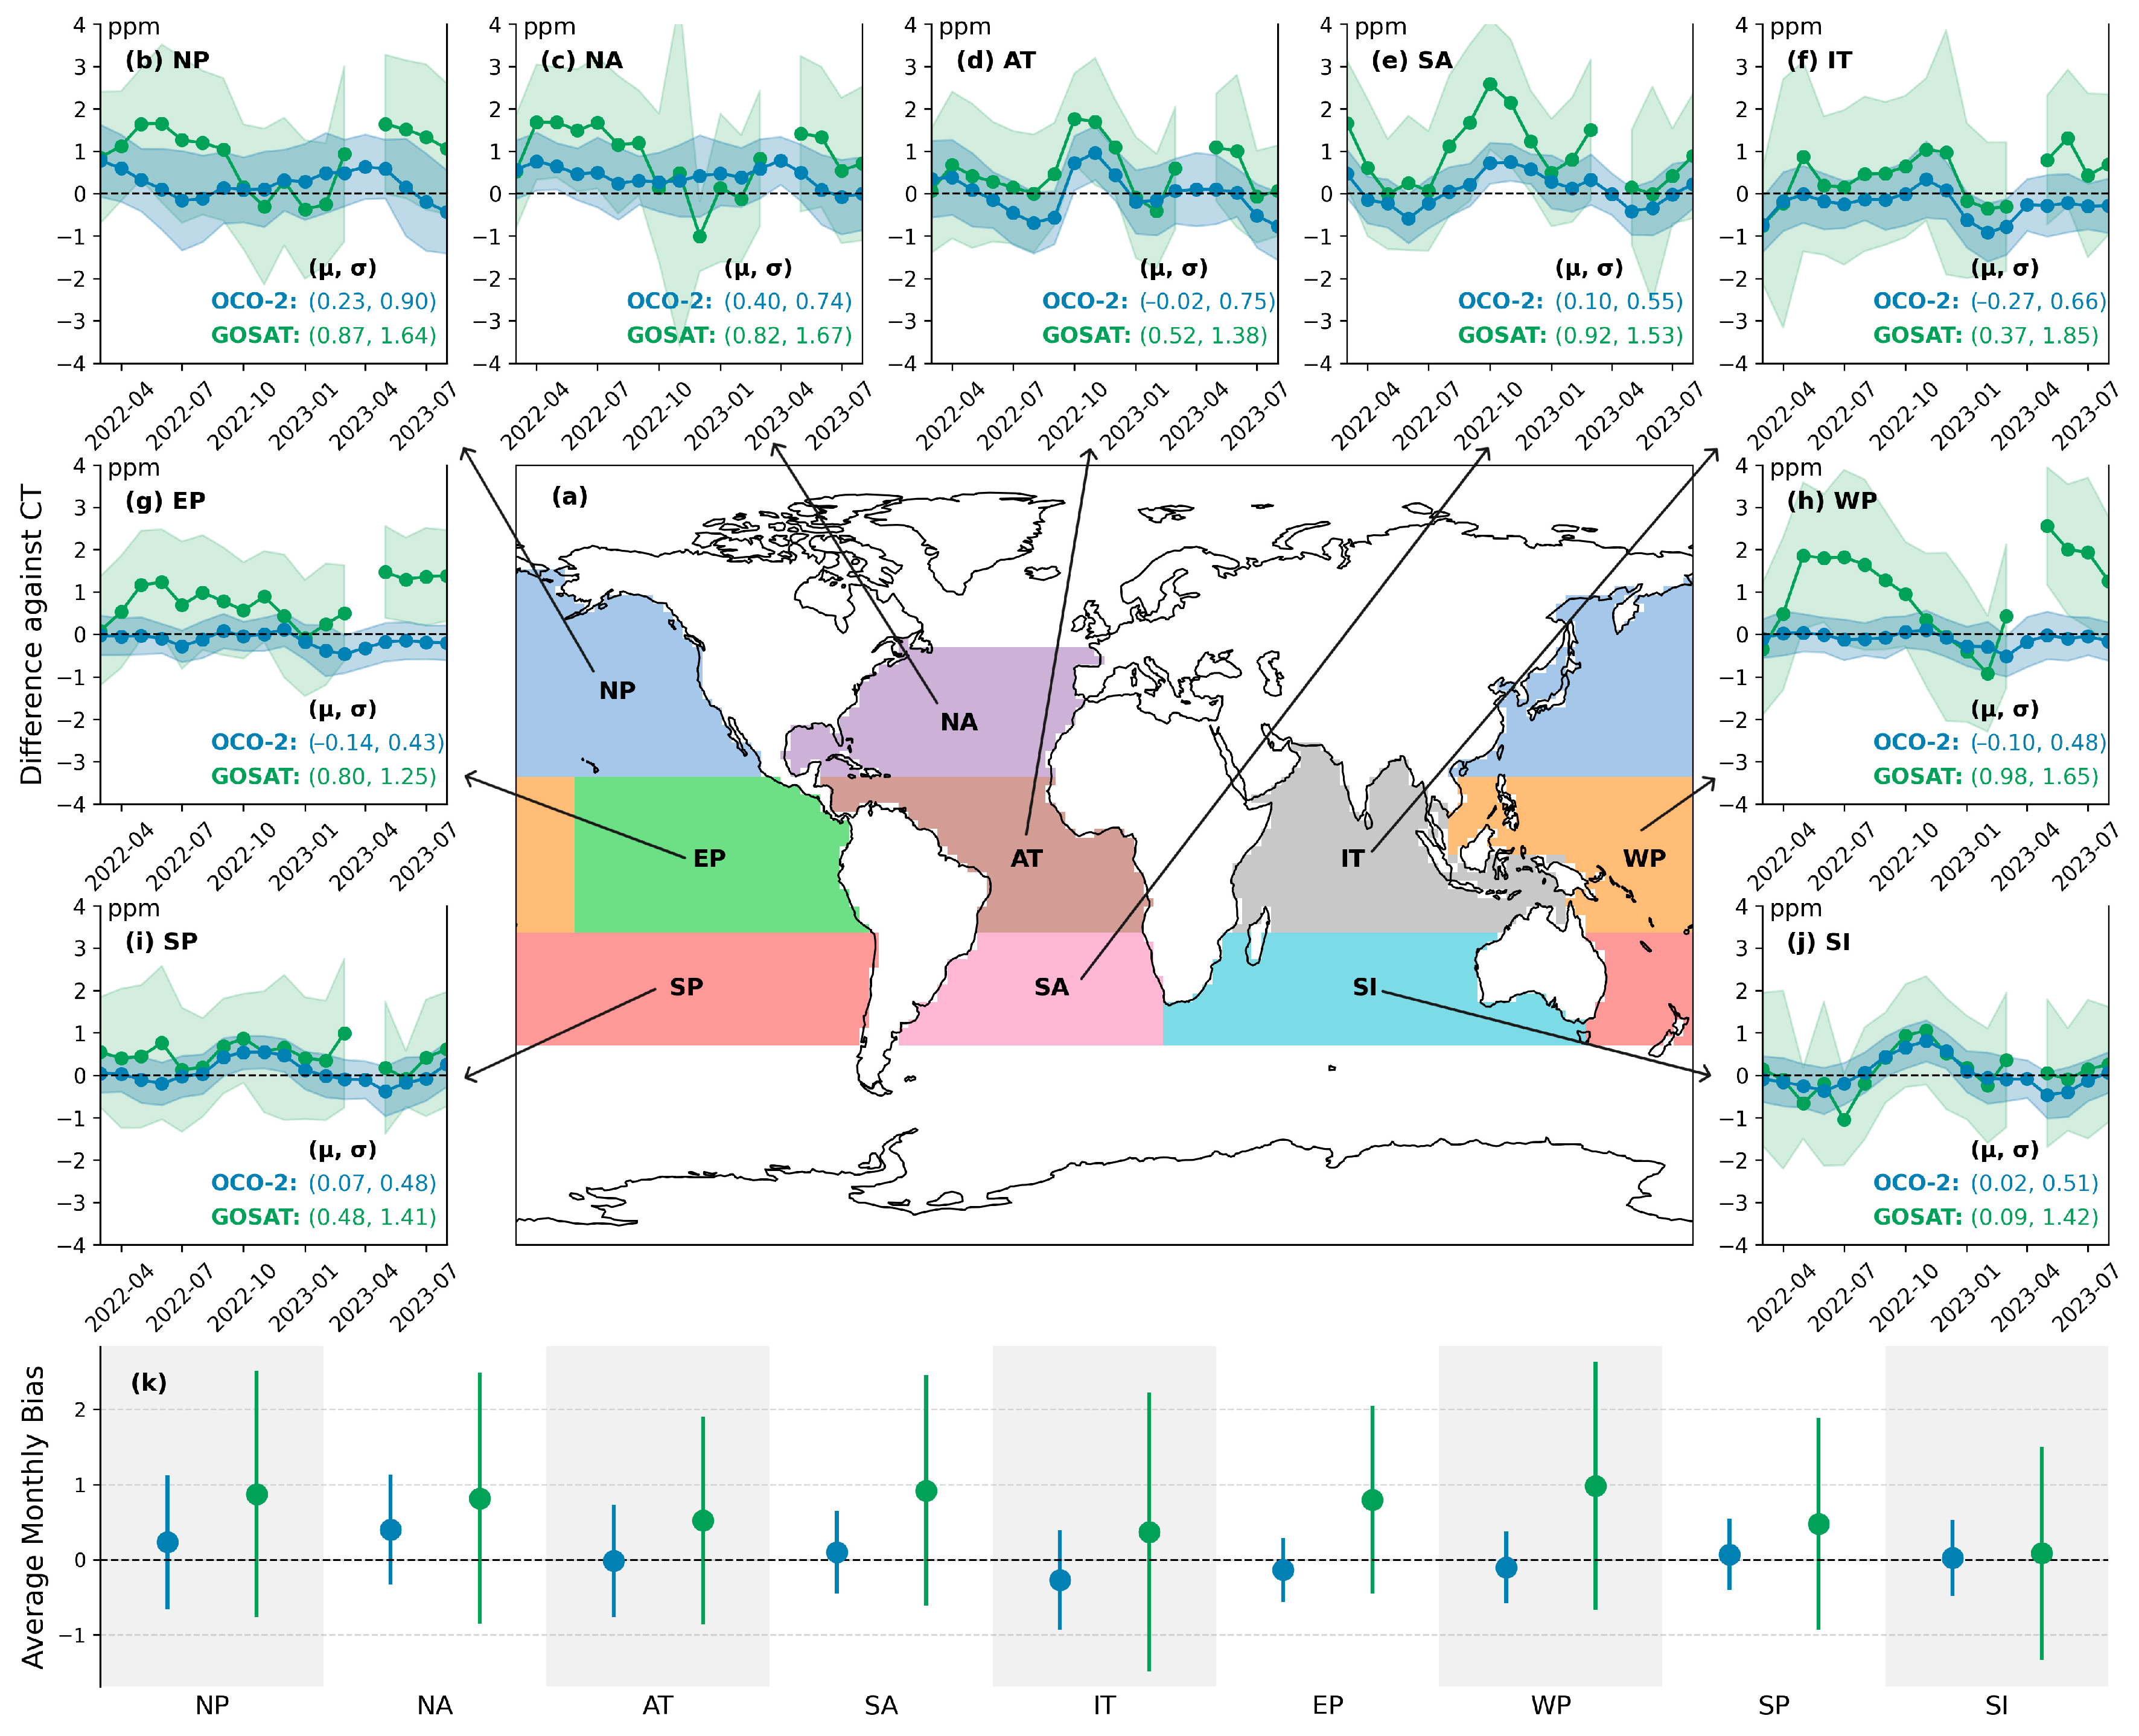
Figure 5 reveals the agreement of the temporal variation in regional monthly mean XCO2 between the two satellites and CT over the ocean surface.
OCO-2 time series show high consistency with those of CT in the North Pacific (NP; Figure 5b), North Atlantic (NA; Figure 5c), and East and West Pacific Tropical (EP and WP; Figure 5g,h) regions. In these regions, the OCO-2 time series showed no temporal lag relative to CT, with high correlation coefficients of 1.00 for the first three regions and 0.99 for the WP region. For non-tropical regions (Figure 5b,c), OCO-2 regional monthly means were nearly the same as those for CT, with only slight overestimations during spring. For tropical regions (Figure 5g,h), OCO-2 only slightly underestimated values between January and May 2023. GOSAT, however, did not reliably capture the regional monthly means in all four regions, as it tended to severely overestimate regional monthly means from March to November. This positive bias even shifted the phase of the GOSAT time series one month behind that of CT in the EP and WP regions (Figure 5g,h).
In the three SH ocean regions (Figure 5e,i,j), the primary mismatch between the OCO-2 and CT time series lay in the consistent overestimation of XCO2 by OCO-2 from August to December. Because of this, statistics suggest that OCO-2 showed a one-month phase lag relative to CT in the South Atlantic (SA) and South Indian (SI) regions. However, it should be clarified that the regional monthly time series of the two datasets were in strong agreement in the remaining months, without obvious phase offset. GOSAT failed to retrieve reliable temporal variability over the three SH ocean regions.
In the Atlantic Tropical (AT) region (Figure 5d), the correlation coefficient between GOSAT and CT time series was the lowest (0.84) among all ocean regions. Although having a relatively high maximum cross-correlation coefficient of 0.97, the OCO-2 time series showed a one-month lead in phase compared to CT.
In the Indian Tropical (IT) region (Figure 5f), no apparent phase shift was observed for either satellite relative to CT, and the correlation coefficients were 0.98 for OCO-2 and 0.94 for GOSAT. Nevertheless, the time series of both satellites somewhat differed from those of CT. In particular, GOSAT exhibits unphysical temporal variabilities. This phenomenon is mainly due to the small number of valid grid cells used in regional averaging, which makes the noise evident in time series. As for OCO-2, it underestimated the seasonal maximum, resulting in a reduced amplitude of variation.
Figure 6 provides information about the time series of the regional monthly bias and the regional standard deviation of the monthly bias in 9 selected TransCom ocean regions during the study period. For the same reason discussed in Section 3.1.1, the regional monthly bias in Figure 6 does not exactly correspond to the difference between the regional monthly means of different datasets shown in Figure 5.
OCO-2 observations showed low biases over the ocean. The averaged regional monthly biases in the AT (Figure 6d), South Pacific (SP; Figure 6i), and SI (Figure 6j) regions were −0.02, 0.07, and 0.02 ppm, respectively, with all other ocean regions also no larger than 0.4 ppm. However, relatively large uncertainties (greater than 0.7 ppm) were observed in the NP (Figure 6b), NA (Figure 6c), and AT (Figure 6d) regions.
As for GOSAT, it consistently showed positive regional monthly biases across all ocean regions, indicating the existence of uncorrected positive systematic errors in GOSAT ocean observations during the study period. Except for the two regions in the Indian Ocean (0.09 ppm for the SI region, shown in Figure 6j; and 0.37 ppm for the IT region, shown in Figure 6f), the average regional monthly biases of other ocean regions were 0.48 ppm and higher. Moreover, the precision of GOSAT regional detection over the oceans was relatively poor, which was indicated by that the regional standard deviation of the monthly bias in all ocean regions exceeded 1.2 ppm.
In contrast to observations over land, satellites tended to obtain worse detection results over non-tropical ocean regions during their spring seasons in both hemispheres. On the one hand, the solar zenith angle in spring varies, and the light conditions are not as stable as in summer, especially for mid- to high latitudes. These unfavorable conditions can lead to a weakening or instability in the satellites’ CO2 absorption features. On the other hand, the physical state of the ocean in spring (e.g., sea surface temperature, wave conditions, salinity) is on the transition stage between seasons. Such transitions can influence surface albedo and scattering properties, thereby interfering with satellite retrievals.

3.1.3. Spatial Analyses of Differences Against CT over Land

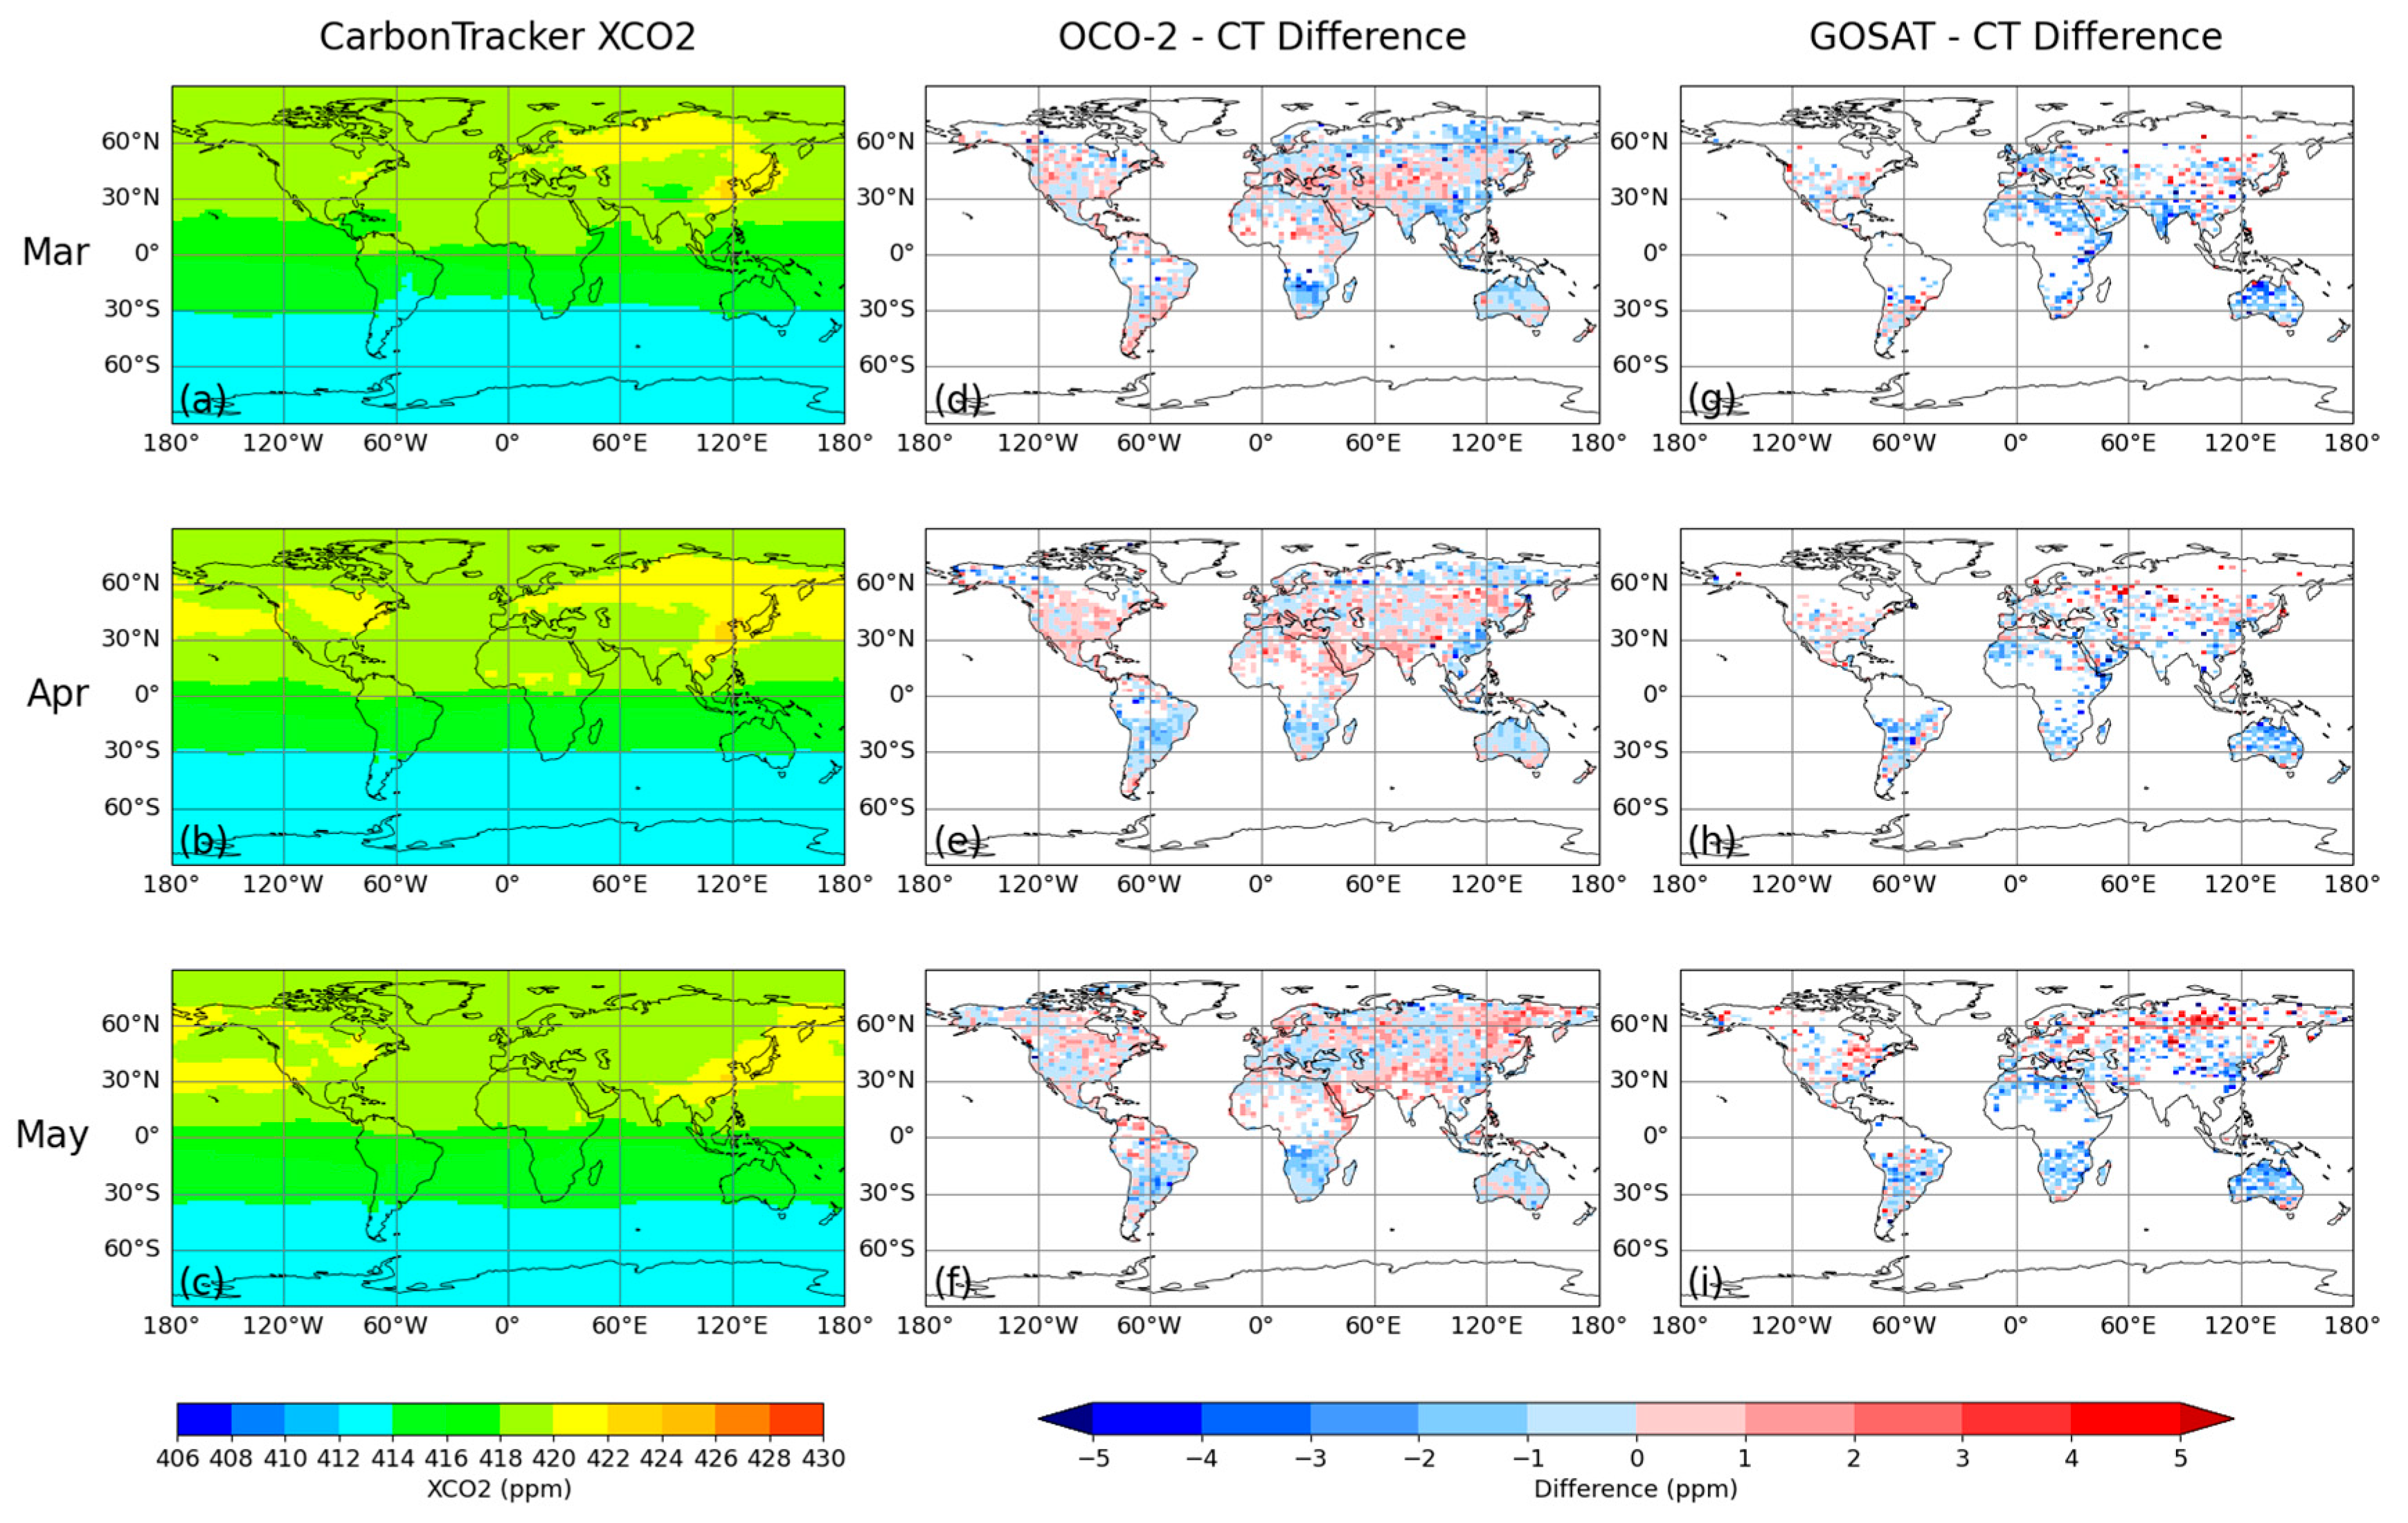
The geographic distributions of regional-scale biases over land help infer the sources of these biases. Figure 7, Figure 8, Figure 9 and Figure 10 provide more details about the spatial pattern of the monthly concentrations provided by CT and how the satellite data differed from these CT data.
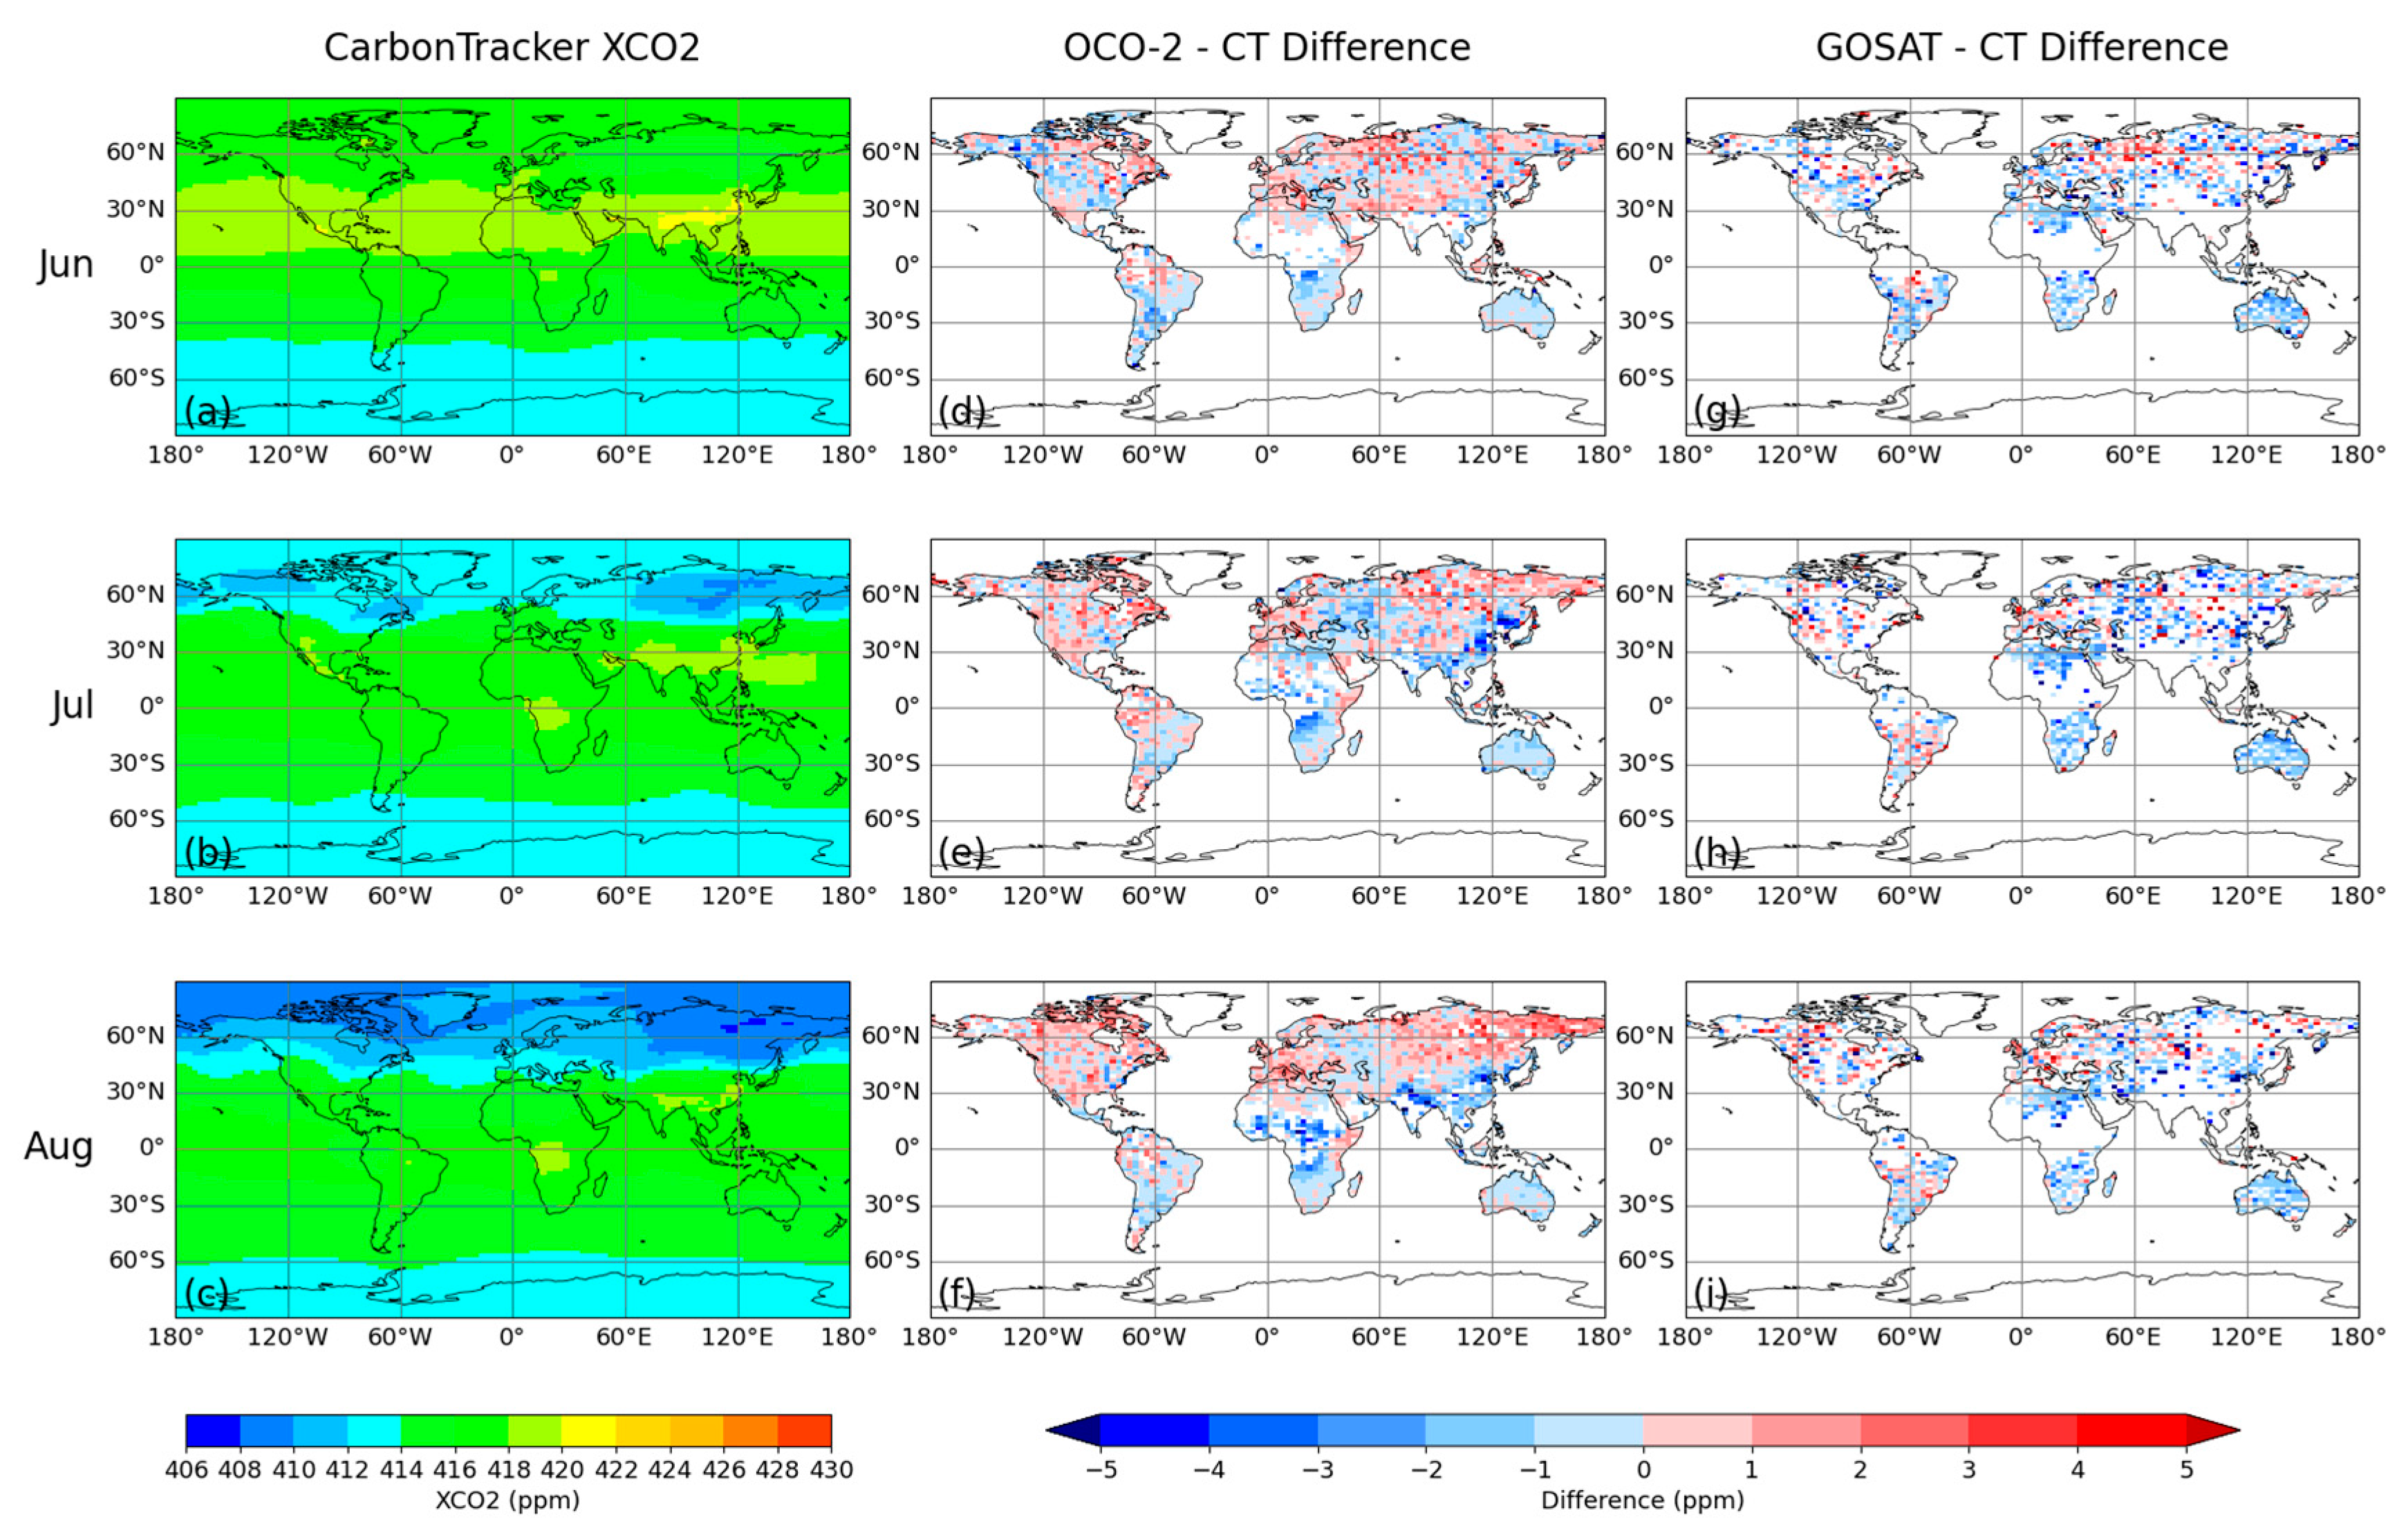
Figure 7a–c show the monthly averages of the CT data in March, April, and May (MAM) 2022. Throughout this period, XCO2 was higher in the NH than that in the SH, with the highest concentration in the North China Plain in April (Figure 7b). In the NH, XCO2 clearly but moderately varied within the season (see Figure S1a–c). From March to April (Figure 7a,b), XCO2 increased over eastern Siberia, the Pacific Ocean, and the Tibetan Plateau. However, by May (Figure 7c), the concentrations in most of the EABO and EUR regions decreased. This may be due to the relatively low temperatures, at which photosynthesis is relatively low and does not significantly influence hemispheric-scale XCO2 until May. In the SH, XCO2 slightly increased in MAM.
For OCO-2 (Figure 7d–f), spatially clustered differences were found in the SAF and EABO regions during MAM. The negative bias in the SAF region mainly originated from its central area (in March, Figure 7d), possibly due to the drawbacks in CT assimilation. In the EABO region, OCO-2 overestimated XCO2 concentrations in the mountainous areas of eastern Siberia in May (Figure 7f), which may result from variations in surface elevation. Complex topographic changes can introduce surface pressure errors in the prior profiles, therefore deteriorating the retrieval results.
Biases for GOSAT (Figure 7g–i) were mainly located in five TransCom regions. In the two Africa regions, differences were distributed relatively uniformly, whereas in the EABO, EATE, and AUS regions, differences were clustered in central Siberia, South Asia, and northern Australia, respectively. Different from the negative biases in the other four regions, large overestimation occurred in the EABO region. Notably, overestimations with smaller magnitudes were also observed over other areas at similar latitudes in May (Figure 7i), although this phenomenon was less apparent due to data gaps in GOSAT observations.
Figure 8a–c show the monthly mean XCO2 derived from the CT data for June to August (JJA) 2022. In JJA, favorable environmental conditions such as temperature, precipitation, and sunlight enable significant carbon uptake by the vegetation. A steady and rapid decline of XCO2 was observed in the NH, especially at high latitudes, forming a decreasing gradient from the high to low latitudes. However, in densely populated urban areas (e.g., India and East China), high and consistent anthropogenic CO2 emissions dampened the vegetation effect and reduced variation in these areas (Figure S1d–f). In the SH, XCO2 continued to slightly increase (Figure S1d–f). Because of the different trends between hemispheres, the lowest CO2 concentrations shifted from high latitudes of the SH to high latitudes of the NH within the season. Meanwhile, high XCO2 areas were consistently distributed in the Congo Basin and East and South China.
Compared to MAM (Figure 7d–f), OCO-2 observations showed more spatially clustered differences in JJA (Figure 8d–f). Retrieval challenges in high-latitude observation may have contributed to the positive biases over the EABO and NABO regions. Among these, differences with larger values (up to 4 ppm) were found in the mountain areas of eastern Siberia. It is therefore a combined effect from both high-latitude conditions and variation in complex topographic elevation. Negative bias clusters were more evident, with dense and large underestimations (larger than −4 ppm) observed in the south of the Sahara (NAF), the Congo Basin (SAF), South Asia (EATE), and East China (EATE). The biases in East China may be attributed to substantial emissions of aerosols from urban and industrial areas, as aerosols are one of the major contributors to XCO2 measurement errors [18,21,23,24,25]. The biases in South Asia were mainly caused by the thick cloud cover introduced by the monsoon. During the South Asian monsoon season (June to September) [77,78], the summer monsoon conveys large amounts of warm and moist air. This leads to cloud formation through thermal convection and orographic lifting in South Asia [79] and influences satellite inversion [78]. Although variable topography and anthropogenic aerosol emissions may have also contributed to the biases, they are unlikely to be the primary cause, as similarly large biases were not observed in the non-monsoon season when data coverage was higher. Similarly, negative biases in the NAF region can also be explained by the summer monsoon. As a diagnostic of the West African monsoon, the African Easterly Jet can extend eastward as far as Ethiopia [26,80], which well explains the spatial distribution of the negative biases (Figure 8f). However, to its east, positive biases occurred along the coast of the Horn of Africa. Figure S1d–f indicate that the Horn of Africa experienced a different atmospheric transport motion from the Sahel, as the Ethiopian Highlands and mountains limited the eastward extension of the low-level African Easterly Jet. Due to the onset of low-level Somali Jet, the oceanic sea salt aerosol was brought to the coast and changed the scattering properties. Therefore, different aerosol types in these two areas can lead to the opposing signs in the biases. Notably, unlike the biases in March (Figure 7d), the JJA biases over the SAF region were located further north, indicating that they may have partly been contributed by the Intertropical Convergence Zone (ITCZ) and rainforest areas in Congo.
GOSAT (Figure 8g–i) generally exhibited larger errors, but bias clusters were less distinguishable. This may reflect the effect of the bias correction process, particularly in boreal regions. In June (Figure 8g), spatially clustered positive differences were observed at the boundary between the EUR and EABO regions, while two clusters of negative biases were found in the Sahara (NAF) and East China (EATE).
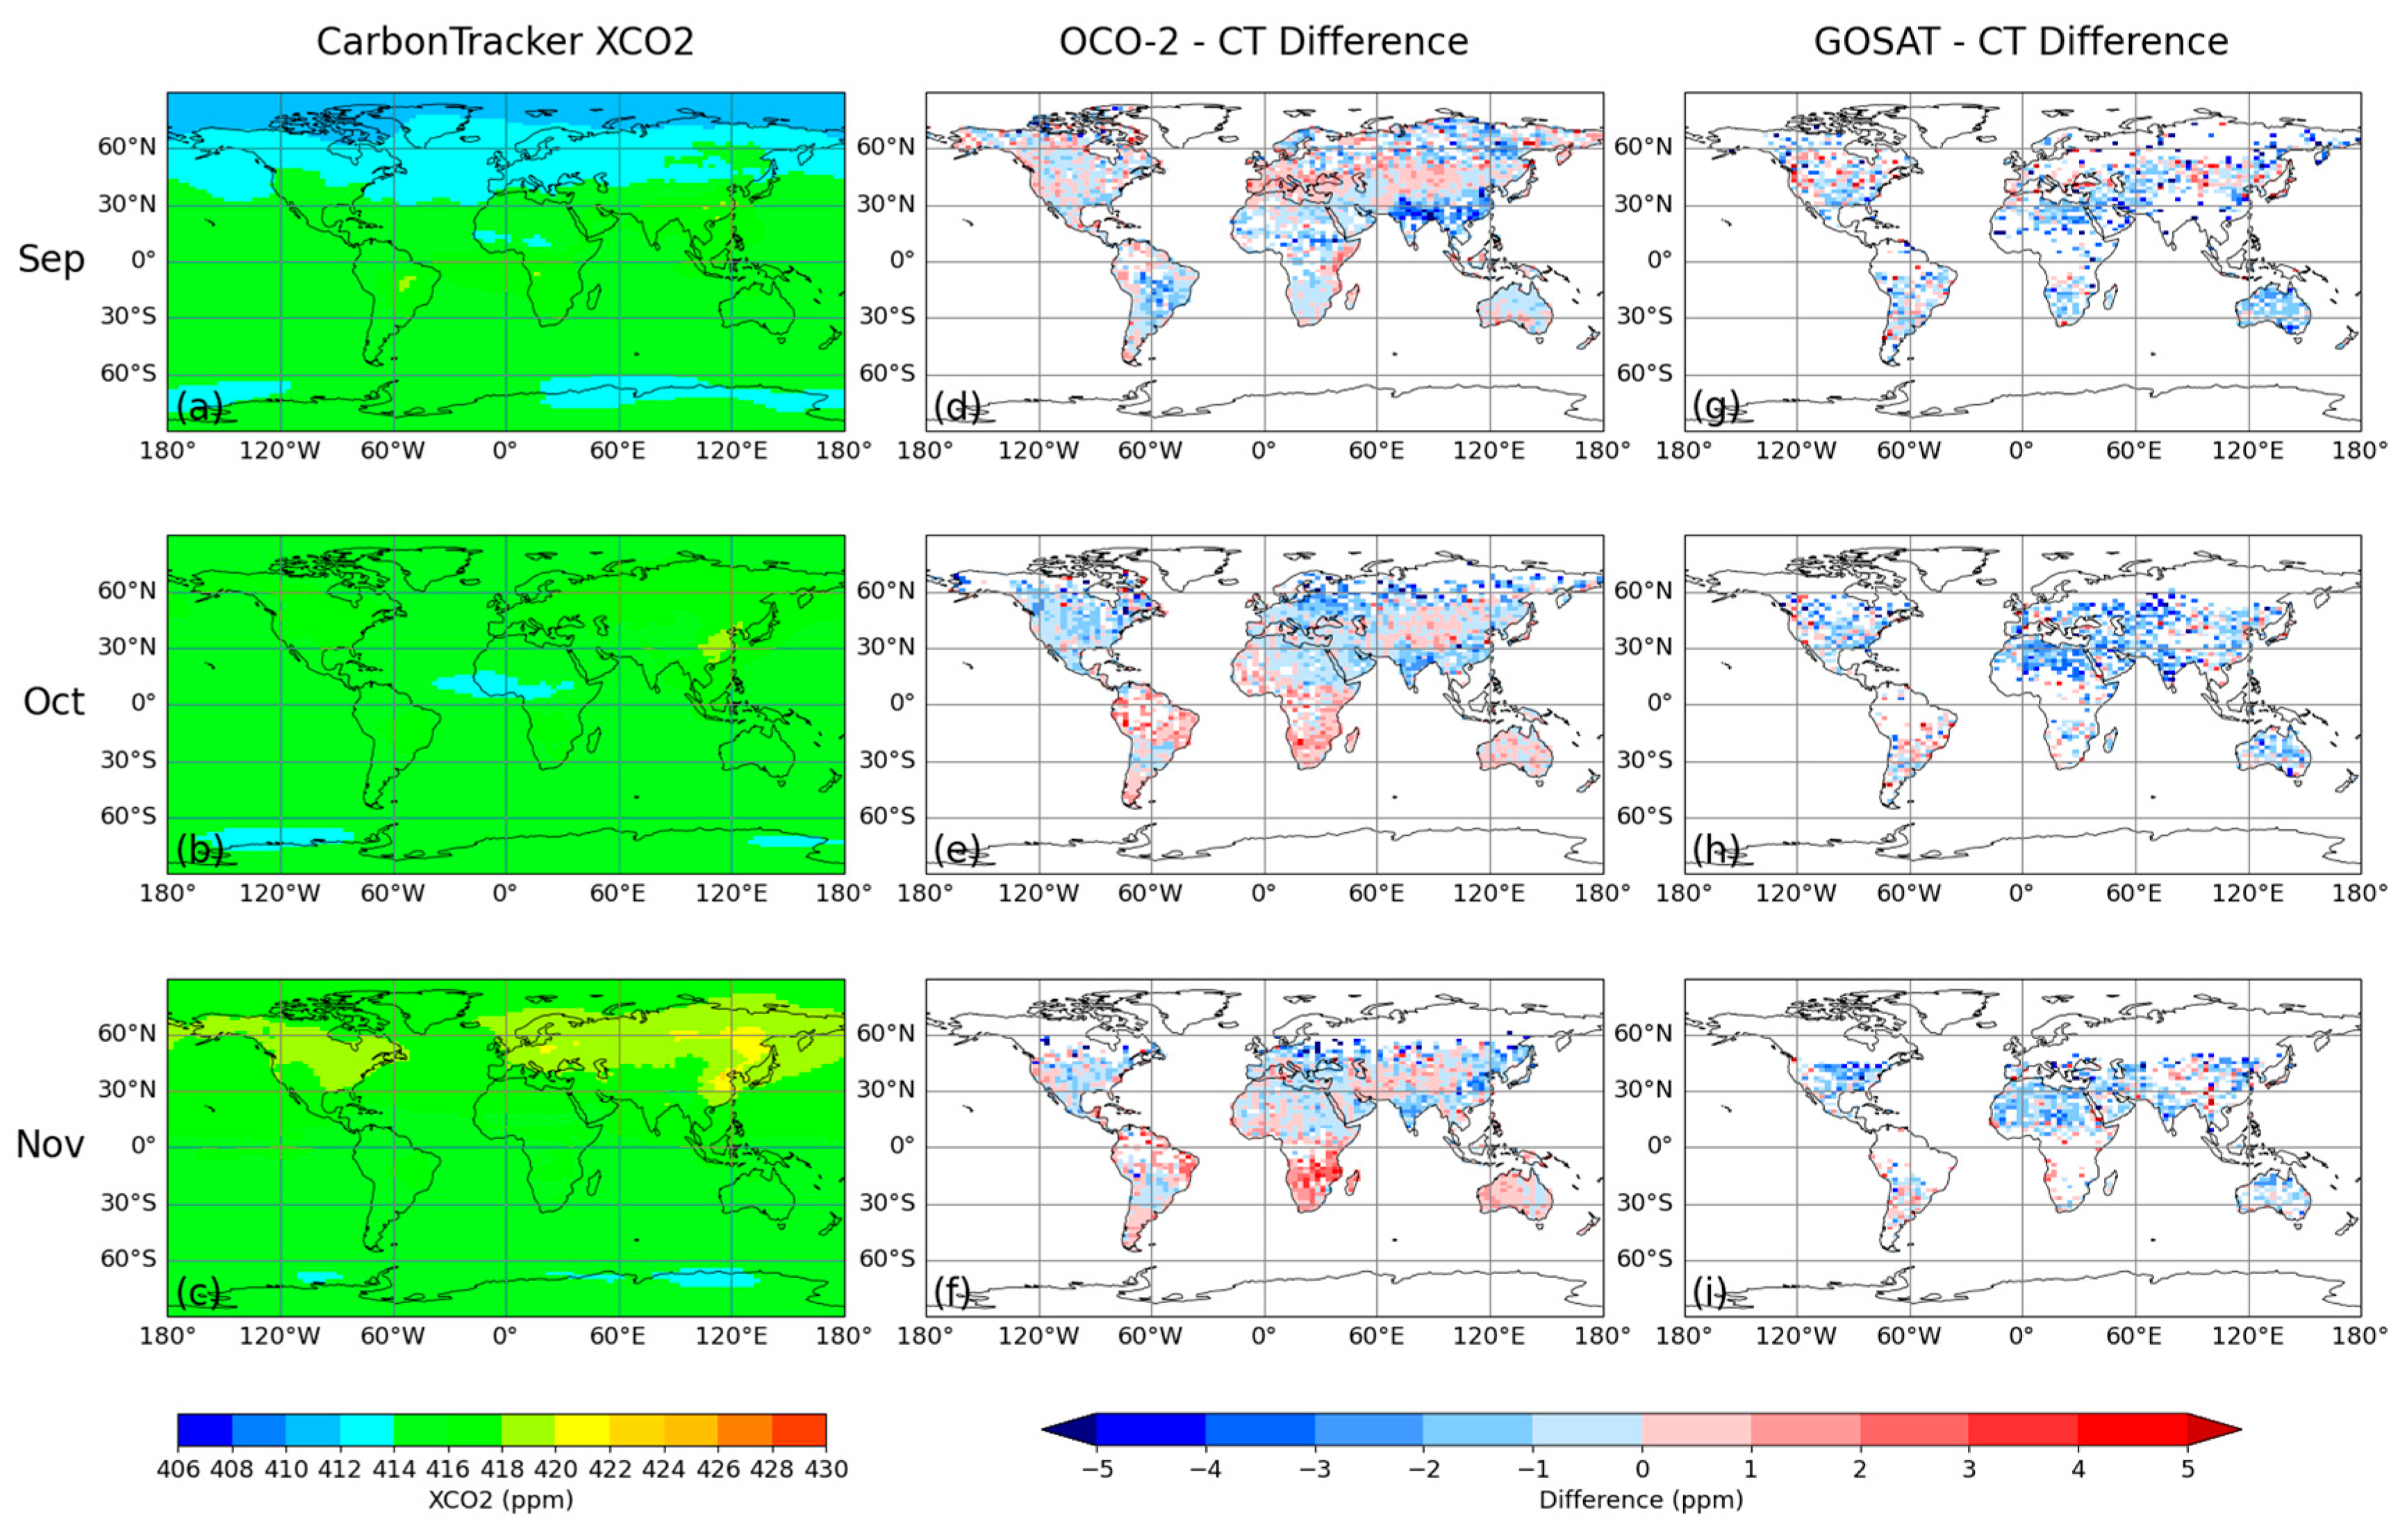
Figure 9a–c present the upward global tendency of XCO2 in September, October, and November (SON) in 2022. The NH witnessed a relatively rapid increase of XCO2 due to weakened photosynthesis in autumn, particularly in high latitudes, whereas concentrations remained nearly stable in the SH. The rising XCO2 in the NH surpassed that in the SH again in October (Figure 9b). However, the North China Plain remained the area with the highest XCO2.
As shown in Figure 9d–f, spatially clustered differences between OCO-2 and CT data occurred in EATE, SAF, and SATR during SON. The reason for the two clusters with a large negative bias, which were respectively located in South Asia and East China in September (Figure 9d), may be the monsoon (the same as that in JJA). Rainforests and the ITCZ in the SATR region could have contributed to local positive differences. As for the positive differences in the SAF region, they may have resulted from wildfires because the dry season in Southern Africa lasts from September to December [81]. However, these differences could also be due to the performance of CT rather than the quality of OCO-2 retrieval. As one of the prior inputs for the fire module of CT-NRT.v2024-1, GFED4.1s can underestimate CO2 emissions for African landscape fires [82,83]. Regarding GOSAT (Figure 9g–i), it strongly and consistently underestimated XCO2 over the NAF, Europe, and two Eurasia regions.
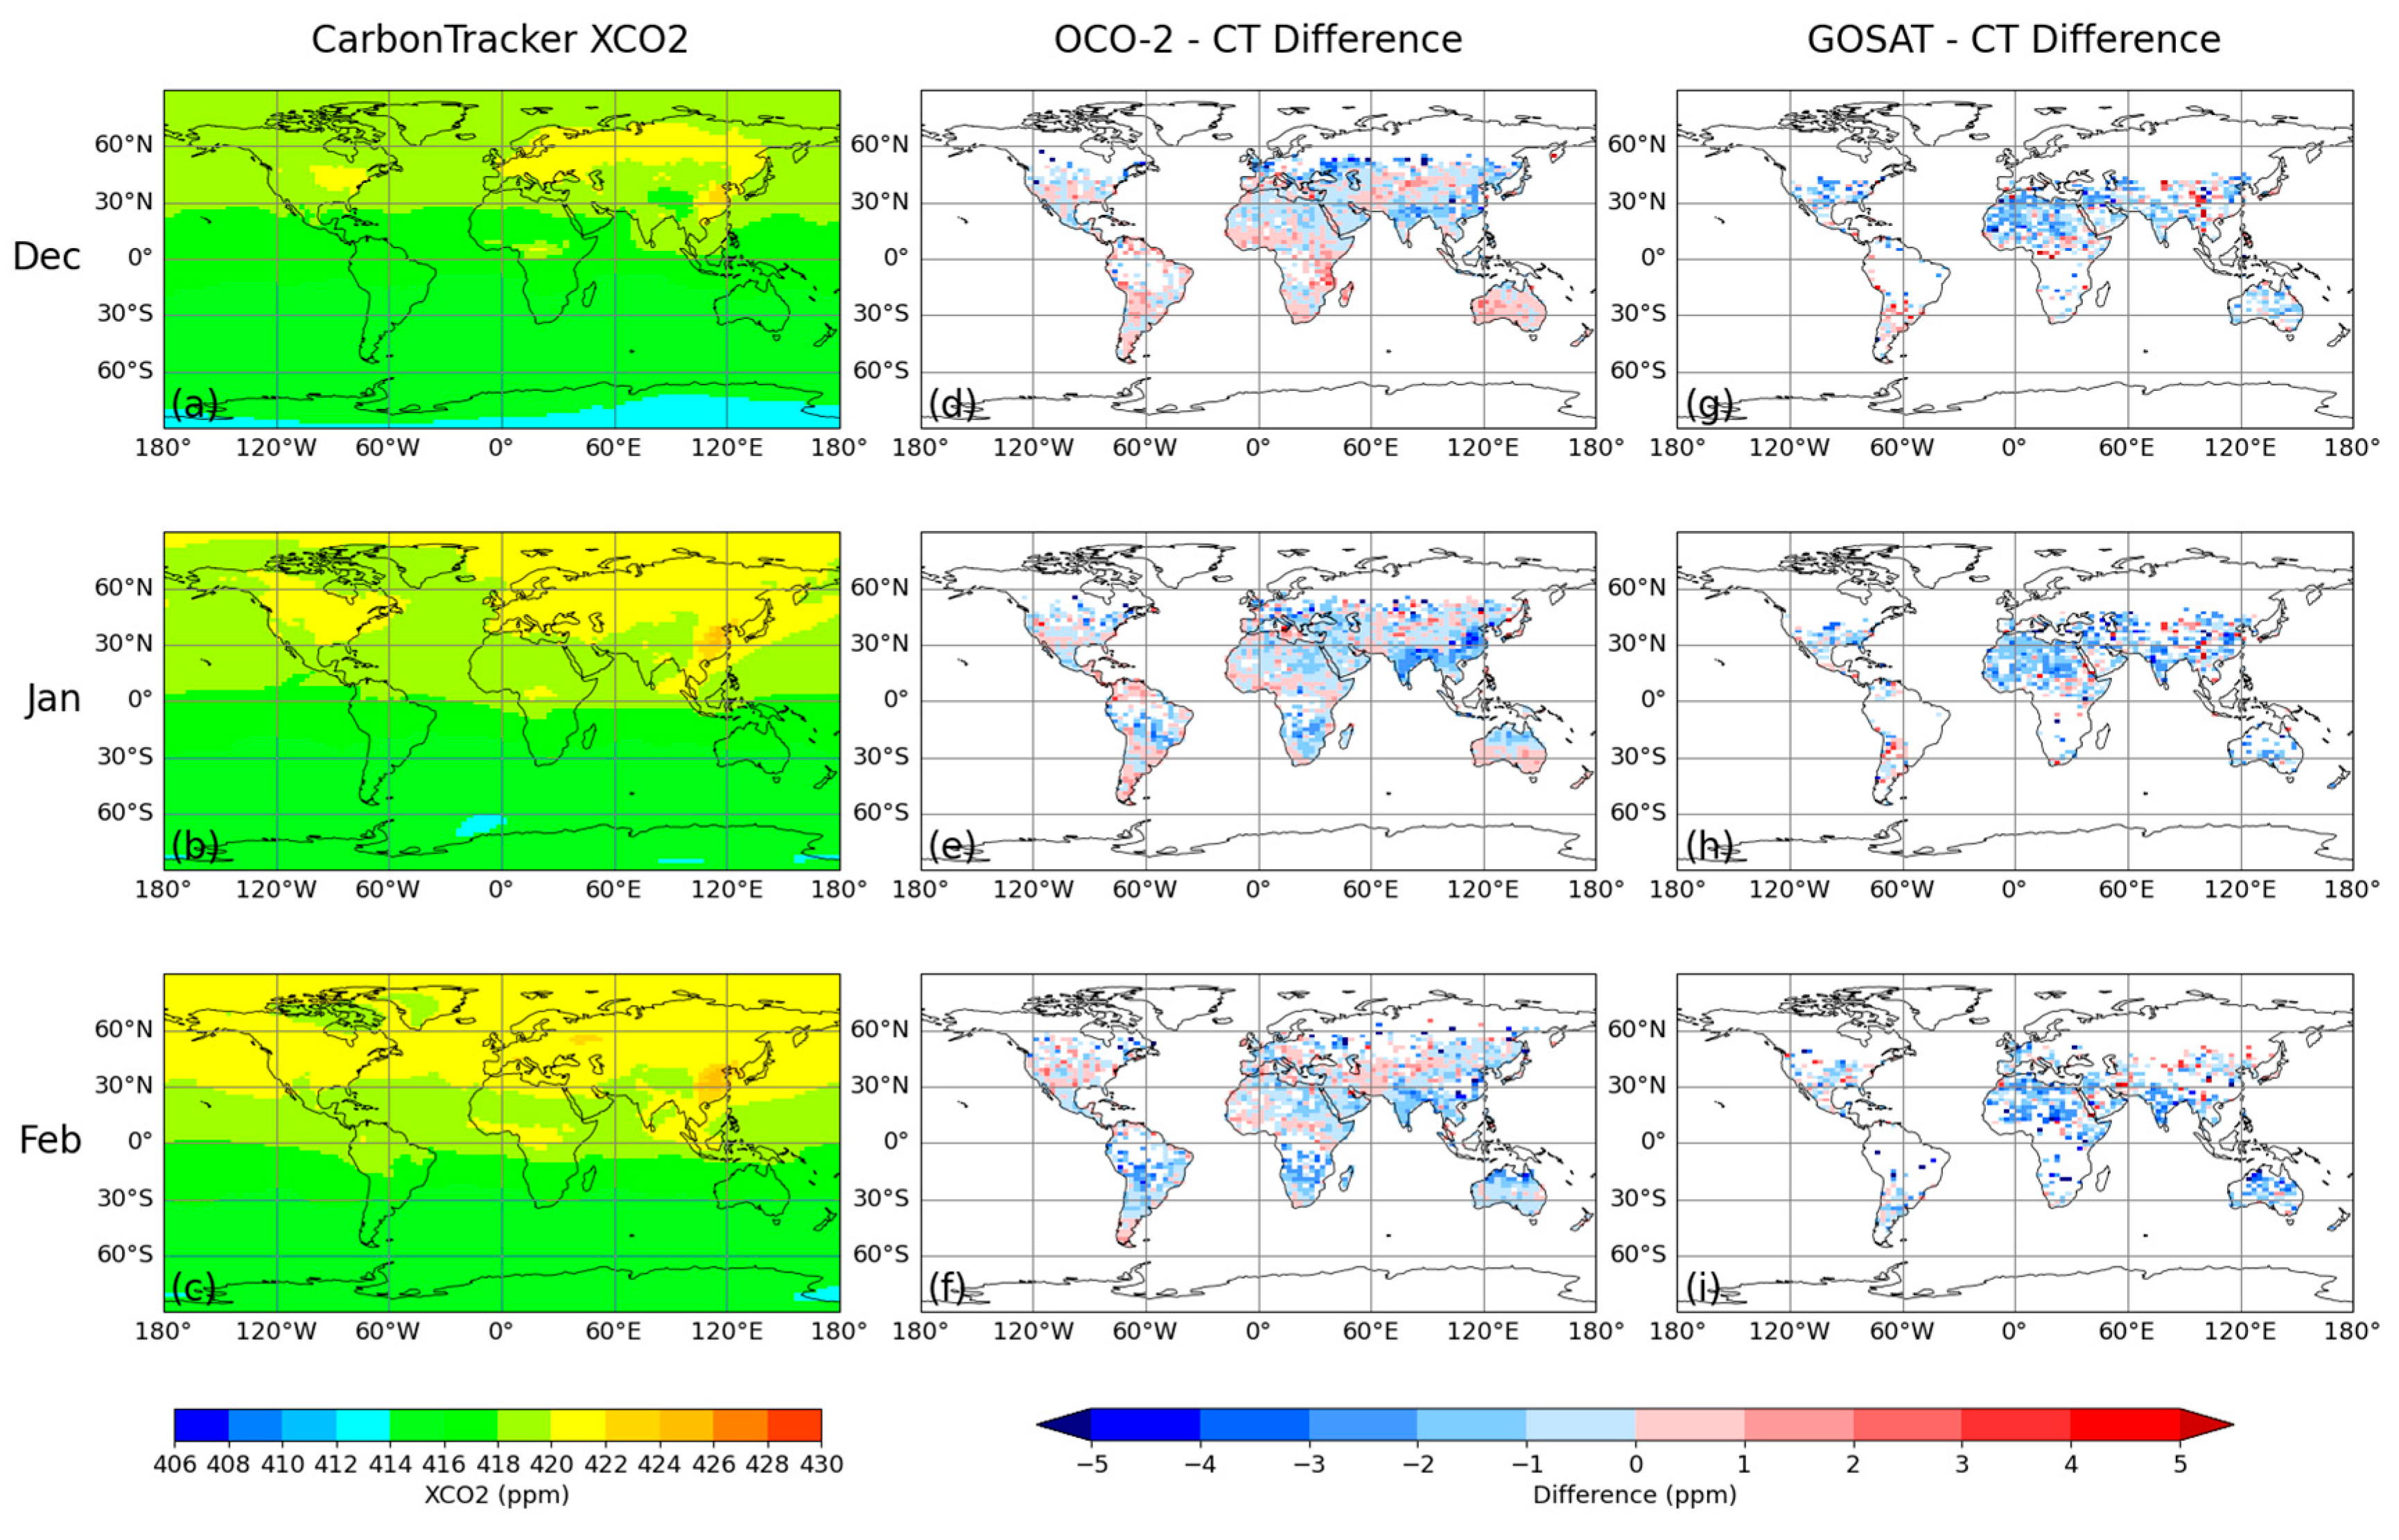
Figure 10a–c illustrate the monthly mean XCO2 from December 2022 to February 2023 (DJF). During this season, XCO2 in the NH increased slower than that in SON (see Figure S1j–l). As a result of the vegetation photosynthetic activity in the NH decreasing to its interannual minimum, the high emission background in high-density urban areas (e.g., East China) became particularly evident. High XCO2 areas extended from the northeastern United States, Europe, and East China to the entire mid- to high latitudes of the NH, driven by large-scale atmospheric transport. The photosynthetic rates in the SH peaked in DJF, leading to a XCO2 decrease in the two satellite data series (see Figure 3). However, the CT data still demonstrated an increasing trend.
For OCO-2 (Figure 10d–f), clusters of negative differences showed evidently over East China and South Asia within the EATE region. A severe bias (more than 4 ppm) appeared for East China in January (Figure 10e), which turned into a data gap in February (Figure 10f). However, such data gaps were unusual for OCO-2, even during cloudy summer months (JJA, Figure 8d–f). This may suggest that high aerosol loads from human activity in January and February cause inconsistencies in the data from satellite inversion and model assimilation. In the SH, differences correlated with low latitudes, and relatively large negative biases were distributed along data gap areas, especially for January and February (Figure 10e,f). This phenomenon may relate to biomass burning [81] and cloud cover. For GOSAT (Figure 10g–i), its large negative differences against CT were similarly located in East China and South Asia in the EATE region, as well as in northern Australia in February.
Combining Figure 7, Figure 8, Figure 9 and Figure 10 (spanning one year), OCO-2 demonstrated the worst regional-scale observation quality in JJA, which was mainly caused by cloud contamination driven by monsoon activity. In addition, relatively low and stable differences were observed in areas such as NAF (excluding its southern part), AUS (excluding the northern part), and West Asia. These areas are deserts with high albedo, which supports that high surface albedo can enhance the precision of satellite observations under some circumstances. For MAM and JJA 2023 (Figures S2 and S3), the spatial patterns of differences were similar to those observed in 2022 (Figure 7 and Figure 8).

3.2. Comparison of XCO2 Between Satellites and TCCON

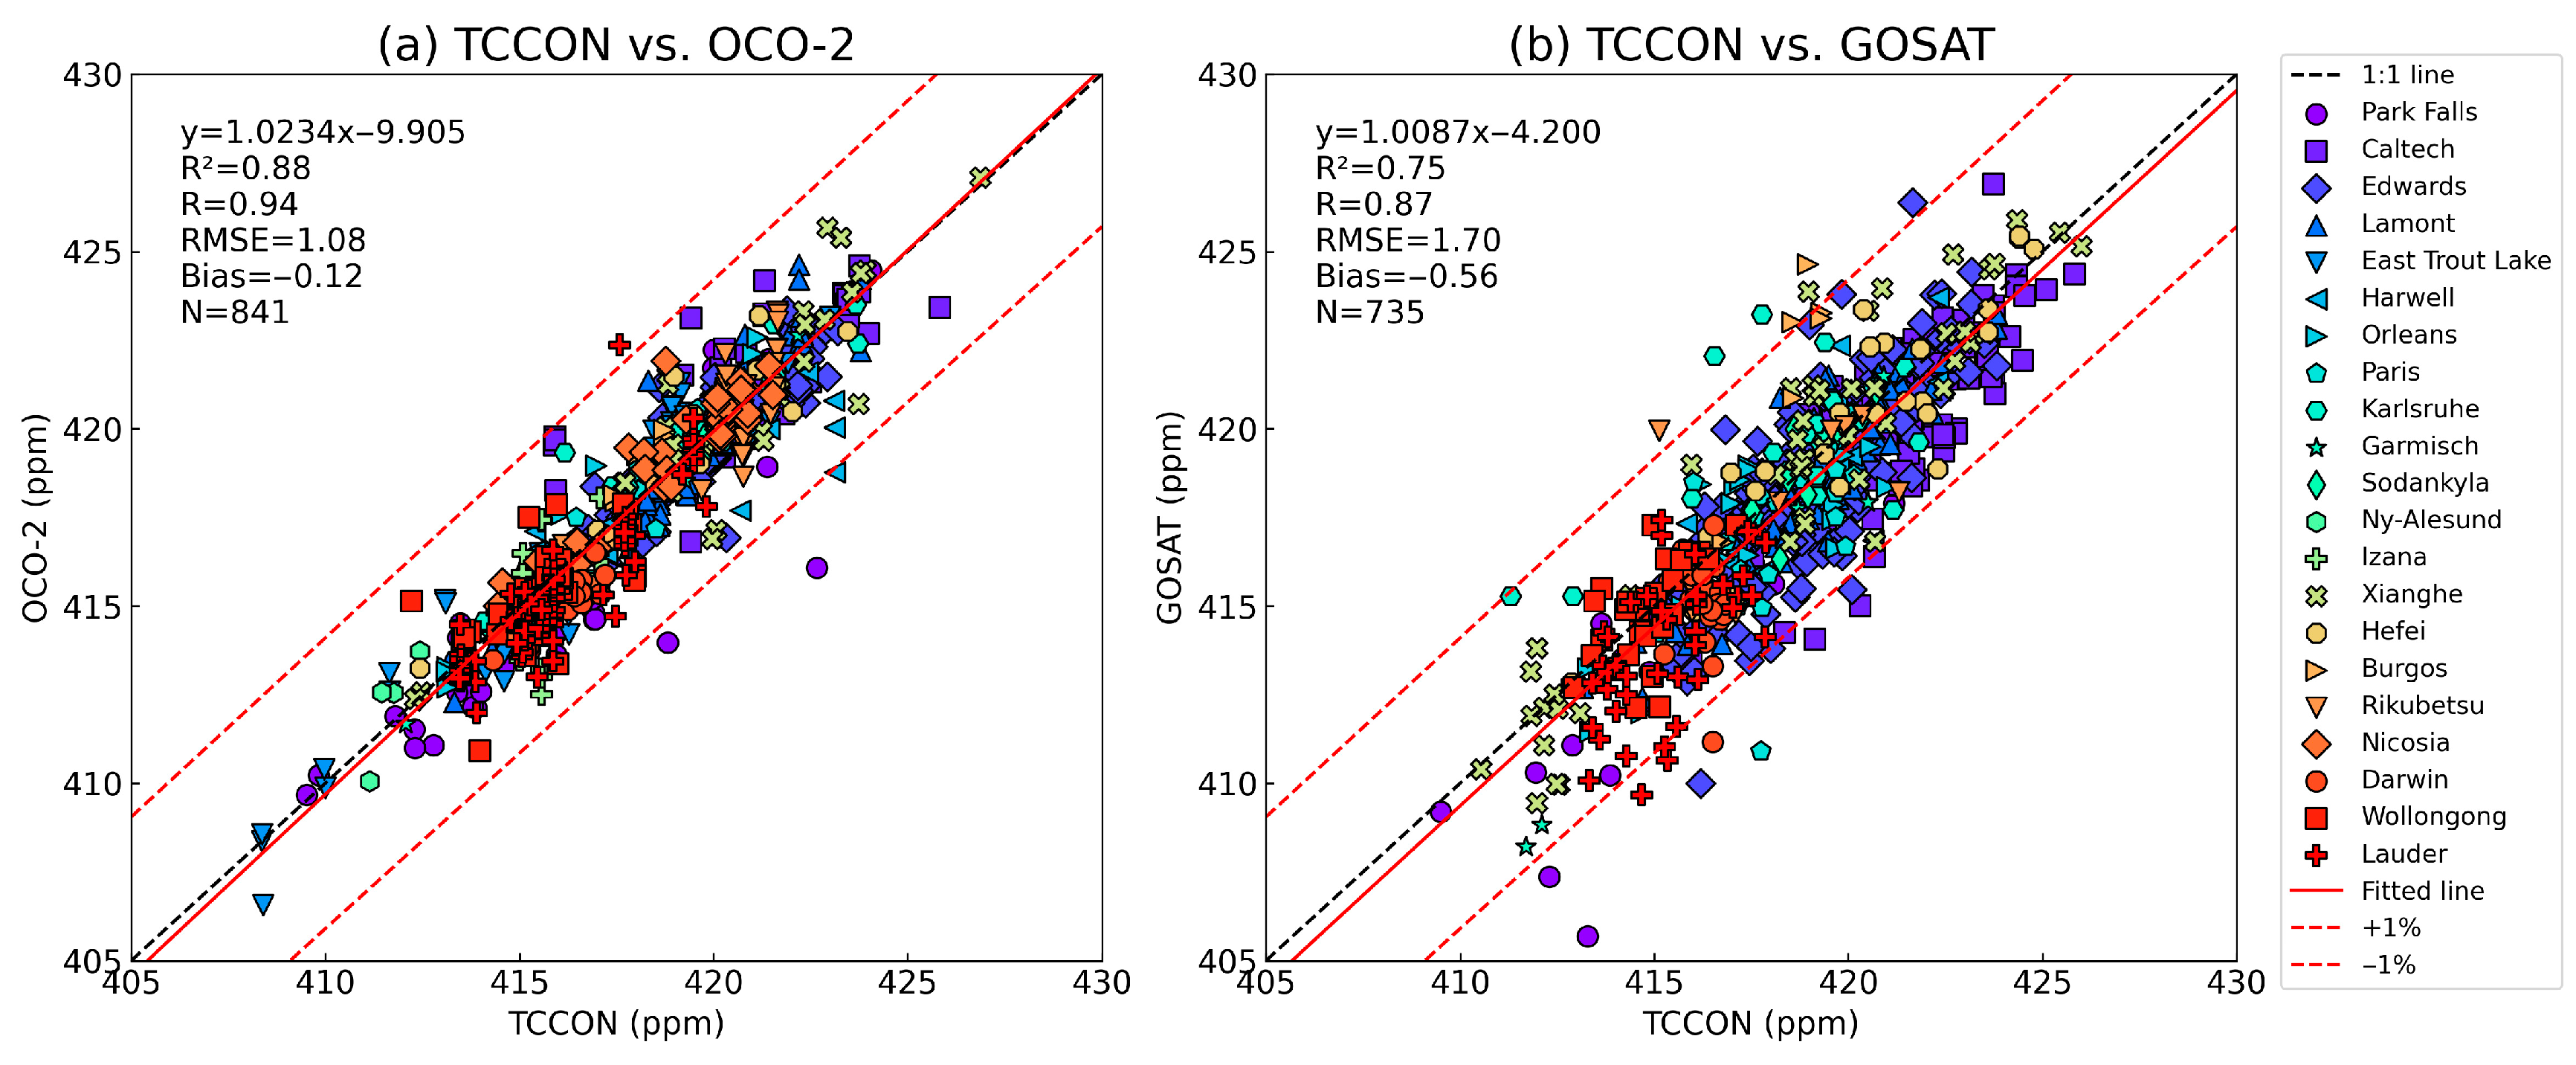
In this section, we aim to evaluate the performance of satellite retrieval by comparing the data with TCCON in situ observations. We also intend to discover the major sources of errors in satellite products on the local scale. By following the spatiotemporal matching criteria in Section 2.2.3, we obtained 841 matched samples for OCO-2 and 735 for GOSAT across the period from March 2022 to February 2024.
Figure 11 shows the overall comparison results. The fitted lines for the two satellite observations show slopes very close to 1, especially for GOSAT, with a slope of 1.0087, indicating high consistency between retrievals and in situ measurements. The determination coefficient of the fitted line for OCO-2 has a value of 0.88, which is slightly higher than that for GOSAT (0.75), suggesting that OCO-2 observations have fewer anomalies relative to GOSAT observations. OCO-2 (Figure 11a) achieved a low bias of −0.12 ppm, an RMSE of 1.08 ppm, and a high correlation coefficient of 0.94. GOSAT (Figure 11b) had an uncorrected negative bias of −0.56 ppm, an RMSE of 1.70, and a correlation coefficient of 0.87. These metrics indicate the generally good performance of the two satellite retrievals, especially for OCO-2.
Figure 12 demonstrates the performance of the satellites over each available TCCON site. For both satellites, the number of matched observations was the highest at mid-latitude sites (from Hefei at 31.91° to Park Falls at 45.94°), while fewer matches were found at high and low latitudes. Such latitude-dependent sample density also contributes to the magnitude of statistical metrics.
For OCO-2 (Figure 12a), observations near mid-latitude sites (from Hefei to Rikubetsu at 43.46°) showed an apparently smaller bias, with an absolute value of below 0.20 ppm over Rikubetsu, Xianghe, Lamont, Edwards, and Wollongong. Both Xianghe and Caltech are located in densely populated areas that are close to large sources of urban and industrial emissions, e.g., aerosols. These emissions are occluded by the surrounding mountains and therefore caused the relatively large RMSEs of 1.40 and 1.37 ppm, respectively. However, only negligible biases were observed (0.05 and 0.35 ppm, respectively), which may reflect the efficiency of bias correction procedures. Compared with mid-latitude sites, observations over high-latitude sites (from Garmisch 47.48° to Ny-Ålesund 78.92°) showed generally lower RMSEs and higher correlation coefficients, perhaps due to the improved digital elevation model used in OCO-2 Atmospheric Carbon Observations from Space (ACOS) v11.1 [30]. The Izaña site is on a low-latitude (28.31°) island off the northwest coast of Africa, characterized by the highest geometric altitude (2370 m) among TCCON sites. OCO-2 retrievals at Izaña showed a bias of −0.39 ppm, an RMSE of 1.44 ppm, and a correlation coefficient of 0.72. Although Izaña is less influenced by land properties due to its location, strong variabilities in surface altitude renders OCO-2 retrievals difficult (Figure S4). A similar situation was found for observations over Lauder (Figure S5), where shows a bias of −0.65 ppm.
The statistical metrics for GOSAT observations (Figure 12b) were more dependent on latitude than those for OCO-2. Retrieval performance over mid-latitude stations (from Hefei to Xianghe at 39.80°) was generally good, with a bias of -0.01 ppm (Wollongong), an RMSE below 1.62 ppm (Xianghe), and relatively high correlation coefficients. However, retrievals over stations from Rikubetsu to Karlsruhe (49.10°) had a large bias and RMSE, as well as low correlation coefficients. For these higher-latitude sites, GOSAT retrievals were likely complicated by industrial activity (e.g., Paris and Karlsruhe) and surface topography (e.g., Garmisch and Lauder); whereas Orléans and Rikubetsu, due to their flat terrain and low population density, respectively, tended to show smaller biases. Low-latitude stations such as Burgos (18.53°) and Darwin (12.42°) performed poorly. Particularly, Burgos had the highest bias (3.38 ppm) and RMSE (3.83 ppm). The relatively high correlation coefficient at this site was due to the strong linear relationship between satellite and in situ observations.
Notably, both satellites exhibited large biases and RMSEs at Darwin, Park Falls, and Lauder. Darwin is characterized by a low and flat terrain, but in cloudy low latitudes. OCO-2 retrieval bias for Darwin was almost entirely contributed by land observations (Figure S6). Park Falls is located in a forested area with relatively uniform surface properties but low albedo. Another potential reason for larger errors over Park Falls will be discussed in Figure 13.
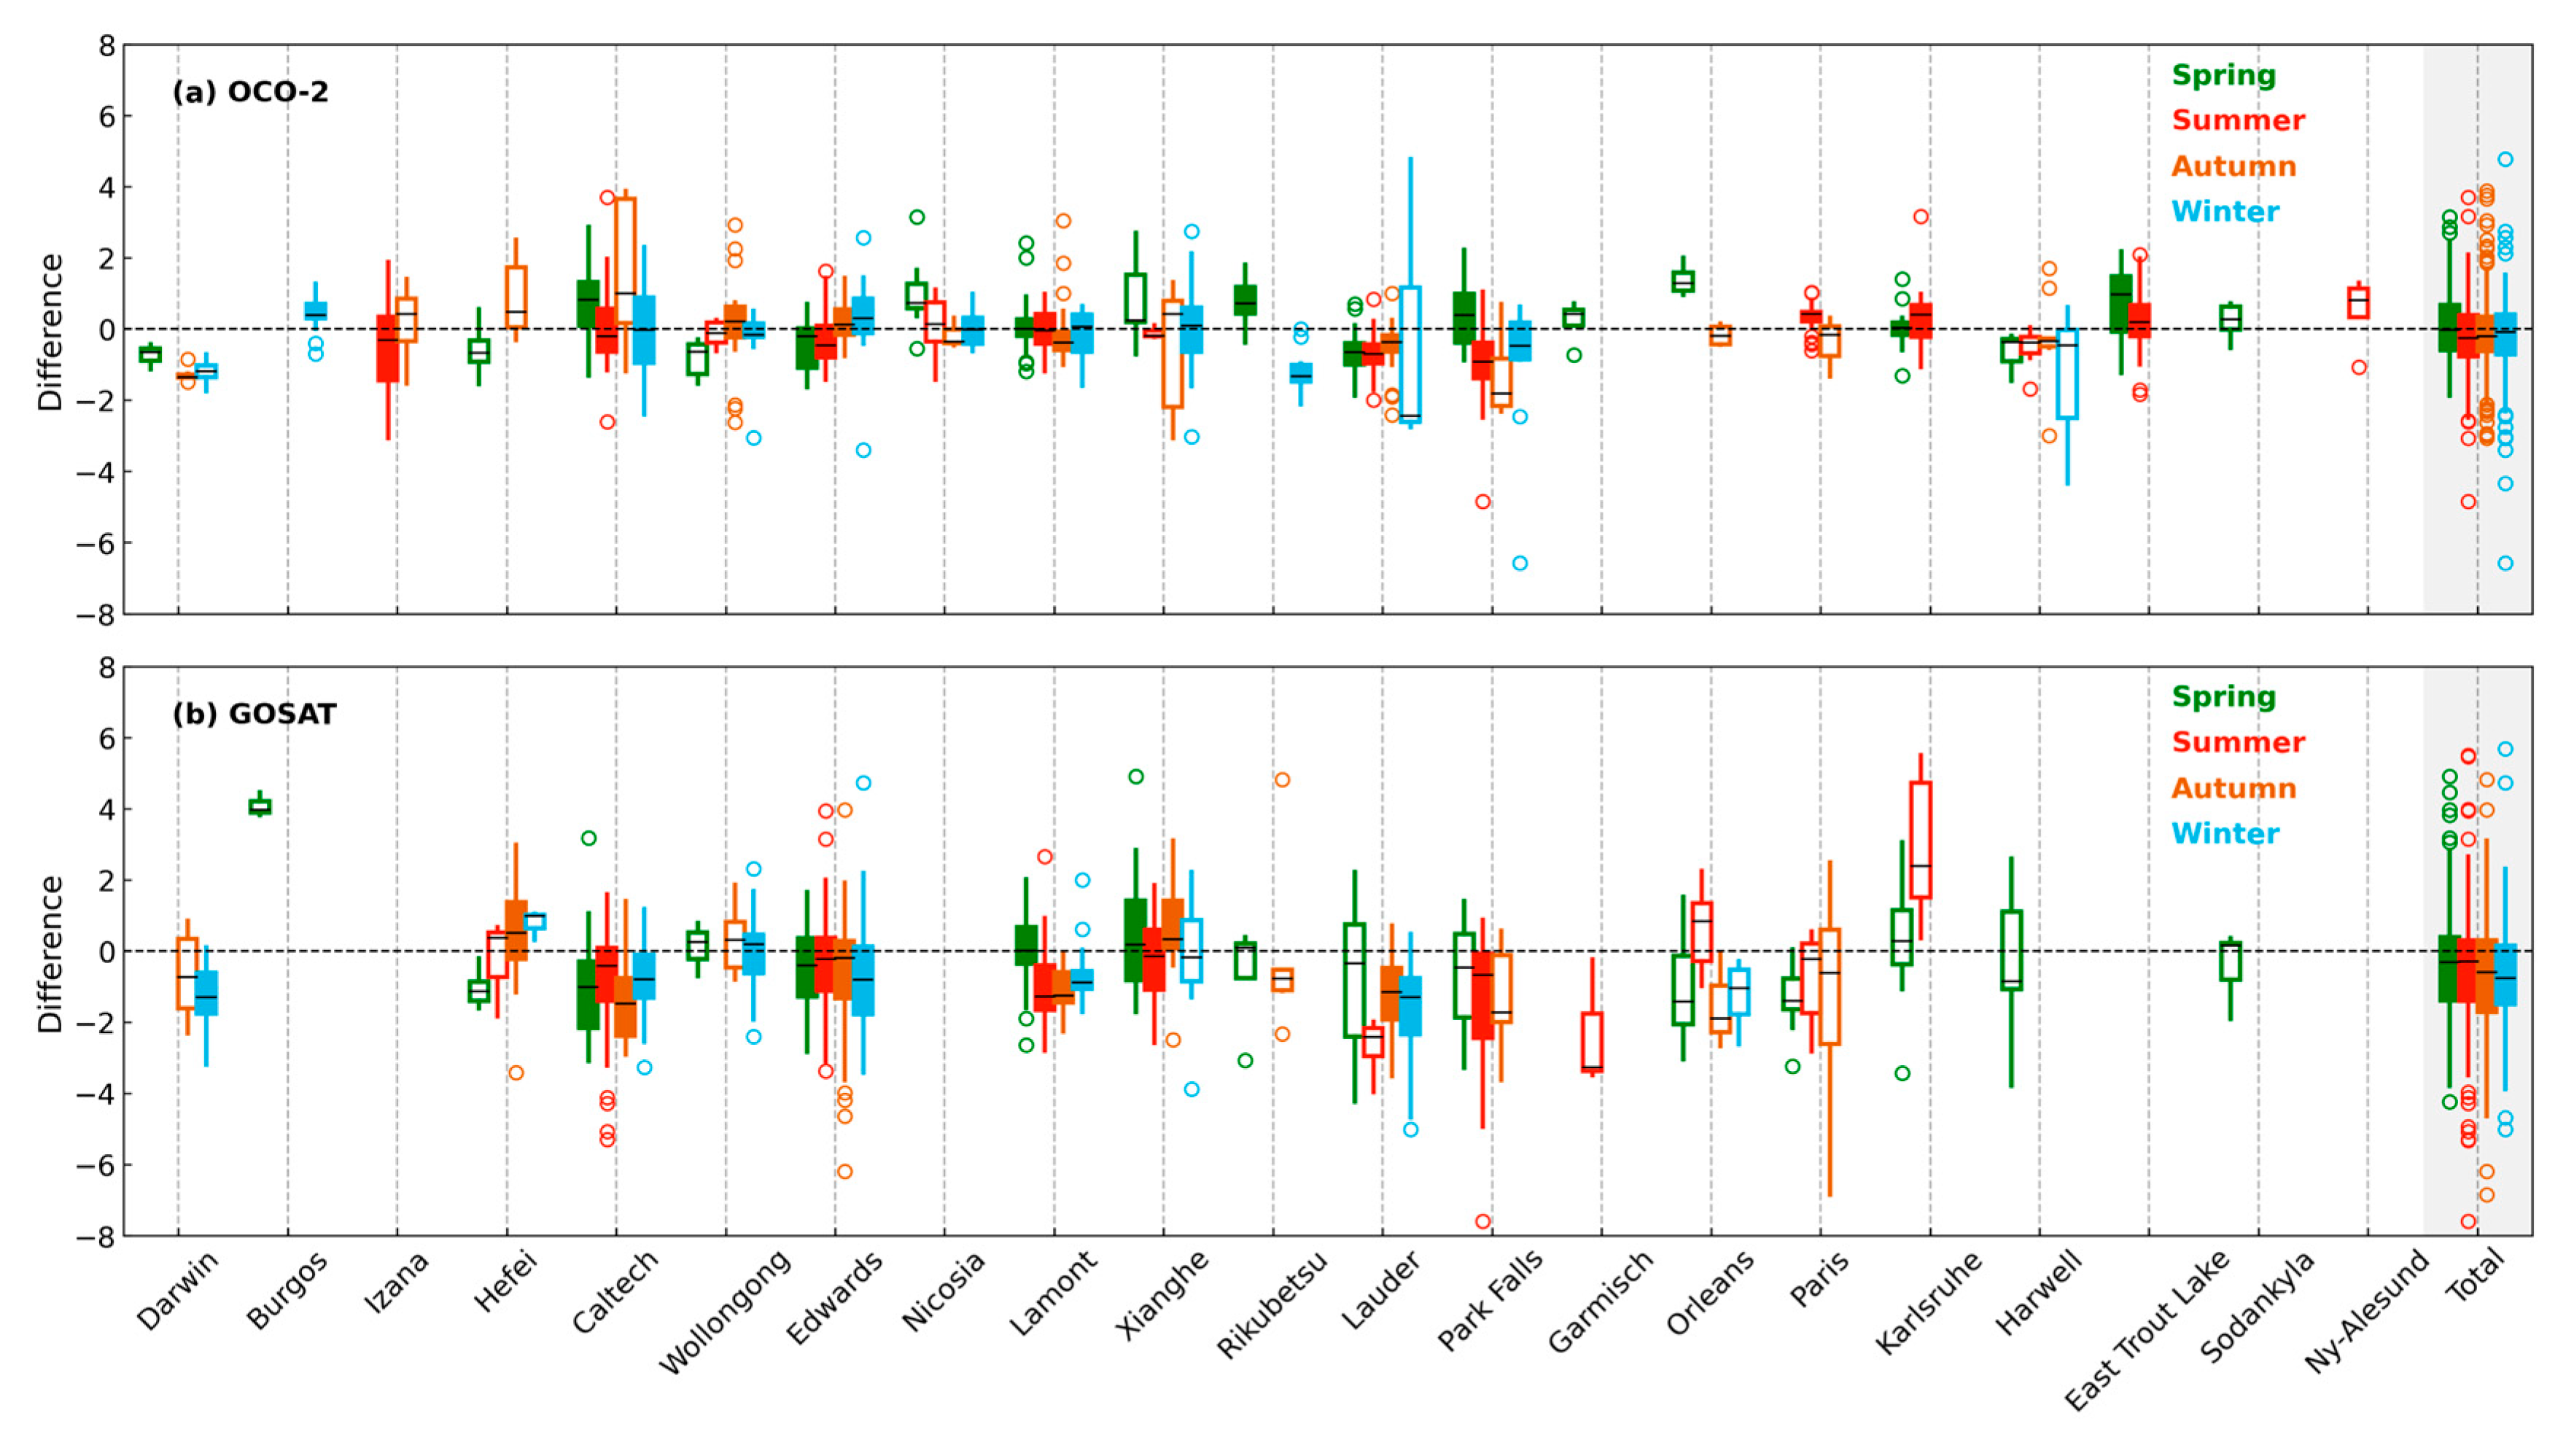
We also investigated the seasonal correlation of errors with respect to TCCON, shown as Figure 13. Regarding OCO-2 (Figure 13a), the magnitude of observation errors over Caltech and Xianghe showed wide distribution during autumn, whereas those over Lauder and Harwell had wide distribution in winter. Errors over the four stations from Wollongong to Lamont were weakly correlated with seasons, with narrower distribution within season and small variation between seasons. Notably, stable negative seasonal biases were observed at Darwin. As for GOSAT (Figure 13b), satellite measurements over Wollongong, Edwards and Xianghe showed a low season-dependent bias relative to TCCON, while seasonal bias and cross-season variation in errors were evident from Lauder to Karlsruhe. As reported by Figure 12, larger errors were observed over the Park Falls station but with uniform surface properties; this may suffer from the variation in surface optical property between different seasons, such as snow cover, grass and leaves, supported by Figure 13, where the errors over the Park Falls station show a relatively clear seasonal dependence. In general, both satellites obtained more accurate and precise observations in spring but relatively biased and unstable observations in summer and winter.

4. Discussion

We assessed the recent versions of OCO-2 and GOSAT data through CT and TCCON comparisons. The study focused on discovering advantages and drawbacks of satellite retrieval over CT simulation across TransCom regions along with the corresponding reasons. We also intend to examine the data consistency relative to TCCON and sources of errors.

4.1. Sources of Retrieval Biases and Uncertainties

The TCCON validation results indicate that retrievals affected by large surface elevation variability (e.g., Izana, Caltech, and Lauder in Figure 12; also see Figures S4, S5, S7c and S8b) or aerosol pollution (e.g., Caltech and Xianghe in Figure 12; also see Figures S7a,b and S8a) tended to exhibit larger errors for both satellites. In this context, bias correction is essential for the accuracy and precision of satellite Level 2 products. The Hefei, Wollongong, Xianghe, and Rikubetsu sites are some examples. Although relatively large RMSEs were observed, systematic biases could be significantly mitigated owing to parametric bias correction via multivariate regression [21,84].
Wunch et al. [20] reported the presence of spurious albedo-related variability in OCO-2 B7r XCO2 over Edwards. Bie et al. [24] also found that GOSAT observations showed larger errors over deserts in western China than cities in eastern China. Here, when comparing with TCCON, we found that such problems have been greatly improved (see Caltech and Edwards in Figure 12 and Figure S7). This improvement is also reflected in the comparison against CT (Figure 7, Figure 8, Figure 9 and Figure 10), identified by the small uncertainty and differences over Northern African, Australian, and West Asian deserts.
In Lauder, another undesirable error related to the [topographic variability in OCO-2 B7r products was emphasized by Wunch et al. [20]. This type of error has become a key issue in the OCO-2 project [29,30] and been mitigated to some extent. However, our results suggest that this error could be further alleviated (Figures S4 and S5).
Previous studies [27,32,35,36] also assessed Level 2 products with TCCON matching criteria that were similar to ours. Compared with these previous results, our data (i.e., OCO-2 v11.1r and GOSAT v03.05; Figure 11) tended to exhibit smaller biases and RMSEs for OCO-2, but larger biases for GOSAT. For GOSAT, this is mainly a result of the stricter matching criteria at four sites (see Section 2.2.3 and Table 2), rather than instrument degradation [31,32]. Without application of special treatment (as in those studies), the biases in Figure 11 would further decrease to −0.06 ppm for OCO-2 and −0.30 ppm for GOSAT. Therefore, although we used data from more recent years, the new degradation model [85] applied in the NIES v03 algorithm [19] has indeed a positive effect on GOSAT data quality. However, systematic errors still obviously exist in the GOSAT NIES bias-corrected product, no matter whether it was compared with TCCON or CT.

4.2. Advantages and Disadvantages of Satellite Retrieval Relative to CT

For performance over land, the strength of satellites lies in their ability to more accurately capture CO2 concentrations (especially OCO-2) and realistic temporal variability over SH regions. In these regions, the seasonal variability simulated by CT (Figure 3c,k,i) violated the common variation trend recorded by ground-based FTS in previous studies [20,86]. However, a limitation of OCO-2 is that it retrieves seasonal data gaps in the EUR and boreal regions (although its overall agreement with CT remains good), while GOSAT failed to quantify the true variation in the NAF and EATE regions and showed even larger data gaps and biases than OCO-2. These shortcomings are mainly because satellite retrieval can suffer from high solar zenith angles, frequent cloud cover (e.g., associated with the monsoon and ITCZ), and urban pollution. In contrast, the CT assimilation system can effectively double the knowledge in each analysis by incorporating an independent observation network. It has the ability to reproduce monthly variations with accurate amplitude, phase, and full coverage. Inconsistencies between data were observed in two tropical regions. Such inconsistencies may not be clearly reflected in statistical metrics (R and bias; see Figure 4i,j and Figure 5i,j). Considering that tropical rainforests are vital for flux and stock change estimates [38,39], inaccuracies in seasonal extremes and responses may result in substantial errors. Based on our results, we can only cautiously suggest that CT may perform the best in the TRAS region, and that GOSAT might be more accurate than OCO-2 although it suffers from severe data gaps.
For ocean data, unlike for land data, CT was directly treated as the fiducial reference. We acknowledge that this treatment was a relatively arbitrary choice. However, due to the limited distribution of TCCON sites, satellite observations over oceans are far less sufficiently validated than those over land. Previous studies [20,38,39,43,76] have also pointed out the incorrectness of ocean retrievals. Therefore, instead of cross-comparisons, using the reanalysis product as a benchmark is currently a reasonable way. Notably, when there was a good match between the time series patterns of regional monthly biases for the two satellites, such as in the SP (Figure 6i), SI (Figure 6j), and AT (Figure 6d) regions, both satellites tended to show relatively small biases compared to CT. This further highlights the reliability of using CT as a reference for regional monthly means over the oceans. As expected, GOSAT did not obtain reliable retrievals for regional monthly variations over the oceans, as its original product SWIR Level 2 CO2 V03.00 (without bias correction) showed a large bias relative to TCCON and other in situ measurements over ocean surfaces [19]. Based on comparison with CT (see Section 3.1.2), GOSAT observations exhibited significant positive biases during spring, summer, and autumn (e.g., Figure 6g) in the NP (Figure 6b), NA (Figure 6c), EP (Figure 6g), and WP (Figure 6h) regions. These biases were up to 2 ppm and accounted for almost the entire positive bias. In contrast, the regional bias of OCO-2 relative to CT was relatively low (no larger than 0.40 ppm), and the variability in time series for the NP, NA, EP, and WP regions closely matched those of CT. Primary deviations were a forward phase shift in the monthly time series for the AT region (Figure 5d), consistent underestimation of XCO2 in the IT region (Figure 5f and Figure 6f), and overestimation of spring XCO2 in SH TransCom regions (Figure 5e,i,j and Figure 6e,i,j).

4.3. Other Suggestions

As mentioned in Section 4.2, CT reanalysis is not as reliable as satellite data in the SH lands. One reason for this is that CT only utilizes a sparse observation network in the SH lands. Thus, in these regions, model inversion constrained by satellite observations (data assimilation) can be pursued.
Moreover, satellite ocean observations lack adequate validation. Even for some land regions, the deployment of TCCON stations is difficult or even impractical due to various constraints [87]. The COllaborative Carbon Column Observing Network (COCCON) [86], as a portable spectrometer platform, allows for flexible deployments in key areas. It offers a promising way to address validation difficulties in remote areas [88,89], including both land and ocean.

5. Conclusions

This study provides insights into current OCO-2 (v11.1r) and GOSAT (v03.05) XCO2 observations by identifying their advantages and disadvantages relative to CT and validation against TCCON. For the CT comparison, we utilized data from March 2022 to August 2023, and for the TCCON comparison, we utilized data from March 2022 to February 2024.
Based on TransCom regions, analyses against CT demonstrated that both satellites had an overall negative bias over land and the smallest bias in spring. In three SH land regions, the satellites detected a realistic monthly variability, while OCO-2 more accurately retrieved monthly concentrations. However, because of limitations associated with latitude, season, and anthropogenic pollution, the satellite data are not as reliable as CT data in NH land regions. Nevertheless, OCO-2 still performed well in quantifying monthly means in the NABO, NATE, NAF, SATR, and EABO regions, and GOSAT reliably detected monthly means in the NABO, EUR, and EABO regions. However, no clear conclusions were derived for the two tropical regions. Additionally, the OCO-2 data showed clear spatial features clustering on the sub-regional scale (such as in East and South Asia) related to typical error sources, while those features were less distinguishable in GOSAT data due to data gaps or larger biases. For ocean regions, the largest bias relative to CT occurred in spring. Reliable retrievals over the ocean were not obtained from GOSAT, while the main issues for OCO-2 monthly time series were a phase shift in the AT region, a steady underestimation in the IT region, and spring positive biases in the SA, SP, and SI regions.
Comparison to TCCON showed overall biases of −0.12 and −0.56 ppm, and RMSEs of 1.08 and 1.70 ppm for OCO-2 and GOSAT, respectively. These local-scale errors are primarily caused by variability in surface elevation or urban aerosol pollution and tended to be the smallest in spring but larger in summer and winter. Different from previous studies, comparisons based on CT and TCCON indicated that high albedo over desert surfaces may be favorable for current satellite retrieval. Clouds, aerosols, and surface pressure still accounted for the biggest challenges for OCO-2, while the bias-correction process was a more realistic issue for GOSAT.

Supplementary Materials

The following supporting information can be downloaded at: https://www.mdpi.com/article/10.3390/rs17213635/s1, Figure S1: Standardized temporal anomaly of monthly XCO2 for CT data from March 2022 to February 2023. Here, standardized anomalies are computed individually at each grid point by normalizing its time series; Figure S2: The same as Figure 7 but in March, April, and May 2023; Figure S3: The same as Figure 7 but in June, July, and August 2023; Figure S4: Difference in OCO-2 observations with respect to TCCON measurement over Izaña on (a) 18 July 2022, (b) 17 August 2022, and (c) 20 October 2022 plotted on a map; Figure S5: The same as Figure S4 but over Lauder on (a) 9 April 2022, (b) 25 October 2022, and (c) 8 January 2023; Figure S6: The same as Figure S4 but over Darwin on (a) 2 May 2022, (b) 12 July 2022, and (c) 28 July 2022; Figure S7: The same as Figure S4 but over Caltech and Edwards on (a) 9 July 2022, (b) 4 September 2022, and (c) 26 January 2023; Figure S8: The same as Figure S4 but over Xianghe on (a) 28 September 2022, (b) 1 December 2022, and (c) 28 February 2023.

Author Contributions

Conceptualization, K.W. and Y.L.; methodology, K.W., Y.L. and Y.L.Y.; software, Y.L. and K.W.; validation, Y.L.; formal analysis, Y.L. and K.W.; investigation, Y.L., K.W., X.W. and J.H.; resources, Y.L.Y., K.W., X.W., J.H. and Y.L.; data curation, Y.L. and K.W.; writing—original draft preparation, Y.L.; writing—review and editing, K.W. and Y.L.Y.; visualization, Y.L.; supervision, K.W.; project administration, K.W.; funding acquisition, K.W. All authors have read and agreed to the published version of the manuscript.

Funding

This research work was supported by the National Natural Science Foundation of China. (Grant No. 42088101, 42475094) and the State Key Laboratory of Climate System Prediction and Risk Management (CPRM) initiative project (Grant No. CPRM-2025¬NUIST-012).

Data Availability Statement

No new data were created or analyzed in this study. Data sharing is not applicable to this article.

Acknowledgments

The authors gratefully acknowledge the availability of the datasets used in this study.

Conflicts of Interest

The authors declare no conflicts of interest.

Abbreviations

The following abbreviations are used in this manuscript:
ATAtlantic Tropical
AUSAustralia
CAICloud and Aerosol Imager
COCCONCOllaborative Carbon Column Observing Network
CO2Carbon Dioxide
CTCarbonTracker
DJFDecember, January and February
DQ-1Atmospheric Environment Monitoring Satellite
EATEEurasia Temperate
ENVISAT-2002-9AEarth observation satellite Environmental Satellite
EPEast Pacific Tropical
ESAEuropean Space Agency
EUREurope
FTSFourier Transform Spectrometer
GHGGreenhouse Gas
ITIndian Tropical
ITCZIntertropical Convergence Zone
JJAJune, July and August
MAMMarch, April and May
NANorth Atlantic
NABONorthern American Boreal
NAFNorthern Africa
NATENorthern American Temperate
NHNorthern hemisphere
NOAANational Oceanic and Atmospheric Administration
NIESNational Institute for Environmental Studies
NPNorth Pacific
NRTNear-Real-Time
GOSATGreenhouse gases Observing Satellite
OCO-2Orbiting Carbon Observatory-2
RCorrelation coefficient
R2Determination Coefficient
RMSERoot Mean Square Error
SASouth Atlantic
SATESouthern America Temperate
SAFSouthern Africa
SDStandard deviation
SHSouthern hemisphere
SISouth Indian
SONSeptember, October and November
SPSouth Pacific
SWIRshortwave infrared
TANSATCarbon Dioxide Observation Satellite
TANSOThermal and Near-intrinsic Sensor for Carbon Observation
TCCONTotal Carbon Column Observing Network
TRASTropical Asia
WPWest Pacific Tropical
XCO2column-averaged dry air molar fraction of atmospheric CO2

References

  1. IPCC. Climate Change 2023: Synthesis Report. Contribution of Working Groups I, II and III to the Sixth Assessment Report of the Intergovernmental Panel on Climate Change; IPCC: Geneva, Switzerland, 2023; pp. 35–115. [Google Scholar] [CrossRef]
  2. IPCC. The Earth’s Energy Budget, Climate Feedbacks and Climate Sensitivity. In Climate Change 2021—The Physical Science Basis: Working Group I Contribution to the Sixth Assessment Report of the Intergovernmental Panel on Climate Change; Intergovernmental Panel on Climate Change (IPCC); Cambridge University Press: Cambridge, UK, 2023; pp. 923–1054. ISBN 978-1-009-15788-9. [Google Scholar]
  3. Brovkin, V.; Lorenz, S.; Raddatz, T.; Ilyina, T.; Stemmler, I.; Toohey, M.; Claussen, M. What Was the Source of the Atmospheric CO2 Increase during the Holocene? Biogeosciences 2019, 16, 2543–2555. [Google Scholar] [CrossRef]
  4. Yang, Z.; Kagawa, S.; Li, J. Do Greenhouse Gas Emissions Drive Extreme Weather Conditions at the City Level in China? Evidence from Spatial Effects Analysis. Urban Clim. 2021, 37, 100812. [Google Scholar] [CrossRef]
  5. Doney, S.C.; Fabry, V.J.; Feely, R.A.; Kleypas, J.A. Ocean Acidification: The Other CO2 Problem. Annu. Rev. Mar. Sci. 2009, 1, 169–192. [Google Scholar] [CrossRef]
  6. Solomon, S.; Plattner, G.-K.; Knutti, R.; Friedlingstein, P. Irreversible Climate Change Due to Carbon Dioxide Emissions. Proc. Natl. Acad. Sci. USA 2009, 106, 1704–1709. [Google Scholar] [CrossRef] [PubMed]
  7. Jacobson, T.A.; Kler, J.S.; Hernke, M.T.; Braun, R.K.; Meyer, K.C.; Funk, W.E. Direct Human Health Risks of Increased Atmospheric Carbon Dioxide. Nat. Sustain. 2019, 2, 691–701. [Google Scholar] [CrossRef]
  8. Wunch, D.; Toon, G.C.; Blavier, J.-F.L.; Washenfelder, R.A.; Notholt, J.; Connor, B.J.; Griffith, D.W.T.; Sherlock, V.; Wennberg, P.O. The Total Carbon Column Observing Network. Philos. Trans. R. Soc. A Math. Phys. Eng. Sci. 2011, 369, 2087–2112. [Google Scholar] [CrossRef]
  9. Crisp, D.; Dolman, H.; Tanhua, T.; McKinley, G.A.; Hauck, J.; Bastos, A.; Sitch, S.; Eggleston, S.; Aich, V. How Well Do We Understand the Land-Ocean-Atmosphere Carbon Cycle? Rev. Geophys. 2022, 60, e2021RG000736. [Google Scholar] [CrossRef]
  10. Laughner, J.L.; Toon, G.C.; Mendonca, J.; Petri, C.; Roche, S.; Wunch, D.; Blavier, J.-F.; Griffith, D.W.T.; Heikkinen, P.; Keeling, R.F.; et al. The Total Carbon Column Observing Network’s GGG2020 Data Version. Earth Syst. Sci. Data 2024, 16, 2197–2260. [Google Scholar] [CrossRef]
  11. Fan, C.; Yang, J.; Liu, J.; Bu, L.; Wang, Q.; Wei, C.; Zhang, Y.; Zhu, X.; Li, S.; Zang, H.; et al. Airborne Atmospheric Carbon Dioxide Measurement Using 1.5 µm Laser Double-Pulse IPDA Lidar over a Desert Area. Appl. Opt. 2024, 63, 2121–2131. [Google Scholar] [CrossRef]
  12. Wang, Q.; Mustafa, F.; Bu, L.; Zhu, S.; Liu, J.; Chen, W. Atmospheric Carbon Dioxide Measurement from Aircraft and Comparison with OCO-2 and CarbonTracker Model Data. Atmos. Meas. Tech. 2021, 14, 6601–6617. [Google Scholar] [CrossRef]
  13. Mitchell, K.A.; Doney, S.C.; Keppel-Aleks, G. Characterizing Average Seasonal, Synoptic, and Finer Variability in Orbiting Carbon Observatory-2 XCO2 Across North America and Adjacent Ocean Basins. J. Geophys. Res. Atmos. 2023, 128, e2022JD036696. [Google Scholar] [CrossRef]
  14. Machida, T.; Matsueda, H.; Sawa, Y.; Nakagawa, Y.; Hirotani, K.; Kondo, N.; Goto, K.; Nakazawa, T.; Ishikawa, K.; Ogawa, T. Worldwide Measurements of Atmospheric CO2 and Other Trace Gas Species Using Commercial Airlines. J. Atmos. Ocean. Technol. 2008, 25, 1744–1754. [Google Scholar] [CrossRef]
  15. Zhao, S.; Liu, M.; Tao, M.; Zhou, W.; Lu, X.; Xiong, Y.; Li, F.; Wang, Q. The Role of Satellite Remote Sensing in Mitigating and Adapting to Global Climate Change. Sci. Total Environ. 2023, 904, 166820. [Google Scholar] [CrossRef]
  16. Zandbergen, R.; Otten, M.; Righetti, P.L.; Kuijper, D.; Dow, J.M. Routine Operational and High-Precision Orbit Determination of Envisat. Adv. Space Res. 2003, 31, 1953–1958. [Google Scholar] [CrossRef]
  17. Yokota, T.; Yoshida, Y.; Eguchi, N.; Ota, Y.; Tanaka, T.; Watanabe, H.; Maksyutov, S. Global Concentrations of CO2 and CH4 Retrieved from GOSAT: First Preliminary Results. SOLA 2009, 5, 160–163. [Google Scholar] [CrossRef]
  18. Yoshida, Y.; Ota, Y.; Eguchi, N.; Kikuchi, N.; Nobuta, K.; Tran, H.; Morino, I.; Yokota, T. Retrieval Algorithm for CO2 and CH4 Column Abundances from Short-Wavelength Infrared Spectral Observations by the Greenhouse Gases Observing Satellite. Atmos. Meas Tech. 2011, 4, 717–734. [Google Scholar] [CrossRef]
  19. Someya, Y.; Yoshida, Y.; Ohyama, H.; Nomura, S.; Kamei, A.; Morino, I.; Mukai, H.; Matsunaga, T.; Laughner, J.L.; Velazco, V.A.; et al. Update on the GOSAT TANSO–FTS SWIR Level 2 Retrieval Algorithm. Atmos. Meas Tech. 2023, 16, 1477–1501. [Google Scholar] [CrossRef]
  20. Wunch, D.; Wennberg, P.O.; Osterman, G.; Fisher, B.; Naylor, B.; Roehl, C.M.; O’Dell, C.; Mandrake, L.; Viatte, C.; Kiel, M.; et al. Comparisons of the Orbiting Carbon Observatory-2 (OCO-2) XCO2 Measurements with TCCON. Atmos. Meas Tech. 2017, 10, 2209–2238. [Google Scholar] [CrossRef]
  21. O’Dell, C.W.; Eldering, A.; Wennberg, P.O.; Crisp, D.; Gunson, M.R.; Fisher, B.; Frankenberg, C.; Kiel, M.; Lindqvist, H.; Mandrake, L.; et al. Improved Retrievals of Carbon Dioxide from Orbiting Carbon Observatory-2 with the Version 8 ACOS Algorithm. Atmos. Meas Tech. 2018, 11, 6539–6576. [Google Scholar] [CrossRef]
  22. Taylor, T.E.; O’Dell, C.W.; Baker, D.; Bruegge, C.; Chang, A.; Chapsky, L.; Chatterjee, A.; Cheng, C.; Chevallier, F.; Crisp, D.; et al. Evaluating the Consistency between OCO-2 and OCO-3 XCO2 Estimates Derived from the NASA ACOS Version 10 Retrieval Algorithm. Atmos. Meas Tech. 2023, 16, 3173–3209. [Google Scholar] [CrossRef]
  23. Taylor, T.E.; O’Dell, C.W.; Frankenberg, C.; Partain, P.T.; Cronk, H.Q.; Savtchenko, A.; Nelson, R.R.; Rosenthal, E.J.; Chang, A.Y.; Fisher, B.; et al. Orbiting Carbon Observatory-2 (OCO-2) Cloud Screening Algorithms: Validation against Collocated MODIS and CALIOP Data. Atmos. Meas Tech. 2016, 9, 973–989. [Google Scholar] [CrossRef]
  24. Bie, N.; Lei, L.; Zeng, Z.; Cai, B.; Yang, S.; He, Z.; Wu, C.; Nassar, R. Regional Uncertainty of GOSAT XCO2 Retrievals in China: Quantification and Attribution. Atmos. Meas Tech. 2018, 11, 1251–1272. [Google Scholar] [CrossRef]
  25. Virtanen, T.H.; Sundström, A.-M.; Suhonen, E.; Lipponen, A.; Arola, A.; O’Dell, C.; Nelson, R.R.; Lindqvist, H. A Global Perspective on CO2 Satellite Observations in High AOD Conditions. Atmos. Meas Tech. 2025, 18, 929–952. [Google Scholar] [CrossRef]
  26. Mengistu, A.G.; Tsidu, G.M. On the Performance of Satellite-Based Observations of XCO2 in Capturing the NOAA Carbon Tracker Model and Ground-Based Flask Observations over Africa’s Land Mass. Atmos. Meas Tech. 2020, 13, 4009–4033. [Google Scholar] [CrossRef]
  27. Zheng, J.; Zhang, H.; Zhang, S. Comparison of Atmospheric Carbon Dioxide Concentrations Based on GOSAT, OCO-2 Observations and Ground-Based TCCON Data. Remote Sens. 2023, 15, 5172. [Google Scholar] [CrossRef]
  28. Mikkonen, A.; Lindqvist, H.; Peltoniemi, J.; Tamminen, J. Non-Lambertian Snow Surface Reflection Models for Simulated Top-of-the-Atmosphere Radiances in the NIR and SWIR Wavelengths. J. Quant. Spectrosc. Radiat. Transf. 2024, 315, 108892. [Google Scholar] [CrossRef]
  29. Kiel, M.; O’Dell, C.W.; Fisher, B.; Eldering, A.; Nassar, R.; MacDonald, C.G.; Wennberg, P.O. How Bias Correction Goes Wrong: Measurement of XCO2 Affected by Erroneous Surface Pressure Estimates. Atmos. Meas Tech. 2019, 12, 2241–2259. [Google Scholar] [CrossRef]
  30. Jacobs, N.; O’Dell, C.W.; Taylor, T.E.; Logan, T.L.; Byrne, B.; Kiel, M.; Kivi, R.; Heikkinen, P.; Merrelli, A.; Payne, V.H.; et al. The Importance of Digital Elevation Model Accuracy in XCO2 Retrievals: Improving the Orbiting Carbon Observatory 2 Atmospheric Carbon Observations from Space Version 11 Retrieval Product. Atmos. Meas Tech. 2024, 17, 1375–1401. [Google Scholar] [CrossRef]
  31. Kataoka, F.; Crisp, D.; Taylor, T.E.; O’Dell, C.W.; Kuze, A.; Shiomi, K.; Suto, H.; Bruegge, C.; Schwandner, F.M.; Rosenberg, R.; et al. The Cross-Calibration of Spectral Radiances and Cross-Validation of CO2 Estimates from GOSAT and OCO-2. Remote Sens. 2017, 9, 1158. [Google Scholar] [CrossRef]
  32. Kong, Y.; Chen, B.; Measho, S. Spatio-Temporal Consistency Evaluation of XCO2 Retrievals from GOSAT and OCO-2 Based on TCCON and Model Data for Joint Utilization in Carbon Cycle Research. Atmosphere 2019, 10, 354. [Google Scholar] [CrossRef]
  33. Liang, A.; Gong, W.; Han, G.; Xiang, C. Comparison of Satellite-Observed XCO2 from GOSAT, OCO-2, and Ground-Based TCCON. Remote Sens. 2017, 9, 1033. [Google Scholar] [CrossRef]
  34. Yoshida, Y.; Kikuchi, N.; Morino, I.; Uchino, O.; Oshchepkov, S.; Bril, A.; Saeki, T.; Schutgens, N.; Toon, G.C.; Wunch, D.; et al. Improvement of the Retrieval Algorithm for GOSAT SWIR XCO2 and XCH4 and Their Validation Using TCCON Data. Atmos. Meas Tech. 2013, 6, 1533–1547. [Google Scholar] [CrossRef]
  35. Fang, J.; Chen, B.; Zhang, H.; Dilawar, A.; Guo, M.; Liu, C.; Liu, S.; Gemechu, T.M.; Zhang, X. Global Evaluation and Intercomparison of XCO2 Retrievals from GOSAT, OCO-2, and TANSAT with TCCON. Remote Sens. 2023, 15, 5073. [Google Scholar] [CrossRef]
  36. Chen, Y.; Cheng, J.; Song, X.; Liu, S.; Sun, Y.; Yu, D.; Fang, S. Global-Scale Evaluation of XCO2 Products from GOSAT, OCO-2 and CarbonTracker Using Direct Comparison and Triple Collocation Method. Remote Sens. 2022, 14, 5635. [Google Scholar] [CrossRef]
  37. Friedlingstein, P.; Jones, M.W.; O’Sullivan, M.; Andrew, R.M.; Bakker, D.C.E.; Hauck, J.; Le Quéré, C.; Peters, G.P.; Peters, W.; Pongratz, J.; et al. Global Carbon Budget 2021. Earth Syst. Sci. Data 2022, 14, 1917–2005. [Google Scholar] [CrossRef]
  38. Peiro, H.; Crowell, S.; Schuh, A.; Baker, D.F.; O’Dell, C.; Jacobson, A.R.; Chevallier, F.; Liu, J.; Eldering, A.; Crisp, D.; et al. Four Years of Global Carbon Cycle Observed from the Orbiting Carbon Observatory 2 (OCO-2) Version 9 and in Situ Data and Comparison to OCO-2 Version 7. Atmos. Chem. Phys. 2022, 22, 1097–1130. [Google Scholar] [CrossRef]
  39. Byrne, B.; Baker, D.F.; Basu, S.; Bertolacci, M.; Bowman, K.W.; Carroll, D.; Chatterjee, A.; Chevallier, F.; Ciais, P.; Cressie, N.; et al. National CO2 Budgets (2015–2020) Inferred from Atmospheric CO2 Observations in Support of the Global Stocktake. Earth Syst. Sci. Data 2023, 15, 963–1004. [Google Scholar] [CrossRef]
  40. Zhang, H.; Chen, B.; Xu, G.; Yan, J.; Che, M.; Chen, J.; Fang, S.; Lin, X.; Sun, S. Comparing Simulated Atmospheric Carbon Dioxide Concentration with GOSAT Retrievals. Sci. Bull. 2015, 60, 380–386. [Google Scholar] [CrossRef]
  41. Gaubert, B.; Stephens, B.B.; Basu, S.; Chevallier, F.; Deng, F.; Kort, E.A.; Patra, P.K.; Peters, W.; Rödenbeck, C.; Saeki, T.; et al. Global Atmospheric CO2 Inverse Models Converging on Neutral Tropical Land Exchange, but Disagreeing on Fossil Fuel and Atmospheric Growth Rate. Biogeosciences 2019, 16, 117–134. [Google Scholar] [CrossRef]
  42. Metz, E.-M.; Vardag, S.N.; Basu, S.; Jung, M.; Butz, A. Seasonal and Interannual Variability in CO2 Fluxes in Southern Africa Seen by GOSAT. Biogeosciences 2025, 22, 555–584. [Google Scholar] [CrossRef]
  43. Müller, A.; Tanimoto, H.; Sugita, T.; Machida, T.; Nakaoka, S.; Patra, P.K.; Laughner, J.; Crisp, D. New Approach to Evaluate Satellite-Derived XCO2 over Oceans by Integrating Ship and Aircraft Observations. Atmos. Chem. Phys. 2021, 21, 8255–8271. [Google Scholar] [CrossRef]
  44. National Institute for Environmental Studies (NIES). Release Note of Bias-corrected FTS SWIR Level 2 CO2 Product (V03.05) for General Users. Available online: https://data2.gosat.nies.go.jp/GosatDataArchiveService/doc/GU/ReleaseNote_FTSSWIRL2_BiasCorrCO2_V03.05_GU_en.pdf (accessed on 15 August 2024).
  45. GOSAT Website. Available online: https://data2.gosat.nies.go.jp/ (accessed on 15 August 2024).
  46. OCO-2/OCO-3 Science Team; Payne, V.; Chatterjee, A. OCO-2 Level 2 Bias-Corrected XCO2 and Other Select Fields from the Full-Physics Retrieval Aggregated as Daily Files, Retrospective Processing V11.1r; Goddard Earth Sciences Data and Information Services Center (GES DISC): Greenbelt, MD, USA. [CrossRef]
  47. OCO-2/OCO-3 Science Team; Payne, V.; Chatterjee, A. User Guide OCO-2 V11.1r. Available online: https://docserver.gesdisc.eosdis.nasa.gov/public/project/OCO/OCO2_V11.1_OCO3_V10_L2_Data_Users_Guide_v3.0_RevA.pdf (accessed on 12 July 2025).
  48. Jacobson, A.R.; Schuldt, K.N.; Tans, P.; Andrews, A.; Miller, J.B.; Oda, T.; Basu, S.; Mund, J.; Weir, B.; Ott, L.; et al. CarbonTracker CT-NRT.v2024-1. 2024. Available online: https://doi.org/10.15138/3RE5-3Y28 (accessed on 5 September 2024).
  49. Jacobson, A.R.; Schuldt, K.N.; Tans, P.; Andrews, A.; Miller, J.B.; Oda, T.; Basu, S.; Mund, J.; Weir, B.; Ott, L.; et al. CarbonTracker Documentation CT2022 Release. 2023. Available online: https://www.gml.noaa.gov/ccgg/carbontracker/CT2022_doc.pdf (accessed on 5 September 2024).
  50. TCCON Data Archive. Available online: https://tccondata.org/ (accessed on 15 August 2024).
  51. Morino, I.; Velazco, V.A.; Hori, A.; Uchino, O.; Griffith, D.W.T. TCCON Data from Burgos, Ilocos Norte (PH), Release GGG2020.R0. 2022. Available online: https://doi.org/10.14291/tccon.ggg2020.burgos01.R0 (accessed on 15 August 2024).
  52. Wennberg, P.O.; Roehl, C.M.; Wunch, D.; Blavier, J.-F.; Toon, G.C.; Allen, N.T.; Treffers, R.; Laughner, J. TCCON Data from Caltech (US), Release GGG2020.R0. 2022. Available online: https://doi.org/10.14291/tccon.ggg2020.pasadena01.R0 (accessed on 15 August 2024).
  53. Deutscher, N.M.; Griffith, D.W.T.; Paton-Walsh, C.; Velazco, V.A.; Wennberg, P.O.; Blavier, J.-F.; Washenfelder, R.A.; Yavin, Y.; Keppel-Aleks, G.; Toon, G.C.; et al. TCCON Data from Darwin (AU), Release GGG2020.R0. 2023. Available online: https://doi.org/10.14291/tccon.ggg2020.darwin01.R0 (accessed on 15 August 2024).
  54. Wunch, D.; Mendonca, J.; Colebatch, O.; Allen, N.T.; Blavier, J.-F.; Kunz, K.; Roche, S.; Hedelius, J.; Neufeld, G.; Springett, S.; et al. TCCON Data from East Trout Lake, SK (CA), Release GGG2020.R0. 2022. Available online: https://doi.org/10.14291/tccon.ggg2020.easttroutlake01.R0 (accessed on 15 August 2024).
  55. Iraci, L.T.; Podolske, J.R.; Roehl, C.; Wennberg, P.O.; Blavier, J.-F.; Allen, N.; Wunch, D.; Osterman, G.B. TCCON Data from Edwards (US), Release GGG2020.R0. 2022. Available online: https://doi.org/10.14291/tccon.ggg2020.edwards01.R0 (accessed on 15 August 2024).
  56. Sussmann, R.; Rettinger, M. TCCON Data from Garmisch (DE), Release GGG2020.R0. 2023. Available online: https://doi.org/10.14291/tccon.ggg2020.garmisch01.R0 (accessed on 15 August 2024).
  57. Liu, C.; Wang, W.; Sun, Y.; Shan, C. TCCON Data from Hefei (PRC), Release GGG2020.R1. 2023. Available online: https://doi.org/10.14291/tccon.ggg2020.hefei01.R1 (accessed on 15 August 2024).
  58. Weidmann, D.; Brownsword, R.; Doniki, S. TCCON Data from Harwell, Oxfordshire (UK), Release GGG2020.R0. 2023. Available online: https://doi.org/10.14291/tccon.ggg2020.harwell01.R0 (accessed on 15 August 2024).
  59. García, O.E.; Schneider, M.; Herkommer, B.; Gross, J.; Hase, F.; Blumenstock, T.; Sepúlveda, E. TCCON Data from Izana (ES), Release GGG2020.R1. 2022. Available online: https://doi.org/10.14291/tccon.ggg2020.izana01.R1 (accessed on 15 August 2024).
  60. Hase, F.; Herkommer, B.; Groß, J.; Blumenstock, T.; Kiel, M.Ä.; Dohe, S. TCCON Data from Karlsruhe (DE), Release GGG2020.R1. 2023. Available online: https://doi.org/10.14291/tccon.ggg2020.karlsruhe01.R1 (accessed on 15 August 2024).
  61. Pollard, D.F.; Robinson, J.; Shiona, H. TCCON Data from Lauder (NZ), Release GGG2020.R0. 2022. Available online: https://doi.org/10.14291/tccon.ggg2020.lauder03.R0 (accessed on 15 August 2024).
  62. Wennberg, P.O.; Wunch, D.; Roehl, C.M.; Blavier, J.-F.; Toon, G.C.; Allen, N.T. TCCON Data from Lamont (US), Release GGG2020.R0. 2022. Available online: https://doi.org/10.14291/tccon.ggg2020.lamont01.R0 (accessed on 15 August 2024).
  63. Petri, C.; Vrekoussis, M.; Rousogenous, C.; Warneke, T.; Sciare, J.; Notholt, J. TCCON Data from Nicosia (CY), Release GGG2020.R1. 2024. Available online: https://doi.org/10.14291/tccon.ggg2020.nicosia01.R1 (accessed on 15 August 2024).
  64. Buschmann, M.; Petri, C.; Palm, M.; Warneke, T.; Notholt, J. TCCON Data from Ny-ålesund, Svalbard (NO), Release GGG2020.R0. 2022. Available online: https://doi.org/10.14291/tccon.ggg2020.nyalesund01.R0 (accessed on 15 August 2024).
  65. Warneke, T.; Petri, C.; Notholt, J.; Buschmann, M. TCCON Data from Orléans (FR), Release GGG2020.R1. 2024. Available online: https://doi.org/10.14291/tccon.ggg2020.orleans01.R1 (accessed on 15 August 2024).
  66. Té, Y.; Jeseck, P.; Janssen, C. TCCON Data from Paris (FR), Release GGG2020.R0. 2022. Available online: https://doi.org/10.14291/tccon.ggg2020.paris01.R0 (accessed on 15 August 2024).
  67. Wennberg, P.O.; Roehl, C.M.; Wunch, D.; Toon, G.C.; Blavier, J.-F.; Washenfelder, R.; Keppel-Aleks, G.; Allen, N.T. TCCON Data from Park Falls (US), Release GGG2020.R1. 2022. Available online: https://doi.org/10.14291/tccon.ggg2020.parkfalls01.R1 (accessed on 15 August 2024).
  68. Morino, I.; Ohyama, H.; Hori, A.; Ikegami, H. TCCON Data from Rikubetsu (JP), Release GGG2020.R0. 2022. Available online: https://doi.org/10.14291/tccon.ggg2020.rikubetsu01.R0 (accessed on 15 August 2024).
  69. Kivi, R.; Heikkinen, P.; Kyrö, E. TCCON Data from Sodankylä (FI), Release GGG2020.R0. 2022. Available online: https://doi.org/10.14291/tccon.ggg2020.sodankyla01.R0 (accessed on 15 August 2024).
  70. Deutscher, N.M.; Griffith, D.W.T.; Paton-Walsh, C.; Jones, N.B.; Velazco, V.A.; Wilson, S.R.; Macatangay, R.C.; Kettlewell, G.C.; Buchholz, R.R.; Riggenbach, M.O.; et al. TCCON Data from Wollongong (AU), Release GGG2020.R0. 2023. Available online: https://doi.org/10.14291/tccon.ggg2020.wollongong01.R0 (accessed on 15 August 2024).
  71. Zhou, M.; Wang, P.; Kumps, N.; Hermans, C.; Nan, W. TCCON Data from Xianghe, China, Release GGG2020.R0. 2022. Available online: https://doi.org/10.14291/tccon.ggg2020.xianghe01.R0 (accessed on 15 August 2024).
  72. Gurney, K.R.; Law, R.M.; Denning, A.S.; Rayner, P.J.; Baker, D.; Bousquet, P.; Bruhwiler, L.; Chen, Y.-H.; Ciais, P.; Fan, S.; et al. Towards Robust Regional Estimates of CO2 Sources and Sinks Using Atmospheric Transport Models. Nature 2002, 415, 626–630. [Google Scholar] [CrossRef]
  73. CarbonTracker CT2022 Download. Available online: https://gml.noaa.gov/ccgg/carbontracker/download.php (accessed on 28 June 2025).
  74. Zhang, L.; Sun, R.; Xu, Z.; Qiao, C.; Jiang, G. Diurnal and Seasonal Variations in Carbon Dioxide Exchange in Ecosystems in the Zhangye Oasis Area, Northwest China. PLoS ONE 2015, 10, e0120660. [Google Scholar] [CrossRef]
  75. Munassar, S.; Rödenbeck, C.; Gałkowski, M.; Koch, F.-T.; Totsche, K.U.; Botía, S.; Gerbig, C. To What Extent Does the CO2 Diurnal Cycle Impact Flux Estimates Derived from Global and Regional Inversions? Atmos. Chem. Phys. 2025, 25, 639–656. [Google Scholar] [CrossRef]
  76. Crowell, S.; Baker, D.; Schuh, A.; Basu, S.; Jacobson, A.R.; Chevallier, F.; Liu, J.; Deng, F.; Feng, L.; McKain, K.; et al. The 2015–2016 Carbon Cycle as Seen from OCO-2 and the Global in Situ Network. Atmos. Chem. Phys. 2019, 19, 9797–9831. [Google Scholar] [CrossRef]
  77. Sreenivas, G.; Mahesh, P.; Subin, J.; Kanchana, A.L.; Rao, P.V.N.; Dadhwal, V.K. Influence of Meteorology and Interrelationship with Greenhouse Gases (CO2 and CH4) at a Suburban Site of India. Atmos. Chem. Phys. 2016, 16, 3953–3967. [Google Scholar] [CrossRef]
  78. Nalini, K.; Uma, K.N.; Sijikumar, S.; Tiwari, Y.K.; Ramachandran, R. Satellite- and Ground-Based Measurements of CO2 over the Indian Region: Its Seasonal Dependencies, Spatial Variability, and Model Estimates. Int. J. Remote Sens. 2018, 39, 7881–7900. [Google Scholar] [CrossRef]
  79. Wu, R.; Chen, G. Contrasting Cloud Regimes and Associated Rainfall over the South Asian and East Asian Monsoon Regions. J. Clim. 2021, 34, 3663–3681. [Google Scholar] [CrossRef]
  80. Stein, T.H.M.; Parker, D.J.; Delanoë, J.; Dixon, N.S.; Hogan, R.J.; Knippertz, P.; Maidment, R.I.; Marsham, J.H. The Vertical Cloud Structure of the West African Monsoon: A 4 Year Climatology Using CloudSat and CALIPSO. J. Geophys. Res. Atmos. 2011, 116. [Google Scholar] [CrossRef]
  81. Hao, W.M.; Liu, M.-H. Spatial and Temporal Distribution of Tropical Biomass Burning. Glob. Biogeochem. Cycle 1994, 8, 495–503. [Google Scholar] [CrossRef]
  82. Roteta, E.; Bastarrika, A.; Padilla, M.; Storm, T.; Chuvieco, E. Development of a Sentinel-2 Burned Area Algorithm: Generation of a Small Fire Database for Sub-Saharan Africa. Remote Sens. Environ. 2019, 222, 1–17. [Google Scholar] [CrossRef]
  83. Nguyen, H.M.; Wooster, M.J. Advances in the Estimation of High Spatio-Temporal Resolution Pan-African Top-down Biomass Burning Emissions Made Using Geostationary Fire Radiative Power (FRP) and MAIAC Aerosol Optical Depth (AOD) Data. Remote Sens. Environ. 2020, 248, 111971. [Google Scholar] [CrossRef]
  84. Inoue, M.; Morino, I.; Uchino, O.; Nakatsuru, T.; Yoshida, Y.; Yokota, T.; Wunch, D.; Wennberg, P.O.; Roehl, C.M.; Griffith, D.W.T.; et al. Bias Corrections of GOSAT SWIR XCO2 and XCH4 with TCCON Data and Their Evaluation Using Aircraft Measurement Data. Atmos. Meas. Tech. 2016, 9, 3491–3512. [Google Scholar] [CrossRef]
  85. Someya, Y.; Yoshida, Y. Evaluating Radiometric Responsivity Degradations of TANSO-FTS/GOSAT Using Principal Component Analysis. J. Atmos. Ocean. Technol. 2020, 37, 1877–1890. [Google Scholar] [CrossRef]
  86. Frey, M.M.; Hase, F.; Blumenstock, T.; Dubravica, D.; Groß, J.; Göttsche, F.; Handjaba, M.; Amadhila, P.; Mushi, R.; Morino, I.; et al. Long-Term Column-Averaged Greenhouse Gas Observations Using a COCCON Spectrometer at the High-Surface-Albedo Site in Gobabeb, Namibia. Atmos. Meas. Tech. 2021, 14, 5887–5911. [Google Scholar] [CrossRef]
  87. Sha, M.K.; Das, S.; Frey, M.M.; Dubravica, D.; Alberti, C.; Baier, B.C.; Balis, D.; Bezanilla, A.; Blumenstock, T.; Boesch, H.; et al. Fiducial Reference Measurements for Greenhouse Gases (FRM4GHG): Validation of Satellite (Sentinel-5 Precursor, OCO-2, and GOSAT) Missions Using the COllaborative Carbon Column Observing Network (COCCON). Remote Sens. 2025, 17, 734. [Google Scholar] [CrossRef]
  88. Frey, M.; Sha, M.K.; Hase, F.; Kiel, M.; Blumenstock, T.; Harig, R.; Surawicz, G.; Deutscher, N.M.; Shiomi, K.; Franklin, J.E.; et al. Building the COllaborative Carbon Column Observing Network (COCCON): Long-Term Stability and Ensemble Performance of the EM27/SUN Fourier Transform Spectrometer. Atmos. Meas. Tech. 2019, 12, 1513–1530. [Google Scholar] [CrossRef]
  89. Pollard, D.F.; Hase, F.; Sha, M.K.; Dubravica, D.; Alberti, C.; Smale, D. Retrievals of XCO2, XCH4 and XCO from Portable, near-Infrared Fourier Transform Spectrometer Solar Observations in Antarctica. Earth Syst. Sci. Data 2022, 14, 5427–5437. [Google Scholar] [CrossRef]
Figure 1. Locations of the TCCON sites used in this study.
Remotesensing 17 03635 g001
Figure 2. Visualization of the matching criteria for (a) Caltech and Edwards, and (b) Paris and Orléans on the Esri World Imagery map.
Remotesensing 17 03635 g002
Figure 3. (a) The boundaries of 11 TransCom land regions used to aggregate XCO2 observations for evaluation. (bl) The time series of regional monthly XCO2 for the satellite retrievals and CT assimilation from March 2022 to August 2023. (m) The highest cross-correlation between satellites and CT time series, where the colors of bars represent the corresponding best time lag. The low bars in blue and green in (m) are only used to indicate the OCO-2 and GOSAT, respectively. The TransCom land regions are abbreviated as follows: Northern American Boreal (NABO), Southern Africa (SAF), Northern Africa (NAF), Europe (EUR), Eurasia Boreal (EABO), Northern American Temperate (NATE), Eurasia Temperate (EATE), Southern American Tropical (SATR), Tropical Asia (TRAS), Southern American Temperate (SATE), Australia (AUS).
Remotesensing 17 03635 g003
Figure 4. (a) The boundaries of 11 TransCom land regions used to aggregate XCO2 differences for evaluation. (bl) The time series of regional monthly bias and standard deviation of differences for the satellite retrievals against CT assimilation from March 2022 to August 2023. (m) The averaged regional monthly bias and standard deviation of differences across the period from March 2022 to August 2023.
Remotesensing 17 03635 g004
Figure 5. Similar to Figure 3 but for the (a) 9 selected TransCom ocean regions. The TransCom ocean regions are abbreviated as follows: North Pacific (NP), North Atlantic (NA), Atlantic Tropical (AT), South Atlantic (SA), Indian Tropical (IT), East Pacific Tropical (EP), West Pacific Tropical (WP), South Pacific (SP), South Indian (SI). (bj) The time series of regional monthly XCO2 for the satellite retrievals and CT assimilation from March 2022 to August 2023. (k) The highest cross-correlation between satellites and CT time series, where the colors of bars represent the corresponding best time lag. The low bars in blue and green in (k) are only used to indicate the OCO-2 and GOSAT, respectively.
Remotesensing 17 03635 g005
Figure 6. Similar to Figure 4 but for (a) the 9 selected TransCom ocean regions. (bj) The time series of regional monthly bias and standard deviation of differences for the satellite retrievals against CT assimilation from March 2022 to August 2023. (k) The averaged regional monthly bias and standard deviation of differences across the period from March 2022 to August 2023.
Remotesensing 17 03635 g006
Figure 7. (ac) Distribution of monthly average XCO2 for CT in March, April, and May (MAM) 2022. (df) Difference in monthly average XCO2 between OCO-2 and CT (OCO2—CT) in MAM 2022. (gi) Difference in monthly average XCO2 between GOSAT and CT (GOSAT—CT) in MAM 2022.
Remotesensing 17 03635 g007
Figure 8. The same as Figure 7 but in (a,d,g) June, (b,e,h) July, and (c,f,i) August 2022.
Remotesensing 17 03635 g008
Figure 9. The same as Figure 7 but in (a,d,g) September, (b,e,h) October, and (c,f,i) November 2022.
Remotesensing 17 03635 g009
Figure 10. The same as Figure 7 but in (a,d,g) December 2022, (b,e,h) January, and (c,f,i) February 2023.
Remotesensing 17 03635 g010
Figure 11. Comparison between XCO2 of satellite observations and collected TCCON measurements from March 2022 to February 2024 for (a) OCO-2 and (b) GOSAT. The best fitted line (solid red line), the one-to-one line (dashed black line), and the ±1% bias lines (dashed red lines) are shown. “R2” represents the determination coefficient of the fitted line. The correlation coefficient (R), root mean square error (RMSE) and bias of satellite measurements are also shown. “N” indicates the number of valid matched pairs.
Remotesensing 17 03635 g011
Figure 12. Detailed information of the comparison between satellites and TCCON data for each TCCON site. The number of samples, bias, RMSE and R are shown. The TCCON stations from bottom to top are ordered by increasing magnitude of latitude, where Darwin, Wollongong and Lauder are in the SH.
Remotesensing 17 03635 g012
Figure 13. Distribution of errors relative to TCCON in (a) OCO-2 and (b) GOSAT observations, grouped by seasons. Similar to Figure 12, the TCCON stations from left to right are ordered by the increasing magnitude of latitude. Seasons with at least three matched pairs are included while those with more than ten matched pairs are marked with filled boxes. The short solid black lines within the box indicate the median values. The lower and upper boundaries of the box represent the 25th and 75th percentiles of data, respectively. The whiskers extend to the minimum and maximum values within the non-outlier range, while any data points that fall outside this range are marked individually as outliers using circles.
Remotesensing 17 03635 g013
Table 1. Information about the TCCON sites used in this study. Latitude and longitude were retained to two decimal places. Some stations may experience slight changes in latitude and longitude over time; only the current location information is listed.
SiteSite Location (Latitude, Longitude)Start DateEnd Date
Burgos [51]18.53°N, 120.65°E23 November 202224 July 2023
Caltech [52]34.14°N, 118.13°W1 January 202221 April 2024
Darwin [53]12.42°S, 130.93°E2 January 202227 December 2022
East Trout Lake [54]54.35°N, 104.99°W1 January 20222 June 2024
Edwards [55]34.96°N, 117.88°W1 January 202222 February 2024
Garmisch [56]47.48°N, 11.06°E12 January 20224 May 2023
Harwell [57]51.57°N, 1.32°W17 February 202230 June 2024
Hefei [58]31.91°N, 117.17°E2 January 202225 December 2023
Izaña [59]28.31°N, 16.50°W1 January 202230 August 2023
Karlsruhe [60]49.10°N, 8.44°E19 January 202226 June 2023
Lauder03 [61]45.04°S, 169.68°E1 January 202228 December 2023
Lamont [62]36.60°N, 97.49°W2 January 202225 February 2024
Nicosia [63]35.14°N, 33.38°E5 January 202210 May 2023
Ny-Ålesund [64]78.92°N, 11.92°E18 March 202223 July 2023
Orléans [65]47.96°N, 2.11°E10 March 202217 July 2023
Paris [66]48.85°N, 2.36°E5 January 202220 December 2023
Park Falls [67]45.94°N, 90.27°W1 January 202225 February 2024
Rikubetsu [68]43.46°N, 143.77°E27 April 202225 July 2023
Sodankylä [69]67.37°N, 26.63°E11 March 202230 May 2023
Wollongong [70]34.41°S, 150.88°E1 January 202227 June 2023
Xianghe [71]39.80°N, 116.98°E1 January 202229 May 2023
Table 2. Matching criteria for TCCON sites. The positive and negative values in the table represent the distance setting from the station, and the longitude and latitude ranges corresponding to the dashed boxes in Figure 2 are in parentheses.
SiteLatitudeLongitude
Caltech−0.7° (33.64°N), +0.3° (34.64°N)−1° (117.13°W), +1° (119.13°W)
Edwards−0.5° (34.46°N), +1.5° (36.46°N)−1° (116.88°W), +1° (118.88°W)
Paris−0.5° (48.35°N), +1.5° (50.35°N)−1° (1.36°E), +1° (3.36°E)
Orléans−1.5° (46.46°N), +0.5° (48.46°N)−1° (1.11°E), +1° (3.11°E)
The other sites±1°±1°
Disclaimer/Publisher’s Note: The statements, opinions and data contained in all publications are solely those of the individual author(s) and contributor(s) and not of MDPI and/or the editor(s). MDPI and/or the editor(s) disclaim responsibility for any injury to people or property resulting from any ideas, methods, instructions or products referred to in the content.