Article

Long-Term Spatiotemporal Relationship of Urban–Rural Gradient Between Land Surface Temperature and Nighttime Light in Representative Cities Across China’s Climate Zones

1
The Academy of Digital China, Fuzhou University, Fuzhou 350002, China
2
Key Laboratory of Ecosystem Network Observation and Modeling, Institute of Geographic and Nature Resources Research, Chinese Academy of Sciences, Beijing 100101, China
3
Changsha Ecological and Environmental Monitoring Center of Hunan Province, Changsha 410001, China
*
Author to whom correspondence should be addressed.
These authors contributed equally to this work.
Remote Sens. 2025, 17(21), 3585; https://doi.org/10.3390/rs17213585
Submission received: 5 August 2025 / Revised: 14 October 2025 / Accepted: 23 October 2025 / Published: 30 October 2025

Highlights

What are the main findings?
  • Nighttime light rose more rapidly than land surface temperature, with the strongest light–heat coupling in suburban zones and pronounced spatial heterogeneity across climate zones.
  • Light–heat relationships exhibited a distance-decay pattern, showing synchronized increases in eastern coastal cities but decoupling in plateau and arid regions.
What are the implications of the main findings?
  • The results highlight the need for climate-specific adaptation strategies that consider local climatic and geographic contexts.
  • The study provides a systematic quantification of urban–rural light–heat interactions across multiple climate zones, revealing spatial patterns previously underexplored.

Abstract

In the context of rapid urbanization, human activities have profoundly transformed urban thermal environments. However, most existing studies have focused on single cities or relatively uniform climatic contexts, and the long-term dynamics between land surface temperature (LST) and nighttime light (NTL) across urban–rural gradients in diverse climates remain insufficiently explored. This gap limits a systematic understanding of how human activities and thermal environments co-evolve under varying regional conditions. To address this gap, we selected ten representative cities spanning multiple climate zones in China. Using MODIS LST and NTL datasets from 2000 to 2020, we developed an urban–rural gradient analysis framework to systematically assess the spatiotemporal response patterns and coupling mechanisms between LST and NTL. Our findings reveal the following: (1) From 2000 to 2020, NTL exhibited a pronounced upward trend across all climate zones, most notably in the marginal tropical humid region, while LST changes were relatively moderate. (2) LST and NTL displayed power-law distributions along urban–rural transects, marked by steep declines in monocentric cities and gradual transitions in polycentric cities, with sharper thermal gradients in northern and inland areas and more gradual transitions in southern and coastal regions. (3) The long-term increase in NTL was most evident in suburban areas (0.94 nW/cm2/sr/a), surpassing that in urban cores (0.68 nW/cm2/sr/a) and rural zones (0.60 nW/cm2/sr/a), with inland cities (0.84 nW/cm2/sr/a) outpacing their coastal counterparts. Although LST changes were modest, suburban warming (0.16 ± 0.08 °C/a) was over twice that of urban and rural areas. Notably, the synergistic escalation of light and heat was most pronounced in tropical and subtropical cities. (4) Eastern coastal cities exhibited strongly synchronized rises in NTL and LST, whereas cities in the plateau, temperate semi-arid, and mid-temperate arid regions showed clear decoupling. Along urban–rural gradients, NTL–LST correlations generally weakened from urban centers to peripheries, yet coupling coordination peaked in fringe areas (mean = 0.63), underscoring pronounced spatial heterogeneity. This study advances our understanding of the spatiotemporal coupling of urban light and heat under varying climatic and urbanization contexts, offering critical insights into managing urban thermal environments.

1. Introduction

With the acceleration of global urbanization, changes in the composition and configuration of urban landscapes have markedly altered the surface energy balance. The persistent rise in land surface temperature (LST) within urban areas, termed the urban heat island (UHI) effect [1], has emerged as a critical concern in contemporary urban environmental research. Numerous studies have demonstrated that the rapid expansion of impervious surfaces, coupled with the continual loss of natural cover such as vegetation and water bodies, constitutes the principal driver of elevated LST. This process severely impacts air quality [2], energy demand [3], public health [4], ecological stability, and the frequency of extreme climatic events [5,6,7]. Thus, elucidating the mechanisms by which urbanization influences the surface thermal environment is essential for urban climate adaptation and sustainable development.
Recent advancements in remote sensing technologies have considerably advanced the monitoring of urban thermal environments. Thermal infrared-derived LST datasets quantitatively depict the spatiotemporal dynamics of urban heat and serve as foundational metrics for UHI assessments [8]. Simultaneously, nighttime light (NTL) remote sensing, which is widely employed as a proxy for urbanization levels and human activity intensity, captures the spatial distribution and intensity of anthropogenic illumination [9]. NTL data effectively capture the expansion and spatiotemporal dynamics of urban built-up areas and strongly correlate with key socioeconomic parameters, including population, GDP, and energy consumption [9,10,11,12]. Early studies employed DMSP/OLS-based regression models to estimate GDP and map global economic activity [13]. Higher-resolution sensors, notably NPP-VIIRS, have since enhanced the accuracy of socioeconomic parameter estimation and enabled rapid estimation of population density [14]. Owing to their objectivity, continuous temporal coverage, and broad spatial availability, NTL data serve as a powerful proxy where conventional statistical data are scarce or outdated.
Empirical evidence consistently underscores significant positive correlations between LST and NTL: NTL not only encapsulates patterns of human activity but also highlights spatial heterogeneity within urban thermal landscapes [15]. Correlation coefficients between NTL and LST generally range from 0 to 0.5 [16], with the strength of these correlations exhibiting an upward trend over time [17]. In megacities such as Beijing, strong linear associations (R2 > 0.85) between NTL digital number (DN) values and LST reaffirm the pronounced warming implications of urbanization [18,19]. Research in Seoul further substantiates NTL’s efficacy as a UHI indicator, reporting correlation coefficients exceeding 0.86 (p < 0.05) between NTL and surface urban heat island intensity (SUHII) [20]. However, the LST–NTL relationship is modulated by geographic constraints and sensor saturation effects. For instance, the LJ-1 sensor’s 130-m resolution permits more precise estimation of anthropogenic heat fluxes than VIIRS, thereby reducing overestimation in natural landscapes and underestimation in dense urban cores [21]. Moreover, extreme heat events intensify NTL signals through shifts in human behavior, as observed in cities such as Cairo and Delhi, adding further complexity to these dynamics [22].
Although previous studies have shown a general correlation between nighttime lights (NTL) and land surface temperature (LST), most analyses are conducted at the city scale or treat NTL as one of several explanatory factors. This approach lacks a systematic examination of their relationship under different spatial structures. The urban–rural gradient is conceptualized as a spatial continuum from urban cores to suburbs and rural areas [23,24]. It has become a key framework for understanding the UHI effect and its variations [25]. Compared to the traditional urban–rural dichotomy [26,27,28], a continuous gradient more accurately captures the complexity and nonlinear dynamics of urban systems, and also reveals critical transitions or threshold effects, offering new theoretical insights into the mechanisms of urban thermal environments [29,30]. Empirical studies consistently show that NTL intensity decreases from urban centers outward. Some researchers have used zoning methods like the concentric zone model (CZM) [31] and local climate zones (LCZ) [32] to analyze thermal variations along the gradient at finer scales. However, most studies are limited to single cities or short time spans. Our study aims to address these gaps by systematically adopting the urban–rural gradient as a unified framework to compare the spatial patterns of LST and NTL and reveal their long-term coupled evolution. This research helps clarify the distinct roles of urban cores, transition zones, and rural peripheries in shaping thermal environments, thereby improving the understanding of how human activities interact with the surface energy budget [33,34]. It also identifies high-risk areas where human activities cause thermal imbalances, providing a scientific basis for heat mitigation strategies in urban cores, ecological buffer zone planning in suburbs, and regional collaborative governance [35].
The moderating role of climatic background on urban thermal environments warrants close attention. China, situated within the East Asian monsoon region, encompasses diverse climate types ranging from the marginal tropical humid region to the mid temperate arid region. These climatic variations entail pronounced differences in natural conditions such as solar radiation, precipitation, and topography, which in turn lead to significant spatial heterogeneity in UHI intensity and its diurnal evolution [36,37]. Although cities in arid zones generally show stronger UHI effects than those in humid zones [38], with SUHII in subtropical cities reaching or even exceeding 2 °C during summer daytime [39], this pattern is not universal. In some arid cities, including Dallas, Las Vegas, and Phoenix, irrigation, water bodies, and urban vegetation alleviate desert heat, resulting in urban cool island (UCI) effects [40,41,42]. These findings suggest that UHI or UCI reflects not only climate zone but also land cover, vegetation, and water use [43]. Furthermore, the sensitivity of urban thermal responses to changes in urban morphology and land use differs markedly across climate zones [44]. However, there remains a scarcity of long-term systematic research on the interactions between urban thermal environments and human activities across different climate zones.
Addressing these research gaps, this study selects ten representative cities spanning China’s seven major climate zones. By integrating MODIS-derived land surface temperature (LST) and NPP-VIIRS nighttime light (NTL) datasets from 2000 to 2020, we construct a multi-temporal, multiscalar analytical framework to investigate: (1) the long-term spatiotemporal evolution and differentiation patterns of LST and NTL along urban–rural gradients; (2) the spatial coupling mechanisms between anthropogenic activity intensity (proxied by NTL) and surface thermal regimes throughout urbanization processes; and (3) the regulatory effects and spatial heterogeneity of urban thermal responses under distinct climatic conditions. By systematically revealing the coupled dynamics and differentiation mechanisms underpinning LST–NTL interactions, this study provides a theoretical basis and robust empirical evidence for optimizing urban thermal environments and enhancing climate resilience across diverse climate zones, thereby informing evidence-based pathways for low-carbon urban development and climate-adaptive spatial governance.

2. Materials and Methods

2.1. Study Area

China’s vast territory, diverse climatic types, and marked spatial heterogeneity in population distribution and urbanization jointly give rise to pronounced regional differences in urban thermal environments [45]. To systematically characterize the spatiotemporal dynamics of land surface temperature (LST) and nighttime light (NTL), and to clarify their coupling relationship, this study selected ten representative cities across China, stratified by climate zones and urban-scale gradients (Figure 1): the marginal tropical humid region (Guangzhou, Nanning), the northern subtropical humid region (Shanghai, Chengdu), the warm temperate semi-humid region (Tianjin, Zhengzhou), the mid temperate semi-humid region (Shenyang), the mid temperate semi-arid region (Hohhot), the plateau temperate semi-arid region (Xining), and the mid temperate arid region (Urumqi).
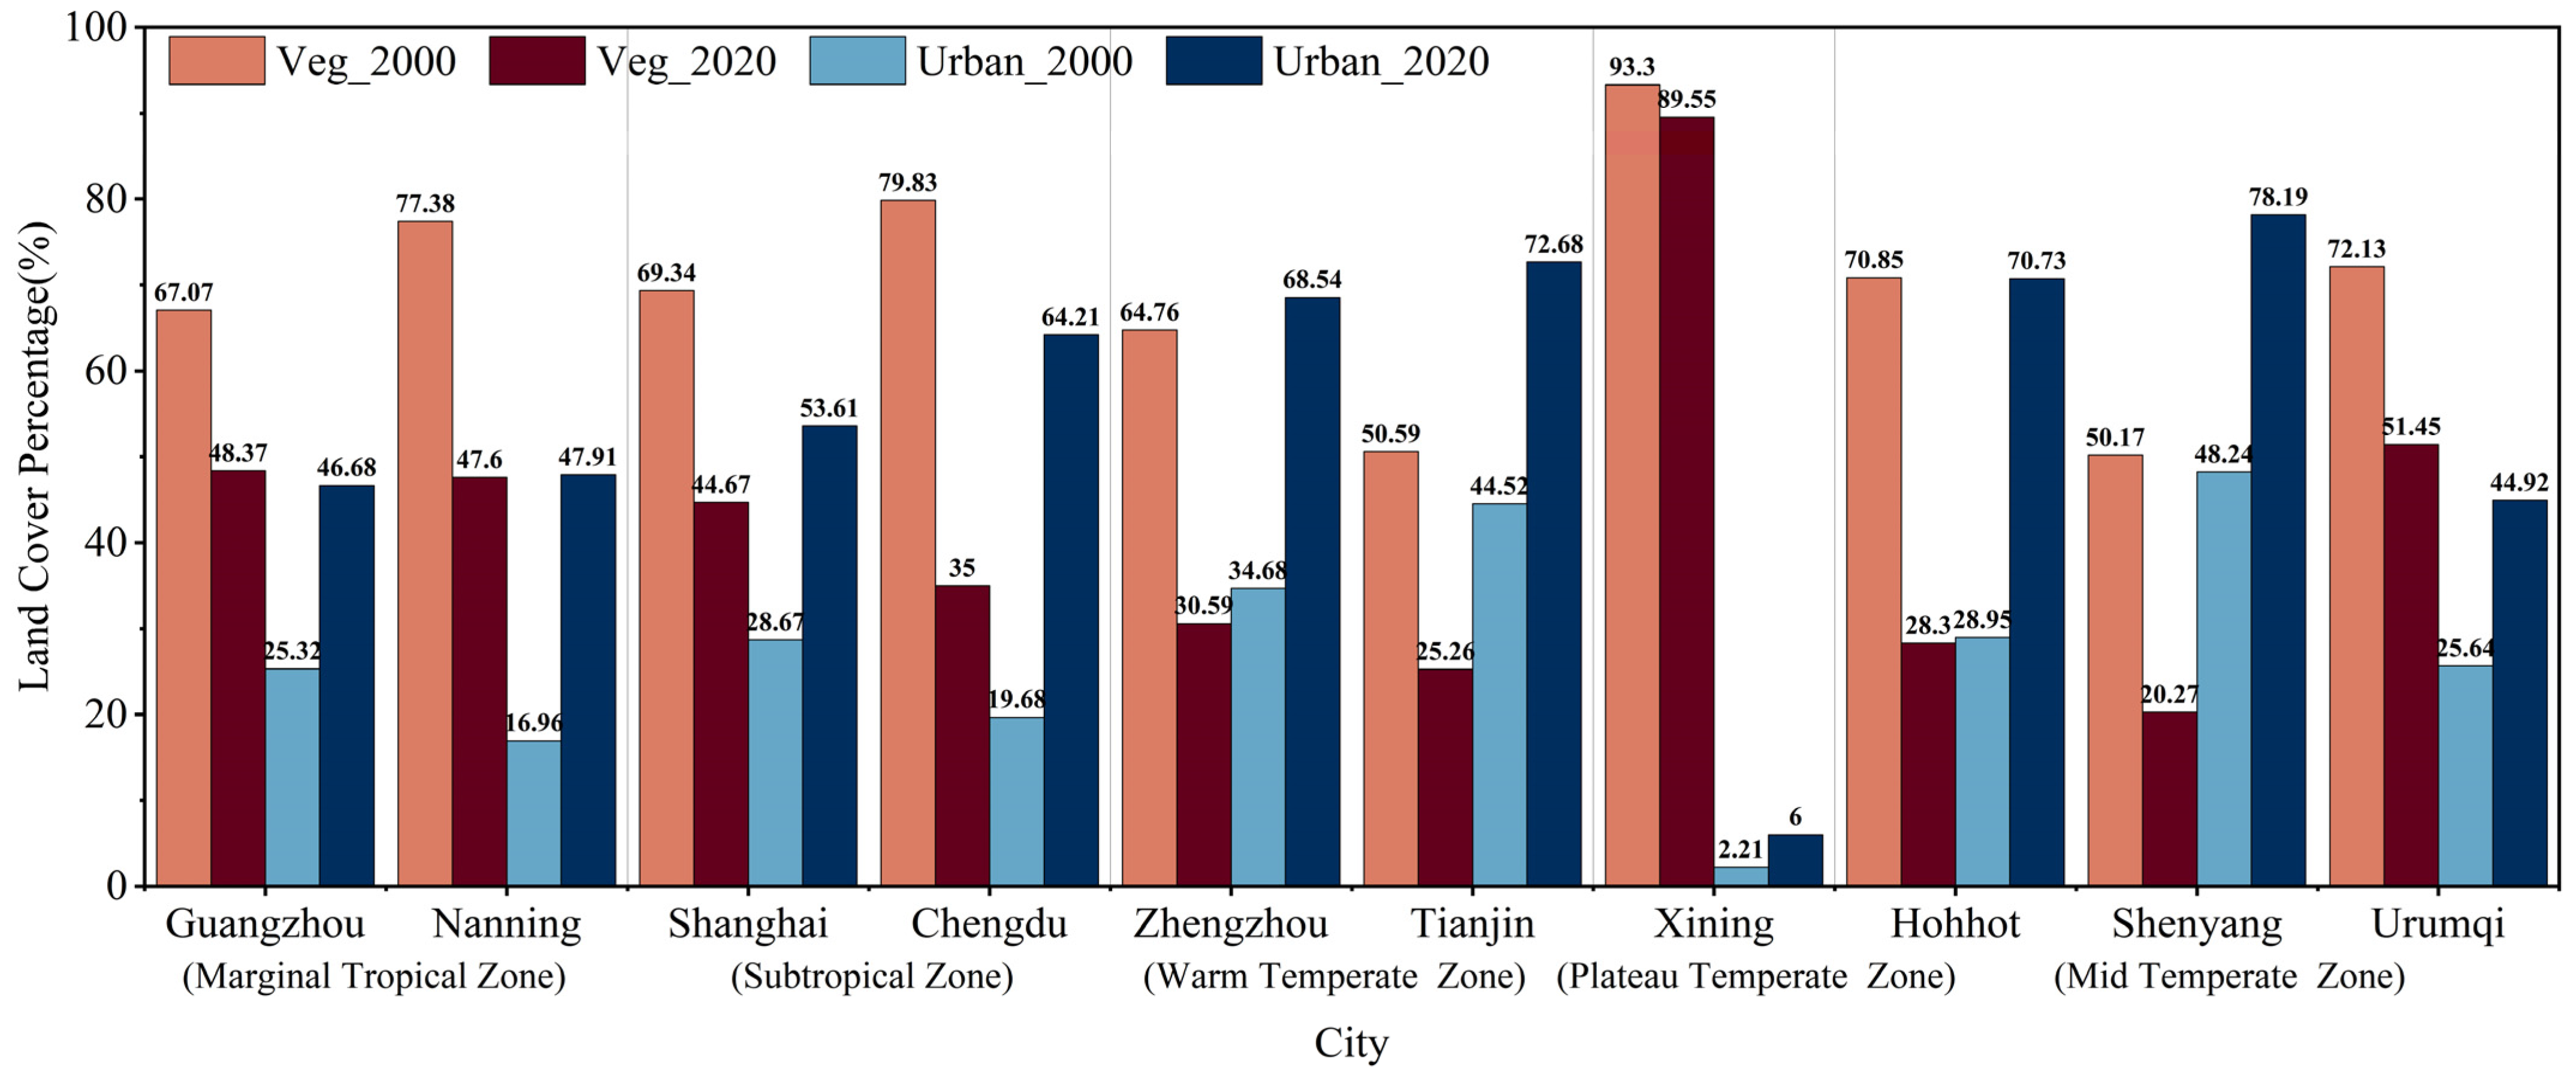
The selection of the study areas followed two principles: comprehensive climatic coverage and representative urban scale (Table 1). The chosen cities span major climate zones, ranging from the humid tropics to the mid-temperate regions and from the eastern coast to the northwestern interior, thereby capturing the influence of contrasting hydrothermal conditions on urban thermal environments. Furthermore, each city is a major metropolitan center—typically a direct-administered municipality or provincial capital—characterized by its large urban size and advanced level of urbanization within its climate zone, ensuring a strong and detectable anthropogenic signal for remote sensing-based identification and quantitative assessment. By incorporating cities of varying sizes across diverse climatic contexts, the study design disentangles the relative contributions of climate and urbanization drivers to differences in the urban thermal environment and provides a robust basis for multiscale, multifactor comparative analysis with both rigor and representativeness.

2.2. Data Sources and Processing

To ensure temporal consistency, we restricted all datasets to 2000–2020; although the original products cover longer periods, only the overlapping years were analyzed.
Land surface temperature (LST) was derived from the MOD11A2 product (1 km, 8-day composites; NASA MODIS). For each year, we calculated mean values for July–August on the Google Earth Engine (GEE), as midsummer LST best captures peak urban heat island intensity and shows the strongest correlation with nighttime light [18]. The original values were scaled by 0.02 and converted from Kelvin to Celsius.
For assessing urbanization levels, we employed the 500 m resolution “NPP-VIIRS-like” nighttime light (NTL) dataset (2000–2024) provided by the National Earth System Science Data Center http://www.geodata.cn (accessed on 12 March 2025). This dataset integrates DMSP-OLS and NPP-VIIRS through cross-sensor calibration to ensure temporal continuity. Here, only the 2000–2020 subset was used [46].
The China Land Cover Dataset (CLCD) provides annual land cover information for China from 1985 to 2020 https://doi.org/10.5281/zenodo.4417810 (accessed on 12 March 2025) [47]. We used 2000–2020 data, aggregated to 1 km grids, to calculate landscape indices and assess land cover effects on LST and NTL.
The Global Urban Boundary (GUB) dataset is derived from the long-term, high-resolution Global Artificial Impervious Area (GAIA) dataset (1990–2018) and was used to delineate urban extents more realistically than administrative boundaries http://data.ess.tsinghua.edu.cn/gub.html (accessed on 12 March 2025) [48]. In this study, we employed GUB snapshots for 2000, 2010, and 2018 to characterize different stages of urban expansion.
To reconcile differences in spatial resolution between the NTL and LST datasets, the study area was partitioned into 1-km × 1-km grid cells. Within each cell, NTL values were extracted from pixels whose centroids lay within each cell, while mean LST values were computed from all corresponding pixels. This approach standardized both datasets to a common spatial analytical unit. Subsequently, LST and NTL values were normalized using min–max normalization, as detailed by the formula below.
X = X X m i n X m a x X m i n
where X is the normalized result; X m i n and X m a x are the minimum and maximum values of LST or NTL in a given year, with normalized values ranging from 0 to 1.

2.3. Methods

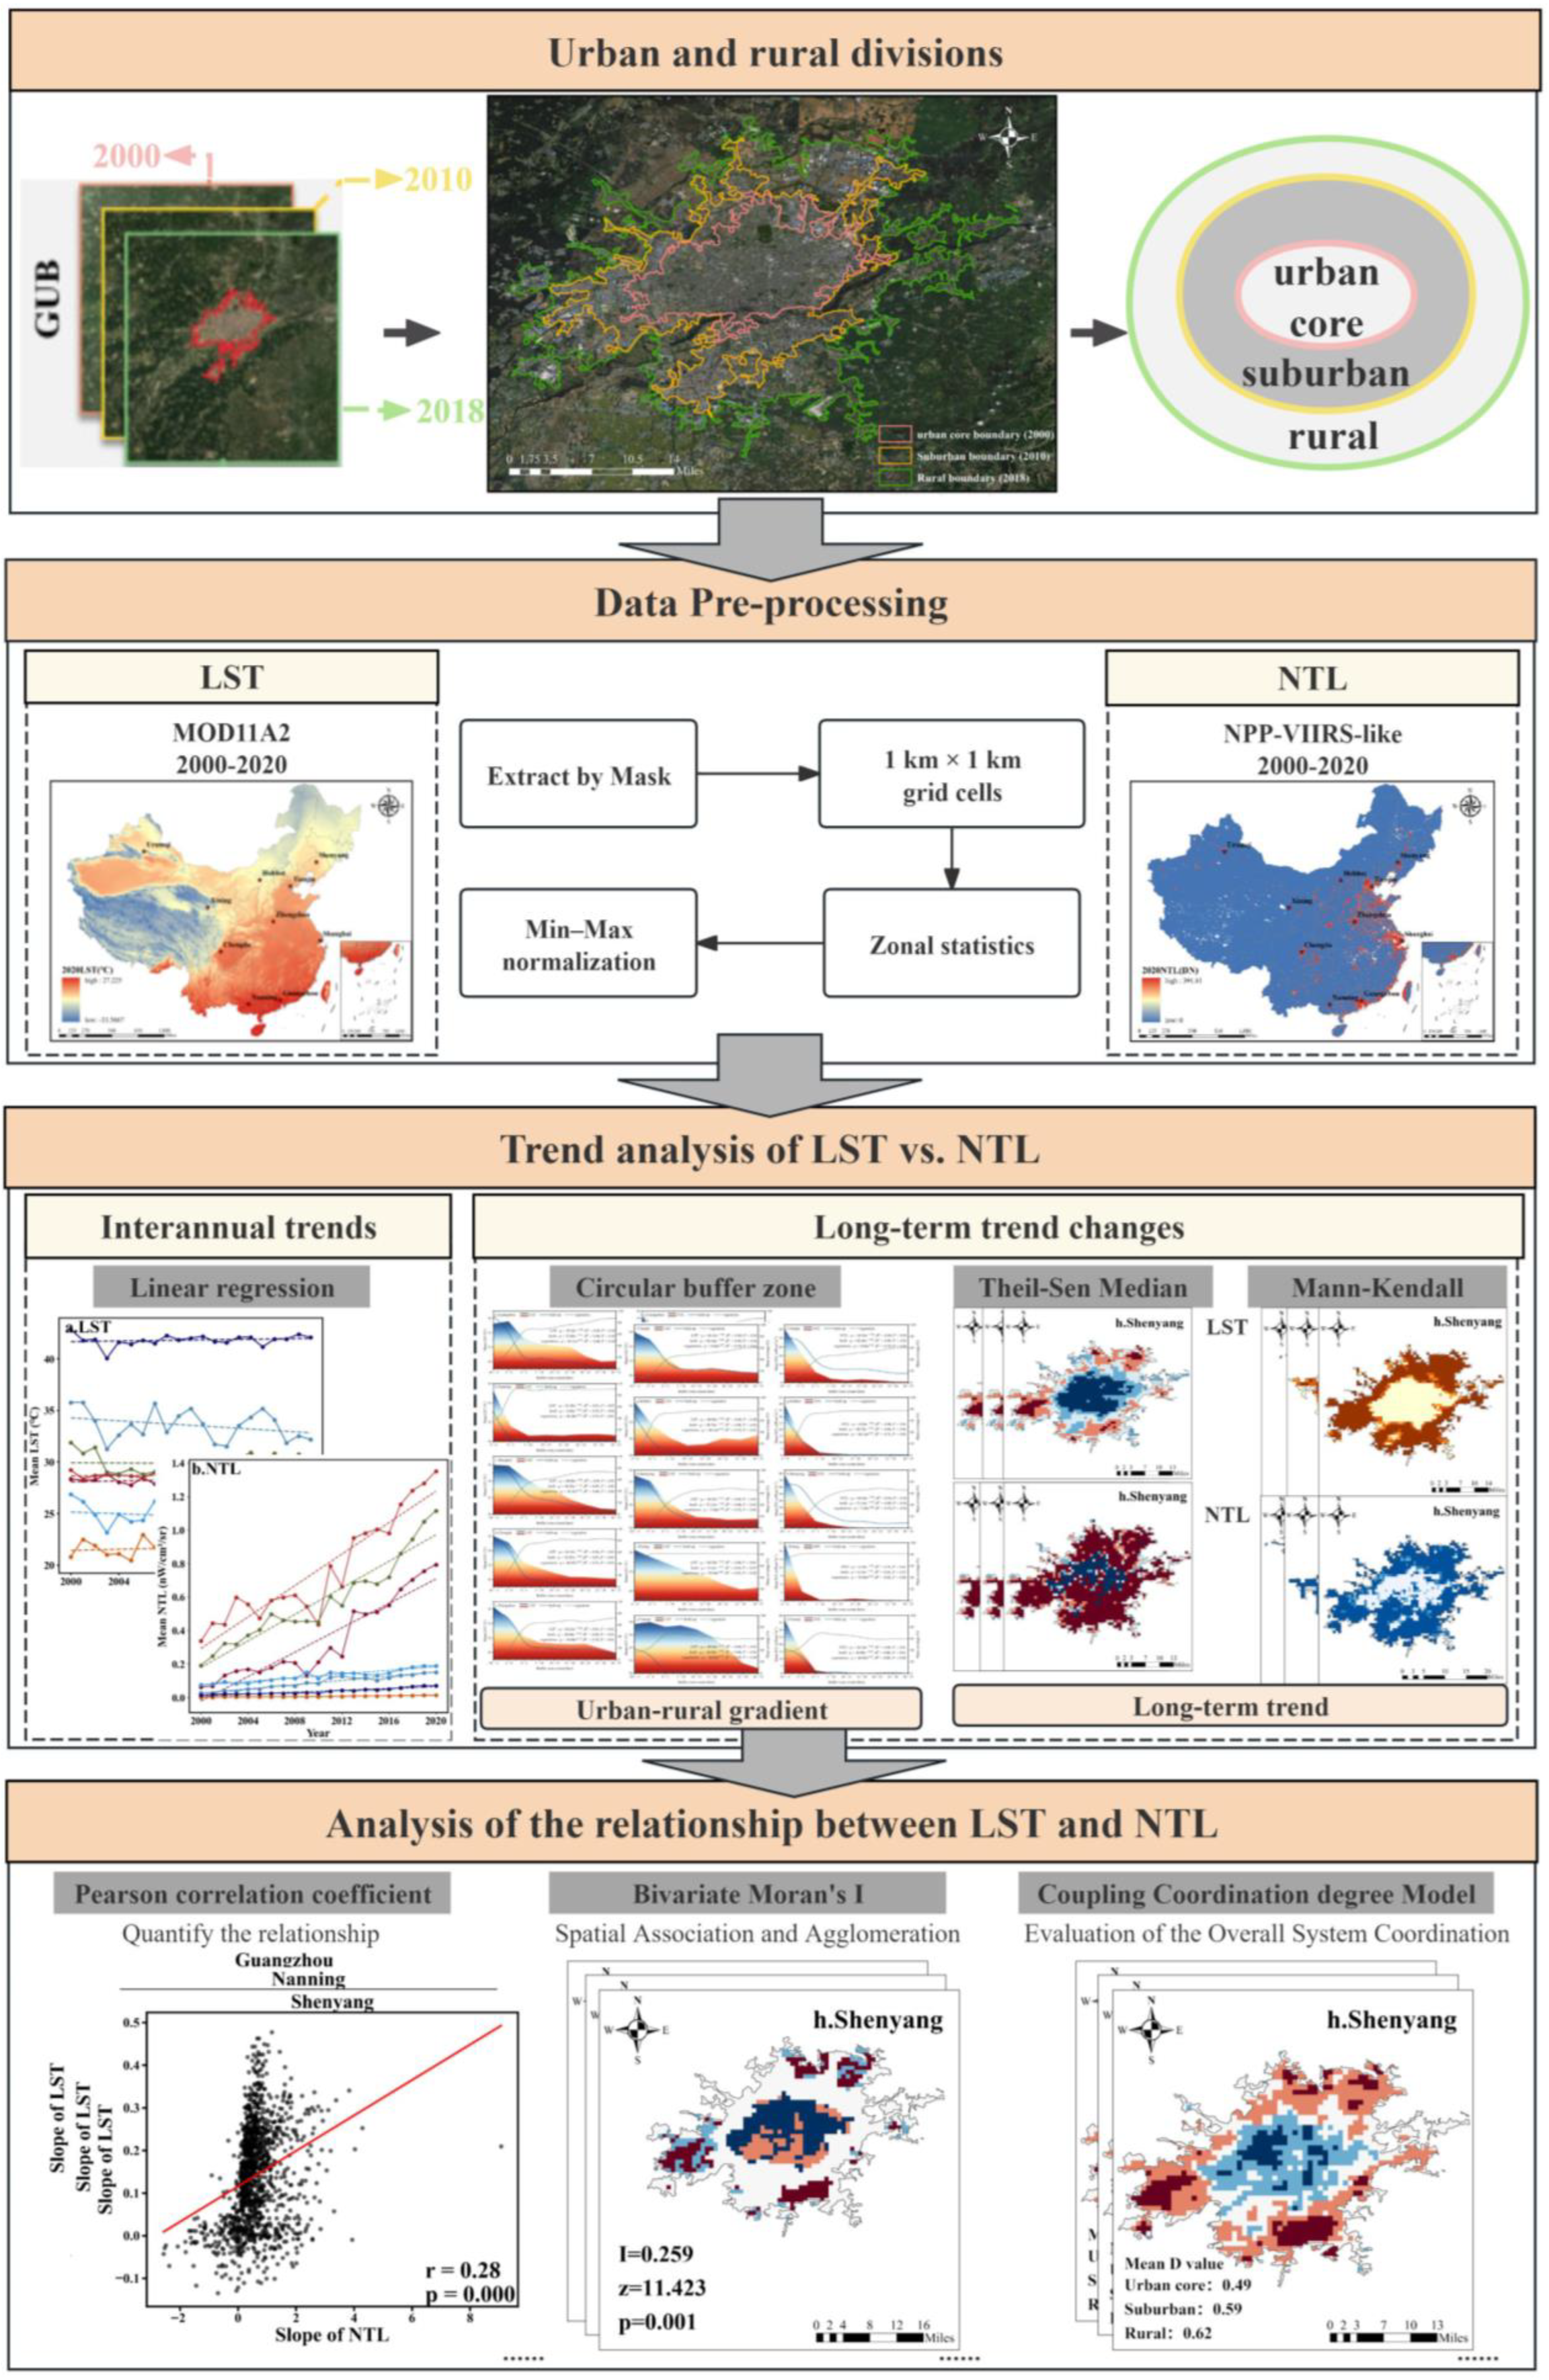
This study employed a three-step analytical framework to investigate the interaction between urbanization intensity and the land surface thermal environment along urban–rural gradients in different climate zones (Figure 2). First, we divided the study areas into urban core, suburban, and rural areas using the Global Urban Boundary (GUB) data for 2000, 2010, and 2018. Then, we calculated the interannual trends and multi-year average change rates of nighttime light (NTL, derived from NPP-VIIRS-like data) and land surface temperature (LST, from MOD11A2). A concentric buffer method was used to examine their spatial transition patterns along the urban–rural gradient. Finally, the long-term trends of LST and NTL were analyzed using the Theil–Sen median estimator and Mann–Kendall significance test. Furthermore, their correlation, spatial clustering, and coordination were quantitatively evaluated by integrating Pearson correlation, bivariate Moran’s I index, and a coupling coordination degree model.

2.3.1. Urban and Rural Divisions

Drawing on Global Urban Boundary (GUB) datasets from 2000, 2010, and 2018, we delineated areas according to their degree of urbanization (Figure 3) [49]: urban core (pixels within the 2000 GUB), suburban belt (the annulus between the 2000 and 2010 GUB datasets), and rural candidates (the annulus between the 2010 and 2018 GUB datasets). We then refined the rural class by the change in impervious surface from 2010 to 2018; areas with a <30% increase were retained as rural, thereby excluding sectors with substantial urban expansion [50].
I S A ¯ = I S A 2018 I S A 2010
where I S A 2018 and I S A 2010 are the percent impervious surface in 2018 and 2010, respectively.

2.3.2. Gradient Analysis

To examine the spatial disparities and trends of LST and NTL between urban and rural environments, this study employed an urban–rural gradient analysis. Initially, the interannual variations in LST and NTL across the study area were assessed. Subsequently, spatial differences between urban and rural zones were investigated. To capture the gradient characteristics from urban cores through suburban to rural regions, multiple concentric buffer zones were established by incrementally expanding inward and outward from the urban boundary at 5 km intervals [51]. The buffer zones were defined as radial distance bins from the urban boundary. Negative values (e.g., −10 to −5 km and −5 to 0 km) indicate inner buffers located within the urban core, while positive values (e.g., 0–5 km and 5–10 km) correspond to outward buffers extending into suburban and rural areas. The annual mean values of LST and NTL within each buffer zone were then calculated, thereby facilitating a nuanced understanding of their spatial relationship and providing a robust basis for interpreting urbanization-induced thermal and illumination patterns.

2.3.3. Trend Analysis

To detect long-term trends of LST and NTL during 2000–2020, we applied the Theil–Sen median slope estimator together with the Mann–Kendall (MK) significance test. This non-parametric framework is robust to outliers and does not assume data normality [52,53].
The Theil–Sen estimator computes the slope as the median of all pairwise slopes in the time series:
β = m e d i a n x j x i j i               ( 1 i < j n )
where β > 0 indicates an upward trend and β < 0 denotes a downward trend.
The MK test evaluates significance by calculating the statistic S:
S = i = 1 n 1 j = i + 1 n s g n ( x j x i )
s g n ( x ) = 1                 x > 0 0                 x = 0 1           x < 0
Based on the S-value and its variance, the standardized statistic Z can be further calculated:
Z = S 1 V a r ( S )       S > 0 0                                     S = 0 S + 1 V a r ( S )       S < 0
A trend is significant at the 95% confidence level when |Z| > 1.96.

2.3.4. Correlation Analysis

The Pearson correlation coefficient (PCC) was applied to quantify the linear correlation between LST and NTL trends.

2.3.5. Spatial Autocorrelation

In this study, we applied bivariate Moran’s I to examine spatial dependence between the long-term trends of LST and NTL, implemented in OpenGeoDa [54].
The bivariate global Moran’s I was applied to evaluate the spatial response of LST to NTL:
I = i = 1 n j = 1 n W i j ( x i x ¯ ) ( y i y ¯ ) S 2 i = 1 n j = 1 n W i j
where I is the bivariate global spatial autocorrelation index; n is the total number of spatial cells; W i j is the element of the spatial weight matrix constructed based on the K-nearest neighbor criterion; x i and y i are the observed values of the variables in spatial cells i and j, respectively; and S is the bivariate standardized covariance term.
The bivariate local Moran’s I was employed to identify localized spatial associations:
I i = ( x i x ¯ ) j = 1 n w i j ( y i y ¯ )
where I i quantifies the local spatial relationship between the independent variable at unit i and the dependent variable at neighboring units j, while x i and y i are variance-standardized values. Based on the local indicators of spatial association (LISA), four clustering types can be distinguished: HH (High-High), LL (Low-Low), LH (Low-High), and HL (High-Low).

2.3.6. Coupling Coordination Analysis

The coupling coordination degree model (CCDM) was employed in this study to quantitatively assess the degree of synchronized development between urban expansion, represented by NTL, and LST dynamics [55,56]. The model includes coupling degree (C), coordination index (T), and coupling coordination degree (D):
C = 2 U 1 U 2 U 1 + U 2
T = α U 1 + β U 2
D = C × T
where U 1 and U 2 represent the trend level of NTL and LST, (scaled within [0, 1]). In this study, C represents the interaction strength between urban expansion (NTL) and thermal environment dynamics (LST); T reflects their integrated development level; and D combines both to quantify the degree of coordinated evolution. Following the principle of equal contribution, coefficients were set as α = β = 0.5, assigning equal weights to the contributions of NTL and LST.

3. Results

3.1. Trend Analysis of LST vs. NTL

3.1.1. Interannual Trends of Climate Zones in China

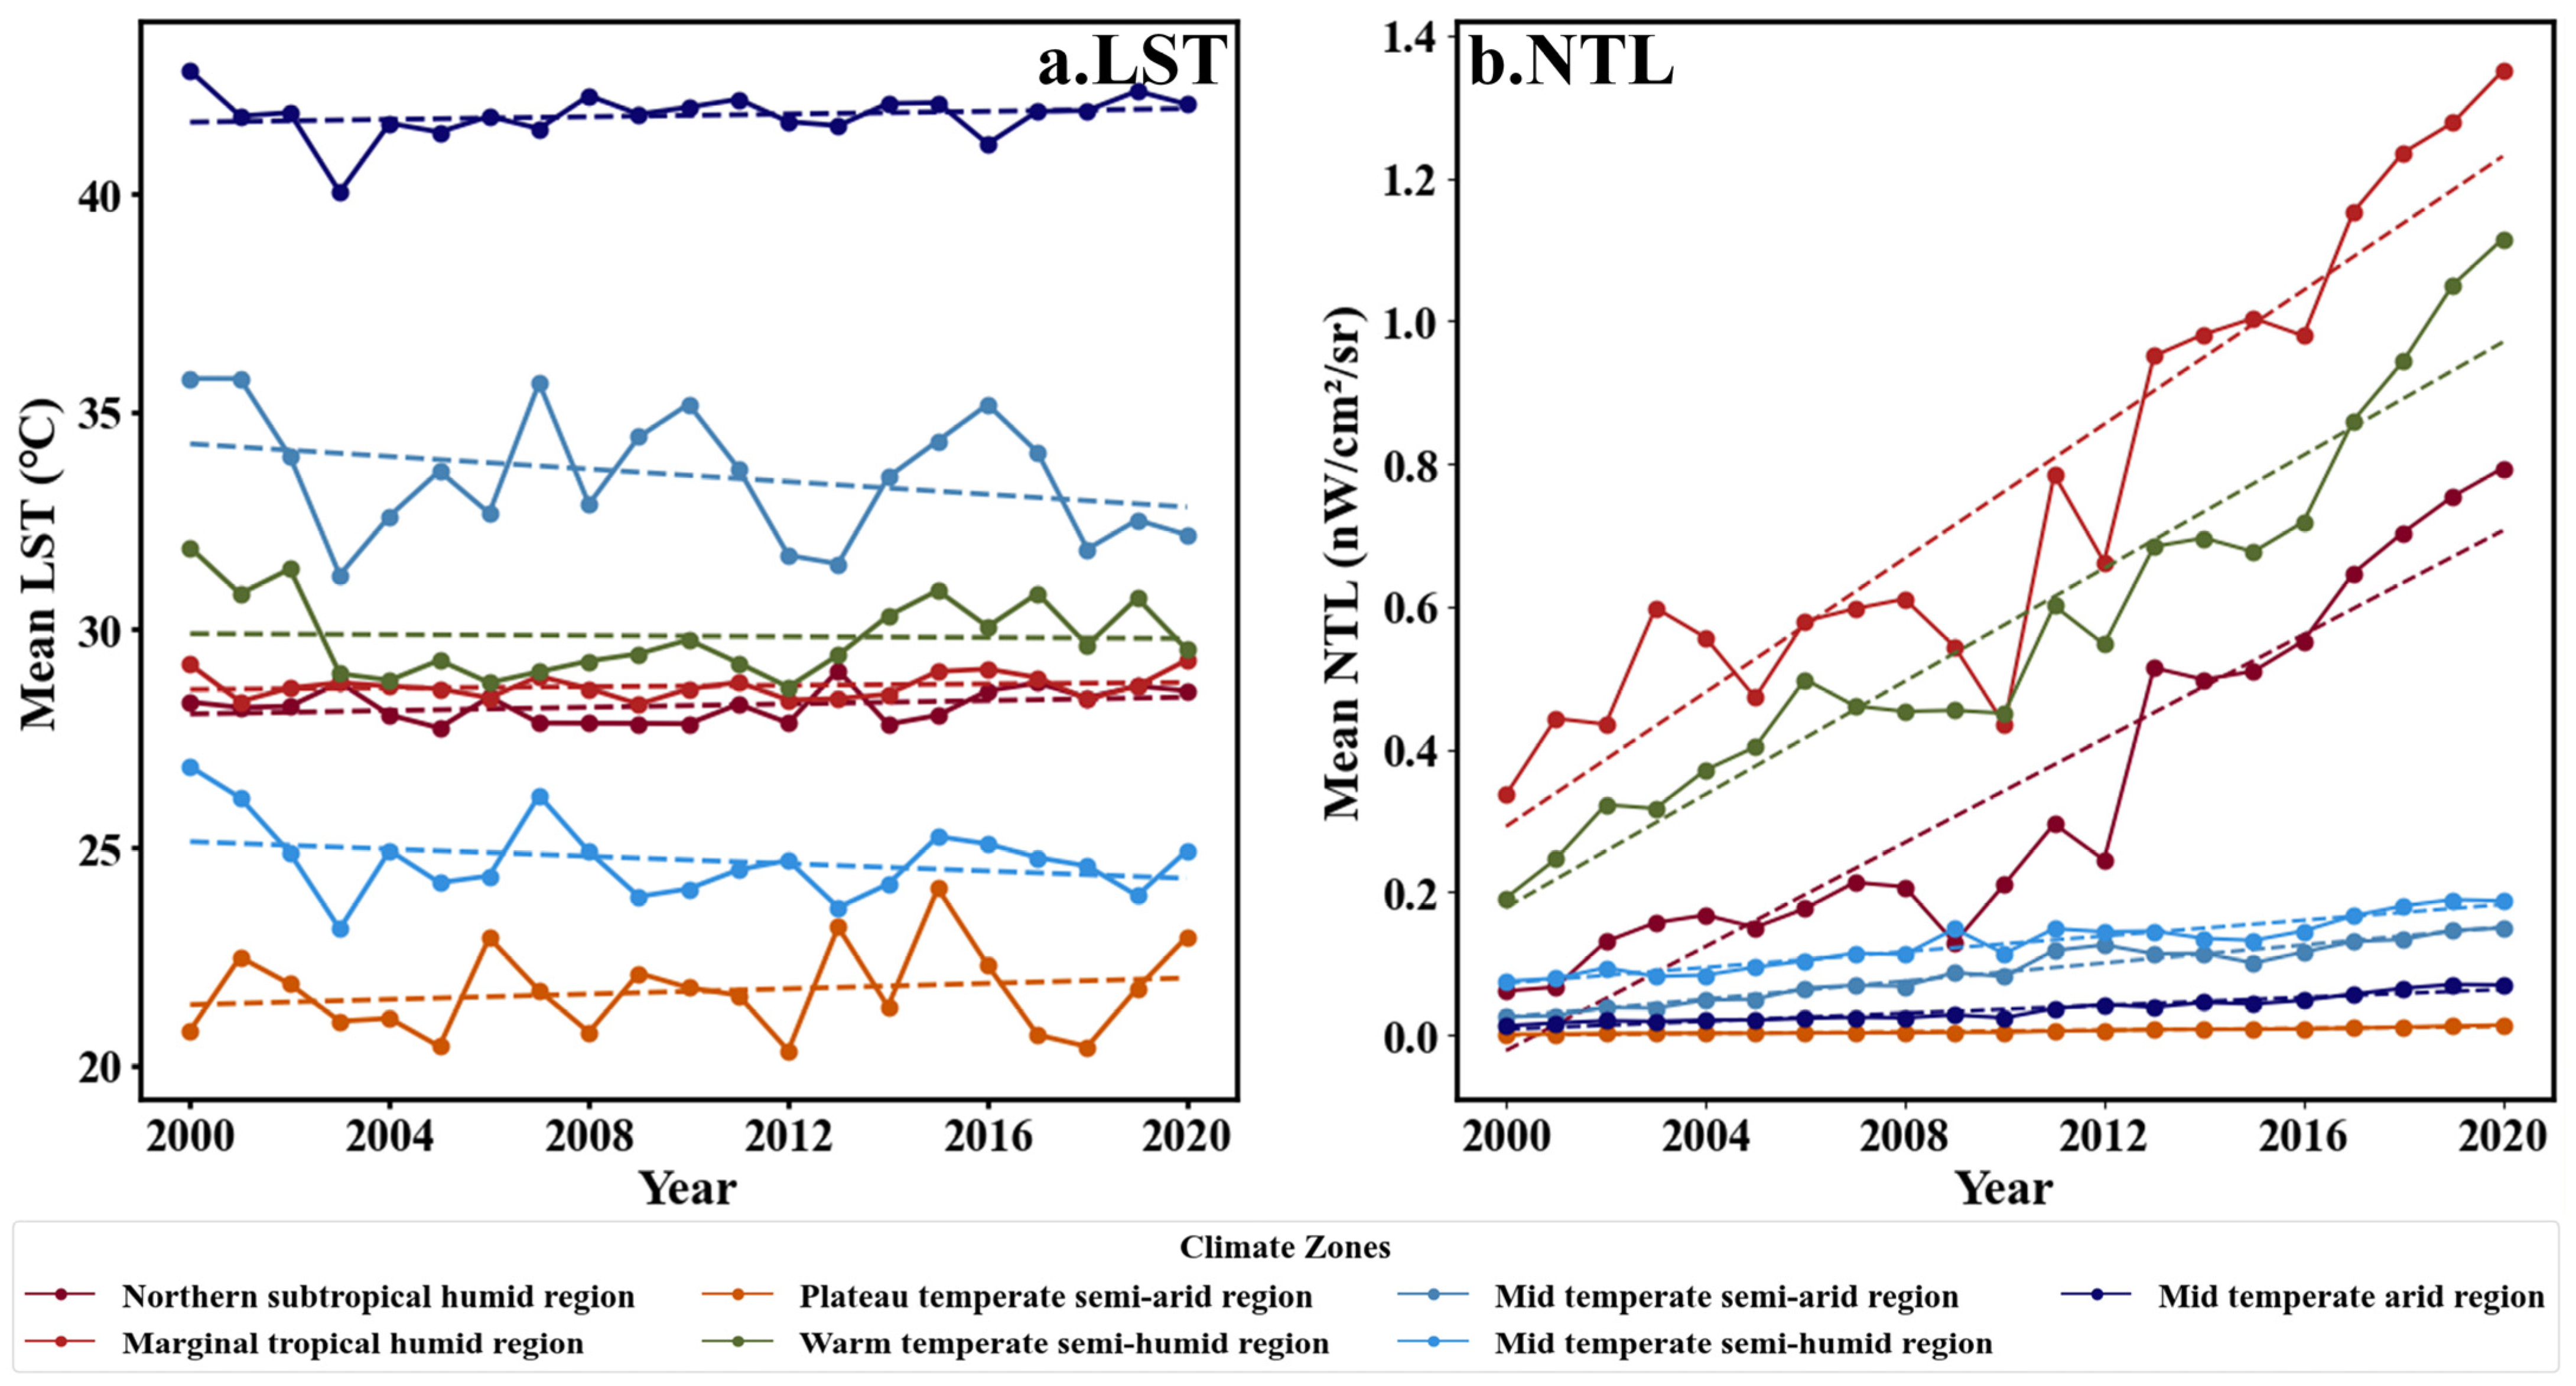
During 2000–2020, nighttime light (NTL) across China’s climate zones showed a consistently increasing trend (Table 2; Figure 4), with coefficients of determination (R2) generally exceeding 0.86. Notably, the mid temperate semi-arid region (R2 = 0.939) and the plateau temperate semi-arid region (R2 = 0.919) exhibited the highest temporal consistency, underscoring the sustained progression of urbanization-driven human activities. However, these climate zones also displayed markedly different interannual growth rates of NTL. Southern climate zones, such as the northern subtropical humid region, recorded an average annual NTL growth rate of 17.99%, substantially outpacing that of the mid temperate semi-humid region (5.16%) and the mid temperate arid region (9.86%) in mid- to high-latitude areas. This disparity indicates a faster urbanization process in southern China, likely driven by higher population densities, stronger economic activity, and advanced infrastructure development.
In contrast, land surface temperature (LST) showed weaker and more complex temporal patterns, with R2 values falling below 0.10 across all climate zones, suggesting a highly nonlinear and region-specific evolution. Among these, the plateau temperate semi-arid region experienced the most pronounced warming, with an average annual LST increase of 0.73%, reflecting the amplifying influence of plateau topography on local climate warming. Conversely, the warm temperate semi-humid region displayed the strongest cooling trend, with an average annual LST decrease of 0.41%, indicating that urban heat mitigation measures or extensive green space construction in this region may have contributed to local temperature moderation. Meanwhile, the marginal tropical humid region and the northern subtropical humid region experienced slight warming, with mean annual LST increases of 0.03% and 0.06%, respectively, whereas the remaining climate zones showed negative LST trends. Such spatial variations are likely influenced by regional climatic baselines, surface cover types, and differences in urban thermal regulation capacity.
The asynchronous dynamics of NTL and LST highlight a coupled yet temporally lagged relationship between urban development and thermal environmental responses. NTL, as a sensitive indicator of urban functional expansion and human activity intensity, increased rapidly and consistently, whereas LST, as an integrative ecological feedback metric, responded more slowly and cumulatively. This pattern of a “fast variable” (NTL) alongside a “slow variable” (LST) was especially evident in the warm temperate and mid temperate regions. For instance, in 2015, NTL declined across most climate zones (with a maximum reduction of 11.81%), while LST increased simultaneously, reaching a peak annual rise of 12.71%. Such dynamic asymmetry underscores the temporal lag between urban expansion and thermal responses, warranting deeper investigation into the mechanisms of urban–environment interactions.

3.1.2. Trends in Spatial Urban–Rural Gradient

Building on the macro-scale interannual trends of land surface temperature (LST) and nighttime light (NTL), and in order to further reveal the differences and regularities in their spatial distribution within cities, this study selects ten typical cities in China’s climate zones, and combines the spatial gradient analysis and urban–rural contouring methods to systematically analyze the spatial evolution trends of LST and NTL along the urban–suburban–rural axis.
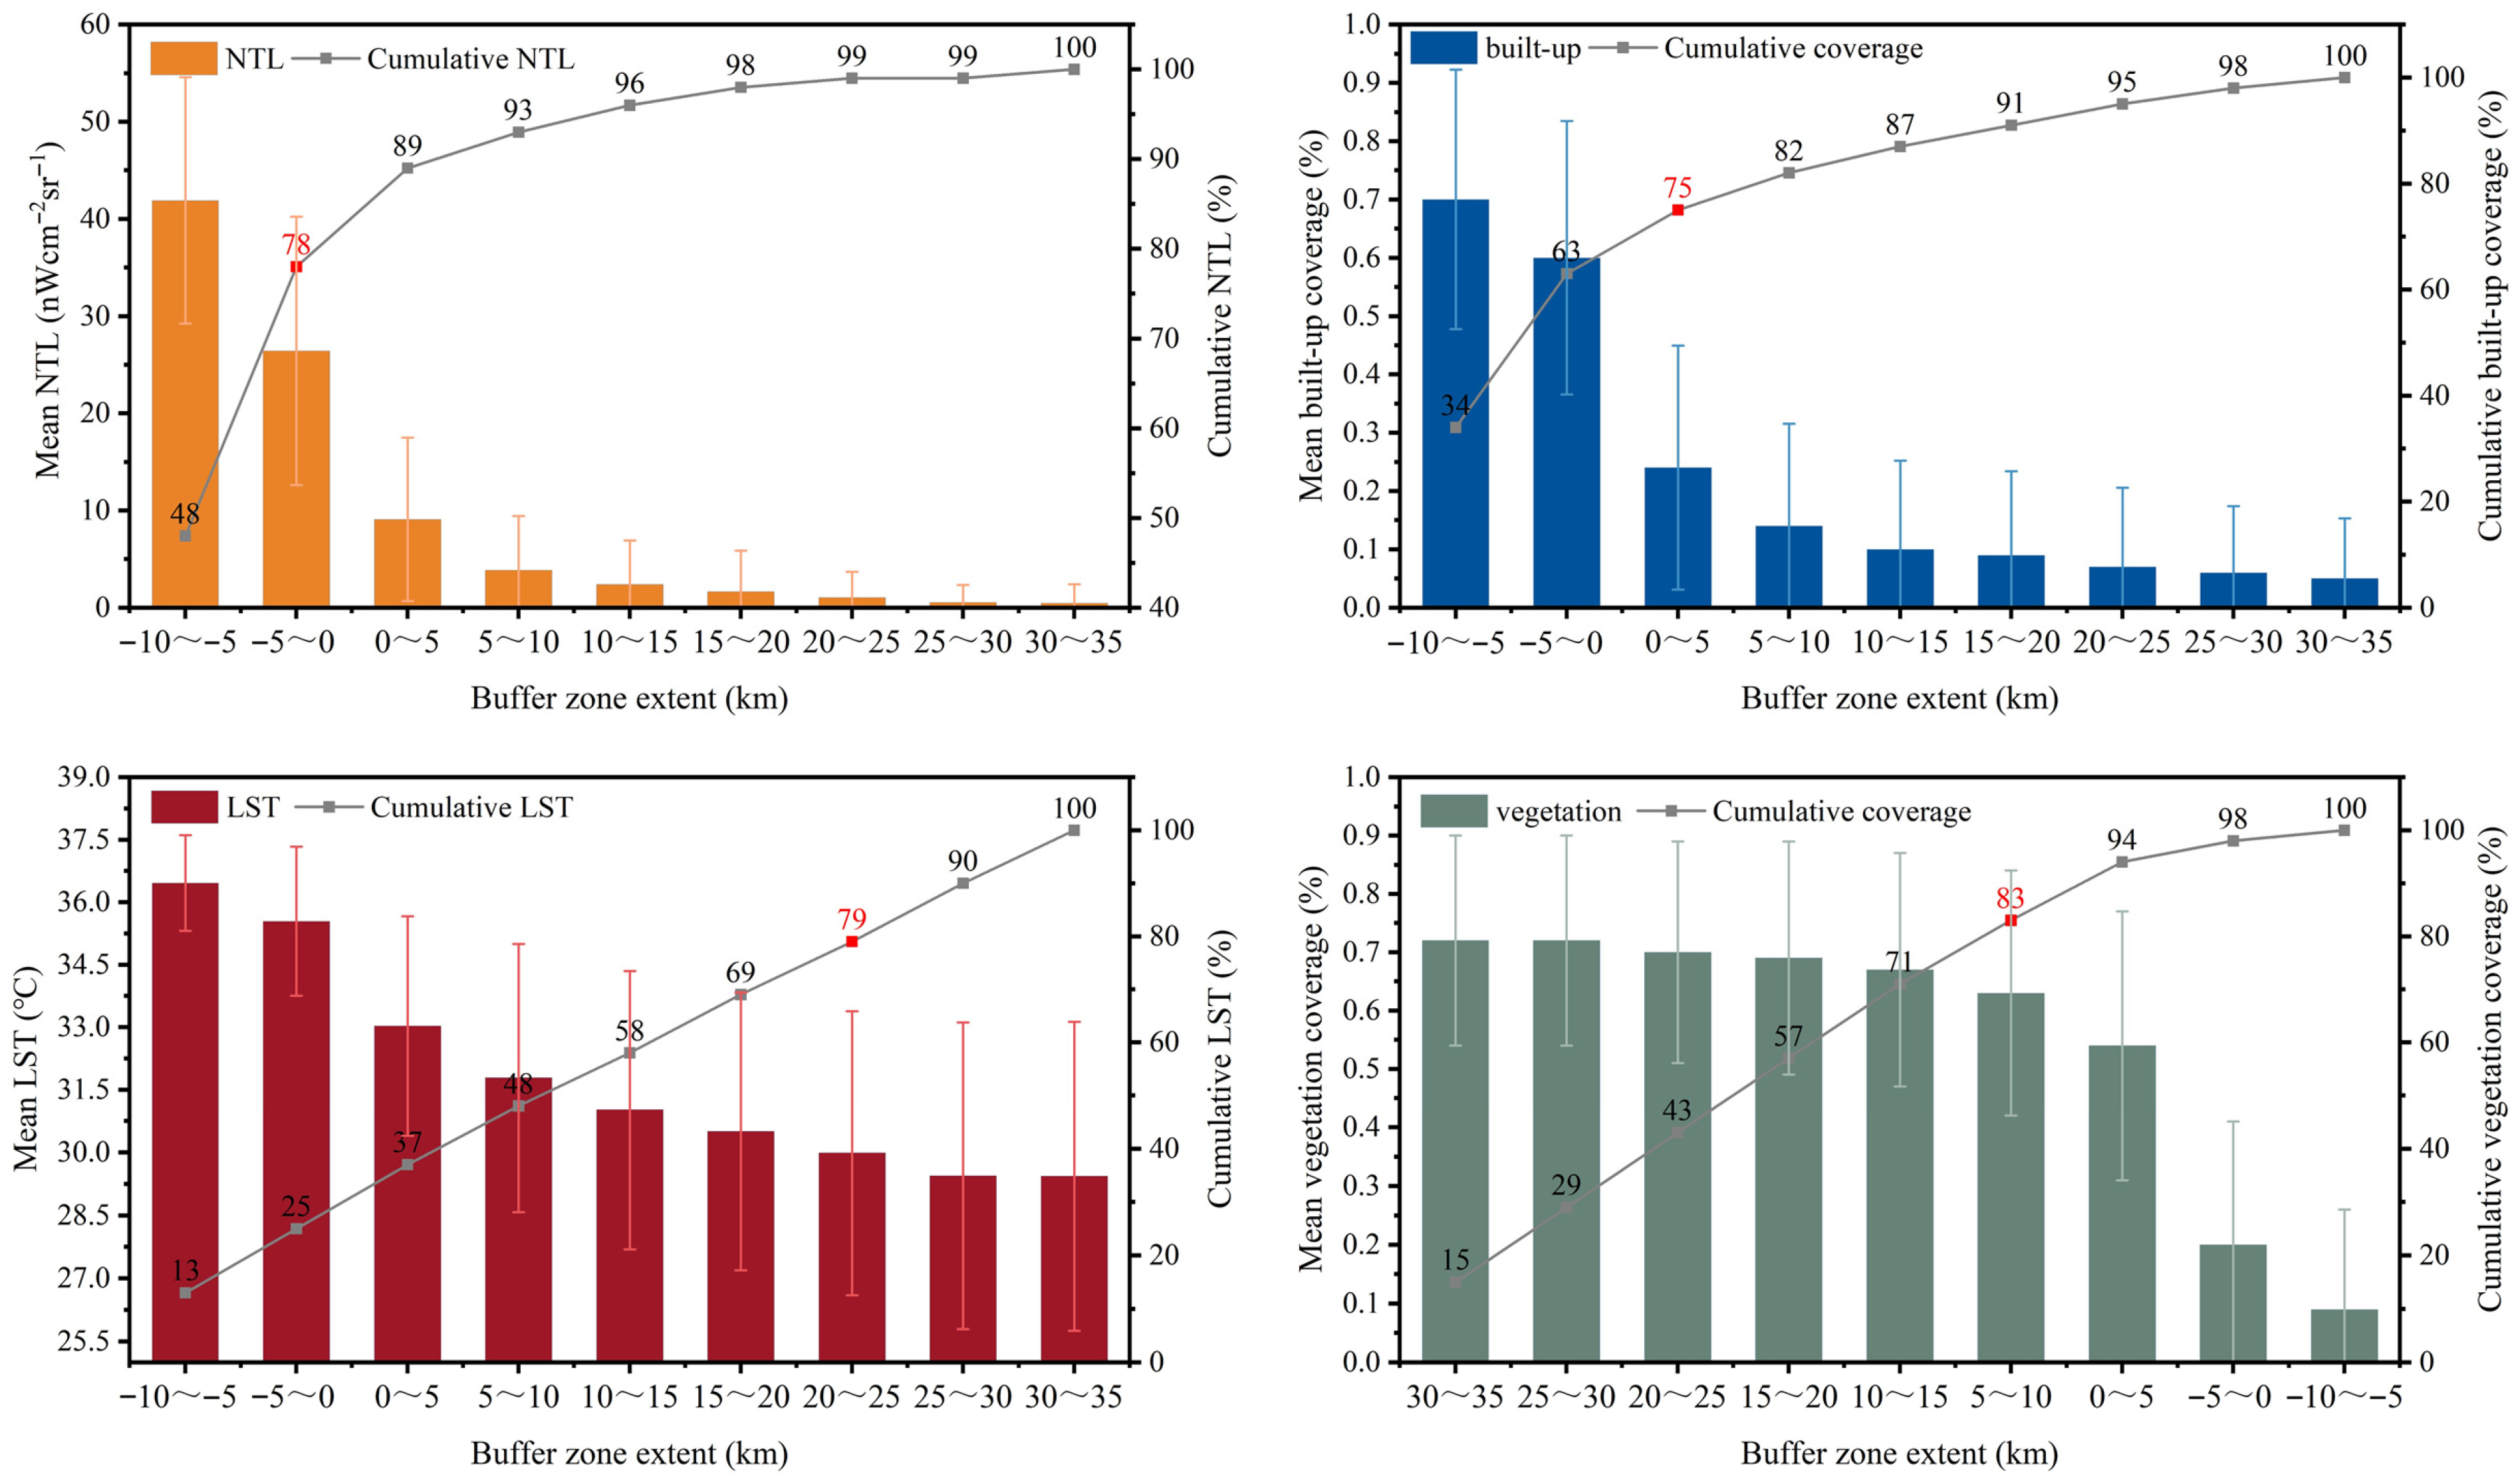
NTL, LST, built-up density, and vegetation cover are unevenly distributed along the urban–rural gradient, showing strong polarization (Figure 5). Within the 0–5 km ring outside the urban boundary, cumulative NTL accounts for 89% of the citywide total, indicating that most nighttime-light intensity is concentrated in the core and immediate surroundings and highlighting the concentration of economic activity, population, and infrastructure. This distribution is highly consistent with the power law distribution, where about 20% of the area carries about 80% of the nighttime light energy. Similarly, the cumulative built-up density within the 0–5 km ring reaches 75%, reflecting high land densification near the core. At the same time, the spatial distribution of LST shows a “center-edge” pattern, with high-temperature areas concentrated in the urban area and decreasing with increasing distance from the urban area, reflecting the close relationship between the urban heat island effect and land use density. In contrast, the vegetation cover shows the opposite spatial gradient, with a decreasing trend from suburbs to urban areas. Within the 0–5 km buffer zone on the periphery of the urban area, the cumulative vegetation cover reached 83%.
Across climate zones, LST and NTL generally decline with distance from city centers, conforming to a power-law decay (p < 0.01). This gradient reflects not only urban expansion and built-up form but also geographic location, climatic context, and land use configuration.
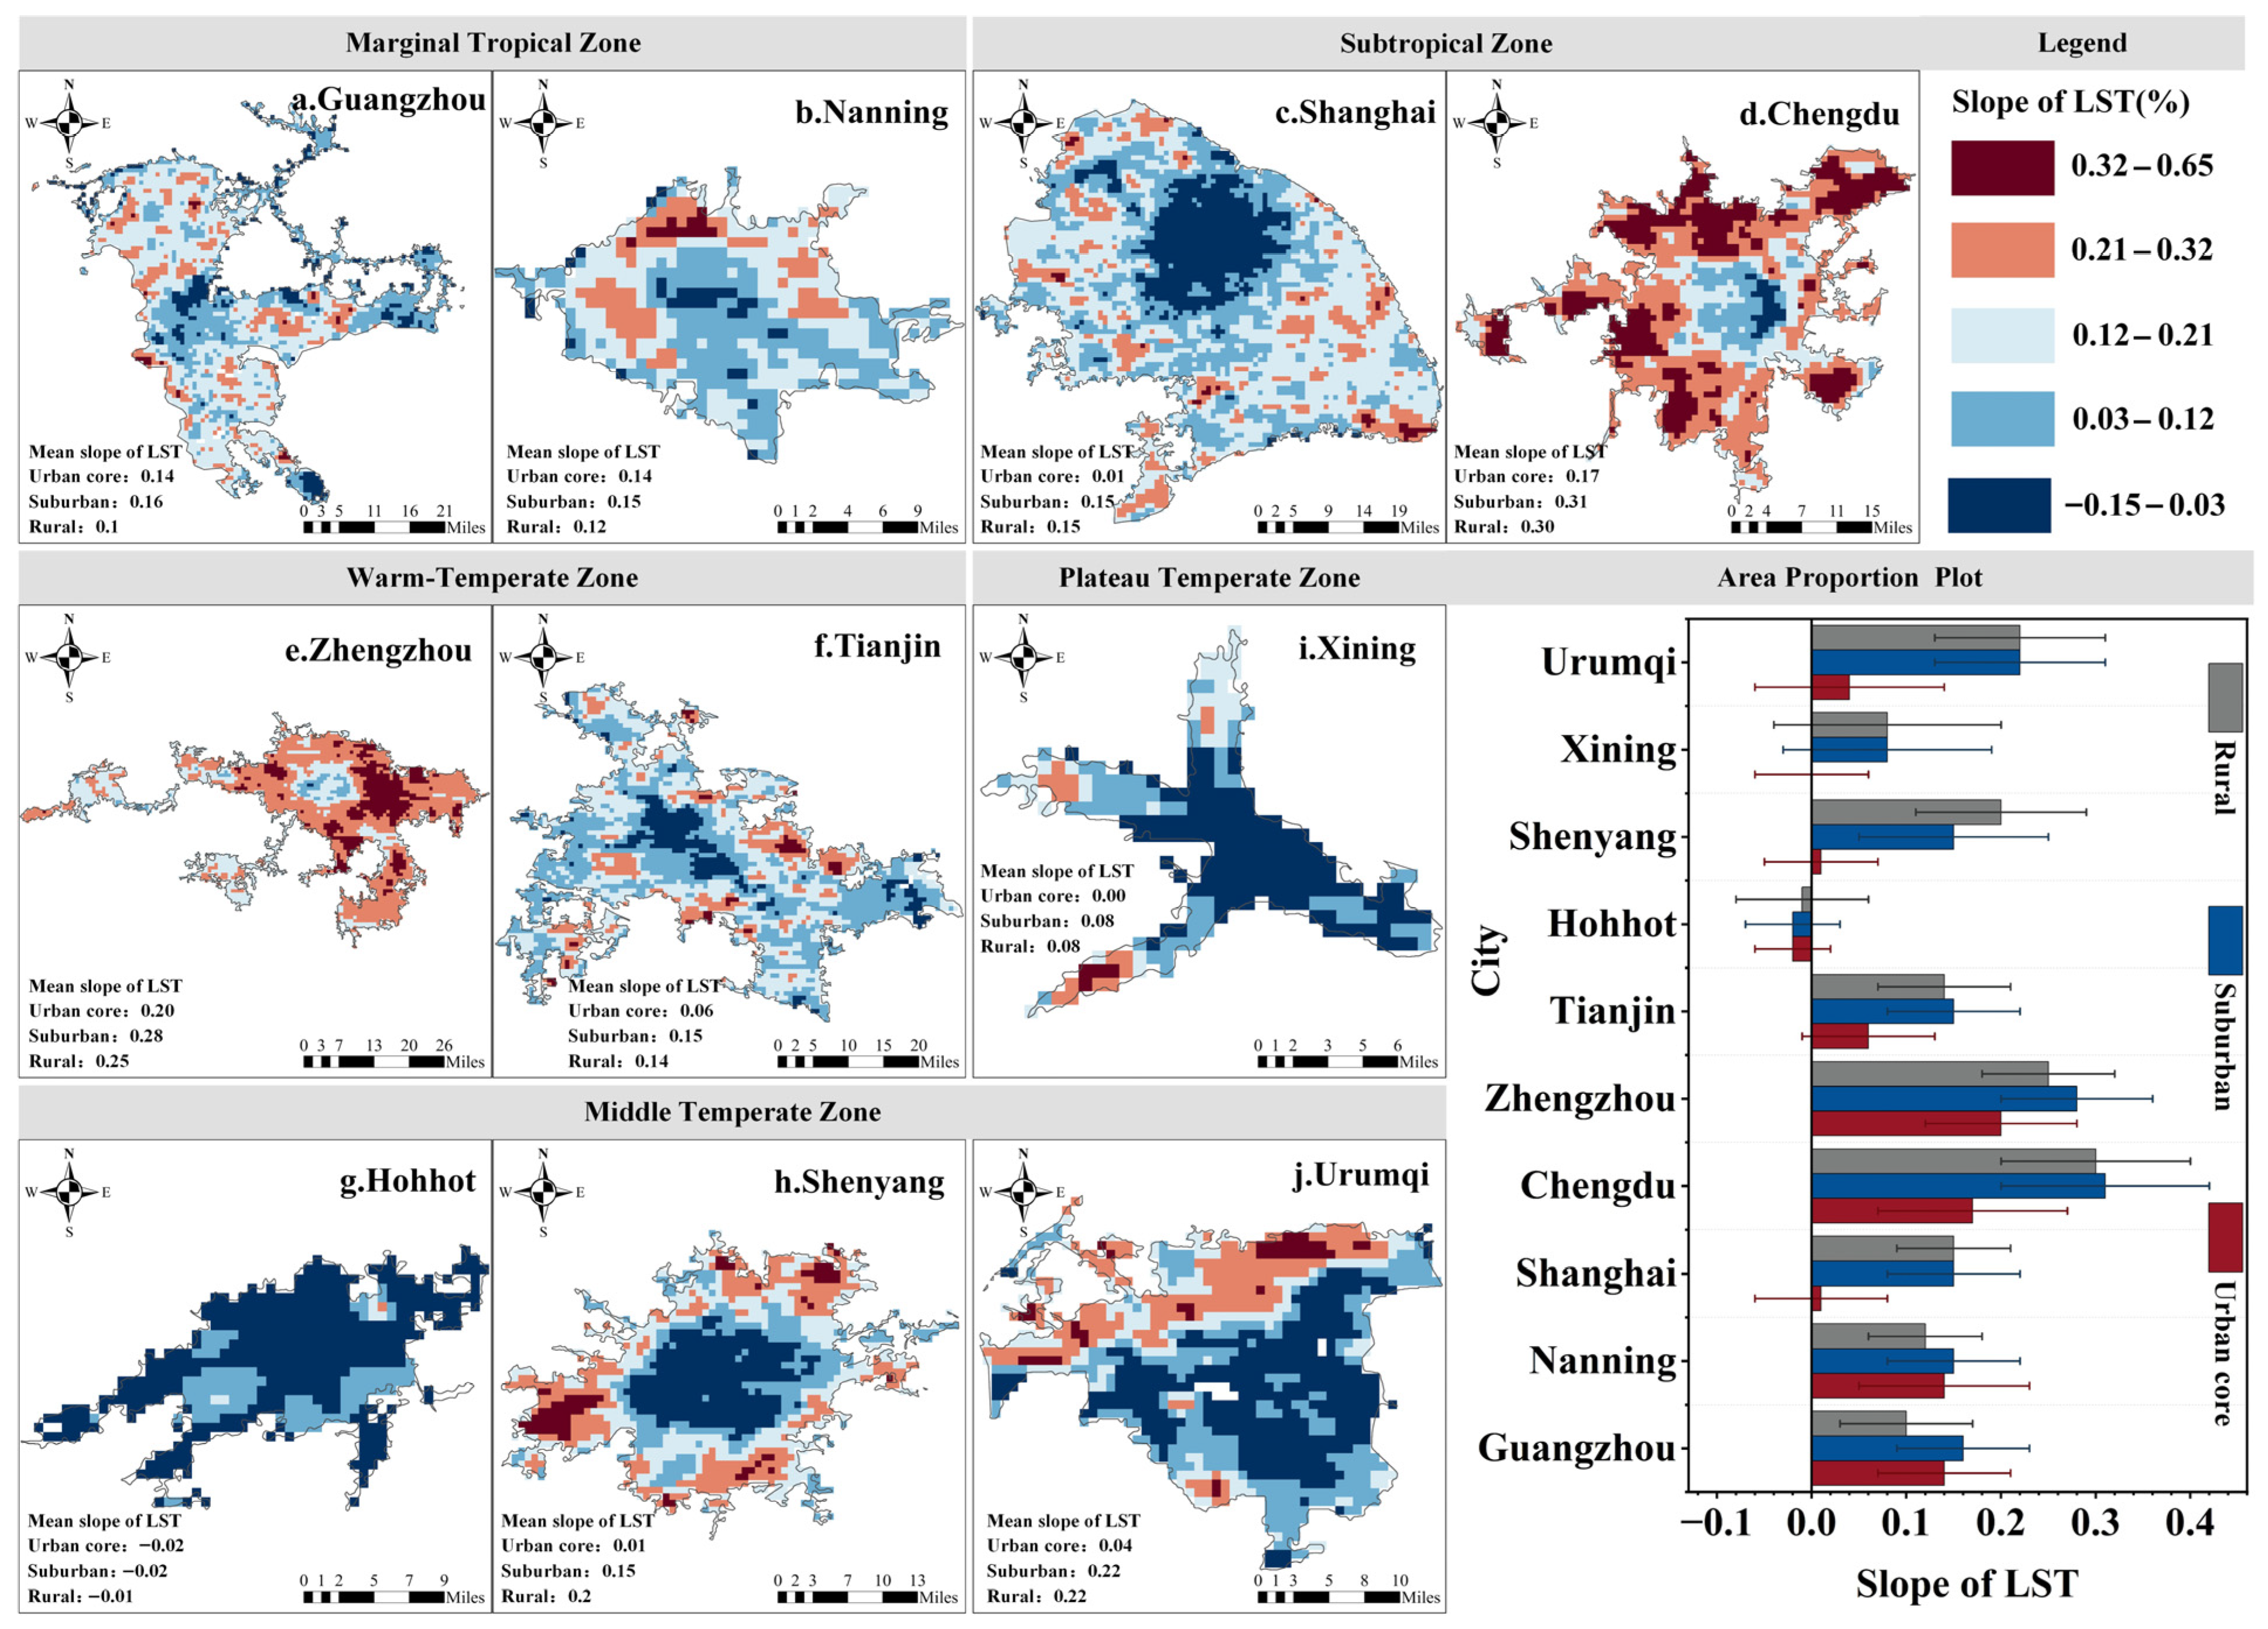
In the marginal tropical humid region, Guangzhou (Figure 6a) exhibited a typical synergistic attenuation of heat and light, underpinned by high built-up density and substantial thermal mass in its urban core: NTL and LST decreased by 98.60% and 14.65%, respectively, indicating a pronounced gradient. However, Nanning (Figure 6b), also located within this climate zone, displayed divergent spatial responses. While its built-up density and NTL decreased in peri-urban areas, LST remained relatively stable, indicating a weak thermal gradient, likely due to a smaller urban footprint, limited core thermal aggregation, and stronger vegetation-mediated cooling.
In the northern subtropical humid region, more continuous and clustered built-up landscapes correspond to gentler LST gradients but distinct anthropogenic-intensity patterns. Shanghai (Figure 6c), characterized by its polycentric structure and dense peripheral sub-centers, demonstrated a slower LST decay (15.01% reduction), while Chengdu (Figure 6d), a typical monocentric city, displayed modest LST changes (b = −0.07) but a sharper NTL decline (b = −1.90), highlighting the differentiated influence of urban morphology on heat-light dynamics.
Similarly, in the warm temperate semi-humid region, Tianjin (Figure 6f) and Zhengzhou (Figure 6e), despite exhibiting comparable LST attenuation and thus modest urban–rural thermal differences, showed markedly divergent NTL gradients. Zhengzhou’s NTL decay coefficient reaches −2.19 (98.57% reduction), whereas Tianjin’s is −1.06 (93.38% reduction). Tianjin’s multi-center configuration on the coastal plain disperses functions and mitigates core–edge contrasts, flattening both NTL and LST decay curves; Zhengzhou’s monocentric agglomeration—with centralized functions, underdeveloped peripheries, and fragmented green space—produces a cliff-like attenuation of thermal and anthropogenic intensity.
Shenyang (Figure 6h), situated in the mid temperate semi-humid region, shows the highest urban–rural LST contrast (21.49%), evidencing a strong heat island effect. Simultaneously, its rapid edge NTL decay (b = −2.54) indicates highly centralized human activities, with the sharp spatial gradients likely linked to its concentrated urban form and substantial built-up volumes.
In stark contrast, Hohhot (Figure 6g), in the mid temperate semi-arid region, despite dramatic NTL (99.54%) and built-up density (99.11%) reductions, registered only a minor urban–rural LST difference (1.50%), suggesting effective peri-urban thermal buffering by ecological isolation belts and grasslands. Meanwhile, Xining (Figure 6i), located in the plateau temperate semi-arid region, experienced a substantial LST decrease of 9.78 °C, shaped by the combined effects of plateau topography and arid climate, resulting in a sharp “urban–rural thermal boundary”. Urumqi (Figure 6j), in the mid temperate arid region, demonstrated the steepest NTL decline alongside a notable LST gradient, underscoring the intense spatial concentration of human–land interactions in monocentric arid-zone cities.

3.1.3. Long-Term Trend Changes

To comprehensively assess the spatiotemporal evolution of land surface temperature (LST) and nighttime light (NTL) over an extended period, this study conducted a quantitative analysis of the changes in LST and NTL between urban and rural areas in ten representative cities from 2000 to 2020.
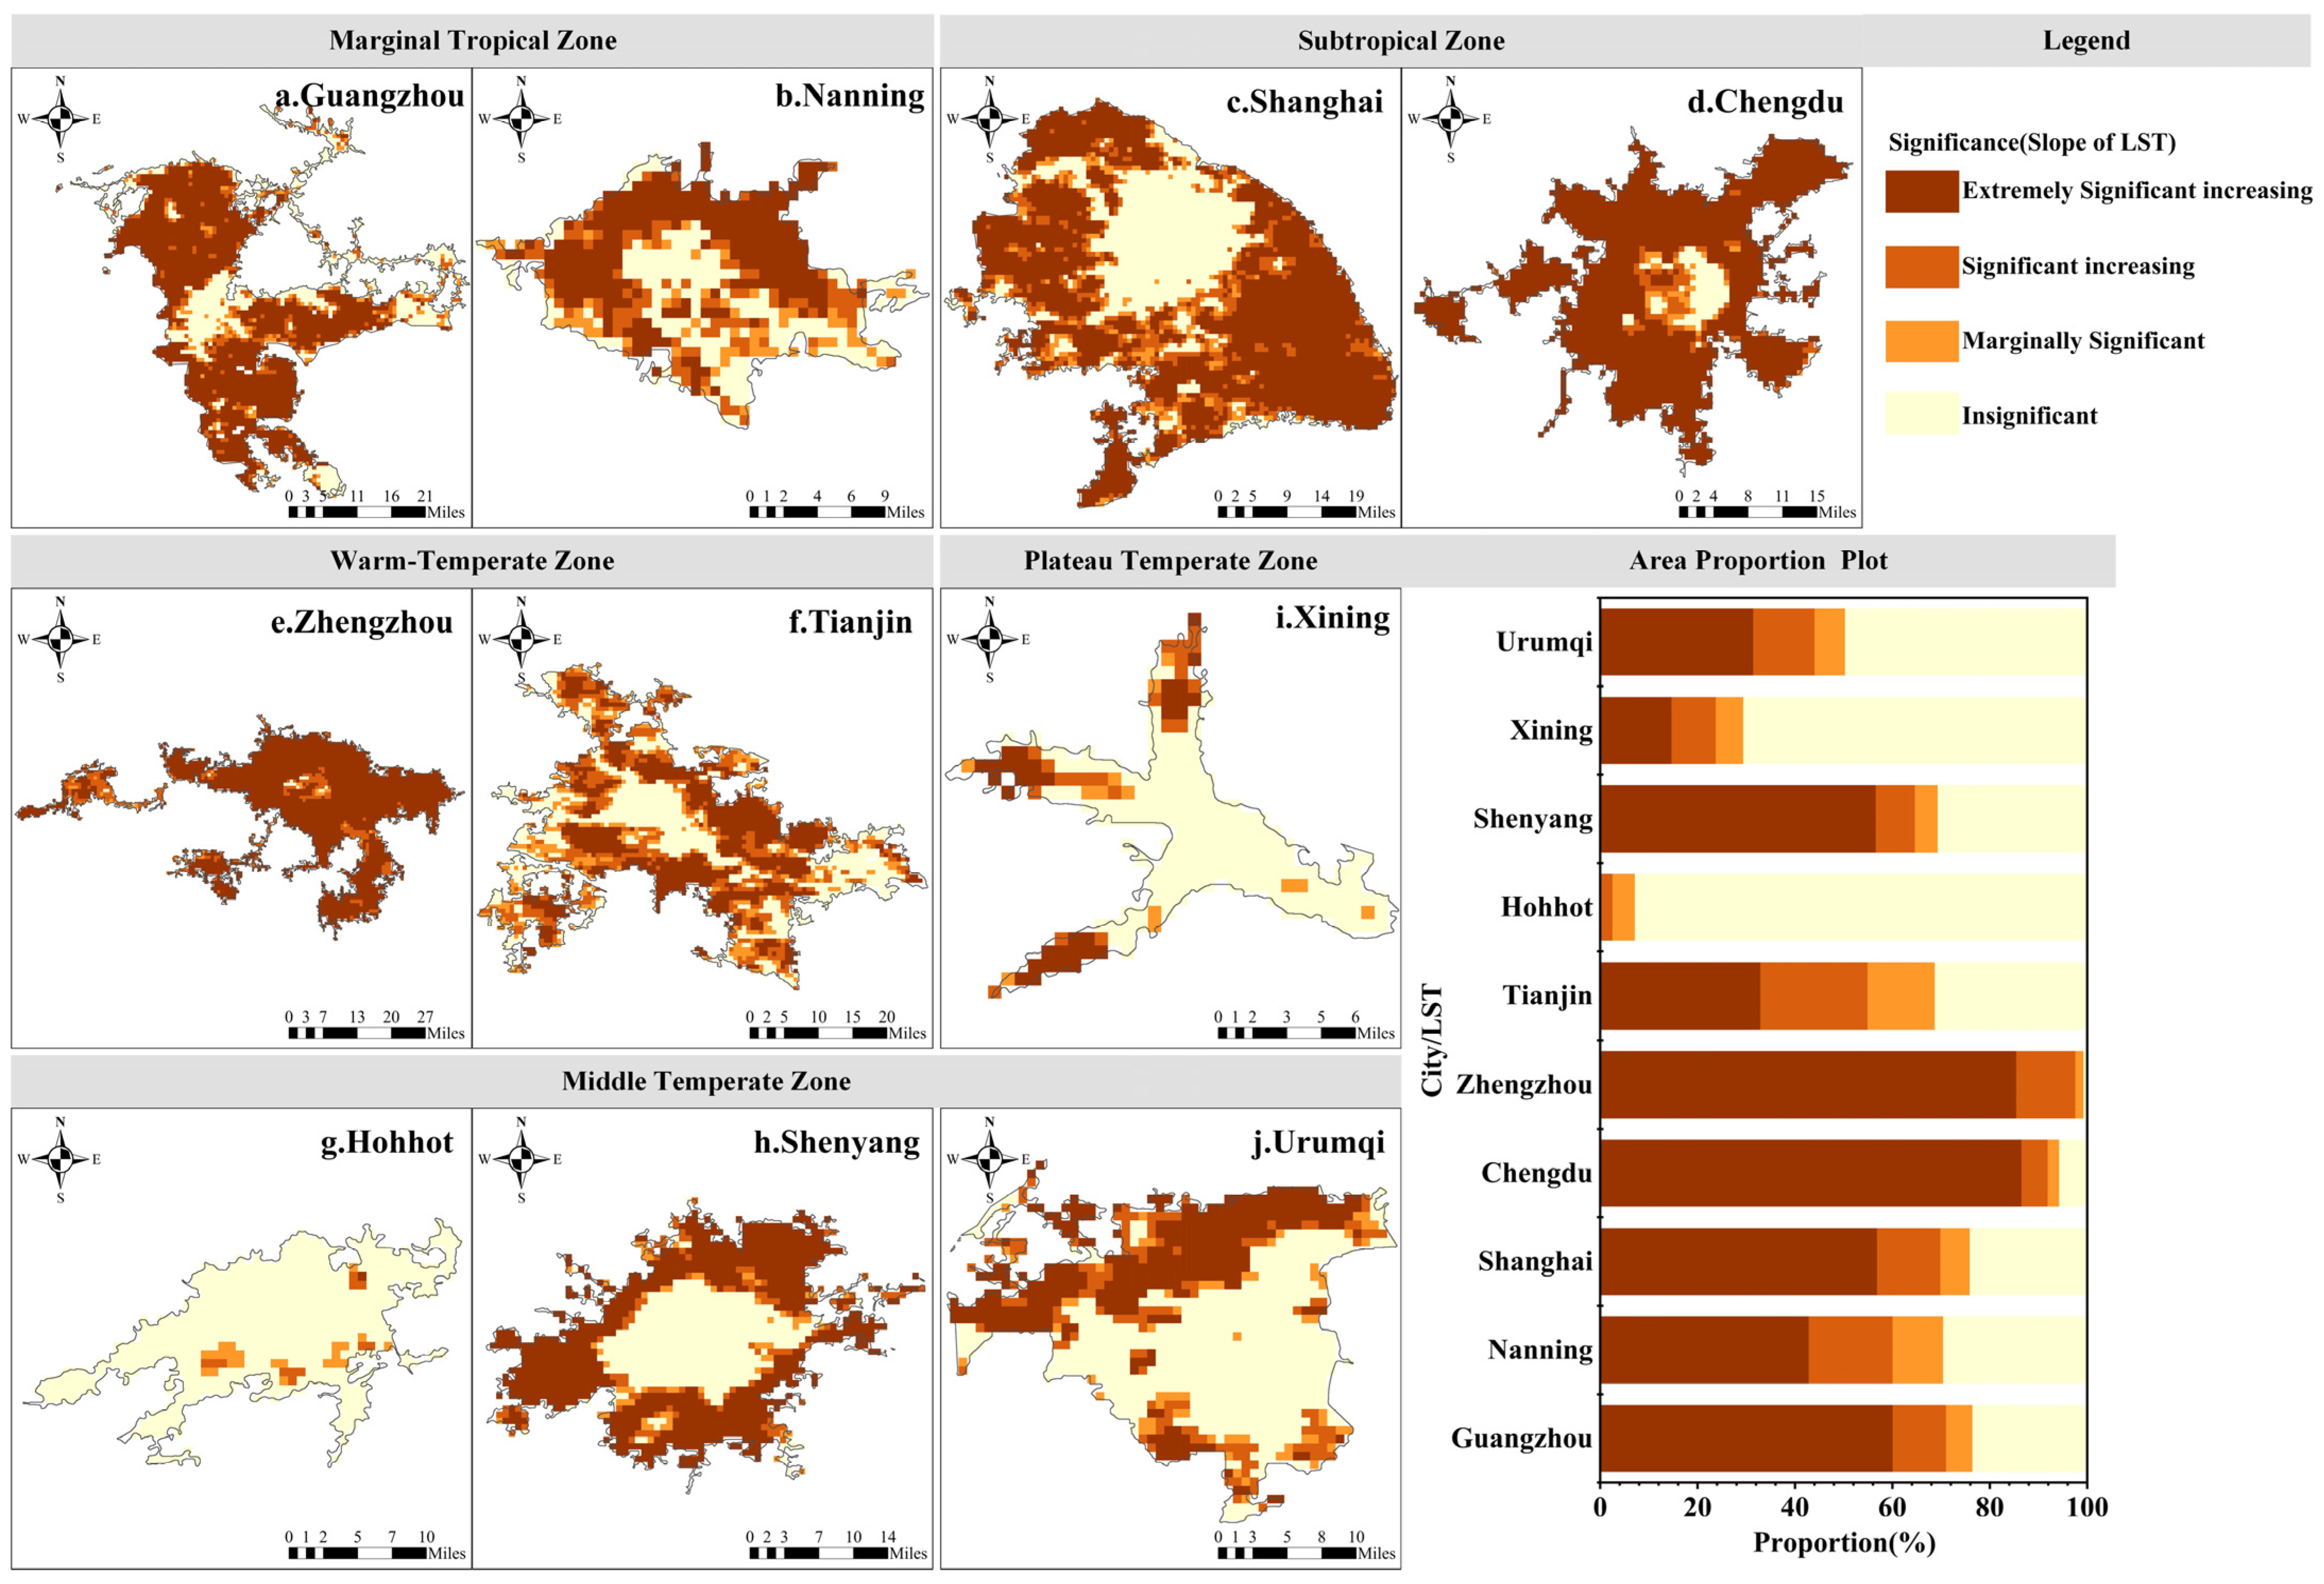
Overall, LST exhibited an increasing trend in all cities except Hohhot, though the warming rates varied substantially across different subregions. Notably, the rate of LST increase was generally higher in suburban areas (0.16 ± 0.08 °C/a) than in urban cores (0.07 ± 0.07 °C/a) and rural areas (0.15 ± 0.08 °C/a), indicating an outward expansion of the urban heat island effect from city centers towards the periphery (Figure 7). Specifically, the most pronounced LST increases were observed in the northern subtropical humid region (Chengdu and Shanghai) and the warm temperate semi-humid region (Zhengzhou and Tianjin) (Figure 8). In particular, the suburban LST growth rate reached 0.31 °C/a in Chengdu and 0.28 °C/a in Zhengzhou, likely linked to vegetation loss and increased built-up density resulting from rapid urbanization.
In contrast, LST in the mid temperate semi-arid region (Hohhot) exhibited a slight decreasing trend (−0.02 °C/a), possibly attributable to regional climate regulation initiatives or ecological restoration projects (such as converting farmland to forest). Furthermore, the overall warming rates in the plateau temperate semi-arid region (Xining) and the mid temperate arid region (Urumqi) were relatively low, at 0.04 and 0.09 °C/a, respectively, constrained by the cold, high-altitude background and the radiation balance characteristic of arid climates.
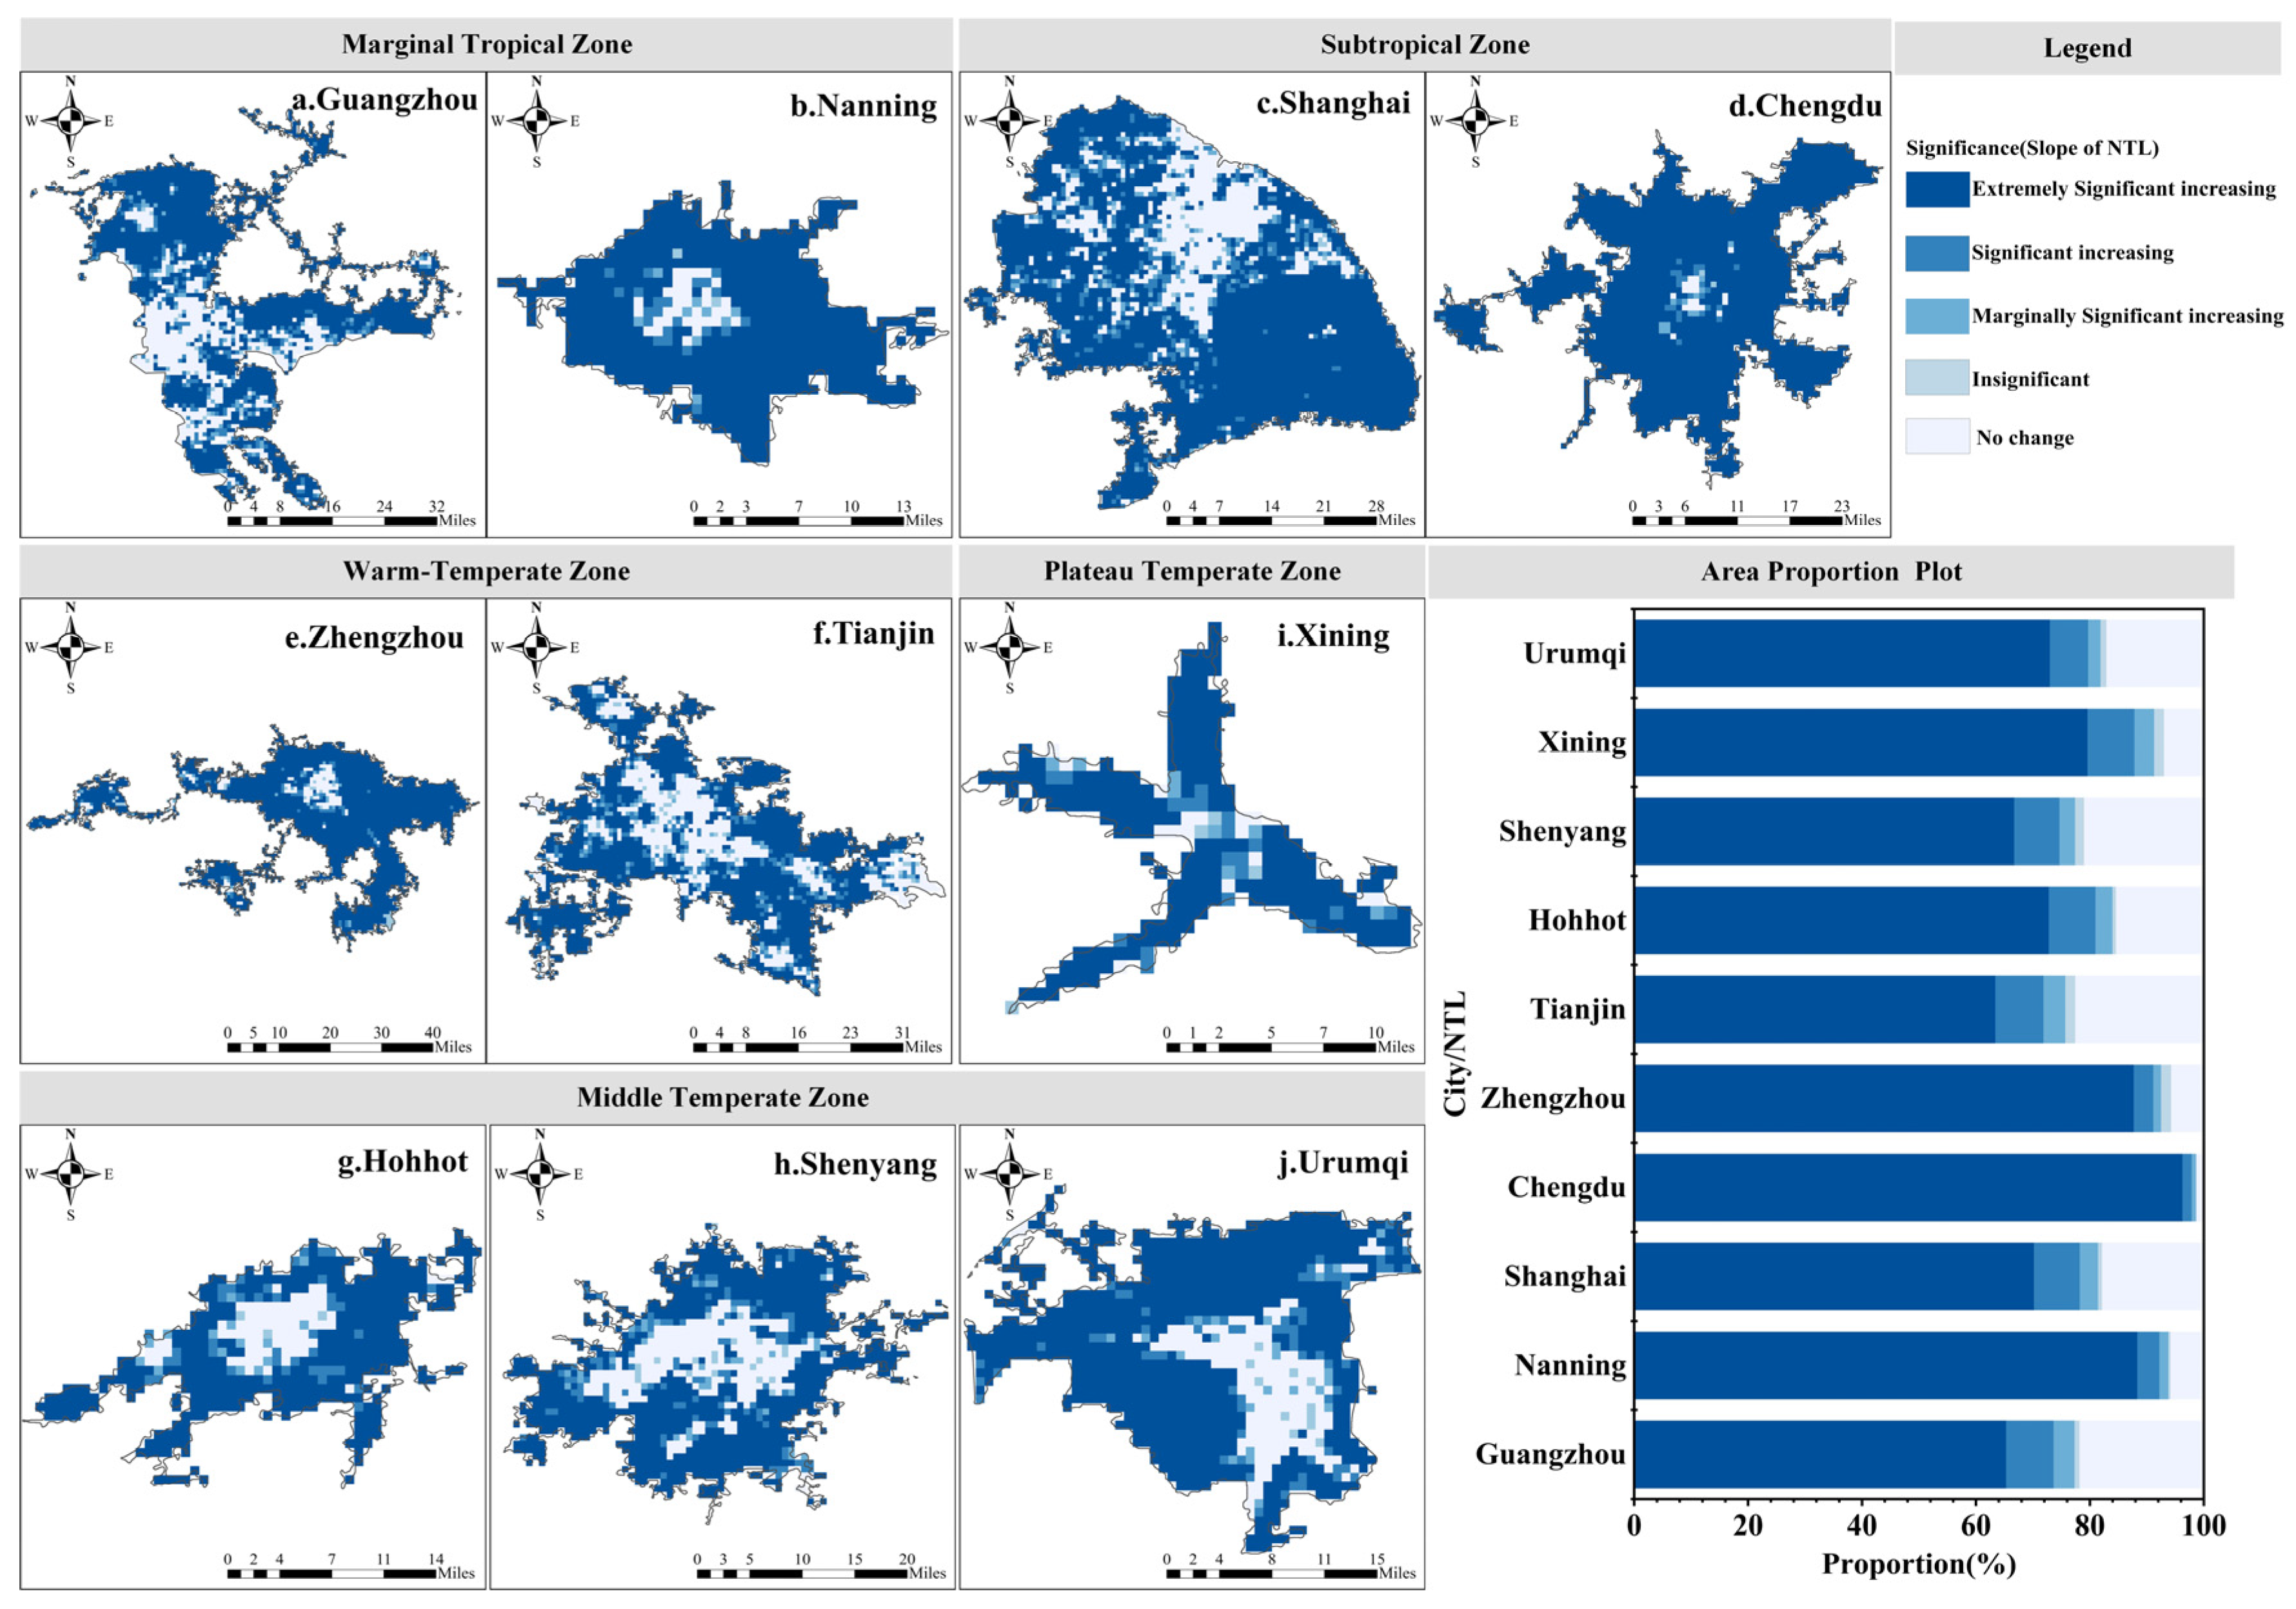
NTL exhibited an upward trend across all cities, with markedly higher growth rates in inland areas compared to coastal counterparts (Figure 9). The marginal tropical humid region (Guangzhou and Nanning) and the northern subtropical humid region (Chengdu) recorded particularly pronounced NTL increases (Figure 10), especially in Chengdu (1.25 ± 0.76 nW/cm2/sr/a) and Nanning (1.00 ± 0.59 nW/cm2/sr/a), reflecting rapid urban expansion and intensified population agglomeration. Similarly elevated NTL growth rates occurred in the mid temperate semi-arid region (Hohhot: 0.95 ± 0.93 nW/cm2/sr/a) and the plateau temperate semi-arid region (Xining: 0.92 ± 0.85 nW/cm2/sr/a), likely driven by infrastructure development and increased energy consumption under the Western Development Policy. In contrast, coastal cities such as Shanghai, Guangzhou, and Tianjin exhibited relatively moderate NTL growth rates (ranging from 0.48 to 0.71 nW/cm2/sr/a), indicating more mature urbanization stages and stabilized patterns of artificial lighting expansion.
Comparing the spatial distribution patterns of NTL and LST trends across ten cities reveals pronounced differences in how these two indicators respond to urban expansion. Areas with significant NTL increase are predominantly located at the peripheries of urban cores, reflecting the outward extension of human activity intensity. By contrast, significant LST increases tend to cover smaller areas and are mainly confined to newly developed zones, exhibiting considerable spatial heterogeneity.
Within urban cores, LST changes are generally modest, suggesting thermal environment stabilization. This pattern is evident in multiple cities and implies that the response of LST to urban expansion may have reached saturation in high-density built-up areas. Zhengzhou and Chengdu display highly synchronized growth in both NTL and LST, with significant LST growth covering 97% and 92% of total built-up areas, and significant NTL growth covering 91% and 98%, respectively. This highlights the strong spatial coupling between urban sprawl and surface thermal dynamics in these cities. Spatially, Zhengzhou’s LST growth predominantly extends outward, notably forming a continuous high-temperature belt between the economic and technological development zone and the airport district, characterized by marked patchiness and spatial extensiveness. In Chengdu, however, LST growth areas largely align with the city’s principal development axes and are strongly shaped by local topography.
In contrast, Nanning and Xining show a relatively low proportion of areas with significant LST growth (60% and 24%, respectively), despite high shares of significant NTL growth (92% and 88%, respectively). This suggests potential spatial decoupling between LST and NTL trends during urbanization in these two cities. Specifically, in Nanning, LST growth is concentrated in newly developed zones, while changes within the urban core are minimal. In Xining, LST growth is more fragmented, with some areas even displaying cooling trends.
Additionally, coastal cities such as Shanghai exhibit relatively stable spatial dynamics in both LST and NTL, with significant growth primarily occurring at urban edges and minimal change in core areas. Notably, despite substantial NTL increases in Hohhot, the proportion of areas with LST growth remains limited, while some zones experience cooling, suggesting the presence of a “cold island effect.”

3.2. Analysis of the Relationship Between LST and NTL

Analysis of nighttime light (NTL) and land surface temperature (LST) trends revealed notable spatiotemporal synergies between the two variables. To further quantify this relationship, this study initially employed the Pearson correlation coefficient to examine long-term NTL and LST trends across different spatial scales, thereby assessing the degree of association. Subsequently, spatial statistical methods were applied to explore the patterns of correlation and clustering characteristics in their spatial distributions. Finally, a coupling coordination degree model was developed to comprehensively evaluate the interaction between NTL and LST from a systems perspective, aiming to depict the spatial heterogeneity in the coordinated evolution of urban thermal environments and human activities, and to elucidate regional differences in coordination levels.

3.2.1. Pearson Correlation Analysis

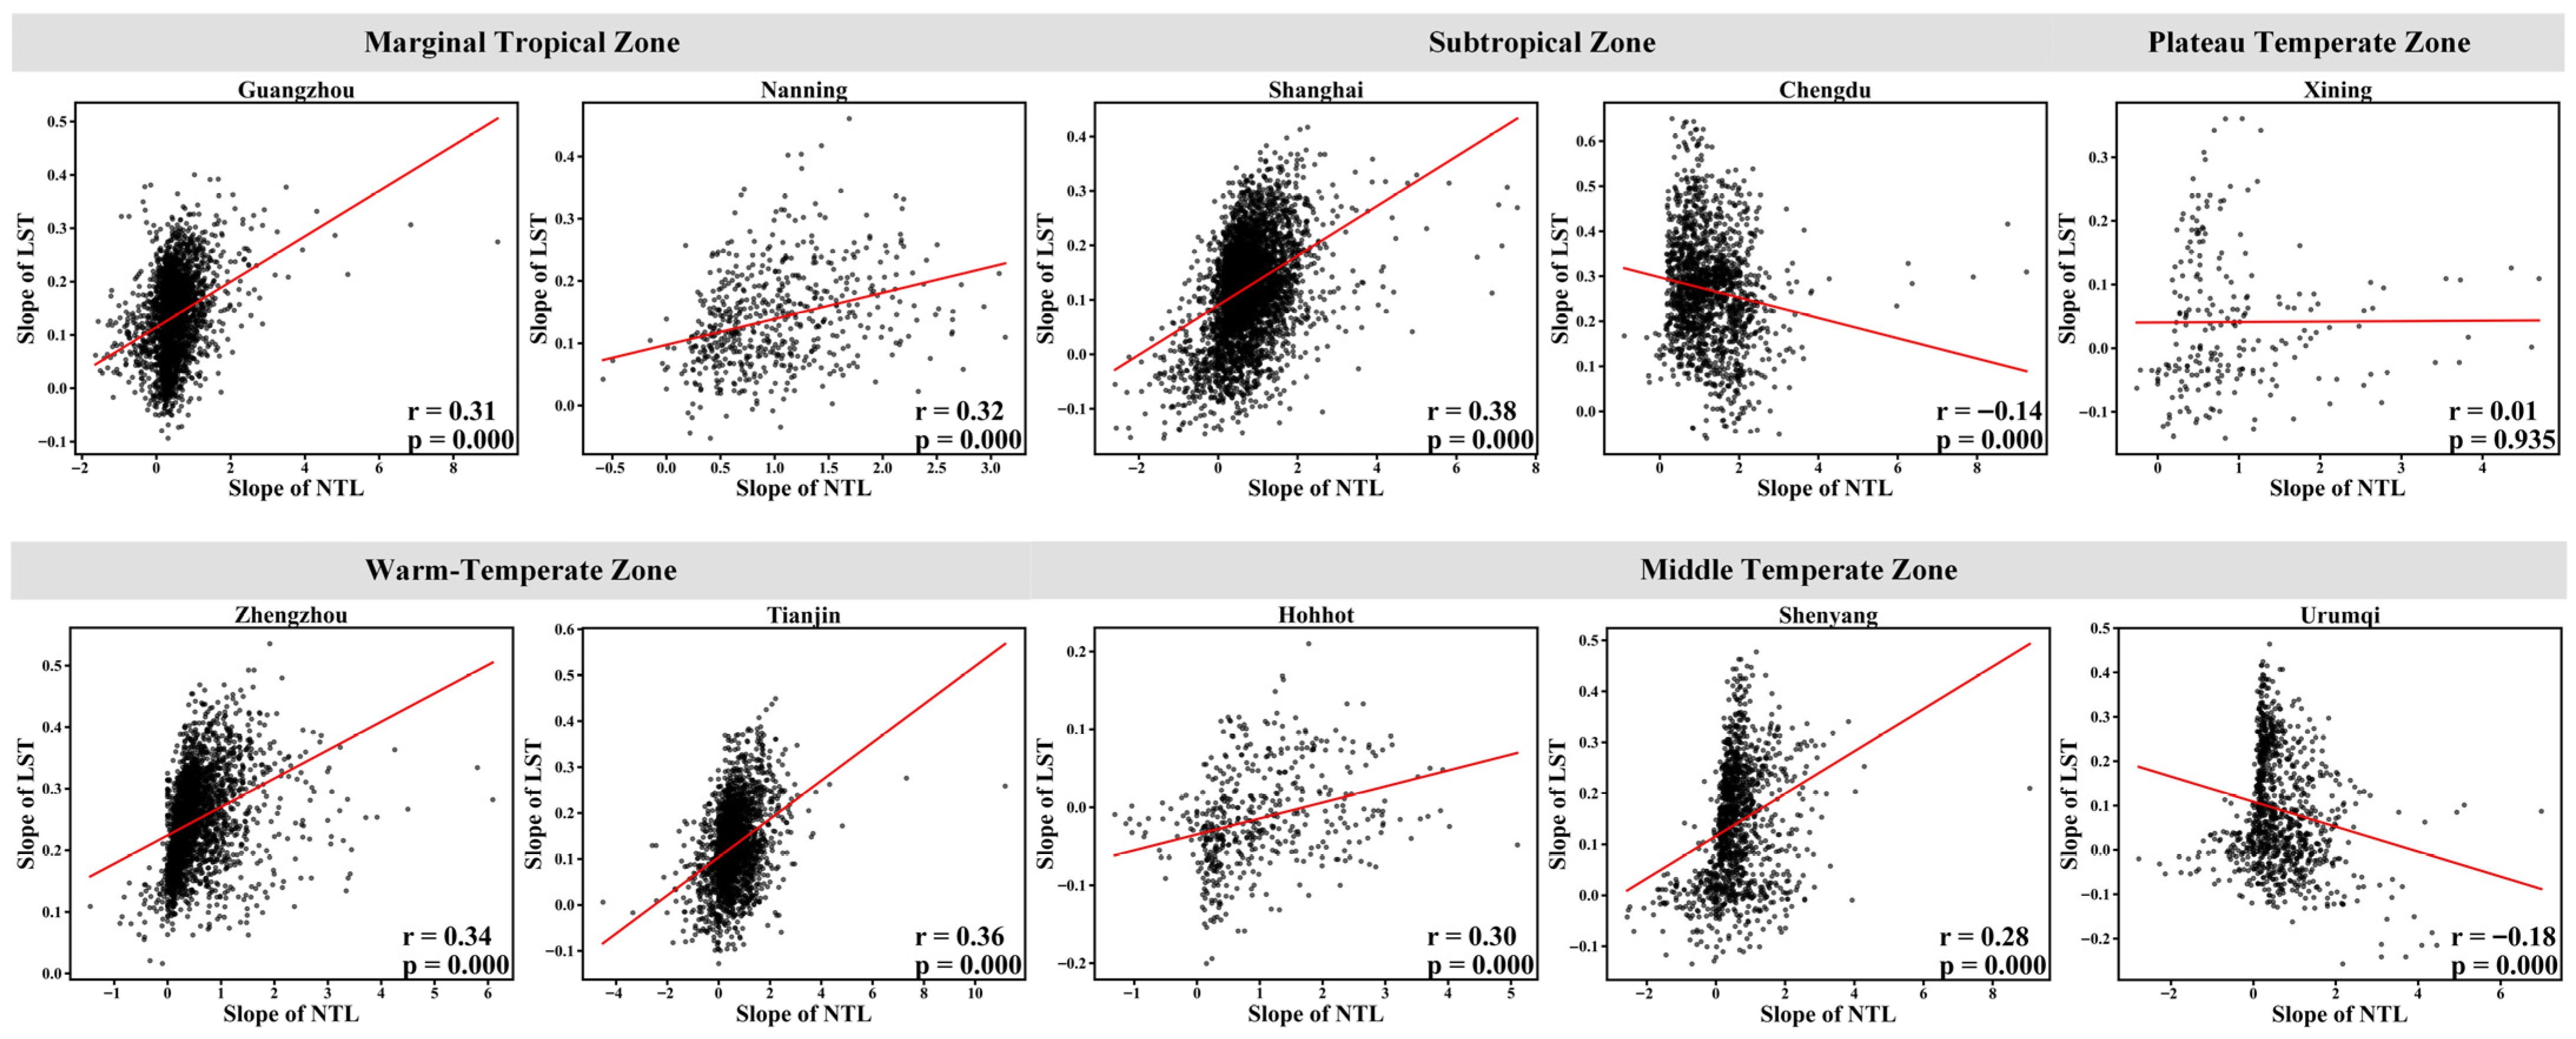
The correlation between LST and NTL trends exhibits significant variation across both climate zones and urban–rural gradients (Table 3; Figure 11). Coastal and plain cities consistently exhibit positive correlations across all gradients. In Shanghai, significant positive correlations are observed in both the urban core (r = 0.36, p < 0.01) and rural areas (r = 0.48, p < 0.01). Tianjin shows a progressive strengthening from the core (r = 0.22, p < 0.01) to suburban (r = 0.34, p < 0.01) and rural zones (r = 0.45, p < 0.01). These patterns indicate that urban expansion in coastal regions reinforces the co-intensification of nighttime luminosity and surface warming over broader spatial extents.
In contrast, cities in arid and basin environments display weakened or even reversed correlations. Urumqi (mid-temperate arid region) exhibits negative correlations in both the core (r = −0.10, p < 0.01) and suburban areas (r = −0.06, p = 0.57), with only a weak positive correlation in rural zones (r = 0.15, p = 0.03). Similarly, Chengdu (northern subtropical humid basin) shows non-significant or negative correlations in cores (r = −0.02, p = 0.65) and suburban areas (r = −0.17, p < 0.01), while rural correlations remain negligible (r = 0.05, p = 0.20). These findings suggest that ecological restoration and climatic buffering (such as cold-island effects in arid regions or inversion layers in basins) can offset or even decouple thermal responses from rising luminosity.
Cities in climatic transition zones exhibit moderate positive correlations that often intensify toward the urban fringe. In Nanning (a marginal tropical humid region), correlations strengthen from the core (r = 0.22, p < 0.01) to the suburbs (r = 0.38, p < 0.01), with rural areas (r = 0.32, p < 0.01) still higher than the core. Zhengzhou (warm temperate semi-humid region) follows a similar pattern, with correlations increasing from the core (r = 0.18, p < 0.01) to suburban (r = 0.37, p < 0.01) and rural zones (r = 0.40, p < 0.01). This highlights that peri-urban and rural frontiers, often hotspots of rapid expansion, experience more synchronized increases in luminosity and surface warming.
High-altitude and semi-arid contexts reveal predominantly weak or inconsistent associations. Xining (plateau temperate semi-arid region) shows no significant correlation in cores (r = 0.01, p = 0.43) or suburban areas (r = −0.17, p = 0.55), with only an insignificant positive signal in rural zones (r = 0.43, p = 0.38), underscoring the overriding influence of climatic constraints. Shenyang and Hohhot also exhibit relatively weak, with positive correlations primarily detectable in rural peripheries.
Notably, rural areas in most cities exhibited stronger correlations than urban cores, reflecting a more synchronous coupling between anthropogenic activity and thermal response at the urban expansion frontier. At the same time, pronounced inter-climatic differences emerge. These findings highlight the dual regulation of LST–NTL coupling by urban–rural gradients and climatic background.

3.2.2. Spatial Correlation Analysis

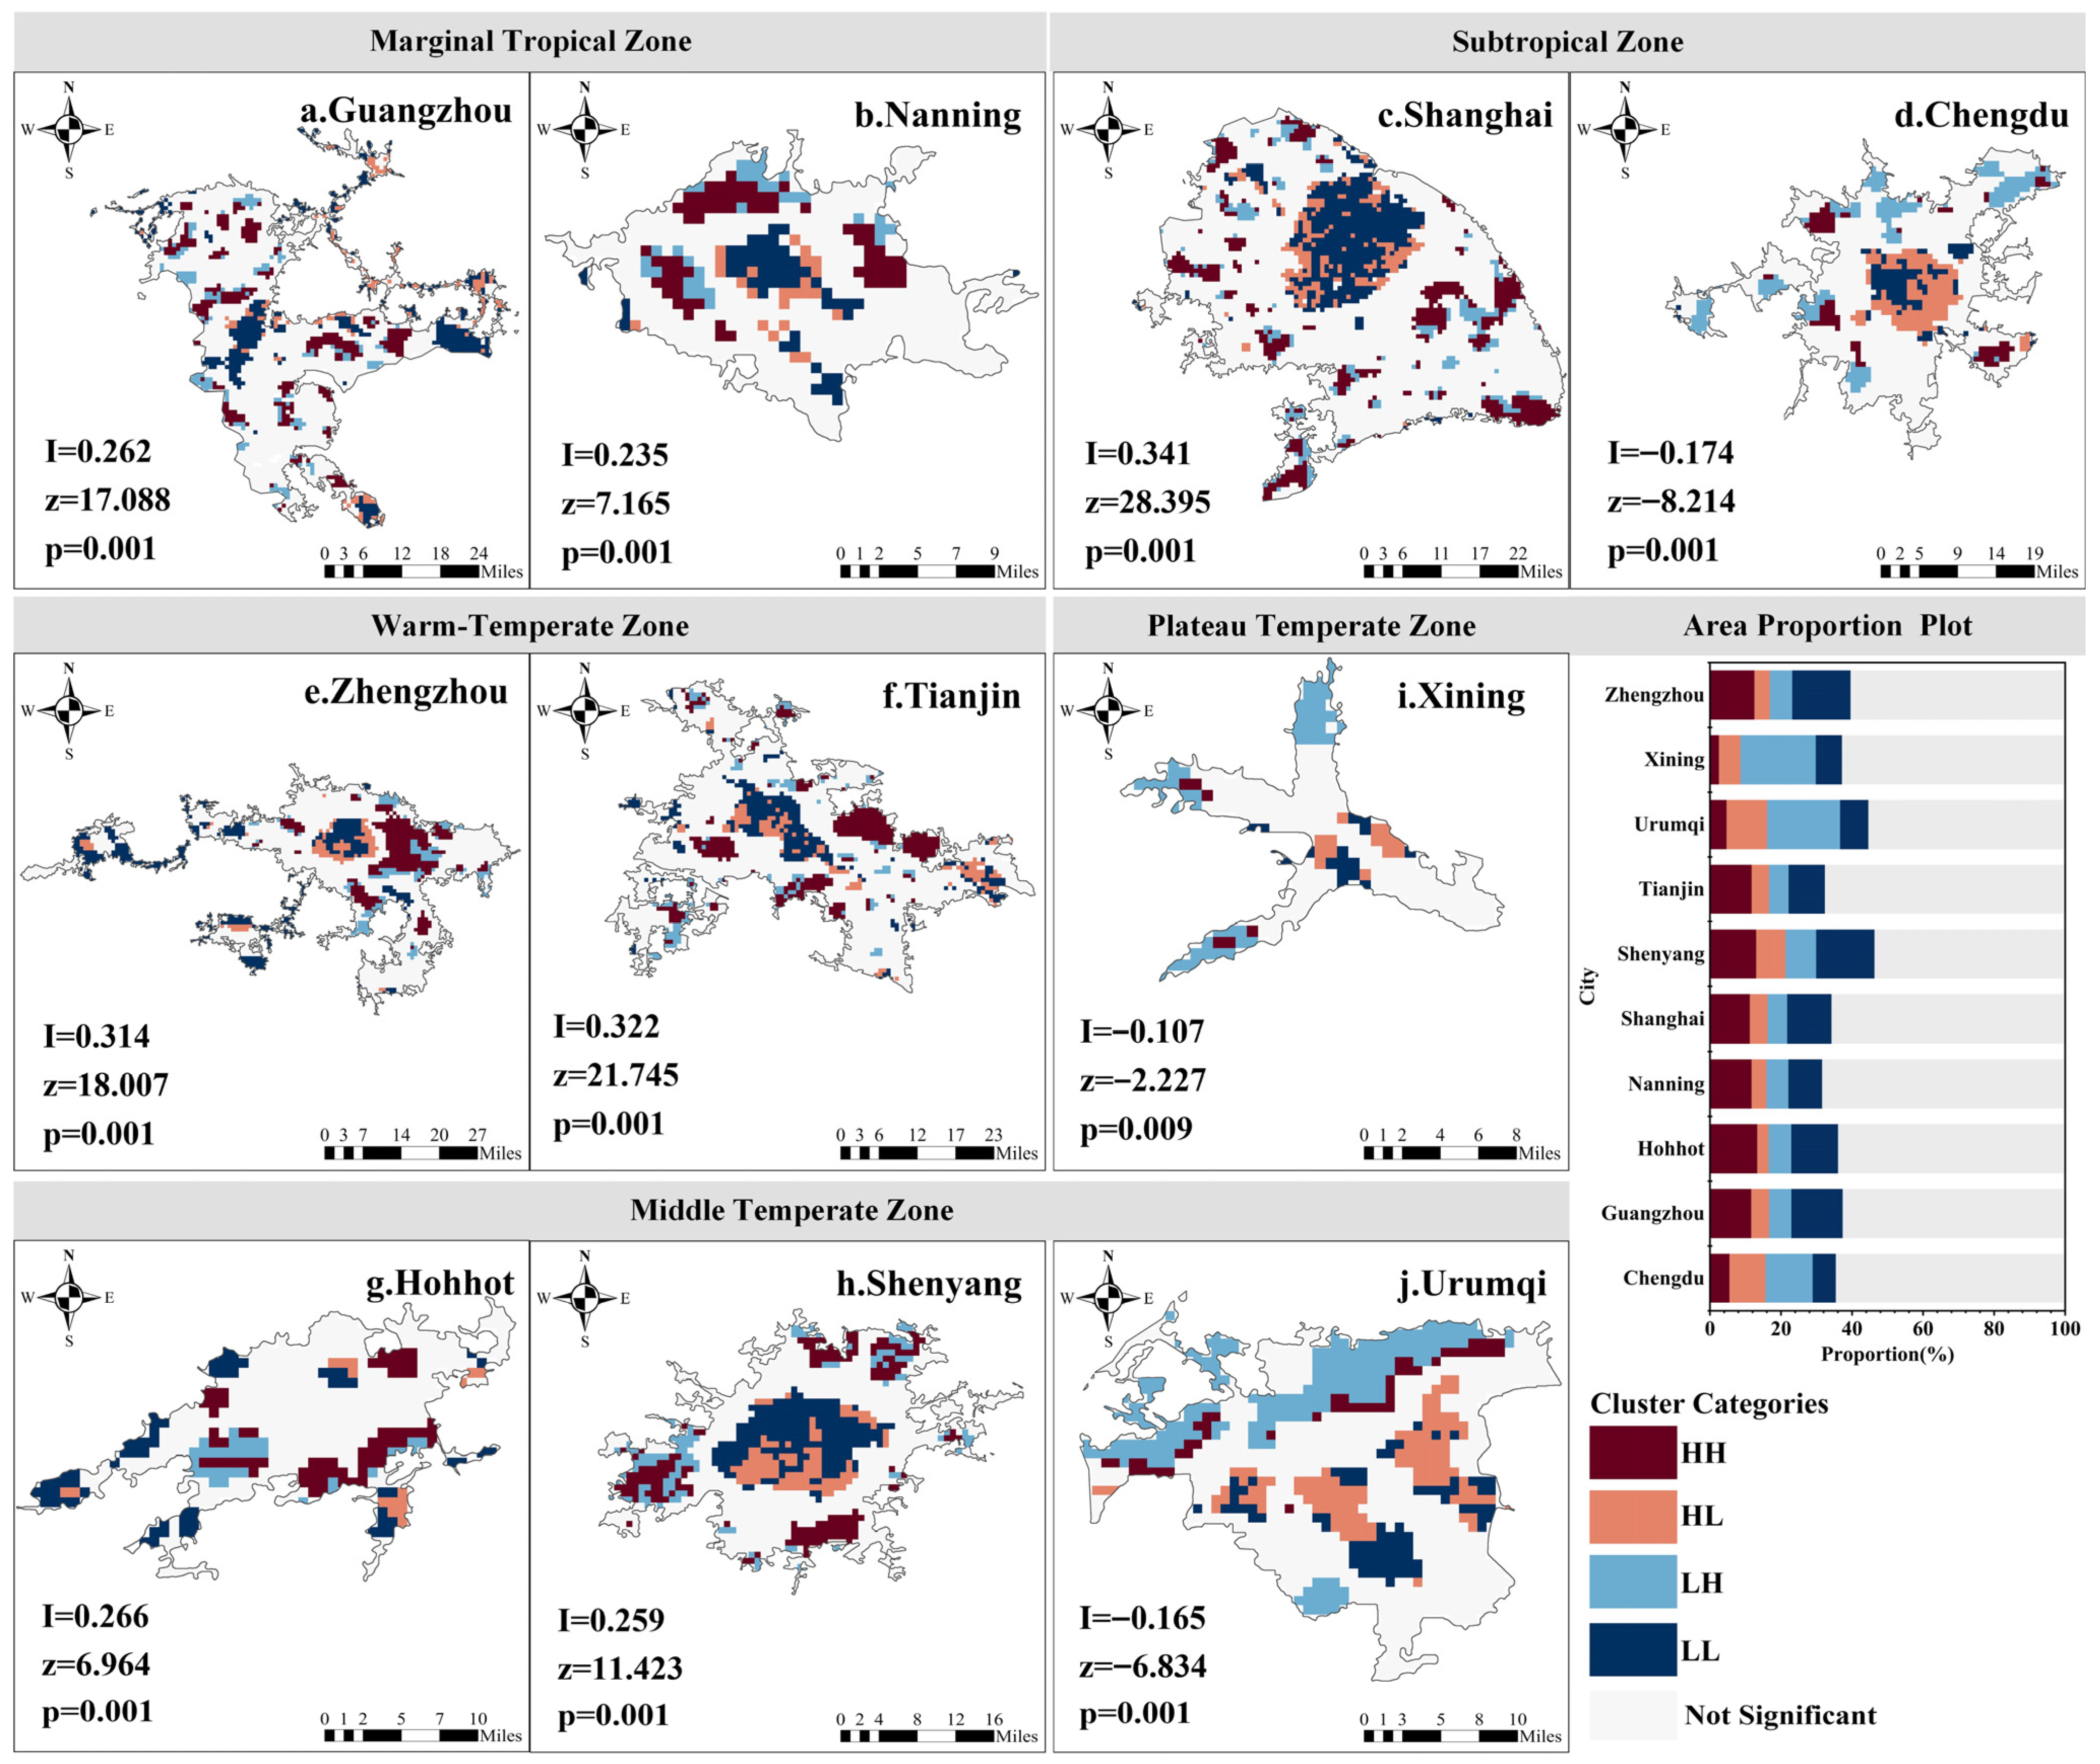
Spatial correlation analysis further revealed pronounced heterogeneity in NTL–LST trend associations across the cities (Figure 12). Seven cities exhibited statistically significant positive Moran’s I indices (p < 0.01), except for Chengdu, Urumqi, and Xining. High–High (HH) clusters occurred mainly in peri-urban zones, reflecting coupled hotspots of intensive human activity and thermal dynamics at urban fringes. In contrast, HL (High NTL–Low LST change) and LH (Low NTL–High LST change) clusters, which often delineate HH regions, correspond to urban expansion zones and ecologically sensitive areas, respectively. Low–Low (LL) clusters concentrated in dense urban cores and near water bodies exhibited minimal changes in both variables.
Except for Chengdu, Urumqi, and Xining, the remaining cities exhibited higher proportions of HH and LL cluster types, highlighting pronounced spatial heterogeneity in the interplay between urban thermal environments and nighttime light. By contrast, the dominance of HL and LH clusters in Chengdu, Urumqi, and Xining underscores a notable spatial decoupling of LST and NTL, largely governed by three mechanisms (Figure 13). In Chengdu, a service-oriented economy (tertiary sector > 65% of GDP in 2024) boosts NTL via the nighttime economy, but lower energy intensity (~42% below traditional industries) suppresses heat, decoupling LST and NTL trends. In Urumqi, located within an arid oasis, LST is significantly modulated by artificial irrigation and ecological projects; enhanced vegetation evapotranspiration and restoration efforts (e.g., Wulapo wetland protection) mitigate heat accumulation despite rising NTL. Conversely, Xining is characterized by a plateau climate, where strong solar radiation, low air pressure, and frequent inversions primarily control LST, reducing the thermal influence of urban structures. Concurrent greening of surrounding mountains has increased surface albedo, inducing local cooling and thus weakening the NTL–LST relationship.
Intercity Moran’s I values revealed a distinct spatial gradient, decreasing from east to west: Shanghai (0.341) > Tianjin (0.322) > Zhengzhou (0.314) > Hohhot (0.266) > Guangzhou (0.262) > Shenyang (0.259) > Nanning (0.235) > Chengdu (0.174) > Urumqi (0.165) > Xining (0.107). Mature agglomerations (such as the Yangtze River Delta and Beijing–Tianjin–Hebei) demonstrated stronger NTL–LST spatial correlations, while western cities exhibited more spatial decoupling.

3.2.3. Analysis of Coupling Relationships

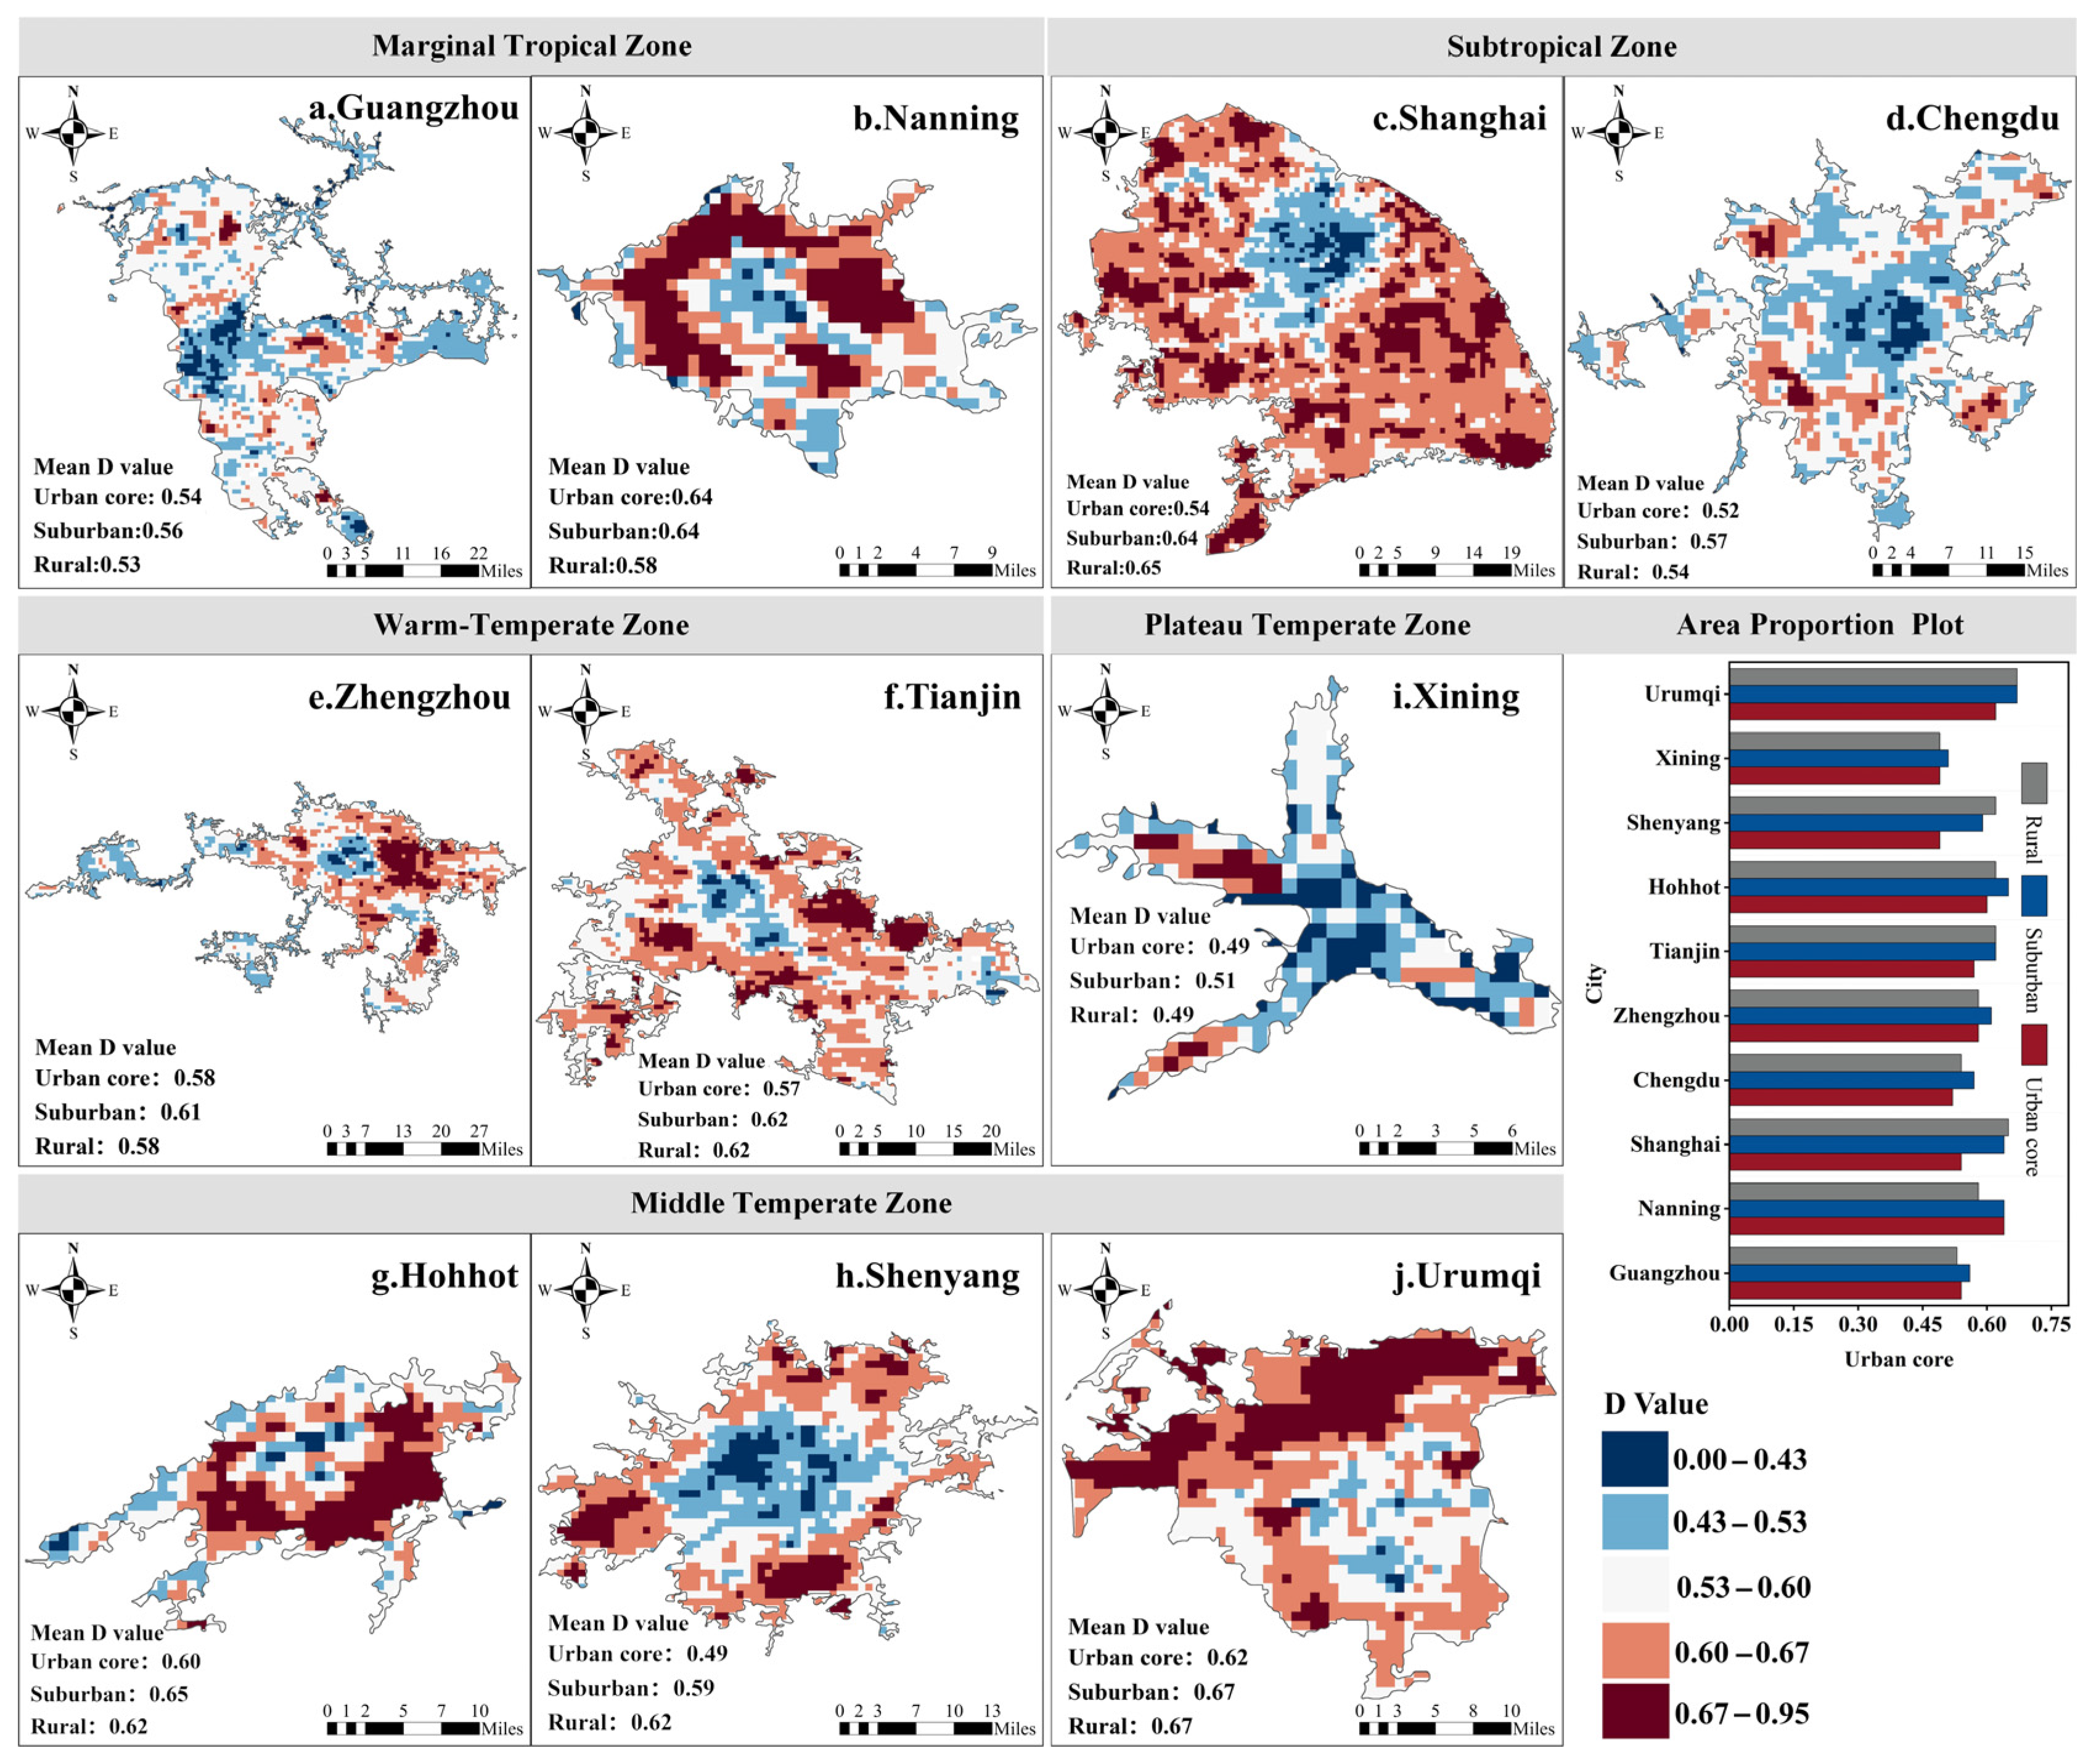
Using the Coupling Coordination Degree (CCD) model, we assessed LST–NTL coupling. Most cities followed a typical pattern of “urban core < suburban < rural” (Figure 14). In dense cores, stabilized NTL and moderating effects of green spaces, water bodies, and targeted heat island mitigation measures limit LST variation, yielding low CCD (partial decoupling). By contrast, suburban and rural fringes demonstrate higher CCD as NTL and LST intensify together with development. Regional statistics further substantiate this spatial differentiation, with peripheral areas of Urumqi, Hohhot, Tianjin, and Nanning exhibiting relatively high CCD, whereas lower core CCD is more evident in central-western cities, highlighting the crucial influence of urban development stages and spatial configurations on LST–NTL relationships.
Quantitatively, CCD values mostly range from 0.4 to 0.7 (“preliminary” to “basic” coordination). Urumqi exhibited the highest CCD (0.63), indicating a stable and closely coordinated relationship between LST and NTL during extensive outward development. This was followed by Shanghai (0.62), Tianjin, and Nanning (both at 0.61), where functional zone development and intensified human activities progressed in close synchrony. In contrast, Xining displayed the lowest CCD (0.50), attributable to its plateau environment, sparse urban fabric, and limited lighting, which resulted in substantial LST variability with only weak NTL responses—highlighting insufficient coupling. Meanwhile, Guangzhou and Chengdu (both at 0.54) showed considerable internal variability, with boxplots indicating wide interquartile ranges and dispersed outliers, reflecting complex urban spatial structures and substantial intra-city differences in development intensity and thermal regulation (Figure 15).

4. Discussion

4.1. Differences in Urban–Rural Trends Between NTL and LST

This study elucidates the spatiotemporal evolution of nighttime light (NTL) and land surface temperature (LST), along with their driving mechanisms, across multiple cities and climatic regions in China over the period 2000–2020. The results demonstrate that NTL generally exhibited rapid, linear growth across different climatic regions (R2 > 0.86), whereas LST changes followed a weaker, non-linear trend (R2 < 0.1), highlighting a pronounced divergence between the two indicators. The growth rate of NTL in inland cities (e.g., Chengdu: 1.25 nW/cm2/sr/a) significantly exceeded that of coastal cities (e.g., Shanghai: 0.48 nW/cm2/sr/a), reflecting disparities attributable to differing stages of urban development [57,58].
Climatic differences exerted a substantial moderating influence on LST variations. For instance, the plateau temperate semi-arid region (Xining) recorded a relatively modest average annual warming rate (0.04 °C/a), underscoring the buffering capacity of high-altitude environments under certain conditions. In contrast, the mid temperate semi-arid region (Hohhot) exhibited a cooling trend (–0.02 °C/a), likely driven by large-scale ecological restoration projects, thereby confirming the cooling potential of ecological interventions in arid zones. Urban spatial structure also shaped the heat–light response patterns: monocentric cities (e.g., Zhengzhou, Chengdu) exhibited strong synergistic increases in NTL and LST, whereas polycentric cities (e.g., Shanghai, Tianjin) displayed smoother gradients of heat and light attenuation due to functional diffusion, aligning with Han et al.’s (2022) findings that urban morphology regulates the dispersion of the urban heat island (UHI) effect [59].
Along the urban–rural gradient, the integration of power-law and gradient analyses revealed that urban resources followed a typical Pareto distribution, with 28% of the core area accounting for 89% of NTL and 75% of built-up land. The spatial differentiation of LST was governed by both natural and anthropogenic factors. Dense vegetation belts along urban fringes served as ecological buffers, where LST remains lower [60,61], while urban cores experienced thermal accumulation due to high-density development. Particularly noteworthy was the emergence of an “accelerated suburban heat island” phenomenon: LST growth rates at urban fringes (0.16 ± 0.08 °C/a) were significantly higher than those in core areas, reaching up to 0.31 °C/a in suburban Chengdu, indicating an outward expansion of the heat island effect.
Ecological and climatic factors jointly shaped the heat–light dynamics at urban peripheries. For example, in Hohhot’s suburbs, NTL decreased by 99.5% relative to urban centers, yet LST declined by only 11.5%, reflecting the thermal buffering provided by surrounding grassland ecosystems. In contrast, coastal cities such as Tianjin exhibited milder thermal gradients under marine influence, whereas inland arid-region cities like Urumqi displayed pronounced thermal boundaries (temperature differences > 6 °C), further corroborating the compounded roles of climate and ecology in driving urban–rural thermal disparities [62].
In summary, by integrating multi-scale methodologies with diverse urban samples, this study systematically reveals the non-linear change mechanisms and regional variability of LST and NTL along urban–rural gradients. These findings advance our understanding of the coupled responses of thermal environments and human activities under urban expansion, offering robust empirical evidence to deepen insights into the evolution of urban thermal systems.

4.2. Long-Term Correlation Between NTL and LST

Building upon the analysis of urban–rural disparities in NTL and LST trends, this study further quantified their long-term interrelationship. The correlations analysis showed limited urban–rural variation, though rural zones in most cities exhibited stronger NTL–LST correlations than urban cores, reflecting tighter associations in urban expansion zones. In contrast, pronounced climatic differences emerged. Coastal cities such as Shanghai and Tianjin displayed robust positive correlations across gradients, whereas arid basins (Urumqi, Chengdu) and plateau settings (Xining) exhibited weak, negligible, or even negative associations. These results suggest that the NTL–LST relationship is not solely controlled by anthropogenic intensity, but also significantly modulated by regional climate and meteorological processes, including humidity, wind circulation, and diurnal temperature amplitude [63].
Although correlations were statistically significant (p < 0.01) in nine cities, their generally low magnitudes (|r| < 0.4) indicate that long-term NTL variations provide only limited explanatory power for LST trends. Such limitations are closely related to the thermal inertia of land surfaces under different climatic regions and the varying radiative responses at distinct temporal scales. In humid coastal climates, the high heat capacity and latent heat exchange of moist air weaken the sensitivity of LST to NTL, whereas in arid inland basins, sparse vegetation and high solar insolation amplify daytime fluctuations but reduce nocturnal consistency [64]. This constraint also arises from the phenomenon of “rising luminosity with latent thermal effects”: in newly urbanized fringe areas, pronounced increases in NTL are accompanied by relatively weak thermal accumulation or dissipation, reflecting the immature stage of built-up environments and thereby reducing the concordance of long-term trends between NTL and LST.
Given these constraints, we employed bivariate spatial autocorrelation to capture spatial heterogeneity. The results revealed that eastern cities exhibited significant positive spatial autocorrelation between NTL and LST changes (Moran’s I > 0), predominantly with HH (high–high) and LL (low–low) clustering, supporting a synergistic evolution of human activities and the thermal environment. In contrast, western cities such as Chengdu and Urumqi displayed negative spatial autocorrelation (Moran’s I < 0), with HL/LH (high–low/low–high) clustering prevailing. These spatial patterns coincide with climatic gradients: cities in humid and temperate regions tend to show synchronous variation due to stable boundary-layer dynamics, while those in arid or high-altitude areas reveal decoupled responses driven by atmospheric instability and frequent inversion layers.
Further insights from the coupled coordination degree analysis highlighted the dynamic equilibrium characteristics of urban–rural systems. Notably, the coordination of NTL and LST trends followed a spatial gradient opposite to that of their correlation strength, i.e., “rural > suburban > urban core”. Weak coupling was prevalent within urban cores, whereas suburban zones exhibited moderate coordination levels (0.4–0.7). These findings align with the work of Yue et al. (2022), suggesting that urban fringes have yet to establish stable response mechanisms amid rapid urbanization [65,66]. Particularly noteworthy was the observation that developed coastal cities, such as Shanghai and Tianjin, exhibited synchronous moderation in NTL growth and LST changes, corroborating the theoretical proposition by Hong et al. (2025) that “heat island stabilization emerges during saturated stages of urban development” [67].
By integrating bivariate spatial autocorrelation and the coupling coordination model, this study transcends the explanatory limitations of traditional statistical methods regarding spatial heterogeneity and non-linear interactions. Building on this, the study constructs a tripartite regulatory framework to explain the asymmetric patterns of urban development and thermal environment change across urban–rural gradients. These asymmetries are not simply spatial in nature but are fundamentally constrained by climatic context, with both the direction and magnitude of the relationship shaped by regional climate conditions. This framework, encompassing climatic background, urban developmental stage, and spatial gradients, offers novel perspectives for understanding the coupling dynamics of urban human–land systems.

4.3. Implications for Urban Thermal Management

This study provides robust empirical evidence supporting differentiated urban thermal environment management grounded in spatial heterogeneity. The results highlight that urban thermal governance should move beyond uniform, citywide strategies and adopt targeted interventions tailored to specific spatial units.
Priority should be directed toward urban fringes, where the observed weak coupling between NTL and LST reflects unstable thermal conditions and a high risk of intensification. At the early stages of new-town planning and land development, vegetation patches and water bodies should be strategically embedded as core ecological infrastructure to establish a structural cooling network. Such measures can prevent the consolidation of heat island effects under intensive development and shift governance from reactive mitigation to anticipatory guidance.
Planning strategies must also account for the interactions between urban spatial morphology and climatic context. In monocentric cities, enhancing the permeability and connectivity of blue–green spaces in the core can alleviate thermal accumulation induced by dense construction [23]. In polycentric cities, maintaining ecological buffers and ventilation corridors between nodes is essential to preserve regional airflow and heat exchange [51]. In arid and semi-arid regions, ecological restoration should be continuously advanced, with its cooling benefits incorporated into urban development assessments [68]. Coastal cities, in contrast, can capitalize on the moderating influence of marine climates through spatial design.
Moreover, the negative correlations between NTL and LST identified in ecologically fragile western regions and cities with complex topography underscore the necessity of strictly adhering to ecological carrying capacity. Planning in such areas must prioritize the protection and restoration of critical natural assets (e.g., mountains, forests, grasslands), strictly regulate development boundaries and intensity, and minimize irreversible human-induced perturbations to local climates.
In conclusion, it is recommended that thermal environmental risk assessment be systematically embedded within the national spatial planning framework. Establishing an early-warning and tracking mechanism based on coordinated NTL–LST monitoring, with particular attention to high-intensity development zones where thermal responses remain latent, will be crucial to mitigating delayed deterioration of thermal environments and ensuring the sustainable development of urban living conditions.

4.4. Uncertainty

This study systematically examined the long-term trends and correlation characteristics of NTL and LST across ten representative cities situated within distinct climatic regions. However, several sources of uncertainty warrant further investigation.
First, the analysis was restricted to ten large metropolitan areas—typically provincial capitals or municipalities—with high levels of urbanization. Although these cities capture strong anthropogenic signals, the limited sample size constrains the generalizability of the results to smaller or functionally distinct cities. Moreover, climatic representativeness varies among these samples; while the dataset spans humid, semi-arid, and plateau regions, intra-regional meteorological diversity (e.g., precipitation regimes, monsoon variability, and aerosol loading) may influence the comparability of NTL–LST patterns.
Second, while NTL serves as a useful proxy for urban expansion, it insufficiently represents multidimensional urban characteristics such as demographic shifts, industrial structures, and spatial morphology. Similarly, the static threshold-based urban–rural gradient derived from GUB data may not fully reflect the spatiotemporal heterogeneity of long-term urban growth. This limitation is further complicated by the distinct response timescales of LST to anthropogenic forcing: surface temperature reacts to instantaneous radiative and convective fluxes, whereas NTL integrates cumulative socio-economic activity, leading to potential temporal mismatches across monthly, seasonal, and decadal scales.
Third, despite standardization and cross-sensor calibration, discrepancies in spatial resolution, overpass timing, and sensor performance between MODIS LST and NPP-VIIRS NTL may introduce temporal noise. For instance, MODIS LST represents instantaneous thermal conditions determined by atmospheric transparency and diurnal radiation cycles, whereas NTL observations are restricted to nocturnal illumination conditions under clear-sky assumptions. Consequently, the asynchronous sampling times and differing temporal coverage may obscure short-term meteorological influences, such as nocturnal temperature inversions, humidity, and cloud cover.
In addition, LST measures radiative surface temperature rather than near-surface air temperature, and NTL data are prone to saturation and blooming effects in highly urbanized areas. Such sensor-dependent limitations highlight the need for multi-sensor fusion and cross-temporal normalization when investigating human–thermal interactions across varying climate regimes. At large scales, it is also difficult to disentangle the confounding influences of topography, water bodies, atmospheric circulation, and industrial heat emissions, raising the risk of ecological fallacy when inferring fine-scale mechanisms from aggregated patterns.
Future studies should incorporate meteorological reanalysis datasets (e.g., temperature, humidity, wind, and cloud fraction) [69,70] together with multidimensional urbanization indicators (e.g., POI density, land use, and 3D urban morphology) [71,72,73] to assess the scale-dependent sensitivity of NTL–LST relationships across different climatic contexts. Integrating high-resolution remote sensing, machine learning, and multi-temporal analyses will enable more accurate characterization of intra-urban variability and enhance understanding of how climatic and anthropogenic factors jointly regulate long-term thermal environment dynamics.

5. Conclusions

This study employed an urban–rural gradient framework to systematically examine the long-term dynamics and spatial linkages between nighttime light (NTL) and land surface temperature (LST) in ten representative Chinese cities from 2000 to 2020. The findings reveal that both nighttime light and land surface temperature display a characteristic spatial pattern—high in urban centers and diminishing toward the periphery—gradually decreasing with greater distance from city cores. Specifically, NTL intensity was highly concentrated in urban cores and followed a power-law distribution, yet its growth rate was slowest in core areas and accelerated toward the fringe. LST changes were relatively moderate but regionally heterogeneous, with steeper gradients in northern and inland cities and gentler declines in coastal and southern regions. Notably, the NTL–LST relationship was neither uniform nor linear. Correlation was weakest in urban cores but strengthened toward suburban zones, where coupling coordination also peaked, reflecting the outward expansion of the urban heat island. In contrast, core areas often showed decoupling, where LST stabilized or saturated despite continuous NTL growth, indicating a spatiotemporal mismatch between human activity and surface warming.
Climatic context further modulated these interactions. Coastal humid cities exhibited strong positive correlations and synchronized increases in NTL and LST, while plateau and arid regions displayed weak or even negative associations due to ecological restoration and climatic buffering. Coupling coordination generally decreased from east to west. Overall, the interplay between NTL and LST—in terms of correlation, spatial autocorrelation, and coupling coordination—demonstrated asymmetry, climate sensitivity, and scale dependence. Suburban areas emerged as critical transition zones with the most unstable light–heat interactions, necessitating prioritized spatial governance tailored to specific climatic and developmental contexts to mitigate thermal risks and guide sustainable urban development.

Author Contributions

Conceptualization, J.L. and Y.Z.; methodology, W.L.; software, W.L.; validation, W.L., Y.Z. and J.L.; formal analysis, J.L., D.L. and Y.Z.; investigation, J.L. and Y.Z.; resources, W.L.; data curation, W.L. and D.L.; writing—original draft preparation, W.L. and J.L.; writing—review and editing, W.L., Y.Z., J.L., D.L. and X.H.; visualization, W.L.; supervision, J.L., Y.Z. and X.H.; project administration, J.L., Y.Z. and X.H. All authors have read and agreed to the published version of the manuscript.

Funding

This research was funded by the National Key Research and Development Program, grant number 2021xjkk0303.

Data Availability Statement

Please refer to Section 2.2 of the article for detailed information on the sources of data used in this study.

Acknowledgments

We gratefully acknowledge the National Aeronautics and Space Administration (NASA) for providing MOD11A2 land surface temperature data, and the National Earth System Science Data Center for the “NPP-VIIRS-like” nighttime light dataset. Special thanks to the developers of the China Land Cover Dataset (CLCD) and the Global Urban Boundary (GUB) dataset for their valuable open-access resources. We also appreciate the Google Earth Engine platform for enabling large-scale geospatial data processing. We express our gratitude to the anonymous reviewers for their valuable feedback and constructive suggestions.

Conflicts of Interest

The authors declare no conflicts of interest.

Abbreviations

The following abbreviations are used in this manuscript:
NTLNighttime Light
LSTLand Surface Temperature
CCDCoupling Coordination Degree

References

  1. Oke, T.R. The Energetic Basis of the Urban Heat Island. Q. J. R. Meteorolog. Soc. 1982, 108, 1–24. [Google Scholar] [CrossRef]
  2. Liang, Z.; Huang, J.; Wang, Y.; Wei, F.; Wu, S.; Jiang, H.; Zhang, X.; Li, S. The Mediating Effect of Air Pollution in the Impacts of Urban Form on Nighttime Urban Heat Island Intensity. Sustain. Cities Soc. 2021, 74, 102985. [Google Scholar] [CrossRef]
  3. Li, X.; Zhou, Y.; Yu, S.; Jia, G.; Li, H.; Li, W. Urban Heat Island Impacts on Building Energy Consumption: A Review of Approaches and Findings. Energy 2019, 174, 407–419. [Google Scholar] [CrossRef]
  4. Yang, J.; Zhou, M.; Ren, Z.; Li, M.; Wang, B.; Liu, D.L.; Ou, C.-Q.; Yin, P.; Sun, J.; Tong, S.; et al. Projecting Heat-Related Excess Mortality under Climate Change Scenarios in China. Nat. Commun. 2021, 12, 1039. [Google Scholar] [CrossRef]
  5. Ullah, S.; You, Q.; Chen, D.; Sachindra, D.A.; AghaKouchak, A.; Kang, S.; Li, M.; Zhai, P.; Ullah, W. Future Population Exposure to Daytime and Nighttime Heat Waves in South Asia. Earth’s Future 2022, 10, e2021EF002511. [Google Scholar] [CrossRef]
  6. Doan, Q.-V.; Chen, F.; Kusaka, H.; Dipankar, A.; Khan, A.; Hamdi, R.; Roth, M.; Niyogi, D. Increased Risk of Extreme Precipitation over an Urban Agglomeration with Future Global Warming. Earth’s Future 2022, 10, e2021EF002563. [Google Scholar] [CrossRef]
  7. Taripanah, F.; Ranjbar, A. Quantitative Analysis of Spatial Distribution of Land Surface Temperature (LST) in Relation Ecohydrological, Terrain and Socio-Economic Factors Based on Landsat Data in Mountainous Area. Adv. Space Res. 2021, 68, 3622–3640. [Google Scholar] [CrossRef]
  8. Wang, C.; Ren, Z.; Guo, Y.; Zhang, P.; Hong, S.; Ma, Z.; Hong, W.; Wang, X. Assessing Urban Population Exposure Risk to Extreme Heat: Patterns, Trends, and Implications for Climate Resilience in China (2000–2020). Sustain. Cities Soc. 2024, 103, 105260. [Google Scholar] [CrossRef]
  9. Bennett, M.M.; Smith, L.C. Advances in Using Multitemporal Night-Time Lights Satellite Imagery to Detect, Estimate, and Monitor Socioeconomic Dynamics. Remote Sens. Environ. 2017, 192, 176–197. [Google Scholar] [CrossRef]
  10. Jia, M.; Li, X.; Gong, Y.; Belabbes, S.; Dell’Oro, L. Estimating Natural Disaster Loss Using Improved Daily Night-Time Light Data. Int. J. Appl. Earth Obs. Geoinf. 2023, 120, 103359. [Google Scholar] [CrossRef]
  11. Perez-Sindin, X.S.; Chen, T.-H.K.; Prishchepov, A. Are Night-Time Lights a Good Proxy of Economic Activity in Rural Areas in Middle and Low-Income Countries? Examining the Empirical Evidence from Colombia. Remote Sens. Appl. Soc. Environ. 2021, 24, 100647. [Google Scholar] [CrossRef]
  12. Xu, P.; Lin, M.; Jin, P. Spatio-Temporal Dynamics of Urbanization in China Using DMSP/OLS Nighttime Light Data from 1992–2013. Chin. Geogr. Sci. 2021, 31, 70–80. [Google Scholar] [CrossRef]
  13. Zhang, Q.; Seto, K.C. Mapping Urbanization Dynamics at Regional and Global Scales Using Multi-Temporal DMSP/OLS Nighttime Light Data. Remote Sens. Environ. 2011, 115, 2320–2329. [Google Scholar] [CrossRef]
  14. Shi, K.; Huang, C.; Yu, B.; Yin, B.; Huang, Y.; Wu, J. Evaluation of NPP-VIIRS Night-Time Light Composite Data for Extracting Built-up Urban Areas. Remote Sens. Lett. 2014, 5, 358–366. [Google Scholar] [CrossRef]
  15. Ren, J.; Yang, J.; Zhang, Y.; Xiao, X.; Xia, J.C.; Li, X.; Wang, S. Exploring Thermal Comfort of Urban Buildings Based on Local Climate Zones. J. Clean. Prod. 2022, 340, 130744. [Google Scholar] [CrossRef]
  16. Guo, A.; Yang, J.; Sun, W.; Xiao, X.; Xia Cecilia, J.; Jin, C.; Li, X. Impact of Urban Morphology and Landscape Characteristics on Spatiotemporal Heterogeneity of Land Surface Temperature. Sustain. Cities Soc. 2020, 63, 102443. [Google Scholar] [CrossRef]
  17. Fan, Q.; Shi, Y.; Mutale, B.; Cong, N. Spatiotemporal Gravitational Evolution of the Night Land Surface Temperature: An Empirical Study Based on Night Lights. Remote Sens. 2023, 15, 4347. [Google Scholar] [CrossRef]
  18. Li, L.; Yu, T.; Zhao, L.; Zhan, Y.; Zheng, F.; Zhang, Y.; Mumtaz, F.; Wang, C. Characteristics and Trend Analysis of the Relationship between Land Surface Temperature and Nighttime Light Intensity Levels over China. Infrared Phys. Technol. 2019, 97, 381–390. [Google Scholar] [CrossRef]
  19. Chen, W.; Zhang, Y.; Pengwang, C.; Gao, W. Evaluation of Urbanization Dynamics and Its Impacts on Surface Heat Islands: A Case Study of Beijing, China. Remote Sens. 2017, 9, 453. [Google Scholar] [CrossRef]
  20. Nganyiyimana, J.; Ngarambe, J.; Yun, G.Y. Nighttime Light: A Potential Proxy for Local Nocturnal Urban Heat Island Intensity in Seoul. J. Green Build. 2023, 18, 29–41. [Google Scholar] [CrossRef]
  21. Liu, X.; Li, X. Luojia Nighttime Light Data with a 130m Spatial Resolution Providing a Better Measurement of Gridded Anthropogenic Heat Flux than VIIRS. Sustain. Cities Soc. 2023, 94, 104565. [Google Scholar] [CrossRef]
  22. Dewan, A.; Kiselev, G.; Botje, D.; Mahmud, G.I.; Bhuian, M.H.; Hassan, Q.K. Surface Urban Heat Island Intensity in Five Major Cities of Bangladesh: Patterns, Drivers and Trends. Sustain. Cities Soc. 2021, 71, 102926. [Google Scholar] [CrossRef]
  23. Wu, Y.; Che, Y.; Liao, W.; Liu, X. The Impact of Urban Morphology on Land Surface Temperature across Urban-Rural Gradients in the Pearl River Delta, China. Build. Environ. 2025, 267, 112215. [Google Scholar] [CrossRef]
  24. Zhang, J.; Zhang, P.; Liu, Z.; Yang, D.; Li, M. Response of Vegetation Phenology to Seasonal Land Surface Temperature in the Beijing-Tianjin-Hebei Region under Urbanization Background. IEEE J. Sel. Top. Appl. Earth Obs. Remote Sens. 2025, 18, 12180–12193. [Google Scholar] [CrossRef]
  25. Yang, J.; Li, J.; Xu, F.; Li, S.; Zheng, M.; Gong, J. Urban Development Wave: Understanding Physical Spatial Processes of Urban Expansion from Density Gradient of New Urban Land. Comput. Environ. Urban Syst. 2022, 97, 101867. [Google Scholar] [CrossRef]
  26. Yang, L.; Li, X.; Shang, B. Impacts of Urban Expansion on the Urban Thermal Environment: A Case Study of Changchun, China. Chin. Geogr. Sci. 2022, 32, 79–92. [Google Scholar] [CrossRef]
  27. Zhou, D.; Zhao, S.; Liu, S.; Zhang, L.; Zhu, C. Surface Urban Heat Island in China’s 32 Major Cities: Spatial Patterns and Drivers. Remote Sens. Environ. 2014, 152, 51–61. [Google Scholar] [CrossRef]
  28. Zhao, C.; Zhu, H.; Zhang, S.; Jin, Z.; Zhang, Y.; Wang, Y.; Shi, Y.; Jiang, J.; Chen, X.; Liu, M. Long-term Trends in Surface Thermal Environment and Its Potential Drivers along the Urban Development Gradients in Rapidly Urbanizing Regions of China. Sustain. Cities Soc. 2024, 105, 105324. [Google Scholar] [CrossRef]
  29. Xie, J.; Zhou, S.; Chung, L.C.H.; Chan, T.O. Evaluating Land-Surface Warming and Cooling Environments across Urban–Rural Local Climate Zone Gradients in Subtropical Megacities. Build. Environ. 2024, 251, 111232. [Google Scholar] [CrossRef]
  30. Stuhlmacher, M.; Georgescu, M.; Turner, B.L.; Hu, Y.; Goldblatt, R.; Gupta, S.; Frazier, A.E.; Kim, Y.; Balling, R.C.; Clinton, N. Are Global Cities Homogenizing? An Assessment of Urban Form and Heat Island Implications. Cities 2022, 126, 103705. [Google Scholar] [CrossRef]
  31. Xue, X.; He, T.; Xu, L.; Tong, C.; Ye, Y.; Liu, H.; Xu, D.; Zheng, X. Quantifying the Spatial Pattern of Urban Heat Islands and the Associated Cooling Effect of Blue-Green Landscapes Using Multisource Remote Sensing Data. Sci. Total Environ. 2022, 843, 156829. [Google Scholar] [CrossRef]
  32. Yang, J.; Wang, Y.; Xiu, C.; Xiao, X.; Xia, J.; Jin, C. Optimizing Local Climate Zones to Mitigate Urban Heat Island Effect in Human Settlements. J. Clean. Prod. 2020, 275, 123767. [Google Scholar] [CrossRef]
  33. Quantifying Surface Urban Heat Island Variations and Patterns: Comparison of Two Cities in Three-Stage Dynamic Rural–Urban Transition. Sustain. Cities Soc. 2024, 109, 105538. [CrossRef]
  34. Guan, S.; Chen, Y.; Wang, T.; Hu, H. Mitigating Urban Heat Island through Urban-Rural Transition Zone Landscape Configuration: Evaluation Based on an Interpretable Ensemble Machine Learning Framework. Sustain. Cities Soc. 2025, 123, 106272. [Google Scholar] [CrossRef]
  35. Mortoja, M.G.; Yigitcanlar, T.; Mayere, S. What Is the Most Suitable Methodological Approach to Demarcate Peri-Urban Areas? A Systematic Review of the Literature. Land Use Policy 2020, 95, 104601. [Google Scholar] [CrossRef]
  36. Jingyun, Z.; Yunhe, Y.; Bingyuan, L. A New Scheme for Climate Regionalization in China. Acta Geogr. Sin. 2010, 65, 3–12. [Google Scholar] [CrossRef]
  37. Geng, X.; Zhang, D.; Li, C.; Yuan, Y.; Yu, Z.; Wang, X. Impacts of Climatic Zones on Urban Heat Island: Spatiotemporal Variations, Trends, and Drivers in China from 2001–2020. Sustain. Cities Soc. 2023, 89, 104303. [Google Scholar] [CrossRef]
  38. Peng, S.; Feng, Z.; Liao, H.; Huang, B.; Peng, S.; Zhou, T. Spatial-Temporal Pattern of, and Driving Forces for, Urban Heat Island in China. Ecol. Indic. 2019, 96, 127–132. [Google Scholar] [CrossRef]
  39. Li, J.; Wang, F.; Fu, Y.; Guo, B.; Zhao, Y.; Yu, H. A Novel SUHI Referenced Estimation Method for Multicenters Urban Agglomeration Using DMSP/OLS Nighttime Light Data. IEEE J. Sel. Top. Appl. Earth Obs. Remote Sens. 2020, 13, 1416–1425. [Google Scholar] [CrossRef]
  40. Wang, C.; Middel, A.; Myint, S.W.; Kaplan, S.; Brazel, A.J.; Lukasczyk, J. Assessing Local Climate Zones in Arid Cities: The Case of Phoenix, Arizona and Las Vegas, Nevada. ISPRS J. Photogramm. Remote Sens. 2018, 141, 59–71. [Google Scholar] [CrossRef]
  41. Qiu, R.; Zhan, Q.; Tu, S. Long-Term Global Trends and Influencing Factors of Surface Urban Cool and Heat Islands. Int. J. Digital Earth 2025, 18, 2489731. [Google Scholar] [CrossRef]
  42. Liu, Z.; Wang, J.; Ding, J.; Xie, X. Analysis of Spatial-Temporal Evolution Trends and Influential Factors of Desert-Oasis Thermal Environment in Typical Arid Zone: The Case of Turpan-Hami Region. Ecol. Indic. 2023, 154, 110747. [Google Scholar] [CrossRef]
  43. Wang, C.; Ren, Z.; Du, Y.; Guo, Y.; Zhang, P.; Wang, G.; Hong, S.; Ma, Z.; Hong, W.; Li, T. Urban Vegetation Cooling Capacity Was Enhanced under Rapid Urbanization in China. J. Clean. Prod. 2023, 425, 138906. [Google Scholar] [CrossRef]
  44. Amorim, M.C.d.C.T.; Dubreuil, V.; Amorim, A.T. Day and Night Surface and Atmospheric Heat Islands in a Continental and Temperate Tropical Environment. Urban Clim. 2021, 38, 100918. [Google Scholar] [CrossRef]
  45. Yao, N.; Li, Y.; Lei, T.; Peng, L. Drought Evolution, Severity and Trends in Mainland China over 1961–2013. Sci. Total Environ. 2018, 616, 73–89. [Google Scholar] [CrossRef]
  46. Chen, Z.; Yu, B.; Yang, C.; Zhou, Y.; Yao, S.; Qian, X.; Wang, C.; Wu, B.; Wu, J. An Extended Time Series (2000-2018) of Global NPP-VIIRS-like Nighttime Light Data from a Cross-Sensor Calibration. Earth Syst. Sci. Data 2021, 13, 889–906. [Google Scholar] [CrossRef]
  47. Yang, J.; Huang, X. The 30 m Annual Land Cover Dataset and Its Dynamics in China from 1990 to 2019. Earth Syst. Sci. Data 2021, 13, 3907–3925. [Google Scholar] [CrossRef]
  48. Li, X.; Gong, P.; Zhou, Y.; Wang, J.; Bai, Y.; Chen, B.; Hu, T.; Xiao, Y.; Xu, B.; Yang, J.; et al. Mapping Global Urban Boundaries from the Global Artificial Impervious Area (GAIA) Data. Environ. Res. Lett. 2020, 15, 94044. [Google Scholar] [CrossRef]
  49. Lian, D.; Yuan, B.; Li, X.; Shi, Z.; Ma, Q.; Hu, T.; Miao, S.; Huang, J.; Dong, G.; Liu, Y. The Contrasting Trend of Global Urbanization-Induced Impacts on Day and Night Land Surface Temperature from a Time-Series Perspective. Sustain. Cities Soc. 2024, 109, 105521. [Google Scholar] [CrossRef]
  50. Homer, C.; Dewitz, J.; Jin, S.; Xian, G.; Costello, C.; Danielson, P.; Gass, L.; Funk, M.; Wickham, J.; Stehman, S.; et al. Conterminous United States Land Cover Change Patterns 2001-2016 from the 2016 National Land Cover Database. ISPRS-J. Photogramm. Remote Sens. 2020, 162, 184–199. [Google Scholar] [CrossRef] [PubMed]
  51. Sun, Y.; Gao, C.; Li, J.; Li, W.; Ma, R. Examining Urban Thermal Environment Dynamics and Relations to Biophysical Composition and Configuration and Socio-Economic Factors: A Case Study of the Shanghai Metropolitan Region. Sustain. Cities Soc. 2018, 40, 284–295. [Google Scholar] [CrossRef]
  52. Burn, D.H.; Hag Elnur, M.A. Detection of Hydrologic Trends and Variability. J. Hydrol. 2002, 255, 107–122. [Google Scholar] [CrossRef]
  53. Sen, P.K. Estimates of the Regression Coefficient Based on Kendall’s Tau. J. Am. Stat. Assoc. 1968, 63, 1379–1389. [Google Scholar] [CrossRef]
  54. Anselin, L. Local Indicators of Spatial Association—LISA. Geogr. Anal. 1995, 27, 93–115. [Google Scholar] [CrossRef]
  55. Li, Y.; Li, Y.; Zhou, Y.; Shi, Y.; Zhu, X. Investigation of a Coupling Model of Coordination between Urbanization and the Environment. J. Environ. Manag. 2012, 98, 127–133. [Google Scholar] [CrossRef]
  56. Yao, L.; Li, X.; Li, Q.; Wang, J. Temporal and Spatial Changes in Coupling and Coordinating Degree of New Urbanization and Ecological-Environmental Stress in China. Sustainability 2019, 11, 1171. [Google Scholar] [CrossRef]
  57. Liu, S.; Liu, W.; Zhou, Y.; Wang, S.; Wang, Z.; Wang, Z.; Wang, Y.; Wang, X.; Hao, L.; Wang, F. Analysis of Economic Vitality and Development Equilibrium of China’s Three Major Urban Agglomerations Based on Nighttime Light Data. Remote Sens. 2024, 16, 4571. [Google Scholar] [CrossRef]
  58. Guo, A.; Yang, J.; Xiao, X.; Xia, J.; Jin, C.; Li, X. Influences of Urban Spatial Form on Urban Heat Island Effects at the Community Level in China. Sustain. Cities Soc. 2020, 53, 101972. [Google Scholar] [CrossRef]
  59. Han, S.; Li, W.; Kwan, M.-P.; Miao, C.; Sun, B. Do Polycentric Structures Reduce Surface Urban Heat Island Intensity? Appl. Geogr. 2022, 146, 102766. [Google Scholar] [CrossRef]
  60. Han, G.; Xu, J. Land Surface Phenology and Land Surface Temperature Changes along an Urban–Rural Gradient in Yangtze River Delta, China. Environ. Manag. 2013, 52, 234–249. [Google Scholar] [CrossRef]
  61. Jia, W.; Zhao, S. Trends and Drivers of Land Surface Temperature along the Urban-Rural Gradients in the Largest Urban Agglomeration of China. Sci. Total Environ. 2020, 711, 134579. [Google Scholar] [CrossRef] [PubMed]
  62. Wu, W.-B.; Yu, Z.-W.; Ma, J.; Zhao, B. Quantifying the Influence of 2D and 3D Urban Morphology on the Thermal Environment across Climatic Zones. Landsc. Urban Plan. 2022, 226, 104499. [Google Scholar] [CrossRef]
  63. Caicedo, V.; Rappenglueck, B.; Cuchiara, G.; Flynn, J.; Ferrare, R.; Scarino, A.J.; Berkoff, T.; Senff, C.; Langford, A.; Lefer, B. Bay Breeze and Sea Breeze Circulation Impacts on the Planetary Boundary Layer and Air Quality from an Observed and Modeled DISCOVER-AQ Texas Case Study. J. Geophys. Res. Atmos. 2019, 124, 7359–7378. [Google Scholar] [CrossRef]
  64. Zhu, Q.; Ran, L.; Zhang, Y.; Guan, Q. Integrating Geographic Knowledge into Deep Learning for Spatiotemporal Local Climate Zone Mapping Derived Thermal Environment Exploration across Chinese Climate Zones. ISPRS-J. Photogramm. Remote Sens. 2024, 217, 53–75. [Google Scholar] [CrossRef]
  65. Yue, X.; Liu, W.; Wang, X.; Yang, J.; Lan, Y.; Zhu, Z.; Yao, X. Constructing an Urban Heat Network to Mitigate the Urban Heat Island Effect from a Connectivity Perspective. Sustain. Cities Soc. 2024, 114, 105774. [Google Scholar] [CrossRef]
  66. Shi, Z.; Jia, G.; Hu, Y.; Zhou, Y. The Contribution of Intensified Urbanization Effects on Surface Warming Trends in China. Theor. Appl. Climatol. 2019, 138, 1125–1137. [Google Scholar] [CrossRef]
  67. Hong, T.; Huang, X.; Lv, Q.; Zhao, S.; Wang, Z.; Yang, Y. Thermal Mitigation in Coastal Cities: Marine and Urban Morphology Effects on Land Surface Temperature in Xiamen. Buildings 2025, 15, 1170. [Google Scholar] [CrossRef]
  68. Wang, J.; Cui, X.; Zhao, F.; Huang, M.; Guo, Y.; Wang, Q.; Shao, B.; Tong, Y. ECOSTRESS-Based Analysis of Diurnal Urban Heat Island Intensity and Thermal Dynamics Across LCZ in Six Chinese Cities with Diverse Terrain and Elevation. IEEE J. Sel. Top. Appl. Earth Observ. Remote Sens. 2025, 18, 15236–15248. [Google Scholar] [CrossRef]
  69. Sheng, L.; Tang, X.; You, H.; Gu, Q.; Hu, H. Comparison of the Urban Heat Island Intensity Quantified by Using Air Temperature and Landsat Land Surface Temperature in Hangzhou, China. Ecol. Indic. 2017, 72, 738–746. [Google Scholar] [CrossRef]
  70. Wang, C.; Zhan, W.; Li, L.; Wang, S.; Wang, C.; Miao, S.; Du, H.; Jiang, L.; Jiang, S. Urban Heat Islands Characterized by Six Thermal Indicators. Build. Environ. 2023, 244, 110820. [Google Scholar] [CrossRef]
  71. Xi, Y.; Wang, S.; Zou, Y.; Zhou, X.; Zhang, Y. Seasonal Surface Urban Heat Island Analysis Based on Local Climate Zones. Ecol. Indic. 2024, 159, 111669. [Google Scholar] [CrossRef]
  72. Peng, J.; Tian, L.; Liu, Y.; Zhao, M.; Hu, Y.; Wu, J. Ecosystem Services Response to Urbanization in Metropolitan Areas: Thresholds Identification. Sci. Total Environ. 2017, 607, 706–714. [Google Scholar] [CrossRef] [PubMed]
  73. Su, H.; Han, G.; Li, L.; Qin, H. The Impact of Macro-Scale Urban Form on Land Surface Temperature: An Empirical Study Based on Climate Zone, Urban Size and Industrial Structure in China. Sustain. Cities Soc. 2021, 74, 103217. [Google Scholar] [CrossRef]
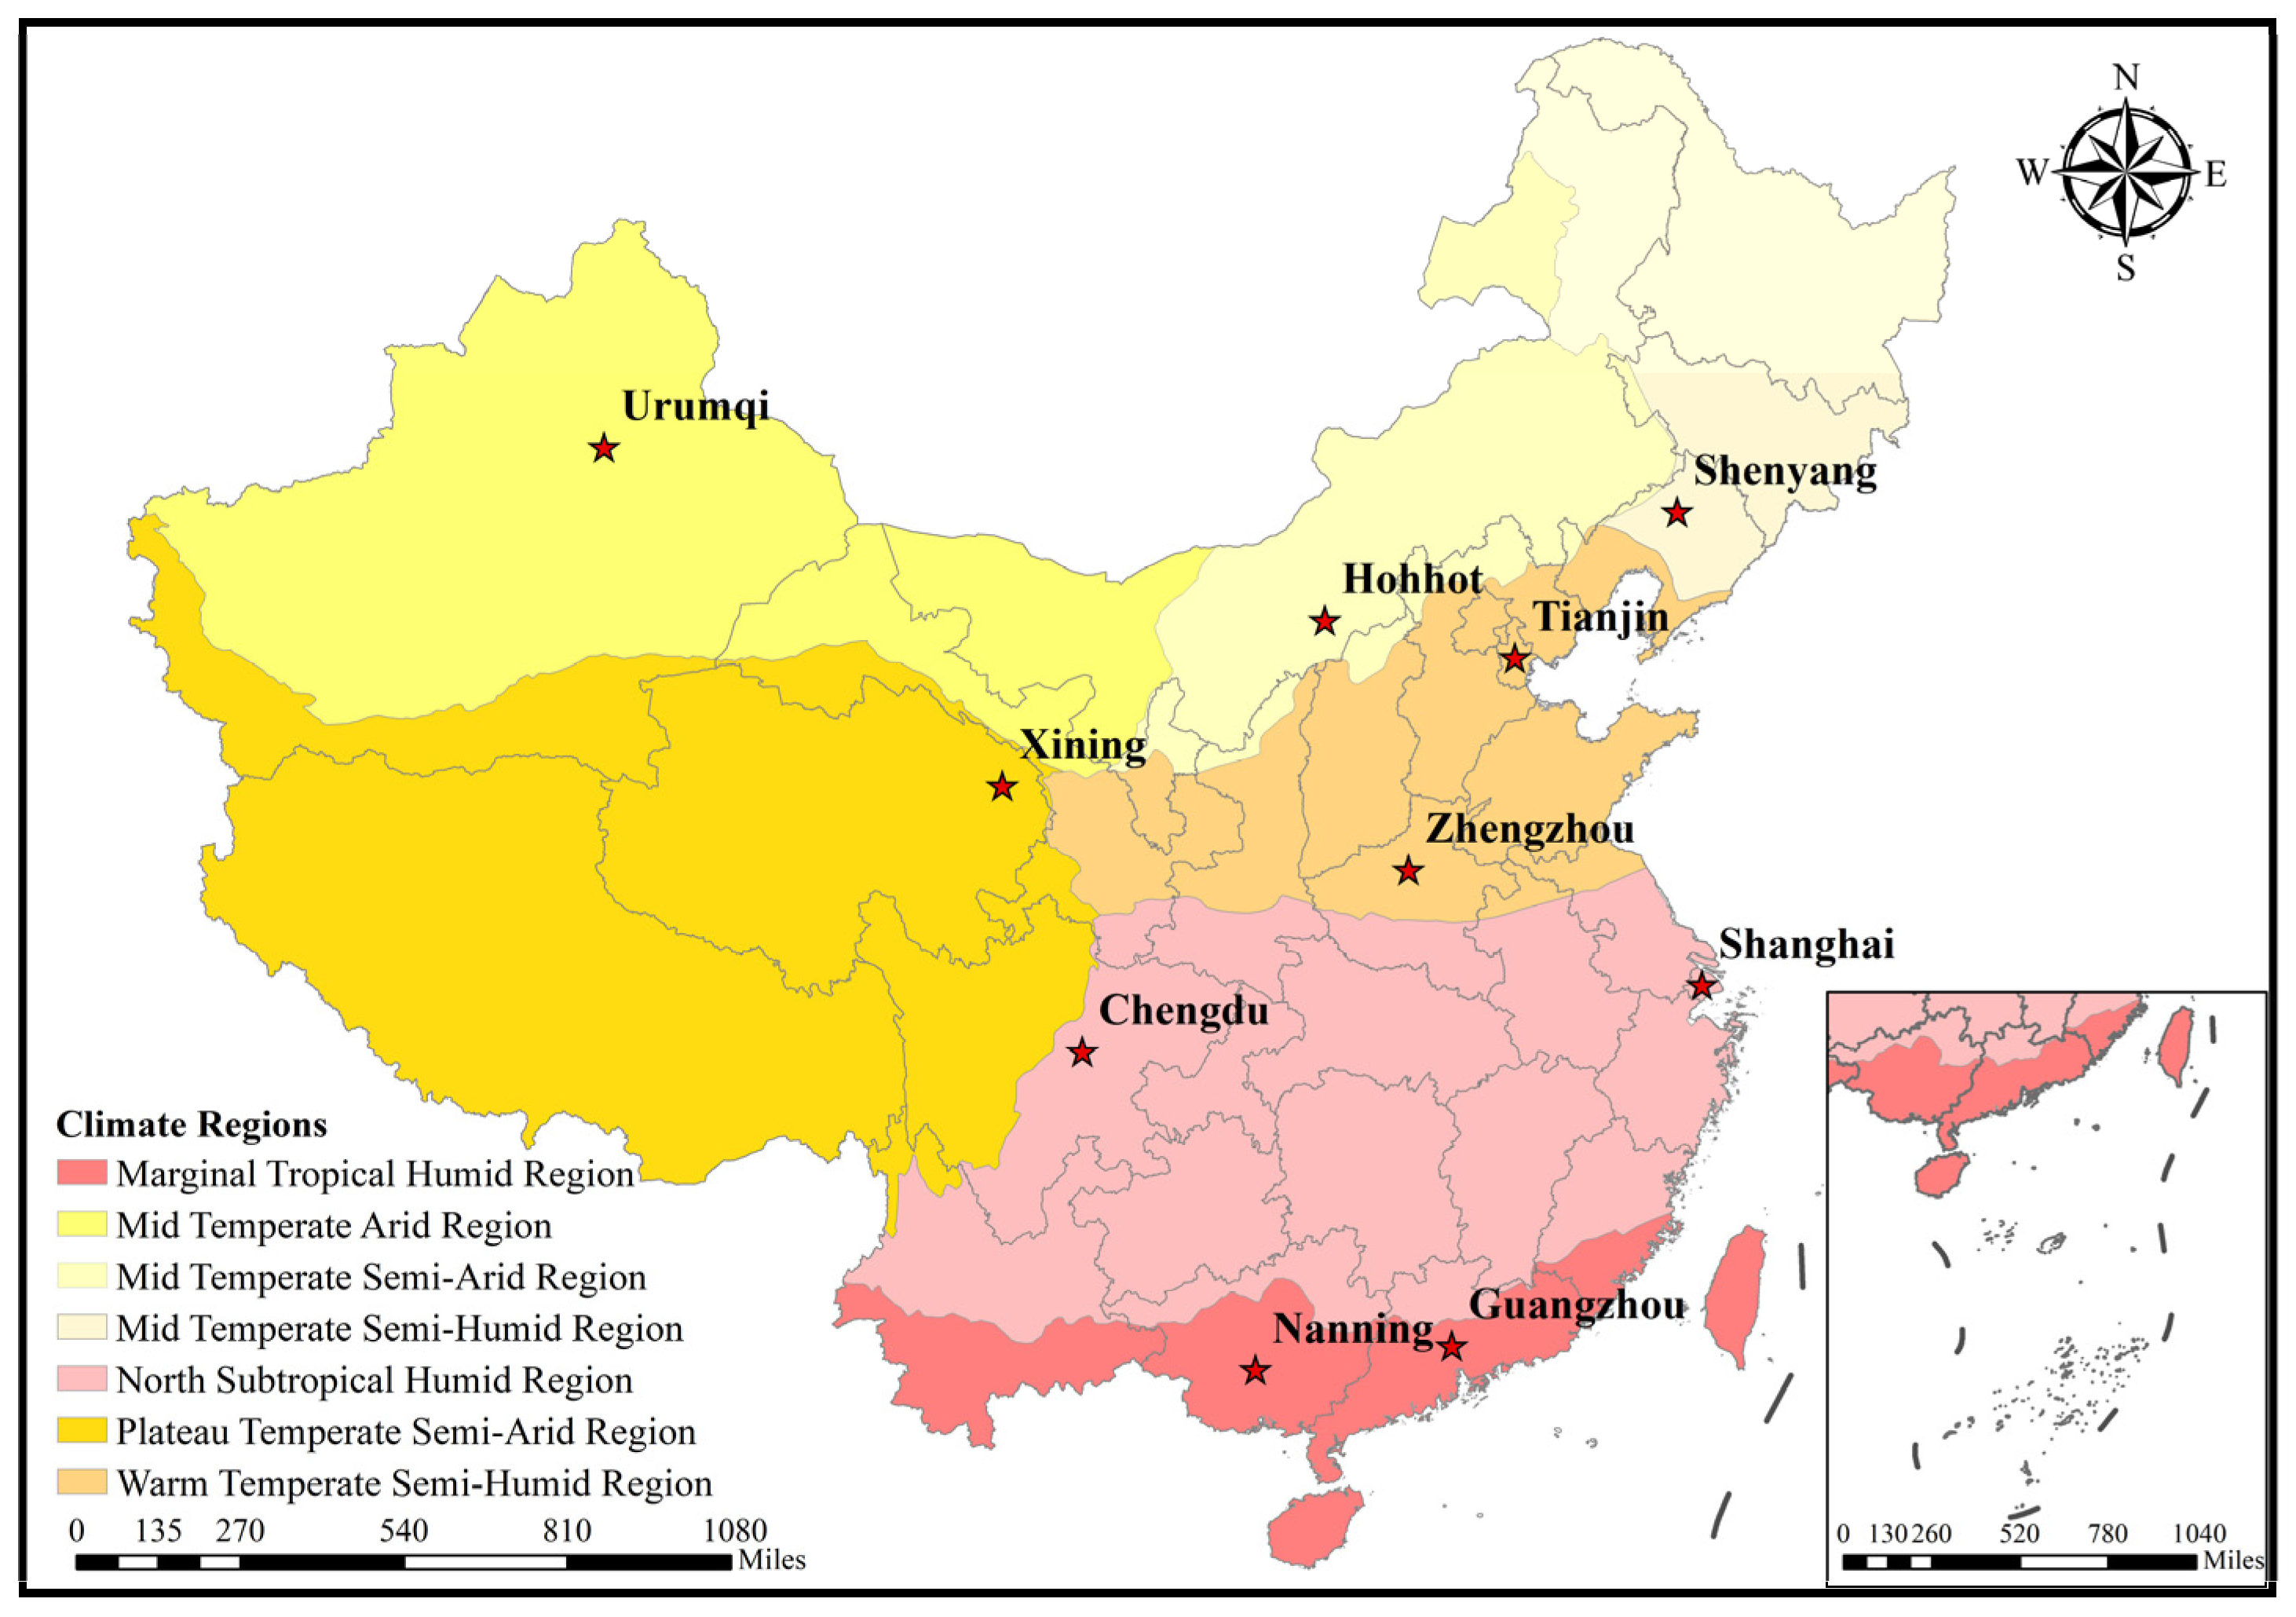
Figure 1. Geographic distribution of ten representative cities across China’s climatic regions.
Remotesensing 17 03585 g001
Figure 2. Technical flowchart.
Remotesensing 17 03585 g002
Figure 3. Delineation of urban, suburban, and rural zones based on GUB data, exemplified by Shenyang.
Remotesensing 17 03585 g003
Figure 4. Annual mean trends of LST (a) and NTL (b) across China’s climate zones, 2000–2020.
Remotesensing 17 03585 g004
Figure 5. Spatial rank-order patterns of NTL, LST, built-up density, and vegetation cover across different buffer distances (overall average for ten representative cities, 2000–2020). Negative distance bins (−10 to −5 km, −5 to 0 km) represent inner-core buffers within the urban boundary. Red numbers and squares highlight values around 80%, which serve as a key indicator for assessing the distribution’s conformity to a power law.
Remotesensing 17 03585 g005
Figure 6. Urban–rural profiles of annual mean LST and NTL with power-law fitting results for representative cities across China’s climate zones, 2000–2020. Negative distance bins follow the same definition as in Figure 5.
Remotesensing 17 03585 g006aRemotesensing 17 03585 g006b
Figure 7. Spatial distribution of LST trend slopes and comparison of means and standard deviations across urban, suburban, and rural subregions in representative cities across China’s climate zones, 2000–2020.
Remotesensing 17 03585 g007
Figure 8. Comparison of the spatial distribution and proportional significance levels of LST trends in representative cities across China’s climate zones, 2000–2020.
Remotesensing 17 03585 g008
Figure 9. Spatial distribution of NTL trend slopes and comparison of means and standard deviations across urban, suburban, and rural subregions in representative cities across China’s climate zones, 2000–2020.
Remotesensing 17 03585 g009
Figure 10. Comparison of the spatial distribution and proportional significance levels of NTL trends in representative cities across China’s climate zones, 2000–2020.
Remotesensing 17 03585 g010
Figure 11. Correlation analysis results of LST and NTL trends in representative cities within China’s climate zones.
Remotesensing 17 03585 g011
Figure 12. Comparison of bivariate spatial autocorrelation patterns and clustering proportions of LST and NTL trends in representative cities within China’s climate zones.
Remotesensing 17 03585 g012
Figure 13. Vegetation cover vs. built-up area proportions in representative cities within China’s climate zones, 2000 vs. 2020.
Remotesensing 17 03585 g013
Figure 14. Spatial distribution of the coupled coordination of LST and NTL trends and comparison of urban, suburban, and rural means in representative cities within China’s climate zones.
Remotesensing 17 03585 g014
Figure 15. Statistical distribution of coupling coordination levels of LST and NTL trend changes in representative cities within China’s climate zones.
Remotesensing 17 03585 g015
Table 1. Overview of representative cities selected across climate zones in China.
Climate ZoneCityClimate CharacteristicsCity Size 1Location
Marginal tropical humid regionGuangzhouHot and humid climate under strong maritime influence, frequent typhoonsMegacityCoastal estuarine delta
NanningHot and humid, with stagnant air in an inland basin, calm winds, and heavy summer rainfallType II Big CityInland basin
Northern subtropical humid regionShanghaiFour distinct seasons, strong maritime influence, mild and humid climateMegacityCoastal alluvial plain
ChengduFour distinct seasons, frequent fog and overcast conditions, basin confinement with stagnant airMegacityInland basin
Warm temperate semi-humid regionTianjinCold winters and hot summers, spring droughts, partly moderated by maritime influenceMegacityCoastal plain
ZhengzhouCold winters and hot summers, pronounced spring droughts, dominated by continental influenceSuper-large CityInland plain
Plateau temperate semi-arid RegionXiningLow temperatures, intense solar radiation, and extreme diurnal temperature variationType II Big CityInland river valley
Mid temperate semi-humid regionShenyangSevere winters and relatively warm summers, characterized by strong continentalitySuper-large CityInland plain
Mid temperate semi-arid regionHohhotArid climate with minimal precipitation, high evaporation, and large thermal fluctuationsType II Big CityInland plateau
Mid temperate
arid region
UrumqiExtremely arid, sparse vegetation, and pronounced diurnal and seasonal temperature variabilityType I Big CityInland oasis
1 The classification of city size is derived from data obtained in China’s Seventh National Population Census. Classifications follow Chinese State Council standards: Megacity (>10 M), Super-large City (5–10 M), Type I Big City (3–5 M), Type II Big City (1–3 M).
Table 2. Linear regression results of NTL and LST across China’s climate zones, 2000–2020.
Climate ZoneLinear Regression (LST) R 2 (LST)p Value (LST)
Marginal tropical humid regiony = 0.008x + 12.6110.0300.46
Northern subtropical humid regiony = 0.019x − 10.2820.0920.18
Warm temperate semi-humid regiony = −0.0054x + 40.6870.0010.88
Plateau temperate semi-arid regiony = 0.031x − 39.7410.0350.42
Mid temperate semi-humid regiony = −0.042x + 109.4120.0870.19
Mid temperate semi-arid regiony = −0.072x + 179.1350.0960.17
Mid temperate arid regiony = 0.0156x + 10.7390.0310.44
Climate ZoneLinear Regression (NTL) R 2 (NTL)p Value (NTL)
Marginal tropical humid regiony = 0.047x − 93.5770.8610.00
Northern subtropical humid regiony = 0.036x − 72.8560.8810.00
Warm temperate semi-humid regiony = 0.040x − 79.0160.9190.00
Plateau temperate semi-arid regiony = 0.0006x − 1.1990.9190.00
Mid temperate semi-humid regiony = 0.005x − 10.9550.8960.00
Mid temperate semi-arid regiony = 0.006x − 12.6020.9390.00
Mid temperate arid regiony = 0.003x − 5.5730.9080.00
Table 3. Correlation analysis results of LST and NTL trends across urban, suburban, and rural subregions in representative cities within China’s climate zones.
Climate ZoneCityUrban CoreSuburbanRural
Marginal tropical humid regionGuangzhou0.31 (p < 0.01)0.33 (p < 0.01)0.24 (p < 0.01)
Nanning0.22 (p < 0.01)0.38 (p < 0.01)0.32 (p < 0.01)
Northern subtropical humid regionShanghai0.36 (p < 0.01)0.17 (p < 0.01)0.48 (p < 0.01)
Chengdu−0.02 (p = 0.65)−0.17 (p < 0.01)0.05 (p = 0.20)
Warm temperate semi-humid regionTianjin0.22 (p < 0.01)0.34 (p < 0.01)0.45 (p < 0.01)
Zhengzhou0.18 (p < 0.01)0.37 (p < 0.01)0.40 (p < 0.01)
Plateau temperate semi-arid regionXining0.01 (p = 0.43)0.17 (p = 0.55)0.43 (p = 0.38)
Mid temperate semi-humid regionShenyang0.12 (p = 0.04)−0.07 (p = 0.17)0.28 (p < 0.01)
Mid temperate semi-arid regionHohhot0.08 (p = 0.89)0.09 (p = 0.08)0.10 (p < 0.01)
Mid temperate arid regionUrumqi−0.10 (p = 0.01)−0.06 (p = 0.57)0.15 (p = 0.03)
Disclaimer/Publisher’s Note: The statements, opinions and data contained in all publications are solely those of the individual author(s) and contributor(s) and not of MDPI and/or the editor(s). MDPI and/or the editor(s) disclaim responsibility for any injury to people or property resulting from any ideas, methods, instructions or products referred to in the content.