Highlights
What are the main findings?
- Spatially aggregating the output fluxes was more accurate than spatially aggregating inputs when estimating latent energy using a Two-Source Energy Balance Priestley–Taylor model.
- Spatially aggregating data from unmanned aerial systems to estimate latent energy using the two-source energy model was closer to eddy flux tower measurements than applying manned aircraft and satellite imagery.
What is the implication of the main finding?
- Latent energy estimates from data collected by unmanned aerial systems can be a reliable source of spatial latent energy in a field with variable soil properties.
Abstract
Daily evapotranspiration (ET) estimated from an unoccupied aerial system (UAS) could help improve irrigation practices, but its spatial resolution needs to be upscaled to coarser pixel resolutions before applying surface energy balance models. The purpose of this study was to evaluate the impact of various energy balance-based aggregation schemes on generating spatially distributed latent heat flux (LE), and, in comparison, to existing occupied aircraft and satellite remote sensing platforms. In 2017, UAS multispectral and thermal imagery, along with ground truth data, were collected at various cotton growth stages. These data sources were combined to model LE using a Two-Source Energy Balance Priestley–Taylor (TSEB-PT) model. Several UAS aggregation schemes were tested, including the mode of aggregation (i.e., input image and output flux) as well as the averaging scheme (i.e., simple aggregation vs. Box–Cox). Results indicate that output flux aggregation with Box–Cox averaging produced the lowest relative upscaling pixel-scale variability in LE and the lowest absolute prediction errors (relative to eddy covariance flux tower measurements). Output flux aggregation with simple averaging was also more accurate in reproducing LE from occupied aircraft and satellite imagery. Although results are limited to a single site, UAS LE estimates were reliably aggregated to coarser pixel resolutions, which made for faster image processing for operational applications.
1. Introduction
Actual evapotranspiration (ETa in mm per unit time) has been estimated using thermal and multispectral imagery from sensors located aboard non-commercial geostationary and polar-orbiting satellites (or SATs collectively) [1]. However, SAT imagery is not guaranteed to be cloud-free [2], and more frequent thermal observations are needed to capture day-to-day variability in ETa and plant stress, as in the case of combining multi-sensor sources [3]. Furthermore, even ET at the highest SAT pixel resolution (currently 30 m) may not be sufficient to adequately detect crop and soil variability within a single production field in agricultural settings. While alternative platforms such as commercial SATs and occupied aerial systems (OASs) can provide enhanced spatial and temporal information, both have high acquisition costs, as survey companies require a minimum area for coverage to at least break even [4].
Unoccupied aerial systems (UASs) have been proposed as an alternative to monitor ETa within a given production field [5]. This is because, relative to OASs and commercial/non-commercial SATs, users have the most control over image collection [4]. UASs can offer additional advantages in terms of spatial detail, with imagery as fine as 0.05 m having been reported [6]. The value of such high pixel resolutions can be appreciated within certain applications, such as crop scouting [2]. In other applications, such as irrigation management, this extra spatial detail is usually unnecessary [7]. Mismatches can exist between the observation scale at which UAS images are collected and the application scale at which decisions are implemented. Drip irrigation systems, for example, operate on a spatial scale from 1–10 m2, central pivots on 100 m2, and furrow irrigation on 1000 m2 [8]. If UAS imagery is indeed more detailed than is necessary, prolonged processing times can even delay the delivery of the end product. A customer survey report by [8] indicates that most users require ETa maps less than a day after image acquisition, a demand that can be met with UASs, given a proper workflow.
In addition to the application scale, UAS images can also present discrepancies with respect to the LE modeling scale. For example, mismatches may result between the defined modeling scale and processes that define these models, such as shear-driven turbulence [9]. These discrepancies are most apparent within LE algorithms such as the two-source energy balance (TSEB) model. TSEB models were initially developed and applied at pixel resolutions associated with non-commercial SATs (e.g., 60–120 m pixel resolution) [10,11,12]. Under the TSEB model, canopy and soil temperatures (Tc and Ts, respectively) are estimated at each pixel, which are then used to find LE as a residual from the energy balance equation. The assumption behind the TSEB-PT model, therefore, is that each pixel contains both vegetation and soil components. However, such assumptions are not always met with UAS imagery, where pixel resolutions can be fine enough to capture both components. Under these conditions, application of the TSEB-PT model, therefore, may not provide reliable estimates of LE, since the model algorithms were not necessarily designed to operate at very fine resolutions.
Discrepancies between observation, management, and modeling scales can be mitigated by transferring information using scaling techniques [13]. In the case of the UAS, one such scaling technique can be performed through up-scaling, or aggregating, images to a coarser pixel resolution [14]. Initial studies quantifying the effects of aggregation on ET (or LE) modeling have been primarily confined to pixel resolutions associated with SAT imagery [15,16]. For example, one study aggregated Landsat 5/7 thermal/multispectral imagery from original resolutions to various pixel resolutions (0.06–1 km) and then ran contextual surface energy balance system (SEBS) ET models at each resolution, a process called input aggregation [17]. In their results, they reported relative canopy ET (or ETc) pixel-scale errors ranging from 25 to 60 percent, which they attributed to changes in sensible heat (H), specifically roughness length for heat and momentum (zoh and zom, respectively). Another study suggests that input aggregation is detrimental when model parameters (such as zoh and zom) behave in a non-linear fashion [18]. Ref. [17] also found that pixel-scale ETc errors were reduced when the fluxes were modeled at the initial Landsat resolution and then aggregated, an alternative process called output aggregation.
Errors from input-aggregated SEBS fluxes could be reduced by applying alternative aggregation rules (e.g., for linear, harmonic, or geometric roughness length averaging) [19]. However, the optimal averaging rule has rarely been analyzed in terms of non-contextual ET models such as TSEB. TSEB can be favorable over the SEBS and contextual models, in general, because it eliminates the need for empirical corrections of excess resistance (i.e., zom, zoh) [20]. In one of the few papers on the topic, Ref. [19] showed that, at least with ASTER SAT imagery, ET fluxes using TSEB models were more conservative across spatial scales (i.e., 0.1 to 1 km) than contextual models such as the SEBS. However, such studies have not been extensively evaluated with UAS imagery, except for [21] for a particular crop type, since image quality can vary depending on weather conditions (e.g., wind, radiation, temperature, vapor pressure) and/or sensor quality [22].
The purpose of this study was to investigate the scaling properties of UAS-based LE estimates from a TSEB model. In particular, the interest is in comparing the different modes of UAS aggregation (i.e., input vs. output, linear vs. non-linear averaging) at partial and full canopy cover conditions from a cotton row crop. There is additional interest in determining the contributing sources of error that result from these different aggregation modes. Finally, UAS maps are compared with those obtained from OAS and SAT imagery.
2. Materials and Methods
2.1. Study Area and Management
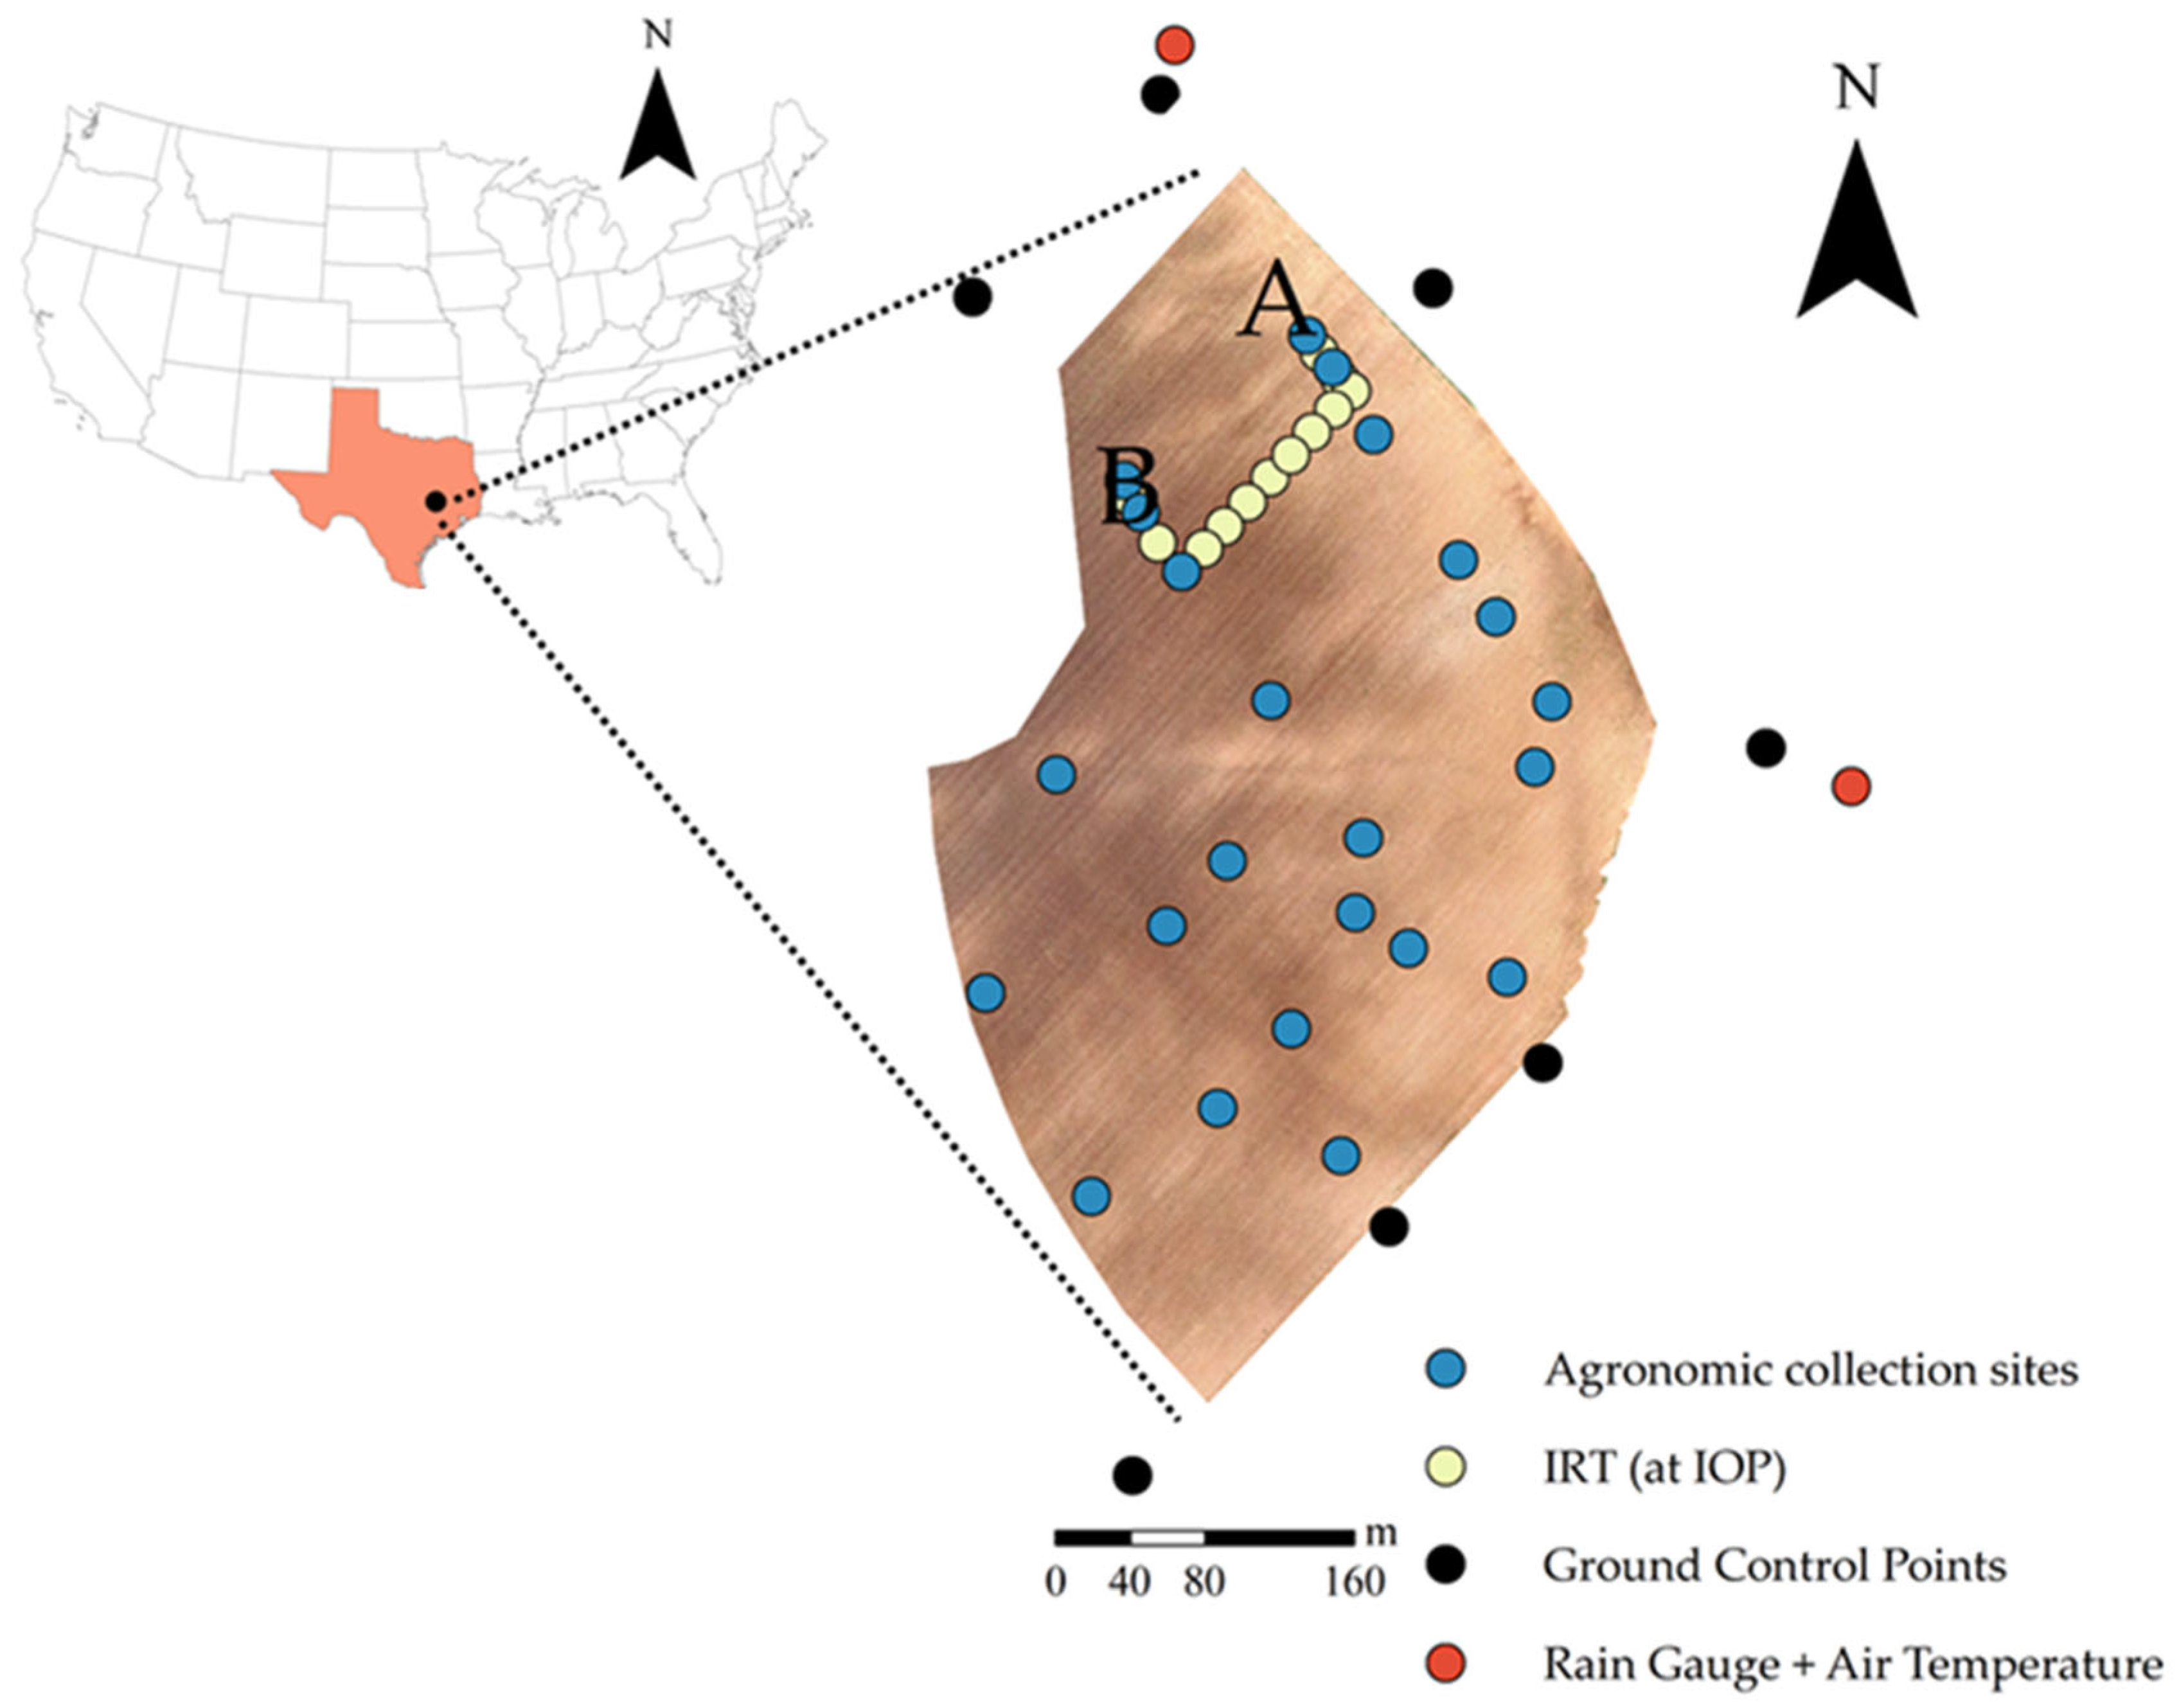
The study site (17 ha, 30.531°N, −96.431°W) is located on the Texas A&M Experimental Farm in central-eastern Texas (Figure 1). The region has a humid subtropical climate (Cfa) according to the Köppen climate classification system. Soil color varies within the field, with darker and lighter soils on the west and east sides of the field, respectively. Soil surface textures include silt loam, silty clay loam, and silty clay [23], and the soils are classified as Vertisols, Inceptisols, and Entisols as they vary across the field [24]. Elevations are relatively constant, with an average elevation of 67.7 ± 0.3 m above ground level (coefficient of variation = 0.44). Total in-season precipitation and average daily air temperatures based on local rain gauges (red circles, Figure 1) were 495 mm and 26.0 °C, respectively.
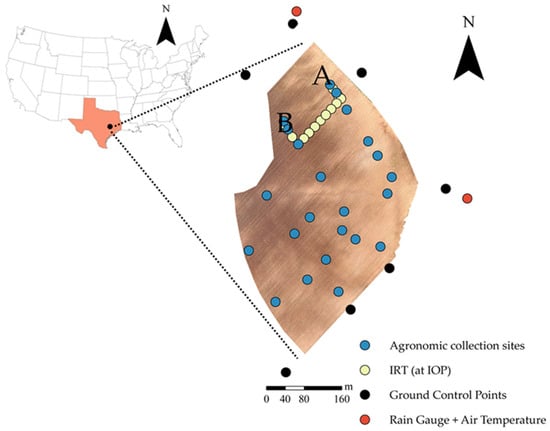
Figure 1.
Location of study area within the United States and the state of Texas (in red). The letters ‘A’ and ‘B’ refer to two different eddy covariance towers installed during the 2017 field season. A visual image was obtained by a consumer-grade digital camera aboard a UAS about two weeks before planting (5 April 2017). Also shown are locations of various field equipment and agronomic data deployed throughout the 2017 growing season. Agronomic collection sites include measured variables such as leaf area index, canopy height, and canopy width. Additional infrared thermography (IRT) measurements were consistently collected at the time of each UAS overpass or intense observation period (IOP) (yellow) for UAS temperature validation.
In past seasons, the field was actively managed with conventional tillage practices and kept in a continuous crop rotation with alternate years of corn (Zea mays L.) and cotton (Gossypium hirsutum L.). On 5 April 2017 (day of year = 95), cotton (variety PHY 444 WRF) was planted at a rate of 111,200 seeds ha−1 and at 1.02 m row spacing. Pre-emerge and post-emergence herbicides (Prowl H2O, Cotoran 4L, Cornerstone Plus) were applied to ensure uniform stand establishment. In-season management of cotton included fertilization, plant growth regulation, and weed control. Based on field measurements, first flowering was observed on June 8 (64 days after planting, or DAP), with cutout (i.e., 5 nodes above white flower or NAWF) on 1 July 2017. Boll filling occurred approximately between June 29 and July 28 (85-112 DAP, defined here as 2 NAWF). Open bolls for about 90 percent of the field occurred around September 1 (210 DAP). Defoliation occurred on 9 September 2017 (157 days after planting, or DAP), and harvest was conducted on 10 October 2017 (188 DAP).
2.2. Image Acquisition
One of the objectives of this study was to compare UAS-aggregated LE imagery with that from OAS and SAT platforms. Table 1 shows the dates of intense observation periods (IOPs) when UAS, OAS, and SAT surveys were conducted over the field in the 2017 growing season. The images collected at these dates and times form the basis of the images for this study. SAT in this study refers to Landsat 8, a satellite that operates in sun-synchronous, near-polar orbit. SAT thermal images are initially collected at 100 m but subsequently resampled to 30 m resolution via cubic convolution [25]. The SAT multispectral bands are defined at 30 m resolution. The main growth stages selected for this study include cotton flowering and boll filling. Note that UAS multispectral and thermal surveys were conducted separately due to platform limitations. Survey altitudes for UAS, OAS, and SAT systems were approximately 0.12, 1.37, and 705 km, respectively (Table 1).

Table 1.
Flight times and pixel resolutions for all intensive observation periods. The local times associated with each multispectral and thermal survey are also described by survey platform, along with its reported altitudes and native or original pixel resolutions for each sensor. MS—Multispectral. No SAT data was available on July 28 due to cloud cover.
The lag time between the UAS and SAT surveys on 16 June 2017 was about one hour. Previous attempts were made to conduct a UAS thermal survey at the time of the SAT overpass (i.e., 11:57, Table 1) to ensure similar radiative conditions between platforms. However, cloud variability was present during the survey, and partial cloud cover was observed from the SAT imagery (Figure A1). SAT images were not available on July 26 or July 28 (i.e., UAS thermal and multispectral surveys, Table 1) because the next overpass date was not until 3 August 2017. Both multispectral and thermal images were necessary for TSEB-PT modeling (Section 2.4).
Relative to the SAT, OAS surveys were conducted much closer in time to UAS thermal surveys. The average flight time for OAS surveys at 1.37 km was 13 min. All multispectral and thermal afternoon flights were conducted within ±two hours of solar noon, which is defined here as 13:30 local time (Table 1). The pixel resolutions from the multispectral camera were 0.48 m, while those from the thermal camera were 1.31 m (Table 1). Both multispectral and thermal sensors equipped on the OAS platform were flown at the same time. On 26 July 2017, only a UAS multispectral survey was conducted so that the TSEB-PT model could be run from UAS thermal surveys on July 28 (Section 2.4)—no UAS multispectral survey was conducted on July 28 because it was collected two days prior (Table 1).
2.2.1. UAS Sensors
Sensors equipped aboard the Tuffwing UAS platform (Boerne, TX, USA) are given in Table 2. The multispectral camera used in this study was the Micasense RedEdge (MicaSense, Seattle, WA, USA). The RedEdge camera is a complementary metal–oxide–semiconductor sensor that detects visible and near-infrared radiation. Thermal images were collected using an ICI 8640-P sensor (Infrared Cameras Inc., Beaumont, TX, USA). The 8640-P is an uncooled focal plane array microbolometer with vanadium oxide film. Previous use of the RedEdge and the ICI 8640-P sensors towards vegetation monitoring and plant phenotyping has been documented [26,27].

Table 2.
Remote sensing platform and sensor characteristics used in the study 1.
2.2.2. OAS Sensors
OAS multispectral images were collected with a Nikon D810 camera (Melville, NY, USA). Thermal images were collected using a FLIR SC660 sensor, which, like the ICI 8640-P, is an uncooled focal plane array microbolometer (Wilsonville, OR, USA, https://www.flir.com/ (accessed on 19 October 2025)). The FLIR SC660 has a slightly smaller range for detecting thermal radiation (7.5–13 μm) than the ICI 8640-P (7.0–14.0 μm, Table 2). The D810 multispectral sensor was set under manual settings, with an exposure time of 0.001 s. The D810 and SC660 have previous applications in monitoring crop water status [28,29].
2.2.3. SAT Sensors
Landsat 8 SAT imagery was obtained on 16 June 2017, from multispectral and thermal sensors aboard the platform, namely the Operational Land Imager (OLI) and the Thermal Infrared Sensor (TIRS), respectively. The OLI was manufactured by Ball Aerospace & Technologies Corporation, while the TIRS was built by the NASA Goddard Space Flight Center. More detailed information on the characteristics of these two sensors beyond Table 2 can be found elsewhere in the literature [30]. While Landsat has two thermal bands, only band 10 (i.e., 10.6–11.19 μm) was used, as band 11 (11.5–12.51 μm) has documented stray light issues [31].
2.3. Image Post-Processing
Discussion of UAS post-processing, including geometric/radiometric corrections, can be found in Appendix A and is omitted here for the sake of brevity.
2.3.1. OAS
The goal of orthomosaicking OAS imagery was to only analyze images that cover the area spanned by the eddy covariance tower footprints for LE comparisons. While the entire field was captured in a single shot with OAS multispectral imagery, such was not the case with the thermal imagery. Because thermal images define the ET modeling domain (Section 2.5), and to simplify processing times, all OAS analysis was only conducted over these smaller portions of the field.
After data acquisition, multispectral images were first corrected from RAW to 16-bit TIFF files using the provided software (Capture NX-D 1.2.1). Because the multispectral sensor captured the entire field in one shot, mosaicking was not needed. Instead, only geo-referencing was needed using known coordinates of objects identified within the image. RGB and NIR images were first geo-referenced separately and then stacked together within ArcGIS Version 10.8.1 (ESRI, Redlands, CA, USA).
Multispectral radiometric calibrations were conducted using the empirical line calibration in order to obtain surface reflectance [32]. The main interest was in estimating red and NIR reflectance (ρRed, ρNIR) alone so that the Normalized Difference Vegetation Index (NDVI) could be calculated for later use in the LE modeling phase (Section 2.4). Ground-truth reflectance measurements were obtained with a Handheld 2 spectroradiometer instrument, which has a spectral range of 325–1075 nm, a spectral resolution of <3 nm, and a 25° FOV (ASD Inc., Boulder, CO, USA). Four 8 × 8 m tarpaulins were used for radiometric calibration, with reported nominal reflectance values of 4, 16, 32, and 48 percent [33]. The Handheld 2 collected reflectance data from these tarps during each OAS IOP, as well as measurements of soil and cotton reflectance for validation. In addition to measured reflectance values, raw sensor information (i.e., digital numbers, or DNs) was extracted from a 9 × 9-pixel box within each tarp in order to convert DNs to percent reflectance values.
All images collected by the thermal FLIR SC660 sensor were first processed to generate camera-calibrated temperatures using the provided software (ExaminIR Version 1.10.0, FLIR, Wilsonville, OR, USA). The settings supplied in ExaminIR were the same as those from the UAS processing software, mainly: (1) emissivity or ε = 1.00, (2) transmissivity or τ = 1.00, and (3) obtained air temperatures or Ta. At 1.37 km altitude, most of the field was captured in one shot (Figure A1); therefore, like the multispectral imagery, image registration was only required, and this was performed using the geo-referenced multispectral imagery as a visual aid. OAS thermal radiometric corrections were performed at each pixel by calculating emissivity (ε) values weighted by vegetation fraction cover [34], followed by estimation of surface temperature (Tr) from brightness temperature (Tbr) and background air temperature (or Tbg, via local weather data) [35].
2.3.2. SAT
Surface reflectance data from the visible/near-infrared wavelengths were obtained through the Landsat Ecosystem Disturbance Adaptive Processing System (LEDAPS). Raw thermal DNs were first obtained from the level one product using the United States Geological Survey Global Visualization Viewer (GLOVIS). Raw DNs, along with the surface reflectance data, were used to estimate Tr—detailed information regarding the conversion of SAT DN to Tr can be found in Appendix B.
2.4. Model Formulation
The purpose of this study was to evaluate how UAS LEs change as a function of coarsening pixel resolution and how such information compares with that from OASs and SATs. Within this context, LEs needed to be obtained across the entire production field. To do this, LEs were estimated using a combination of remote sensing and energy balance modeling techniques. The energy balance model used here was the TSEB model [36]. Contextual energy balance models, while popular [6,37], were hypothesized as unfavorable in this study because satellites were not expected to properly identify hot/cold temperature endmembers within the small study area (17 ha or 0.17 km2).
The general approach to TSEB models is to estimate LE as a residual of the energy balance equation, which is based on the difference between net radiation and soil heat fluxes (Rn-G) and sensible heat (H). In the original TSEB-PT formulation from [36], H is expressed from both soil and vegetation components as follows:
where ρCp is the volumetric capacity of air (J m−3 K−1), T0 is the surface aerodynamic temperature (K), Ta is the air temperature (K), and ra is the resistance to heat transport or aerodynamic resistance (s m−1). In practice, T0 is unknown and replaced with Tr, although this approach can result in an overestimation of H fluxes [38]. Ref. [36] explicitly considers the aerodynamic resistance of the soil and canopy elements originally through a parallel resistance network, and to obtain a solution, estimates LE from the canopy using the TSEB Priestley–Taylor approximation (TSEB-PT). Unlike other versions of the TSEB model (i.e., TSEB-DTD and TSEB-2T; [21]), the TSEB-PT model allows for comparisons between UAS, OAS, and SAT LEs because it uses thermal imagery comprising a mixture or composite of soil and vegetation temperatures at one point in time (Table 1). The original model formulation begins with an initial approximation of LEc based on the transpiration equation from [39] as follows:
where αPT is the Priestley–Taylor parameter with an initial value of 1.26, fg is the fraction of green vegetation (typically assumed = 1 during the growing season), Δ is the slope of the saturation vapor pressure–temperature curve (Pa K−1), γ is the psychrometric constant (Pa K−1), and Rn,c is the net radiation of the canopy computed by a procedure summarized in [38]. After LEc is initialized using Equation (1), Hc is then computed as Rn,c–LEc which then allows for Tc to be found as follows:
where ra is the aerodynamic resistance to momentum and heat transfer (s m−1), ρ is the air density (kg m−3), Cp is the specific heat of air (J kg−1 K−1), and Ta is the air temperature at the time of overpass (K). With an initial Tc from Equation (3), Ts, or soil temperature, is found by rearranging a mixing model weighted by the vegetation fraction cover (fc) and Tr values obtained from the sensor [36]:
Note that, in order to obtain an initial Tc value, fraction canopy cover (fc) is calculated from [40] as follows:
where Ω is a vegetative clumping factor calculated at a given sensor viewing angle θ [41], and the leaf area index (LAI) is calculated from multispectral imagery (see Section 2.5). A check on these Tc and Ts values is then performed by applying these newly found Ts values to find Hs:
where rs is the soil resistance to momentum and heat transfer (s m−1). Finally, LEs is found from the energy balance of the soil (LEs = Rn,s − G − Hs), where G = 0.35*Rn,s is from [41]. A valid solution is reached when LEs is positive. If a valid solution is found, the latent and sensible fluxes from both canopy (i.e., LEc = Rn,c − Hc) and soil sources are, respectively, added together to compute the LE and H terms. A more detailed description of this model can be found in [36,41]. The modeling scheme described above is the version of TSEB-PT using parallel resistance as opposed to the more complicated series resistance formulation, which is available in the Python package pyTSEB, version 2.0 (https://github.com/hectornieto/pyTSEB (accessed on 15 October 2018), Source: Hector Nieto) and applied to the imagery in this study. Details of the original series resistance formulation are in [36], while updates are described in detail in [21]. For the range of canopy cover conditions existing in this study, both parallel and series resistance formulations would yield similar results [11].
2.5. Model Inputs and Processing
To run TSEB-PT models for UAS, OAS, and SAT imagery, both image and non-image data need to be generated. Image inputs refer to spatially varying parameters such as Tr (Section 2.3), fc, and LAI. Non-image inputs refer to model inputs such as weather data (e.g., incoming solar radiation, wind speed, and air temperature) and agronomic data such as canopy height (hc) and canopy width (wc). The following sections detail the derivation of these inputs separately.
2.5.1. Image Inputs
All further discussion of input derivation applies to UAS, OAS, and SAT platforms. The fc was derived from NDVI imagery by scaling between the ‘infinite’ NDVI (NDVI∞) and soil NDVI (NDVIs) [42]:
where NDVI∞ was taken to be the maximum NDVI observed from the native pixel size (0.976). NDVIs was based on average NDVI values at a time before squaring occurred, just prior to planting (0.2).
LAI maps were then generated by regressing in situ LAI (Figure 1) against the fc maps generated from above. LAI measurements were taken with an LAI-2200C sensor (LI-COR, Lincoln, NE, USA), either one hour before sunrise or one hour before sunset. All LAI campaigns were collected in a two-day span from a UAS thermal overpass (Table 1). LAI measurements were taken in an area spanning three meters by three rows. In accordance with LICOR recommendations, all LAI observations were collected directly underneath cotton plants along a row and at one-fourth, one-half, and three-fourths distance from the cotton row. Table 3 shows field average characteristics of agronomic data collected at site locations shown in Figure 1 (dark blue circles). The field average LAI values on June 16 and July 28 were 1.03 ± 0.22 and 2.37 ± 0.34 m2 m−2, respectively.

Table 3.
Agronomic and weather data collected at the IOPs, along with their respective units. Abbreviations are as follows: (1) LAI—leaf area index; (2) hc—canopy height; (3) wc—canopy width; (4) Ta—air temperature; (5) u—wind speed; (6) Sdn—downward incoming solar radiation; (7) VPD—vapor pressure deficit. No SAT data was available on July 28 due to cloud cover. Flight times are for thermal sensor flights only.
2.5.2. Non-Image Inputs
Weather data were collected using 15-minute averaged sensor data obtained across both eddy flux towers. Weather parameters include (but are not limited to) (1) air temperature (Ta, K), (2) wind speed (u, m s−1), (3) vapor pressure deficit (VPD, kPa), (4) incoming shortwave radiation (Sdn, W m−2), and (5) longwave radiation (Ldn, W m−2). Specific weather data on June 16 and July 28 (Table 1) are shown in Table 3.
Field agronomic information was obtained by averaging spatially distributed field measurements at each IOP (Figure 1). Relevant information includes canopy height, canopy width, leaf width, leaf spectral properties, and leaf angle distribution. All canopy height and width measurements were visually observed across ten different plants at each site using measuring tape. Leaf width was visually observed from the widest points between select leaves on each plant. Leaf spectral properties were obtained using local ground-truth reflectance data. Leaf angle distribution was calculated from leaf tip angle measurements collected alongside LAI data [43].
The use of a constant G/Rn,s was based on the observation that most PM thermal UAS surveys were collected around solar noon, which is supported by observations by [44], indicating that the use of a constant ratio is appropriate for several hours around solar noon. Green vegetation fraction, fg, was set to one for all model runs. View zenith angle was set to nadir or zero degrees.
2.6. General Design of the Experiments
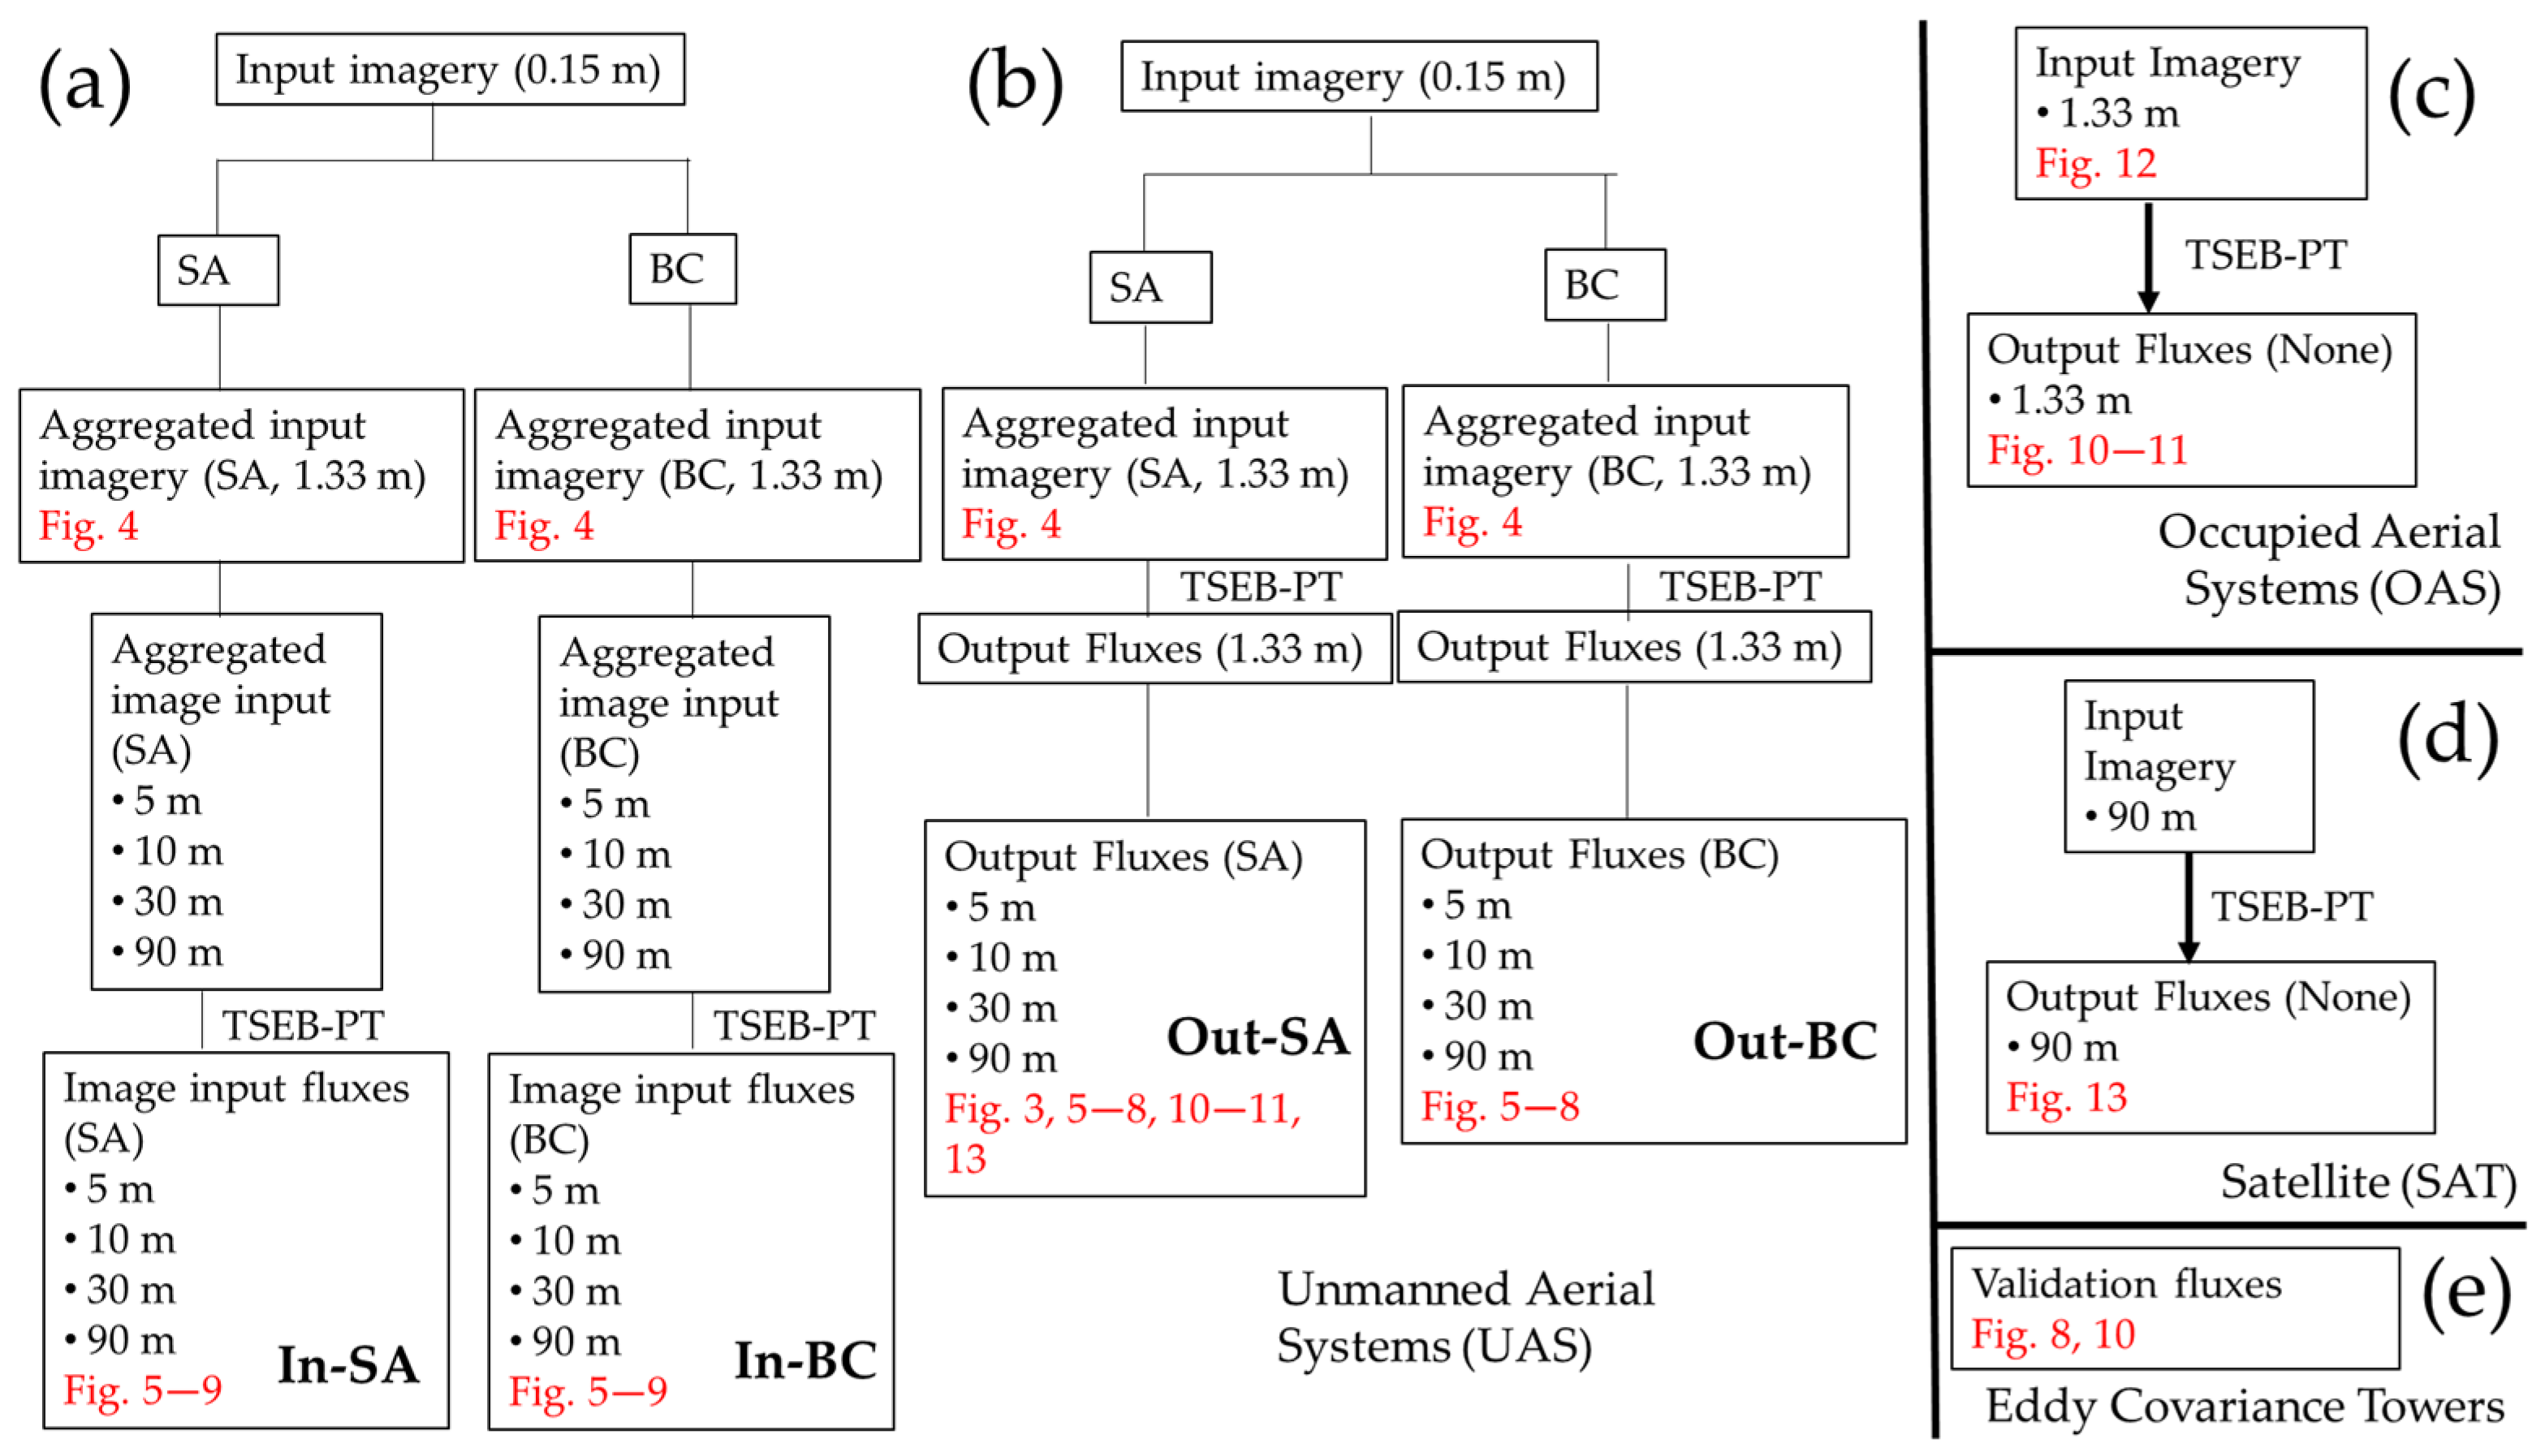
The purpose of this study was to address the effect of UAS aggregation on LE estimations. The overall methodology used to address this question is shown in Figure 2. Two basic aggregation rules, either from the input imagery or output fluxes, were applied to UAS imagery. Before these aggregation rules were applied, however, all image inputs (e.g., Tr, LAI, fc) were first aggregated to a pixel resolution of 1.33 m—this step was performed so that assumptions of TSEB modeling of having a mixed pixel of soil and vegetation (i.e., >1 m) were satisfied. The choice of 1.33 m was based on the nearest multiple of UAS thermal imagery relative to the OAS (Table 1). Next, an input aggregation scheme was applied, whereby the initially aggregated imagery (at 1.33 m) was aggregated again to a coarser pixel resolution (5, 10, 30, and 90 m), followed by a TSEB-PT model run at each resolution. To address the effect of different input image aggregation schemes, only one set of image inputs can be modified at a time. Therefore, initial analyses were focused on identifying the most sensitive image input parameters via field histograms. The two candidate input variables were Tr and fc. The 30 m resolution reflects the SAT Tr disaggregation approaches using concurrent multispectral imagery [10]. The 90 m resolution reflects Landsat 8 thermal imagery satellite images aggregated to the closest multiple of its original resolution (i.e., 100 m)—this approach has precedence within the literature [45].
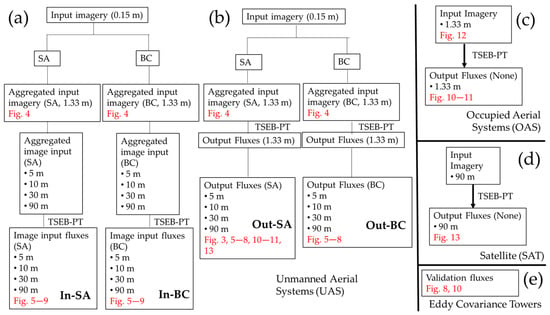
Figure 2.
Workflow for this study. Different processing steps are applied to UAS imagery (a,b), OAS imagery (c), SAT imagery (d), eddy covariance flux towers (e). The steps outlined in (a) apply to the different processing routes from a single set of multispectral and thermal IOP images. Within (a), two different aggregation methods are referred to as input aggregation (a) or output aggregation (b). Image inputs refer to fc, LAI, and Tr (e.g., 0.15, 1.33 m, 30.0 m, and 90 m from (a)). Output fluxes refer to Rn, G, H, and LE modeled using TSEB-PT. SA—simple (arithmetic) average; BC—Box–Cox averaging. In-SA: Input aggregation using arithmetic mean; In-BC: Input aggregation using Box–Cox transformation; Out-SA: Output aggregation using arithmetic mean; Out-BC: Output aggregation using Box–Cox transformation. Boxes designated with figure numbers (in red) should be used to interpret figures presented in the paper.
The other aggregation scheme tested in this study was output flux aggregation, whereby the fluxes were first modeled at 1.33 m, followed by flux aggregation to the desired pixel resolution. The output-aggregated flux resolution was aggregated to the same values as those from the input-aggregated approaches. This experimental design is like other studies addressing aggregation properties from satellite sensors [15,16,17,18].
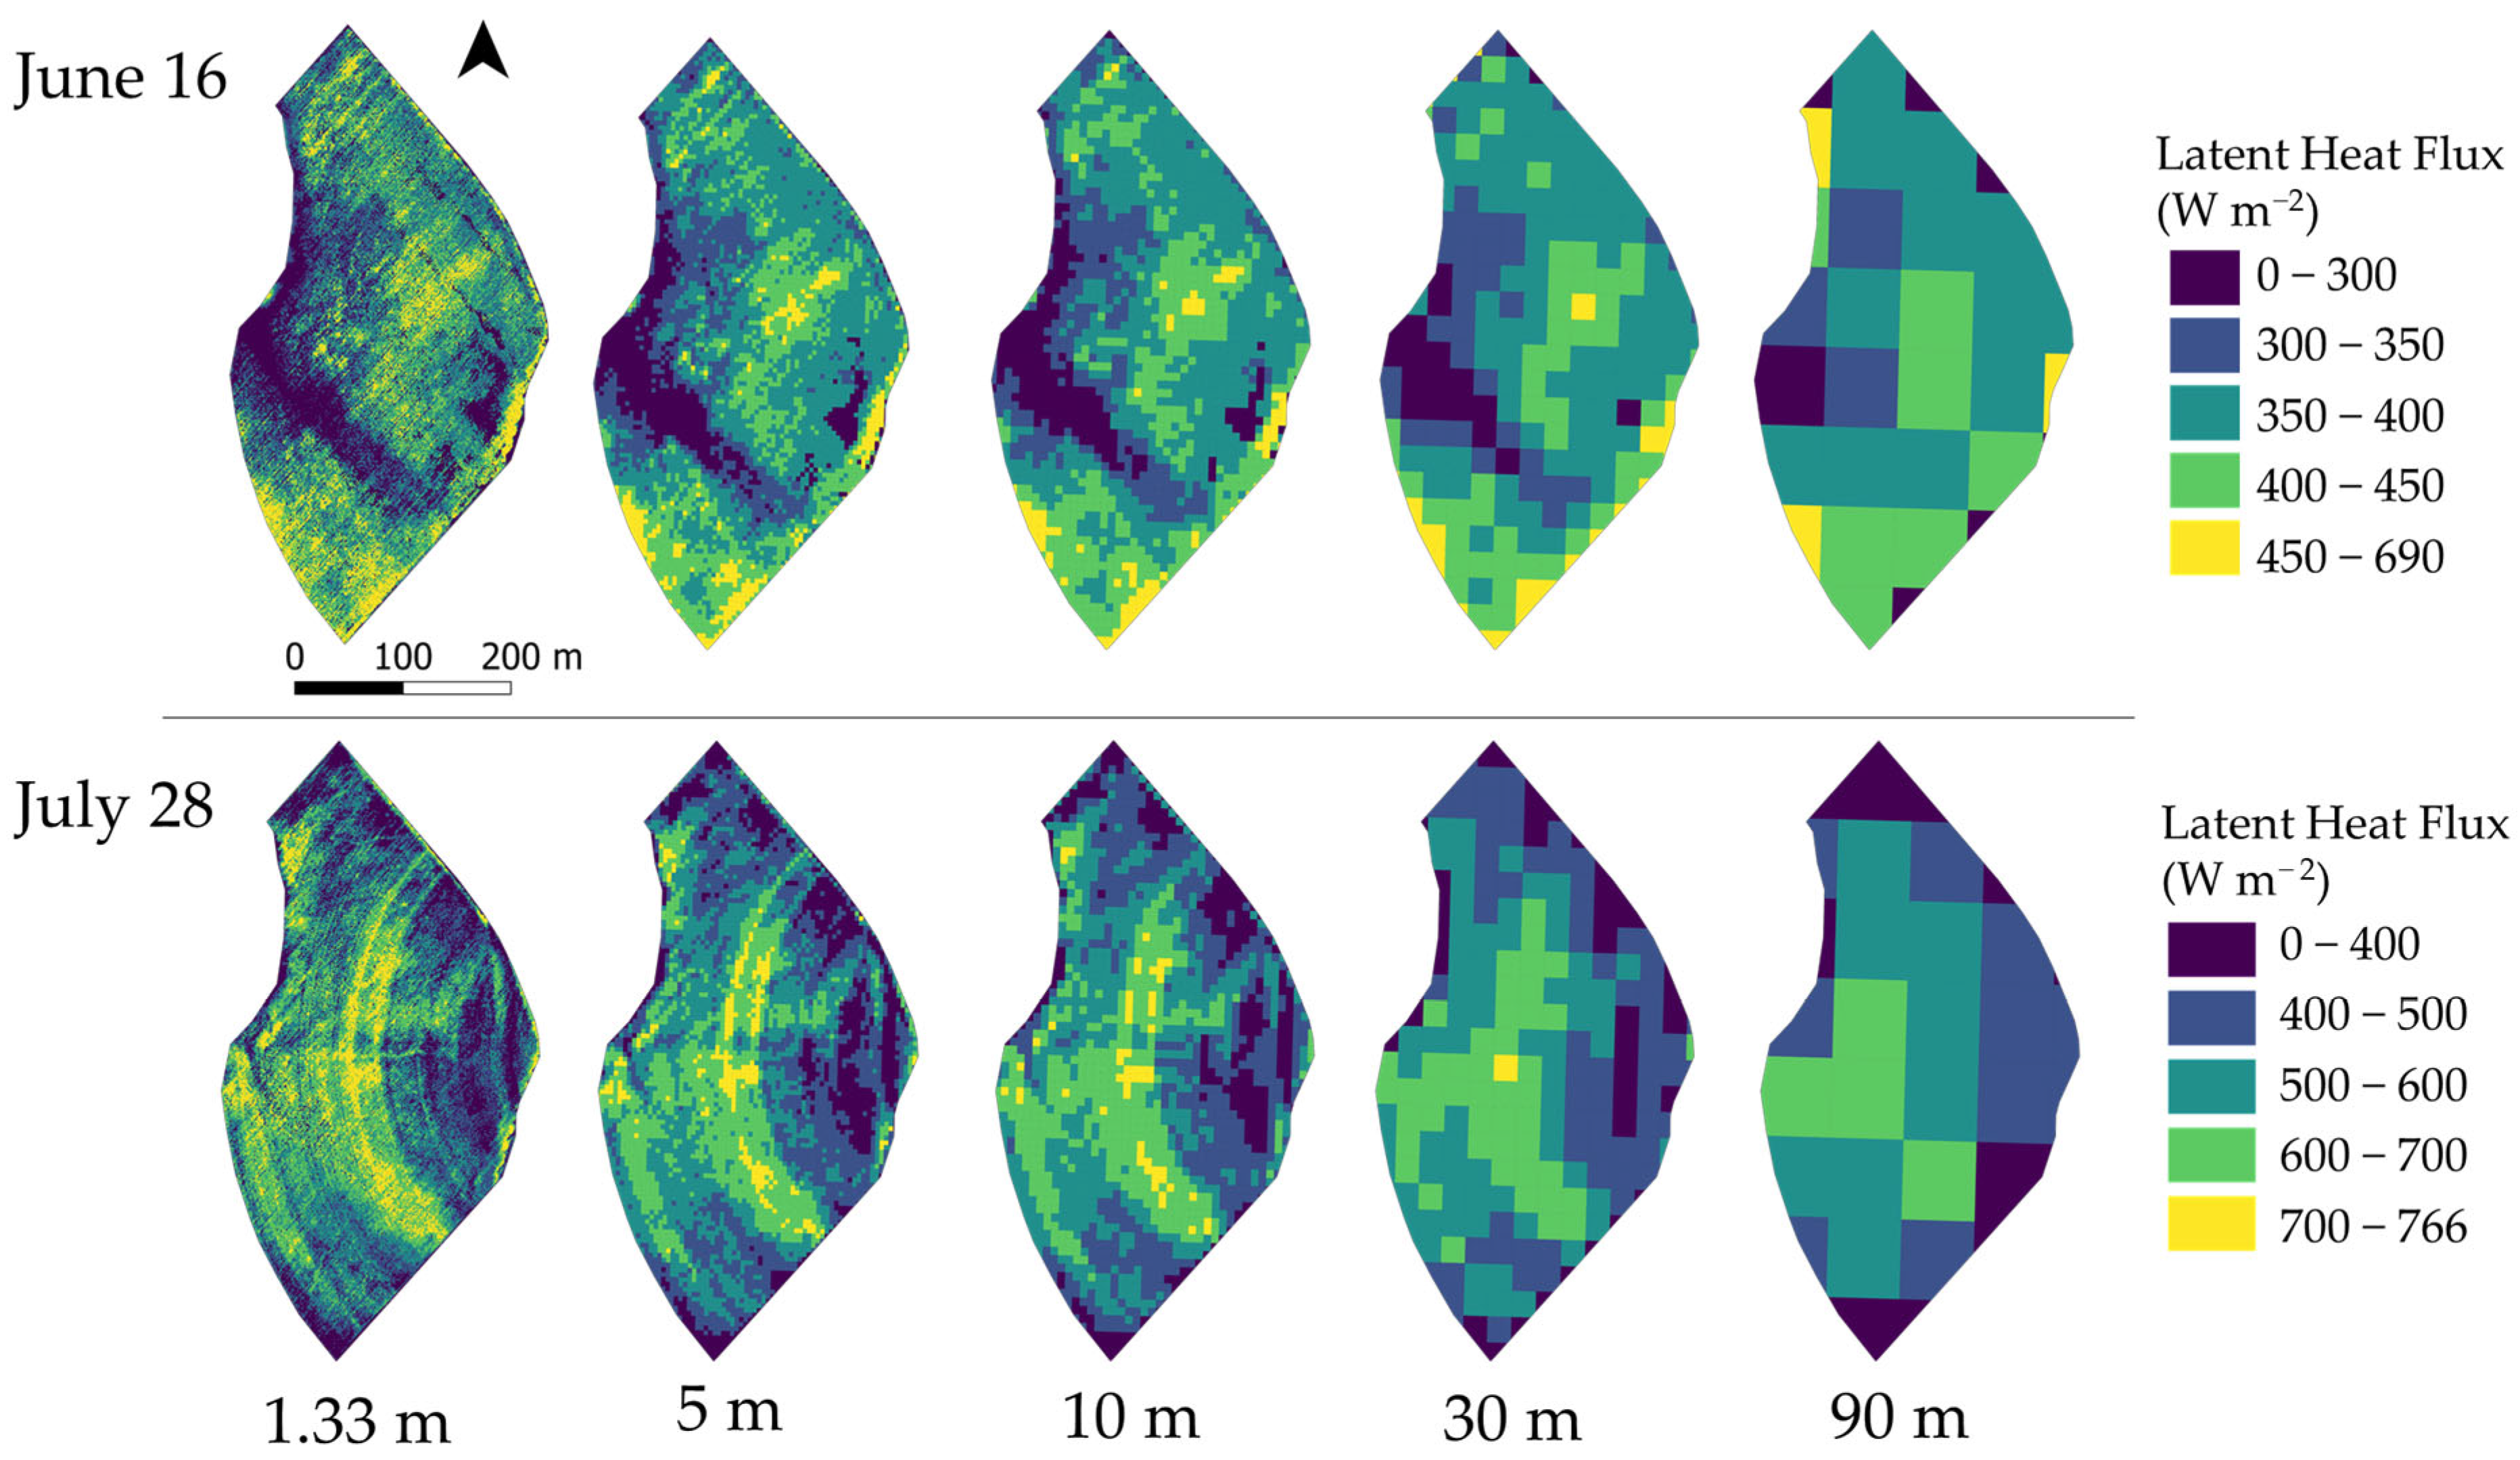
Within a given aggregation scheme (i.e., input/output), additional sub-schemes were used to address the effect of field statistical distributions on aggregation. First, a simple mean, or arithmetic average, was calculated, with the assumption that image inputs or outputs behave linearly (labeled as SA in Figure 2a). Second, a non-linear scheme was addressed by using a Box–Cox approach, whereby values were transformed to an optimal transformation power, arithmetically averaged, and subsequently back transformed to obtain values in the original units (labeled as BC in Figure 2a)—further description of the BC approach is given in Appendix C. Collectively, four individual aggregation schemes were tested for a given IOP date (hereafter referred to as In-SA, In-BC, Out-SA, and Out-BC in Figure 2a). Examples of UAS Out-SA LE images across both IOP dates are shown in Figure 3.
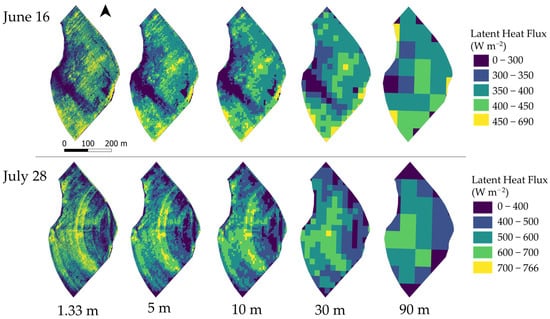
Figure 3.
Output flux aggregation (Out-SA, Figure 2) for latent heat fluxes on June 16 and July 28.
One of the primary goals of this study was to address which aggregation scheme (i.e., In-SA, In-BC, Out-SA, or Out-BC) produced the lowest (1) pixel-scale errors and (2) prediction errors (with respect to eddy flux towers). First, pixel-scale relative errors were calculated, which compare the value at the selected aggregated resolution against the individual pixels from which it is comprised. Relative error (Re) is calculated as Re = RMSE/μ [46], where RMSE is the root-mean-square error difference between the coarse resolution pixel and its constituent fine resolution pixels, and μ is the spatial mean value of all the fine resolution pixels. Second, the modeled fluxes (i.e., In-SA, In-BC, Out-SA, Out-BC) were compared to the LE measured by the eddy covariance towers installed within the field during each IOP (Figure 1). Quality of fit was assessed in terms of mean absolute percentage error (MAPE):
where ŷ and y are the UAS/OAS modeled and eddy covariance LEs, respectively. Appendix D provides a description of flux tower data and the method used to obtain remotely sensed weighted fluxes within the footprint of each eddy tower, as well as the extraction of energy balance components (i.e., Rn, G, LE, H) from the flux towers.
3. Results
3.1. Comparing UAS Aggregation Approaches
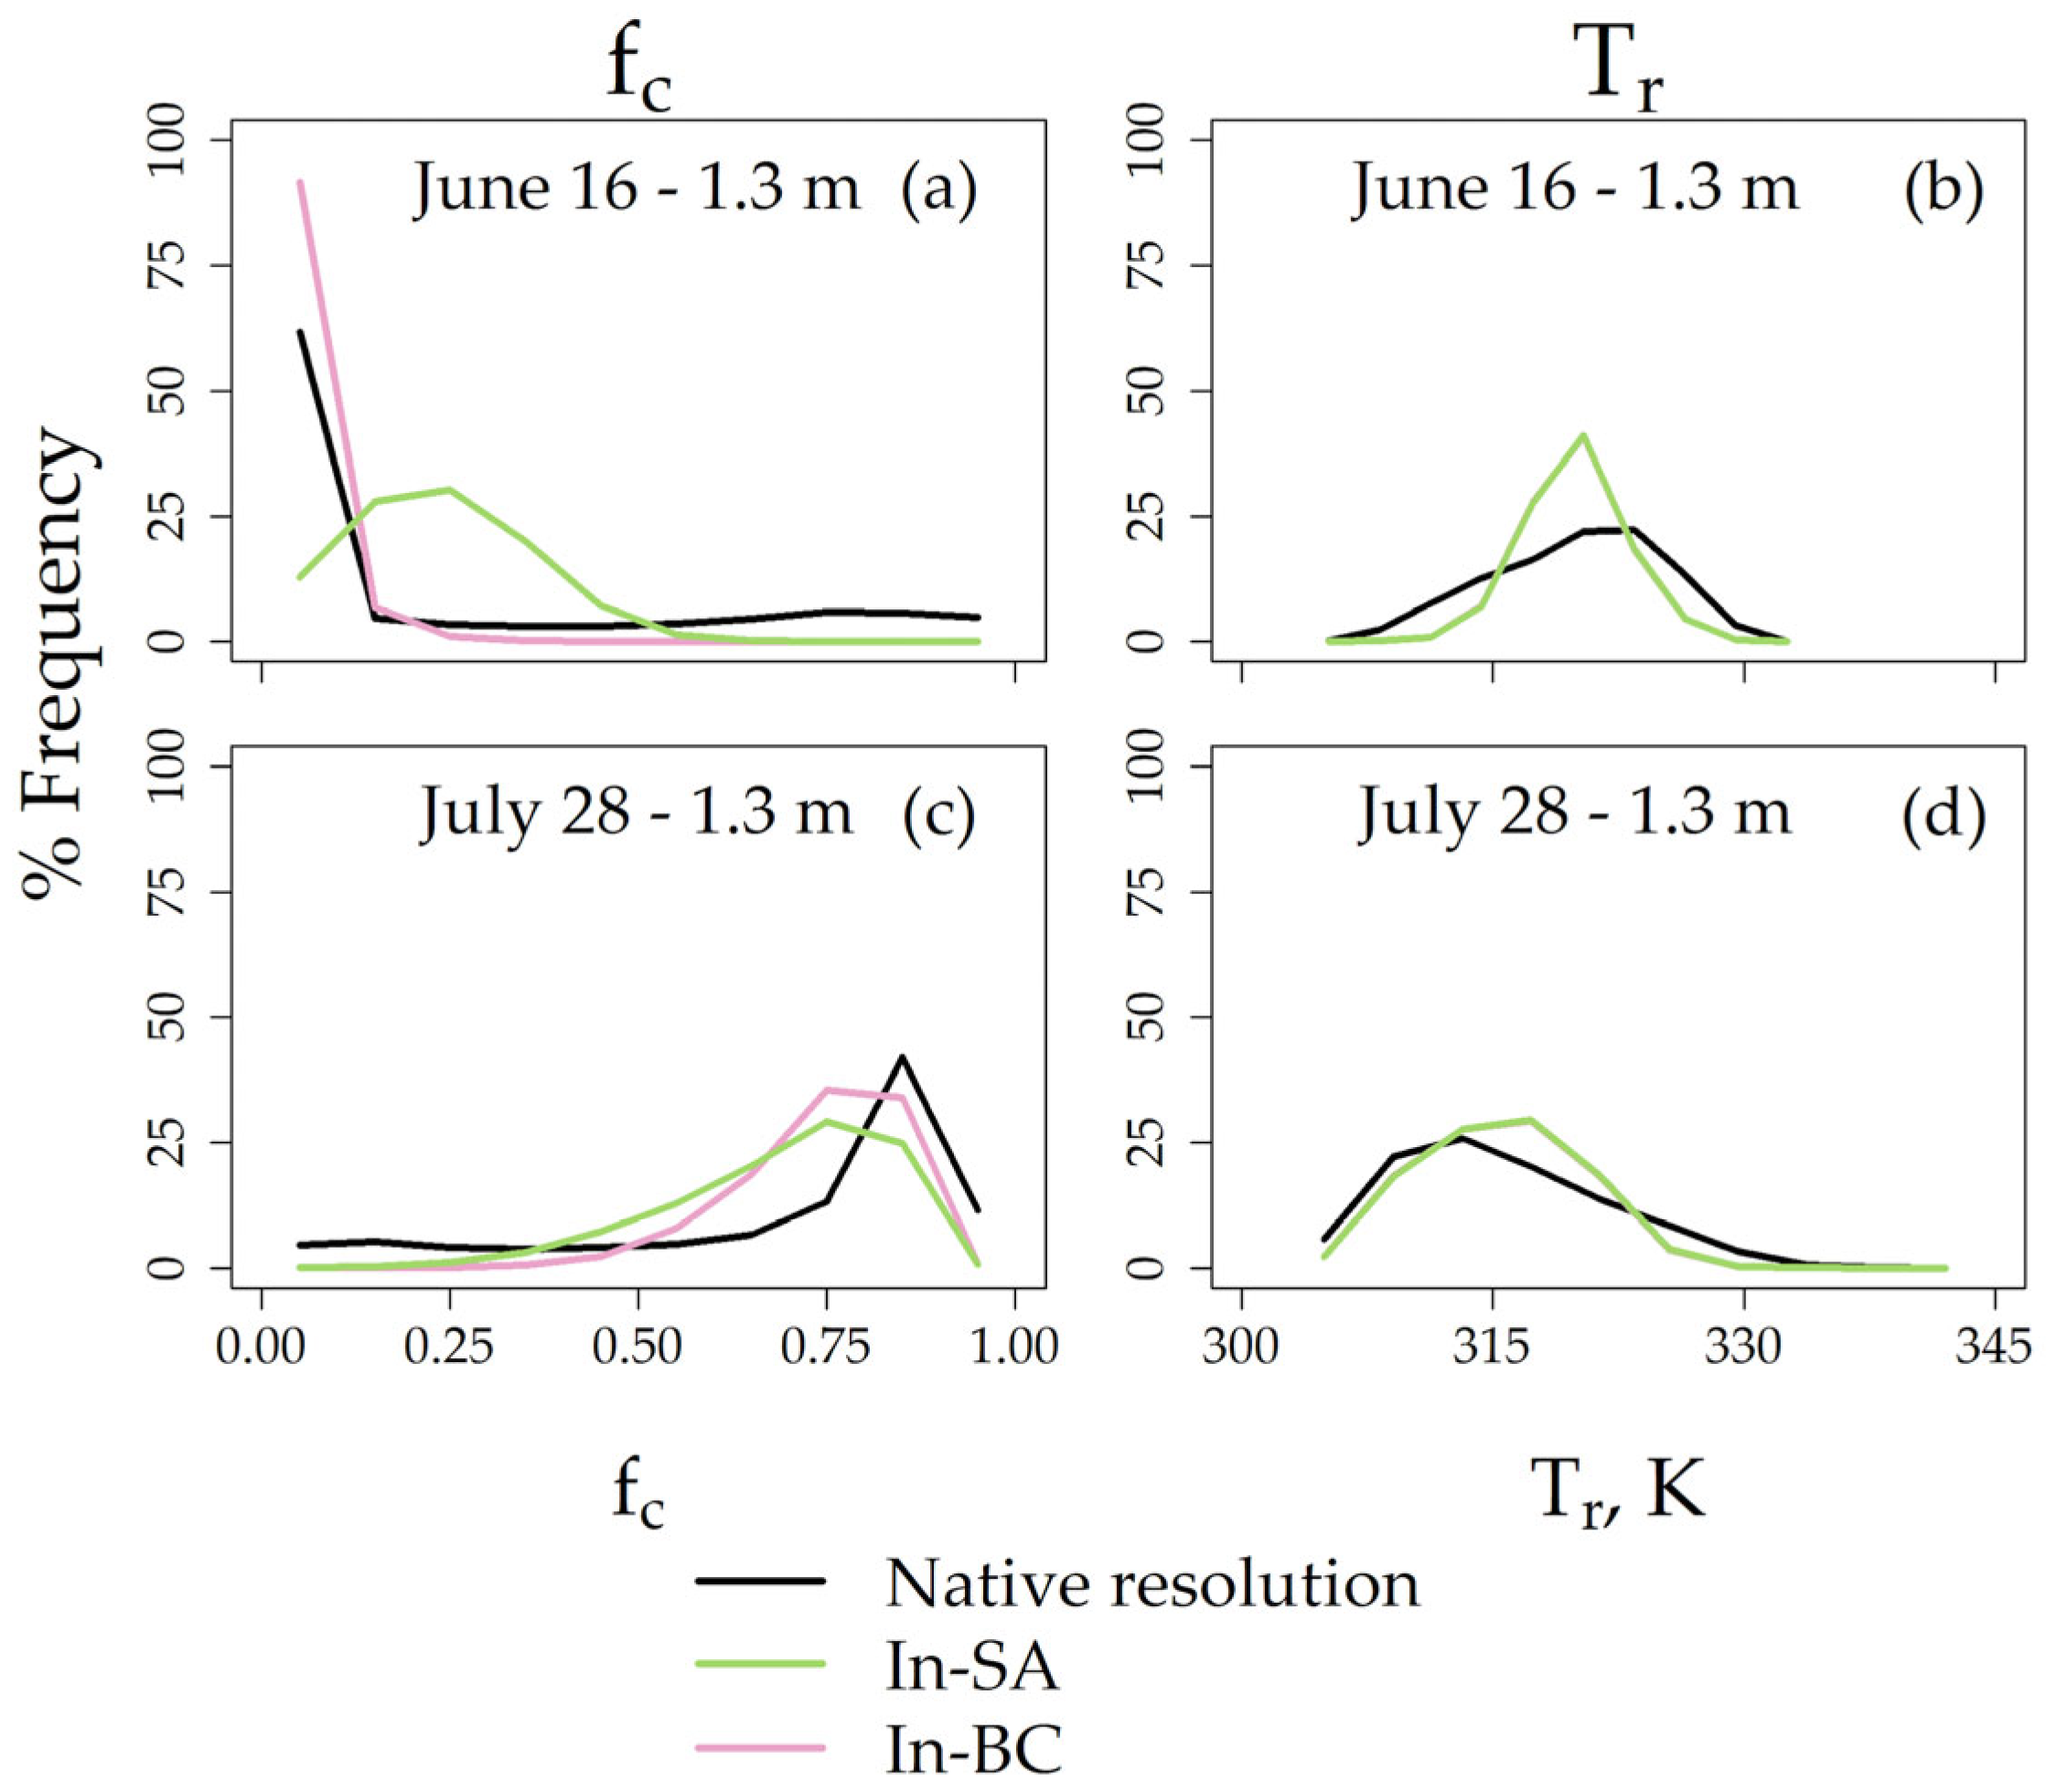
The purpose of this study was to evaluate the different aggregation approaches (Figure 2) in terms of (1) Re on the pixel scale and (2) absolute errors with respect to eddy flux towers. Analysis begins by first presenting histograms for Tr and fc on different dates and resolutions, as shown in Figure 4. Because LAI is derived from fc (Section 2.5.1), it is omitted here for the sake of brevity. The purpose here is to determine the relative sensitivity of these parameters to aggregation, as this will determine which parameter will then be tested in terms of averaging rules (e.g., In-SA, In-BC, Figure 2). Each panel in Figure 4 has the distribution of fc and Tr at the native resolution as black lines (i.e., 0.07 and 0.15 m, respectively, Table 1), as well as the aggregated resolution, either using SA (green lines) or BC (pink lines) averaging approaches.
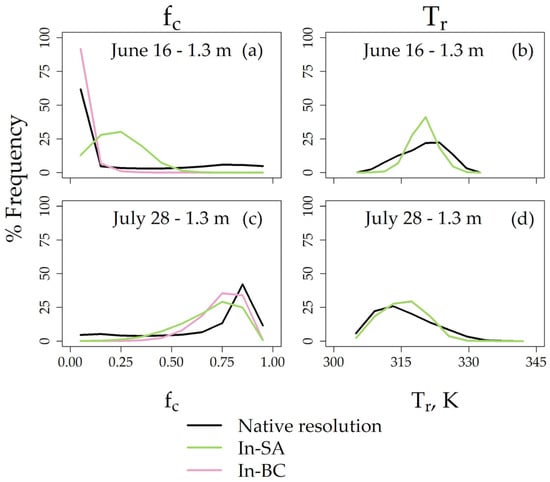
Figure 4.
Line histograms for fc and Tr imagery on June 16 (a,b) and July 28 (c,d), expressed in terms of percentage frequency. The histograms are calculated over pixels across the entire field. Note that histograms for In-SA and In-BC for Tr are nearly identical and therefore overlap.
One observation that can be made from Figure 4 is that the distribution of the fc and Tr curves for the native and aggregated images shifts in time. For example, on June 16, the fc curves are primarily right-skewed (Figure 4a), while on July 28, these fc curves shift to left-skewed distributions (Figure 4c). On June 16, Tr curves were approximately normal (Figure 4b), while on July 28 these distributions shifted towards right-skewed distributions (Figure 4d). These shifts in fc and Tr correspond with the increased vegetative cover (and decreased soil exposure) during the two sampling dates (Table 3). On July 28, the distributions from fc and Tr behave in a somewhat opposite manner, as both show left- and right-skewed distributions, respectively, (Figure 4c,d), likely because of changes in crop phenology throughout the growing season.
In comparing distributions within and across aggregation methods, several observations can be made. On June 16, and to a lesser degree, July 28, fc-SA (green line) and fc-BC (pink line) field distributions are visually different from each other, particularly for the low-medium values of fc (0–0.5, Figure 4a). In particular, the fc-SA distribution on June 16 contains a greater amount of fc pixels between 0.1 and 0.5 than the fc-BC or fc-native imagery (Figure 4a). Moving from June 16 to July 28, fc differences between SA/BC and native resolution (0.15 m) become less noticeable, although both aggregated distributions are shifted slightly to the left from the native distribution (Figure 4c). The fc-SA shows a greater proportion of pixels associated with vegetation than that of fc-BC (Figure 4c). This result may have occurred because In-SA effectively mixes high- and low-end values (from vegetation and soil, respectively), while In-BC weights values more towards high values (based on the greater proportion of vegetation via the transformation power, Appendix B).
Unlike fc, differences in Tr distributions by aggregation rule were not observed. On June 16, for example, the Tr distributions for both SA and BC aggregation were almost identical (Figure 4b), and this was also observed on July 28 (Figure 4d). From these observations, two main points can be made. First, the sensitivity of fc to the aggregation rule (i.e., SA vs. BC) was greater during partial than full vegetation coverage. Second, fc was more sensitive to the selected aggregation rule than Tr, and this may have occurred because fc is expressed on a much smaller scale relative to Tr (i.e., 0−1). For this reason, all further results for input aggregation will be discussed in terms of fc input aggregation only. In other words, In-SA and In-BC refer to aggregation techniques from fc imagery only (Figure 2).
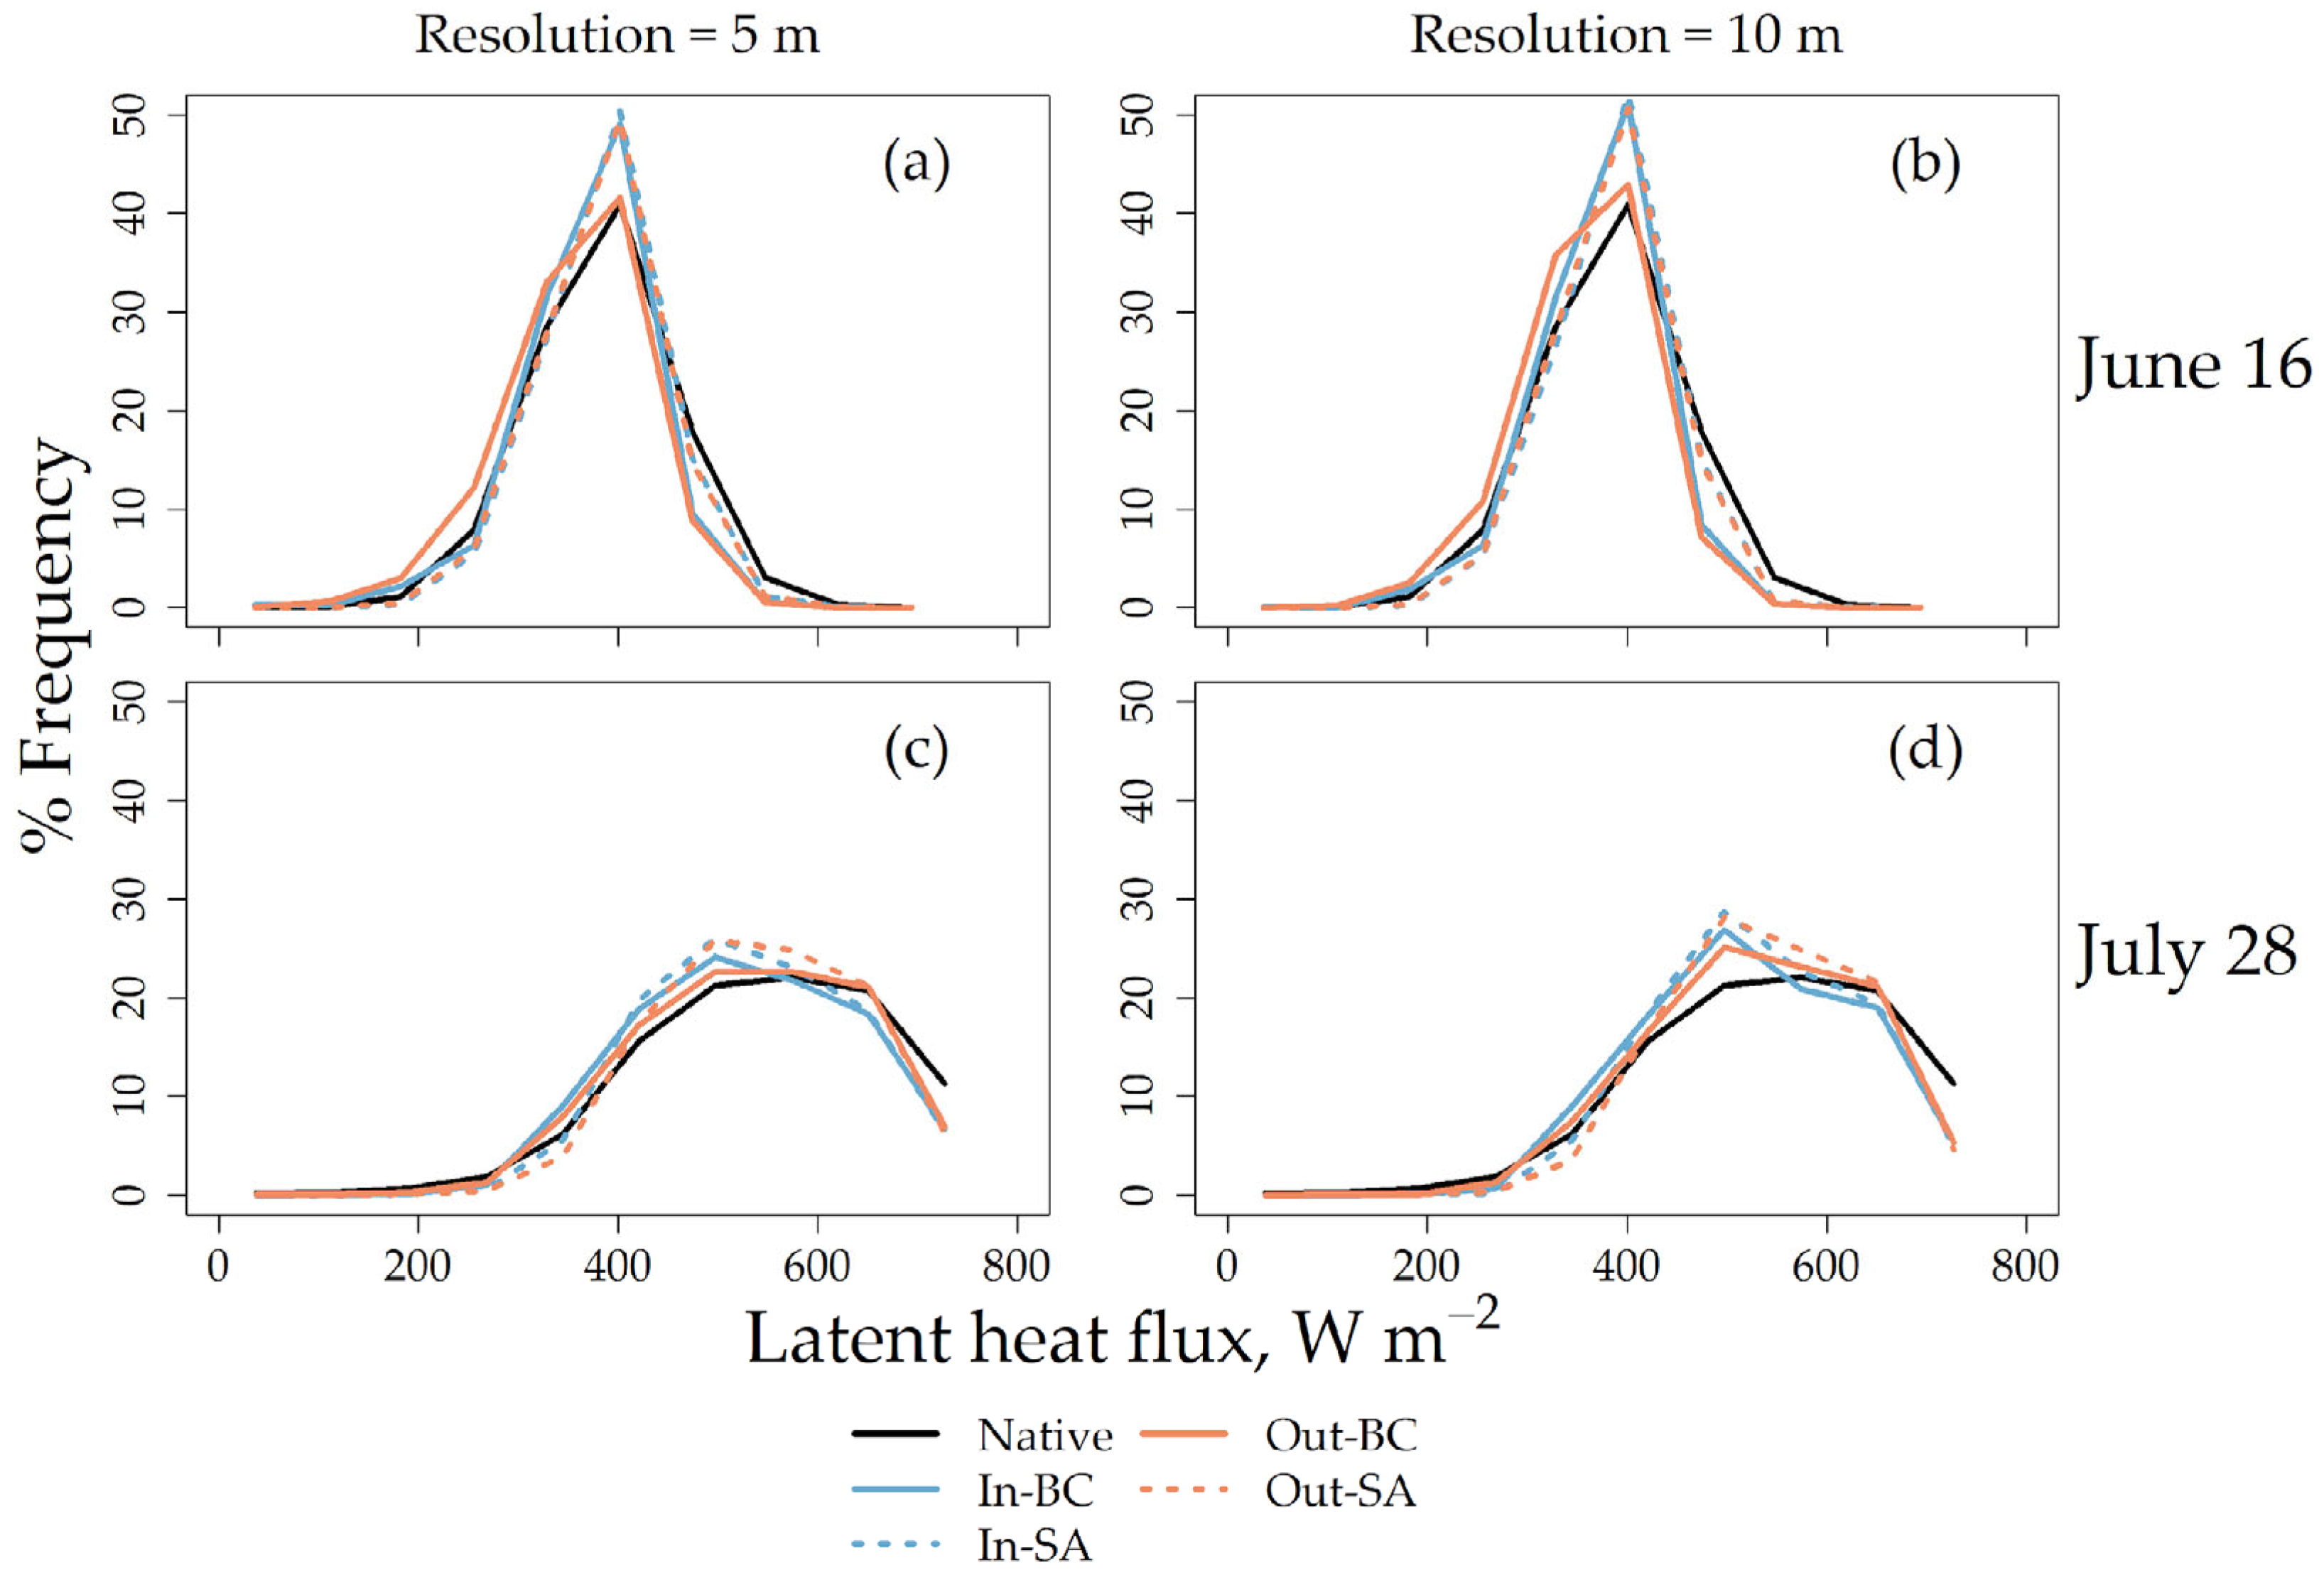
Figure 5 shows histograms from LEs across the field at two different pixel resolutions (5 m and 10 m) and IOPs. Within each panel, field distributions at the initial aggregation level (1.33 m, black) are plotted alongside input (i.e., fc)-aggregated images (blue) and output flux-aggregated images (orange). Note that the Tr arithmetic averaging was consistently used for all aggregation schemes (see Appendix A). The peak LE encountered on June 16 and July 28 was around 400 W m−2 and 500 W m−2, respectively. On June 16, LE histograms become generally narrower as the pixel resolution is aggregated from its native counterpart (Figure 5a,b). The most likely reason for this result is that soil and vegetation pixels are being increasingly averaged when pixel resolutions become greater than the width of the soil row (~0.5 m), resulting in less variation relative to the finer resolution imagery. When moving from June 16 to July 28, the LE field histograms across native and aggregation types shift from approximately normal to left-skewed, indicating greater vegetation coverage (Figure 5a vs. Figure 5c, Figure 5b vs. Figure 5d). A general trend that persists across all aggregation distributions on July 28, relative to the native distribution, is that the former has a larger proportion of pixels in the mid-range (i.e., 400–600 W m−2), presumably due to averaging of vegetation and soil pixels, regardless of aggregation/averaging approach.
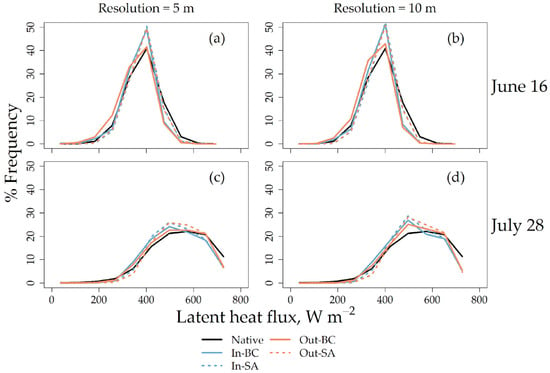
Figure 5.
Line histograms of latent energy (LE) fluxes using TSEB-PT across different IOP dates and times: (a) June 16 at 5 m; (b) June 16 at 10 m; (c) July 28 at 5 m; (d) July 28 at 10 m. Different colors and line types are assigned to In-BC (bold blue), In-SA (dashed blue), Out-BC (bold orange), and Out-SA (dashed orange) fluxes at various pixel resolutions. Native fluxes (1.33 m, black) are also plotted as a reference.
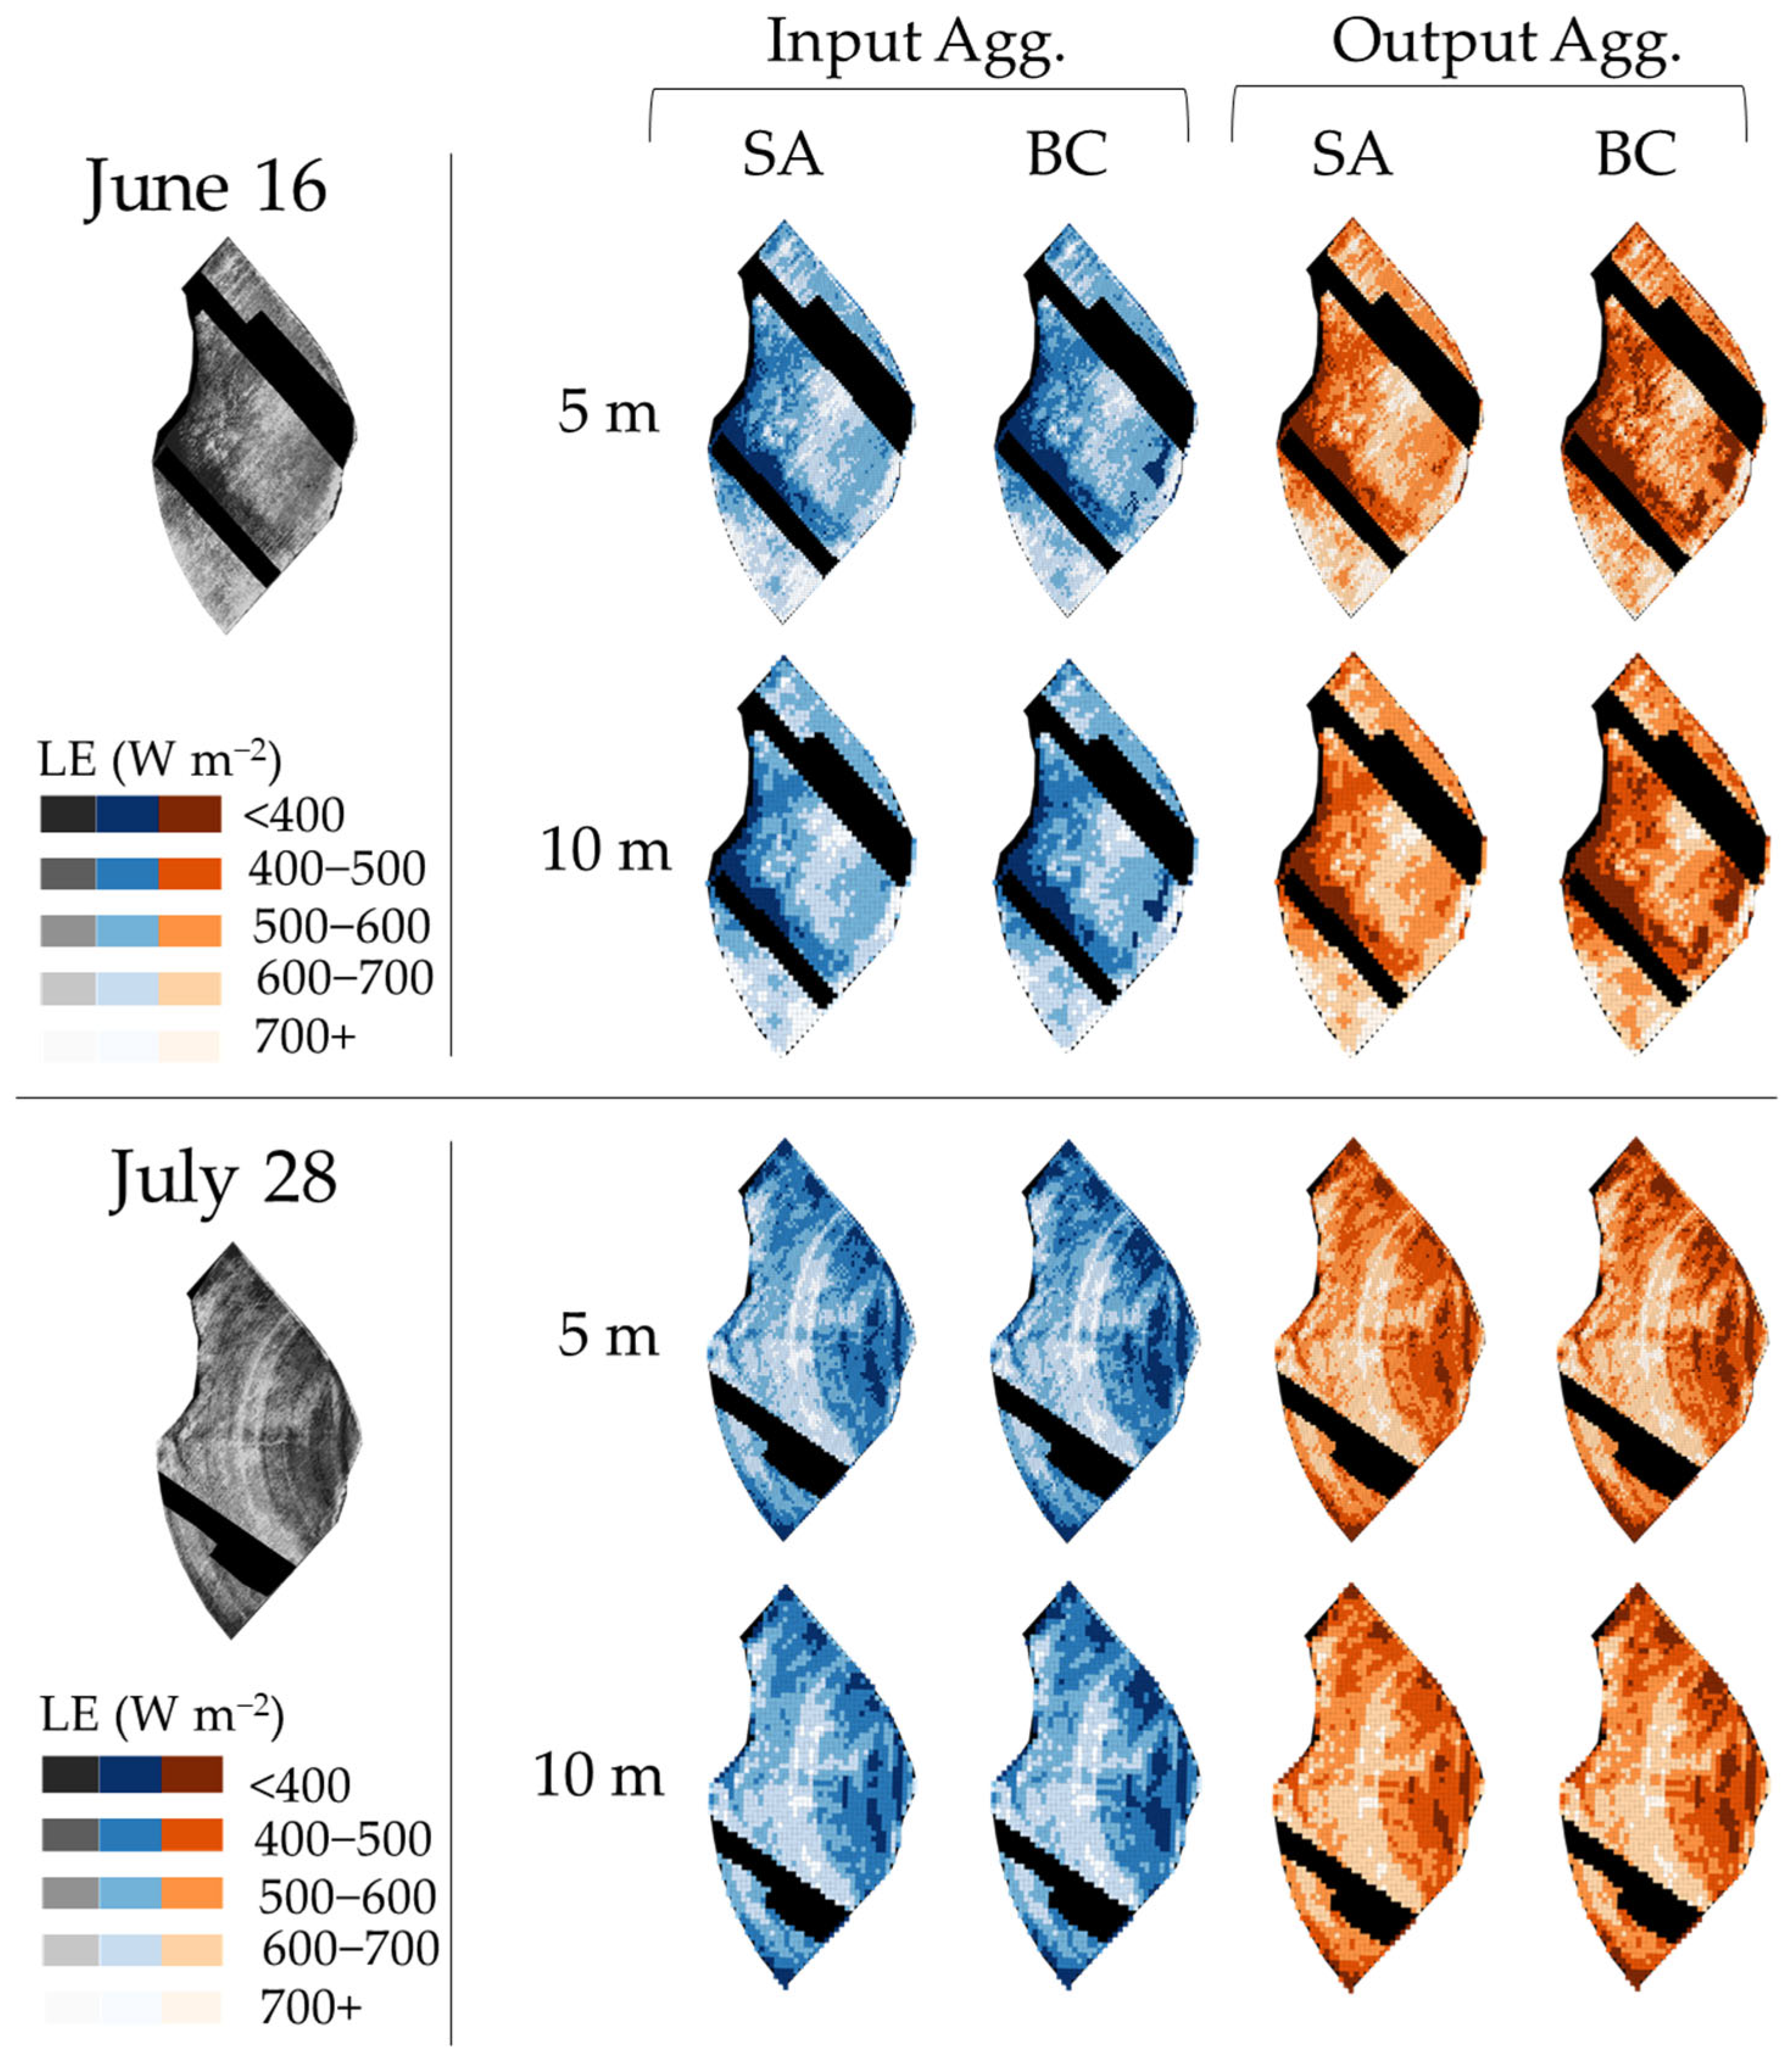
Unlike the fc field distributions (Figure 4a,c), the LE field distributions by aggregation and averaging methods (In-BC, Out-BC, In-SA, Out-SA) are pretty similar to each other on both sampling dates (Figure 5). While this may suggest that the selection of the correct aggregation and averaging approach has a minor impact, large differences (as much as 100 W m−2) were visually observed between the approaches on a per-pixel basis (Figure 6). Further visual inspection revealed that these differences were more prevalent within less densely vegetated areas. In other words, the selection of the aggregation and averaging approach is mostly relevant to heterogeneous surfaces, and this observation is in line with previous findings [47].
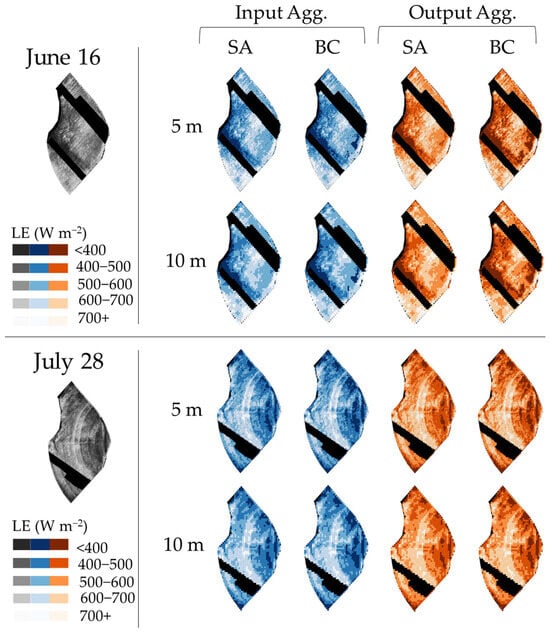
Figure 6.
Aggregation methods of latent energy (LE) fluxes (W m−2) using TSEB-PT on June 16 and July 28. Different colors are assigned to In-BC and In-SA (blue) compared with Out-BC and Out-SA (orange) fluxes and were aggregated to 5 and 10 m pixel resolutions. Native fluxes (1.33 m, left side) are shown as reference. Black spaces are areas that were removed based on cloud coverage.
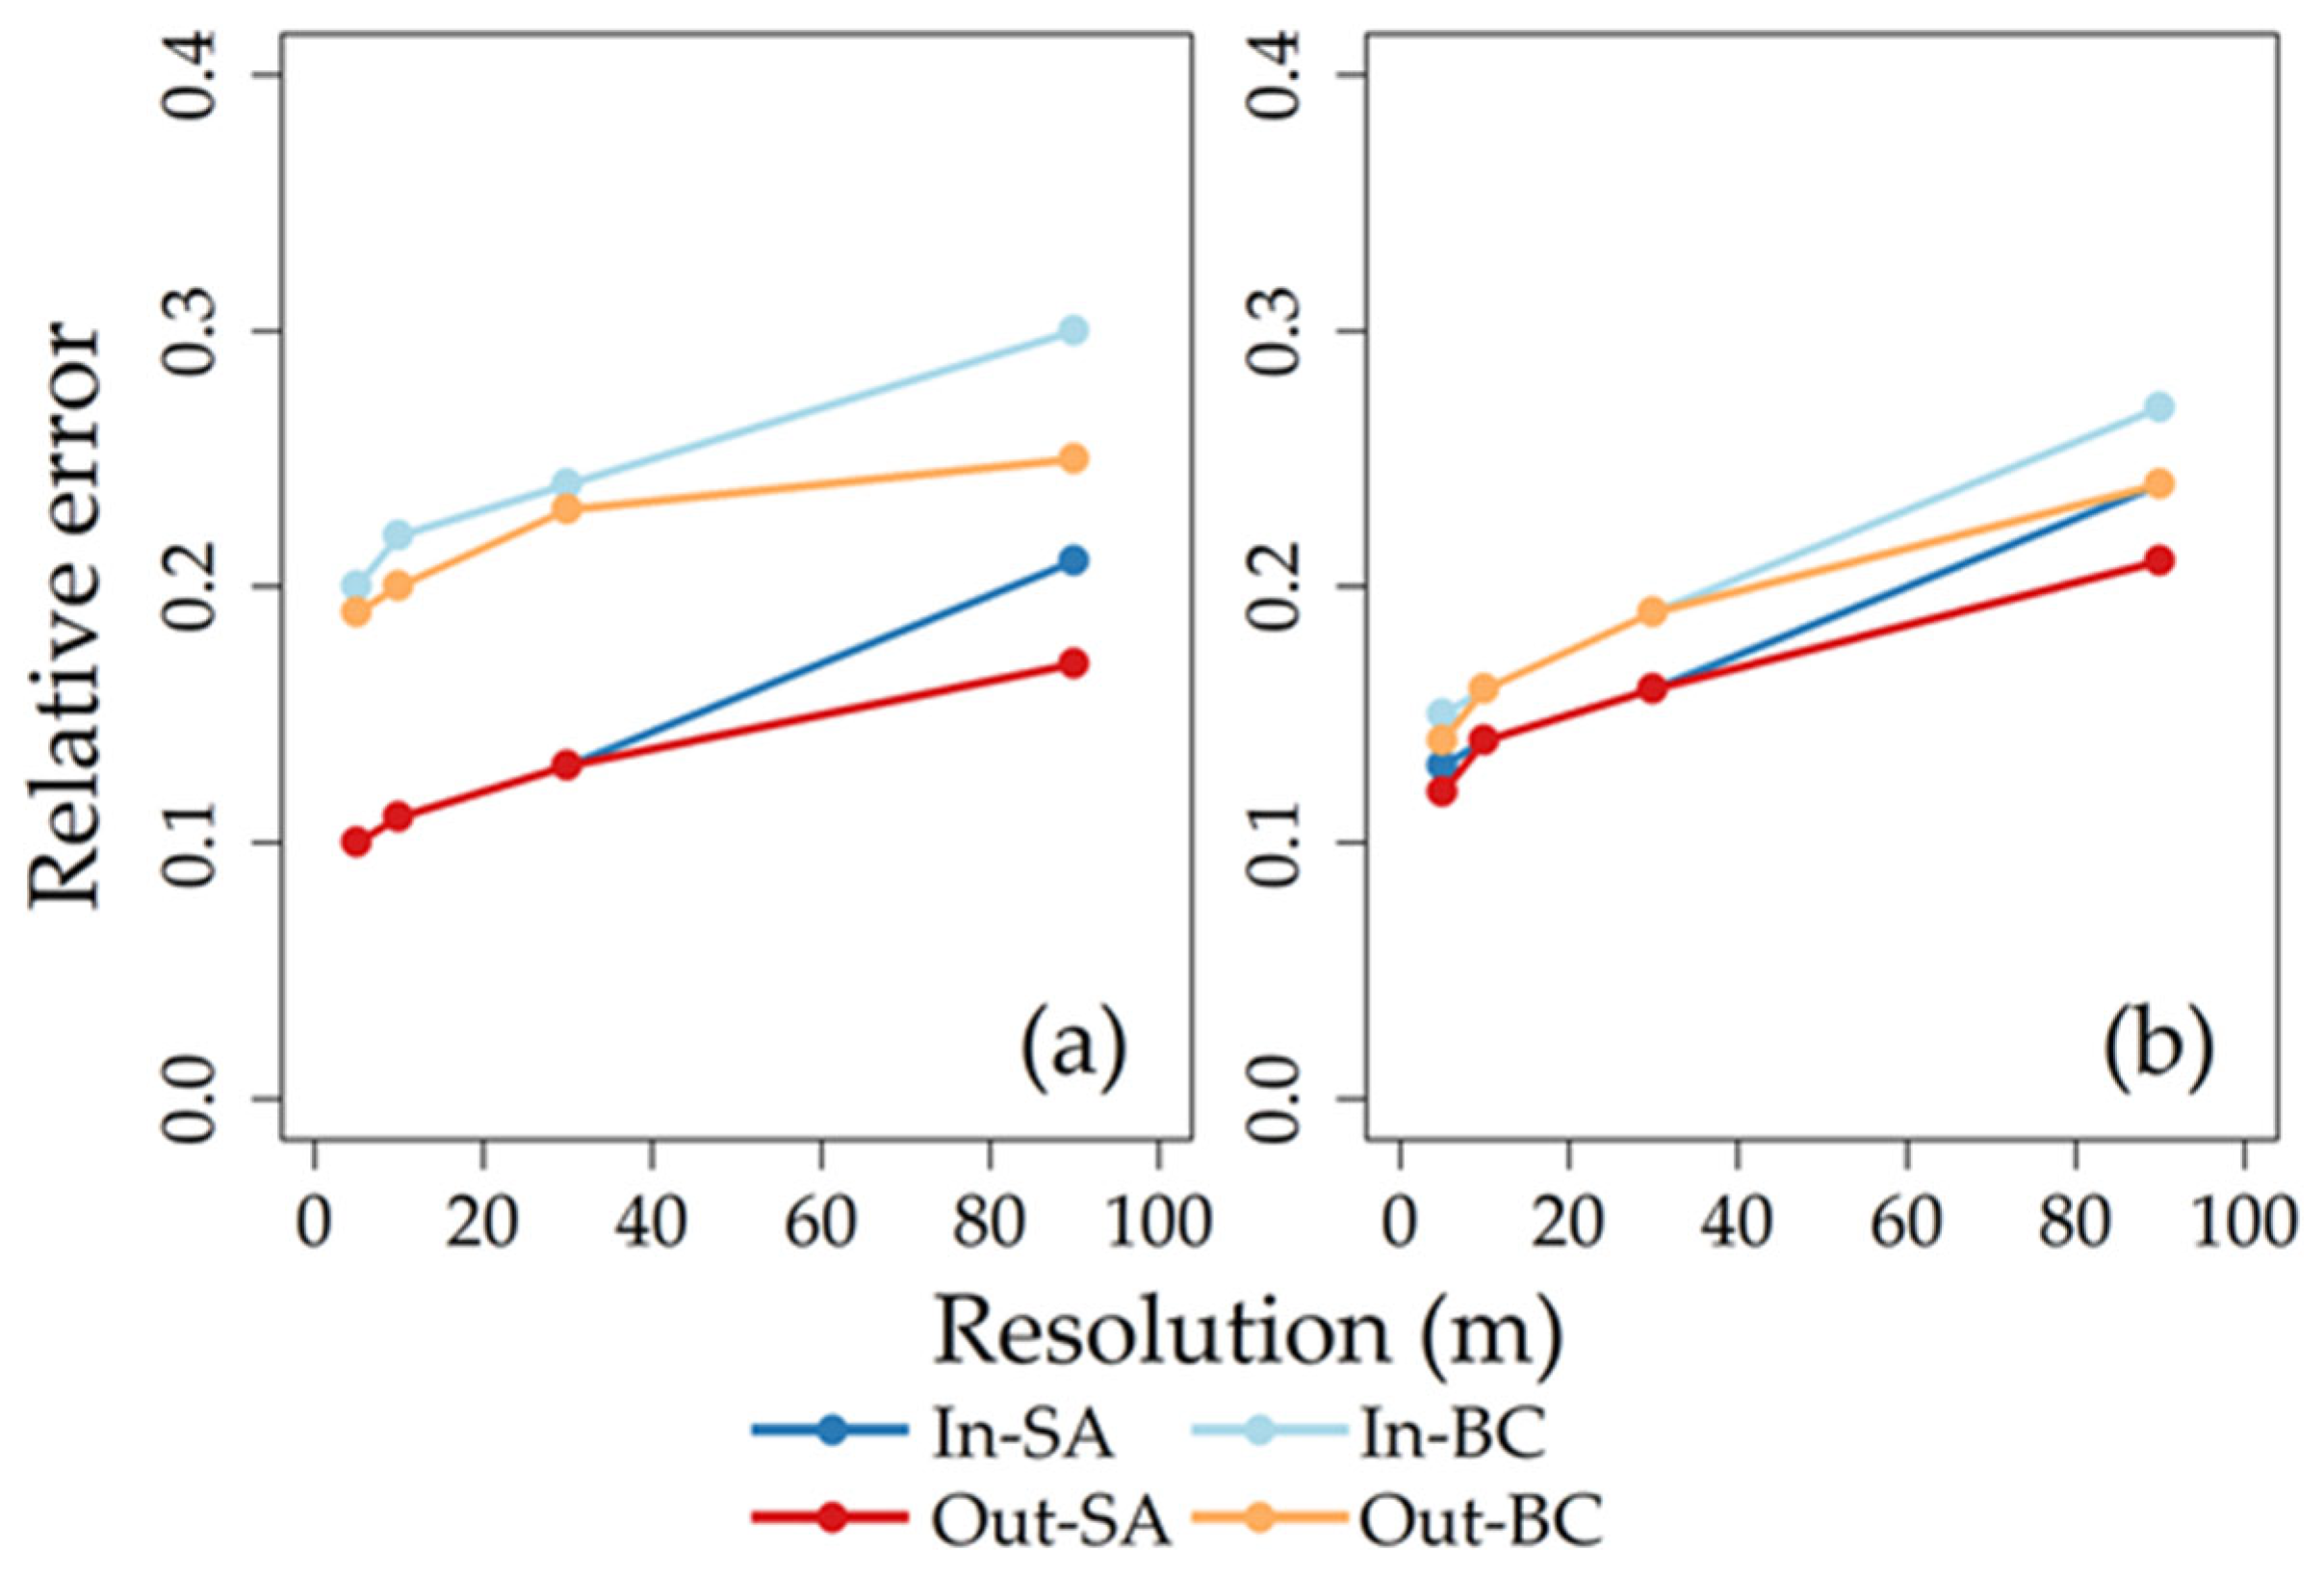
Based on these observations, as well as Figure 5 and Figure 6, further insights into LE aggregation behavior were quantified by calculating Re for each of the scenarios shown in Figure 2. In particular, LE pixel-scale errors (Re, Section 2.6) are plotted as a function of four different pixel resolutions (5 m, 10 m, 30 m, and 90 m) in Figure 7, and these errors are given in Table 4. As expected, the magnitude of relative error, regardless of aggregation method, increased with increasing pixel resolution—this is because the signal/noise ratio is diminished as the pixel size increases relative to the sensed objects (i.e., crops/soils) [7]. Re values for all aggregation methods were lower on July 28 (Figure 7b) than on June 16 (Figure 7a), as the median Re from Table 4 was 0.16 and 0.20, respectively. Differences between the 25th and 75th percentiles of different aggregation methods are more noticeable on June 16 than on July 28 as well (Figure 6 and Figure 7). These results most likely occurred because of the relatively high Re errors on June 16 from both In-BC and Out-BC (Figure 7a).
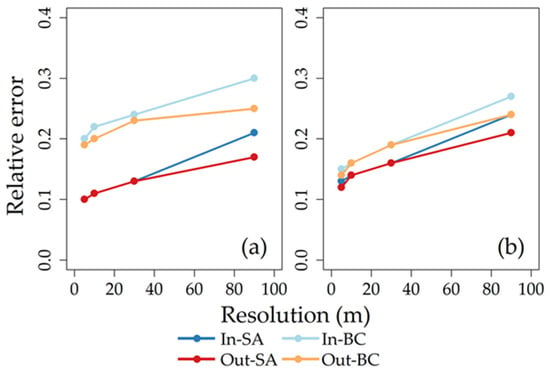
Figure 7.
Pixel-scale latent energy (LE) relative errors (Re = RMSE/μ) plotted as a function of pixel resolution on (a) 16 June 2017, and (b) 28 July 2017. Plots are divided into In-SA (blue), Out-SA (red), In-BC (light blue), and Out-BC (orange).

Table 4.
Mean pixel-scale relative errors from plots shown in Figure 7 (scaled between 0 and 1).
Re differences were exhibited not only across dates but within dates as well. For a given sampling date, differences in relative errors between the SA vs. BC transformation were smaller than those between input vs. output aggregation (Table 4). In other words, aggregated LEs were more sensitive to the selection of the averaging rule than the selection of the aggregation method. In terms of comparison, relative errors from simple averaging (i.e., Out-SA, In-SA) were generally lower than BC (i.e., Out-BC, In-BC). For example, the median relative error for SA on June 16 was 0.14, while for BC it was 0.20. With respect to the individual models, the magnitude of Re was (from lowest to highest): Out-SA < In-SA < In-BC < Out-BC (Figure 7, Table 4). Thus, output flux aggregation produced slightly lower pixel-scale errors than using input aggregation with respect to SA. These trends are particularly apparent on June 16 (Figure 7a), although differences are diminished on July 28 (Figure 7b), presumably because of more homogenous (vegetated) surfaces. Therefore, it can be concluded that SA averaging (preferably with output flux aggregation) performed the best at upscaling UAS imagery under these conditions for this study, despite the apparent non-normal distributions presented in the inputs (Figure 4c,d) and output fluxes (Figure 5c,d).
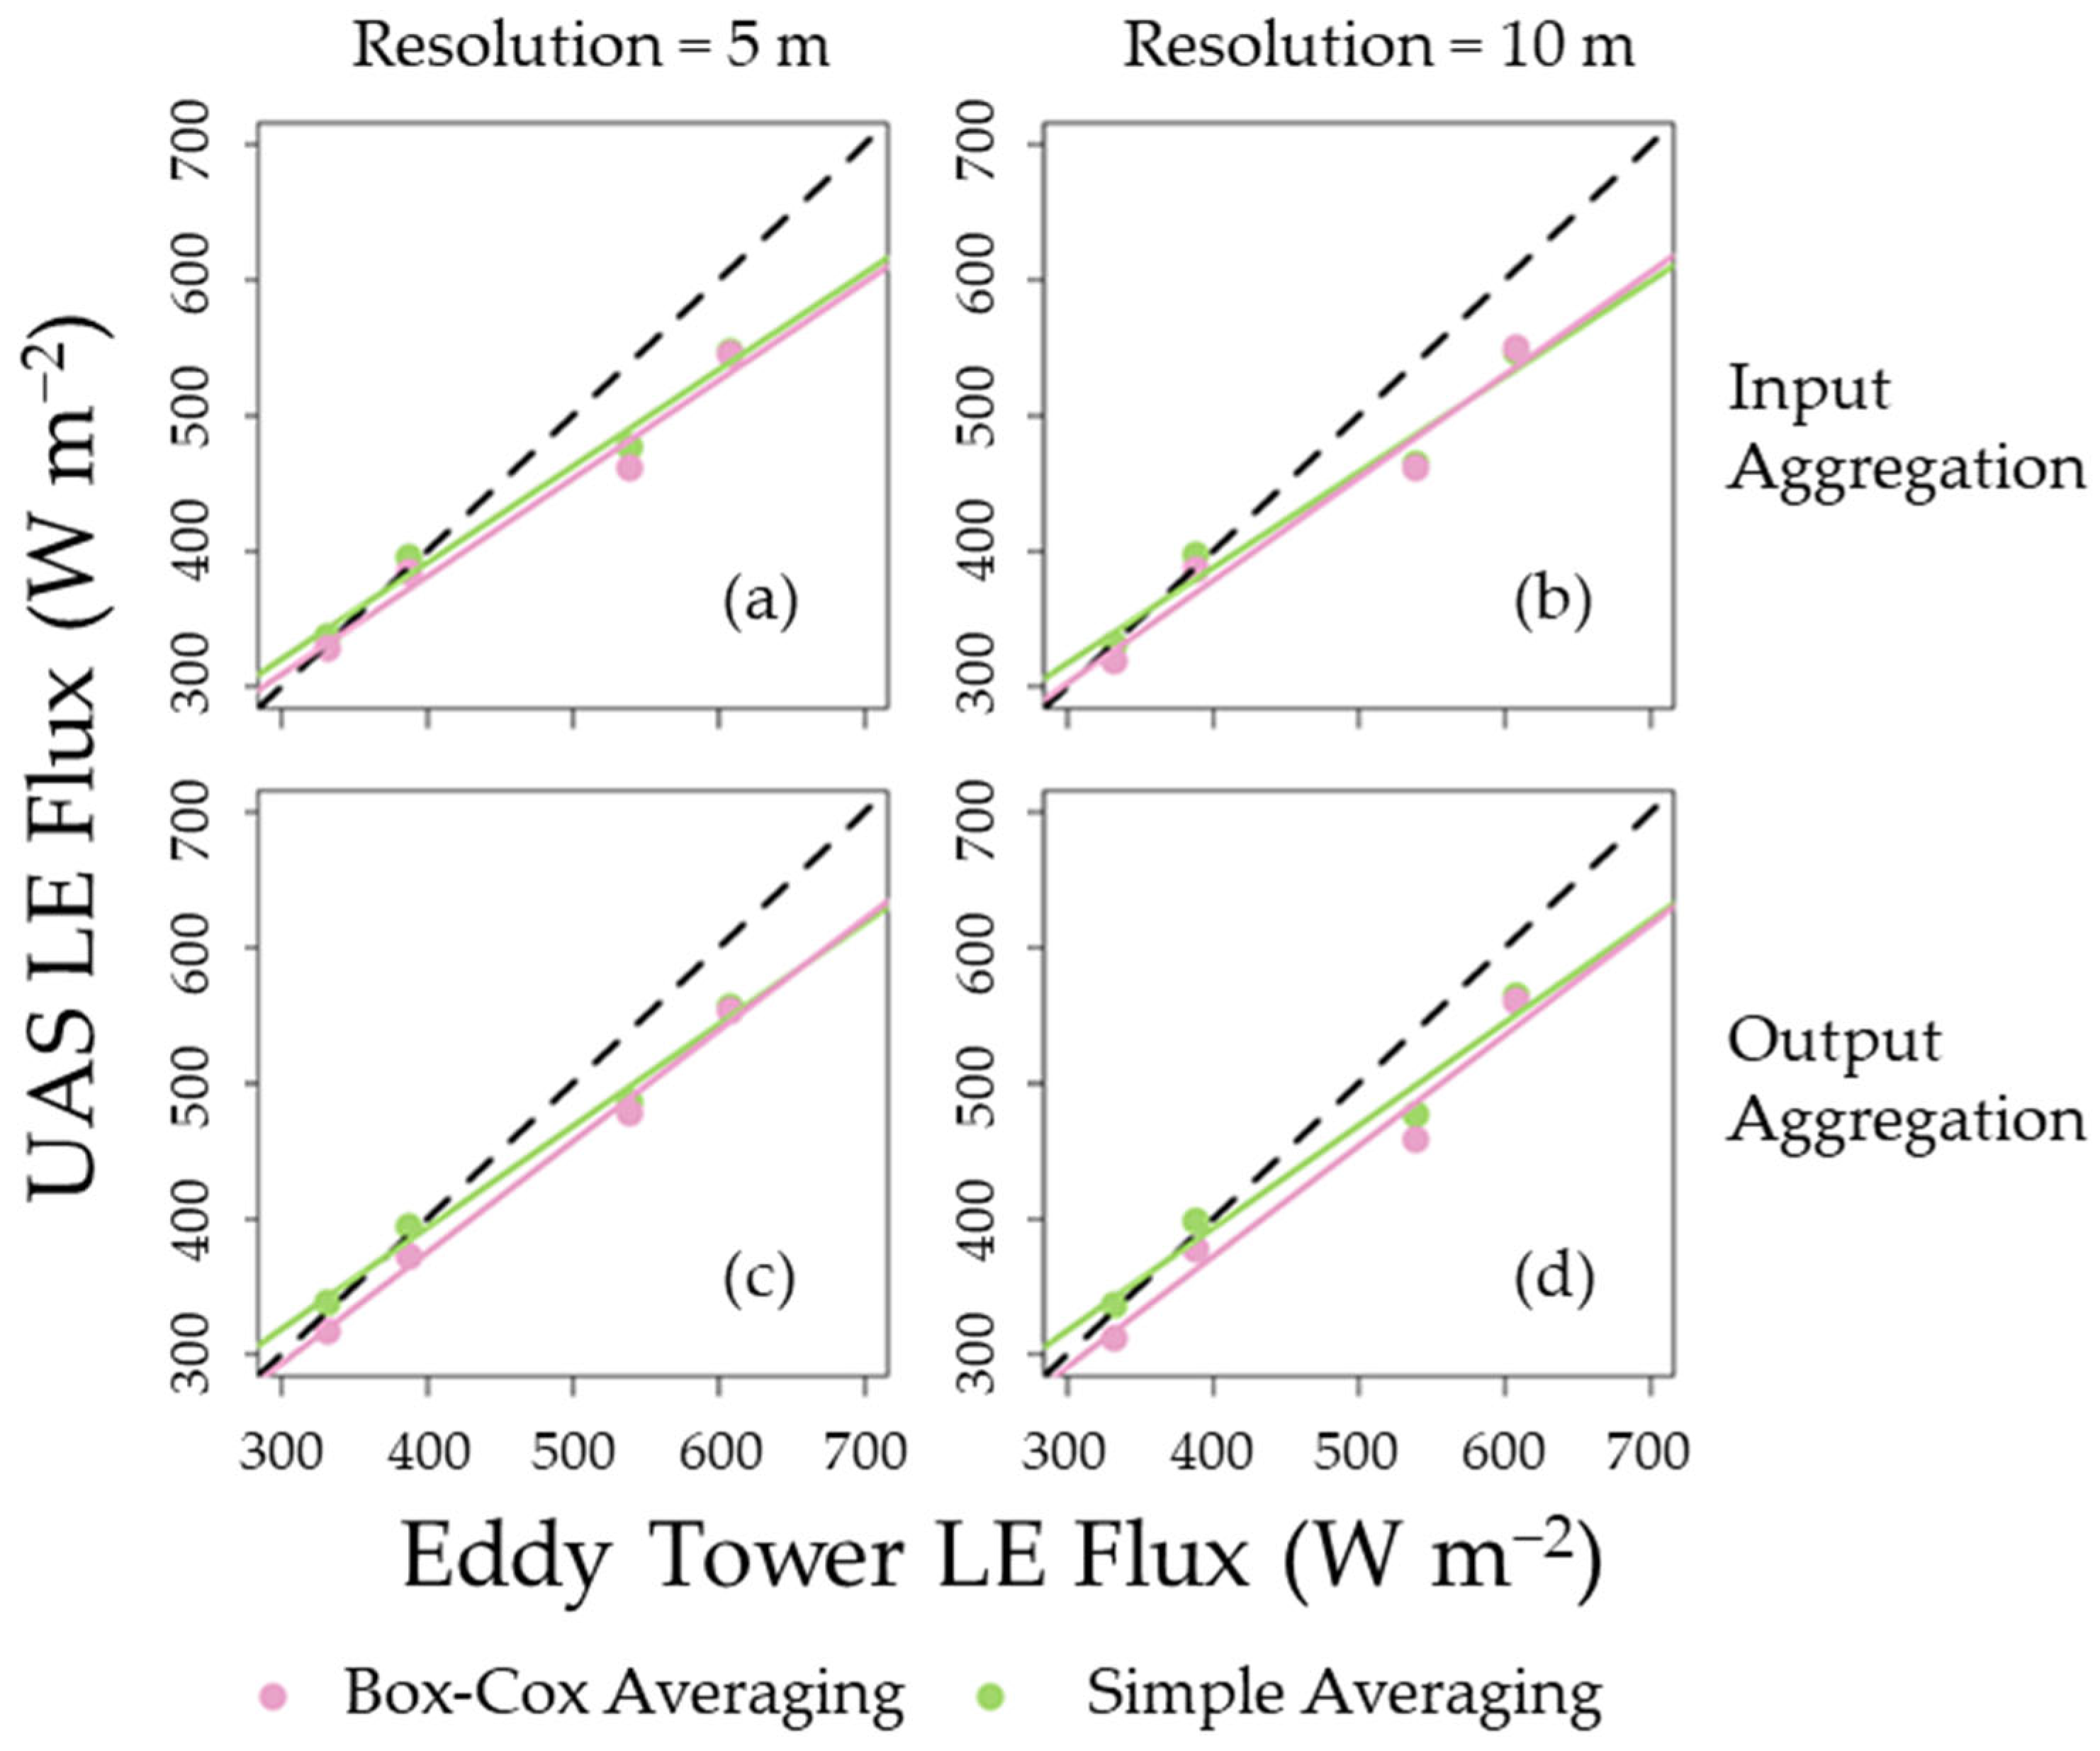
The second criterion used to determine which aggregation method was optimal was through comparisons with LE from eddy flux towers. Figure 8 shows plots of UAS-aggregated LEs (i.e., In-SA, In-BC, Out-SA, Out-BC) against the LE measured by the eddy covariance-based LEs, across both towers and dates (n = 4). Table 5 provides the MAPE values from each configuration and is expressed as error from the mean LE (467 W m−2). One consistent result that appeared across all resolutions was that the errors from output flux aggregation (i.e., Out-SA, Out-BC) were lower than those from input LAI aggregation (i.e., In-SA, In-BC). For example, at 5 m, the MAPE for In-SA was 7.2 percent, while for Out-SA it was 6.0 percent (Table 5). When comparing SA vs. BC averaging, the former was more accurate relative to eddy fluxes—the average BC MAPE for input aggregation was 8.2 percent, while for SA it was 6.8 percent (Table 5). In fact, the trends in MAPE are the same as the relative errors from Table 4: MAPE (Out-SA) < MAPE (In-SA) < MAPE (In-BC) < MAPE (Out-BC). Output aggregation approaches had slightly lower median MAPE values than input approaches (7.2 vs. 7.8 percent, respectively, on average).
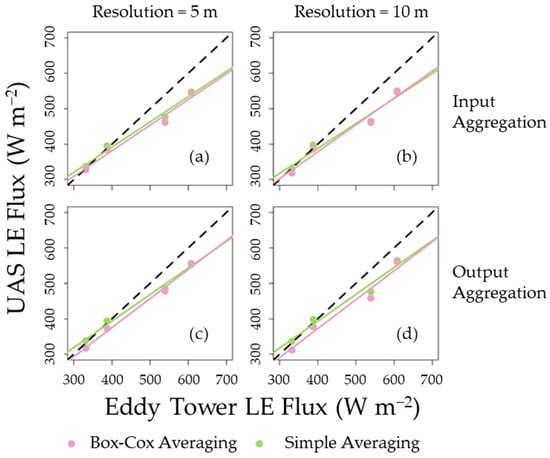
Figure 8.
UAS-based LEs (y-axis) plotted against eddy covariance-based LEs (details in Appendix B). Panels are then subdivided by aggregation method at various pixel resolutions. Note that each point represents a tower (Figure 1) and an IOP date combination. In-SA and In-BC are plotted in (a,b), while Out-SA and Out-BC are plotted in (c,d). Circled items are provided in the discussion. Box–Cox and arithmetic averaging are shown in pink and green, respectively.

Table 5.
Mean absolute errors (MAEs, expressed as a %) of different LE-aggregated flux configurations between the UAS and eddy flux towers. In-SA: LAI input simple average aggregation; In-BC: LAI input Box–Cox aggregation; Out-SA: LE native simple average aggregation; Out-BC: LE native Box–Cox aggregation.
Therefore, it was concluded that aggregating using SA (with output aggregation) had the lowest MAE when upscaling LE from 1.33 m, and this is in agreement with the pixel-scale results reported earlier (Figure 7, Table 4). Input image aggregation can be unstable if all inputs do not present similar statistical distributions, as was shown here (Figure 4). Considering that many previous papers have opted for the input aggregation approach [48,49], the use of output aggregation may need to be considered for future UAS aggregation studies, as was also found by [50].
3.2. Aggregation Properties of the UAS In-SA, In-BC
Because input aggregation schemes, on average, underperformed relative to output aggregation schemes (Section 3.1), possible sources of aggregation errors were explored with respect to both fluxes and model parameters. Input image parameters (Tr, fc) and output ancillary parameters (ra, u*) were investigated by plotting Re values as a function of pixel resolution (i.e., 5 m, 10 m, 30 m, 90 m). The ra and u* were included in this study because they have been cited as contributing sources in regard to aggregation [47].
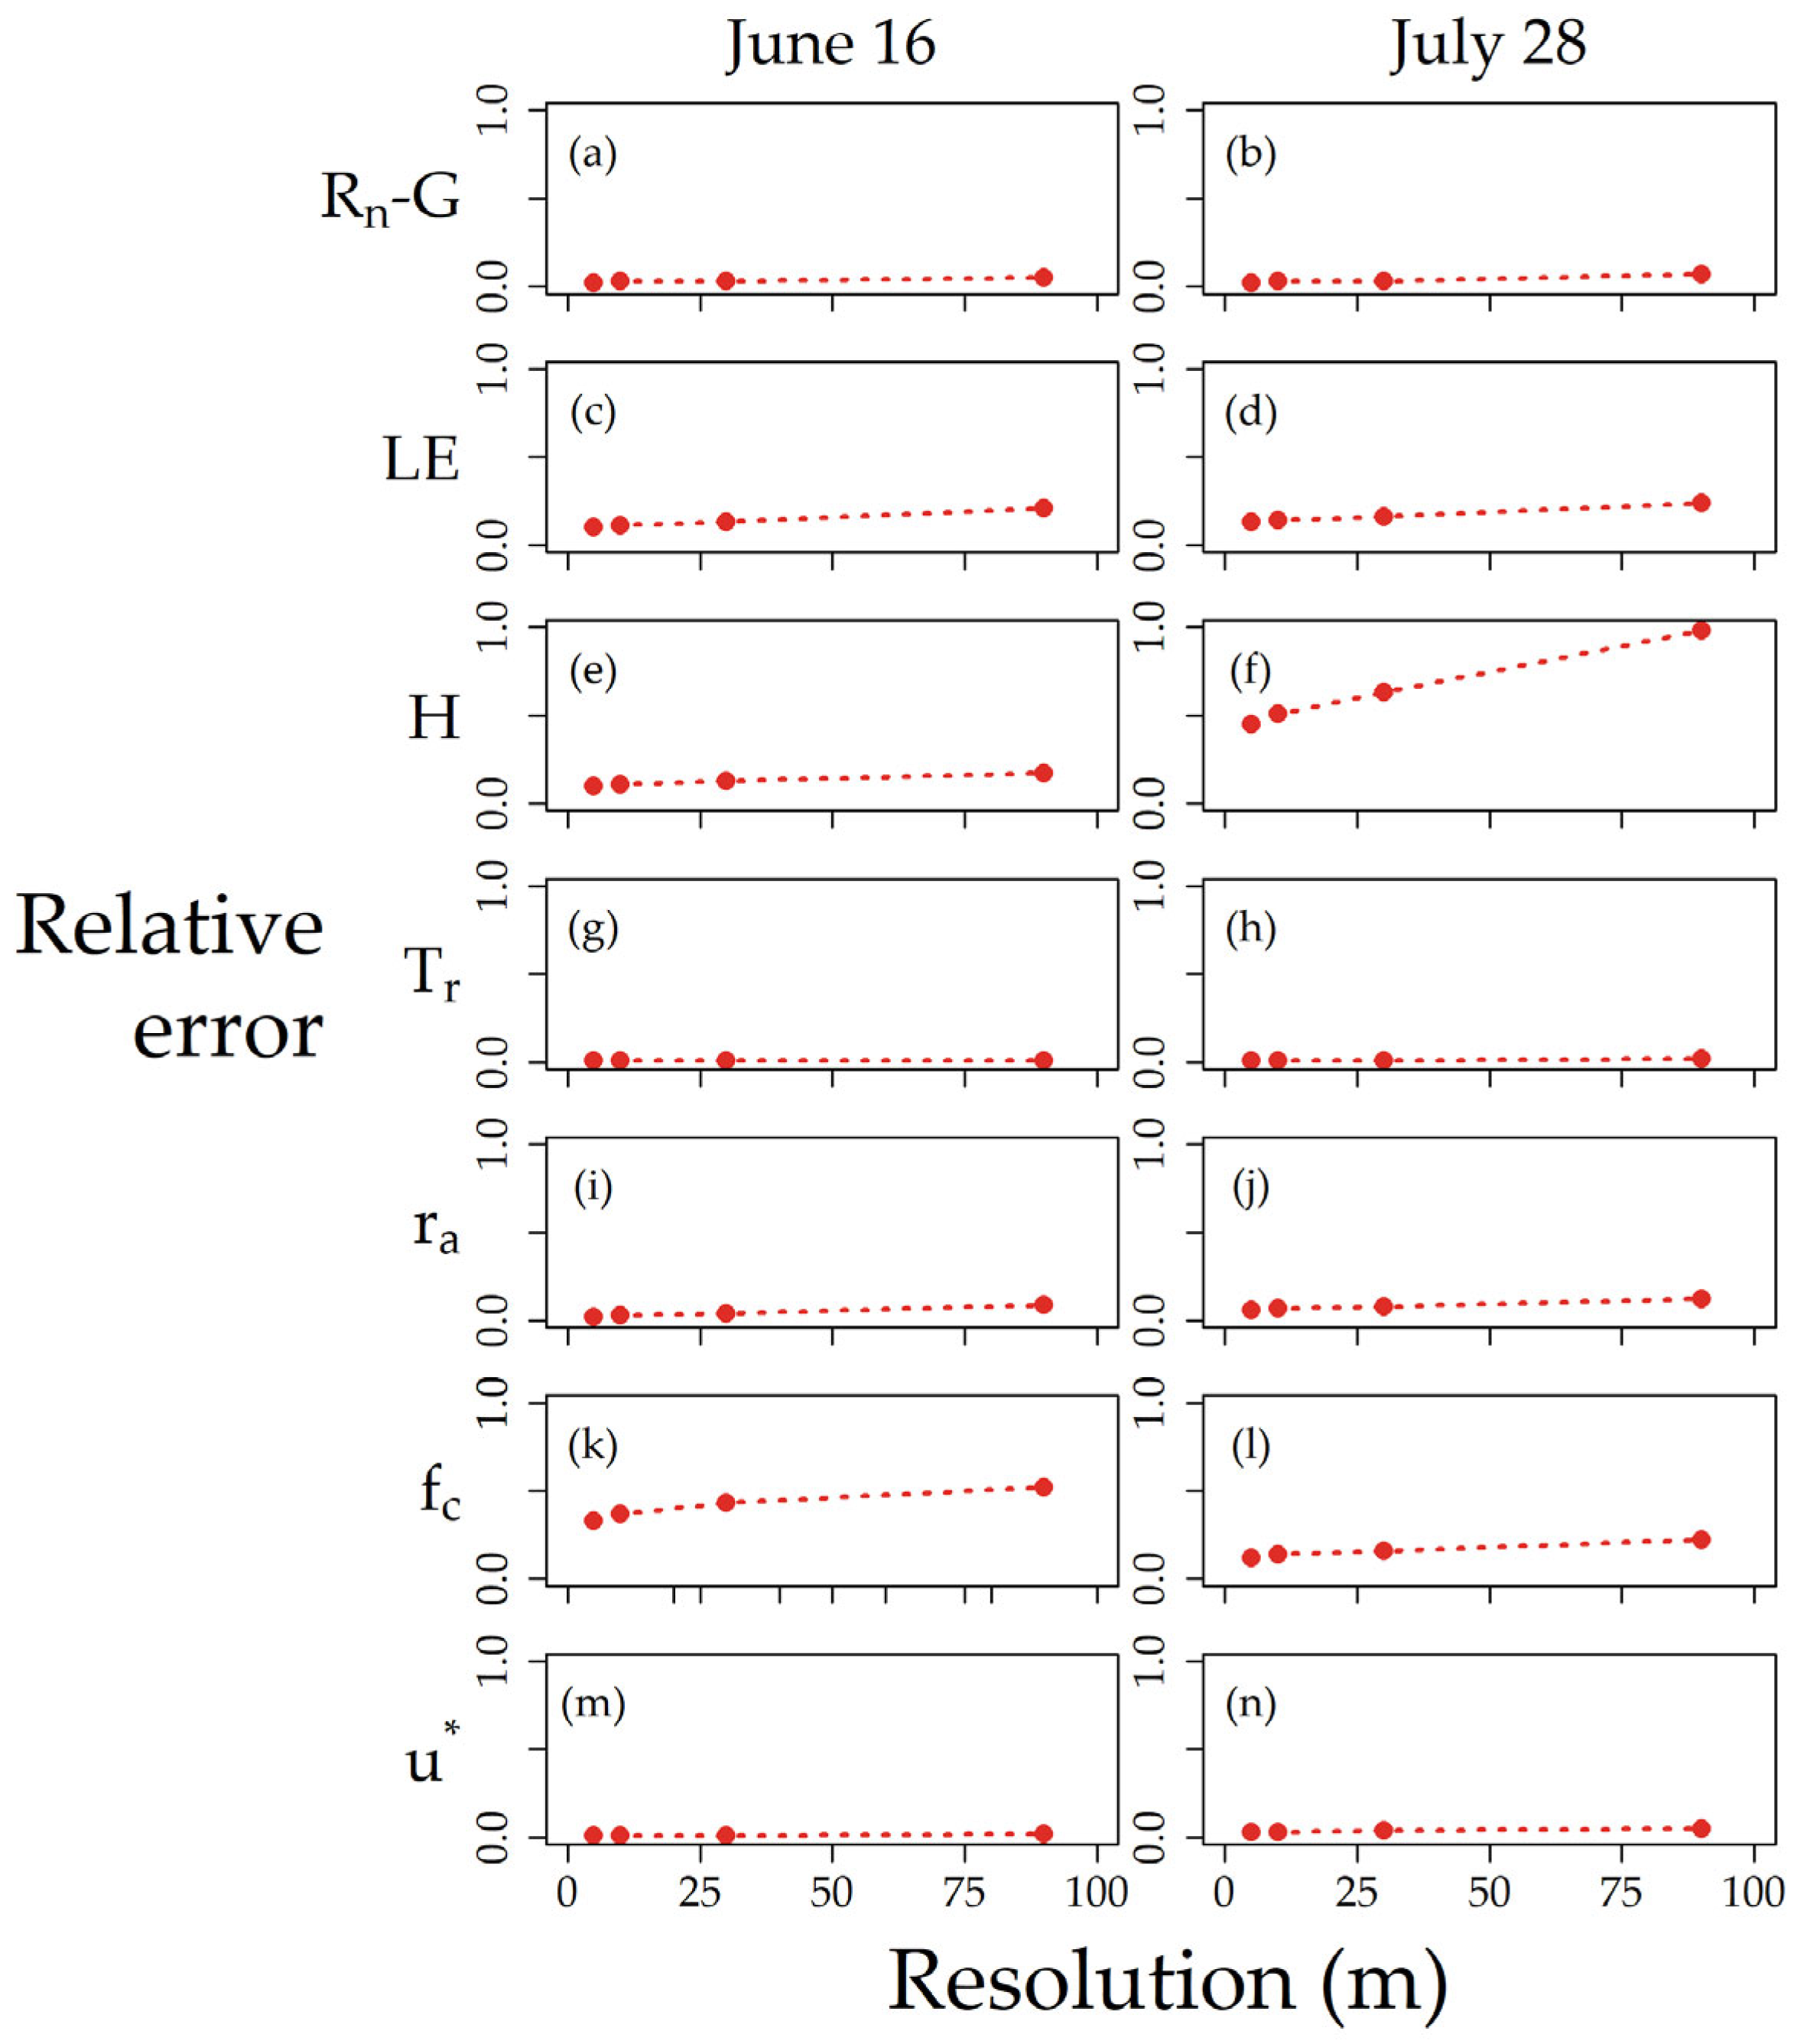
Re values from the same set of inputs and outputs are provided in Figure 9. The data presented in Figure 9 are parameters obtained from arithmetic averaging (i.e., In-SA). Rn-G errors were less than 10 percent across resolutions and were very low relative to the turbulent fluxes (i.e., LE/H, Figure 9a,b). This finding has been observed across both non-contextual and contextual models, as Rn is affected more by solar properties than vegetation/soil properties [19,37]. The LE relative error values were similar on June 16 (partial vegetation cover) and July 28 (near-full vegetation cover) (Figure 9c,d). Because LE is calculated as a residual from Rn-G and H, it stands to reason that H errors are contributing to LE aggregation errors, and this was in fact observed from the data, particularly on July 28 (Figure 9f). The effect of this H error on July 28 resulted in greater LE Re values ranging from two to five percent.
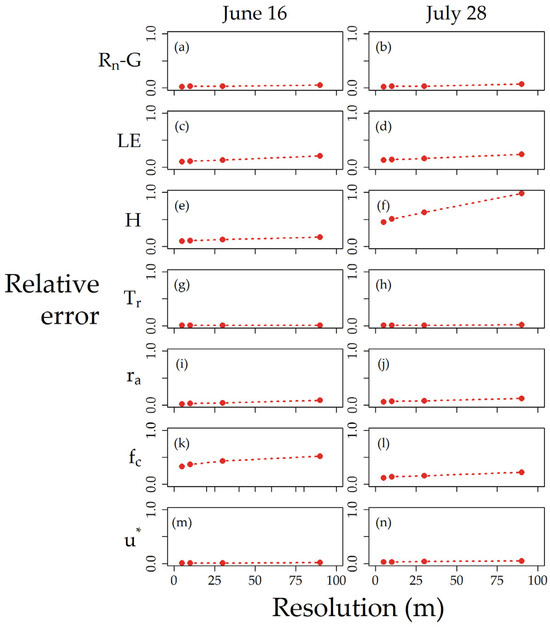
Figure 9.
Relative errors (scaled from 0 to 1) for the same variables as Figure 8, plotted by pixel resolution on June 16 (left column) and July 28 (right column). Variable include net radiation minus soil heat flux (Rn-G) (a,b), latent heat (LE) (c,d), sensible heat (H) (e,f), surface temperature (Tr) (g,h), resistance to heat transport (ra) (i,j), fraction canopy cover (fc) (k,l), and friction velocity (u*) (m,n). Note that Rn, G, H, and LE refer to images obtained via the In-SA aggregation method.
With respect to model parameters, ra errors were relatively low, ranging from one to five percent (Figure 9i,j). The fc relative errors were much higher than ra, although these errors decreased from June 16 to July 28 (Figure 9k,l). The u* relative errors were lower than both ra and LAI, although their errors similarly decreased in time (Figure 9m,n). The Tr relative errors were low and constantly close to zero across both dates (Figure 9g,h). Thus, fc appears to be the main source of aggregation error during partial canopy and full canopy stages, as was the case in previous studies [19]. These findings reaffirm the importance of fc as stated by the original model developers [36]. However, given that input image aggregation was not the optimum approach in this study (Figure 7 and Figure 8), fc (and LAI) errors can be avoided through the use of output flux aggregation, preferably by first choosing a pixel resolution suitable for TSEB-PT modeling, which will be dependent on the canopy structure and distribution [9].
3.3. UAS Aggregation as Compared with OAS and SAT Imagery
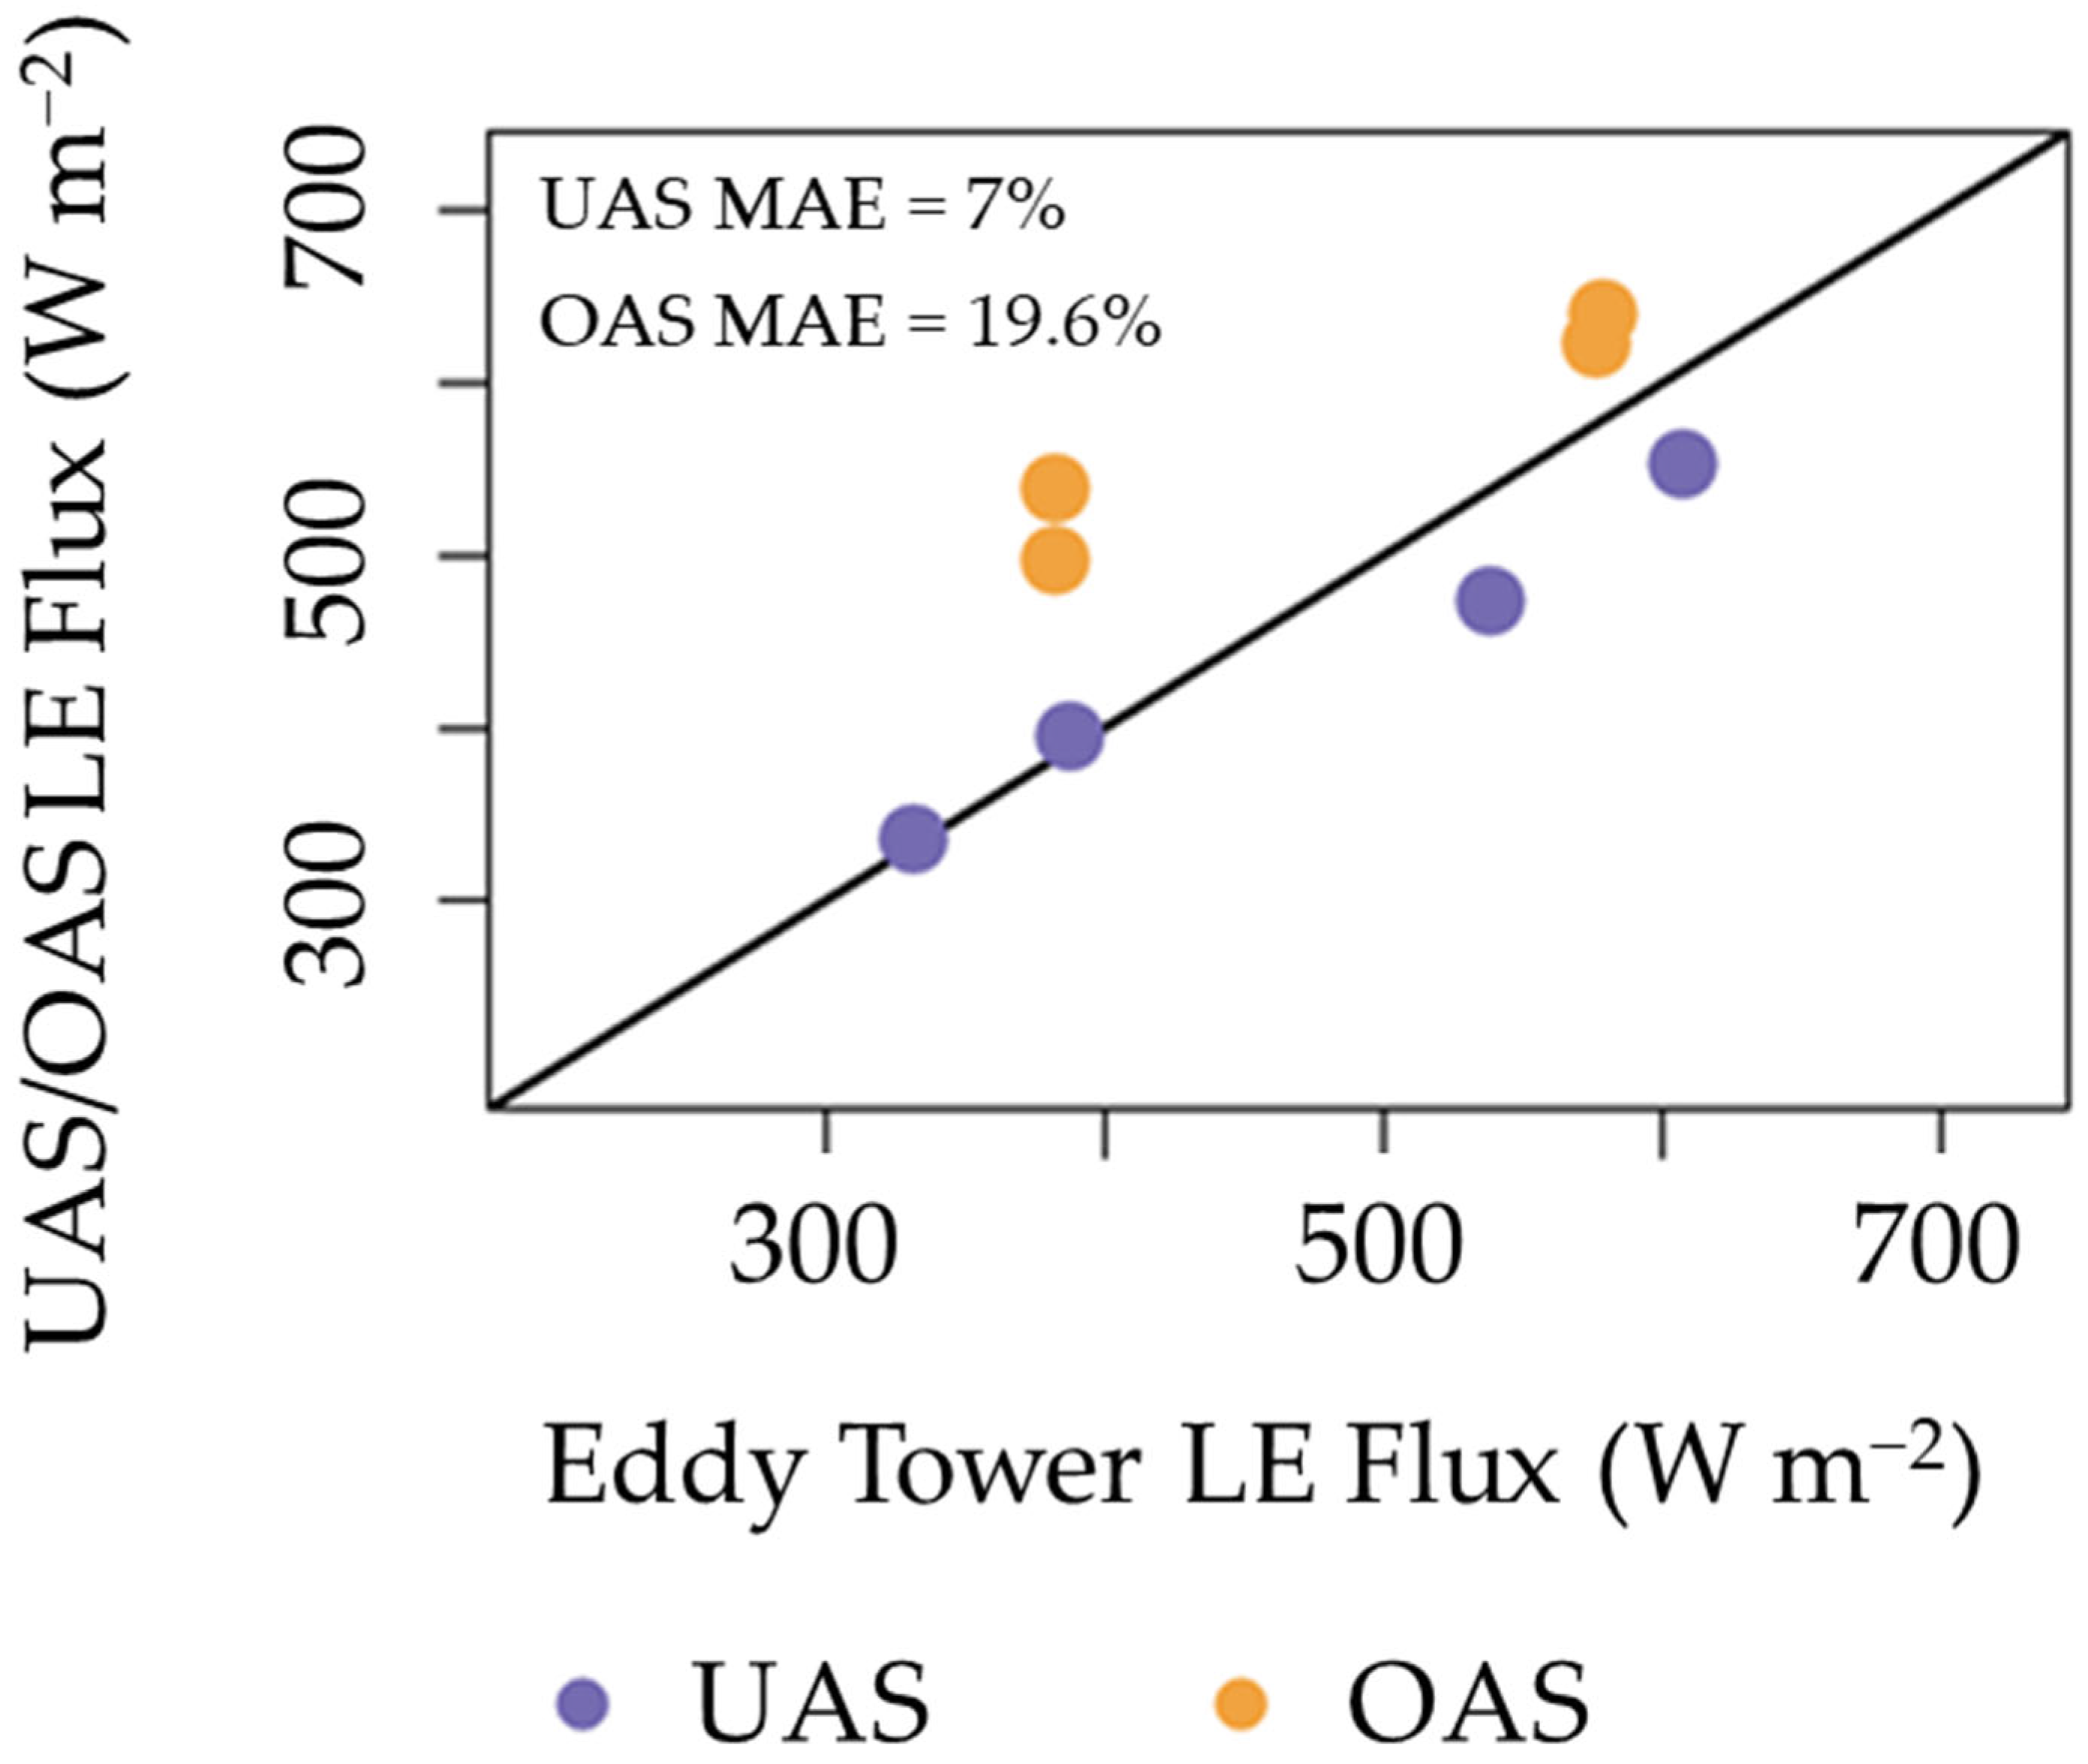
Next, we compared LEs from one UAS-aggregated technique (Out-SA, Figure 2) with those predicted from OAS and SAT imagery. This is first shown in Figure 10, where UAS Out-SA and OAS LEs (at their resolution, Table 1) are plotted against eddy covariance LEs at the time of the UAS and OAS flights. Figure 10 shows that, across both sampled OAS altitudes, the UAS Out-SA was more similar to eddy LEs. For example, the MAPE values from UAS LEs are 7.0 percent at the 1.33 m pixel resolution. In contrast, the MAPE value from OAS was at 19.6 percent. The scatterplot between the UAS Out-SA and eddy LEs is not outwardly biased (Figure 10). Therefore, aggregated UAS LEs, given the limited number of sampling points, might be a more suitable approach towards accurately estimating LE than using OAS remote sensing.
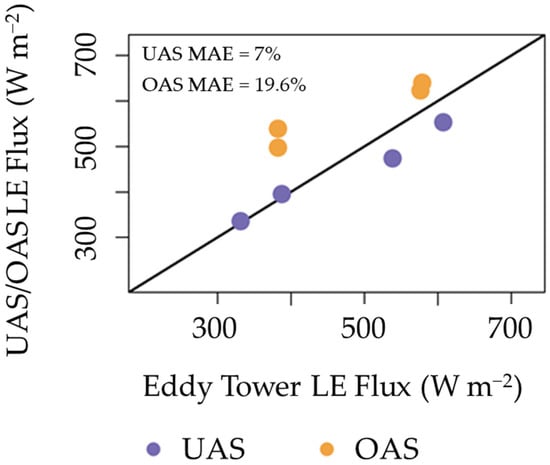
Figure 10.
UAS (purple)/OAS (orange) modeled LE (y-axis) vs. eddy covariance LE (x-axis). UAS fluxes were obtained around the resolution of the OAS survey at 1.37 km altitude.
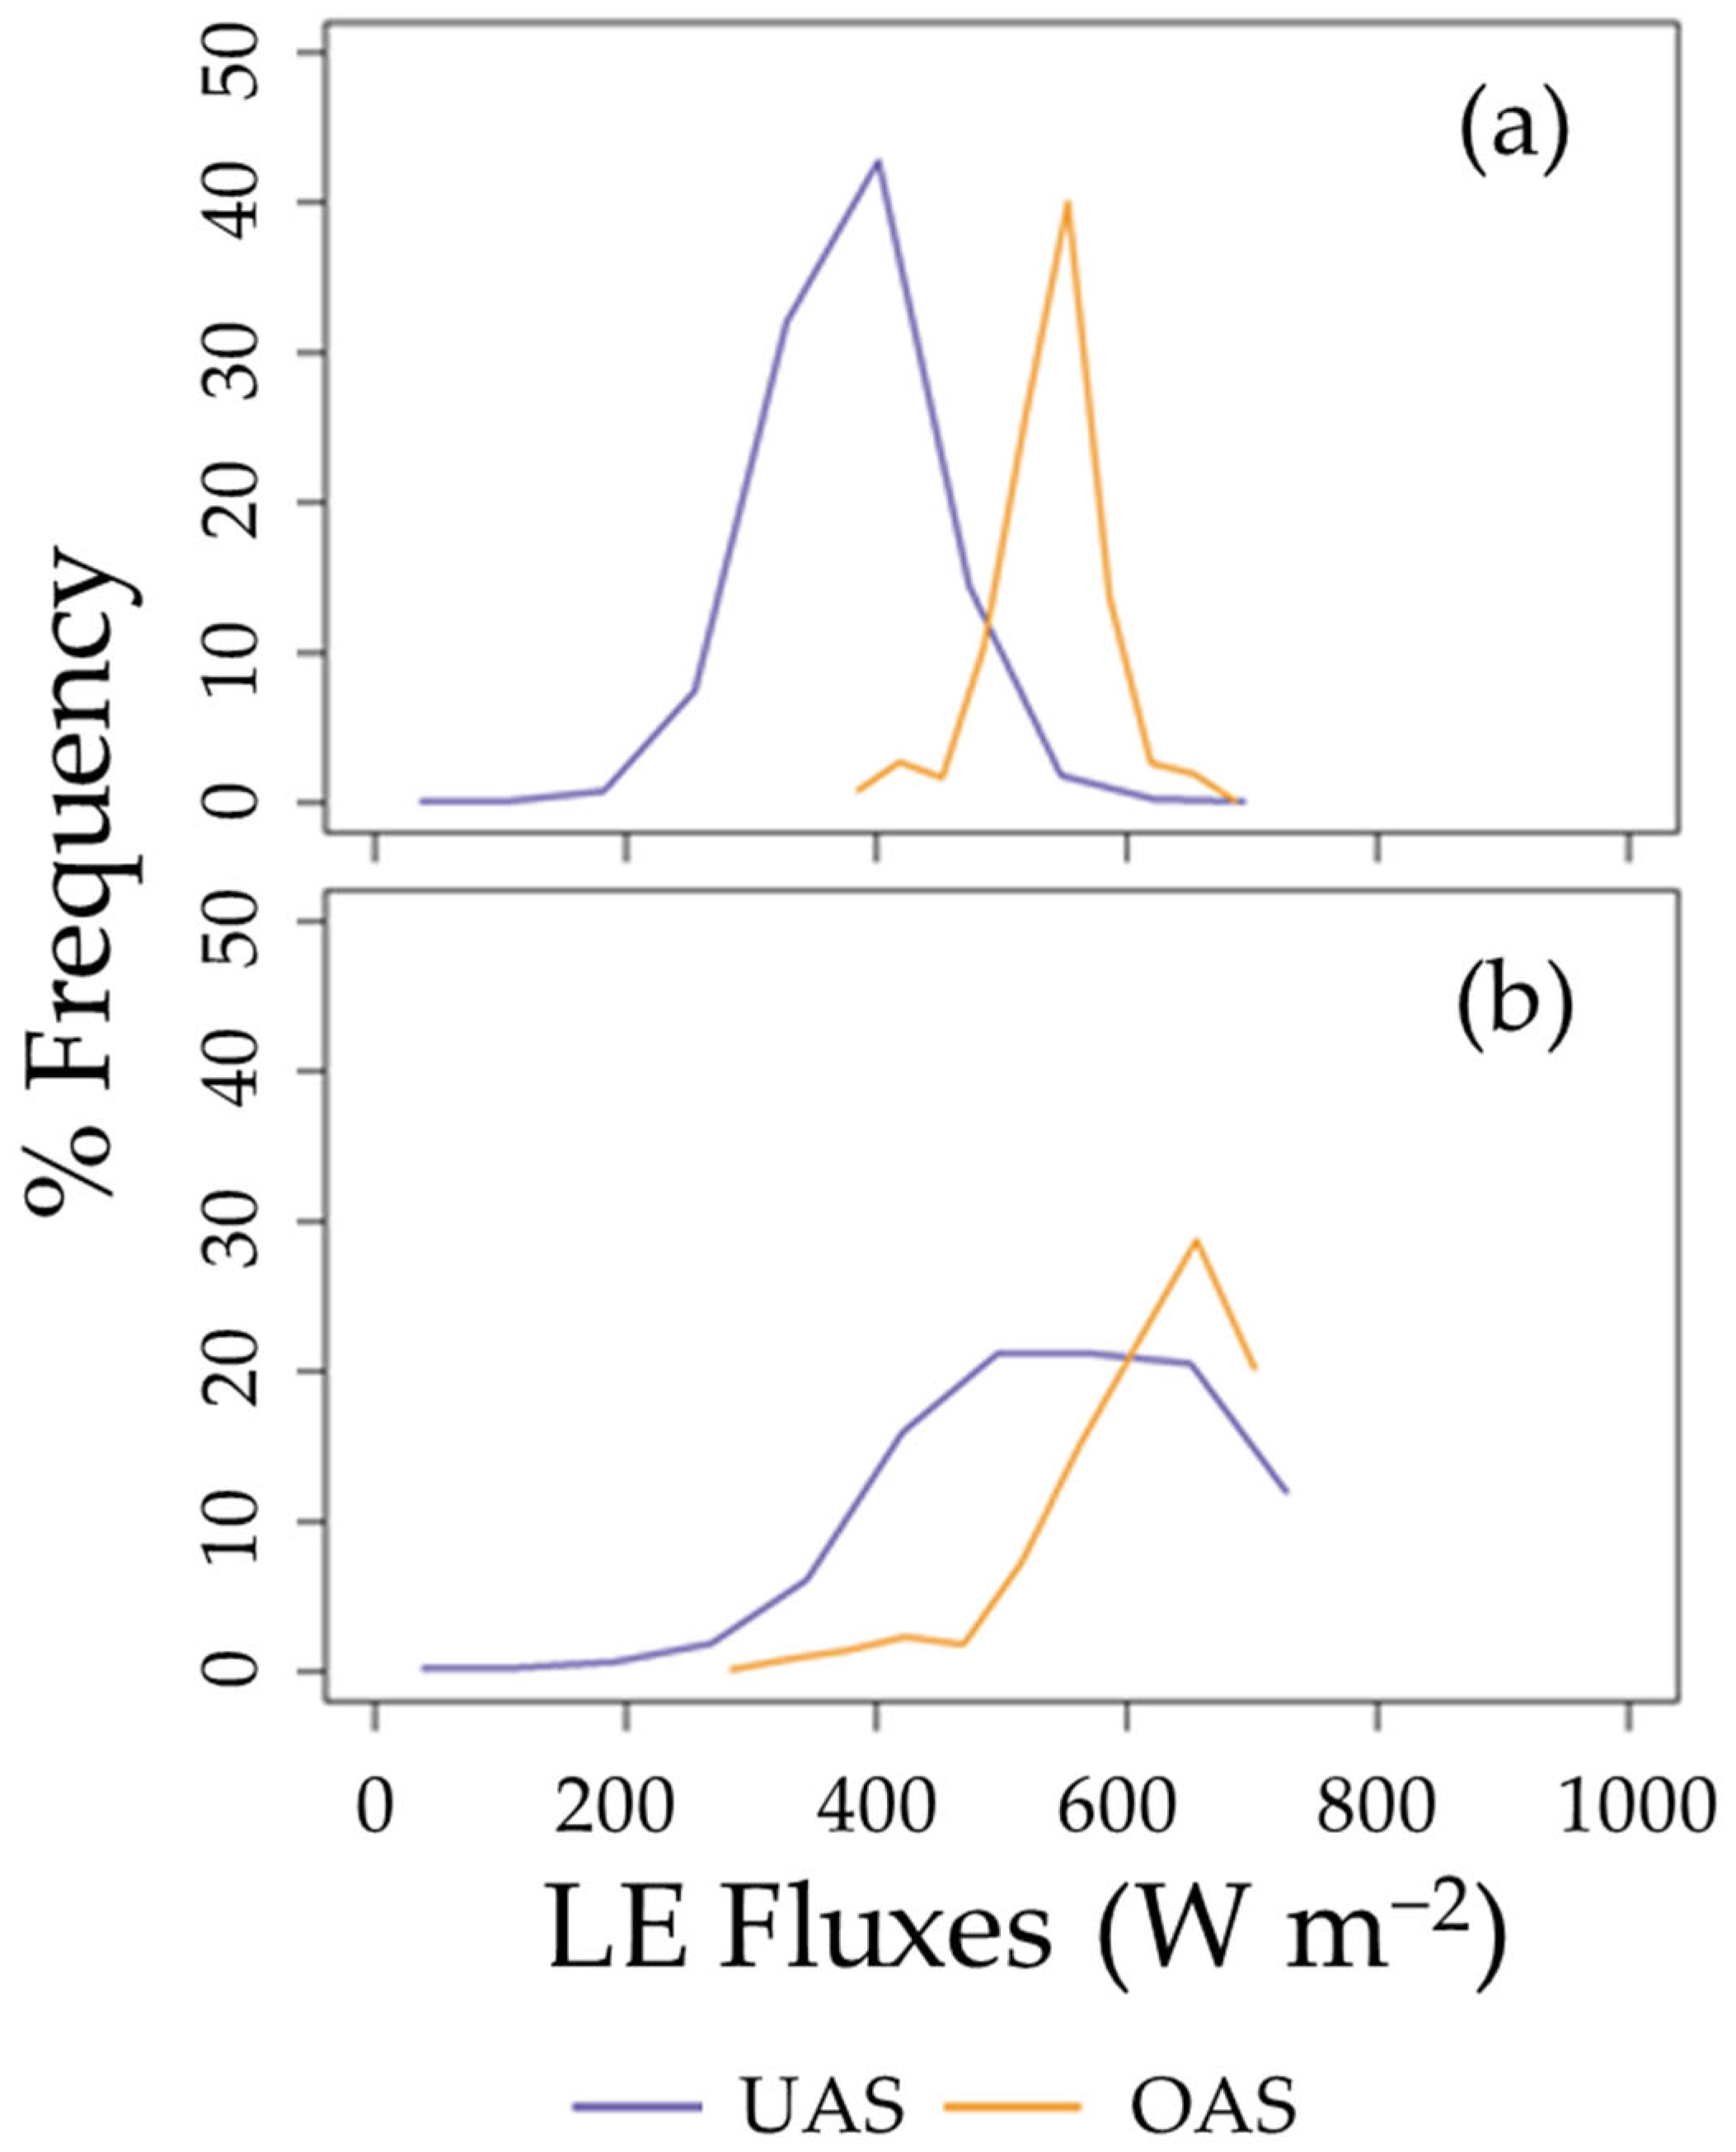
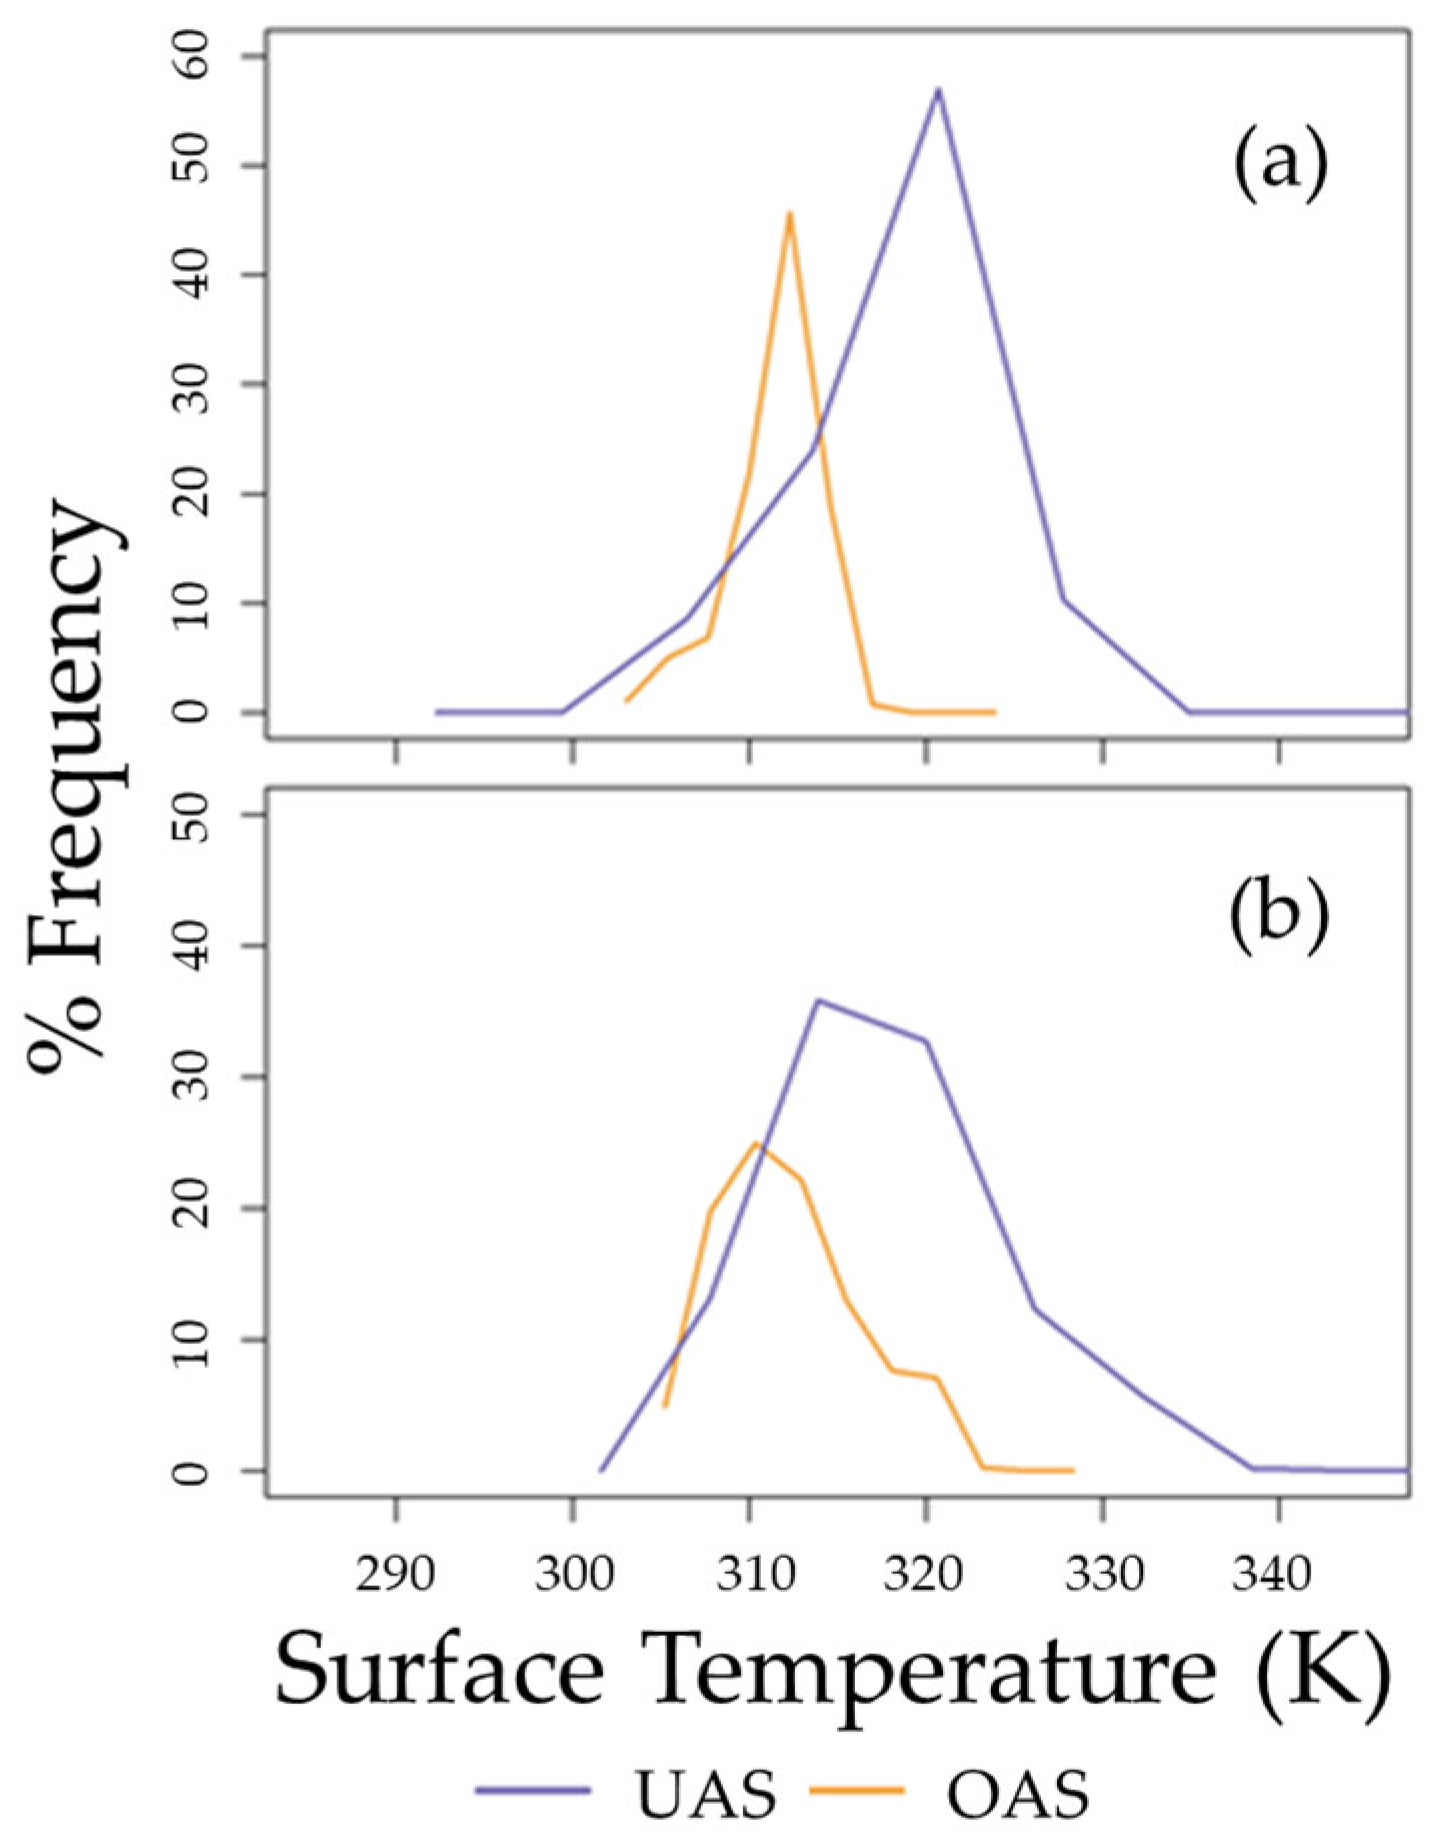
Trends observed at the flux towers (Figure 10) were also observed across the whole field (Figure 11), whereby modeled LEs were greater from OAS than UAS imagery. One potential reason why this trend might be occurring is that measured Tr decreases as the survey altitude increases from UAS (purple) to OAS (orange) surveys (Figure 12). All things being equal, lower Tr signatures result in higher LEs due to lower Ts and Tc values, which reduce H and result in higher LEs. Figure 12 also shows that the UAS-aggregated Tr encompasses a greater range than that encountered by the OAS Tr. In this situation, therefore, the OAS uncooled microbolometer may be unsuitable for accurately determining Tr, and as a result, estimating LE, especially when UAS-aggregated solutions offer promise.
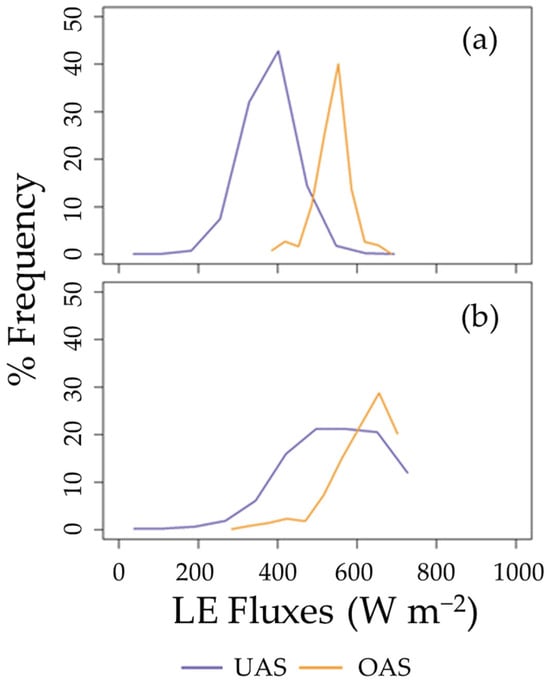
Figure 11.
Line histograms from aggregated UAS LEs (purple) and from non-aggregated OAS LEs (orange) across the entire field on (a) June 16 and (b) July 28.
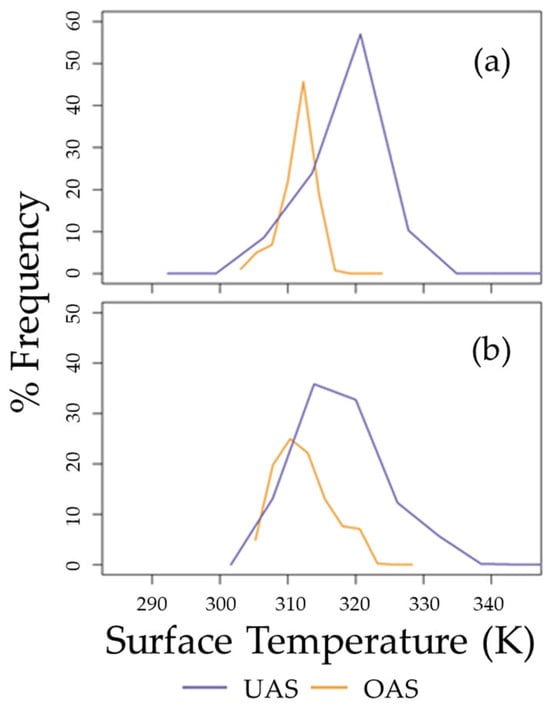
Figure 12.
Whole-field Tr histograms from UAS (1.33 m, purple) and OAS (1.3 m, orange) surveys on (a) June 16 and (b) July 28.
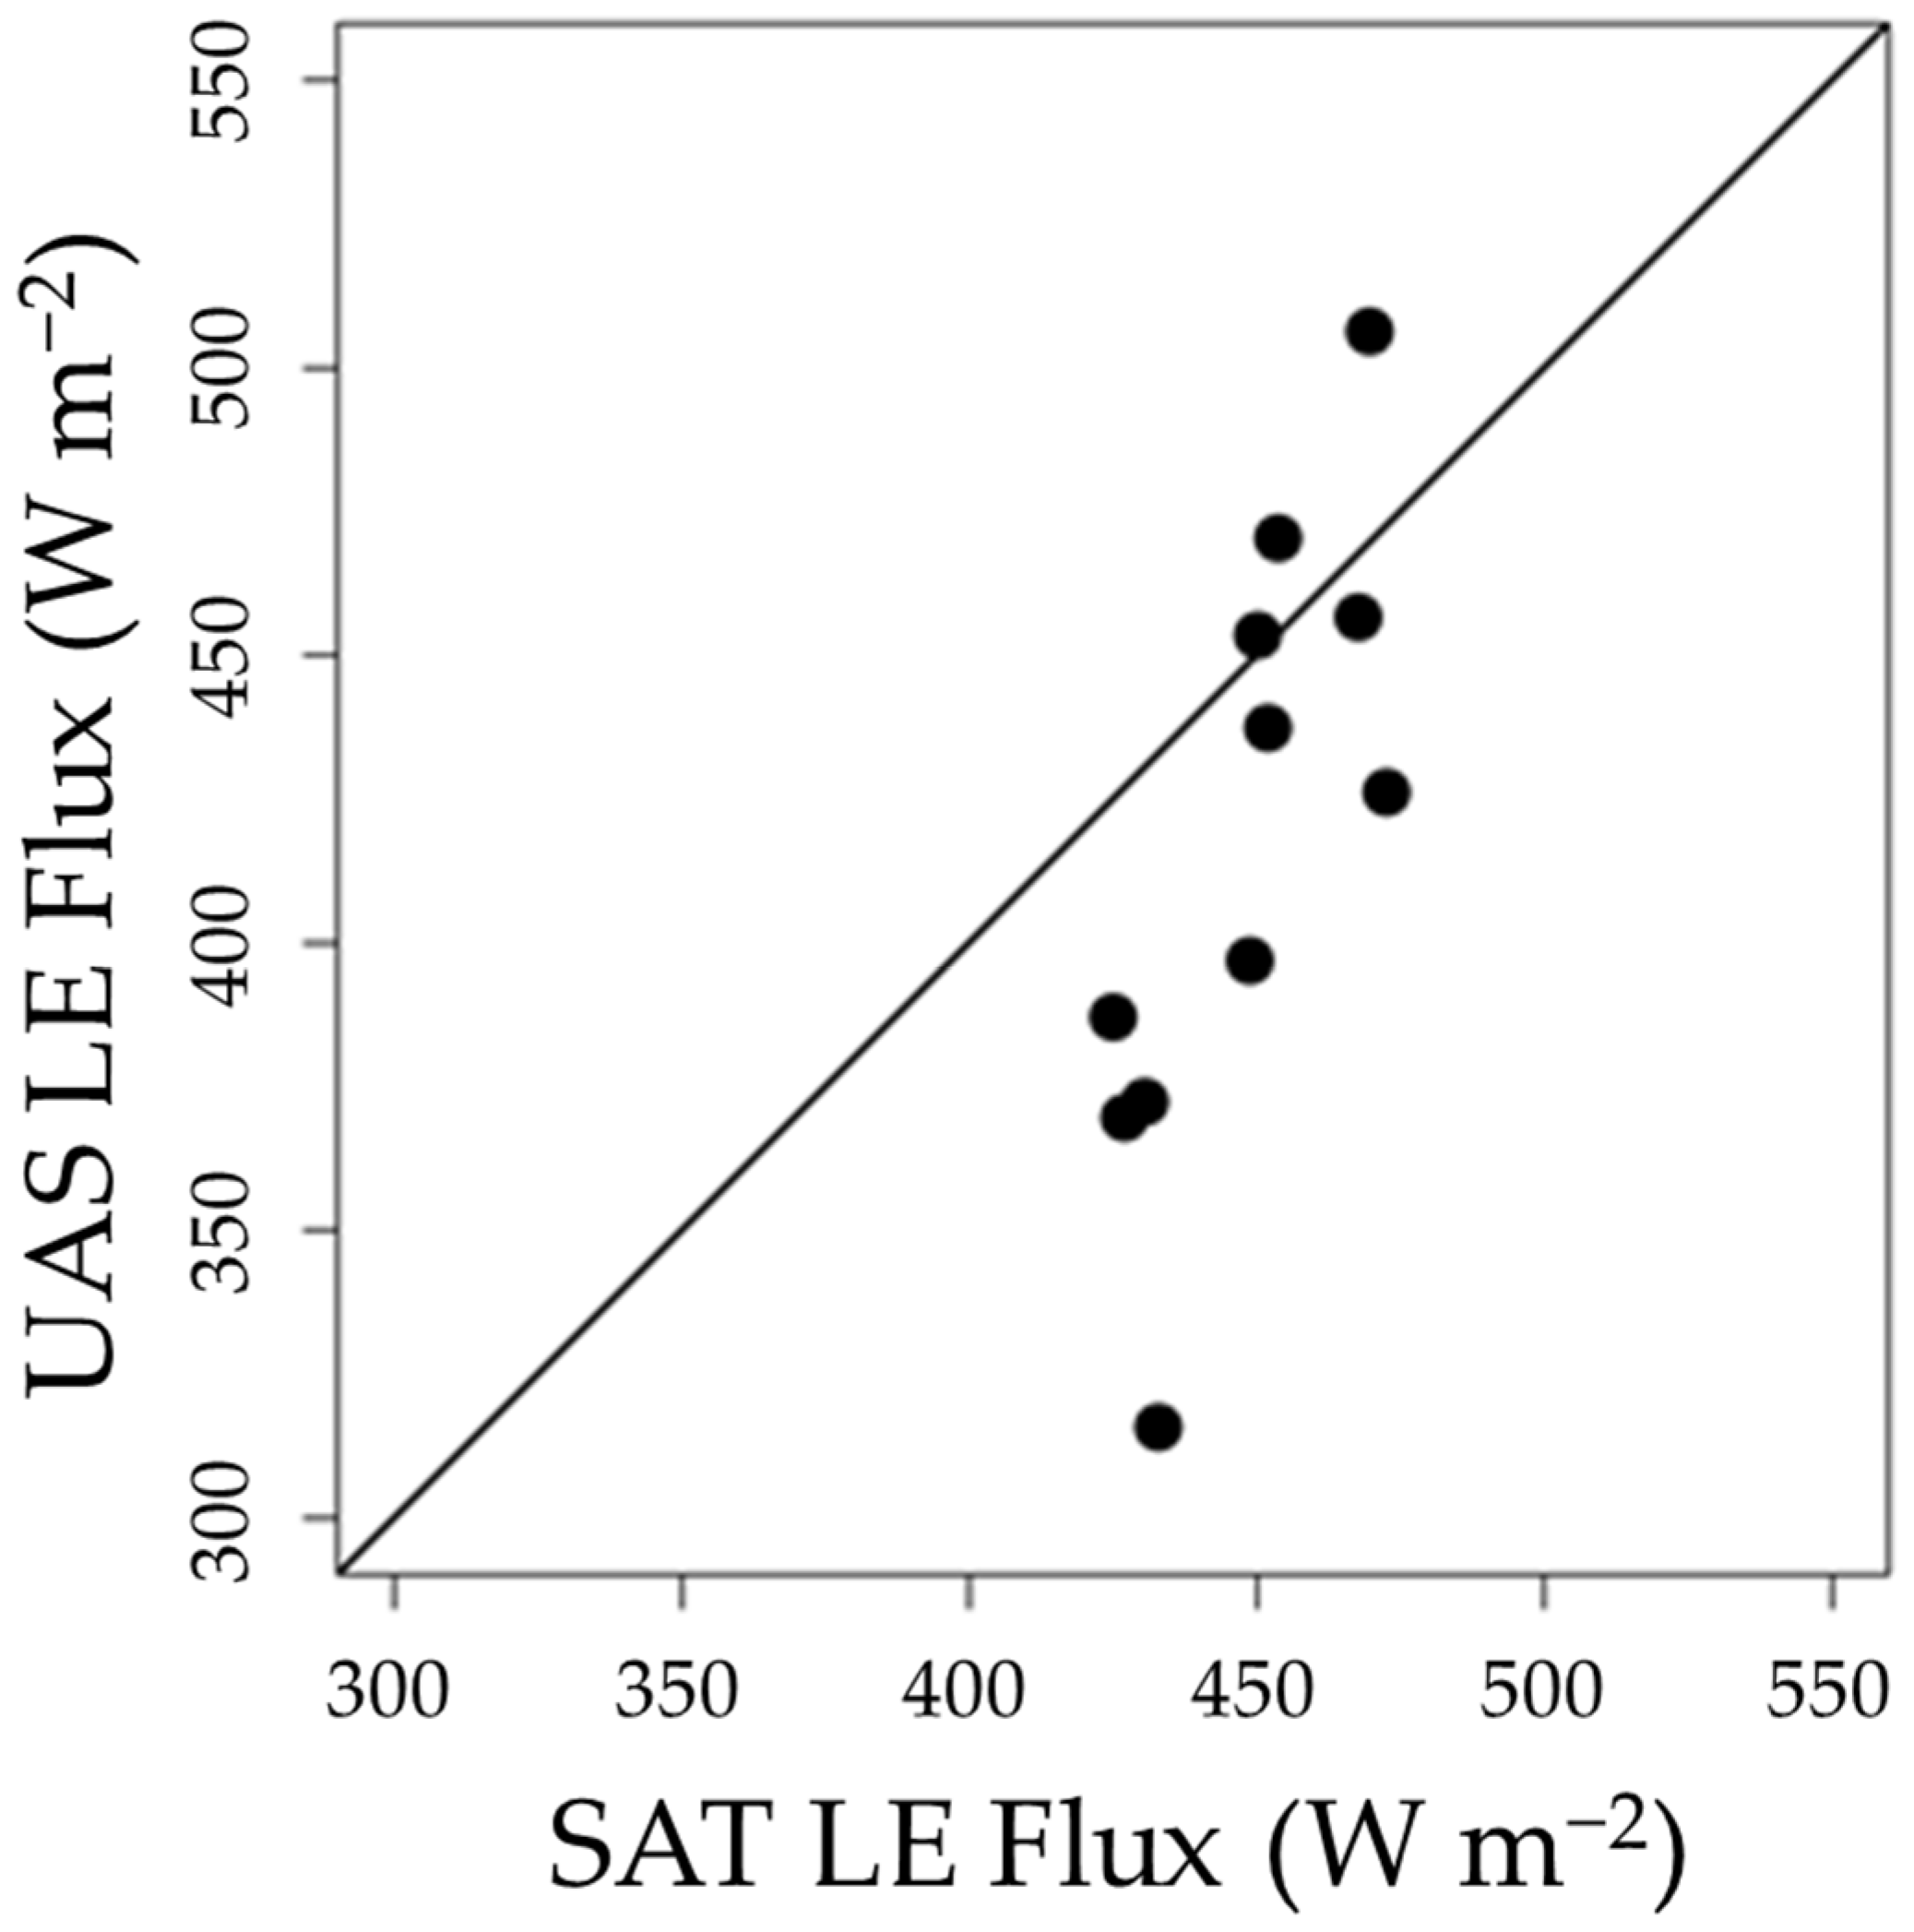
In addition to the OAS, UAS-aggregated LEs via Out-SA were compared with SAT LEs, both across the field and compared to the eddy flux towers. Figure 13 shows the spatial correlation between UAS LE (y-axis) and SAT LE (x-axis) fluxes on 16 June 2017, from the limited sample area (Figure A1). Whole-field comparisons between UAS and SAT LE reveal large differences in modeled LE, with UASs ranging from 315 to 506 W m−2, while SAT only ranges from 430 to 472 W m−2. Note that this data is coming from areas that do not fall under clouds and/or cloud shadow on June 16 (Figure A1). While the LEs between platforms are not entirely comparable due to differences in thermal acquisition times (Table 1), UAS-aggregated LEs, at the very least, are more spatially variable than SAT LEs. To address the differences in acquisition times, SAT/UAS LEs were normalized by tower-measured Rn-G (i.e., available energy). The resulting ratios approximately normalize the effect of different available energy conditions between UAS and Landsat overpass times. These ratios were then compared with the associated available energy fraction from the tower around the overpass time. Through this analysis, the resulting flux ratios can be better compared between the platforms and the towers by reducing the effect of the different radiation conditions for the two overpass times. Results indicate that the flux tower ratio fell within the UAS LE/Rn-G fraction distribution, while it did not for the corresponding SAT LE/Rn-G fraction distribution. Specifically, the UAS LE/Rn-G fraction distribution was 0.70 ± 0.09 (n = 11), and the tower LE/Rn-G fraction was 0.56; the SAT LE/Rn-G fraction distribution was 0.88 ± 0.03 (n = 11), and the tower LE/Rn-G fraction was 0.59. Therefore, any errors induced in the UAS aggregation process may be acceptable because they may capture intra-row variability and its patterns [4].
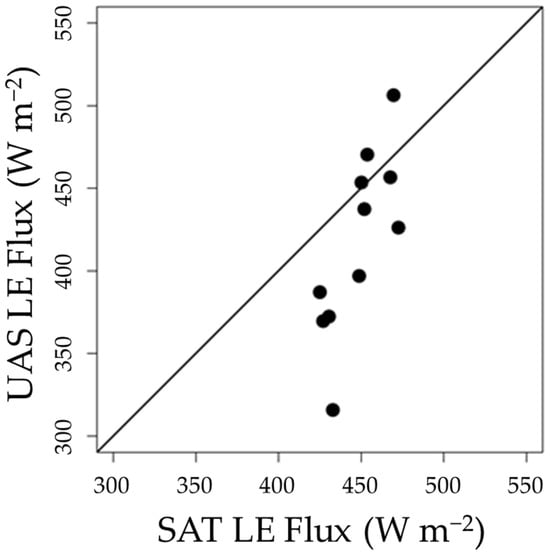
Figure 13.
Pixel-wise comparisons between the UAS (y-axis) and SAT (x-axis) LEs on 16 June 2017. Note that the UAS LEs were aggregated using Out-SA up to the SAT resolution (i.e., 90 m).
Flux comparisons between the UAS and SAT platforms at the tower were performed as in Figure 10, except here fluxes were extracted from single pixels encompassing eddy flux tower B (Figure 1, flux tower B) at the time of the UAS and SAT flights. Given the one tower data point on June 16, the residual error between the UAS and eddy flux LE was −52 W m−2, while between the SAT and eddy flux it was 126 W m−2. Therefore, while the number of data points is very limited, there is initial evidence to suggest that aggregated UAS fluxes (via Out-SA) might be more accurate than SAT approaches—such a study should aim to collect and compare UAS and SAT imagery beyond the single overpass date presented here.
4. Discussion
The purpose of this study was to evaluate ultra-high (cm-scale) UAS-aggregated imagery within the context of LE modeling. Out of the parameters selected in this study, the largest aggregation errors were predominantly attributed to fc across both IOP dates (Figure 7 and Figure 8). Here, it was assumed that fc could be used as a proxy for LAI, based on the methodology described in this paper (Section 2.5.1). This study reinforces previous observations that, even with high-resolution UAS imagery, the surface heterogeneity of the site is a major factor that controls remotely sensed LE aggregation properties [47]. These findings agree with other TSEB aggregation studies [19], although their study was restricted to SAT imagery. The fc and associated LAI affect several components of the TSEB-PT model, including (1) aerodynamic roughness length (or zom), (2) zero-plane displacement height (or d), (3) shortwave canopy/soil net radiation (Sn,c/Sn,s), (4) longwave canopy/soil net radiation (Ln,c/Ln,s), (5) clumping index (Ω0), and (6) canopy layer boundary resistance (or Rx) [36,39,40,41].
Because Rn-G aggregation errors were relatively low (Figure 9), fc aggregation errors were most likely not manifested through the components of Rn (i.e., Sn,c/Sn,s, Ln,c/Ln,s). Other parameters of Rn that could potentially contribute to aggregation errors, such as shortwave albedo and emissivity, relative to other parameters (such as H), are minimal (Figure 9a,b). Other papers have reported substantial error (greater than 50 percent) due to differences in surface roughness alone [47]. Therefore, it is likely that LAI aggregation errors will have an impact on aerodynamic resistance parameters and either directly or indirectly affect the estimation of H, and this could contribute to the relatively large pixel-scale errors observed (Figure 9e,f). However, prior studies evaluating the sensitivity of TSEB-PT to model inputs find that Tr and fc/LAI can cause the largest uncertainty in H estimation [51,52].
The topic of the effects of aggregation also has relevance within crops other than cotton. For example, olive orchards and vineyards present additional modeling challenges, as the latter exhibit vertically non-uniform leaf area distribution, requiring modification to radiation and wind extinction algorithms used in uniform canopies [12,53]. Based on a study by [54], there may be cases where a different soil resistance (rs) scheme may be more appropriate for sparsely vegetated and clumped canopies. Future studies, therefore, might consider the potential influence on estimating aerodynamic resistance based on aggregation schemes. Given that the output flux aggregation was a better approach for this study, however, the question may not be of utmost importance, at least within these given conditions.
Another significant finding in this study was that the fc aggregation properties (Figure 4), as well as the LE aggregation errors in general (Figure 5 and Figure 7), were more prominent during partial vegetation cover than full vegetation cover. Note that spatial variability in fc can occur due to changes in soil moisture, soil type, management practices, etc. Such challenges could be addressed by collecting at a finer scale and then aggregating the flux output via output aggregation, as shown in this study. Furthermore, the statistical distribution of the native LE output should be addressed before aggregating LEs. Output flux aggregation is expected to play a role in the validation of coarser-scale flux products provided by Landsat and Sentinel [55]. The finding here that calculating LE or ETa at the original resolution, rather than an aggregated resolution, has been found elsewhere, at least with satellite imagery [15,56]. In fact, this approach of output flux aggregation is similar in concept to that used in the disaggregation scheme of the DisALEXI (Disaggregation Atmosphere Land Exchange Inverse) model [57]. The downside of these findings, however, is that greater resources (i.e., time, money, etc.) will need to be spent on post-processing operations, such as GCP deployment, high-grade GPS collection, and orthomosaicking. UASs also present LE challenges in terms of finer resolution, amplifying sources of noise such as shadows, canopy glint, and blurriness from wind [58].
Beyond the model parameterization, it is possible that fc errors are exaggerated due to the UAS data collection process. Multispectral surveys were conducted at different times than the thermal survey, indicating potential differences in illumination conditions between multispectral and thermal surveys (Table 1). These temporal differences can result in image misregistration and, therefore, LE estimation errors. However, given that the model results were less than 10 percent on these two dates (Table 5) and that UASs were more accurate than OASs (Figure 10), this potential error does not appear to be substantial. Recent technological improvements have allowed for multispectral and thermal cameras to collect data at the same time, and preliminary results in the literature suggest this platform setup may be useful for future UAS studies that aim to model LE via TSEB models [59].
In this study, the aggregated UAS was more accurate in replicating eddy flux tower LE measurements relative to OAS (Figure 10). One hypothesis for this result may be that the differences in altitude between the UAS and OAS. As the survey altitude increases further from the ground, outgoing longwave radiation will be attenuated through interaction with water vapor and gases in the atmospheric column, requiring a greater atmospheric correction [60]. The thermal correction approach described here for the OAS is more uncertain due to relatively large pixel resolutions. It is hypothesized that there is more uncertainty in estimations of OAS Tr because the size of the cold object used for correction (i.e., polystyrene blocks) was at or slightly smaller than the OAS thermal pixel resolution. Therefore, the average of polystyrene predicted Tr could not be extracted with OAS thermal images. Another reason why the UAS may have outperformed the OAS sensor could be differences in thermal sensor quality. Both cameras in this study were uncooled microbolometers and are known for producing image blur while the sensor is in motion [61]. Given that the OAS was traveling much faster than the UAS, the resulting blur could increasingly degrade the former’s image quality. Thermal image blur can be reduced using cooled thermal infrared sensors, but these systems cannot currently be equipped aboard UAS platforms, nor are they cost-effective [62]. Future studies might consider comparing UAS LE aggregation properties using output aggregation against those of OAS cooled sensors.
In this study, the land use type was mainly uniform, as a uniform seeding rate and a single variety were growing under a uniformly irrigated field. It would be interesting to evaluate the UAS LE aggregation properties under production fields with multiple land use types [11], for example, found that LE discrimination between corn and soybean fields was diminished beyond a pixel resolution of 960 m. The effects of these studies will be determined by the nature of the objects themselves, as well as their spatial pattern [61], for example, found that high pixel-scale relative errors were linked with areas that show highly contrasting surface roughness properties, such as irrigation canals and production field boundaries. If there is interest beyond a single production field, the approach described in this study could be used to validate platform sensors, such as satellites. While this study was limited to Landsat 8, the launch of Landsat 9 is now available for future studies. Validation could also be applied for fused satellite products, such as Sentinel-2 and Sentinel-3, as proposed by [63] and disaggregation techniques described using multiple satellite sources, including ECOSTRESS and Landsat [3].
5. Conclusions
The purpose of this study was to evaluate the impact of aggregation methods on spatially distributed latent heat flux (LE) when compared to more established occupied aircraft (OAS) and satellite (SAT) remote sensing platforms. The UAS data was aggregated from a fine scale (1.3 m) up to 90 m to compare with OAS and SAT imagery. Although this study was on only one field, results indicate that aggregating the UAS LE output with simple averaging (Out-SA) produced the lowest relative pixel-scale errors and lowest absolute prediction errors for LE when compared to the eddy covariance flux tower measurements. Aggregating UAS imagery-based estimates of LE using the TSEB-PT model was also more accurate in reproducing LEs from eddy flux towers than applying OAS and satellite imagery. This study suggests that UAS LE estimates, despite their data complexity, can be a reliable source of spatial LE, and if reliably extrapolated, spatial daily ETa, as shown by [50] for evaluating coarser resolution LE and daily ETa products from SAT data. UAS can also potentially provide ETa maps over targeted fields at critical stages in crop development when SAT data may be unavailable. Additional studies on other crops, crop growth stages, and land use types would strengthen these conclusions.
Author Contributions
Conceptualization, H.L.N. and C.L.M.; Methodology, H.L.N., C.L.M., B.P.M. and C.Y.; Software, H.L.N.; Validation, H.L.N.; Formal Analysis, H.L.N.; Data Curation, H.L.N. and C.Y.; Writing—Original Draft Preparation, H.L.N.; Writing—Review and Editing, H.L.N., C.L.M. and B.P.M.; Supervision, H.L.N. and C.L.M.; Project Administration, H.L.N. and C.L.M.; Funding Acquisition, H.L.N. and C.L.M. All authors have read and agreed to the published version of the manuscript.
Funding
This work was supported by Texas A&M Agrilife, the Unoccupied Aerial Systems Project for Precision Agriculture and High Throughput Field Phenotyping project, as well as the Texas Water Observatory project.
Data Availability Statement
The data presented in this study are available on request from the corresponding author.
Acknowledgments
This research was additionally supported in part by the U.S. Department of Agriculture, Agricultural Research Service. Mention of trade names or commercial products in this publication is solely for the purpose of providing specific information and does not imply recommendation or endorsement by the U.S. Department of Agriculture. USDA is an equal opportunity provider and employer. The authors would like to thank additional members of the UAS team (Jinha Jung, Anjin Chang, Ian Gates, Andrew Vree, Alex Thomasson, and G. Cody Bagnall), the OAS flight team (Fred Gomez), and the Texas Water Observatory Project (Nandita Gaur, Deanroy Mbabazi, and Aline James). Special thanks to William Kustas for his guidance and support in this study.
Conflicts of Interest
The authors declare no conflicts of interest. The funders had no role in the design of the study; in the collection, analyses, or interpretation of data; in the writing of the manuscript; or in the decision to publish the results.
EEO
The U.S. Department of Agriculture prohibits discrimination in all its programs and activities on the basis of race, color, national origin, age, disability, and where applicable, sex, marital status, familial status, parental status, religion, sexual orientation, genetic information, political beliefs, reprisal, or because all or part of an individual’s income is derived from any public assistance program. (Not all prohibited bases apply to all programs.) Persons with disabilities who require alternative means for communication of program information (Braille, large print, audiotape, etc.) should contact USDA’s TARGET Center at (202) 720-2600 (voice and TDD). To file a complaint of discrimination, write to USDA, Director, Office of Civil Rights, 1400 Independence Avenue, S.W., Washington, D.C. 20250-9410, or call (800) 795-3272 (voice) or (202) 720-6382 (TDD). USDA is an equal opportunity provider and employer.
Abbreviations
The following abbreviations are used in this manuscript:
| Abbreviation | Definition |
| DN | Digital Number |
| ET | Evapotranspiration |
| In-BC | Input Flux Aggregation with Box–Cox Averaging |
| In-SA | Input Flux Aggregation with Simple Averaging |
| IOP | Intense Observation Period |
| LAI | Leaf Area Index |
| MAPE | Mean Absolute Percentage Error |
| OAS | Occupied Aerial System |
| OLI | Operational Land Imager |
| Out-BC | Output Flux Aggregation with Box–Cox Averaging |
| Out-SA | Output Flux Aggregation with Simple Averaging |
| SAT | Satellite |
| SEBS | Surface Energy Balance System |
| TIRS | Thermal Infrared Sensor |
| TSEB | Two-Source Energy Balance |
| TSEB-PT | Two-Source Energy Balance Priestley–Taylor |
| UAS | Unoccupied Aerial System |
Appendix A. Description of UAS Geometric/Radiometric Corrections
After image collection, both multispectral and thermal images were transferred to a computer for further processing. Thermal images were first processed from 8-bit digital numbers (DNs) or radiance to 16-bit camera-calibrated brightness temperature (Tbr) using the provided software (IRFlash 2.16.4.21). Tbr is not the same as Tr, the variable of interest, as the former contains sources of uncertainty such as atmospheric attenuation and differences in land surface emissivity (ε) within a scene [60]. Tr can be estimated from Tbr at each ith pixel, given ε and the background air temperature (Tbg) [36]:
Because soil and vegetation pixels were visible from thermal images at all points in this study, and because these two objects were found to exhibit different ε values from field measurements, spatially distributed ε was needed to derive accurate Tr. ε was calculated at each ith pixel; therefore, by weighting soil and vegetation ε values (εs and εv, respectively) by fc [31]:
where εs was 0.96 as obtained from a box method [64], and εv was set to 0.99, per recommendations from [35]. Tbg (Equation (4)) was found using Ta data from an HC2S3 temperature probe (Campbell Scientific, Logan, UT, USA).
Validation for the thermal correction approach above was assessed by comparing predicted and measured Tr obtained using a handheld sensor (MI-220, Apogee Instruments, Logan, UT, USA). Measured Tr values refer to vegetated and bare soil surfaces during thermal image collection. Predicted temperatures were computed by first aggregating up to the field-of-view of the IRT (around 0.08 m2). Predicted canopy and soil temperatures were obtained by extracting the minimum and maximum temperatures within the approximate measurement area (3 m radius). Mean absolute error (MAE) values of 2.6 and 4.6 °C and mean biases (predicted-measured) of 1.9 and −2.6 °C were found for plants and soils, respectively. One possible source of error lies within the different spectral ranges between a ground thermal sensor (i.e., MI-220, Apogee Instruments, Logan, UT, USA) and the aerial thermal sensor (i.e., ICI-8640 P) (8–14 μm and 7–14 μm, respectively).
All multispectral and thermal images collected from each survey were then used to generate orthomosaics using the commercial software Agisoft PhotoScan Pro (St. Petersburg, Russia). Orthomosaic generation is based on the structure from motion method, which is based on steps such as (1) image alignment, (2) 3D geometry creation, (3) ortho-photo generation, and (4) digital surface model generation [64]. Orthomosaic generation was aided by GCPs (Figure 1) and their known locations using the RTK GPS described earlier. Thermal orthomosaic generation was additionally aided by attaching (and subsequently identifying) aluminized polyester located on the upper level of each GCP. For AM Tr images, however, a different procedure was performed, as orthomosaic generation was difficult due to a low number of matching features. Instead, a partial orthomosaic was generated within ArcGIS by orthorectifying select images using multispectral imagery as a visual guide (ESRI, Redlands, CA, USA). The images were selected based on their location within the eddy covariance footprint. Because AM surveys are generally characterized by relatively lower Tr variability, an average Tr was calculated within each partial orthomosaic—this approach has precedence within the literature [5]. Exported orthomosaics were deemed acceptable and exported as GeoTIFFs when the positional RMSE values were less than or equal to 1.5 times the pixel resolution.
Radiometric calibration was performed on multispectral orthomosaics using the empirical line method [32]. A previous study by [65] demonstrated that the empirical line method can be used to calibrate UAS multispectral sensors, assuming the size of the calibration targets is sufficiently large (here, 9 × 9 pixels). In this method, DNs acquired from the red and NIR bands were converted into percent reflectance using various objects located within the field. For the red band, it was observed that crop DN values were much lower than those of the five percent albedo target, resulting in artificially negative reflectance values. To get around this, a new low-end reflectance point within the red band was established within nearby tree shadows at two percent [66]. Similar problems were encountered for the NIR band, where crop DNs were higher than the 45 percent albedo target. Therefore, a new high-end reflectance point was established using the GCP plywood material, measured at 79 percent. Quality control on this approach was performed by comparing the predicted red/NIR reflectance values with ground reflectance data collected at the calibration tiles. In this comparison, reflectance values agreed well with independent ground-truth measurements, with a bias (bias = predicted − observed) of 0.5 percent and a root mean squared error of 2.5 percent. This accuracy is similar, if not lower, than similar analyses conducted by [49,67].
Appendix B. Estimation of Landsat Tr
In this study, Tr was estimated at each ith pixel from an IOP date using the single-channel method [68]. The main equation used to estimate Tr is as follows:
With
where Lsensor,i is the at-sensor radiance (W m−2 sr−1 μm−1), Tsensor,i is the at-sensor brightness temperature (K), and bγ is a constant (1324). Lsensor,i (used in Equations (A3) and (A4)) is found by the following:
where ML and AL are constants (3.342 × 10⁻⁴ and 0.1, respectively) provided in the Landsat 8 metadata, and Qcal,i are the digital number (DN) values extracted from the level 1 product. Tsensor,i, or TOA brightness temperature, is found as follows:
where K1 and K2 are constants (774.8853 and 1321.0789, respectively) from the Landsat 8 metadata, and Lsensor is from Equation (A5). εi (Equation (A2)) is the land surface emissivity, which was calculated according to Equation (25) from [69] the following:
where NDVI [70] is defined as follows:
where i,NIR and i,Red are the surface reflectance values from the near-infrared and red bands, respectively, using the LEDAPS; ai and bi are the linear coefficients at each ith pixel, εv,i and εs,i are the vegetation and soil emissivity values, Pv,i is the vegetation fraction, and Ci is the surface roughness. εv,i and εs,i are defined as 0.9863 and 0.9668 by [69] using a MODIS UCSB (University of California, Santa Barbara, CA, USA) emissivity library. Pv,i is defined as the following:
NDVImin is calculated as a field average of NDVI pixels collected from a cloud-free Landsat scene collected around cotton squaring, where soils are the dominant component in the scene (15 May 2017). NDVImax is calculated as a field average of NDVI pixels collected from a different cloud-free Landsat scene collected around high vegetative growth (2 July 2017).
Ci is calculated as [69] follows:
where F′ is a geometrical factor usually equal to 0.55 [71]. The atmospheric functions (i.e., Ψ1, Ψ2, Ψ3, A1) are found by solving the matrix
where the cij coefficients are given as [71] follows:
where W refers to the total vapor water content (in g cm−2) estimated using local measurements of near-surface air humidity and density (ref. Equations (14) and (15) from [72]. Once w is known, Equations (A11) and (A12) are used to find Ψ1, Ψ2, and Ψ3 using matrix algebra.
δ (Equation (A13)) uses Tsensor,i (Equation (A6)), and bγ (Equation (A4)) as follows:
where γ (Equation (A4)), εi (Equation (A7)), Ψ1, Ψ2, Ψ3 (Equations (A11) and (A12)), Lsensor,i (Equation (A5)), and δ (Equation (A13)) are used to find Tr at each ith pixel (Equation (A3)).
Appendix C. Box–Cox Averaging
This section describes the Box–Cox transformation approach used in this study. The assumption of the Box–Cox method is that the variable(s) of interest (i.e., fc, LAI, Tr) are distributed in a non-normal manner. The extent to which these variables behave in a non-normal fashion will depend on many variables, such as growth stage, soil moisture, etc. [47]. The purpose of this approach, therefore, is to achieve data normality so that aggregation is less likely to be affected by subpixel heterogeneity.
The Box–Cox transformation aims to find an “optimal” power value (or λ) with which to transform the data (in this case, UAS native pixel resolutions) [73]. The transformation of the variables ( has the following form, given the original y dataset:
λ or the optimal power is found using the Maximum Likelihood or log-likelihood method. This is first expressed mathematically as follows (μ = Xβ):
Equation (A15) is then transformed into a probability distribution function (or pdf) by introducing the Jacobian ():
Which then results in the log likelihood function:
Optimal β, σ2, and λ (the latter of which is of interest) values are found by maximizing the log likelihood equation or A6. The λ has the largest log-likelihood value across a range of λ values (usually −5 to 5) is considered the transformation power necessary for the dataset. Beyond this point, it is worth pointing the reader to the full computation for Box–Cox elsewhere [74], as the mathematical details are too cumbersome for this research article.
Once λ was found, the UAS variables were transformed using this value. Next, aggregation was performed on the transformed dataset. Finally, these values were backtransformed to retrieve the values in their original units. The procedure described here was performed using several built-in functions and custom functions developed within the R programming language, including powerTransform() for the Box–Cox transformation [75] and raster() for image aggregation [72].
Appendix D. Eddy Covariance Towers
Appendix D.1. Tower Locations, Processing, and Results
Ground fluxes were quantified by installing one eddy covariance flux tower in each ECa zone (Figure 1). More information on the creation of the zones can be found in [76]. The ECa values immediately around the high ECa and low ECa flux towers are 88 and 52 mS m−1, respectively, resulting in clay content values of 466 and 296 g kg−1, a difference of 170 g kg−1 or 17 percent [23]. All equipment installed on the eddy towers was the same at both locations, and sensor details are given in Table A1. High-frequency data includes a three-dimensional sonic anemometer to measure 3D wind velocity components and an infrared gas analyzer to measure water concentrations. LE (in W m−2) from the eddy flux towers is calculated over a given sampling interval using the following equation:
where ρ is the density of air (kg m−3), and ▁(w′q′) is the covariance between vertical wind speed (w, m s−1) and the mass fraction of vapor flux (c, kg water kg−1 air). Sensible heat (H, W m−2) calculates the covariance between w and sonic temperature (T), the latter of which is a proxy for Ta (in Kelvin or K):
where Cp is the volumetric heat capacity of air (J m−3 K−1). Note from Table A1 that the heights of the net radiometer and gas analyzer/anemometer shifted on 30 June 2017, because the latter sensors at the high ECa zone were interfering with the irrigation system. The direction of the anemometer at both ECa sites was 160 degrees from true North, which reflects the prevailing wind direction based on previous weather station data. Soil moisture values were calculated from a custom calibration developed within each ECa zone. Surface G flux was calculated by correcting the subsurface heat flux for storage in the soil layer above the plates using nearby temperature and moisture sensors [77].

Table A1.
Measurands from the eddy covariance systems, along with their associated manufacturers.
Table A1.
Measurands from the eddy covariance systems, along with their associated manufacturers.
| Observed Variable | Height/Depth of Measurand | Logging Interval | Instrument |
|---|---|---|---|
| Height (m) | |||
| Wind speed and direction | High ECa: 2.84 (before 6/30); 2.77 (after 7/1) Low ECa 2.77 | 20 Hz | CSAT-3; Campbell Scientific, Logan, UT, USA |
| Water vapor concentration | LI-7500; LI-COR, Lincoln, NE, USA | ||
| Net radiation | High ECa: 2.52 (before 6/30); 2.37 (after 7/1) Low ECa: 2.35 | 15 min | NR01, Hukseflux, The Netherlands |
| Air temperature and relative humidity | 2.26 | HC2S3, Campbell Scientific | |
| Depth (cm) | |||
| Soil temperature | 2, 6 | 105E; Campbell Scientific | |
| Soil heat flux | 8 | HFT3-L; Campbell Scientific | |
| Soil moisture | 4, 5 | GS1, METER Group Inc., Pullman, WA, USA |
High-frequency raw data collected by the eddy covariance towers were then post-processed within eddyPro software version 6.2.1 (LI-COR). Processing was performed using eddyPro basic settings to quality check raw data, remove potential outliers, and apply corrections [17]. After eddyPro processing, turbulent fluxes were corrected by an additional 10 percent, based on recent findings of underestimates in vertical velocity using a non-orthogonal CSAT-3 anemometer, such as the case here [78,79]. The average energy balance closure for each tower before and after correction is shown in Table A2. The average closure across all dates and towers after the correction methods above was 0.90. Across all dates and towers, energy closure after correction was above 80 percent, and this falls in line with closures reported from previous studies [49,80].

Table A2.
Closure ratio (i.e., before and after applying corrections (i.e., LE ×1.1, H × 1.1) to EddyPro fluxes. July 18 fluxes at the high ECa site are omitted here, as the anemometer within the high ECa zone was “looking at” a poorly vegetated part of the field.
Table A2.
Closure ratio (i.e., before and after applying corrections (i.e., LE ×1.1, H × 1.1) to EddyPro fluxes. July 18 fluxes at the high ECa site are omitted here, as the anemometer within the high ECa zone was “looking at” a poorly vegetated part of the field.
| Date | Time | Associated Platform | Closure Ratio—Unclosed | Closure Ratio—Closed with 1.1 | ||
|---|---|---|---|---|---|---|
| High ECa | Low ECa | High ECa | Low ECa | |||
| 16 June 2017 | 11:57 | SAT | 0.91 | 1.00 | 1.00 | 1.10 |
| 16 June 2017 | 13:00–13:15 | UAS | 0.86 | 0.85 | 0.94 | 0.93 |
| 16 June 2017 | 13:21–13:47 | OAS | 0.89 | 0.93 | 0.98 | 1.02 |
| 16 June 2017 | 13:58–14:10 | OAS | 0.91 | 0.86 | 1.00 | 0.95 |
| 28 July 2017 | 14:46–15:00 | UAS | 0.95 | 1.02 | 1.05 | 1.12 |
| 28 July 2017 | 14:45–15:09 | OAS | 0.90 | 0.96 | 0.98 | 1.06 |
| 28 July 2017 | 15:17–15:31 | OAS | 0.93 | 1.15 | 1.02 | 1.26 |
Appendix D.2. Footprints
The footprint of the fluxes measured by the eddy covariance tower describes the source area of the fluxes, depending on parameters such as wind direction, wind speed, and atmospheric stability [81]. In order to effectively compare the UAS and eddy tower fluxes, footprints need to be generated in two-dimensional coordinate space. In this study, footprints were calculated using the footprint models by [82,83]. UAS-predicted fluxes were averaged within each footprint using the source-weighted scheme proposed by [84]:
where i is a given pixel with location xi and yi, given the flux tower height zm. Note that each ith pixel has an associated weight (i.e., f(xi,yi,zm)) based on its corresponding location to the anemometer.
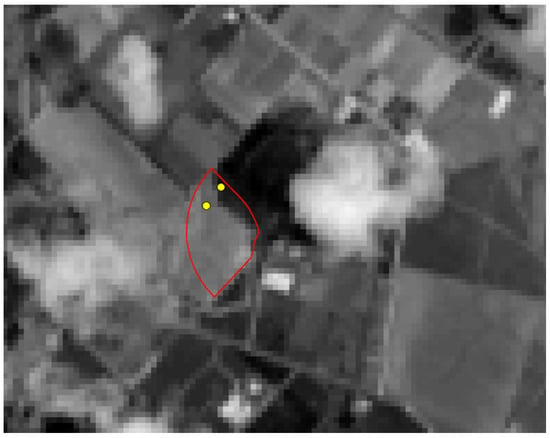
Figure A1.
Landsat 8 NIR image (30 m pixels) over the study area (red outline) on 16 June 2017. The two yellow circles refer to the eddy covariance flux towers shown in Figure 1. Note that the upper flux tower is located within cloud shadows from a scattered cloud to the east.
Figure A1.
Landsat 8 NIR image (30 m pixels) over the study area (red outline) on 16 June 2017. The two yellow circles refer to the eddy covariance flux towers shown in Figure 1. Note that the upper flux tower is located within cloud shadows from a scattered cloud to the east.
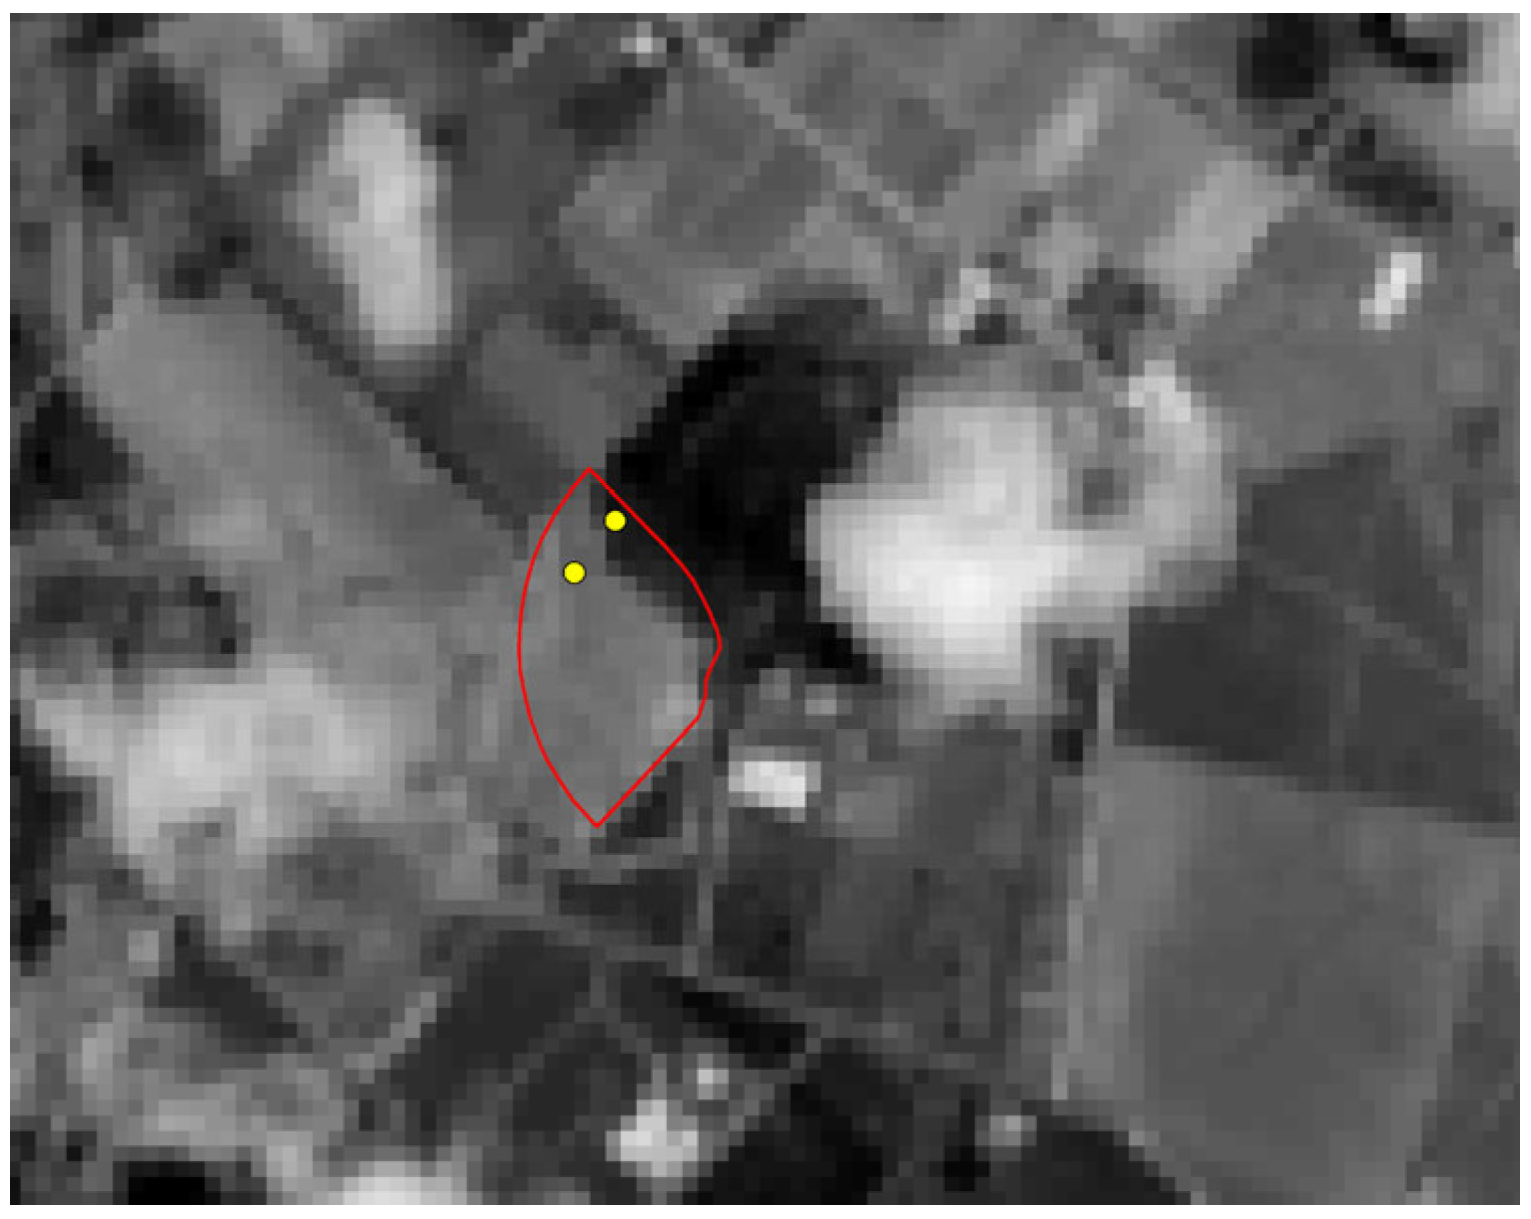
References
- Courault, D.; Seguin, B.; Olioso, A. Review on Estimation of Evapotranspiration from Remote Sensing Data: From Empirical to Numerical Modeling Approaches. Irrig. Drain. Syst. 2005, 19, 223–249. [Google Scholar] [CrossRef]
- Hunt, E.R.; Daughtry, C.S.T. What Good Are Unmanned Aircraft Systems for Agricultural Remote Sensing and Precision Agriculture? Int. J. Remote Sens. 2018, 39, 5345–5376. [Google Scholar] [CrossRef]
- Anderson, M.C.; Yang, Y.; Xue, J.; Knipper, K.R.; Yang, Y.; Gao, F.; Hain, C.R.; Kustas, W.P.; Cawse-Nicholson, K.; Hulley, G.; et al. Interoperability of ECOSTRESS and Landsat for Mapping Evapotranspiration Time Series at Sub-Field Scales. Remote Sens. Environ. 2021, 252, 112189. [Google Scholar] [CrossRef]
- Matese, A.; Toscano, P.; Di Gennaro, S.; Genesio, L.; Vaccari, F.; Primicerio, J.; Belli, C.; Zaldei, A.; Bianconi, R.; Gioli, B. Intercomparison of UAV, Aircraft and Satellite Remote Sensing Platforms for Precision Viticulture. Remote Sens. 2015, 7, 2971–2990. [Google Scholar] [CrossRef]
- Hoffmann, H.; Nieto, H.; Jensen, R.; Guzinski, R.; Zarco-Tejada, P.; Friborg, T. Estimating Evaporation with Thermal UAV Data and Two-Source Energy Balance Models. Hydrol. Earth Syst. Sci. 2016, 20, 697–713. [Google Scholar] [CrossRef]
- Brenner, C.; Zeeman, M.; Bernhardt, M.; Schulz, K. Estimation of Evapotranspiration of Temperate Grassland Based on High-Resolution Thermal and Visible Range Imagery from Unmanned Aerial Systems. Int. J. Remote Sens. 2018, 39, 5141–5174. [Google Scholar] [CrossRef]
- Jones, H.; Sirault, X. Scaling of Thermal Images at Different Spatial Resolution: The Mixed Pixel Problem. Agronomy 2014, 4, 380–396. [Google Scholar] [CrossRef]
- Smith, R.J.; Raine, S.R.; McCarthy, A.C.; Hancock, N.H. Managing Spatial and Temporal Variability in Irrigated Agriculture Through Adaptive Control. Aust. J. Multi-Discip. Eng. 2009, 7, 79–90. [Google Scholar] [CrossRef][Green Version]
- Raupach, M.R.; Finnigan, J.J. Scale Issues in Boundary-layer Meteorology: Surface Energy Balances in Heterogeneous Terrain. Hydrol. Process. 1995, 9, 589–612. [Google Scholar] [CrossRef]
- Kustas, W.P.; Norman, J.M.; Anderson, M.C.; French, A.N. Estimating Subpixel Surface Temperatures and Energy Fluxes from the Vegetation Index–Radiometric Temperature Relationship. Remote Sens. Environ. 2003, 85, 429–440. [Google Scholar] [CrossRef]
- Kustas, W. Effects of Remote Sensing Pixel Resolution on Modeled Energy Flux Variability of Croplands in Iowa. Remote Sens. Environ. 2004, 92, 535–547. [Google Scholar] [CrossRef]
- Li, F.; Kustas, W.P.; Prueger, J.H.; Neale, C.M.U.; Jackson, T.J. Utility of Remote Sensing–Based Two-Source Energy Balance Model Under Low- and High-Vegetation Cover Conditions. J. Hydrometeorol. 2005, 6, 878–891. [Google Scholar] [CrossRef]
- Woodcock, C.E.; Strahler, A.H. The Factor of Scale in Remote Sensing. Remote Sens. Environ. 1987, 21, 311–332. [Google Scholar] [CrossRef]
- Hassan-Esfahani, L.; Ebtehaj, A.; Torres-Rua, A.; McKee, M. Spatial Scale Gap Filling Using an Unmanned Aerial System: A Statistical Downscaling Method for Applications in Precision Agriculture. Sensors 2017, 17, 2106. [Google Scholar] [CrossRef]
- Su, Z.; Pelgrum, H.; Menenti, M. Aggregation Effects of Surface Heterogeneity in Land Surface Processes. Hydrol. Earth Syst. Sci. 1999, 3, 549–563. [Google Scholar] [CrossRef]
- McCabe, M.F.; Wood, E.F. Scale Influences on the Remote Estimation of Evapotranspiration Using Multiple Satellite Sensors. Remote Sens. Environ. 2006, 105, 271–285. [Google Scholar] [CrossRef]
- Sharma, V.; Kilic, A.; Irmak, S. Impact of Scale/Resolution on Evapotranspiration from Landsat and MODIS Images. Water Resour. Res. 2016, 52, 1800–1819. [Google Scholar] [CrossRef]
- Hong, S.; Hendrickx, J.M.H.; Borchers, B. Up-Scaling of SEBAL Derived Evapotranspiration Maps from Landsat (30 m) to MODIS (250 m) Scale. J. Hydrol. 2009, 370, 122–138. [Google Scholar] [CrossRef]
- Bahir, M.; Boulet, G.; Olioso, A.; Rivalland, V.; Gallego-Elvira, B.; Mira, M.; Rodriguez, J.-C.; Jarlan, L.; Merlin, O. Evaluation and Aggregation Properties of Thermal Infra-Red-Based Evapotranspiration Algorithms from 100 m to the Km Scale over a Semi-Arid Irrigated Agricultural Area. Remote Sens. 2017, 9, 1178. [Google Scholar] [CrossRef]
- Liou, Y.-A.; Kar, S. Evapotranspiration Estimation with Remote Sensing and Various Surface Energy Balance Algorithms—A Review. Energies 2014, 7, 2821–2849. [Google Scholar] [CrossRef]
- Nieto, H.; Kustas, W.P.; Torres-Rúa, A.; Alfieri, J.G.; Gao, F.; Anderson, M.C.; White, W.A.; Song, L.; Alsina, M.D.M.; Prueger, J.H.; et al. Evaluation of TSEB Turbulent Fluxes Using Different Methods for the Retrieval of Soil and Canopy Component Temperatures from UAV Thermal and Multispectral Imagery. Irrig. Sci. 2019, 37, 389–406. [Google Scholar] [CrossRef]
- Manfreda, S.; McCabe, M.F.; Miller, P.E.; Lucas, R.; Pajuelo Madrigal, V.; Mallinis, G.; Ben Dor, E.; Helman, D.; Estes, L.; Ciraolo, G.; et al. On the Use of Unmanned Aerial Systems for Environmental Monitoring. Remote Sens. 2018, 10, 641. [Google Scholar] [CrossRef]
- Stanislav, S.M. A Field-Scale Assessment of Soil-Specific Seeding Rates to Optimize Yield Factors and Water Use in Cotton. Master’s Thesis, Texas A&M University, College Station, TX, USA, 2011. [Google Scholar]
- Jurena, M.R. Soil Survey of Burleson County, Texas. Available online: https://texashistory.unt.edu/ark:/67531/metapth278889/ (accessed on 28 July 2025).
- Roy, D.P.; Wulder, M.A.; Loveland, T.R.; Woodcock, C.E.; Allen, R.G.; Anderson, M.C.; Helder, D.; Irons, J.R.; Johnson, D.M.; Kennedy, R.; et al. Landsat-8: Science and Product Vision for Terrestrial Global Change Research. Remote Sens. Environ. 2014, 145, 154–172. [Google Scholar] [CrossRef]
- Duan, T.; Chapman, S.C.; Guo, Y.; Zheng, B. Dynamic Monitoring of NDVI in Wheat Agronomy and Breeding Trials Using an Unmanned Aerial Vehicle. Field Crops Res. 2017, 210, 71–80. [Google Scholar] [CrossRef]
- Sagan, V.; Maimaitijiang, M.; Sidike, P.; Eblimit, K.; Peterson, K.; Hartling, S.; Esposito, F.; Khanal, K.; Newcomb, M.; Pauli, D.; et al. UAV-Based High Resolution Thermal Imaging for Vegetation Monitoring, and Plant Phenotyping Using ICI 8640 P, FLIR Vue Pro R 640, and thermoMap Cameras. Remote Sens. 2019, 11, 330. [Google Scholar] [CrossRef]
- García-Tejero, I.; Ortega-Arévalo, C.; Iglesias-Contreras, M.; Moreno, J.; Souza, L.; Tavira, S.; Durán-Zuazo, V. Assessing the Crop-Water Status in Almond (Prunus dulcis Mill.) Trees via Thermal Imaging Camera Connected to Smartphone. Sensors 2018, 18, 1050. [Google Scholar] [CrossRef] [PubMed]
- Wu, M.; Yang, C.; Song, X.; Hoffmann, W.C.; Huang, W.; Niu, Z.; Wang, C.; Li, W.; Yu, B. Monitoring Cotton Root Rot by Synthetic Sentinel-2 NDVI Time Series Using Improved Spatial and Temporal Data Fusion. Sci. Rep. 2018, 8, 2016. [Google Scholar] [CrossRef]
- Knight, E.; Kvaran, G. Landsat-8 Operational Land Imager Design, Characterization and Performance. Remote Sens. 2014, 6, 10286–10305. [Google Scholar] [CrossRef]
- Wang, Y.; Ientilucci, E. A Practical Approach to Landsat 8 TIRS Stray Light Correction Using Multi-Sensor Measurements. Remote Sens. 2018, 10, 589. [Google Scholar] [CrossRef]
- Smith, G.M.; Milton, E.J. The Use of the Empirical Line Method to Calibrate Remotely Sensed Data to Reflectance. Int. J. Remote Sens. 1999, 20, 2653–2662. [Google Scholar] [CrossRef]
- Zhang, J.; Yang, C.; Zhao, B.; Song, H.; Clint Hoffmann, W.; Shi, Y.; Zhang, D.; Zhang, G. Crop Classification and LAI Estimation Using Original and Resolution-Reduced Images from Two Consumer-Grade Cameras. Remote Sens. 2017, 9, 1054. [Google Scholar] [CrossRef]
- Jiménez-Muñoz, J.C.; Sobrino, J.A.; Gillespie, A.; Sabol, D.; Gustafson, W.T. Improved Land Surface Emissivities over Agricultural Areas Using ASTER NDVI. Remote Sens. Environ. 2006, 103, 474–487. [Google Scholar] [CrossRef]
- Maes, W.H.; Steppe, K. Estimating Evapotranspiration and Drought Stress with Ground-Based Thermal Remote Sensing in Agriculture: A Review. J. Exp. Bot. 2012, 63, 4671–4712. [Google Scholar] [CrossRef]
- Norman, J.M.; Kustas, W.P.; Humes, K.S. Source Approach for Estimating Soil and Vegetation Energy Fluxes in Observations of Directional Radiometric Surface Temperature. Agric. For. Meteorol. 1995, 77, 263–293. [Google Scholar] [CrossRef]
- Ramírez-Cuesta, J.M.; Allen, R.G.; Zarco-Tejada, P.J.; Kilic, A.; Santos, C.; Lorite, I.J. Impact of the Spatial Resolution on the Energy Balance Components on an Open-Canopy Olive Orchard. Int. J. Appl. Earth Obs. Geoinf. 2019, 74, 88–102. [Google Scholar] [CrossRef]
- Kustas, W.; Norman, J.M. Evaluating the Effects of Subpixel Heterogeneity on Pixel Average Fluxes. Remote Sens. Environ. 2000, 74, 327–342. [Google Scholar] [CrossRef]
- Priestley, C.H.B.; Taylor, R.J. On the Assessment of Surface Heat Flux and Evaporation Using Large-Scale Parameters. Mon. Wea. Rev. 1972, 100, 81–92. [Google Scholar] [CrossRef]
- Campbell, G.S.; Norman, J.M. An Introduction to Environmental Biophysics; Springer: New York, NY, USA, 1998; ISBN 978-0-387-94937-6. [Google Scholar]
- Kustas, W.P.; Norman, J.M. Evaluation of Soil and Vegetation Heat Flux Predictions Using a Simple Two-Source Model with Radiometric Temperatures for Partial Canopy Cover. Agric. For. Meteorol. 1999, 94, 13–29. [Google Scholar] [CrossRef]
- Carlson, T.N.; Ripley, D.A. On the Relation Between NDVI, Fractional Vegetation Cover, and Leaf Area Index. Remote Sens. Environ. 1997, 62, 241–252. [Google Scholar] [CrossRef]
- Wang, W.-M.; Li, Z.-L.; Su, H.-B. Comparison of Leaf Angle Distribution Functions: Effects on Extinction Coefficient and Fraction of Sunlit Foliage. Agric. For. Meteorol. 2007, 143, 106–122. [Google Scholar] [CrossRef]
- Kustas, W.P.; Daughtry, C.S.T. Estimation of the Soil Heat Flux/Net Radiation Ratio from Spectral Data. Agric. For. Meteorol. 1990, 49, 205–223. [Google Scholar] [CrossRef]
- Cho, K.; Kim, Y.; Kim, Y. Disaggregation of Landsat-8 Thermal Data Using Guided SWIR Imagery on the Scene of a Wildfire. Remote Sens. 2018, 10, 105. [Google Scholar] [CrossRef]
- Kalma, J.D.; McVicar, T.R.; McCabe, M.F. Estimating Land Surface Evaporation: A Review of Methods Using Remotely Sensed Surface Temperature Data. Surv. Geophys. 2008, 29, 421–469. [Google Scholar] [CrossRef]
- Susan Moran, M.; Humes, K.S.; Pinter, P.J. The Scaling Characteristics of Remotely-Sensed Variables for Sparsely-Vegetated Heterogeneous Landscapes. J. Hydrol. 1997, 190, 337–362. [Google Scholar] [CrossRef]
- Brenner, C.; Thiem, C.E.; Wizemann, H.-D.; Bernhardt, M.; Schulz, K. Estimating Spatially Distributed Turbulent Heat Fluxes from High-Resolution Thermal Imagery Acquired with a UAV System. Int. J. Remote Sens. 2017, 38, 3003–3026. [Google Scholar] [CrossRef]
- Xia, T.; Kustas, W.P.; Anderson, M.C.; Alfieri, J.G.; Gao, F.; McKee, L.; Prueger, J.H.; Geli, H.M.E.; Neale, C.M.U.; Sanchez, L.; et al. Mapping Evapotranspiration with High-Resolution Aircraft Imagery over Vineyards Using One- and Two-Source Modeling Schemes. Hydrol. Earth Syst. Sci. 2016, 20, 1523–1545. [Google Scholar] [CrossRef]
- Nassar, A.; Torres-Rua, A.; Kustas, W.; Nieto, H.; McKee, M.; Hipps, L.; Stevens, D.; Alfieri, J.; Prueger, J.; Alsina, M.M.; et al. Influence of Model Grid Size on the Estimation of Surface Fluxes Using the Two Source Energy Balance Model and sUAS Imagery in Vineyards. Remote Sens. 2020, 12, 342. [Google Scholar] [CrossRef] [PubMed]
- Zhan, X.; Kustas, W.P.; Humes, K.S. An Intercomparison Study on Models of Sensible Heat Flux over Partial Canopy Surfaces with Remotely Sensed Surface Temperature. Remote Sens. Environ. 1996, 58, 242–256. [Google Scholar] [CrossRef]
- Timmermans, W.J.; Kustas, W.P.; Anderson, M.C.; French, A.N. An Intercomparison of the Surface Energy Balance Algorithm for Land (SEBAL) and the Two-Source Energy Balance (TSEB) Modeling Schemes. Remote Sens. Environ. 2007, 108, 369–384. [Google Scholar] [CrossRef]
- Cammalleri, C.; Anderson, M.C.; Ciraolo, G.; D’Urso, G.; Kustas, W.P.; La Loggia, G.; Minacapilli, M. The Impact of In-Canopy Wind Profile Formulations on Heat Flux Estimation in an Open Orchard Using the Remote Sensing-Based Two-Source Model. Hydrol. Earth Syst. Sci. 2010, 14, 2643–2659. [Google Scholar] [CrossRef]
- Li, Y.; Kustas, W.P.; Huang, C.; Kool, D.; Haghighi, E. Evaluation of Soil Resistance Formulations for Estimates of Sensible Heat Flux in a Desert Vineyard. Agric. For. Meteorol. 2018, 260–261, 255–261. [Google Scholar] [CrossRef]
- Brunsell, N.A.; Anderson, M.C. Characterizing the Multi–Scale Spatial Structure of Remotely Sensed Evapotranspiration with Information Theory. Biogeosciences 2011, 8, 2269–2280. [Google Scholar] [CrossRef]
- Bresnahan, P.A.; Miller, D.R. Choice of Data Scale: Predicting Resolution Error in a Regional Evapotranspiration Model. Agric. For. Meteorol. 1997, 84, 97–113. [Google Scholar] [CrossRef]
- Norman, J.M.; Anderson, M.C.; Kustas, W.P.; French, A.N.; Mecikalski, J.; Torn, R.; Diak, G.R.; Schmugge, T.J.; Tanner, B.C.W. Remote Sensing of Surface Energy Fluxes at 101 -m Pixel Resolutions. Water Resour. Res. 2003, 39, 2002WR001775. [Google Scholar] [CrossRef]
- Aboutalebi, M.; Torres-Rua, A.F.; Kustas, W.P.; Nieto, H.; Coopmans, C.; McKee, M. Assessment of Different Methods for Shadow Detection in High-Resolution Optical Imagery and Evaluation of Shadow Impact on Calculation of NDVI, and Evapotranspiration. Irrig. Sci. 2019, 37, 407–429. [Google Scholar] [CrossRef]
- Maes, W.; Huete, A.; Steppe, K. Optimizing the Processing of UAV-Based Thermal Imagery. Remote Sens. 2017, 9, 476. [Google Scholar] [CrossRef]
- Torres-Rua, A. Vicarious Calibration of sUAS Microbolometer Temperature Imagery for Estimation of Radiometric Land Surface Temperature. Sensors 2017, 17, 1499. [Google Scholar] [CrossRef]
- Ershadi, A.; McCabe, M.F.; Evans, J.P.; Walker, J.P. Effects of Spatial Aggregation on the Multi-Scale Estimation of Evapotranspiration. Remote Sens. Environ. 2013, 131, 51–62. [Google Scholar] [CrossRef]
- Ribeiro-Gomes, K.; Hernández-López, D.; Ortega, J.; Ballesteros, R.; Poblete, T.; Moreno, M. Uncooled Thermal Camera Calibration and Optimization of the Photogrammetry Process for UAV Applications in Agriculture. Sensors 2017, 17, 2173. [Google Scholar] [CrossRef] [PubMed]
- Guzinski, R.; Nieto, H. Evaluating the Feasibility of Using Sentinel-2 and Sentinel-3 Satellites for High-Resolution Evapotranspiration Estimations. Remote Sens. Environ. 2019, 221, 157–172. [Google Scholar] [CrossRef]
- Westoby, M.J.; Brasington, J.; Glasser, N.F.; Hambrey, M.J.; Reynolds, J.M. ‘Structure-from-Motion’ Photogrammetry: A Low-Cost, Effective Tool for Geoscience Applications. Geomorphology 2012, 179, 300–314. [Google Scholar] [CrossRef]
- Iqbal, F.; Lucieer, A.; Barry, K. Simplified Radiometric Calibration for UAS-Mounted Multispectral Sensor. Eur. J. Remote Sens. 2018, 51, 301–313. [Google Scholar] [CrossRef]
- Pritsolas, J.; Pearson, R.; Connor, J.; Kyveryga, P. Challenges and Successes When Generating In-Season Multi-Temporal Calibrated Aerial Imagery. In Proceedings of the 13th International Conference on Precision Agriculture, St. Louis, MO, USA, 31 July–3 August 2016. [Google Scholar]
- Berni, J.; Zarco-Tejada, P.J.; Suarez, L.; Fereres, E. Thermal and Narrowband Multispectral Remote Sensing for Vegetation Monitoring from an Unmanned Aerial Vehicle. IEEE Trans. Geosci. Remote Sens. 2009, 47, 722–738. [Google Scholar] [CrossRef]
- Jimenez-Munoz, J.C.; Sobrino, J.A.; Skokovic, D.; Mattar, C.; Cristobal, J. Land Surface Temperature Retrieval Methods from Landsat-8 Thermal Infrared Sensor Data. IEEE Geosci. Remote Sens. Lett. 2014, 11, 1840–1843. [Google Scholar] [CrossRef]
- Yu, X.; Guo, X.; Wu, Z. Land Surface Temperature Retrieval from Landsat 8 TIRS—Comparison Between Radiative Transfer Equation-Based Method, Split Window Algorithm and Single Channel Method. Remote Sens. 2014, 6, 9829–9852. [Google Scholar] [CrossRef]
- Rouse, J.W.; Haas, R.H.; Schell, J.A.; Deering, D.W. Monitoring Vegetation Systems in the Great Plains with ERTS; NASA: Washington, DC, USA, 1974.
- Wang, F.; Qin, Z.; Song, C.; Tu, L.; Karnieli, A.; Zhao, S. An Improved Mono-Window Algorithm for Land Surface Temperature Retrieval from Landsat 8 Thermal Infrared Sensor Data. Remote Sens. 2015, 7, 4268–4289. [Google Scholar] [CrossRef]
- Hijmans, R. Raster: Geographic Data Analysis and Modeling. 2025. Available online: https://cran.r-project.org/web/packages/raster/raster.pdf (accessed on 28 October 2025).
- Box, G.E.P.; Cox, D.R. An Analysis of Transformations. J. R. Stat. Soc. Ser. B Stat. Methodol. 1964, 26, 211–243. [Google Scholar] [CrossRef]
- Hyde, S. Likelihood Based Inference on the Box-Cox Family of Transformations: SAS and Matlab Programs; Montana State University: Bozeman, MT, USA, 1999. [Google Scholar]
- Fox, J.; Weisberg, S. An R Companion to Applied Regression; Sage Publications: Los Angeles, CA, USA, 2018. [Google Scholar]
- Rouze, G.; Neely, H.; Morgan, C.; Kustas, W.; Wiethorn, M. Evaluating Unoccupied Aerial Systems (UAS) Imagery as an Alternative Tool Towards Cotton-Based Management Zones. Precis. Agric. 2021, 22, 1861–1889. [Google Scholar] [CrossRef]
- Evett, S.R.; Schwartz, R.C.; Casanova, J.J.; Heng, L.K. Soil Water Sensing for Water Balance, ET and WUE. Agric. Water Manag. 2012, 104, 1–9. [Google Scholar] [CrossRef]
- Frank, J.M.; Massman, W.J.; Ewers, B.E. Underestimates of Sensible Heat Flux Due to Vertical Velocity Measurement Errors in Non-Orthogonal Sonic Anemometers. Agric. For. Meteorol. 2013, 171–172, 72–81. [Google Scholar] [CrossRef]
- Kochendorfer, J.; Meyers, T.P.; Frank, J.; Massman, W.J.; Heuer, M.W. How Well Can We Measure the Vertical Wind Speed? Implications for Fluxes of Energy and Mass. Bound.-Layer Meteorol. 2012, 145, 383–398. [Google Scholar] [CrossRef]
- Chávez, J.; Neale, C.M.U.; Hipps, L.E.; Prueger, J.H.; Kustas, W.P. Comparing Aircraft-Based Remotely Sensed Energy Balance Fluxes with Eddy Covariance Tower Data Using Heat Flux Source Area Functions. J. Hydrometeorol. 2005, 6, 923–940. [Google Scholar] [CrossRef]
- Burba, G.G.; Anderson, D. A Brief Practical Guide to Eddy Covariance Flux Measurements: Principles and Workflow Examples for Scientific and Industrial Applications; LI-COR Biosciences: Lincoln, NE, USA, 2010. [Google Scholar]
- Detto, M.; Montaldo, N.; Albertson, J.D.; Mancini, M.; Katul, G. Soil Moisture and Vegetation Controls on Evapotranspiration in a Heterogeneous Mediterranean Ecosystem on Sardinia, Italy. Water Resour. Res. 2006, 42, 2005WR004693. [Google Scholar] [CrossRef]
- Hsieh, C.-I.; Katul, G.; Chi, T. An Approximate Analytical Model for Footprint Estimation of Scalar Fluxes in Thermally Stratified Atmospheric Flows. Adv. Water Resour. 2000, 23, 765–772. [Google Scholar] [CrossRef]
- Li, F.; Kustas, W.P.; Anderson, M.C.; Prueger, J.H.; Scott, R.L. Effect of Remote Sensing Spatial Resolution on Interpreting Tower-Based Flux Observations. Remote Sens. Environ. 2008, 112, 337–349. [Google Scholar] [CrossRef]
Disclaimer/Publisher’s Note: The statements, opinions and data contained in all publications are solely those of the individual author(s) and contributor(s) and not of MDPI and/or the editor(s). MDPI and/or the editor(s) disclaim responsibility for any injury to people or property resulting from any ideas, methods, instructions or products referred to in the content. |
© 2025 by the authors. Licensee MDPI, Basel, Switzerland. This article is an open access article distributed under the terms and conditions of the Creative Commons Attribution (CC BY) license (https://creativecommons.org/licenses/by/4.0/).

