Highlights
What are the main findings?
- A stark east–west dichotomy governs the regional lightning climatology; the eastern basin and plateau are characterized by high lightning density and nocturnal peaks, contrasting with the lower density and afternoon maxima of the western high-altitude areas.
- The relationship between lightning frequency and altitude is highly region-specific, exhibiting unique patterns that directly reflect the distinct topography of each of the four sub-regions studied.
- A “summer anomaly” is observed, defined as a temporal decoupling where the seasonal peak in lightning activity does not coincide with the peak in its thermodynamic driver (CAPE).
What is the implication of the main findings?
- The stark east–west divide implies that different large-scale atmospheric circulation patterns are the dominant controls, requiring distinct forecasting strategies for eastern and western regions.
- The highly customized, topographically-driven altitude patterns demonstrate that local terrain forcing is critical for convective initiation, highlighting the necessity of high-resolution models for accurate lightning prediction in these areas.
- The discovery of the “summer anomaly” reveals that thermodynamic indices alone are insufficient for seasonal prediction; models must also incorporate the evolving efficiency of cloud microphysical and electrification processes to capture lightning peaks accurately.
Abstract
Based on five years of data (2017–2021) from the China National Lightning Detection Network (CNLDN), this study compares and analyzes the temporal and spatial distribution characteristics of cloud-to-ground (CG) lightning activities in the Hengduan Mountain region and its surroundings. It explores the relationship between CG lightning occurrences and altitude, topography, and various meteorological elements. Our findings reveal a stark east–west divide: high lightning density in the Sichuan Basin and the central Yungui Plateau contrasts sharply with lower densities over the eastern Tibetan Plateau and Hengduan Mountains. This geographical dichotomy extends to the diurnal cycle, where positive cloud-to-ground (PCG) lightning activities are more prevalent in the western part of the study area, while significant nocturnal activity defines the eastern basin and plateau. The study also finds that the relationship between CG lightning activities in the four sub-regions and 2 m temperature, precipitation, convective available potential energy, and Bowen ratio (the ratio of sensible heat flux to latent heat flux) exhibits similarities. Furthermore, we show that the relationship between lightning frequency and altitude is highly region-specific, with each area displaying a unique signature reflecting its underlying topography: a normal distribution over the eastern Tibetan Plateau, a bimodal pattern in the Hengduan Mountains, a sharp low-altitude peak in the Sichuan Basin, and a complex trimodal structure on the Yungui Plateau. These distinct regional patterns highlight the intricate interplay between large-scale circulation, complex terrain, and local meteorology in modulating lightning activity.
1. Introduction
Lightning, a common manifestation of thunderstorms, serving as a valuable proxy for diagnosing deep convection and severe weather, is a significant natural hazard capable of causing substantial damage and posing threats to human safety and infrastructure. Among them, CG lightning is particularly impactful, as it directly affects public safety and economic assets. As the global economy rapidly expands and environmental concerns grow, the adverse effects of CG lightning strikes are intensifying each year. These events may trigger disruptions to power systems and widespread forest fires worldwide, further endangering lives and causing substantial economic losses [1,2]. To mitigate these risks, especially those associated with CG lightning, there is a critical need to enhance research efforts in understanding the dynamics of lightning activity. The study of modern lightning climatology is primarily built upon observations from two platforms: ground-based lightning location networks (LLNs) and satellite-based sensors [3]. LLNs, such as the CNLDN used in this study, employ numerous sensors to detect electromagnetic pulses from lightning discharges, typically in the very low-frequency to low-frequency (VLF/LF) band, providing continuous, high-resolution regional data [4]. In contrast, satellite instruments, like the Lightning Imaging Sensor (LIS), use optical sensors to provide near-global coverage for capturing large-scale lightning patterns [5]. Thus, while satellite sensors offer invaluable global-scale context, ground-based networks provide the high-resolution data necessary for detailed regional studies. With continuous advancements in lightning detection technology and a growing recognition of its correlation with meteorological conditions, researchers are increasingly focusing on global lightning patterns. Studies have explored potential thunderstorm charge structures that favor CG lightning [6,7]. In China, CG lightning shows significant interannual and seasonal variations [8]. Activity typically peaks in summer, with August being the most active month, then declines through autumn to a minimum in November before remaining low throughout the winter [9]. Winter months see heightened CG lightning activity along Japan’s coasts, causing notable damage to wind turbines [10]. Analyzing data from the Hellenic National Meteorological Service (HNMS) between 2008 and 2012, Greece exhibits peak lightning activity in autumn, particularly concentrated in the Pindus mountain range [11]. In Estonia and its adjacent seas, the monthly variability of CG lightning activity reveals July and August as the most dominant months, differing significantly between land and sea distributions [12]. Even Antarctica experiences a notable proportion of PCG flashes during late summer to winter, reaching close to 50% in 2017 [13]. To mitigate the impacts of lightning and enhance understanding, studying lightning characteristics under varying meteorological conditions across regions is crucial. Satellite data from TRMM/LIS has been used to analyze the relationship between lightning activity, aerosol optical depth (AOD), and climatic parameters in India, including Bowen ratio, and these studies have further revealed that the relationship between lightning activity and Bowen ratio over land contrasts with that observed over the adjacent Indian sea [14,15]. In Southern Asia, the surface latent heat flux, CAPE and the wind shear make important contributions to the distribution of lightning activity [16]. Beyond meteorological drivers, topography is widely recognized as a key modulator of lightning activity. Comparative studies in mountainous regions have revealed complex relationships. For instance, while terrain slope was found to be more influential than altitude in Southern Brazil [17], research in the Congo Basin highlighted the generally favorable conditions in mountainous areas [18]. Similarly, a study in Uganda found that approximately 80% of severe lightning occurrences were concentrated not at the highest elevations, but within a specific mid-altitude range of 800–1200 m [19]. These varied findings underscore that the impact of terrain is not uniform, making a systematic, comparative analysis across the diverse topographies of our study area essential for a more complete understanding of these interactions.
The Hengduan Mountains constitute China’s longest, widest, and most prominent north–south mountain range, situated southeast of the Tibetan Plateau, west of the Sichuan Basin, and northwest of the Yungui Plateau. The mountains run perpendicular to the southwest and southeast monsoons, with their windward slopes intercepting more water vapor. This results in reduced rainfall on the leeward slopes and lower precipitation in the central Hengduan Mountains, influenced by local circulations like the foehn effect [20]. The mechanism of the foehn effect varies across different regions, often favoring textbook latent heating and precipitation mechanisms [21]. Known as the “Third Pole,” the Tibetan Plateau averages over 4000 m in elevation. Lightning activity across the plateau has notably increased over the past two decades [22], primarily occurring from June to August [23]. Significant seasonal variations, convective intensity, and thundercloud structures differ noticeably among the eastern, central, and western regions of the plateau [24]. Influenced by the plateau’s conditions [25,26], there is a predominant peak of CG lightning in the late afternoon, similar to other parts of China, and a distinct midnight peak during the warm season over the Sichuan Basin in the eastern Hengduan Mountains [27]. The Yungui Plateau is renowned for its unique topography, decreasing gradually from west to southeast in slope. From 2016 to 2020, there was a clear spatial disparity in lightning activity, with higher density in the east and lower density in the west [28]. These regions near the Hengduan Mountains possess distinctive features, and previous research has established distinct relationships between lightning activity and various environmental factors here. In the north-east regions of the Himalayan range, over 80% of the annual lightning flash rate density occurs at an elevation below 500 m (terrain slope less than 2%) and then sharply falls off at a higher elevation (terrain slope) [29]. Meteorological parameters such as CAPE directly relate to thunderstorm updraft strength and are generally positively correlated with lightning flash rates in the Tibetan Plateau and Sichuan Basin regions [30,31]. Surface temperature and precipitation are also fundamental drivers of convective processes that lead to lightning. The Pearson linear correlation coefficients between the lightning frequency and precipitation and temperature have been found over 0.7 on the Yungui Plateau [28]. The Bowen ratio, representing the partitioning of surface sensible and latent heat fluxes, can influence boundary layer development and convective initiation, which has been used to modify the precipitation rate with the intention of investigating the influence of sensible heat fluxes on rainfall and lightning production over the Tibetan Plateau [32]. While previous studies have investigated lightning in the Tibetan Plateau, the Sichuan Basin, and the Yungui Plateau individually, often highlighting unique local characteristics, a systematic comparative analysis across these interconnected regions, particularly focusing on the Hengduan Mountains as a linking geographical entity, is still needed. Such a comparative approach is crucial for distinguishing between common, regional-scale drivers and unique local controls on lightning climatology. This study aims to address this need by providing a comparative analysis of lightning characteristics and their environmental drivers across these four distinct yet linked geographical areas.
What are the differences in the spatiotemporal distribution characteristics of lightning activity across the Tibetan Plateau, Hengduan Mountains, Sichuan Basin, and Yungui Plateau? How do lightning patterns in these regions relate to their respective topography and meteorological conditions, and do they influence each other? To address these questions, we analyzed CG lightning location data from the Hengduan Mountains and surrounding areas between 2017 and 2021. Our study examines the spatiotemporal dynamics of lightning and explores their correlation with meteorological factors and topographic elements. These findings contribute to enhancing the prediction of convective activities in the Hengduan Mountains and neighboring regions, while also serving as a foundational resource for lightning disaster preparedness and risk assessment in this area.
2. Data and Methods
2.1. Region of Interest
The region of interest in this paper is depicted in Figure 1 (95–110°E, 25–35°N), encompassing several distinctive areas in and around the Hengduan Mountains. The study area exhibits a considerable range in altitude, descending from the Tibetan Plateau in the west to the Yungui Plateau and Sichuan Basin in the east. In the western part of the region, the altitude differential is most pronounced. Eastern Tibetan Plateau, the landscape is dominated by high-altitude northern mountains, where elevation decreases gradually from north to south. The southwest of Changdu marks the highest point, reaching nearly 7000 m above sea level. Conversely, there are lower elevations of one to two hundred meters in the central and southern parts of Linzhi City. Moving eastward from the Tibetan Plateau, the Hengduan area features folded mountains characterized by sharp elevation changes, ranging predominantly between 2000 and 5000 m above sea level, exhibiting a branching distribution from northwest to south. The Sichuan Basin experiences relatively minor elevation fluctuations, with its central region composed largely of low plains and hills, surrounded by mountains ranging from 1000 to 3000 m above sea level, typical of its basin geography with higher elevations on the periphery and lower in the center. Farther south, the middle of Yungui Plateau serves as a distinct transitional zone with a stepped decline in elevation, tapering gradually from 2000 m in the west to 1000 m in the east.
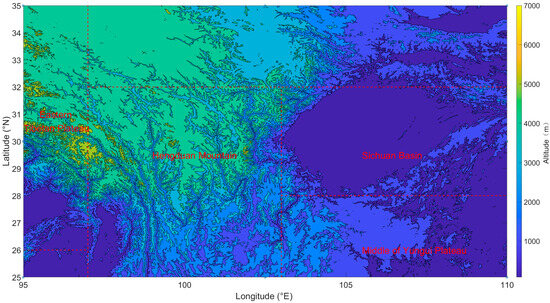
Figure 1.
The region of interest selected in the study: Eastern Tibetan Plateau (95–97°E, 26–35°N), Hengduan Mountain (97–103°E, 25–32°N), Sichuan Basin (103–110°E, 28–32°N), Middle of Yungui Plateau (103–110°E, 25–28°N). The boundaries of the individual areas are marked by a red dashed line.
2.2. Data Source
The lightning dataset utilized in this study comprises observational data and derived products from the CNLDN spanning the years 2017 to 2021. This network encompasses 357 sensors distributed extensively across China [33]. Each sensor typically covers an average detection radius of approximately 300 km, with reported location accuracy and theoretical detection efficiency of about 300 m and 95%, respectively [8,34]. However, due to the lack of sensors, detection efficiency may be lower in the northwestern areas of the Tibetan Plateau [8]. Hence, in this paper, the study region is delineated to focus on the eastern Tibetan Plateau where detection efficiency is assured, forming the basis for analysis and discussion. The dataset includes a total of 6.95 × 10⁶ instances of lightning activity recorded in the Hengduan Mountains and its surrounding areas, providing data on time, longitude, latitude, polarity, steepness, position, and positional error.
The meteorological data used in this study are derived from the ERA5 reanalysis dataset provided by the European Centre for Medium-Range Weather Forecasts (ECMWF), which has been demonstrated as highly reliable across various analogue methods [35]. The spatial resolution of this dataset is 0.25° × 0.25°. For this initial correlational analysis, monthly averages of these meteorological parameters were utilized. This approach is conventional for climatological studies seeking to identify large-scale environmental controls and has been effectively used in previous studies to relate lightning activity to meteorological variables [28]. Furthermore, this choice serves to mitigate potential high-frequency noise and uncertainties inherent in finer-resolution reanalysis data when compared against direct observational data like lightning; for instance, a detailed study pairing hourly ERA5 data with individual lightning strokes found that ERA5-derived CAPE can be unreliable at this fine scale [36], making monthly averages a more robust metric for assessing the background climate state. While this approach is well-suited for our climatological scope, we acknowledge that using monthly averaged data is a limitation, as lightning activity is driven by synoptic and meso-scale weather conditions. Therefore, our results represent climatological relationships, and future work should use higher temporal resolution data to investigate specific event-driven dynamics. To explore the potential environmental controls on lightning activity, we selected several meteorological variables known to influence convective development and lightning occurrence: 2 m temperature as a fundamental indicator of surface heating and atmospheric buoyancy; precipitation as a direct product of convective cloud processes; CAPE as a key measure of atmospheric instability and the potential for strong updrafts necessary for charge separation and lightning; and the Bowen ratio, derived from sensible and latent heat fluxes which govern boundary layer energy input. As with any state-of-the-art dataset, a thorough understanding of ERA5’s characteristics is crucial for scientific interpretation. ERA5’s performance has been extensively evaluated, confirming its high reliability for key variables. For instance, the representation of temperature trends shows high consistency with ground-based station observations [37]. For precipitation, while challenges in capturing the highest daily extremes and certain regional biases are well-understood characteristics of any global model [38,39], ERA5 is notably skillful in representing monthly totals in the Extratropics, where much of our study area lies [38]. The high fidelity of these fundamental variables provides a strong basis for the derived parameters. For instance, the calculation of CAPE benefits from the high-resolution temperature and humidity profiles in ERA5. The Bowen ratio, while influenced by the non-closure of the surface energy budget in the model [40], is based on the most advanced land-surface scheme available in a global reanalysis. Given this comprehensive assessment, while being mindful of the aforementioned characteristics, ERA5 stands as the most suitable and reliable dataset for a comprehensive regional analysis of lightning-environment relationships, and our findings are interpreted within this context.
The elevation and topography data utilized in this study are sourced from the Digital Elevation Model (DEM) dataset of the Shuttle Radar Topography Mission (SRTM), a collaborative effort between the National Aeronautics and Space Administration (NASA) and the National Imagery and Mapping Agency (NIMA). This dataset includes two versions: SRTM1 and SRTM3. Specifically, the SRTM3 dataset employed in this research captures radar data from 60°N to 56°S, covering over 80% of the Earth’s land surface. It boasts an accuracy of approximately 90 m, making it one of the most extensively utilized topographic datasets available [34].
2.3. Data Processing
To ensure the reliability and accuracy of our analysis, the lightning data underwent several preprocessing steps. Following previous preprocessing methods, we applied two key quality control procedures: events detected by three or fewer lightning detection sensors were excluded to ensure higher location accuracy, and PCG lightning flashes with currents less than 10 kA were removed to eliminate potential contamination from intra-cloud discharges [28]. Additionally, return strokes occurring less than 500 ms apart and within 10 km horizontally were grouped as part of the same lightning flash, and two different groups of lightning need to exceed this space-time interval and exhibit opposite polarity [41]. Therefore, lightning events with time intervals under 500 ms and horizontal distances less than 10 km were treated as the same lightning flash for this study. Finally, to create gridded data for analysis, the lightning frequency was calculated by summing the total number of CG flashes within each 0.25° × 0.25° grid cell. This frequency was then used to calculate the density. For the purpose of creating smooth contour maps for visualization in the figures, these gridded density data were then interpolated using a standard 2D interpolation function in MATLAB (R2020a).
3. Results
3.1. Distribution Characteristics of CG Lightning Activities
3.1.1. Spatial Distribution
Figure 2 displays the distribution of average lightning density in the Hengduan Mountains and its surrounding areas. Notably, lightning density is pronounced in the Sichuan Basin and on the Yungui Plateau in the eastern part, while it is comparatively lower on the Tibetan Plateau and in the Hengduan Mountains to the west. In China, lightning activity predominantly occurs east of 100°E, with minimal occurrence in the western plateau regions due to various influencing factors. Areas of high lightning density are notably concentrated, with three prominent centers of CG lightning density found in the Sichuan Basin, Pearl River Delta, and southern Jiangsu Province [8,42]. Our findings, showing relatively higher lightning density in the Sichuan Basin and on the Yungui Plateau, are consistent with these previous studies.
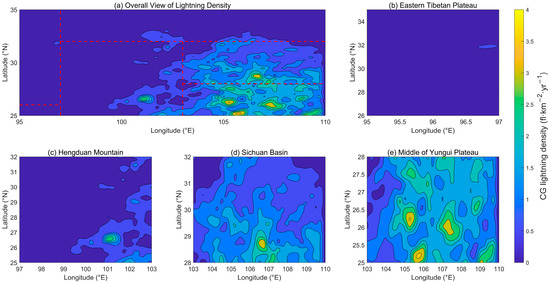
Figure 2.
Spatial distribution of average CG lightning activities in the Hengduan Mountains and its surrounding areas from 2017 to 2021: (a) Overall view of lightning density, (b) Eastern Tibetan Plateau, (c) Hengduan Mountain, (d) Sichuan Basin, (e) Middle of Yungui Plateau.
In Figure 2, two regions stand out for their high CG lightning density: The peak density occurs near (105.8°E, 25.25°N) in the middle of Yungui Plateau, measuring 3.55 flashes per square kilometer per year (fl·km−2·yr−1), marking the highest density across the study area. This elevated lightning density in the Yungui Plateau can be attributed to its proximity to the South China Sea, which provides ample moisture and precipitation; the warm, humid airflow uplifted by the terrain during summer fosters favorable conditions for thunderstorm development in the region [28]. In contrast, the lightning density in the Sichuan Basin is relatively lower, with the highest recorded value reaching 3.34 fl·km−2·yr−1, located near (106.8°E, 28.75°N). In addition, lightning events in the Sichuan Basin are influenced by topographic uplift and meteorological phenomena such as the monsoon, factors that cannot be overlooked in understanding regional lightning patterns.
There are two regions with notably lower lightning activity: Within the broader Tibetan Plateau, the eastern part exhibits the highest overall lightning density compared to the central and western regions. Within this eastern area itself, the density tends to decrease from east to west [32]. In Figure 2, the specific sub-region of the Tibetan Plateau analyzed in this study is situated in its easternmost area, yet it registers a maximum lightning density of only 0.57 fl·km−2·yr−1, located near (96.75°E, 31.75°N). Research indicates that lightning density over the Tibetan Plateau is generally low due to the brief lifespan and weak convection of most thunderstorms [43]. Although lightning activity in the Hengduan Mountain region is generally weak across its central and northwest parts, the maximum CG lightning density near (101°E, 26.5°N) in the southeast can reach 2.74 fl·km−2·yr−1. Few previous studies have focused specifically on lightning activity in the Hengduan Mountain region, probably because it is geographically partitioned by three well-studied surrounding areas, with researchers typically emphasizing lightning in the Tibetan Plateau, Sichuan Basin, or Yungui Plateau separately. This distinct regional disparity, where lightning density is higher in the southeast (near the Sichuan Basin and Yungui Plateau) and lower in the northwest (near the Tibetan Plateau), is closely linked to these surrounding sub-regions.
3.1.2. Temporal Distribution
The annual distribution of lightning frequency and the proportion of PCG lightning flashes in the Hengduan Mountains and its surrounding areas from 2017 to 2021 is depicted in Figure 3. It is evident that the variation in total CG lightning flashes in the eastern Tibetan Plateau and Hengduan Mountain region is relatively subtle. In contrast, significant fluctuations are observed in the Sichuan Basin and the central Yungui Plateau, particularly notable in the Sichuan Basin where there was a sharp increase from 3.0 × 10⁵ in 2020 to 6.3 × 10⁵ in 2021.
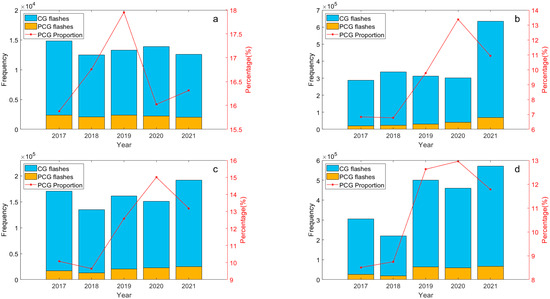
Figure 3.
The annual distribution of CG and PCG lightning frequency (y-axis on the left) and the proportion of PCG lightning flashes (y-axis on the right) in the Hengduan Mountains and its surrounding areas from 2017 to 2021: (a) Eastern Tibetan Plateau, (b) Sichuan Basin, (c) Hengduan Mountain, (d) Middle of Yungui Plateau.
Additionally, there is a notable difference in the average proportion of PCG lightning flashes over a five-year period across four sub-regions. The highest proportion, 16.6%, occurs in the eastern Tibetan Plateau, followed by 12.1% in the Hengduan Mountain region and 10.9% in the middle of the Yungui Plateau. The lowest proportion is found in the Sichuan Basin, where PCG lightning flashes average less than 10%. This indicates that the average proportion of PCG lightning flashes over five years is higher in two regions with lower overall CG lightning frequencies compared to the two regions with higher frequencies. Generally, PCG lightning flashes are much less frequent than negative cloud-to-ground (NCG) lightning flashes in any given area. This outcome is expected because the lower part of the charge distribution structure within convective clouds typically contains a negative charge region, and the closer proximity to the ground facilitates easier discharge of negative charges. It is noteworthy that there is no direct proportional or inverse relationship between the proportion of PCG flashes and the total lightning frequency. The proportion of PCG flashes may correlate more closely with cloud depth, environmental conditions, and topography [8]. Some researchers have noted that strong thunderstorms tend to favor the generation of NCG flashes, whereas weaker thunderstorms are conducive to PCG flashes [44], suggesting that the proportion of PCG flashes reflects the intensity of thunderstorms to some extent. In fact, studies indicate that PCG flashes constitute only about 5% of total CG flashes across China [42], highlighting that the region under study experiences relatively frequent occurrences of PCG flashes compared to the national average.
Figure 4 illustrates the seasonal distribution of lightning frequency and the proportion of PCG lightning flashes in the Hengduan Mountains and its surrounding areas from 2017 to 2021. Across all regions, lightning activity peaks in summer, accounting for an average of 60%, driven by abundant water vapor and strong convection. Conversely, winter sees the least lightning activity, averaging only 1.3%, due to weaker thermal effects. In the two high-frequency regions (Sichuan Basin and middle of Yungui Plateau), lightning is more frequent in spring than in autumn, while the opposite trend is observed in the two low-frequency regions (eastern Tibetan Plateau and Hengduan Mountain). Previous studies on national lightning activity using LIS/OTD climatic data from 1995 to 2003 [9] and lightning data from the ADTD positioning system from 2009 to 2012 [42] have similarly noted seasonal variations. The former show that spring typically exhibits stronger lightning activity compared to autumn nationwide, while it is found in the latter study that although the lightning frequency nationwide in autumn is less than 1% higher than that in spring, in terms of different regions, the distribution of lightning density in the two seasons are quite different. This aligns with our findings, where summer emerges as the peak lightning season and winter as the period with the least activity. Spring and autumn exhibit alternating patterns of intensity based on regional characteristics.
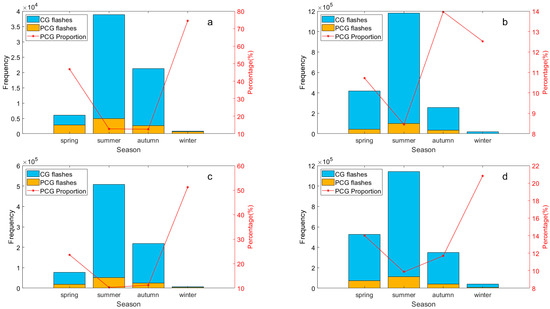
Figure 4.
The seasonal distribution of CG and PCG lightning frequency (y-axis on the left) and the proportion of PCG lightning flashes (y-axis on the right) in the Hengduan Mountains and its surrounding areas from 2017 to 2021: (a) Eastern Tibetan Plateau, (b) Sichuan Basin, (c) Hengduan Mountain, (d) Middle of Yungui Plateau.
In Figure 4, seasonal variations in the proportion of PCG lightning flashes are clearly evident. In all sub-regions except for the eastern Tibetan Plateau, PCG flashes are least frequent in summer. Except for the Sichuan Basin, the proportion of PCG flashes in winter is the highest in the whole year, and the proportion of PCG flashes in the eastern Tibetan Plateau during winter exceeds 70%, nearly six times that of summer. Generally, the proportion of PCG lightning flashes are significantly higher during the colder seasons compared to the warmer seasons, and are more obvious in the western regions than in the eastern regions, consistent with previous research [8].
As shown in Figure 5, the diurnal variation in CG lightning frequency across the eastern Tibetan Plateau and Hengduan Mountain regions from 2017 to 2021 exhibits a unimodal distribution. The number of flashes in the eastern Tibetan Plateau reaches its peak at 17:00 (Beijing Local Time, BJT), nearly 39 times higher than the minimum observed at 10:00 BJT, with a broad peak between 15:00 and 19:00 BJT. According to data from the World Wide Lightning Location Network (WWLLN), lightning on the Tibetan Plateau typically peaks between 16:00 PM and 17:00 BJT and reaches its minimum between 07:00 and 08:00 BJT [45], slightly differing from our findings. This variation may stem from our focus on a specific section of the eastern Tibetan Plateau and differences in lightning data sources. The study also notes that peak lightning activity in this region typically occurs after 16:00 BJT [45]. Similarly, the Hengduan Mountain region experiences its peak CG lightning frequency at 17:00 BJT, matching that of the eastern Tibetan Plateau, with a minimum observed at 10:00 BJT, later than in the eastern Tibetan Plateau. From 17:00 BJT to the early morning lull in the Hengduan Mountain region, lightning activity declines steadily, decreasing by 59.9% from 17:00 to 02:00 BJT, compared to a 62.6% drop on the Tibetan Plateau from 17:00 to 21:00 BJT. The diurnal pattern of lightning activity mirrors global thunderstorm behavior and aligns with studies on convective activity [30]. Therefore, we speculate that while convective activity develops during the daytime, the decline at nighttime is more gradual in the Hengduan Mountain region compared to the eastern Tibetan Plateau.
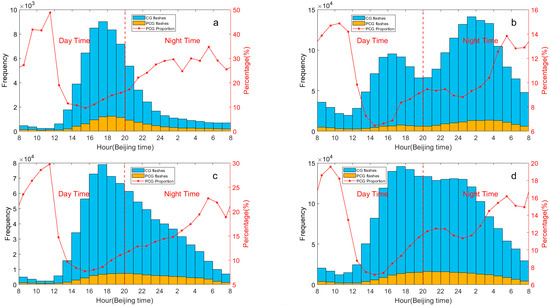
Figure 5.
The diurnal variation of CG and PCG lightning frequency (y-axis on the left) and the proportion of PCG lightning flashes (y-axis on the right) in the Hengduan Mountains and its surrounding areas from 2017 to 2021: (a) Eastern Tibetan Plateau, (b) Sichuan Basin, (c) Hengduan Mountain, (d) Middle of Yungui Plateau (The red dotted line represents the boundary between day time and night time).
The diurnal variation of CG lightning activity in the Sichuan Basin and the middle of Yungui Plateau from 2017 to 2021 exhibits a bimodal distribution. In the Sichuan Basin, two distinct peaks are evident at 16:00 and 01:00 BJT. The peak at 01:00 BJT is particularly pronounced, with CG lightning frequency approximately 1.5 times higher than that of the secondary peak, tapering off to its minimum at 23:00 BJT. This finding is consistent with previous research that peak lightning activity in the Sichuan Basin typically occurs around midnight [26]. Meanwhile, in the middle of Yungui Plateau, a period of heightened lightning activity spans from 16:00 BJT to midnight, with peaks observed at 17:00 BJT and midnight. Unlike the Sichuan Basin, 17:00 BJT is the primary peak period here, followed by midnight with the main peak only 1.1 times that of the secondary peak. The minimum period in the middle of Yungui Plateau is 10:00 BJT, which aligns with earlier findings [28]. In fact, around 17:00 BJT, maximum values are observed in all four sub-regions, corresponding to the maximum of severe convective weather occurrence in China [42].
Due to its unique topography and environmental conditions, the Sichuan Basin has long been recognized as a typical area with frequent nighttime flashes [26,33]. Figure 5 illustrates that not only the Sichuan Basin but also the Yungui Plateau to its south exhibit this characteristic. Therefore, we conducted a comparative analysis of night flash proportions in the Hengduan Mountains and its surrounding areas from 2017 to 2021 (Table 1). It is evident that in the Sichuan Basin, the proportions of night flashes to total flashes, night positive flashes to total positive flashes, and night negative flashes to total negative flashes all exceed 60%. This is attributed to frequent nighttime precipitation and convection in the Sichuan Basin [26]. As mentioned above, the proportion of night flashes in the middle of Yungui Plateau is also considerable. Unlike the Sichuan Basin, the middle of Yungui Plateau also experiences frequent daytime lightning activity (concentrated in the afternoon), likely due to the strengthening of solar radiation in the afternoon and atmospheric convergence near the ground, which leads to rising motion near the ground and the enhancement of convection [28]. Conversely, the proportion of night flashes in the eastern Tibetan Plateau and the Hengduan Mountain region is relatively low. Notably, the proportion of night positive flashes to total positive flashes is highest among the three ratios, exceeding 40% in all cases and approaching 60% in the Hengduan Mountain region. CAPE is one of the controlling factors of PCG lightning frequency to some extent. Low CAPE indicates weaker convection, favoring the occurrence of PCG lightning [46]. Additionally, researchers suggest that although CAPE at higher altitudes is lower than at lower altitudes, lightning activity at higher altitudes is more sensitive to CAPE [30]. It is speculated that the reason for the elevated proportion of night positive flashes in the eastern Tibetan Plateau and Hengduan Mountain region is that CAPE in the two sub-regions becomes smaller at night than in the daytime, and the high altitudes potentially contributes to more night positive flashes.

Table 1.
The proportion of night flashes in the Hengduan Mountains and its surrounding areas from 2017 to 2021, including the proportion of night flashes to total flashes, night positive flashes to total positive flashes, and night negative flashes to total negative flashes.
The distinct diurnal patterns of lightning activity, with a late-afternoon peak over the mountainous regions and a nocturnal peak over the basin, are a classic manifestation of the diurnal cycle of thermally driven mountain-valley wind systems. This phenomenon is well-documented in complex terrain studies [47,48]. During the day, solar heating of the mountain slopes generates upslope valley breezes. This valley breeze converges moisture towards the ridges and peaks, leading to convective initiation and a peak in lightning activity in the late afternoon. Conversely, at night, radiative cooling of the slopes creates downslope mountain breezes. This drainage flow pools and converges within the adjacent basin, forcing the nocturnal low-level air to lift, which can trigger nighttime thunderstorms and a subsequent peak in lightning activity. Consequently, this diurnal transfer of convective activity from the mountains to the basin explains the phase difference in lightning peaks in our study regions.
3.2. Analysis of Influencing Factors
Lightning activity exhibits different temporal and spatial distribution characteristics influenced by factors such as longitude, latitude, topography, altitude, and various meteorological elements. To enhance our understanding of these distribution variances and the mechanisms driving lightning occurrence in the Hengduan Mountains and its surrounding areas, we delve into the relationship between lightning and several key meteorological elements as well as altitude-related factors.
3.2.1. Meteorological Elements
To investigate the relationship between lightning activity and meteorological conditions, we first examined their monthly co-variation from 2017 to 2021 (Figure 6, Figure 7, Figure 8 and Figure 9). Figure 6, Figure 7 and Figure 8 illustrates the monthly variations in lightning frequency and three meteorological elements (2 m temperature, precipitation, and CAPE) across the Hengduan Mountains and its surrounding areas from 2017 to 2021. It can be seen that while the peak value of 2 m temperature is not pronounced, all three meteorological factors exhibit peaks during the summer months (June to August). Notably, precipitation in the central Yungui Plateau peaks in June, whereas the other peaks occur in July and August. However, lightning frequency appears to display a bimodal distribution across the four regions from April to October. Although these meteorological elements and lightning activity show a significant positive correlation on an annual scale, there is a clear divergence in their monthly patterns. Specifically, meteorological elements like 2 m temperature, precipitation, and CAPE exhibit a characteristic unimodal pattern during summer, peaking between June and August (often in July or August) before declining. However, the monthly lightning frequency follows a distinct bimodal pattern during the warm season (April–October). Its peaks occur before and after the peak meteorological period, with a notable dip in lightning activity during the very month when meteorological conditions are at their strongest (e.g., August). This phenomenon, where during the peak of summer meteorological conditions, lightning activity fails to peak concurrently and instead exhibits a significant lag and relative suppression, is what we will hereafter refer to as the “summer anomaly.”
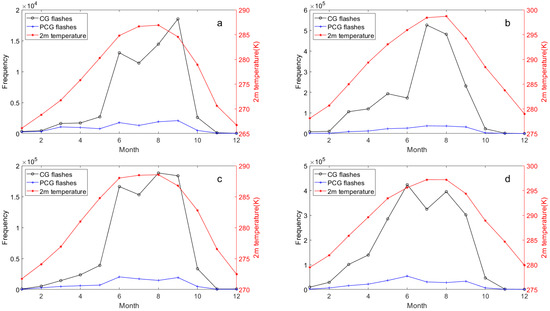
Figure 6.
Monthly variation between CG (black lines) and PCG (blue lines) lightning frequency in the Hengduan Mountains and its surrounding areas from 2017 to 2021 and 2 m temperature (red lines): (a) Eastern Tibetan Plateau, (b) Sichuan Basin, (c) Hengduan Mountain, (d) Middle of Yungui Plateau.
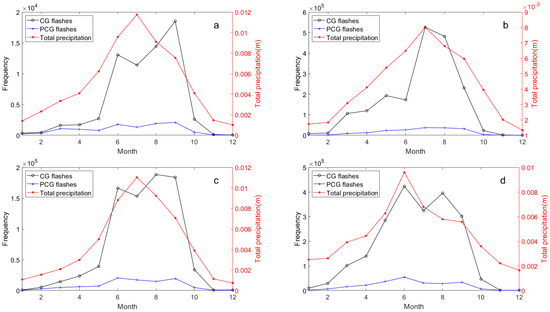
Figure 7.
As in Figure 6, but for total precipitation: (a) Eastern Tibetan Plateau, (b) Sichuan Basin, (c) Hengduan Mountain, (d) Middle of Yungui Plateau.
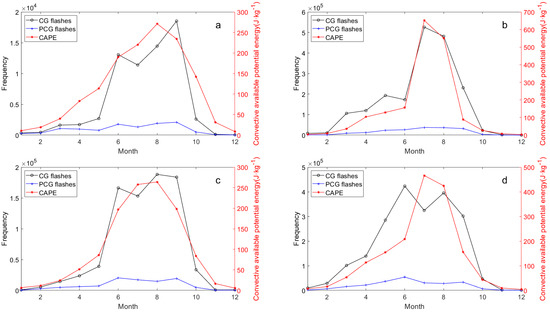
Figure 8.
As in Figure 6, but for CAPE: (a) Eastern Tibetan Plateau, (b) Sichuan Basin, (c) Hengduan Mountain, (d) Middle of Yungui Plateau.
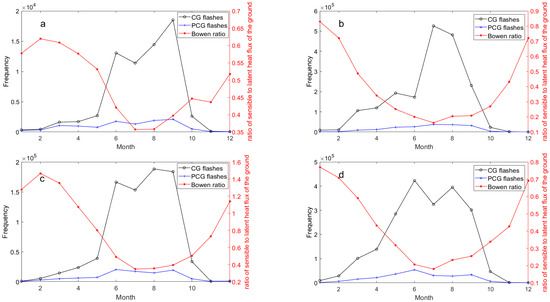
Figure 9.
As in Figure 6, but for Bowen ratio (The ratio of sensible heat flux to latent heat flux): (a) Eastern Tibetan Plateau, (b) Sichuan Basin, (c) Hengduan Mountain, (d) Middle of Yungui Plateau.
Among them, there is an additional “anomaly” between lightning and precipitation in the eastern Tibetan Plateau between August and September (Figure 7a), but no previously observed spring anomalies are shown [49]. In the Sichuan Basin, the anomaly between lightning and CAPE is absent during summer but appears weakly between May and June (Figure 8b). This seems to reflect a stronger correlation between lightning and CAPE and relatively weak correlation with precipitation in the study area. We sought similar phenomena in previous studies and found commonalities, particularly in precipitation dynamics. For instance, Qie et al. [24] explored the regional differences of convection structure of thunderclouds over the Tibetan Plateau, noting a sharp increase in convective precipitation rates in the eastern region from May to June, which was inconsistent with seasonal variations in thundercloud frequency (defined in the cited study as lightning-producing precipitation features). This aligns with Figure 8a, where precipitation peaks in July in the eastern Tibetan Plateau while lightning activity declines from June to July, suggesting thunderstorms producing heavy precipitation may not always yield active lightning flashes during July in this region. Similarly, monthly convective precipitation in the Sichuan Basin peaks in July, whereas maximum lightning density appears in August [27]. In the Yungui Plateau, lightning activity between 2016 and 2020 sharply decreased in June and July before increasing again in August [28].
Figure 9 depicts the monthly correlation between lightning frequency and Bowen ratio across the Hengduan Mountains and its surrounding areas from 2017 to 2021. Similar to the other three meteorological elements, the relationship between Bowen ratio and lightning activity exhibits an “anomaly” contrary to the annual trend. Bowen ratio displays additional anomalies between January and February in the eastern Tibetan Plateau and the Hengduan Mountain region. It is thus evident that a significant ‘summer anomaly’ phenomenon exists between the monthly variation of lightning activity and that of all four key meteorological elements. To systematically investigate the driving factors behind this mismatch and to quantify the overall relationship between each element and lightning activity, we first calculated their Pearson correlation coefficients (Figure 10). Our analysis reveals notable positive correlations with lightning activity for 2 m temperature, precipitation, and CAPE, all exceeding 0.7. Particularly, CAPE demonstrates the strongest correlation, peaking at 0.82. Conversely, the Bowen ratio exhibits a negative correlation of −0.65 with lightning activity. This underscores a significant relationship between these meteorological factors and lightning occurrences in the study area. The strong positive correlations for 2 m temperature, precipitation, and CAPE are consistent with established literature on thunderstorm climatology. However, the strong negative correlation with the Bowen ratio is counter-intuitive and warrants further explanation.
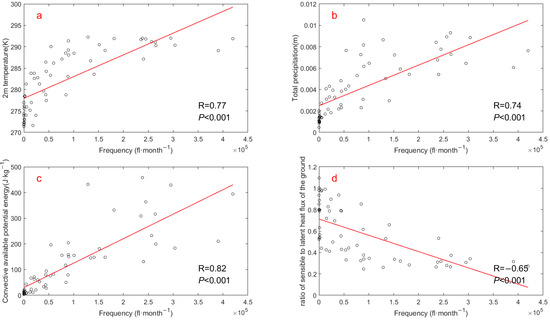
Figure 10.
The correlations between monthly CG lightning frequency in the Hengduan Mountains and its surrounding areas from 2017 to 2021 and the selected meteorological elements at the corresponding time and region: (a) 2 m temperature, (b) Total precipitation, (c) CAPE (d) Bowen ratio (The ratio of sensible heat flux to latent heat flux). R represents the value of correlation coefficient and P shows the significance level.
A high Bowen ratio, typically associated with drier land surfaces, favors the development of a deep, hot, and dry boundary layer. This subsequently leads to higher cloud base heights. These elevated cloud bases, in turn, can reduce the entrainment of dry environmental air into a rising convective plume, allowing for a more efficient conversion of CAPE into strong updrafts. Such robust updrafts are critical for efficient non-inductive charging processes that drive lightning production [23,50,51]. Our finding, while seemingly counterintuitive to the theory that high Bowen ratios can increase lightning efficiency, must be interpreted within the climatological context of our study region. The negative correlation likely arises because the seasons with the highest lightning frequency (i.e., the summer monsoon season) are precisely when the study region experiences maximum moisture availability and rainfall. During this period, a large fraction of the surface energy is partitioned into latent heat flux for evaporation, leading to a low Bowen ratio. Conversely, drier seasons with less lightning are characterized by higher Bowen ratios. Therefore, on a monthly climatological scale, the overwhelming signal of the summer monsoon—which brings both abundant moisture (lowering the Bowen ratio) and the necessary conditions for widespread, frequent thunderstorms—drives this negative statistical relationship. This does not contradict the underlying physics but rather highlights that on a seasonal scale, moisture availability is probably the dominant climatological driver that co-varies with both lightning frequency and the Bowen ratio in this region.
While simple Pearson correlations indicated strong relationships between monthly lightning frequency and several meteorological factors, these variables are subject to multicollinearity. To disentangle their individual effects and identify the most critical drivers, a standardized multiple linear regression analysis was performed.
The results are visualized in the coefficient plot (Figure 11). The overall model was highly significant (F(4,55) = 32.1, p < 0.001) and explained 67.8% of the variance in lightning frequency (Adjusted R2 = 0.678). The plot clearly shows that CAPE is the only statistically significant independent predictor; its coefficient is positive, and its 95% confidence interval does not cross zero. In contrast, the confidence intervals for 2 m temperature, precipitation, and the Bowen ratio all overlap with zero, indicating that their effects are not statistically significant after controlling for the other variables. This comprehensive analysis robustly confirms that, on a climatological monthly scale in our study region, CAPE is the most critical and overwhelmingly dominant driver of lightning activity.
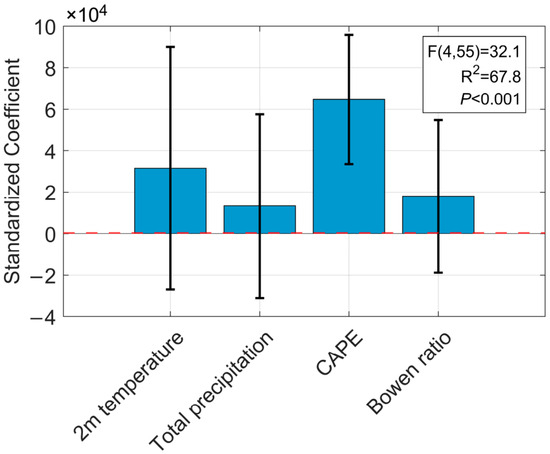
Figure 11.
Standardized regression coefficients for the multiple linear regression model predicting monthly lightning frequency in the Hengduan Mountains and its surrounding areas from 2017 to 2021. The bars represent the standardized coefficient (β) values, and the error bars indicate the 95% confidence intervals. Predictors whose confidence intervals do not cross the zero line (red dashed line) have a statistically significant effect (p < 0.05).
Interestingly, the sign of the Bowen ratio coefficient shifted from negative in the simple correlation analysis to positive in the multiple regression model (though not statistically significant). This reversal is a classic statistical artifact of multicollinearity and provides insight into the dual role of the Bowen ratio. The simple negative correlation is dominated by the seasonal cycle, where the high-lightning monsoon season is associated with low Bowen ratios due to high moisture availability. However, the positive coefficient in the regression model, after controlling for the primary effect of CAPE, is consistent with the physical theory that a higher Bowen ratio can enhance lightning production efficiency for a given level of instability. This highlights the power of multiple regression in disentangling such complex, competing effects.
This comprehensive regression analysis provides a robust climatological framework. It also casts the previously observed “summer anomaly” in a new light. The fact that the model, dominated by CAPE, explains a substantial portion (Adjusted R2 = 0.678) of the variance underscores the fundamental role of atmospheric instability. However, a linear model, by its inherent nature, is designed to quantify average linear relationships and is ill-suited to characterize the asynchronicity embodied by the “summer anomaly”—specifically, the divergence in trends between the driver and the response observed in the raw data. To specifically investigate this non-synchronous seasonal evolution, we employed time-series seasonal decomposition and hysteresis loop analysis. This approach isolates the intrinsic coupling and decoupling features between the annual cycles of lightning activity and CAPE.
After decomposing the monthly time series of lightning frequency and CAPE, we extracted their seasonal components to construct a hysteresis loop plot (Figure 12). The plot reveals a distinct counter-clockwise rotation, indicating that the seasonal peak in lightning activity lags behind the seasonal peak in atmospheric instability (CAPE). This lag effect is most pronounced during the July-to-August transition: while the seasonal component of CAPE begins to decline after reaching its annual maximum in July, the seasonal component of lightning continues to increase, reaching its own apex in August. This dynamic of “response lagging the driver” is the core mechanism of the “summer anomaly.” Physically, this lag phenomenon highlights that the relationship between lightning frequency and its thermodynamic drivers is not simply linear. Lightning is the end-product of a multi-stage physical process. While CAPE represents the fundamental thermodynamic potential for convection, the actual rate of lightning production is critically modulated by the efficiency of cloud electrification processes. This efficiency, in turn, is highly dependent on microphysical factors, such as the concentration and phase of hydrometeors (e.g., supercooled liquid water) and aerosol concentrations which influence cloud properties.
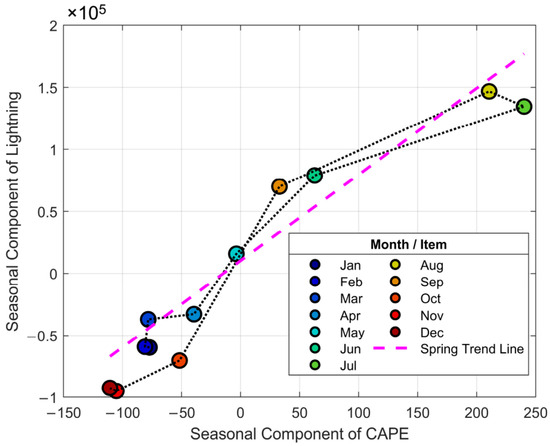
Figure 12.
Hysteresis loop plot showing the relationship between the seasonal components of lightning frequency and CAPE in the Hengduan Mountains and its surrounding areas from 2017 to 2021. The points are colored by month, indicating the progression of the annual cycle from January to December. Due to the self-intersecting path, the hysteresis loop area mentioned in the text refers to the net area (the algebraic sum of signed areas) of the polygon defined by these 12 vertices. The purple dashed line represents the linear trend fitted to the spring months (March, April, and May), serving as a “baseline response”.
To quantitatively describe this process, we calculated two key metrics. First, given that the hysteresis loop exhibits a self-intersecting ‘figure-8’ shape, which contains two sub-loops with opposite traversal directions, we calculated its net area. This value, representing the algebraic sum of the signed areas of these sub-loops (one positive, one negative), was found to be 507,331.46. Second, using the spring (Mar-May) trend line as a “baseline response” (Figure 12, purple dashed line) to measure the summer deviation, we found that lightning activity in July and August fell 42,650.72 and 9864.35 units below the baseline expectation, respectively. Notably, although lightning activity is still increasing from July to August (the response lag), its absolute level remains far below the theoretical value predicted by the CAPE-lightning relationship of the spring “developmental phase.” This suggests that the lag effect and a concurrent suppression mechanism together create the complete picture of the “summer anomaly.”
In summary, the instantaneous value of atmospheric instability (CAPE) is insufficient to fully explain the seasonal evolution of lightning activity in this region. This lag effect, or “summer anomaly,” can be mechanistically interpreted as a temporal decoupling between the peak of the thermodynamic driver (CAPE) and the peak of the conditions that optimize microphysical charging efficiency. This finding strongly suggests that the “summer anomaly” is a complex physical phenomenon modulated by multi-scale and multi-process interactions.
3.2.2. Altitude and Topography Factors
The distribution of lightning is fundamentally linked to topography, which governs the initiation and development of convection through both thermal and dynamic forcing. Based on the combination of altitude and lightning data, Figure 13 illustrates the distribution of CG lightning frequency at varying elevations (in 100-m increment unit) in the Hengduan Mountains and its surrounding areas from 2017 to 2021. To thoroughly investigate the influence of altitude and topography on CG lightning activity, we first defined a “representative altitude range” for each sub-region. This range was determined based on a consistent principle: selecting the continuous altitude band that encompasses the vast majority (typically over 80%) of the region’s land area and total CG lightning frequency. The scientific motivation for this approach is to focus our analysis on the dominant topographic environment of each region. This allows for a more accurate characterization of the core response patterns of lightning to elevation changes within that environment, while avoiding statistical noise from sparse data at extreme altitudes. The following analysis is based on the representative altitude range identified for each sub-region. The results reveal distinct altitude-dependent characteristics in the distribution of CG lightning frequency across four sub-regions, reflecting the underlying physical processes shaped by the diverse terrain of the study regions. In the high-elevation regions, namely the eastern Tibetan Plateau and the Hengduan Mountain, elevated terrain acts as a significant driver for daytime convection. During the day, solar radiation heats the elevated slopes, creating an unstable boundary layer and driving upslope winds that transport moisture to higher altitudes [47,48]. This process effectively triggers convection, leading to a pronounced peak in lightning activity during the afternoon hours, as observed in our diurnal analysis (Figure 5a,c). The general increase in lightning frequency with altitude up to a certain level (with a normal distribution primarily between 3500 and 5300 m above sea level in the eastern Tibetan Plateau and a bimodal distribution in the Hengduan Mountain region) is a direct consequence of this terrain-induced convective activity. In the Hengduan Mountain region, CG lightning frequency displays a clear bimodal distribution in altitude, with peaks at 2100 and 4400 m respectively. The bimodal distribution likely reflects the complex ridge-and-valley structure, which may create multiple preferred zones for convective initiation. Furthermore, the relationship between terrain and lightning extends to its polarity. The observed fluctuating increase in the proportion of PCG flashes with increasing altitude in these high-elevation areas (Figure 13a,c) suggests that topography also modulates the cloud charge structure. This modulation is attributed to the undulating and steep topography of the eastern Tibetan Plateau and Hengduan Mountain region, where the Hengduan Mountains in particular experience a foehn effect. This effect involves cooling during uplift on windward slopes, promoting condensation and cloud formation. Subsequently, the resulting updraft accelerates convection development and, coupled with precipitation rates, reduces negative charges in lower cloud layers during precipitation descent. Ultimately, this indirectly contributes to heightened PCG flash occurrences at higher elevations [34]. The complex variations observed in PCG ratios between peaks (e.g., the notable shift in dominance between PCG and NCG flashes around 3400–3500 m in the Hengduan Mountain region) highlight the high sensitivity of lightning characteristics to specific, localized terrain features.
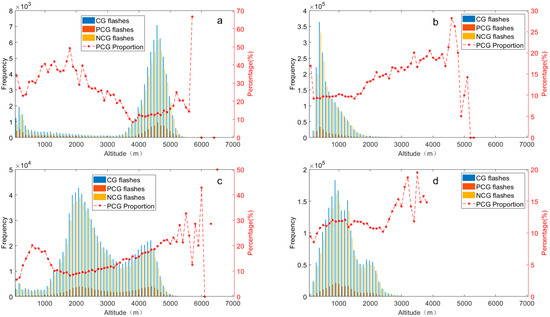
Figure 13.
The variation of CG (blue), PCG (red), NCG (yellow) lightning frequency (y-axis on the left) at different elevations (100 m as the increment unit) and the proportion of PCG lightning flashes (y-axis on the right) in the Hengduan Mountains and its surrounding areas from 2017 to 2021: (a) Eastern Tibetan Plateau, (b) Sichuan Basin, (c) Hengduan Mountain, (d) Middle of Yungui Plateau.
In the Sichuan Basin, the area with altitude of 100 to 2000 m accounts for 94.5%, and the proportion of CG lightning frequency exceeds 98%, representing the unique and relatively homogeneous low-altitude environment of a basin. Thus our primary focus is on understanding how CG lightning varies with this altitude range. Below 400 m, there is a significant increase in CG lightning frequency with altitude, followed by a gradual decrease thereafter. In comparison to the two previously discussed regions, the range of altitude where CG lightning frequency increases is narrower, while the range showing a decrease in lightning flashes is broader. This pattern may be attributed to the lower altitude and frequent precipitation and convection activity in the Sichuan Basin, where the higher CAPE values and precipitation rates likely contribute to intensified lightning activity [52]. The proportion of PCG lightning flashes in the Sichuan Basin remains relatively stable below 1500 m above sea level but shows a significant increase in the altitude range of 1500 to 2000 m. Scholars have observed a relatively high proportion of NCG flashes in this basin region, suggesting that the dry conditions in the lower to mid-level troposphere of the plateau region favor PCG flashes. Conversely, in the basin, the influence of a moister environment appears to be offset by substantially stronger thermodynamic conditions (i.e., higher CAPE). These powerful thermodynamic drivers likely promote such vigorous convection that the resulting thunderstorm charge structure becomes highly efficient for NCG flashes, thus dominating the overall lightning polarity in the basin [53].
Differing from other sub-regions, the frequency of CG lightning in the middle of the Yungui Plateau exhibits three distinct peaks at altitudes of 900, 1300, and 1900 m. This indicates that CG lightning activity in this area is influenced more by topography than altitude. Situated as the transitional zone of the second step of China, the Yungui Plateau features a complex and heterogeneous topography. This terrain heterogeneity can induce localized thermal and dynamic effects, thereby impacting its CG lightning density to some extent [8], which aligns with our findings. Of these peaks, the first two exceed 1.5 × 10⁵ in frequency, more than 2.6 times that observed at 1900 m above sea level. Interestingly, nearly 80% of CG flashes occur at altitudes below 1500 m in the middle of the Yungui Plateau. This can be anticipated, as high lightning density zones often emerge along mesoscale mountains (elevations ranging from 500 to 1500 m) in the eastern humid regions of China [43].
Generally speaking, lightning activity in the Hengduan Mountains and its surrounding areas is intricately linked to meteorological factors, altitude, and topography. Despite occasional anomalies in meteorological elements explaining CG lightning, their correlation factors remain consistently reliable throughout the year. While there isn’t a uniform trend in CG lightning activity variation with altitude across the four sub-regions, the impact of topographic fluctuations on CG lightning activity is undeniable. Our research suggests a close interrelationship among altitude, topography, and meteorological elements, collectively influencing lightning activity. Further investigation into these dynamics is essential for future studies.
4. Discussion
Based on observation data and derivative products from the CNLDN in the Hengduan Mountains and its surrounding areas from 2017 to 2021, we conducted a comparative analysis of the temporal and spatial distribution characteristics of CG lightning activities. This analysis was supplemented by meteorological data from ERA5 and altitude data specific to each region. By examining these factors, correlations between CG lightning activities and meteorological variables were established. Furthermore, we investigated how altitude and topographical features in various sub-regions influence CG lightning frequency.
Spatially, the macro-pattern of “high in the east, low in the west”—i.e., high lightning density in the Sichuan Basin and the middle of the Yungui Plateau versus low density in the eastern Tibetan Plateau and the Hengduan Mountains—is highly consistent with the general distribution of lightning activity across China derived from larger datasets [8,42]. Our high-resolution analysis further reveals intra-regional “hotspot” distinctions. For instance, the peak lightning density in the Yungui Plateau (3.55 fl·km−2·yr−1) surpasses that of the Sichuan Basin, likely benefiting from its proximity to the South China Sea, which provides more abundant moisture transport that enhances convective activity via terrain lifting. This observation supports the conclusions of Liu et al. [28]. In contrast, the general suppression of lightning over the eastern Tibetan Plateau aligns with the established understanding of its short-lived and weaker convective systems [43]. Notably, the southeastern flank of the Hengduan Mountains exhibits higher lightning density, clearly marking it as a transitional zone linking high- and low-density areas. Its lightning climatology is co-influenced by the powerful systems on both its eastern and western sides (plateau climate and basin/monsoon climate), offering a focused analysis of this geographically critical but previously understudied transitional region.
Temporally, this study reveals a multi-scale response landscape centered on an east–west geographical dichotomy. On the diurnal scale, the eastern and western regions exhibit starkly different patterns. The western high-altitude regions (eastern Tibetan Plateau and Hengduan Mountains) exhibit a classic unimodal distribution, with lightning activity peaking in the late afternoon (around 17:00 BJT), which clearly reflects a direct manifestation of slope-heating-driven mountain wind effects; meanwhile, the eastern lower-altitude regions (Sichuan Basin and middle of Yungui Plateau) evolve into a bimodal or even midnight-dominant pattern, clearly pointing to the dynamic mechanism of nocturnal cold-air drainage convergence and lifting within the basin [47,48]. This east–west divergence also extends to the seasonal scale, where we identified a novel phenomenon: lightning is more active in spring in the eastern regions, whereas the western regions are more active in autumn, suggesting significant differences in the establishment and retreat of monsoonal moisture across different topographies. Moreover, the proportion of PCG flashes is systematically higher in the cold season across all regions and is particularly prominent during the night in the western high-altitude zones. This is likely linked to weaker nocturnal convection and lower CAPE, which alters the thunderstorm charging structure [46]. In addition to this classic large-scale topographic thermal circulation, recent research has revealed a more dominant driving process: the diurnal variation of the boundary layer low-level jet (LLJ). Zhang et al. [54] pointed out through high-resolution simulations that the inertial oscillation of the nocturnal southerly LLJ is the primary driver of moisture convergence and the precipitation peak in the basin at night, with the role of mountain downslope winds being secondary. Against the backdrop of these large-scale drivers, local land-atmosphere interactions, such as variations in surface sensible and latent heat fluxes over different land covers (e.g., urban heat islands, croplands, and water bodies), undoubtedly play an important modulating role that can further regulate the intensity, precise timing, and spatial location of these nocturnal lightning peaks. Finally, greater interannual volatility is also concentrated in the more lightning-frequent eastern regions, indicating their higher sensitivity to large-scale climate variability.
Regarding the key meteorological drivers, our most intriguing finding is the “summer anomaly” phenomenon observed across all regions, where the seasonal peak of lightning activity is not synchronized with the peaks of its key drivers, such as CAPE, 2 m temperature, and precipitation. Although on an annual scale, our analysis confirms the expected strong positive correlation between lightning and thermodynamic parameters like CAPE, and the multiple linear regression model verifies that CAPE is a fundamental factor explaining the overall variance in lightning frequency (Adjusted R2 = 0.678), this fails to explain why lightning activity exhibits a lag precisely during the mid-summer peak of these drivers. To quantitatively diagnose and explain this “anomaly,” this study employed hysteresis loop analysis, demonstrating that the lightning system’s response systematically lags behind the changes in thermodynamic forcing. Our hysteresis analysis reveals a temporal decoupling between the thermodynamic forcing and the lightning response. This suggests that the “summer anomaly” is not driven by a simple “system inertia,” but rather by the fact that the conditions for maximum thermodynamic potential (peak CAPE) do not coincide with the conditions for maximum electrical charge separation efficiency. During the peak monsoon season, even as CAPE begins to decline, the deep moisture flux and potentially different aerosol loading may lead to a cloud microphysical environment (e.g., optimal concentrations of supercooled water) that is more efficient at producing lightning. This highlights that a complete understanding of seasonal lightning patterns requires considering not only the thermodynamic drivers but also the evolving efficiency of the microphysical electrification process. Furthermore, the findings on the Bowen ratio are illuminating. Its negative correlation in the simple analysis, which shifts to a (non-significant) positive coefficient in the multiple regression, reveals its dual role. On a seasonal scale, the negative correlation is driven by the statistical association of the “wet-and-stormy” monsoon. Mechanistically, however, after controlling for primary drivers like CAPE, a higher Bowen ratio shows a tendency to enhance convective efficiency [23,50]. With respect to terrain and altitude, our study demonstrates that the distribution patterns of lightning frequency with altitude are highly customized across the different regions, profoundly reflecting the complex modulation of convection by topography. For example, the bimodal distribution in the Hengduan Mountains likely corresponds to two preferred altitudes for convective initiation within its complex ridge-and-valley structure. Our research also confirms and extends previous findings that the proportion of PCG lightning increases with altitude in high-elevation areas, linking this to the influence of topography on the cloud charge structure [30]. In the Sichuan Basin, the pattern of a sharp increase in lightning at low altitudes (<400 m) followed by a gradual decrease, along with the dominance of NCG flashes, clearly indicates that the powerful thermodynamic conditions (high CAPE) in the basin override other factors, promoting vigorous convection favorable for NCG lightning, a conclusion that echoes the findings of Zhao et al. [53]. Lastly, while we establish the primary relationship with altitude, we acknowledge that a quantitative analysis of finer-scale topographic features such as slope and aspect is a further limitation. These factors undoubtedly play a crucial modulating role, as previous studies have demonstrated that the influence of topography on lightning is often non-linear. For instance, lightning density has been shown to have a unimodal relationship with both altitude and slope, and to vary significantly with slope aspect relative to prevailing winds [55]. Indeed, these complex, region-specific modulations are the most likely physical explanation for the variety of distinct altitude-dependent patterns observed across our four sub-regions. Future work should therefore aim to incorporate these finer-scale topographic parameters to build upon the foundational climatological relationships established in this study. The data utilized in this study is based on the ADTD ground-based lightning location data spanning from 2017 to 2021. It is important to note that the analysis of lightning activities in the Hengduan Mountains and its surrounding areas may be influenced by the efficiency and accuracy of the location system, and its validity requires further verification through observational data. Looking ahead, we aim to expand the duration of our lightning dataset and consider integrating location data from the WWLLN. This approach will enable a more comprehensive analysis of the relationships between lightning activities and influential factors such as altitude, topography, and meteorological conditions in the region.
Author Contributions
Conceptualization, Y.L. and Y.J.; methodology, J.Z., Y.L. and Y.J.; software, J.Z. and Y.J.; validation, Y.L.; investigation, J.Z. and Y.J.; resources, Y.L., Z.S., Y.Z. and J.L.; data curation, J.Z.; writing—original draft preparation, J.Z.; writing—review and editing, Y.L.; supervision, Y.L. and Y.T.; funding acquisition, Y.L. and J.L. All authors have read and agreed to the published version of the manuscript.
Funding
This research was funded by Natural Science Youth Fund of the Autonomous Region (Grant No. 2022D01B228), the Second Tibetan Plateau Scientific Expedition and Research (STEP) program (Grant No. 2019QZKK0104), the “Tianshan Talent” Training Program-Science and Technology Innovation Team (Tianshan Innovation Team) Project (Grant No. 2022TSYCTD0007), and S&T Development Fund of CAMS (Grant No. 2021KJ034).
Data Availability Statement
The data presented in this study are available on request from the corresponding author due to (specify the reason for the restriction).
Acknowledgments
The authors sincerely appreciate all the anonymous reviewers for their excellent comments and efforts.
Conflicts of Interest
The authors declare no conflicts of interest.
References
- Moris, J.V.; Conedera, M.; Nisi, L.; Bernardi, M.; Cesti, G.; Pezzatti, G.B. Lightning-caused fires in the Alps: Identifying the igniting strokes. Agric. For. Meteorol. 2020, 290, 107990. [Google Scholar] [CrossRef]
- Müller, M.M.; Vacik, H. Characteristics of lightnings igniting forest fires in Austria. Agric. For. Meteorol. 2017, 240–241, 26–34. [Google Scholar] [CrossRef]
- Zhu, J. Comparison of the satellite-based Lightning Imaging Sensor (LIS) against the ground-based national lightning monitoring network. Prog. Geophys. 2018, 33, 541–546. [Google Scholar] [CrossRef]
- Xu, M.; Qie, X.; Pang, W.; Shi, G.; Liang, L.; Sun, Z.; Yuan, S.; Zhu, K.; Zhao, P. Lightning climatology across the Chinese continent from 2010 to 2020. Atmos. Res. 2022, 275, 106251. [Google Scholar] [CrossRef]
- Blakeslee, R.J.; Christian, H.J.; Mach, D.M.; Virts, K.S.; Buechler, D.E.; Walker, T.D.; Koshak, W.J.; Ellett, W.T.; Stewart, M.F. Lightning Imaging Sensor on the International Space Station: Assessments and results from first year operations [Paper presentation]. In Proceedings of the XVI International Conference on Atmospheric Electricity, Nara, Japan, 17–22 June 2018. [Google Scholar]
- Salvador, A.; Pineda, N.; Montanyà, J.; López, J.A.; Solà, G. Thunderstorm charge structures favouring cloud-to-ground lightning. Atmos. Res. 2021, 257, 105577. [Google Scholar] [CrossRef]
- Barman, S.D.; Shah, R.; Islam, S.; Kumar, A. Numerical Model of Cloud-to-Ground Lightning for PyroCb Thunderstorms. IEEE J. Sel. Top. Appl. Earth Obs. Remote Sens. 2023, 16, 8689–8701. [Google Scholar] [CrossRef]
- Yang, X.; Sun, J.; Li, W. An Analysis of Cloud-to-Ground Lightning in China during 2010–13. Weather Forecast. 2015, 30, 1537–1550. [Google Scholar] [CrossRef]
- Yuan, T.; Qie, X. Spatial and Temporal Distributions of Lightning Activities in China from Satellite Observation. Plateau Meteorol. 2004, 23, 488–494. [Google Scholar]
- Matsui, M.; Michishita, K.; Yokoyama, S. Cloud-to-ground lightning flash density and the number of lightning flashes hitting wind turbines in Japan. Electr. Power Syst. Res. 2020, 181, 106066. [Google Scholar] [CrossRef]
- Matsangouras, I.T.; Nastos, P.T.; Kapsomenakis, J. Cloud-to-ground lightning activity over Greece: Spatio-temporal analysis and impacts. Atmos. Res. 2016, 169, 485–496. [Google Scholar] [CrossRef]
- Enno, S.E. A climatology of cloud-to-ground lightning over Estonia, 2005–2009. Atmos. Res. 2011, 100, 310–317. [Google Scholar] [CrossRef]
- Yusop, N.; Ahmad, M.R.; Abdullah, M.; Zainudin, S.K.; Nor, W.N.A.W.M.; Alhasa, K.M.; Esa, M.R.M.; Sabri, M.H.M.; Suparta, W.; Gulisano, A.M.; et al. Cloud-to-Ground lightning observations over the Western Antarctic region. Polar Sci. 2019, 20, 84–91. [Google Scholar] [CrossRef]
- Tinmaker, M.I.R.; Dwivedi, A.K.; Islam, S.; Ghude, S.D.; Kulkarni, S.H.; Khare, M.; Chate, D.M. Lightning Activity Variability with Prevailing Weather Parameters and Aerosol Loading Over Dry and Wet Regions of India. Pure Appl. Geophys. 2021, 178, 1445–1457. [Google Scholar] [CrossRef]
- Chate, D.M.; Tinmaker, M.I.R.; Aslam, M.Y.; Ghude, S.D. Climate indicators for lightning over sea, sea–land mixed and land-only surfaces in India. Int. J. Climatol. 2016, 37, 1672–1679. [Google Scholar] [CrossRef]
- Qie, K.; Qie, X.; Tian, W. Increasing trend of lightning activity in the South Asia region. Sci. Bull. 2021, 66, 78–84. [Google Scholar] [CrossRef] [PubMed]
- Bourscheidt, V.; Pinto, O.; Naccarato, K.P.; Pinto, I.R.C.A. The influence of topography on the cloud-to-ground lightning density in South Brazil. Atmos. Res. 2009, 91, 508–513. [Google Scholar] [CrossRef]
- Soula, S.; Kasereka, J.K.; Georgis, J.F.; Barthe, C. Lightning climatology in the Congo Basin. Atmos. Res. 2016, 178–179, 304–319. [Google Scholar] [CrossRef]
- Wasswa, P.; Sabiiti, G.; Okal, H.; Kato, P.; Lunyolo, J.; Namulindwa, H. An Assessment of Spatio-Temporal Characteristics of Lightning Occurrence with Elevation, a Case of Uganda. Preprints 2021. [Google Scholar] [CrossRef]
- Qi, W.; Zhang, B.; Pang, Y.; Zhao, F.; Zhang, S. TRMM-Data-Based Spatial and Seasonal Patterns of Precipitation in the Qinghai-Tibet Plateau. Sci. Geol. Sin. 2013, 33, 999–1005. [Google Scholar] [CrossRef]
- Renfrew, I.A.; Elvidge, A.D. The Causes of Foehn Warming in the Lee of Mountains. Bull. Am. Meteorol. Soc. 2016, 97, 455–466. [Google Scholar] [CrossRef]
- Qie, X.; Qie, K.; Wei, L.; Zhu, K.; Sun, Z.; Yuan, S.; Jiang, R.; Zhang, H.; Xu, C. Significantly Increased Lightning Activity Over the Tibetan Plateau and Its Relation to Thunderstorm Genesis. Geophys. Res. Lett. 2022, 49, e2022GL099894. [Google Scholar] [CrossRef]
- Qie, X.; Yuan, T.; Xie, Y.; Ma, Y. Spatial and temporal distribution of lightning activities over the Tibetan plateau. Chin. J. Geophys. 2004, 47, 997–1002. [Google Scholar] [CrossRef]
- Qie, X.; Wei, L.; Zhu, K.; Qie, K.; Xu, C.; Sun, Z.; Jiang, R.; Zhang, H.; Yuan, S. Regional differences of convection structure of thunderclouds over the Tibetan Plateau. Atmos. Res. 2022, 278, 106338. [Google Scholar] [CrossRef]
- Li, Y.D.; Wang, Y.; Song, Y.; Hu, L.; Gao, S.T.; Rong, F. Characteristics of Summer Convective Systems Initiated over the Tibetan Plateau. Part I: Origin, Track, Development, and Precipitation. J. Appl. Meteorol. Climatol. 2008, 47, 2679–2695. [Google Scholar] [CrossRef]
- Wang, H.; Tan, Y.; Shi, Z.; Yang, N.; Zheng, T. Diurnal differences in the effect of aerosols on cloud-to-ground lightning in the Sichuan Basin. Atmos. Chem. Phys. 2023, 23, 2843–2857. [Google Scholar] [CrossRef]
- Xia, R.; Zhang, D.-L.; Wang, B. A 6-yr Cloud-to-Ground Lightning Climatology and Its Relationship to Rainfall over Central and Eastern China. J. Appl. Meteorol. Climatol. 2015, 54, 2443–2460. [Google Scholar] [CrossRef]
- Liu, Y.; Jiang, Y.; Gao, Q.; Shi, Z.; Jiang, Z.; Hu, J. Characteristic analysis of lightning activities on the Yungui Plateau using ground-based remote sensing. Front. Environ. Sci. 2022, 10, 949271. [Google Scholar] [CrossRef]
- Oulkar, S.; Siingh, D.; Saha, U.; Kamra, A.K. Distribution of lightning in relation to topography and vegetation cover over the dry and moist regions in the Himalayas. J. Earth Syst. Sci. 2019, 128, 180. [Google Scholar] [CrossRef]
- Qie, X.; Toumi, R.; Yuan, T. Lightning activities on the Tibetan Plateau as observed by the lightning imaging sensor. J. Geophys. Res. Atmos. 2003, 108, 4551. [Google Scholar] [CrossRef]
- Zhao, P.; Li, Z.; Xiao, H.; Wu, F.; Zheng, Y.; Cribb, M.C.; Jin, X.; Zhou, Y. Distinct aerosol effects on cloud-to-ground lightning in the plateau and basin regions of Sichuan, Southwest China. Atmos. Chem. Phys. 2020, 20, 13379–13397. [Google Scholar] [CrossRef]
- Li, J.; Wu, X.; Yang, J.; Jiang, R.; Yuan, T.; Lu, J.; Sun, M. Lightning activity and its association with surface thermodynamics over the Tibetan Plateau. Atmos. Res. 2020, 245, 105118. [Google Scholar] [CrossRef]
- Shi, Z.; Hu, J.; Tan, Y.; Guo, X.; Wang, H.; Guan, X.; Wu, Z. Significant influence of aerosol on cloud-to-ground lightning in the Sichuan Basin. Atmos. Res. 2022, 278, 106330. [Google Scholar] [CrossRef]
- Yin, L.Y.; Wang, H.Y.; Jin, W.J.; Zhang, S.D.; Wang, W.G.; Mei, H. Lightning Activity Characteristics under Complex Topography in Low Latitude Plateau of China. Appl. Ecol. Environ. Res. 2018, 16, 6349–6367. [Google Scholar] [CrossRef]
- Horton, P. Analogue methods and ERA5: Benefits and pitfalls. Int. J. Climatol. 2021, 42, 4078–4096. [Google Scholar] [CrossRef]
- Chriest, J. Meteorological Drivers of Lightning in Alaska on Seasonal and Sub-Seasonal Timescales. Master’s Thesis, University of Alaska Fairbanks, Fairbanks, AK, USA, 2021. [Google Scholar]
- Yilmaz, M. Accuracy assessment of temperature trends from ERA5 and ERA5-Land. Sci. Total Environ. 2023, 856 Pt 2, 159182. [Google Scholar] [CrossRef]
- Lavers, D.A.; Simmons, A.; Vamborg, F.; Rodwell, M.J. An evaluation of ERA5 precipitation for climate monitoring. Q. J. R. Meteorol. Soc. 2022, 148, 3152–3165. [Google Scholar] [CrossRef]
- Jiang, Q.; Li, W.; Fan, Z.; He, X.; Sun, W.; Chen, S.; Wen, J.; Gao, J.; Wang, J. Evaluation of the ERA5 reanalysis precipitation dataset over Chinese Mainland. J. Hydrol. 2021, 595, 125660. [Google Scholar] [CrossRef]
- Hersbach, H.; Bell, B.; Berrisford, P.; Hirahara, S.; Horányi, A.; Muñoz--Sabater, J.; Nicolas, J.; Peubey, C.; Radu, R.; Schepers, D.; et al. The ERA5 global reanalysis. Q. J. R. Meteorol. Soc. 2020, 146, 1999–2049. [Google Scholar] [CrossRef]
- Pinto, O.; Regina, C.A.; Pinto, I.H.; Diniz, J.; Cazetta Filho, A.C.L.; Cherchiglia, L.M.; Carvalho, A. A seven-year study about the negative cloud-to-ground lightning flash characteristics in Southeastern Brazil. J. Atmos. Sol. Terr. Phys. 2003, 65, 739–748. [Google Scholar] [CrossRef]
- Wang, J.; Chen, Y. Analysis of the 2009-2012 Lightning Distribution Characteristics in China. Meteorol. Mon. 2015, 41, 160–170. [Google Scholar] [CrossRef]
- Ma, M.; Tao, S.; Zhu, B.; LÜ, W. Climatological distribution of lightning density observed by satellites in China and its circumjacent regions. Sci. China Ser. D Earth Sci. 2005, 48, 219–229. [Google Scholar] [CrossRef]
- Qie, X.; Yu, Y.; Wang, D.; Wang, H.; Chu, R. Characteristics of Cloud-to-Ground Lightning in Chinese Inland Plateau. J. Meteorol. Soc. Jpn. 2002, 80, 745–754. [Google Scholar] [CrossRef]
- Ma, R.; Zheng, D.; Zhang, Y.; Yao, W.; Zhang, W.; Cuomu, D. Spatiotemporal Lightning Activity Detected by WWLLN over the Tibetan Plateau and Its Comparison with LIS Lightning. J. Atmos. Ocean. Technol. 2021, 38, 511–523. [Google Scholar] [CrossRef]
- Zhao, P.; Zhang, Y.; Liu, C.; Zhang, P.; Xiao, H.; Zhou, Y. Potential Relationship Between Aerosols and Positive Cloud-to-Ground Lightning During the Warm Season in Sichuan, Southwest China. Front. Environ. Sci. 2022, 10, 945100. [Google Scholar] [CrossRef]
- Whiteman, C.D.; Dreiseitl, E. (Eds.) Alpine Meteorology: Translations of Classic Contributions by A. Wagner, E. Ekhart, and F. Defant; Report No. PNL-5141, ASCOT-84-3; Pacific Northwest Laboratory: Richland, WA, USA, 1984.
- Richard, T.; McNider, R.A.P. Diurnal Boundary-Layer Development over Sloping Terrain. J. Atmos. Sci. 1981, 38, 2198–2212. [Google Scholar] [CrossRef]
- Toumi, R.; Qie, X. Seasonal variation of lightning on the Tibetan Plateau: A Spring anomaly? Geophys. Res. Lett. 2004, 31, L04115. [Google Scholar] [CrossRef]
- Williams, E.; Stanfill, S. The physical origin of the land-ocean contrast in lightning activity. Comptes Rendus Phys. 2002, 3, 1277–1292. [Google Scholar] [CrossRef]
- Wu, Z.; Guo, F.; Lu, X.; Liu, Z.; Deng, J.; Chen, K.; Wang, Q. Simulation on Effect of Updrafts on Complexity of Charge Structures in Thunderstorm Clouds. Chin. J. Atmos. Sci. 2025, 49, 153–172. [Google Scholar] [CrossRef]
- Xu, W. Precipitation and Convective Characteristics of Summer Deep Convection over East Asia Observed by TRMM. Mon. Weather Rev. 2013, 141, 1577–1592. [Google Scholar] [CrossRef]
- Zhao, P.; Xiao, H.; Liu, C.; Zhou, Y.; Karacostas, T. Dependence of Warm Season Cloud-to-Ground Lightning Polarity on Environmental Conditions over Sichuan, Southwest China. Adv. Meteorol. 2021, 2021, 1500470. [Google Scholar] [CrossRef]
- Zhang, Y.; Xue, M.; Zhu, K.; Zhou, B. What is the main cause of diurnal variation and nocturnal peak of summer precipitation in Sichuan Basin, China? The key role of boundary layer low-level jet inertial oscillations. J. Geophys. Res. Atmos. 2019, 124, 2643–2664. [Google Scholar] [CrossRef]
- Hu, Y.; Tao, S.; Gong, M.; Ma, H. Influence analysis of geographic parameters on lightning in plateau. Arid. Land Geogr. 2022, 45, 746–753. [Google Scholar] [CrossRef]


Disclaimer/Publisher’s Note: The statements, opinions and data contained in all publications are solely those of the individual author(s) and contributor(s) and not of MDPI and/or the editor(s). MDPI and/or the editor(s) disclaim responsibility for any injury to people or property resulting from any ideas, methods, instructions or products referred to in the content. |
© 2025 by the authors. Licensee MDPI, Basel, Switzerland. This article is an open access article distributed under the terms and conditions of the Creative Commons Attribution (CC BY) license (https://creativecommons.org/licenses/by/4.0/).