Article

PLISA: An Optical–SAR Remote Sensing Image Registration Method Based on Pseudo-Label Learning and Interactive Spatial Attention

Research Center for Aerospace Information, Institute of Automation, Chinese Academy of Sciences, Beijing 100190, China
*
Author to whom correspondence should be addressed.
Remote Sens. 2025, 17(21), 3571; https://doi.org/10.3390/rs17213571
Submission received: 17 September 2025 / Revised: 23 October 2025 / Accepted: 25 October 2025 / Published: 28 October 2025
(This article belongs to the Section Remote Sensing Image Processing)

Highlights

What are the main findings?
  • PLISA is a self-supervised method for optical–SAR registration. It tackles key challenges by introducing a CIA module for feature alignment and a pseudo-label learning strategy, which generates supervision signals.
  • Extensive experiments on multiple datasets demonstrate that PLISA surpasses state-of-the-art methods in accuracy and robustness under challenging conditions like rotation, scale changes, and noise. It also exhibits strong generalization across varying resolutions and cloud cover.
What are the implications of the main finding?
  • This study shows that self-supervised pseudo-labeling can address the scarcity of annotated keypoints in optical–SAR registration.
  • PLISA maintains high accuracy with high computational efficiency, serving as a reliable tool for real-world remote sensing image registration.

Abstract

Multimodal remote sensing image registration faces severe challenges due to geometric and radiometric differences, particularly between optical and synthetic aperture radar (SAR) images. These inherent disparities make extracting highly repeatable cross-modal feature points difficult. Current methods typically rely on image intensity extreme responses or network regression without keypoint supervision for feature point detection. Moreover, they not only lack explicit keypoint annotations as supervision signals but also fail to establish a clear and consistent definition of what constitutes a reliable feature point in cross-modal scenarios. To overcome this limitation, we propose PLISA—a novel heterogeneous image registration method. PLISA integrates two core components: an automated pseudo-labeling module (APLM) and a pseudo-twin interaction network (PTIF). The APLM introduces an innovative labeling strategy that explicitly defines keypoints as corner points, thereby generating consistent pseudo-labels for dual-modality images and effectively mitigating the instability caused by the absence of supervised keypoint annotations. These pseudo-labels subsequently train the PTIF, which adopts a pseudo-twin architecture incorporating a cross-modal interactive attention (CIA) module to effectively reconcile cross-modal commonalities and distinctive characteristics. Evaluations on the SEN1-2 dataset and OSdataset demonstrate PLISA’s state-of-the-art cross-modal feature point repeatability while maintaining robust registration accuracy across a range of challenging conditions, including rotations, scale variations, and SAR-specific speckle noise.

1. Introduction

The complex demands of terrestrial monitoring applications frequently exceed the capabilities of single-sensor systems, driving the need for multisensor integration to achieve comprehensive Earth observation [1]. Multimodal remote sensing image registration, a prerequisite for effectively utilizing complementary information from these diverse sources [2], aligns images of the same geographic area acquired by different sensors. Registering optical and SAR images, however, is particularly challenging. Their fundamentally different imaging mechanisms lead to significant nonlinear radiometric differences (NRD) and complex geometric distortions, resulting in difficulties for feature extraction and representation during cross-modal image registration.
Traditional image registration methods can be categorized into two types: area-based methods and feature-based methods [3]. The core of area-based methods lies in optimizing a similarity metric to estimate geometric transformation parameters, effectively driving the alignment process through a template matching strategy [4]. Feature-based matching methods typically comprise three key steps: feature detection, feature description, and feature matching. Here, feature detection is crucial in robustly extracting distinctive and repeatable keypoints. A core limitation of these feature-based methods lies in their feature point detection stage, where they heavily rely on image intensity or gradient information. Due to the significant nonlinear radiometric distortions between optical images and SAR images, the intensity distribution patterns and gradient structures of identical objects exhibit drastic changes, or even inversions, between these two modalities. This radiometric discrepancy can be abstracted as an unknown, complex nonlinear function F mapping the intensity values between modalities:
I s ( u , v ) = F ( I o ( x , y ) ) + η ( u , v )
where I o and I s are the optical and SAR image intensities, ( x , y ) and ( u , v ) are corresponding points related by a geometric transformation T θ , and η represents SAR speckle noise. This discrepancy severely undermines the repeatability and localization accuracy of feature points extracted by traditional methods, leading to missed and false detections.
In recent years, deep learning-based remote sensing image registration methods have demonstrated considerable potential in multimodal remote sensing image matching. These methods employ neural networks to extract image feature points, generate feature descriptors, or compute image transformation matrices. Due to the large-scale dimensions inherent in remote sensing imagery, keypoint-based registration methodologies demonstrate marked advantages over dense registration approaches in terms of computational efficiency. However, current deep learning-based feature point detection methods face significant challenges. Crucially, the lack of large-scale, high-quality annotated datasets containing corresponding optical–SAR keypoints hinders supervised learning approaches. Furthermore, existing methods usually depend on image intensity extreme responses [5] or network regression without keypoint supervision [6,7] for feature point extraction. Methods relying on image intensity extreme responses are prone to feature instability due to imaging differences. On the other hand, methods based on network regression without keypoint supervision lack intermediate supervision, which can lead to spatially inconsistent predictions and increased susceptibility to occlusion and ambiguous patterns. Both limitations adversely impact the performance of subsequent feature descriptor construction and matching.
To learn how to extract stable and repeatable keypoints across optical and SAR images, we build upon the concept of self-supervised keypoint generation [8] and propose a novel pseudo-label generation method. This concept was successfully applied to single-modal optical image registration, leveraging synthetic data to explicitly generate stable keypoints without manual annotation. This strategy shares high-level capabilities with other self-supervised methods that create training data through synthetic transformations, such as geometric matching networks [9] and deep image homography estimation [10] for estimating global transformations. However, a limitation of these methods is that they lack interest points and point correspondences, which are crucial for registration. Furthermore, in the realm of unsupervised image registration, another common approach is to directly predict a dense deformation field to warp the moving image towards the fixed image, optimizing similarity metrics without manual annotations. The pivotal distinction of our work lies in its objective: instead of estimating global transformations or dense deformation fields, our method is specifically designed to self-supervise the generation of keypoint location labels. However, directly applying this concept to optical–SAR cross-modal scenarios presents obstacles [11], as it is challenging to generate high-quality virtual synthetic image pairs that accurately reflect genuine cross-modal keypoint characteristics. In the absence of such highly representative virtual training data, it is difficult to train a keypoint detection network capable of co-annotating corresponding feature points across both modalities under reliable cross-modal supervision. To address this, this article proposes a pseudo-label generation method that can simultaneously generate reliable feature point labels for both optical and SAR image pairs.
In deep learning-based remote sensing image registration, early research primarily utilized Siamese networks to simultaneously detect and describe features from cross-modal image pairs [12,13,14]. However, extensive experiments reveal that Siamese networks underperform in heterogeneous image pairs like optical–SAR due to the inadequate modeling of intermodal distinctions [5]. This limitation motivated a shift toward pseudo-Siamese network architectures [5,12,15,16], whose core advantage lies in independently learning modality-specific features. Nevertheless, effectively fusing this modality-specific information with modality-shared information for robust registration remains a critical challenge. The registration objective can be formulated as finding the optimal transformation parameters θ that align the two images:
θ = arg min θ i L Φ s ( I s ( p s i ) ) , Φ o ( I o ( T θ ( p s i ) ) )
where Φ o and Φ s are feature extractors for optical and SAR images, T θ is the geometric transformation, and L is a feature similarity loss. To address this, we propose the pseudo-twin interaction network (PTIF) as a unified feature detection and description backbone.
Based on the analysis above, the main contributions of this paper are summarized as follows:
(1)
It proposes an automated pseudo-labeling module (APLM) to address the challenge of lacking annotated corresponding keypoints. The APLM generates stable keypoint pseudo-labels simultaneously for optical–SAR pairs without manual annotation, enabling effective SAR keypoint extraction through transfer learning from visible synthetic data while avoiding the difficulty of generating high-quality optical–SAR synthetic pairs.
(2)
We design and implement the PTIF using a pseudo-twin architecture integrated with a cross-modal interactive attention (CIA) module. This module captures spatial correspondences and learns cross-modal shared features, thereby effectively fusing modality-specific and modality-shared information.
(3)
We introduce PLISA, an end-to-end registration method built upon the APLM and PTIF. Evaluations on the SEN1-2 dataset and OSdataset demonstrate PLISA’s superior accuracy and robustness against challenges including large perspective rotations, scale variations, and inherent SAR speckle noise.
The remainder of this article is structured as follows. A brief overview of methods in the field of image registration is introduced in Section 2. The proposed method is explained in detail in Section 3. Section 4 discusses the experimental results under various conditions. Finally, Section 5 concludes this article.

2. Background

2.1. Traditional Remote Sensing Image Registration

Region-based registration methods [17,18,19,20,21] determine image transformations by evaluating the similarity within template windows using metrics like MI [22], NCC [23], and SSD [24]. However, SSD and NCC are sensitive to nonlinear grayscale distortions, leading to suboptimal performance in multimodal registration. While MI is resistant to nonlinear distortions, it is computationally intensive and sensitive to local grayscale differences [17]. Critically, all region-based methods face inherent limitations, because they are generally limited to small pixel shifts [4], highly sensitive to rotation and scale changes, and sensitive to illumination and modality variations. Consequently, robust feature-based methods have largely replaced region-based approaches for multimodal remote sensing image registration [25].
Feature-based methods like Moravec [26], Harris [27], DoG [28], FAST [29], SIFT [28], and SURF [30] are widely used. SIFT [28] identifies scale-space extrema in a DoG pyramid, assigns the dominant orientation via gradient histograms, and forms a 128-D descriptor by pooling gradients in spatial bins. SURF [30] accelerates feature detection and description using integral images and Haar wavelets. However, when confronted with multimodal remote sensing image pairs such as optical and SAR imagery, severe NRD and geometric distortions significantly degrade the registration performance of these methods [4]. This results in the low repeatability of cross-modal feature points, lower localization accuracy, and elevated rates of false and missed detections. The cause lies in the significant discrepancies in the intensity and gradient patterns exhibited by identical ground objects under different imaging mechanisms.
To address these challenges, the remote sensing community has developed three primary categories of enhancement strategies. Gradient optimization methods such as SAR-SIFT [31] and OS-SIFT [32] enhance the robustness against modality-specific noise and NRD by redesigning gradient computation. For instance, SAR-SIFT utilizes the ROEWA operator in SAR imagery to suppress speckle noise. However, these methods typically rely on modality-specific gradient definitions, which limits their generalization capabilities. Local self-similarity methods like DOBSS [33] and HOSS [34] construct descriptors using log-polar spatial structures, correlating regional patterns or encoding self-similarity histograms to improve the NRD resistance. Nevertheless, such descriptors’ limited discriminative capacity can compromise the matching robustness under complex nonlinear radiometric distortions. Phase congruency methods including RIFT [35] exploit the illumination and contrast-invariant properties of phase consistency for keypoint detection and description. These methods maintain robustness under severe NRD, making them particularly suitable for tasks such as optical and SAR image registration. However, these approaches carry large computational burdens that limit their practical deployment on large-scale remote sensing imagery.
In summary, existing traditional approaches, encompassing both region-based methods and feature-based methods, are constrained by their dependence on handcrafted features and similarity measures. This limitation inherently compromises their robustness against severe NRD, significant geometric distortions, modality-specific noise, and diverse imaging conditions, which often leads to insufficient keypoint repeatability, poor descriptor discriminativity, and limited model generalization. These persistent limitations motivate a paradigm shift, moving beyond manual feature engineering. To address this gap, we proposes PLISA, an end-to-end deep learning method that learns robust, modality-invariant representations directly from image data, effectively bypassing the inherent limitations of traditional design paradigms.

2.2. Learning-Based Registration Methods

To effectively address the significant NRD between optical and SAR images and the inherent speckle noise in SAR images, researchers have proposed a variety of learning-based registration methods. These approaches aim to extract more discriminative and robust feature representations. In this section, we review these methods by categorizing them into four primary strands: Siamese and pseudo-Siamese network frameworks, cross-modality translation via style transfer, CNN-based feature representation and matching methods, and advanced architectures for image registration. This categorization allows us to systematically explore the strengths and limitations of existing methods and clearly motivates our proposed approach.

2.2.1. Siamese and Pseudo-Siamese Network Frameworks

Siamese and pseudo-Siamese networks have emerged as pivotal frameworks for feature extraction in image registration. Conventional Siamese networks employ weight-shared branches to process homogeneous inputs. For instance, Merkle et al. [36] and Zhang et al. [14] employed Siamese fully convolutional networks for deep feature extraction. Merkle et al. [36] and Zhang et al. [14] both employed Siamese fully convolutional networks to extract deep common features. The former adopted dilated convolutions to expand the receptive fields, while the latter established feature correspondences through convolutional linking operations. Building on this foundation, Cao et al. [37] trained phase congruency networks using Siamese architectures, and Xiang et al. [38] developed the Siamese Cross-Stage Partial Network (Sim-CSPNet) specifically for SAR image registration. However, these weight sharing mechanisms prove inadequate in capturing intermodal discrepancies inherent in heterogeneous modality pairs, such as optical and SAR images [5].
This limitation led to the development of pseudo-Siamese variants. Hughes et al. [39] pioneered the use of independent convolutional streams for optical and SAR inputs, without weight sharing. Similarly, CMM-Net [5] established a dual-branch framework where shallow non-shared layers extract modality-specific features, while deep shared layers learn modality-invariant representations. To achieve deeper fusion, recent refinements have been proposed. For example, Zhou et al. [40] proposed Multiscale Convolutional Gradient Features (MCGF) based on a pseudo-Siamese network to preserve spatial precision through a fully convolutional design. Zhang et al. [12] introduced OSMNet, which is also built upon a pseudo-Siamese architecture. This framework incorporates multilevel feature fusion, multifrequency channel attention, and an adaptive weighted loss to enhance the matching accuracy between optical and SAR images.
While pseudo-Siamese networks allow different processing for each modality, their feature fusion methods still have limitations. Existing fusion mechanisms still lack the modeling of spatial correspondence. It is these limitations that directly motivate our proposed PTIF, which introduces a CIA module to model spatial correspondences and dynamically learn modality-shared features, aiming to address the insufficient fusion in current methods.

2.2.2. Cross-Modality Translation via Style Transfer

An alternative strategy focuses on pixel-level image translation to unify modality representations. This approach converts cross-modal images into a unified modality, enabling the direct application of well-established homogeneous image registration methods. This approach is primarily implemented using GANs [41]. A K-means clustering GAN [42] uses the K-means segmentation of SAR images as input to the GAN to control spatial information. It can stabilize training and generate a natural high-frequency structure to enhance texture details. Merkle et al. [43] utilized a conditional GAN to generate pseudo-SAR images from optical images, thereby improving the matching accuracy of traditional methods. Hughes et al. [39] proposed using a GAN and a variational autoencoder to generate new SAR image patches. Han et al. [44] proposed an image transformation module based on HOG-GAN to generate pseudo-optical images and enhance the discriminability of local features. Subsequently, high-precision matching was achieved through EDs based on scale-angle estimation (SAE) and descriptor co-learning. James et al. [45] proposed a conditional GAN-based image registration method, which is a method for image registration based on a conditional GAN and fast Fourier transform. The main idea of this method is to use the conditional GAN to convert heterogeneous remote sensing images into uniform images and then perform image registration. In addition to using GANs to achieve modality unification, Song et al. [46] implemented a style transfer algorithm based on the VGG network, obtaining a composite image that provides content information from the floating image and style information from the reference image. The composite image is then registered with the reference image to achieve better results.
Despite these efforts, current pixel-level image translation methods still have limitations. Crucially, the converted images have poor quality, especially in optical-to-SAR cases. This directly reduces the registration accuracy [4]. While deep learning can handle some nonlinear differences, the differences between how optical and SAR sensors capture images, combined with the unique speckle noise in SAR, make it extremely difficult to produce high-quality converted images.

2.2.3. CNN-Based Feature Representation and Matching Methods

CNNs represent some of the most widely adopted architectures in image registration. In the field of keypoint detection, early methods such as D2-Net [13] employed CNNs to extract descriptors but depended on unstable local extrema for detection. CMM-Net [5] enhanced the keypoint quality by selecting channel-wise maxima. R2D2 [7] introduced separate learnable maps for repeatability and reliability, enhancing the registration performance by jointly optimizing keypoint repeatability and reliability. ReDFeat [6] decoupled detection and description through mutual weighting and stabilized training via gradient decoupling. To enhance the reliability of feature extraction, Li et al. [47] proposed PMNet, which integrates an MKD for more robust keypoint localization. Similarly, Xiang et al. [48] introduced a feature intersection-based keypoint detector that combines phase consistency, gradient direction, and local variation coefficient measures to extract highly repeatable keypoints, significantly improving the adaptability under highly complex imaging conditions. SuperPoint [8] introduces a self-supervised method called homographic adaptation to generate high-quality pseudo-ground-truth keypoint labels without human annotation. It first pre-trains a base detector, MagicPoint, on a synthetic dataset of simple geometric shapes where corners are well-defined. Then, for each real image, it applies multiple random homographies, detects points on warped versions, aggregates the results back into the original image space, and uses these consistent points as pseudo-labels to train the full SuperPoint model.
In terms of feature description, Liao et al. [49] proposed MatchosNet, which incorporates a local deep CNN descriptor trained with the L2 loss. Xiang et al. [50] also introduced FDNet, consisting of RDNet and a PSFCN, designed to separately learn noise-robust features and semantic features, further enhancing the robustness in noisy environments.
Regarding matching strategies, several methods have also shown notable progress. Hoffmann et al. [51] proposed a fully convolutional network-based registration approach that outperformed traditional mutual information-based metrics in matching accuracy. In outlier rejection, Chen et al. [52] enhanced StateNet with adaptive dual-aggregation convolution and point rendering layers, improving the matching robustness under complex transformations.
Despite these advances, significant challenges remain in optical–SAR image registration. Many methods rely on extremum detection or direct network predictions to locate keypoints, and they lack a clear and consistent definition of what constitutes a reliable feature point in cross-modal scenarios. Furthermore, annotation strategies like those used in SuperPoint [8] struggle to generalize to SAR-specific artifacts due to domain shift.

2.2.4. Advanced Architectures for Image Registration

In recent years, emerging architectures such as Transformers and GNNs have been widely adopted in the field of image registration. Detector-free methods eschew explicit feature detection, instead establishing dense correspondences directly between images. Representative approaches like LoFTR [53] leverage Transformer architectures to achieve robust matching, even in textureless regions. Efforts like Efficient LoFTR [54] improve the efficiency through novel attention mechanisms, while frameworks such as RCM [55] attempt to balance sparse and dense matching. RSOMNet [56] further advances this paradigm with a coarse-to-fine matching cascade refined by non-shared content filtering. Alternative strategies bypass the traditional pipeline entirely; for instance, Li et al. [3] directly predict displacement parameters. However, slight prediction errors can accumulate, potentially resulting in significant deviations in the final transformation matrix. Meanwhile, ADRNet [57] integrates affine and deformable transformations with dilated attention. RoMa [58] is a robust dense feature matching method that leverages frozen pre-trained DINOv2 features combined with specialized fine-level features, an improved Transformer match decoder, and a robust loss formulation. It should be noted that the substantial computational demands inherent in these detector-free dense matching methods render them prohibitively expensive for large-scale, high-resolution image pairs.
In contrast, detector-based methods often incorporate learned feature detectors within an framework. For instance, Chen et al. [59] designed Shape-Former, which integrates CNN and Transformer blocks with permutation-invariant operations to enhance shape-aware feature extraction. Lin et al. [60] introduced a hybrid CNN–Transformer descriptor that achieves a balance between performance and computational efficiency through dense connectivity and transition layers. Similarly, CSR-Net, developed by Chen et al. [61], incorporates structural representation learning and attention mechanisms to enhance fine-grained pattern recognition. MBGA [62] enhances cross-modal matching with a multibranch global attention module.
Matching strategies have also advanced significantly. SuperGlue [63] formulates feature matching as an optimal transport problem, solved using attention-based GNNs. Its efficient variant, LightGlue [64], reduces the computational overhead through adaptive depth and early exiting mechanisms. These methods are often integrated with learnable detectors to form end-to-end differentiable pipelines.
While some of the aforementioned methods work well for natural image registration, they often fail to generalize to optical–SAR scenarios. Even the remaining algorithms specifically designed for optical–SAR matching still face considerable challenges, primarily due to differences in imaging mechanisms between SAR and optical sensors. These include severe radiometric distortions, geometric variations such as layover and shadowing in SAR, speckle noise, and divergent textural characteristics between the two modalities. Such inherent discrepancies often lead to ambiguous feature correspondences, unreliable keypoint detection, and difficulties in achieving consistent alignment in heterogeneous regions, limiting the robustness and generalization of current learning-based methods.
Beyond the image–image registration scope, significant progress has also been made in the alignment of image and point cloud data, which represents another critical multimodal registration scenario. For instance, NRLI-UAV [65] enhances low-cost UAV LiDAR quality by non-rigidly registering sequential raw laser scans and images through trajectory correction and depth optimization. Meanwhile, CoFiI2P [66] tackles cross-modal registration with a coarse-to-fine framework and an I2P transformer for robust correspondence. Complementarily, SE-Calib [67] enables online sensor calibration by aligning semantic edges between LiDAR and cameras using a soft consistency metric. These works demonstrate the potential of advanced architectures in addressing complex multimodal alignment challenges beyond traditional image pairs.

3. Method

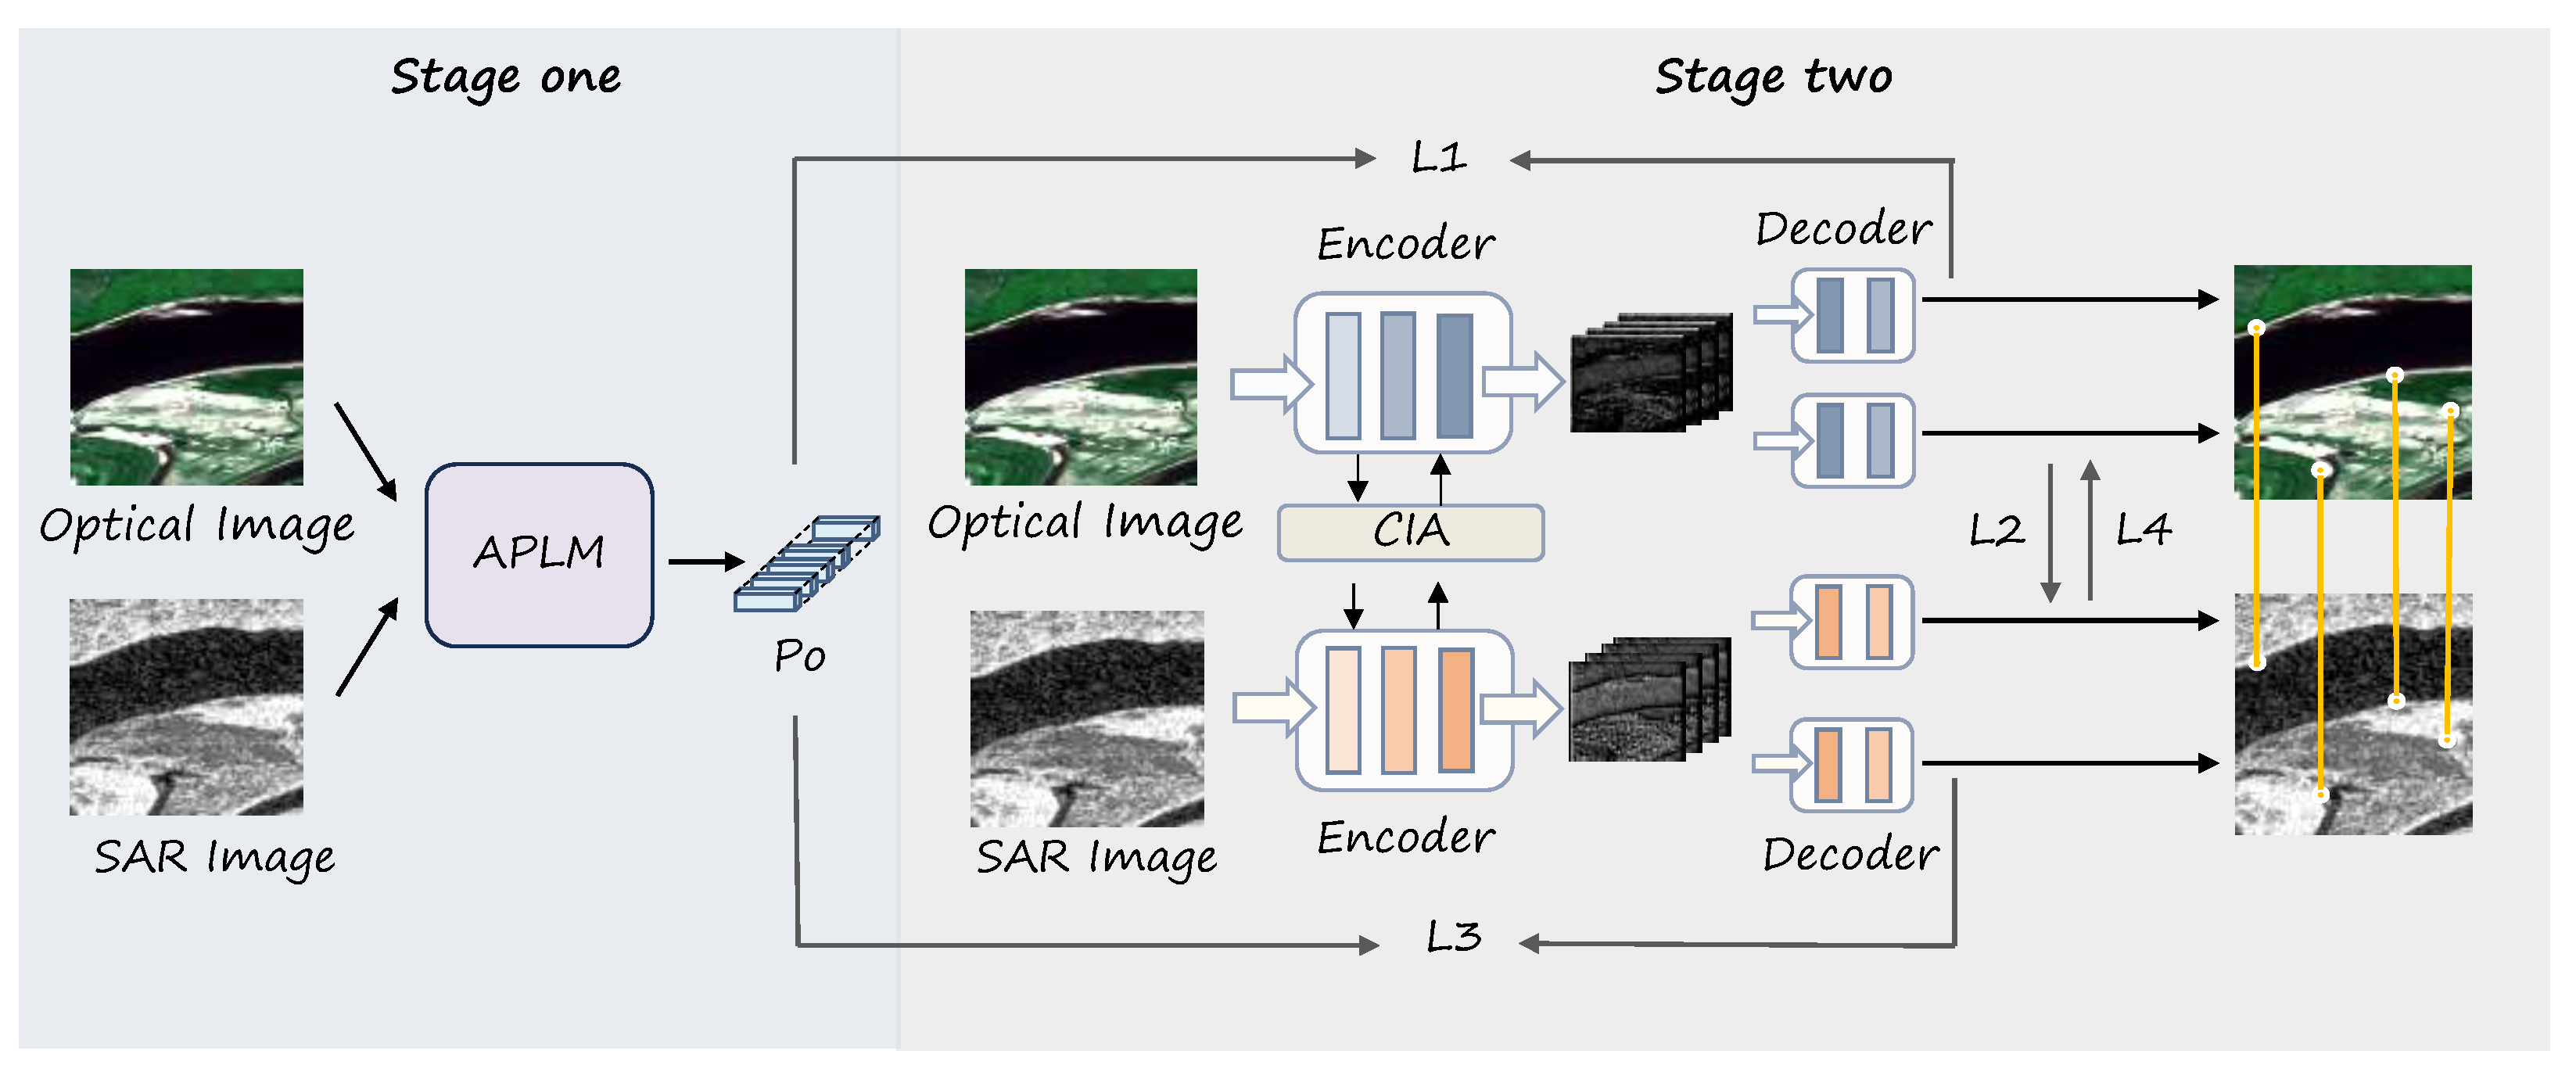
This article proposes a novel framework termed PLISA for optical and SAR image registration, as shown in Figure 1. PLISA comprises two sequential stages. In the first stage, the APLM generates pseudo-labels Po representing corresponding points in the optical and SAR image pair. In the second stage, these pseudo-labels Po are leveraged as supervision to train the PTIF registration network. The PTIF is optimized via a composite loss function including feature point localization losses for both the optical (L1) and SAR (L3) images and bidirectional cross-modal descriptor matching losses (L2: optical to transformed SAR; L4: SAR to transformed optical). This design enables the framework to optimize feature localization and robust cross-modal descriptor matching, thereby enhancing the registration accuracy.

3.1. Automated Pseudo-Labeling Module

The APLM is designed to provide stable and repeatable feature points for both optical and SAR images. We adopt the core concept of feature point annotation from SuperPoint [8].
Nevertheless, Superpoint [8] is primarily designed for the optical spectrum and cannot be directly applied to annotate feature points in SAR images. To overcome this limitation, we propose the APLM, which directly extends its underlying principles to cross-modal scenarios. Given the challenges in generating synthetic SAR datasets, we adhered to SuperPoint’s paradigm by training MagicPoint exclusively on synthetic optical data, subsequently deploying it for feature point detection in real-world optical and SAR imagery. Experimental results indicate that, while MagicPoint accurately labels feature points in optical images, it produces sparser detections in SAR images. This suggests that a method is required to increase the consistency of feature point detection across cross-modal image pairs. The implementation details for the application of MagicPoint to real optical and SAR images are shown in Figure 2.
In response, we propose the Consistency-Aware Pseudo-Ground-Truth Selector (CAGTS) for the pseudo-ground-truth labeling of both optical and SAR images, using only optical synthetic data. This method is inspired by the homographic adaptation strategy [8]. The CAGTS presents the idea of soft labels. This scheme maintains the precise localization of feature points in optical images while effectively preserving feature points characterized by SAR-specific imaging properties.
We initially annotated feature points in optical and SAR images with MagicPoint. This process generates initial sets of candidate feature point locations, denoted as { P VIS } for the optical image and { P SAR } for the corresponding SAR image. The final pseudo-ground-truth points are selected from the complete initial set { P VIS } of optical images and the filtered points from the initial SAR image set { P SAR }.
The filtering begins with a distance-based hard constraint. For each candidate SAR point P SAR in the initial set { P SAR }, its nearest neighbor optical point P VIS within the set { P VIS } is identified. The Euclidean distance d ( P SAR , P VIS ) is calculated. A predefined distance threshold T is applied: if d ( P SAR , P VIS ) T , P SAR is discarded due to being too isolated from any optical point to be considered consistent; if d ( P SAR , P VIS ) < T , P SAR is retained as a provisionally consistent candidate, forming a subset P SAR _ prov . Next, a soft confidence score C ( P SAR ) is calculated for each provisionally consistent SAR point P SAR in P SAR _ prov . A search radius T is defined, centered at P SAR . All optical points P VIS i falling within this radius T are identified, and N denotes the number of such points. The confidence score is computed as the average of the inverse distances to all these neighboring optical points within T:
B i = 1 , if d ( P SAR , P VIS i ) < T 0 , if d ( P SAR , P VIS i ) > T
C ( P SAR ) = 1 N i = 1 N 1 B i × d ( P SAR , P VIS i )
C ( P SAR ) = 1 , if C ( P SAR ) > 1 0 , if C ( P SAR ) α
where, P VIS i denotes the i-th keypoint in the optical image, and d ( P SAR , P VIS i ) represents the Euclidean distance between P SAR and P VIS i . N refers to the total number of keypoints in the optical image. It is crucial to emphasize that this strategy must be applied to a pair of already co-registered optical and SAR images for annotation. A confidence threshold α is then applied to C ( P SAR ) for final selection. This threshold critically controls the strictness of SAR point selection, directly influencing the quantity and quality of the pseudo-ground truth. If C ( P SAR ) > α , P SAR is accepted as a final pseudo-ground-truth point for the SAR image; if C ( P SAR ) α , P SAR is rejected due to lacking sufficient consistent local evidence despite passing the initial distance filter. The optimal value of α was determined through extensive empirical analysis (see Section 4.9 for details), balancing the inclusion of sufficient correspondence points against the exclusion of noisy outliers. Our experiments indicate that α = 0.15 yields the best overall performance. Consequently, the final pseudo-ground-truth points sets are defined as follows: the optical image pseudo-ground-truth points remain the initial set { P VIS } generated by the homographic adaptation strategy [8]; the SAR image pseudo-ground-truth points comprise the subset of the initial { P SAR } points that survived both the hard distance filter and the soft confidence threshold.
The pseudo-ground-truth point set obtained through the above process not only reflects the correspondence between the two image types but also enhances the repeatability of the feature points. The CAGTS helps to filter out inaccurate or isolated feature points that result from structural differences between images from different sources, thereby providing high-quality feature point labels for subsequent image registration.

3.2. Pseudo-Twin Interaction Network

Siamese networks, sharing parameters, perform exceptionally well in feature extraction for homogeneous modalities. However, when applied to cross-modal feature extraction involving optical and SAR remote sensing images, the dual branches can interfere with each other. This not only compromises the quality of feature extraction but also yields suboptimal results. Therefore, in multisource image registration tasks, researchers tend to adopt pseudo-Siamese network architectures to extract features from images of different modalities.
Accordingly, we design a PTIF for the extraction of feature points and descriptors. The architecture of the PTIF mainly consists of two parallel branches, with each branch dedicated to processing input images from different modalities.

3.2.1. Encoder

In the encoder section, the network utilizes a VGG-like backbone, which is configured with six 3 × 3 convolutional layers. After every two convolutional layers, a 2 × 2 max pooling layer is applied for spatial downsampling. Notably, between the first four convolutional layers—specifically after every two convolution operations—a CIA module is introduced between two distinct branches.

3.2.2. Decoder

Within the decoder, there are three 3 × 3 convolutional layers followed by a 1 × 1 convolutional layer, outputting a 65-channel feature point tensor and a 256-channel descriptor tensor.
Regarding the feature point tensor, it represents the probability of each position being a feature point, where the 65 channels include 64 positions from an 8 × 8 pixel grid and one “garbage bin” category [8]. The “garbage bin” category is used to indicate the absence of significant feature points within this 8 × 8 pixel region. During training, the ground truth label y h w for each 8 × 8 region is determined based on the presence of annotated feature points. When the region contains at least one feature point, y h w is set to the grid position index corresponding to the feature point closest to the region center; when the region contains no feature points, y h w is set to 65.
As for the descriptor tensor, it has 256 channels, where both the width and height are 1 8 of the original image size. To reduce the memory and processing time consumption, this tensor is bilinearly interpolated based on the locations of feature points to obtain 256-dimensional descriptors corresponding to the original size.

3.2.3. Cross-Modal Interactive Attention

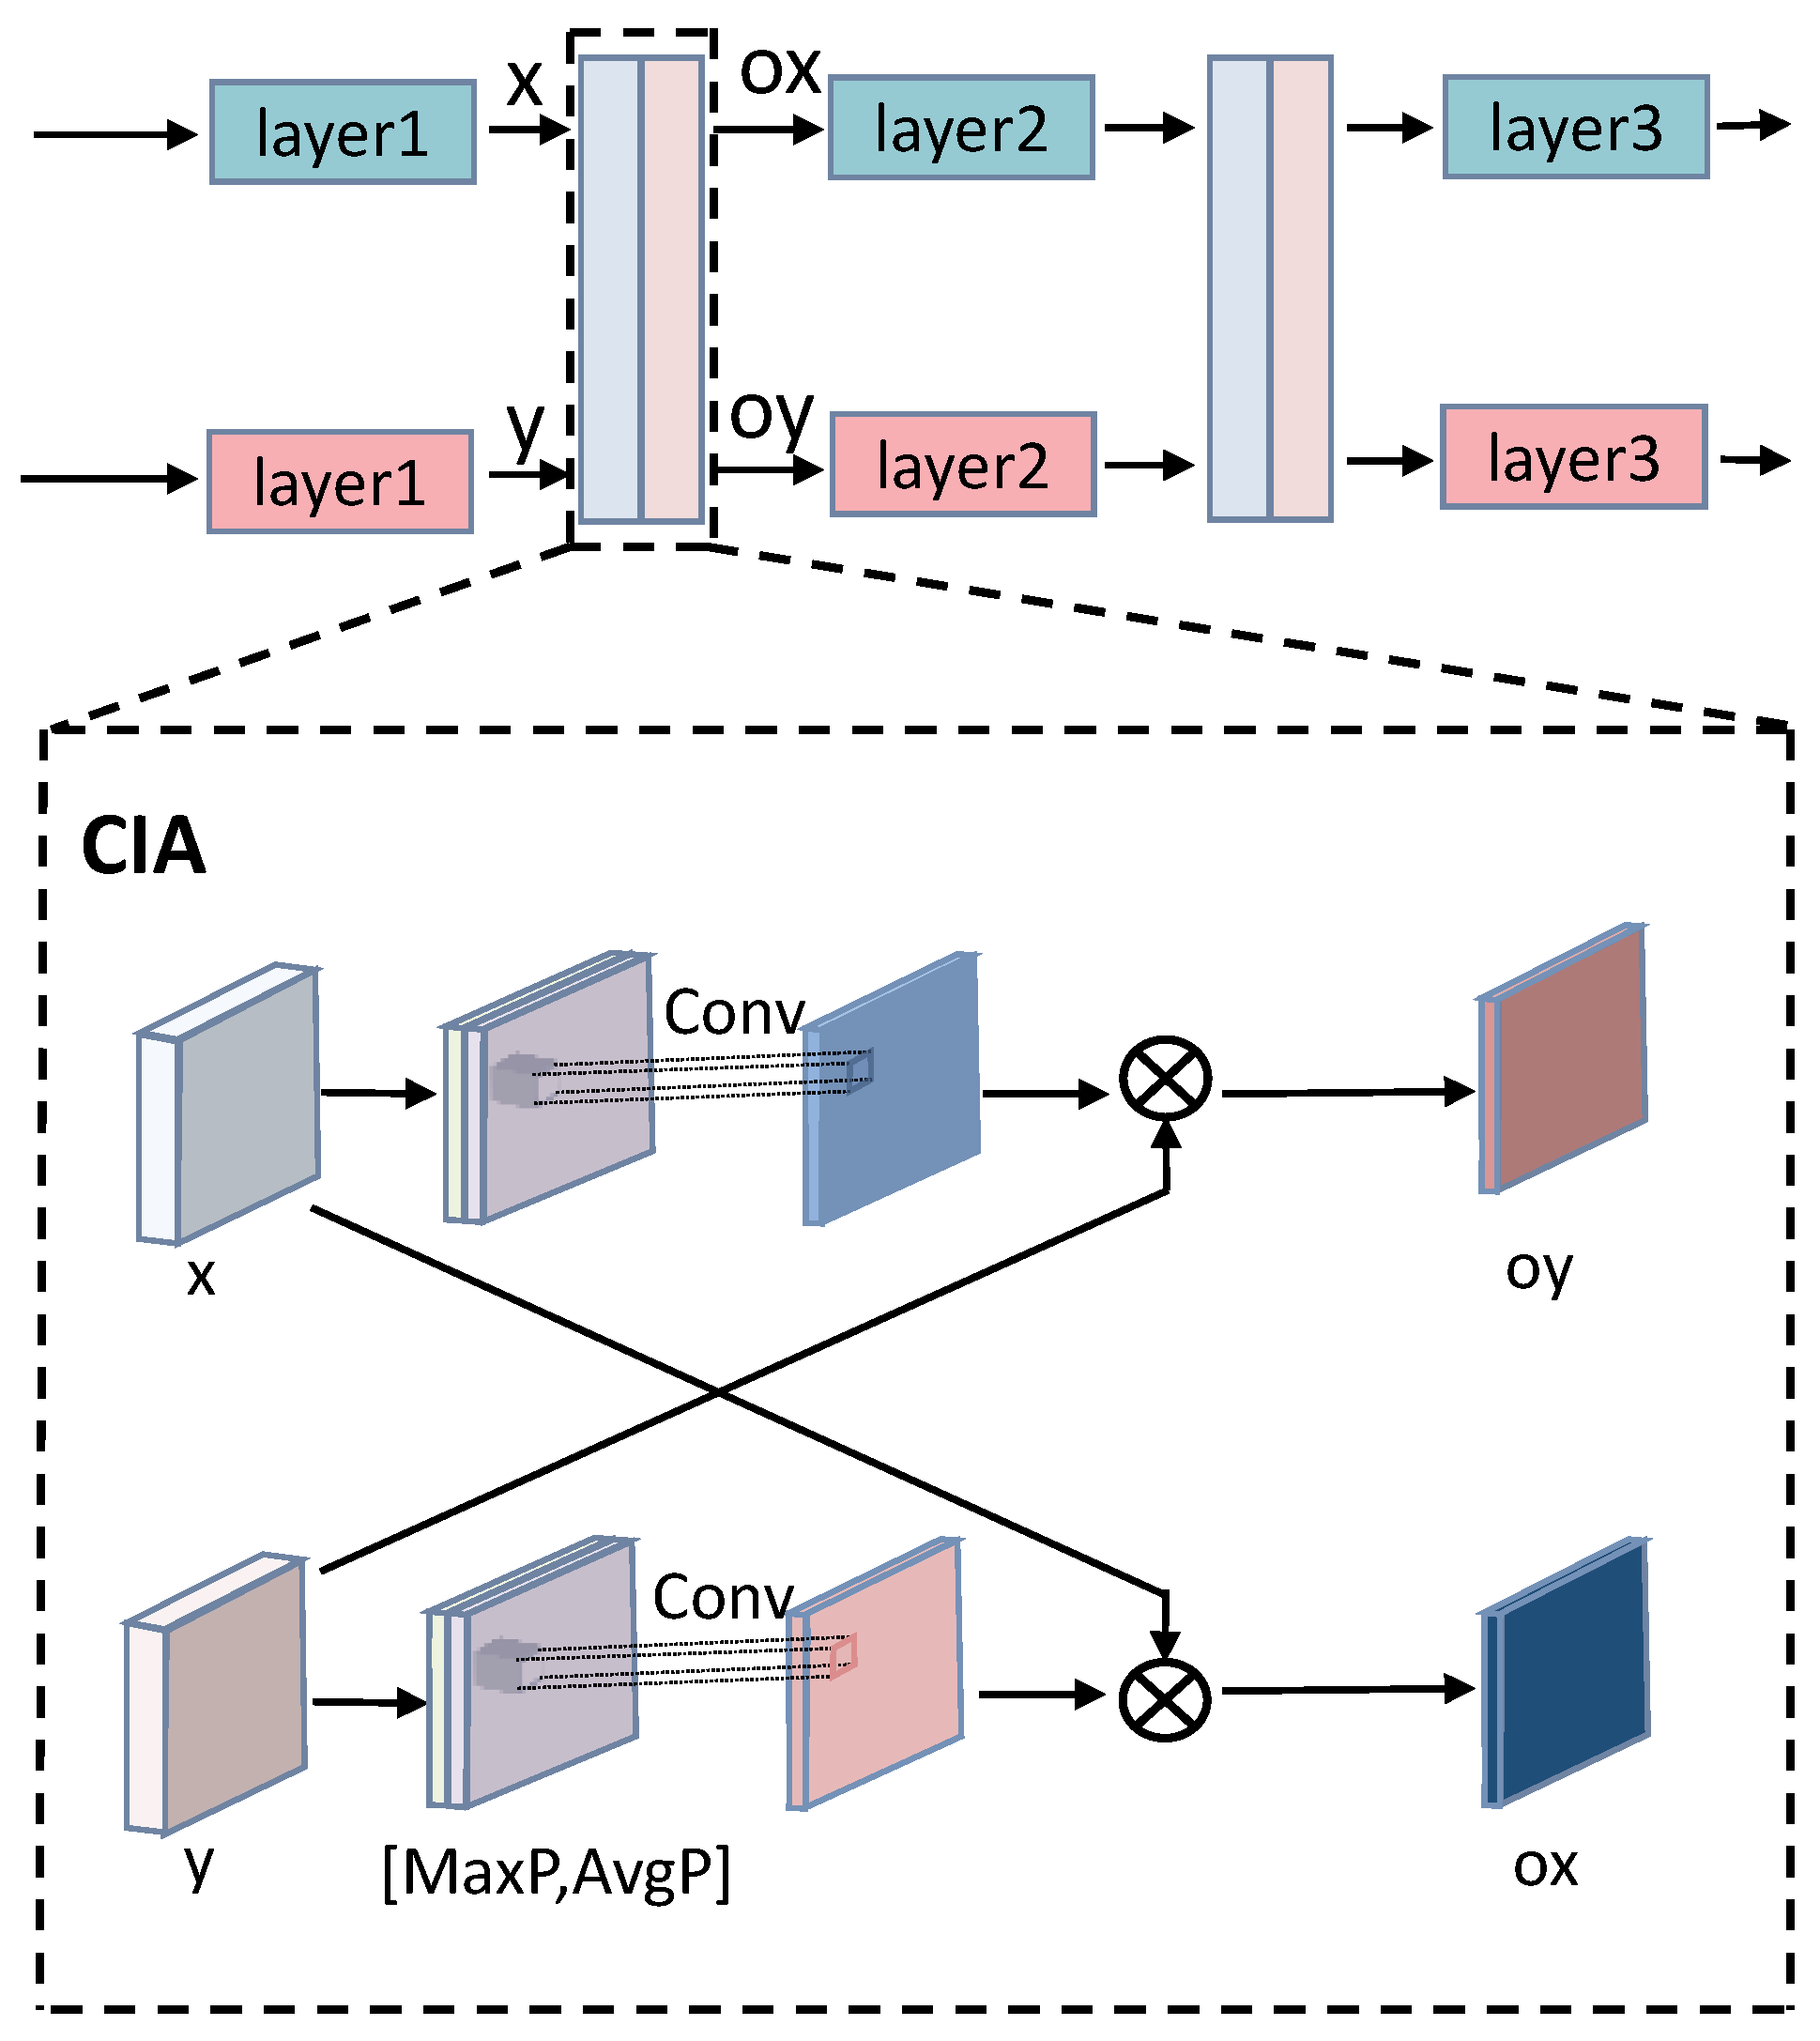
Relying solely on the pseudo-Siamese network structure can only ensure the independence of feature extraction across different modalities, without achieving effective interaction and knowledge sharing between the two modalities. Thus, we introduce the CIA module in the network to enhance the learning capabilities across different modalities. The CIA module is designed to highlight salient structural regions in images. Through cross-modal learning, it adjusts the weight and attention distributions across locations in one modality based on information from the other. This not only helps the model to better capture the spatial structure in the input data but also improves the quality of feature representation.
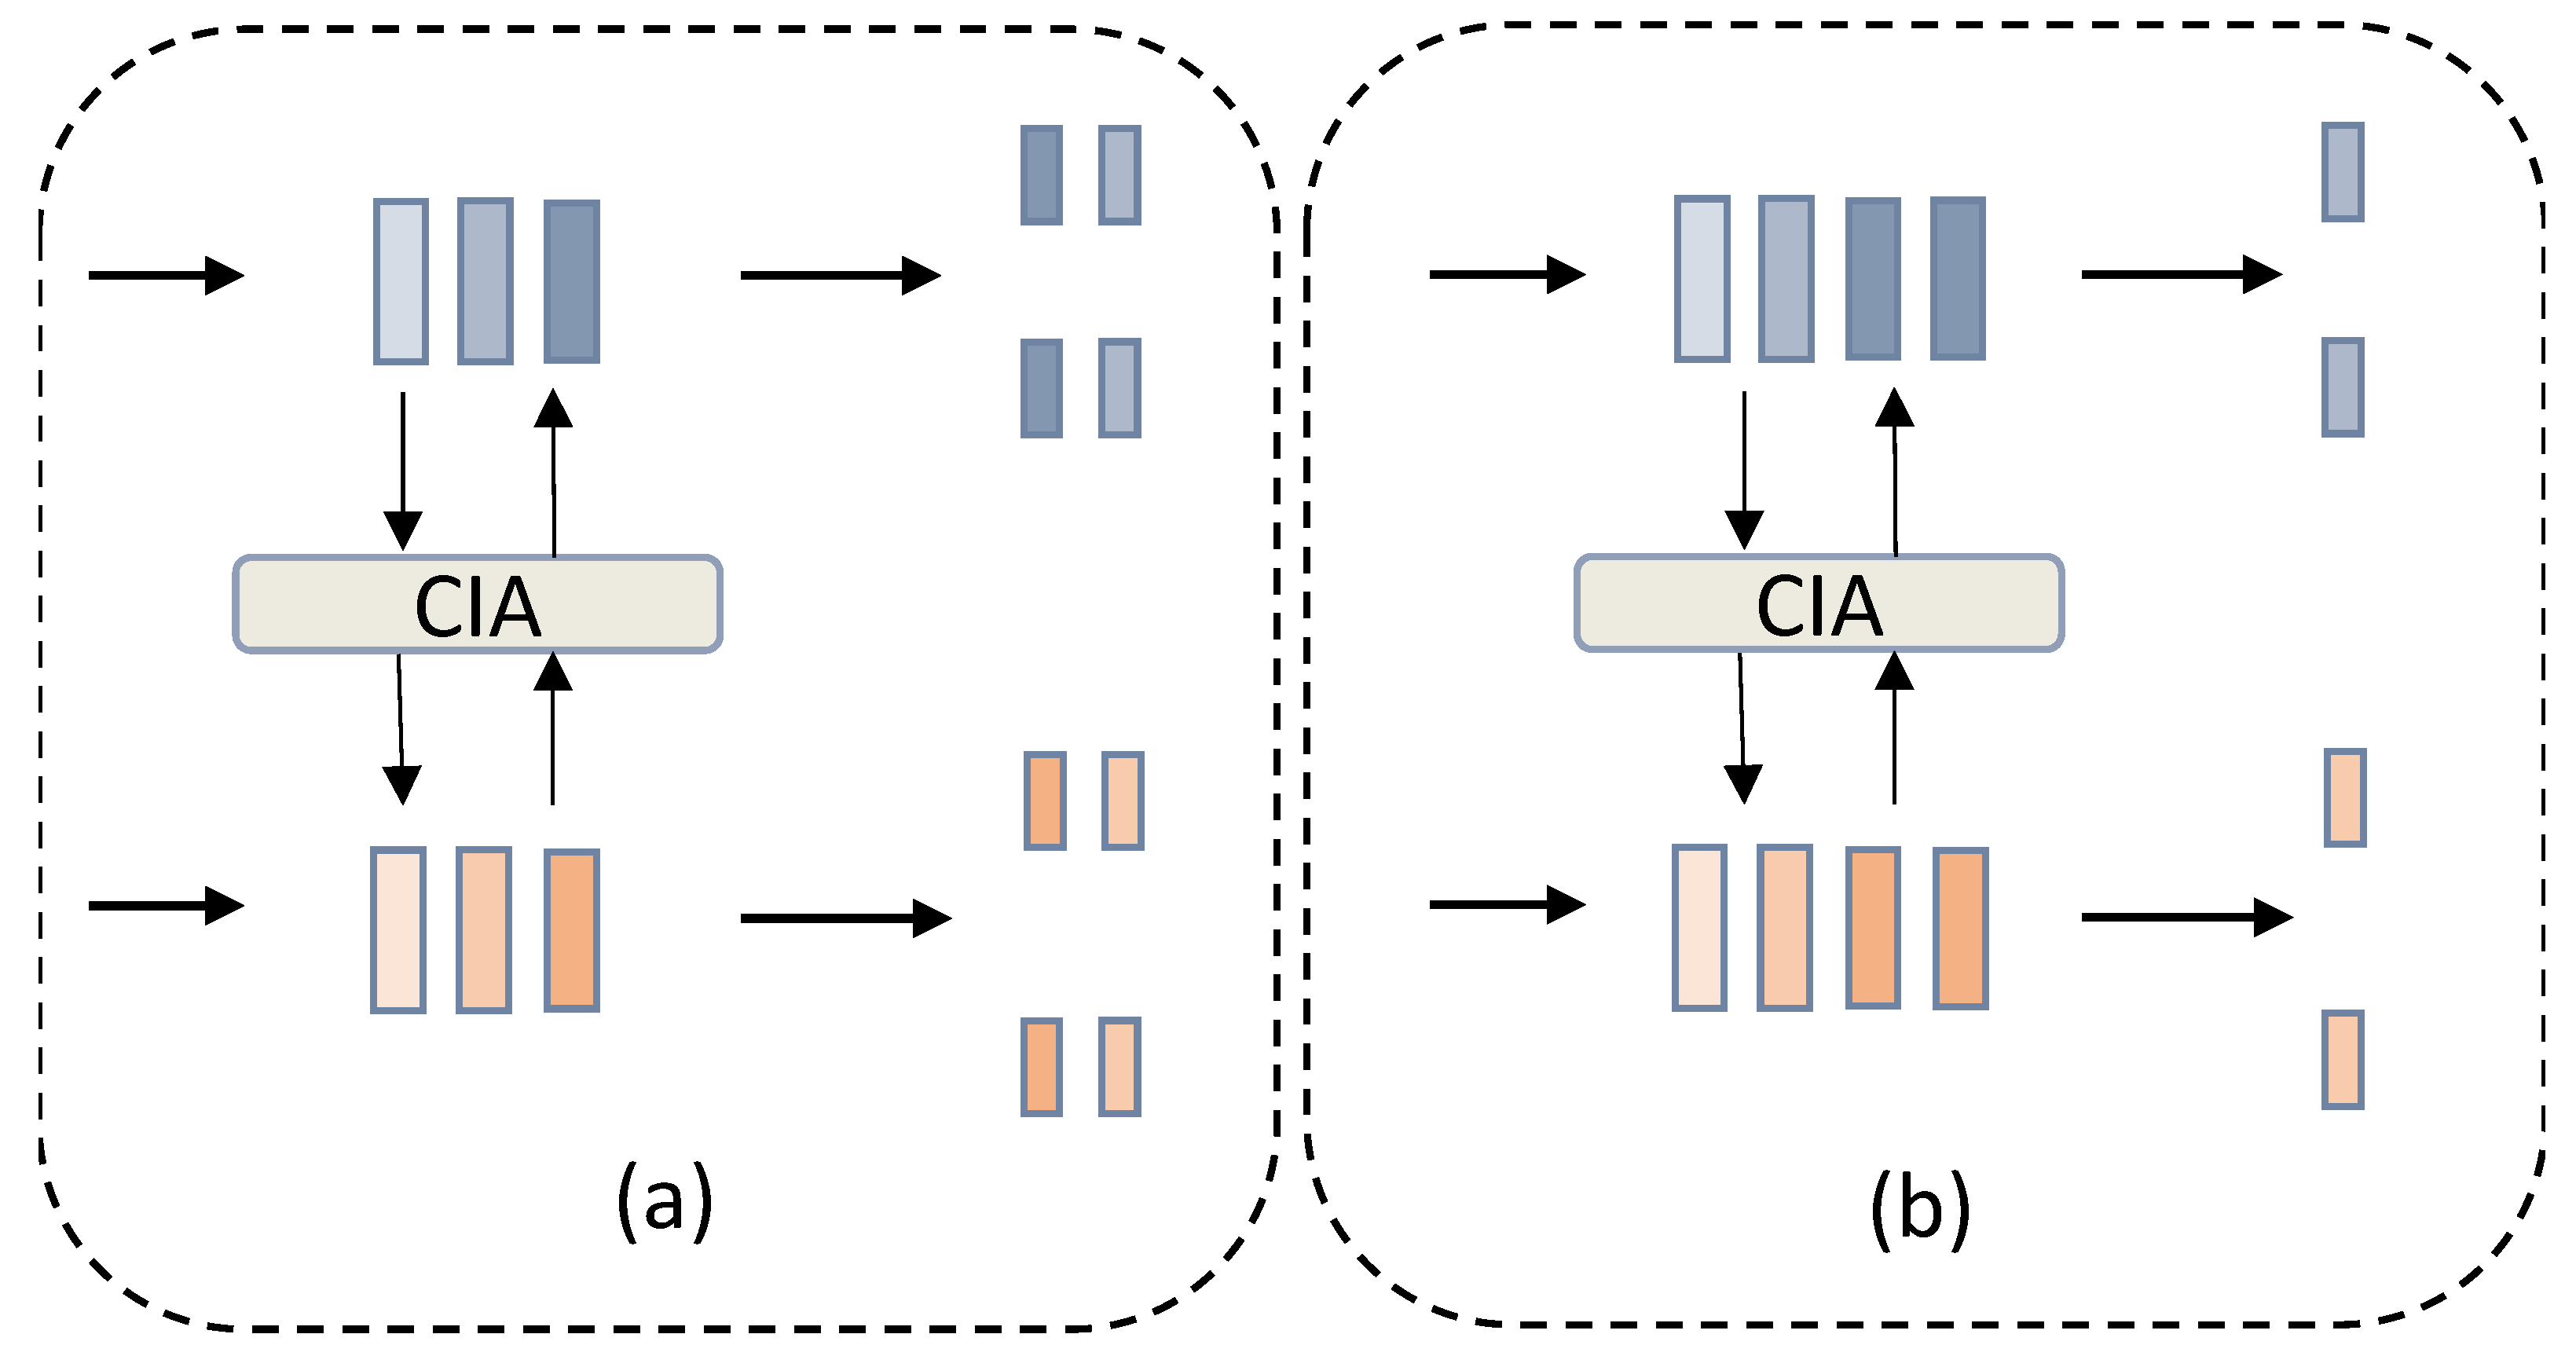
As shown in Figure 3, the CIA module performs max pooling and average pooling operations on the feature map of one modality to capture the global contextual information of this modality. Then, the results of these two pooling operations are concatenated and processed through a 1 × 1 convolutional layer to generate a set of spatial attention weights. These spatial attention weights are subsequently multiplied with the feature map of the other modality, emphasizing the salient parts that both modalities focus on while suppressing irrelevant or interfering regions. The fused feature map integrates the key information from both modalities, enhancing the consistency and complementarity of the cross-modal features.

3.3. Loss Function

The final loss of our network comprises four parts: L1 for optical image feature point localization, L2 for descriptor matching between optical and transformed SAR images, L3 for SAR image feature point localization, and L4 for descriptor matching between SAR and transformed optical images. The formula is as follows:
L = L 1 + λ L 2 + L 3 + λ L 4
where, λ is a pivotal hyperparameter that balances the contributions between the task of keypoint detection and the task of descriptor learning. A higher λ value encourages the network to focus on learning discriminative descriptors for matching, while a lower λ prioritizes the accurate localization of feature points. The optimal value of λ is determined through ablation studies, as detailed in Section 4.9. The feature point loss is defined as
L 1 , 3 = 1 H C W C h = 1 , w = 1 H C W C log e X h w [ y h w ] k = 1 65 e X h w [ k ]
The shape of the feature map of the feature points output by the network is ( H C , W C , 65 ) , where y h w represents the ground truth label, X h w [ y h w ] is the predicted value for the class y h w , and X h w [ k ] ( k = 1 , 2 , , 65 ) denotes the predicted values for other classes. This cross-entropy loss function treats all categories equally. When y h w = 65 , the network is forced to learn high-probability predictions for the garbage bin category; when y h w is a position index, the network is forced to learn probability predictions for the corresponding feature point location. The descriptor loss is defined as
s = 1 , if H · P h w P h w 8 0 , otherwise
L 2 , 4 = 1 ( H C W C ) 2 h = 1 , w = 1 H C , W C h = 1 , w = 1 H C , W C l ( d , d , s )
In computing the descriptor loss, a function l ( d , d , s ) is defined as l ( d , d , s ) = λ d × s × max ( 0 , m p d T d ) + ( 1 s ) × max ( 0 , d T d m n ) . Here, P h w and P h w represent the keypoints at the center positions of the ( h , w ) cells in the two images, while d and d denote the descriptor vectors corresponding to each cell in the two images. The hyperparameters within the descriptor loss function—the weighting term λ d and the margins m p , m n —are adopted directly from the SuperPoint design [8], as they effectively govern the internal balance of positive and negative pairs and have been proven to work well in practice. The weighting term λ d addresses the fact that negative correspondences vastly outnumber positive correspondences.

4. Results

In this section, we first present an overview of the primary metrics, relevant datasets, and the detailed experimental setup. Then, we compare the performance of the proposed innovative method with that of multiple existing baseline methods to verify its superiority. We then assess the impact of varying levels of image noise on registration accuracy and analyze the performance of two feature point and descriptor decoupling strategies. Furthermore, we systematically evaluate the effects of two distinct optimizers on the training stability and final performance of PLISA. Finally, comprehensive ablation studies and parameter analysis are conducted.

4.1. Evaluation Metrics

We evaluate the image registration performance using four metrics: the root mean square error (RMSE), matching success rate (SR), number of correctly matched points (NCM), and repeatability [3]. Among them, the repeatability metric is specifically designed to validate the quality of the extracted feature points. All metric values reported in the following represent averages computed over the complete test dataset.

4.1.1. RMSE

The RMSE is used to quantify the registration accuracy between the reference image and the target image after the predicted transformation, with smaller values indicating higher registration accuracy [68]. The RMSE is calculated as follows:
RMSE = 1 m i = 1 m ( x i o x i s ) 2 + ( y i o y i s ) 2
where ( x i o , y i o ) and ( x i s , y i s ) are the coordinates of the i-th correctly matched feature point pair in the reference image and the target image, respectively, after removing mismatched points using the FSC algorithm. The variable m represents the number of correct matching point pairs remaining after the FSC-based mismatch removal process.
The point ( x i o , y i o ) from the reference image is then transformed to obtain its predicted coordinates ( x i o , y i o ) in the target image. The RMSE is computed based on the differences between these predicted coordinates and the actual corresponding point coordinates ( x i s , y i s ) in the target image, providing an objective measure of the registration transformation accuracy.

4.1.2. NCM

NCM denotes the number of correct matches. This metric provides a direct measure of the number of feature points that are accurately matched between the reference and target images. The definition of a correct match is as follows [8]:
correct match = | X ( x , y ) T truth Y ( x , y ) | < 3
In this case, X ( x , y ) represents the feature point location of the target image after the predicted transformation, Y ( x , y ) denotes the corresponding feature point location on the target image after the actual transformation, and T truth refers to the actual transformation matrix.

4.1.3. SR

A match is considered successful when the RMSE for an image pair is below 3 pixels. The SR is calculated as the proportion of successfully matched pairs relative to the total number of pairs [44].

4.1.4. Repeatability (REP)

Repeatability simply measures the probability that a point is detected in the second image. We compute the repeatability by measuring the distances between the extracted 2D point centers [8]. More specifically, let us assume that we have N 1 points in the first image and N 2 points in the second image. Correctness in repeatability experiments is defined as follows: a point is considered correctly repeated if the distance from its corresponding point in the other image is below a threshold d. Empirically, d is set to 3 pixels [31,69,70]; hence, this metric is commonly referred to as the 3-pixel repeatability. In this work, we also adopt d = 3 as the threshold.
Corr ( x i ) = min j { 1 , , N 2 } x i x ^ j d
Rep = 1 N 1 + N 2 i Corr ( x i ) + j Corr ( x j )

4.2. Dataset

The experiment uses two public multimodal remote sensing image matching and registration datasets, SEN1-2 [71] and OSdataset [72]. The model’s performance is evaluated on the test splits of both the SEN1-2 dataset and OSdataset, with the latter used exclusively to further assess the generalizability to unseen data. Figure 4 shows three groups of multimodal image samples from OSdataset and the SEN1-2 dataset, where significant nonlinear radiometric differences between the SAR images [3] and the corresponding visible images can be clearly observed, posing an additional challenge for cross-modal image processing. The specifics of each dataset are as follows.
The SEN1-2 dataset [71] consists of SAR and optical image patches, with SAR images provided by the Sentinel-1 satellite and the corresponding optical images provided by Sentinel-2. All image patches are standardized to a size of 256 × 256 pixels, with a spatial resolution of 10 m. The training set consists of 9036 pairs and the test set consists of 1260 pairs.
OSdataset [72] contains co-registered SAR and optical image pairs in both 256 × 256 and 512 × 512 pixel sizes. In this study, we utilize the 256 × 256 version, which provides 10,692 image pairs with a 1-meter spatial resolution. From this collection, 1696 pairs of images were randomly chosen as the test set.
M4-SAR [73] is a multiresolution, multipolarization, multiscenario, and multisource dataset designed for object detection based on the fusion of optical and SAR images. It was jointly developed by the PCA Lab of Nanjing University of Science and Technology, the Key Laboratory of Intelligent Computing and Signal Processing of the Ministry of Education at Anhui University, and the College of Computer Science at Nankai University. The dataset contains 112,184 precisely aligned image pairs and nearly one million annotated instances. For the evaluation of the model’s generalization capabilities, we randomly selected 406 optical and SAR image pairs with a spatial resolution of 60 m as the test set.
The SEN12MS-CR [74] dataset comprises 122,218 patch triplets, each containing a Sentinel-1 SAR image, a Sentinel-2 optical image, and a cloud-covered Sentinel-2 optical image. From this collection, we randomly selected 383 cloud-covered optical and SAR image pairs to constitute the test set.
To address the challenge of partial overlap registration, we created the OSD-PO dataset, which is derived from the original OSdataset and consists of 1000 image pairs. These were constructed by first extracting 512 × 512 image patches from OSdataset, which were then cropped with controlled overlap ratios ranging from 50% to 80%. To simulate realistic imaging perturbations, we applied a series of geometric transformations: 70% of the pairs underwent slight translation, 20% were subjected to scale transformation, and the remaining 10% received combined rotation and scale transformations.

4.3. Experimental Details

All experiments were conducted using an NVIDIA RTX 3090 GPU. In the training process, we adopted Adam as an optimizer. Hyperparameters were set to λ = 1 and α = 0.15 . The positive margin m p for the descriptor hinge loss was set to 1, and the negative margin m n was set to 0.2. Prior to the commencement of the experiments, necessary data preprocessing steps were applied to the SAR images to enhance the image quality and improve the subsequent processing results, including histogram equalization and Lee filtering.

4.4. Comparative Experiments

We evaluated seven state-of-the-art methods alongside our proposed approach across three different scenarios: slight translation, scale transformation, and rotation and scale transformation. Here, slight translation refers to minimal global image displacement, typically constrained to a range of ±5 pixels, without involving scale, rotation, or perspective alterations. Scaling transformation is achieved by sampling random scale factors from a truncated normal distribution centered at 1.0 with a ±10% amplitude. The rotation and scale transformations simultaneously applied random rotation across a continuous range of −90° to +90° and scaling within the range of 0.9–1.1. Additionally, all methods were tested on the partially overlapping OSD-PO dataset. The seven methods are RIFT (2019) [35], Superpoint (2017) [8], CMM-Net (2021) [5], ReDFeat (2022) [6], ADRNet (2024) [57], MINIMA-LG (2024) [75], and MINIMA-RoMa (2024) [75], as shown in Table 1.

4.4.1. Slight Translation Scenario

Evaluations of RIFT, Superpoint, CMM-Net, ReDFeat, ADRNet, MINIMA-LG, MINIMA-RoMa, and the proposed method on the SEN1-2 dataset and OSdataset under slight translation transformations reveal varying performance levels. The corresponding quantitative evaluation results are provided in Table 2.
On the SEN1-2 dataset, the proposed method achieves an SR of 100%, matching ReDFeat and ADRNet while significantly outperforming RIFT (72.619%), Superpoint (0%), and CMM-Net (4.360%). In terms of overall performance, MINIMA-RoMa also demonstrates impressive results across multiple metrics, particularly achieving an exceptionally high NCM, which is attributed to its detector-free matching paradigm that involves dense pixel-level correspondence. Our method attains a competitively high NCM while maintaining computational efficiency. Most notably, our approach achieves the lowest RMSE and the highest repeatability, demonstrating superior matching accuracy and robustness. Our method maintains competitive efficiency while delivering substantially improved matching precision.
Similar trends are observed on OSdataset, where our method again achieves a near-perfect SR (99.7%), exceeding ReDFeat (65.5%), ADRNet (77.83%), and RIFT (72.465%). Its NCM is also significantly lower than that of MINIMA-RoMa, but our method achieves the lowest RMSE and the highest repeatability. Superpoint and CMM-Net exhibit notably poor performance across all metrics. These results underscore our method’s effectiveness under slight translational deformations.
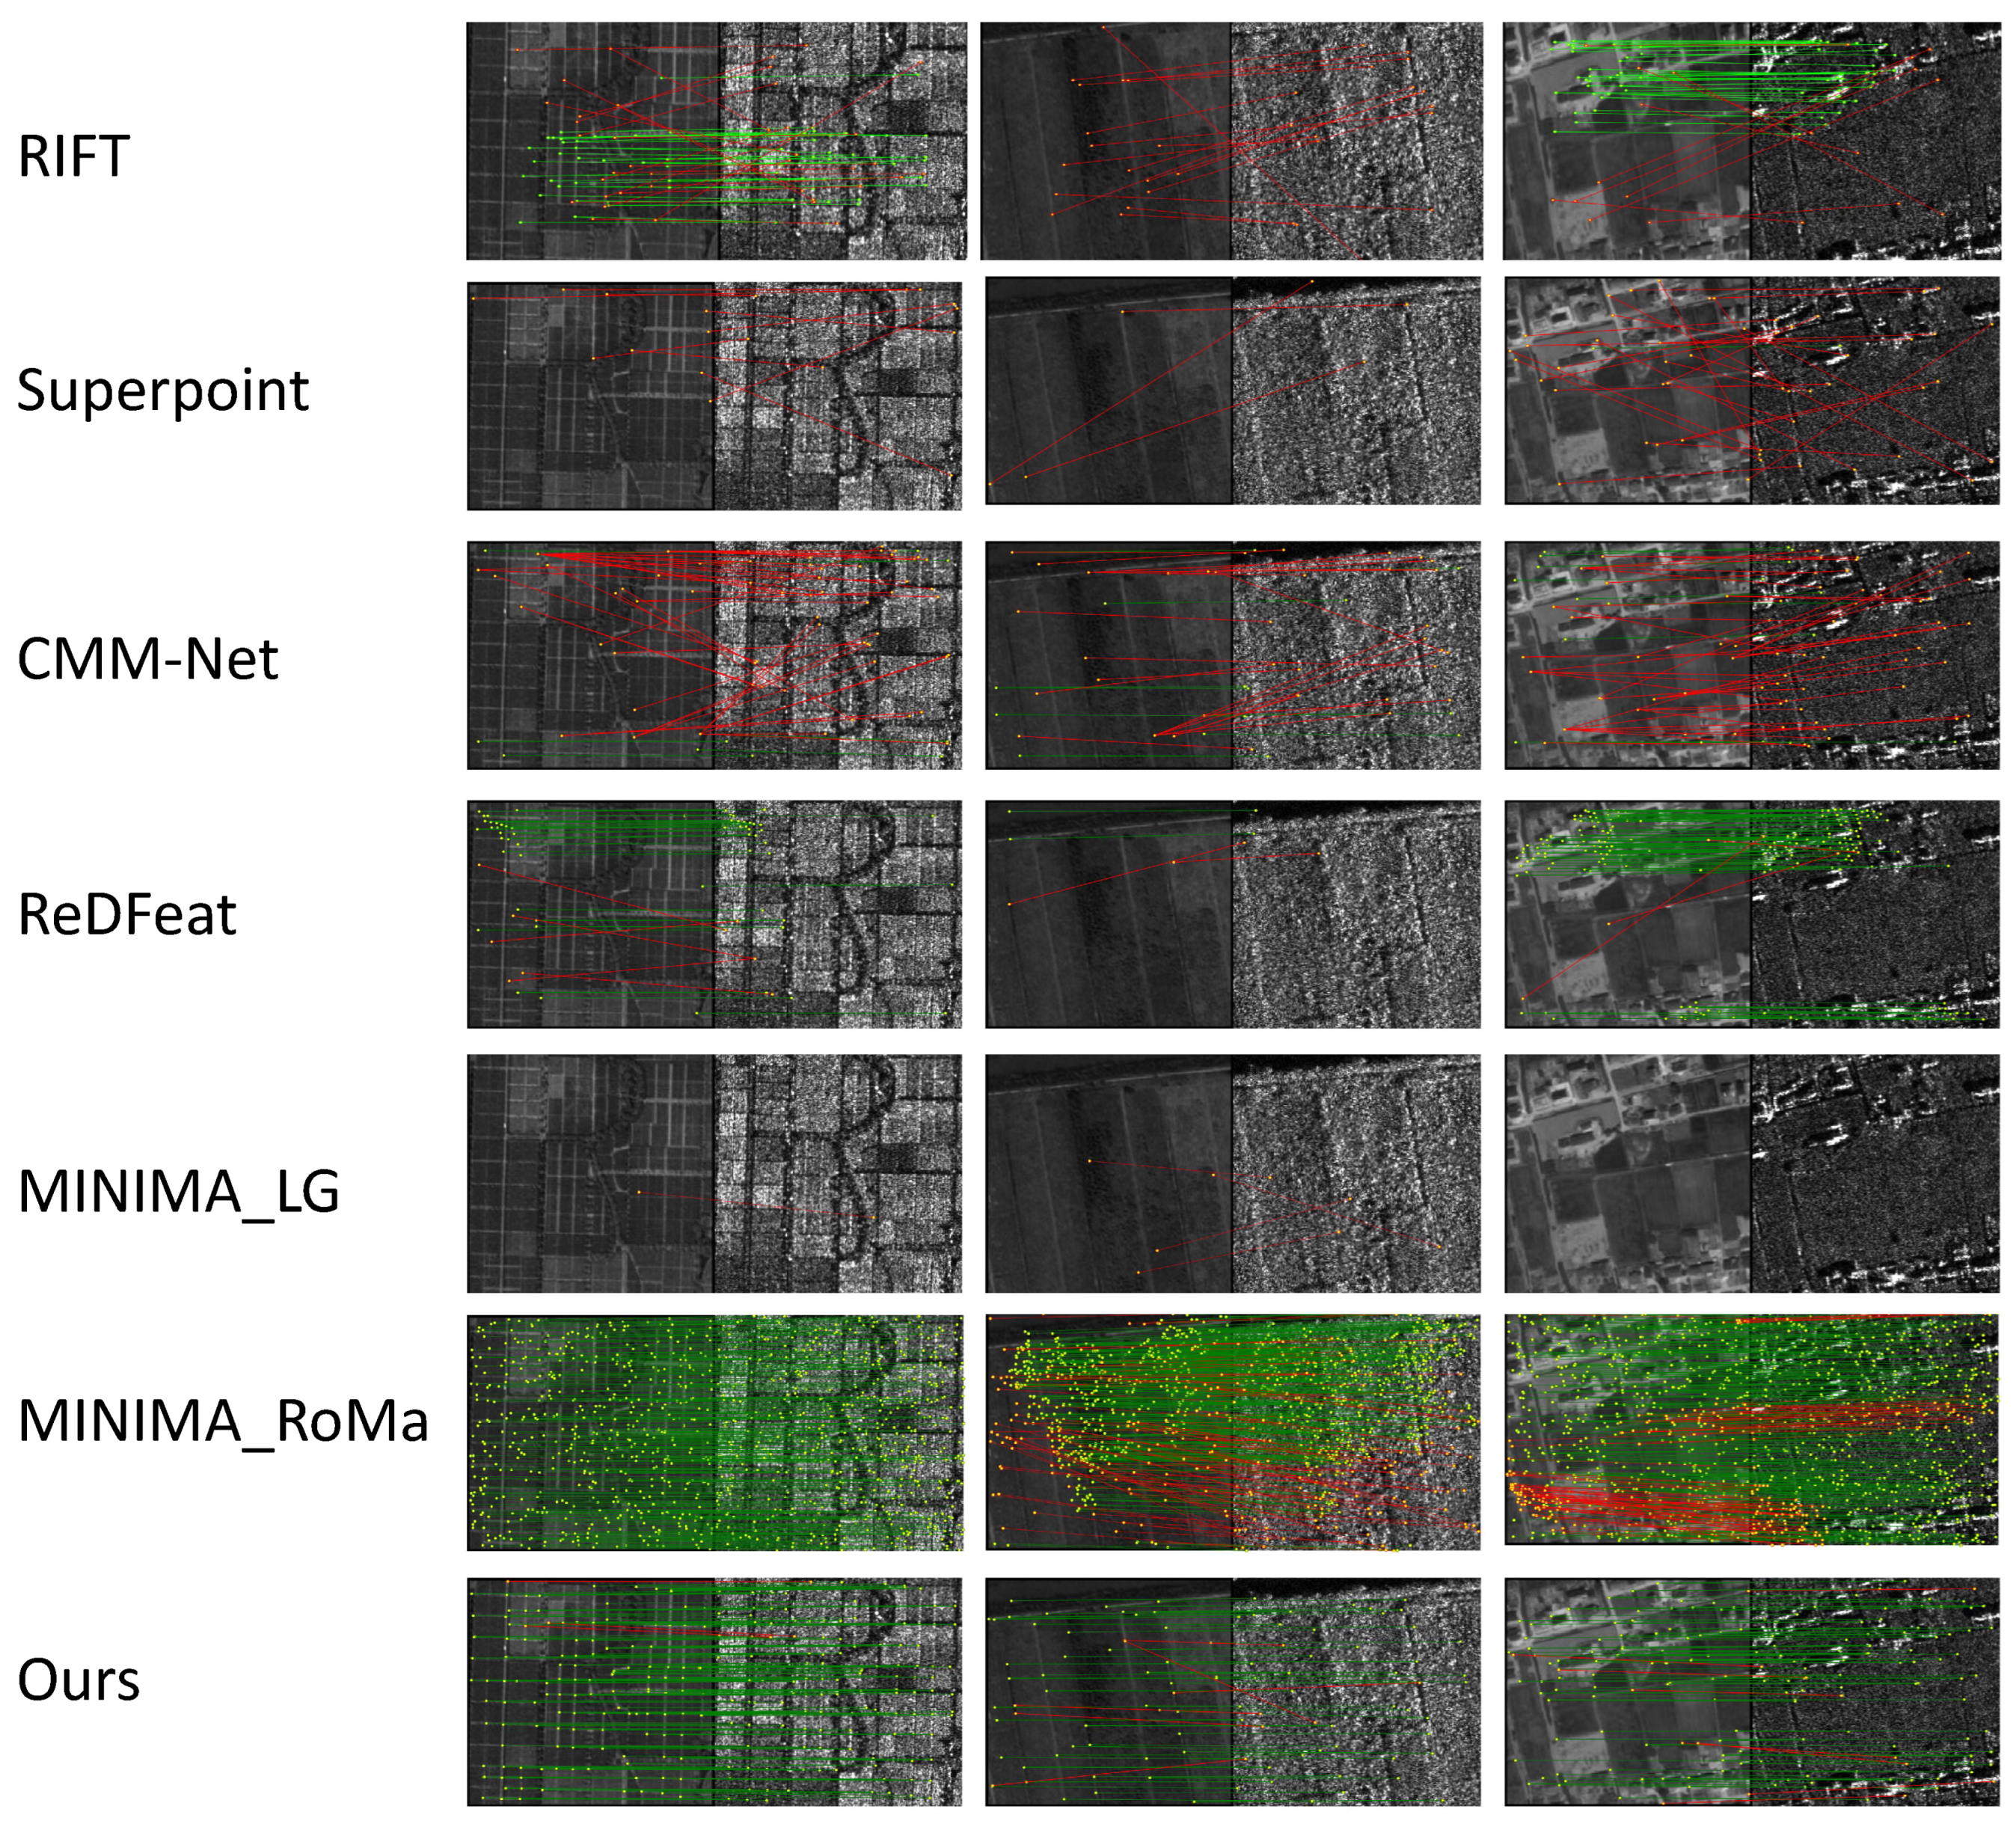
The qualitative results in Figure 5 and Figure 6 visually corroborate the quantitative findings. Among all competitors, MINIMA-RoMa also produces commendable registration results, followed by ReDFeat, which shows relatively good performance. Nevertheless, the proposed method consistently yields the most reliable matches.
In summary, the proposed method demonstrates consistently superior performance across both datasets, proving highly robust and accurate under translation transformations.

4.4.2. Scale Transformation Scenario

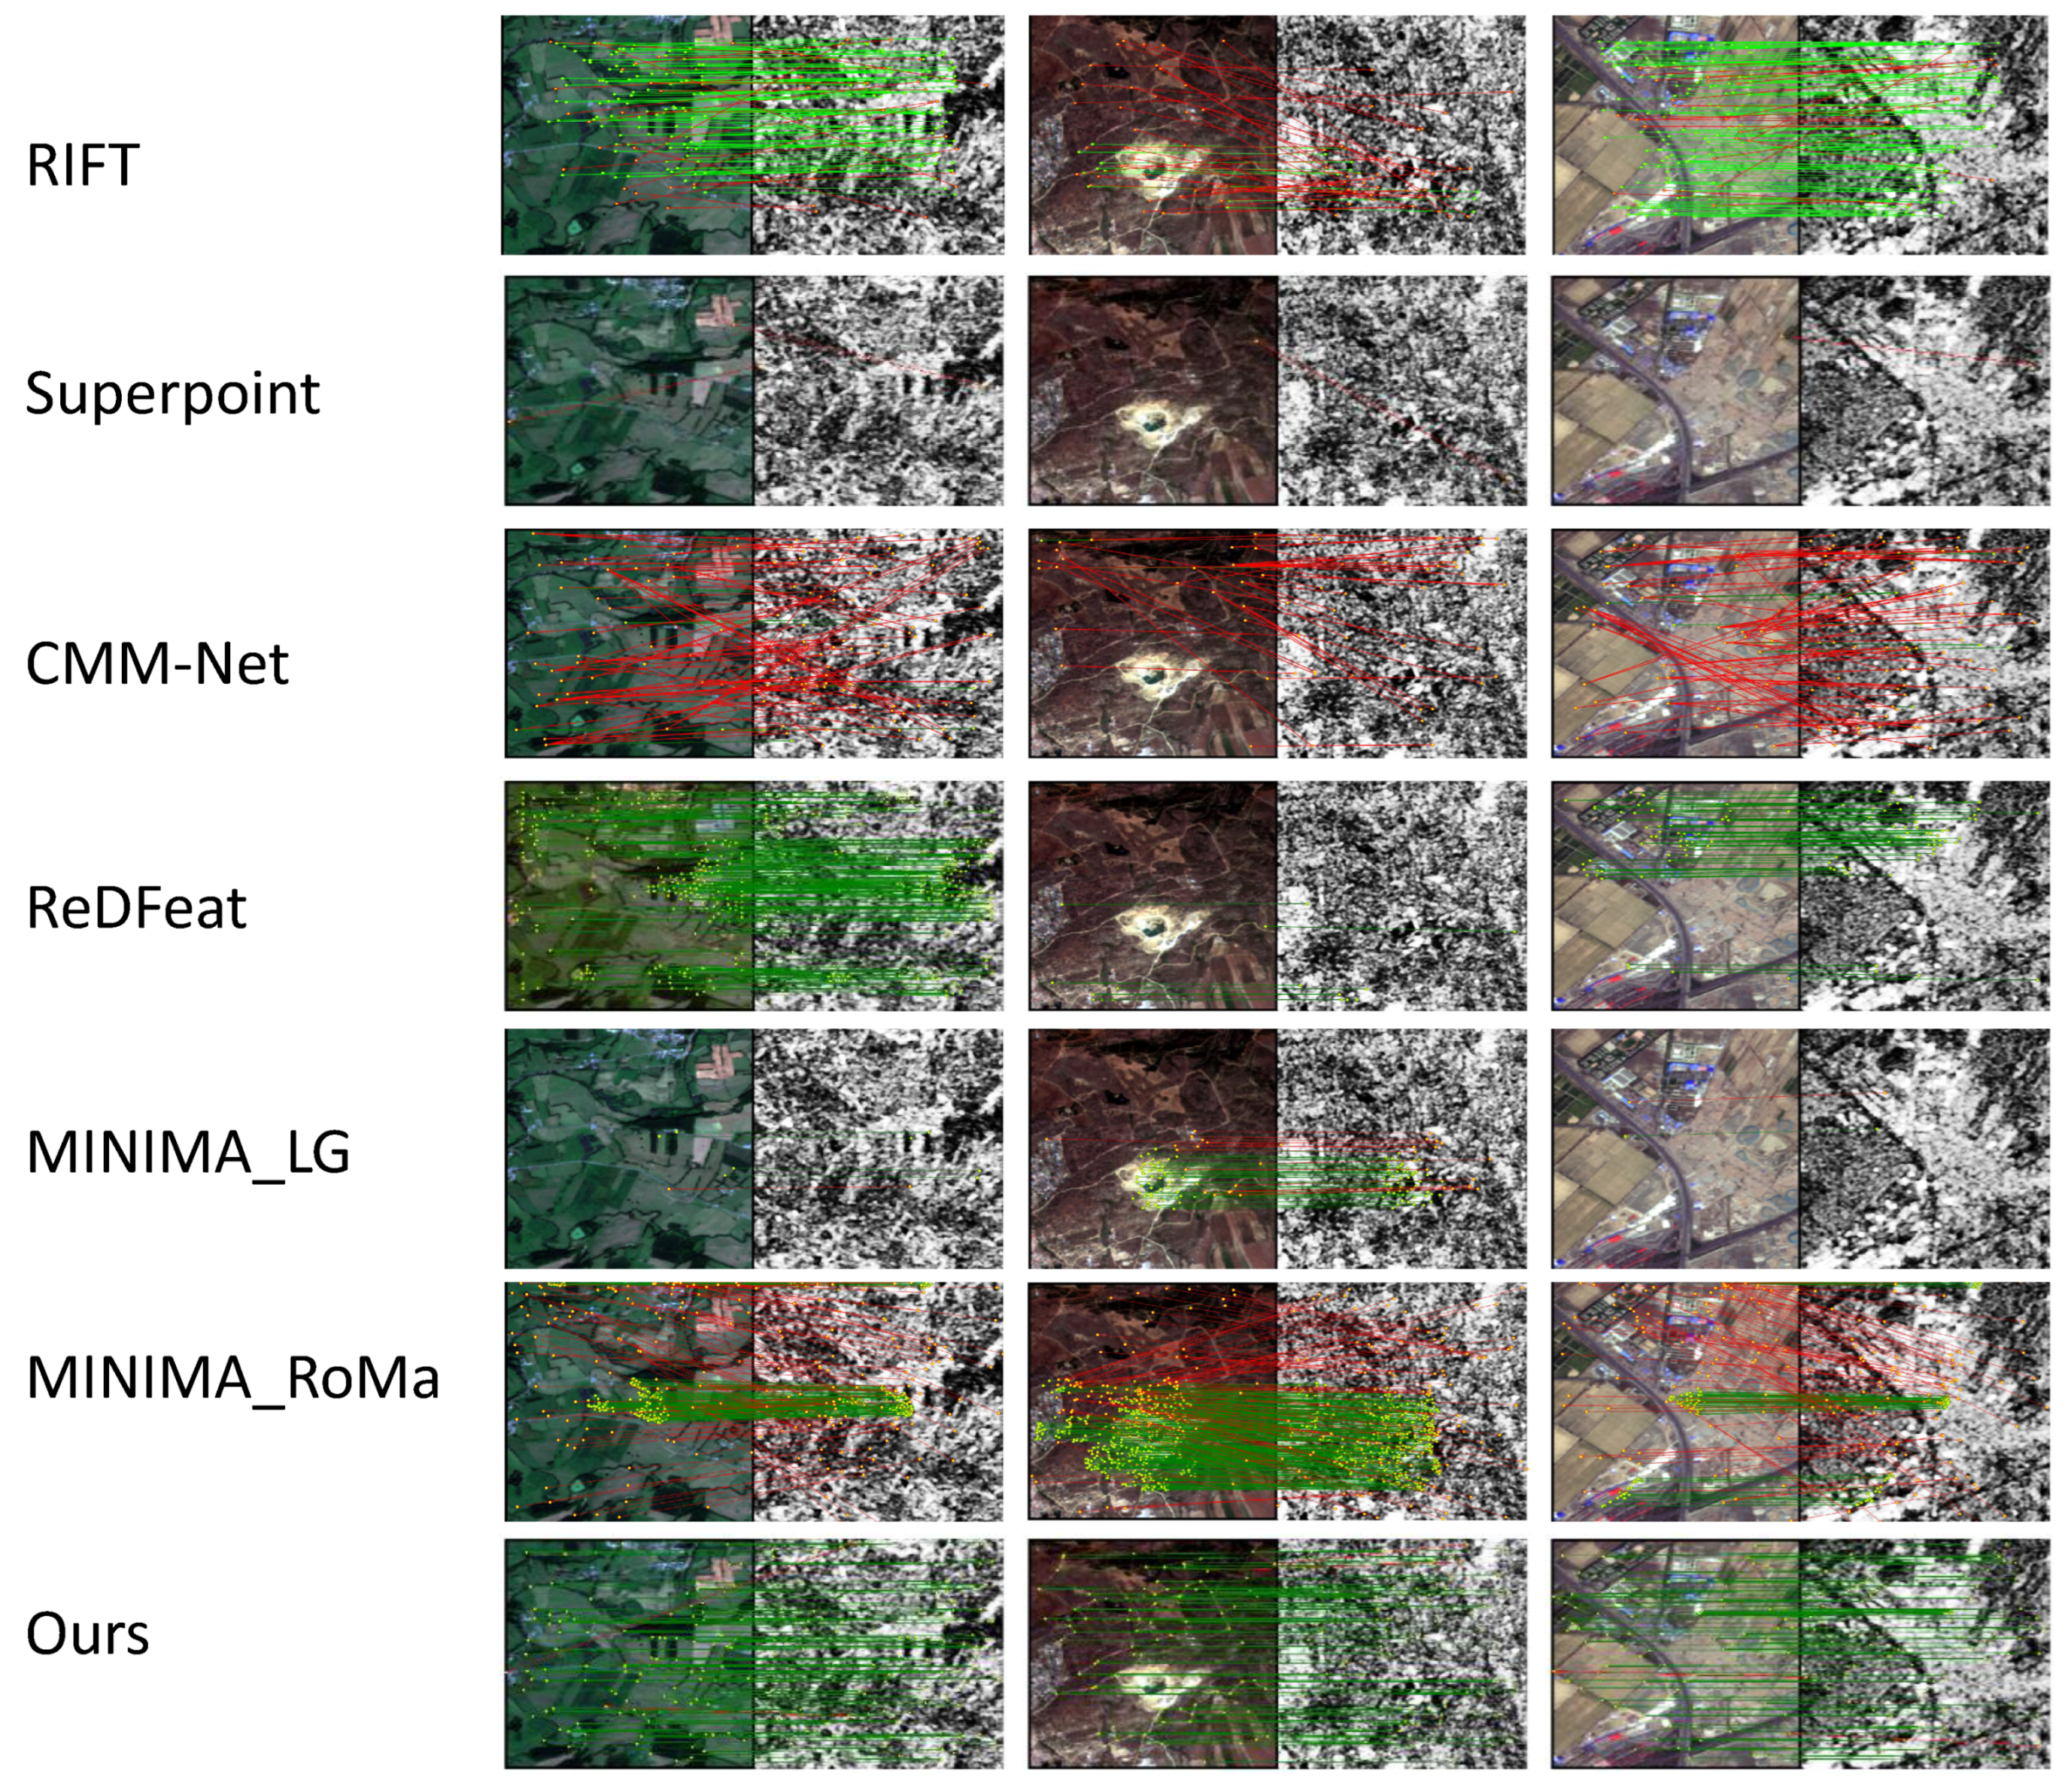
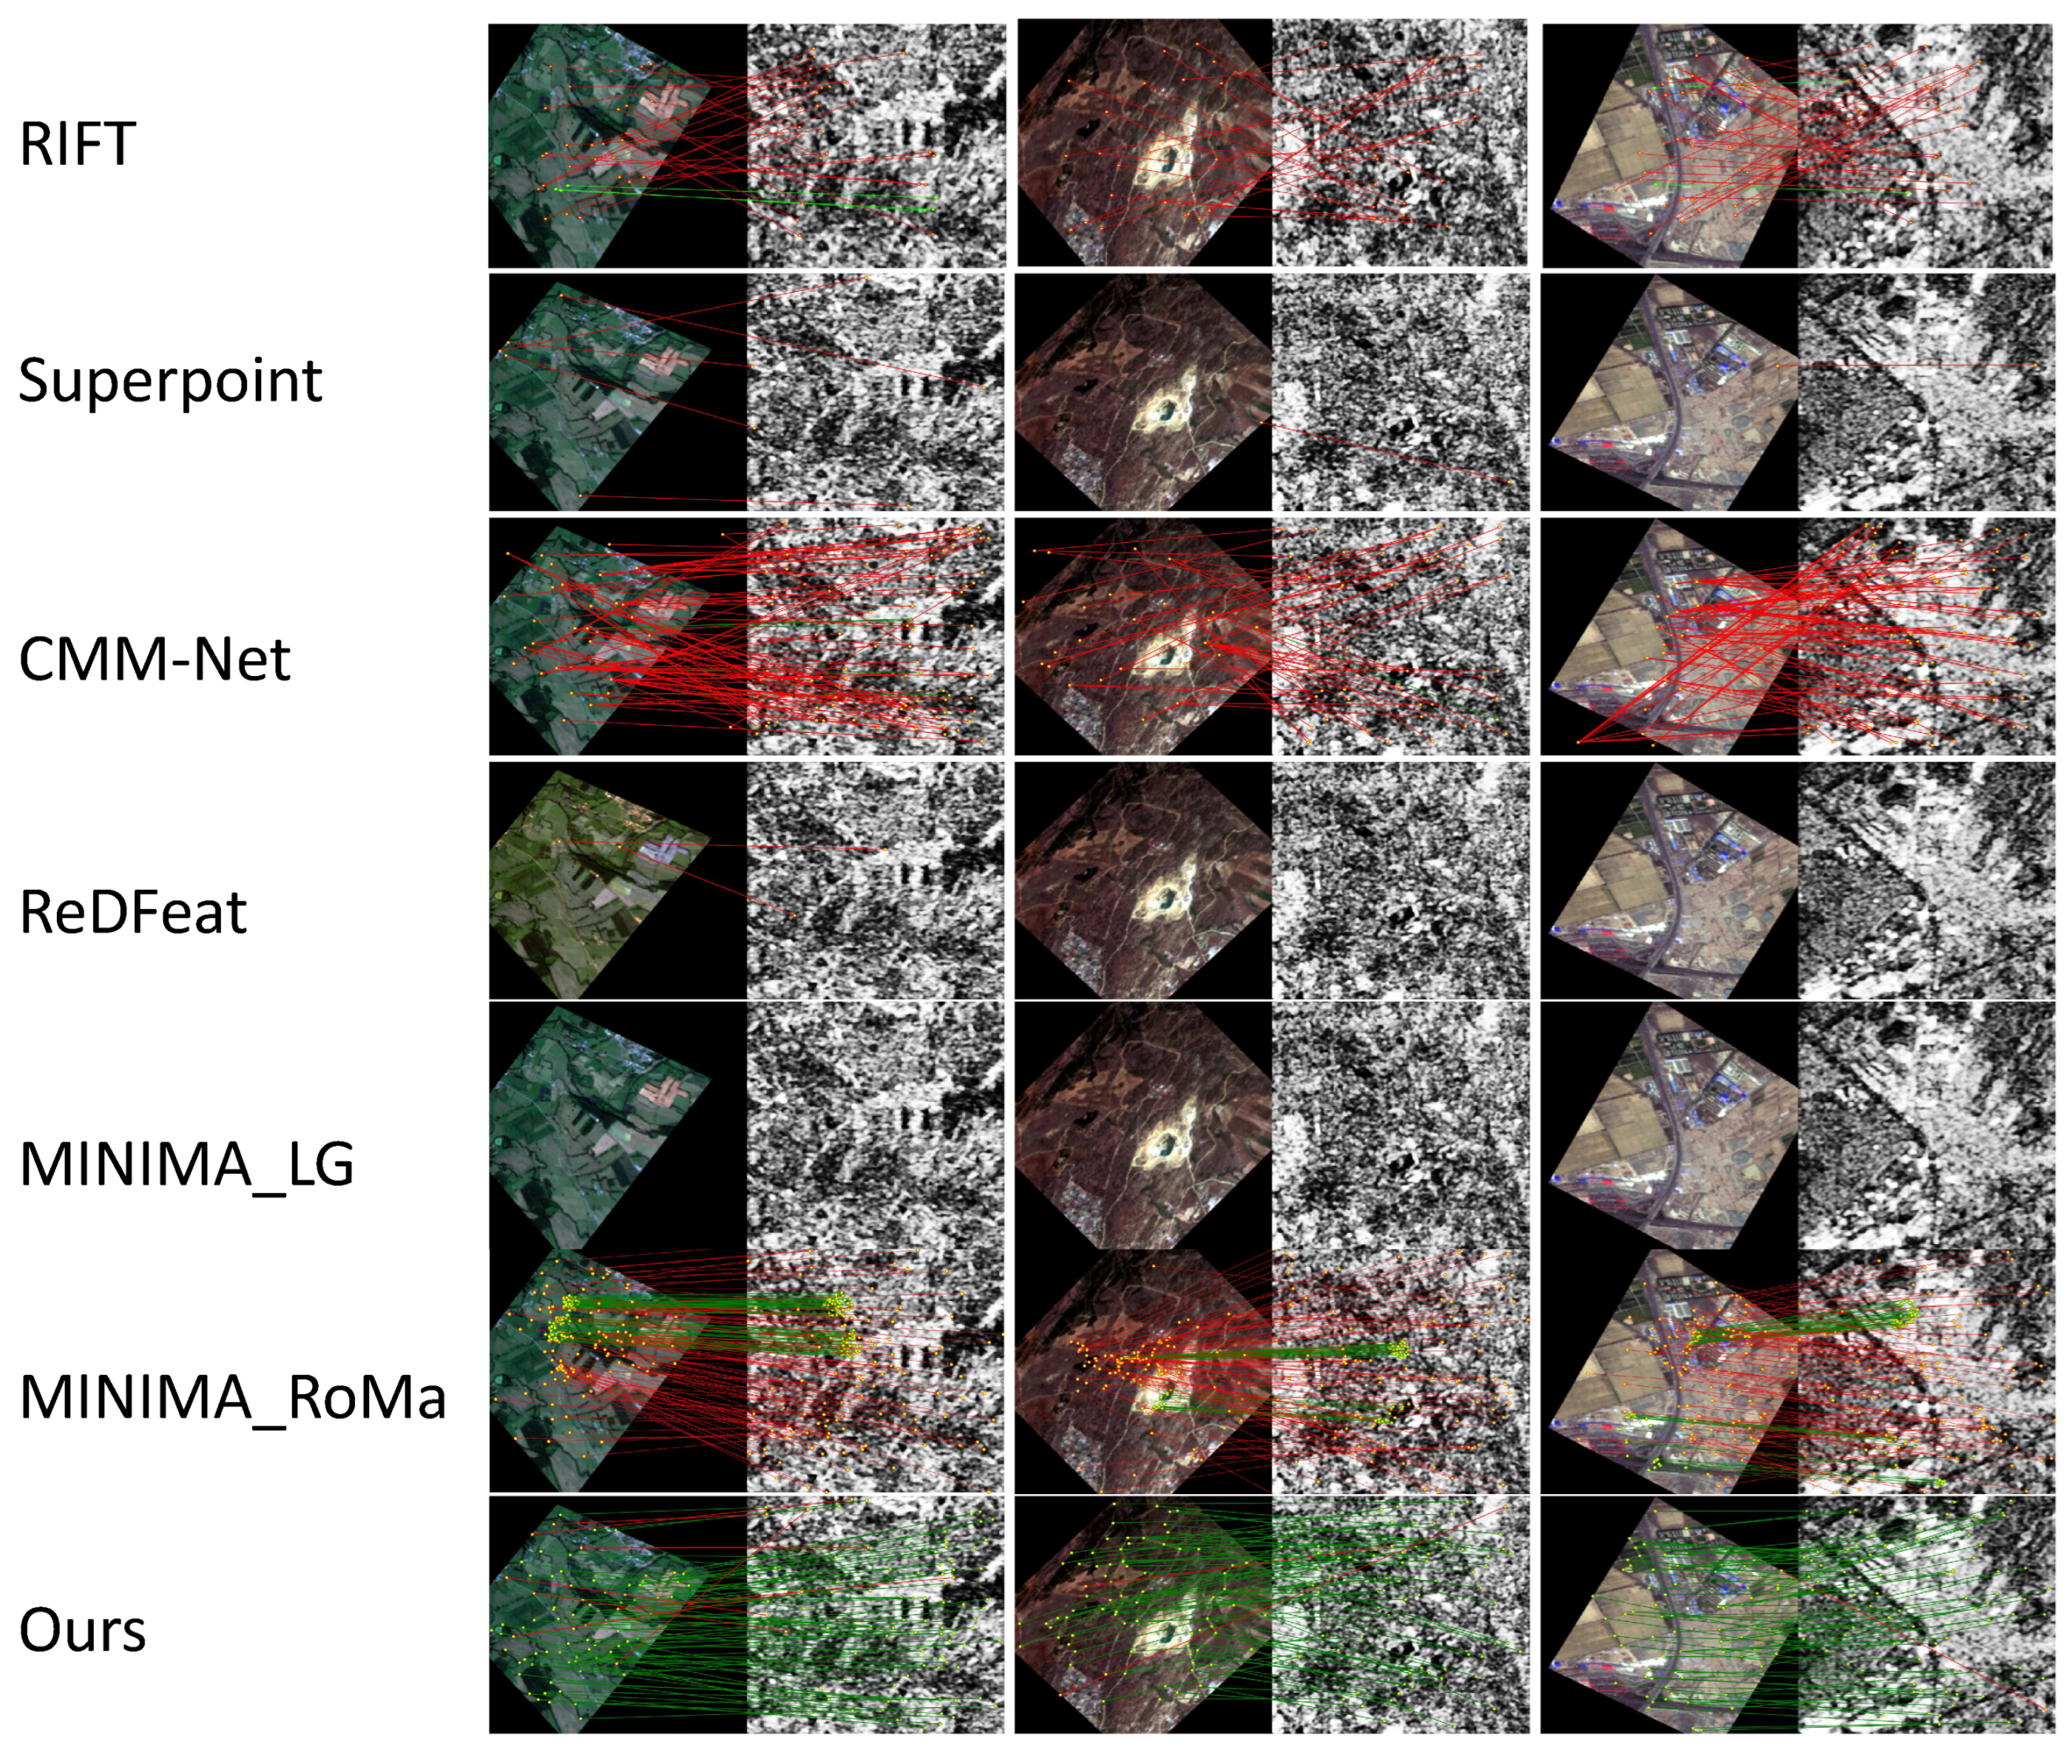
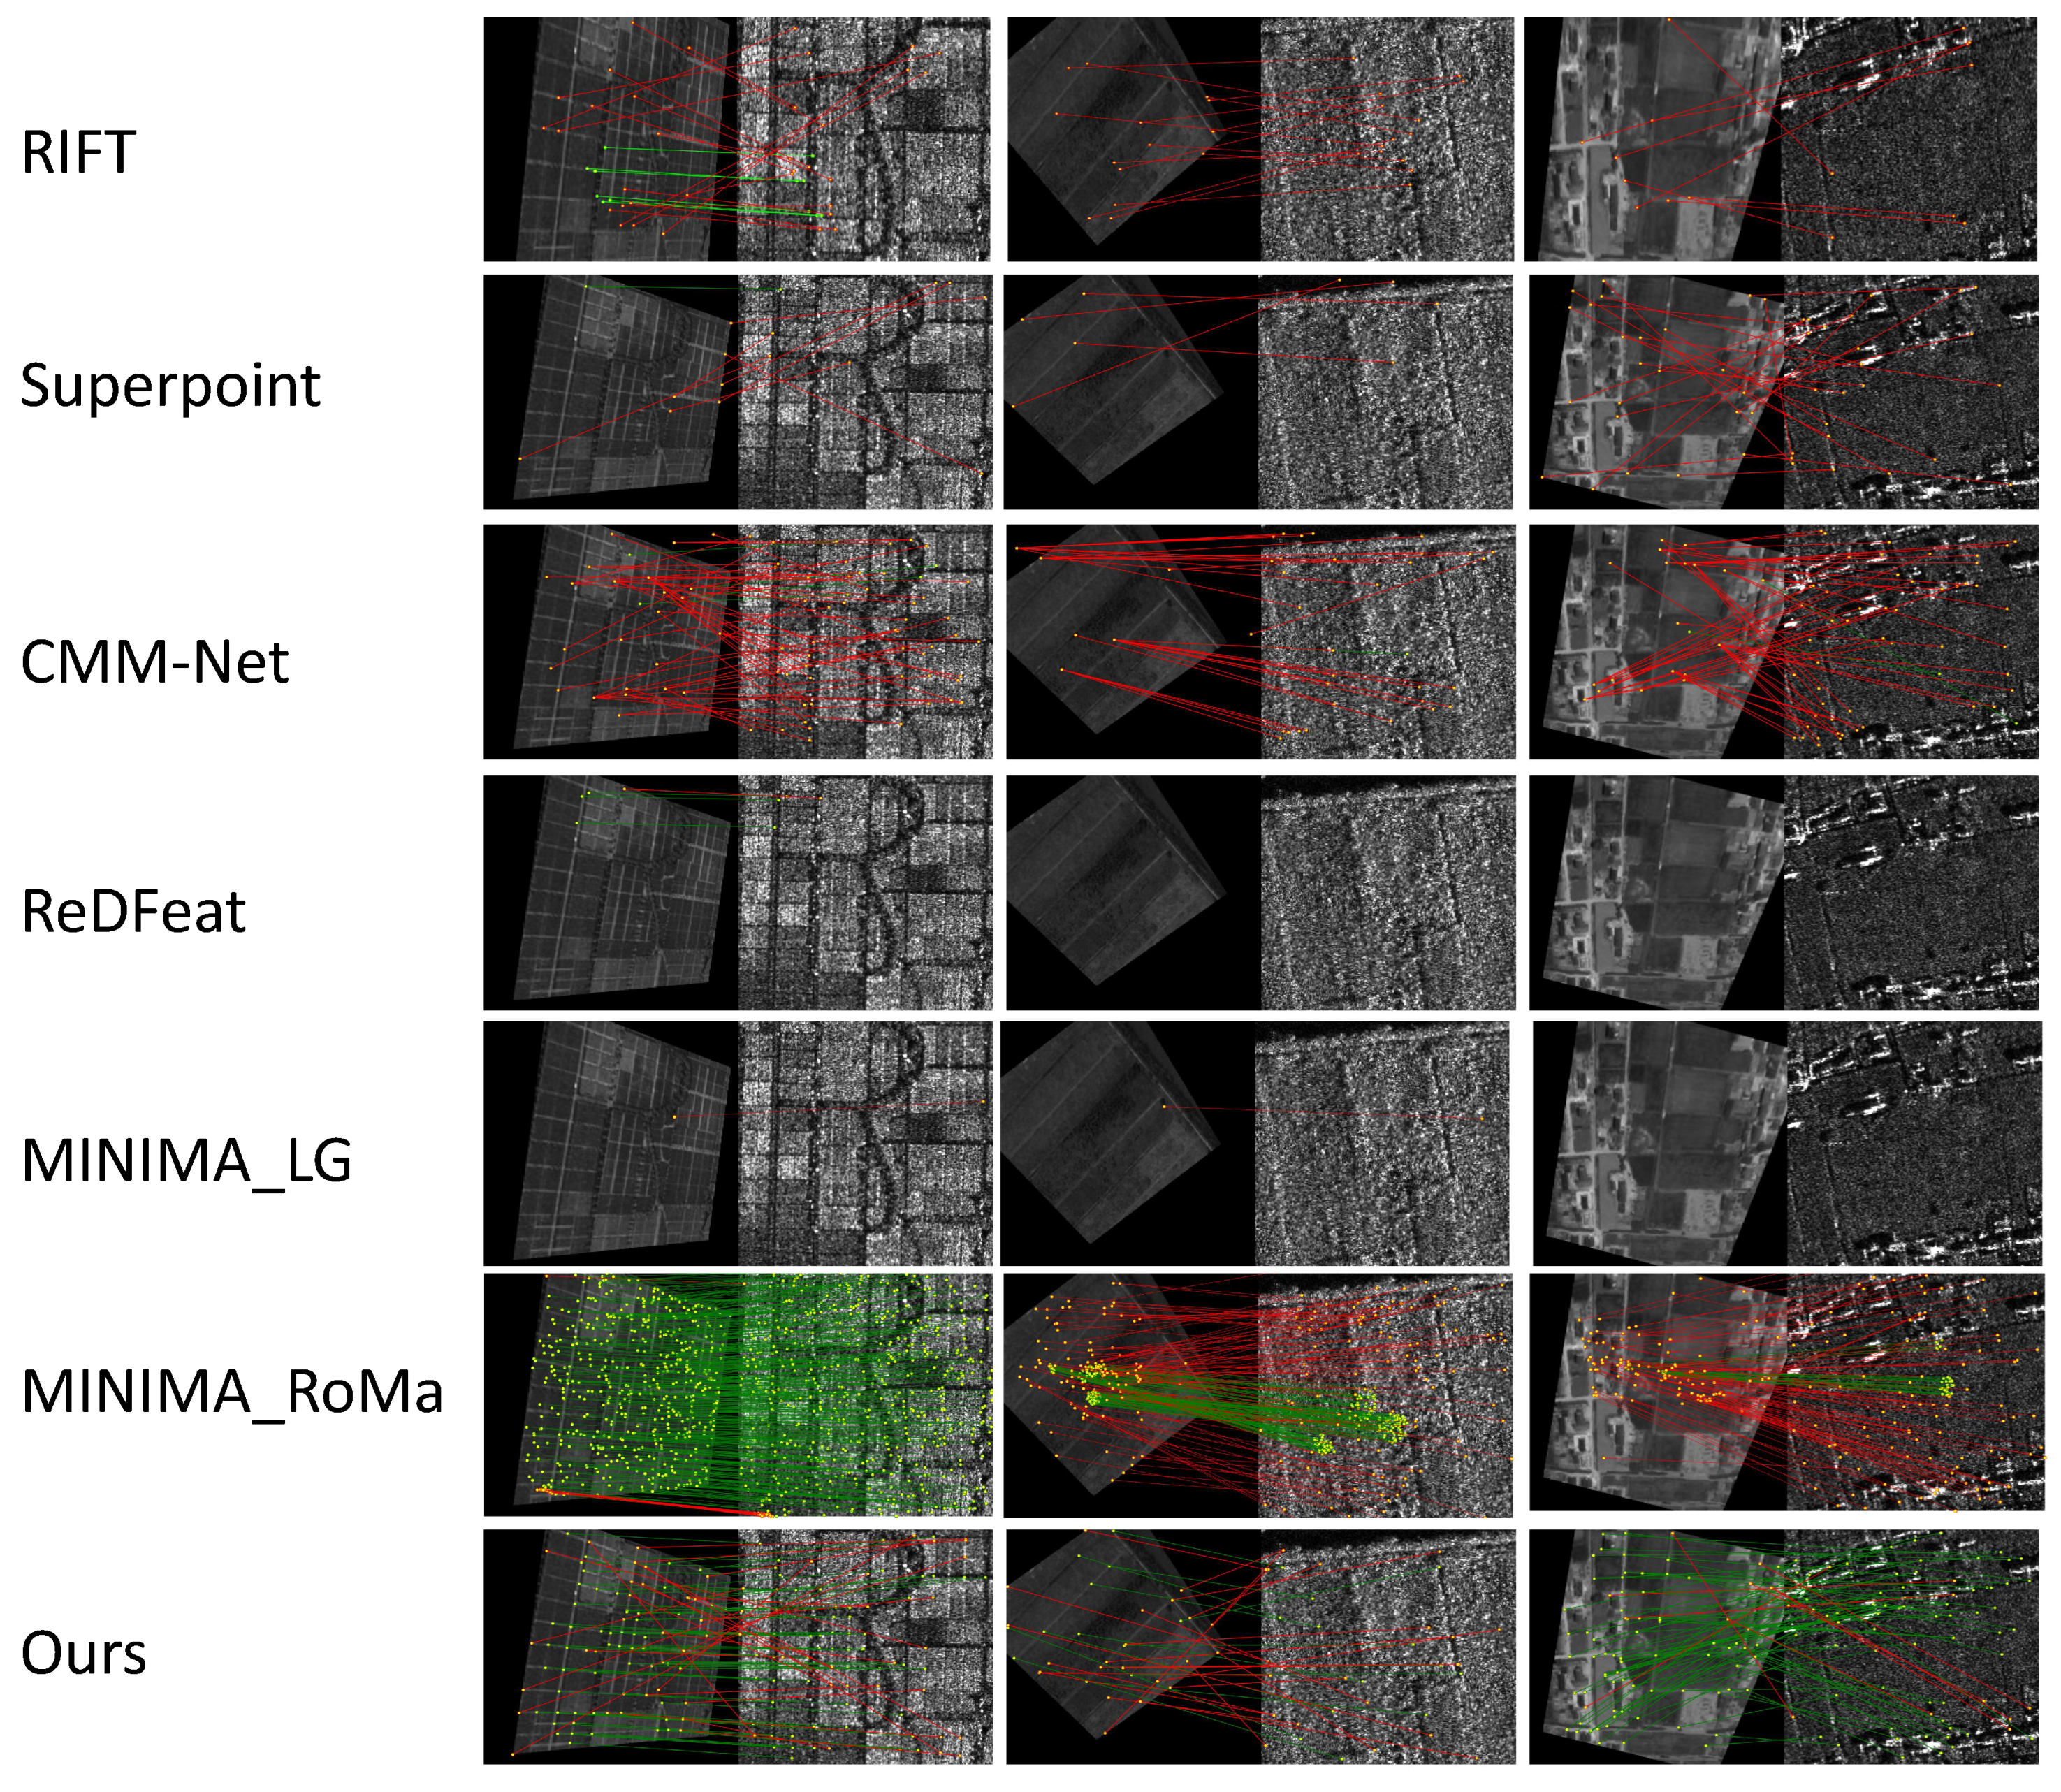
Scale transformations presented significant challenges for most evaluated methods, as clearly evidenced by the quantitative results in Table 3. While the majority of the approaches suffered from substantial performance degradations, MINIMA-RoMa maintained relatively strong performance across key metrics, demonstrating notable resilience to scale variations. The proposed method also achieved consistently superior results despite the challenging conditions.
On the SEN1-2 dataset, our method achieves a perfect SR of 100%, demonstrating clear superiority over other approaches. While MINIMA-RoMa also maintains strong performance, with a 99.8% SR and exceptionally high NCM value, our method achieves the lowest RMSE and highest repeatability. The performance gap becomes particularly evident when comparing it with other methods: RIFT achieves only a 37.063% SR, while ADRNet fails functionally under scale changes, with only a 1.667% SR.
On OSdataset, our method maintains outstanding performance, with a 98.99% SR, closely matching MINIMA-RoMa (99.8% SR) while achieving superior repeatability. MINIMA-LG shows inconsistent performance across datasets, achieving moderate results on SEN1-2 (15.1% SR) but better performance on OSdataset (55.1% SR), albeit still substantially below the leading methods.
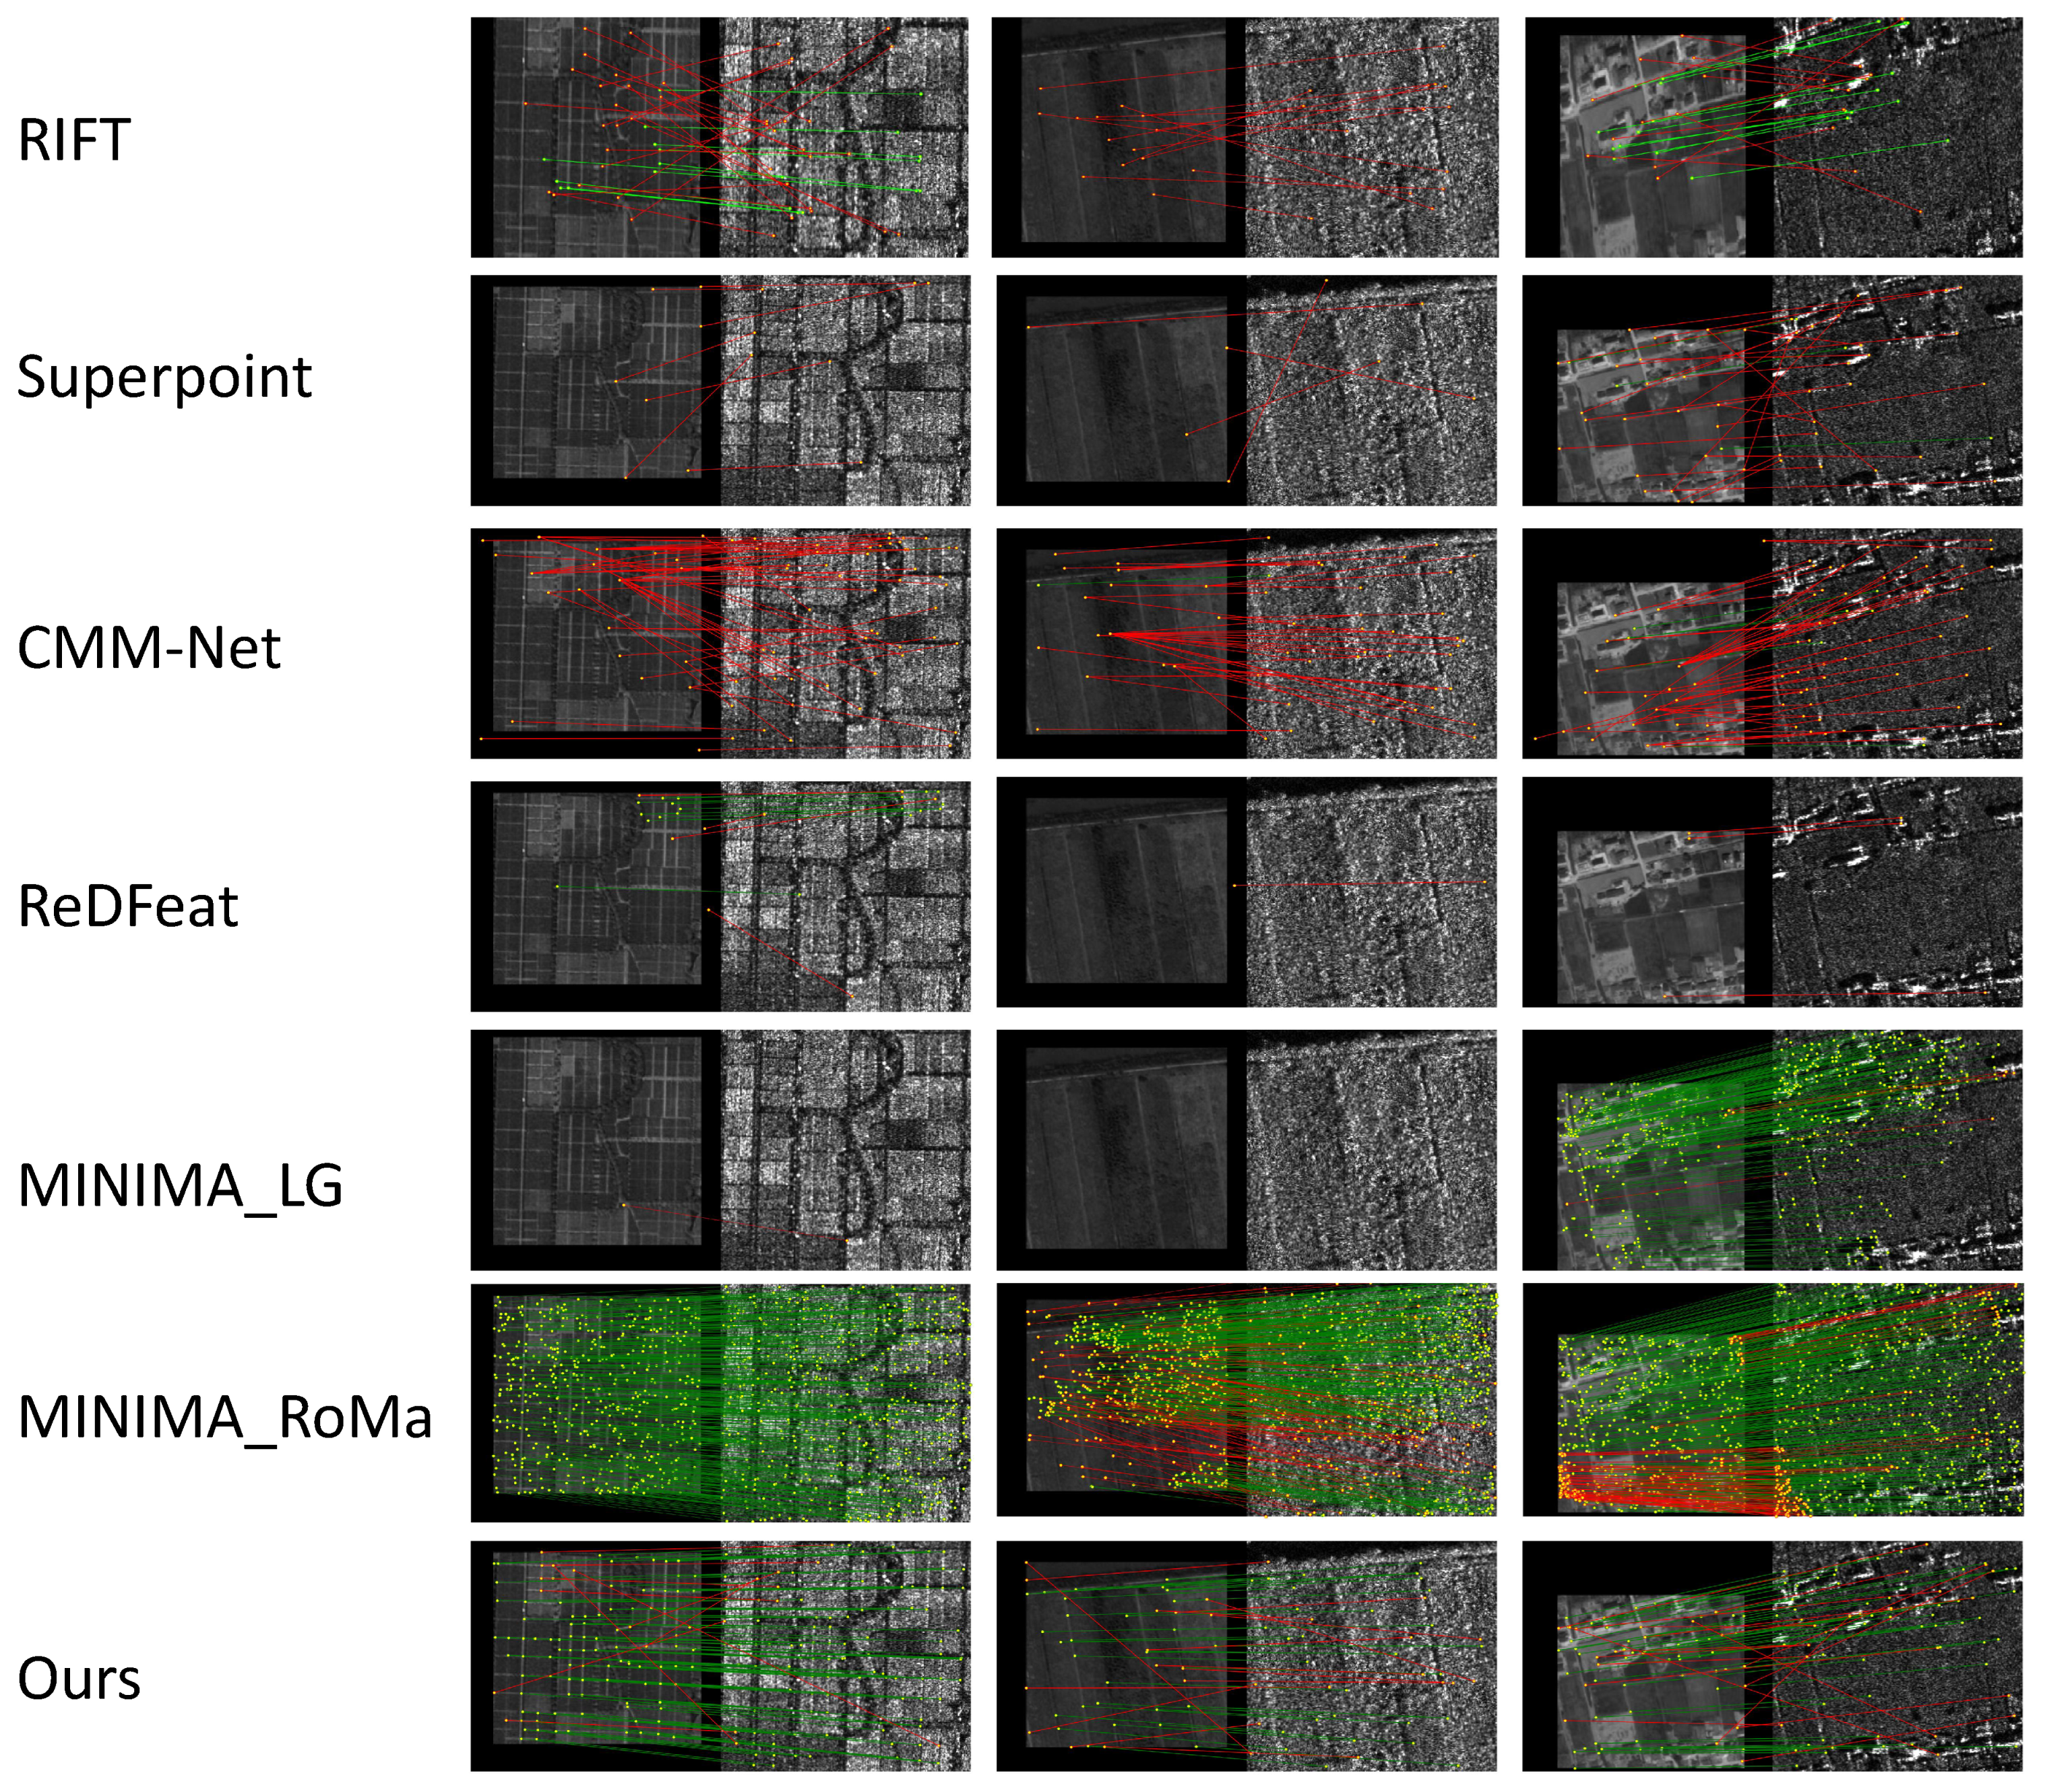
The qualitative results in Figure 7 and Figure 8 corroborate these findings. MINIMA-RoMa produces commendable matching results across all test pairs. MINIMA-LG shows acceptable performance on the three image pairs from the SEN1-2 dataset but exhibits noticeable degradation on the OSdataset examples. The proposed method sustains reliable matches across all test pairs, maintaining robustness where other methods experience significant performance deterioration.
In summary, while MINIMA-RoMa maintains competitive performance in scale transformation scenarios, our method also demonstrates exceptional scale invariance, achieving a perfect or near-perfect SR while maintaining superior matching precision and repeatability across diverse datasets.

4.4.3. Rotation and Scale Transformation Scenario

Large-angle rotation and scale transformations combined represent the most challenging scenario. The quantitative results in Table 4 reveal a stark performance gap: the proposed method delivers near-flawless accuracy, while most competing methods exhibit functional breakdown.
On the SEN1-2 dataset, our approach achieves a perfect 100% SR, demonstrating remarkable robustness to rotation and scale transformations. MINIMA-RoMa emerges as the second-best performer with an 83.4% SR, although its performance shows noticeable degradation compared to scale transformation scenarios. The gap becomes particularly evident when considering other methods: ReDFeat achieves only a 7.38% SR, while RIFT and ADRNet fall below a 3% SR. Our method also dominates in matching quality, achieving the lowest RMSE and highest repeatability.
The qualitative results in Figure 9 and Figure 10 visually demonstrate the performance hierarchy under these conditions. The proposed method clearly produces the most reliable correspondences, maintaining robust matching quality despite the combined large-angle rotation and scale transformations. MINIMA-RoMa emerges as the second-best performer, generating substantially better matches than other approaches. Other competing methods, including RIFT and CMM-Net, exhibit near-complete failure and lack practical utility for registration tasks.
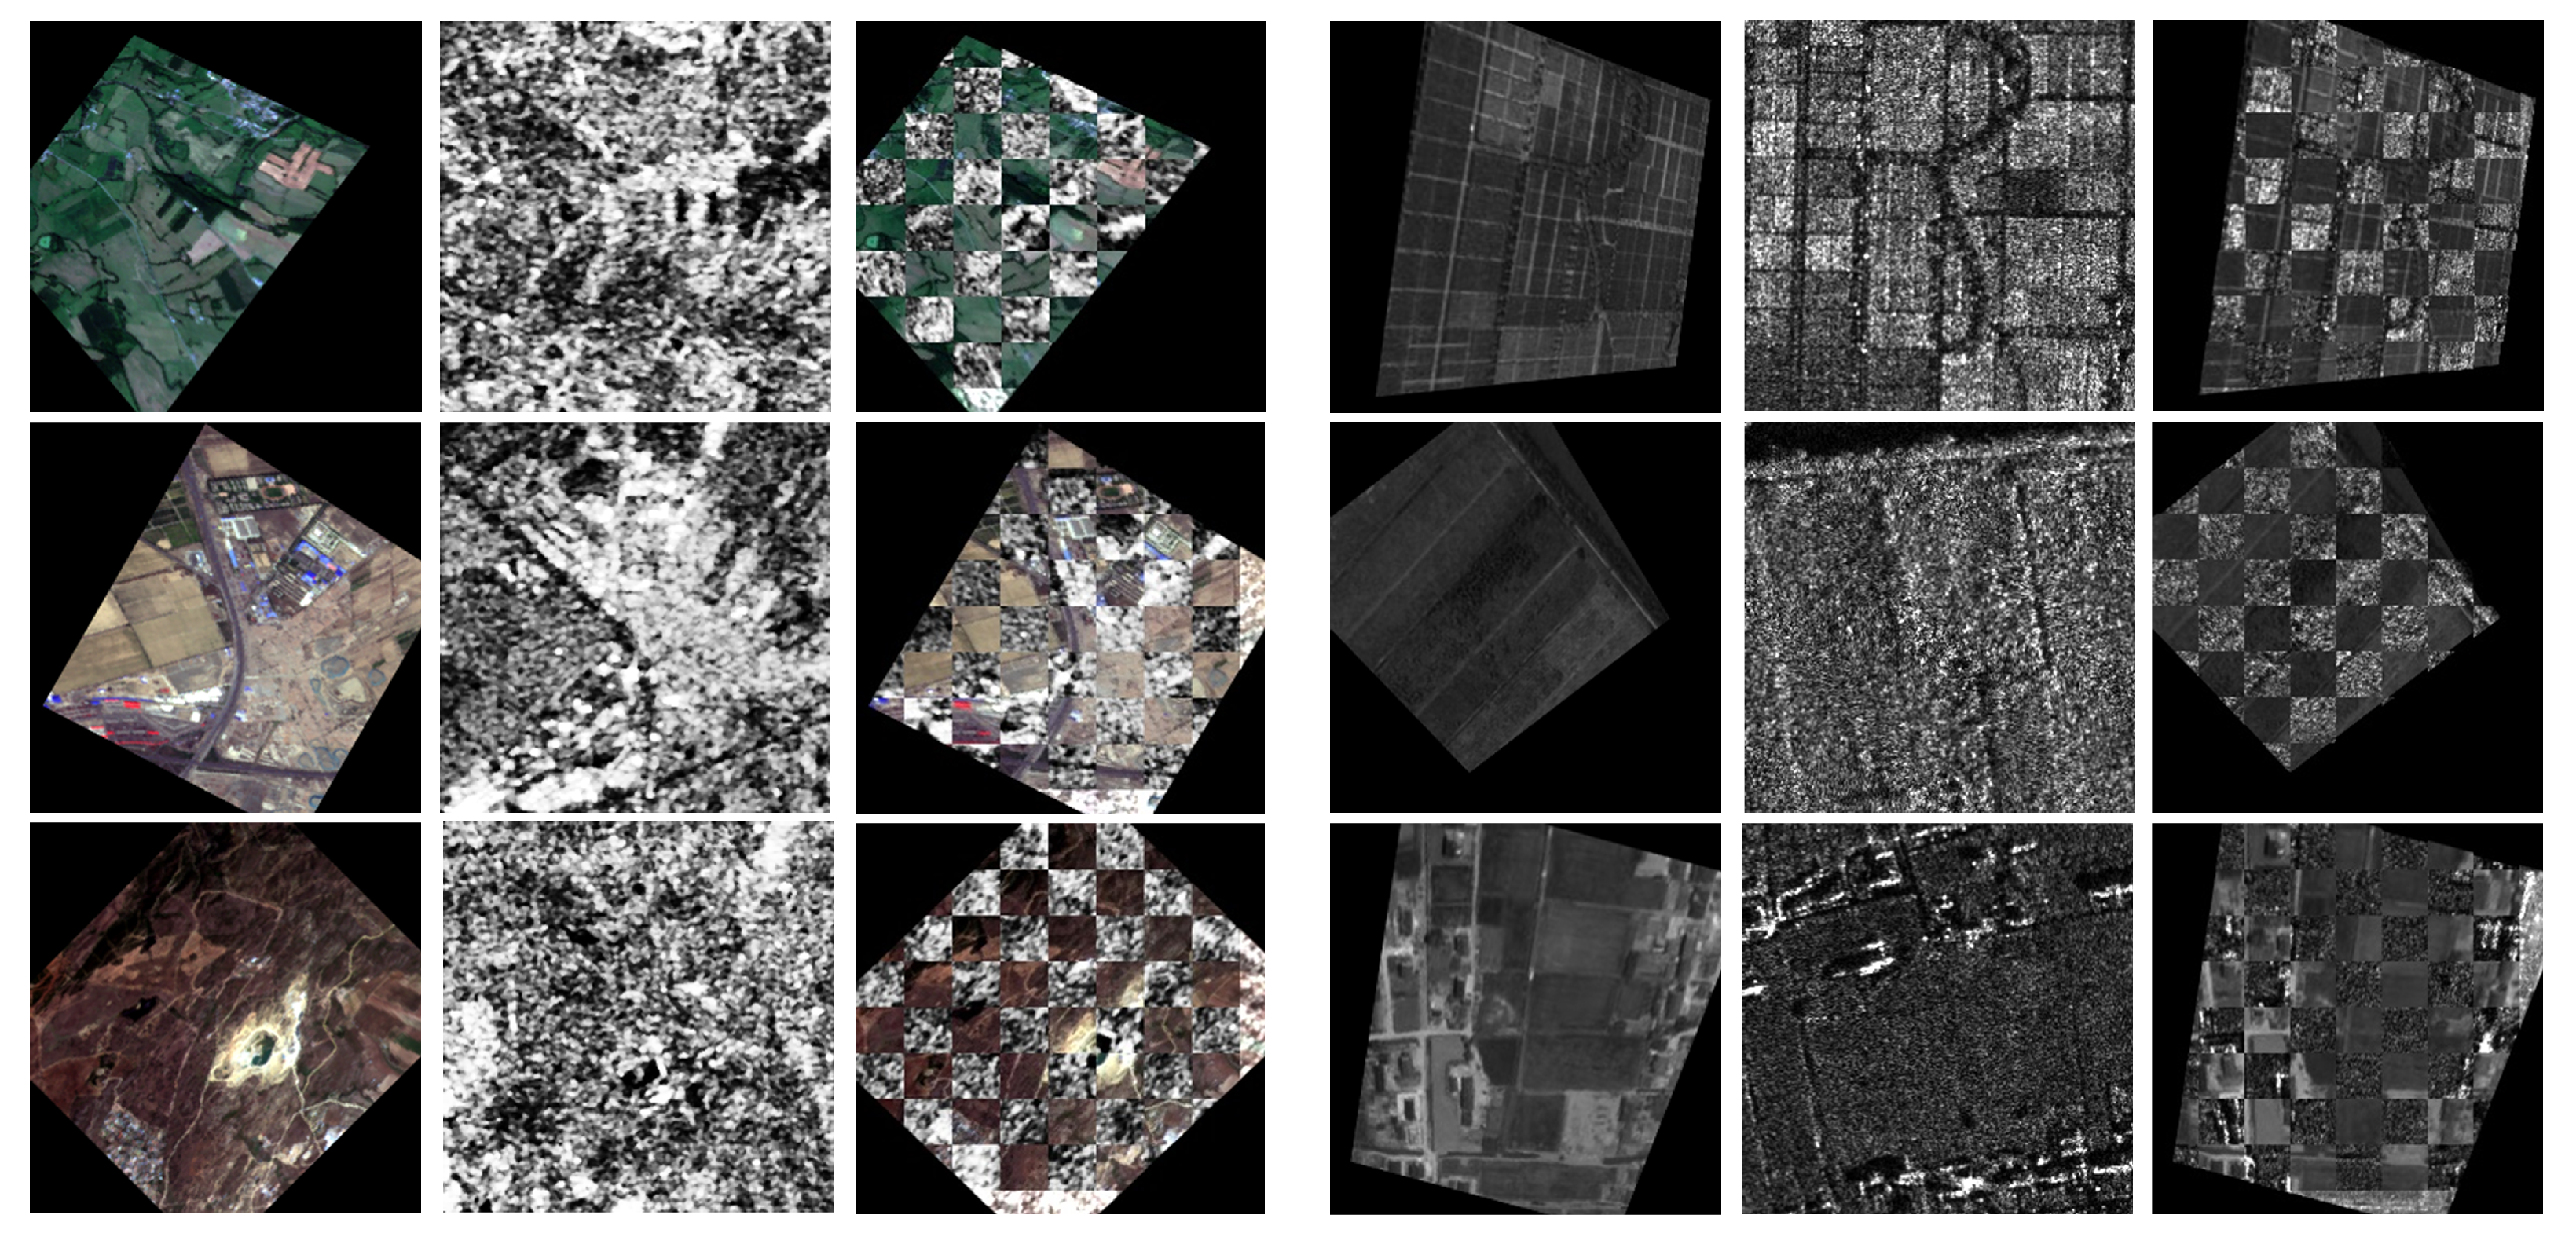
In particular, under rotation and scale transformation conditions, we focus on demonstrating the advantages of the proposed method compared to other state-of-the-art methods. The checkerboard visualization results of six pairs of high-difficulty images are shown in Figure 11, clearly illustrating the superior performance of our method in multimodal image registration tasks.

4.4.4. Evaluation on Partially Overlapping Dataset

The partially overlapping scenario represents an extremely challenging condition for image registration, as clearly evidenced by the quantitative results in Table 5. The overall performance across all evaluated methods remains limited, highlighting the difficulty of this task. Among the compared approaches, MINIMA-RoMa achieves the highest SR at 20.1%, along with significantly superior NCM values, although its matching accuracy, as reflected in the RMSE, still requires substantial improvement. Our method attains a 5.56% SR, comparable to ReDFeat and MINIMA-LG, while achieving the best repeatability among all methods. Notably, RIFT, SuperPoint, CMM-Net, and ADRNet completely fail to produce any successful registrations under these demanding conditions.
We acknowledge the current limitations of our approach in handling severe partial overlap scenarios, particularly in achieving a higher SR. The generally constrained performance across all methods is evident, including the relatively high-performing MINIMA-RoMa. We attribute the generally poor performance across all methods to the absence of non-overlapping image pairs in the training data. This limitation highlights an important direction for future research, where incorporating explicitly non-overlapping training samples could potentially enhance the method’s capabilities in handling extreme partial overlap scenarios.

4.4.5. Computational Efficiency Discussion

We evaluate the inference speed and GPU memory consumption of our method alongside other approaches, with all experiments conducted under the same environment on an NVIDIA RTX 3090 GPU. As shown in Table 6, our method achieves an inference time of 0.126 s per image pair and memory usage of 1680 MiB. While ReDFeat and ADRNet exhibit faster inference speeds, and ReDFeat also consumes significantly less memory, our approach still maintains competitive efficiency. Notably, MINIMA-RoMa, which delivers superior performance compared to ReDFeat and ADRNet and is among the best performers aside from our method, incurs significantly higher computational costs due to its detector-free design. Although our method is not the absolute best in terms of computational efficiency, it strikes a favorable balance between performance and resource demands, making it a practically viable and efficient solution for real-world applications.

4.4.6. Discussion of Generalization Capabilities

This study intentionally employs the SEN1-2 dataset, OSdataset, and the M4-SAR dataset, with significantly different spatial resolutions, to rigorously evaluate the generalization capabilities of the proposed method. As shown in Table 7, the consistently high performance across both datasets demonstrates notable robustness to significant variations in the ground sampling distance. Although a performance decrease is observed on the M4-SAR dataset, the overall results remain satisfactory.
Additionally, the SEN12MS-CR dataset is included to assess the method’s performance under cloud cover conditions. The empirical results confirm that our approach maintains reliable feature matching capabilities despite atmospheric disturbances.
We attribute this robustness to the characteristics of the feature points that our method leverages. The detected feature points are predominantly high-quality corners. Such features maintain their distinctive characteristics across resolution variations because their salience originates from the local geometric structure rather than intensity variations, which tend to be highly sensitive to resolution changes. As a result, identical physical structures, such as building corners or road intersections, produce consistent feature representations in 60 m and 1 m imagery.
The empirical evidence indicates that the method successfully bridges substantial resolution gaps and maintains functionality under challenging conditions like cloud cover, making it highly suitable for practical applications involving multisource remote sensing data.

4.5. Discussion of the Effectiveness of the APLM

The proposed APLM serves as the cornerstone for generating supervisory signals in our self-supervised framework. To comprehensively validate its efficacy, this section provides a detailed analysis from two critical perspectives: the quality of the generated pseudo-labels and the robustness of the model to potential inaccuracies within them.
First, to validate the quality of the generated pseudo-labels, we conducted manual verification. A prerequisite for the success of our method is the availability of high-quality pseudo-labels for training the feature matcher. To quantitatively assess this, we performed manual verification on a randomly selected set of 600 image pairs from the training corpus. The statistical results confirm the exceptional reliability of our APLM, yielding average pseudo-label accuracy of 93.9%. This high precision ensures that the supervisory signal provided to the matcher is overwhelmingly correct, thereby effectively guiding the learning process.
Second, we designed an experiment to investigate the model’s robustness to noise. Specifically, we systematically introduced errors into the training data. For each image pair, 10% of the pseudo-label point correspondences were corrupted by shifting the coordinates of the SAR image points by 3 pixels in a random direction, while the corresponding optical image points remained unaltered.
The model was subsequently trained and evaluated on this perturbed dataset. The impact on the matching performance across key datasets is summarized in Table 8. On the SEN1-2 dataset, the performance remained highly stable, with the SR and repeatability showing negligible changes, while the RMSE saw a minor increase of 0.03, and the NCM decreased by 30. A contained effect was observed on OSdataset, where the repeatability decreased by 1%, the SR decreased by 1%, the RMSE increased by 0.3, and the NCM was reduced by 10. Crucially, the training process remained stable and converged normally under both conditions.
These results robustly demonstrate that our framework is not critically sensitive to a small proportion of erroneous pseudo-labels, confirming that the APLM provides a sufficiently clean and robust supervisory signal for effective model convergence.

4.6. Impact of Noise on Cross-Modal Registration Accuracy

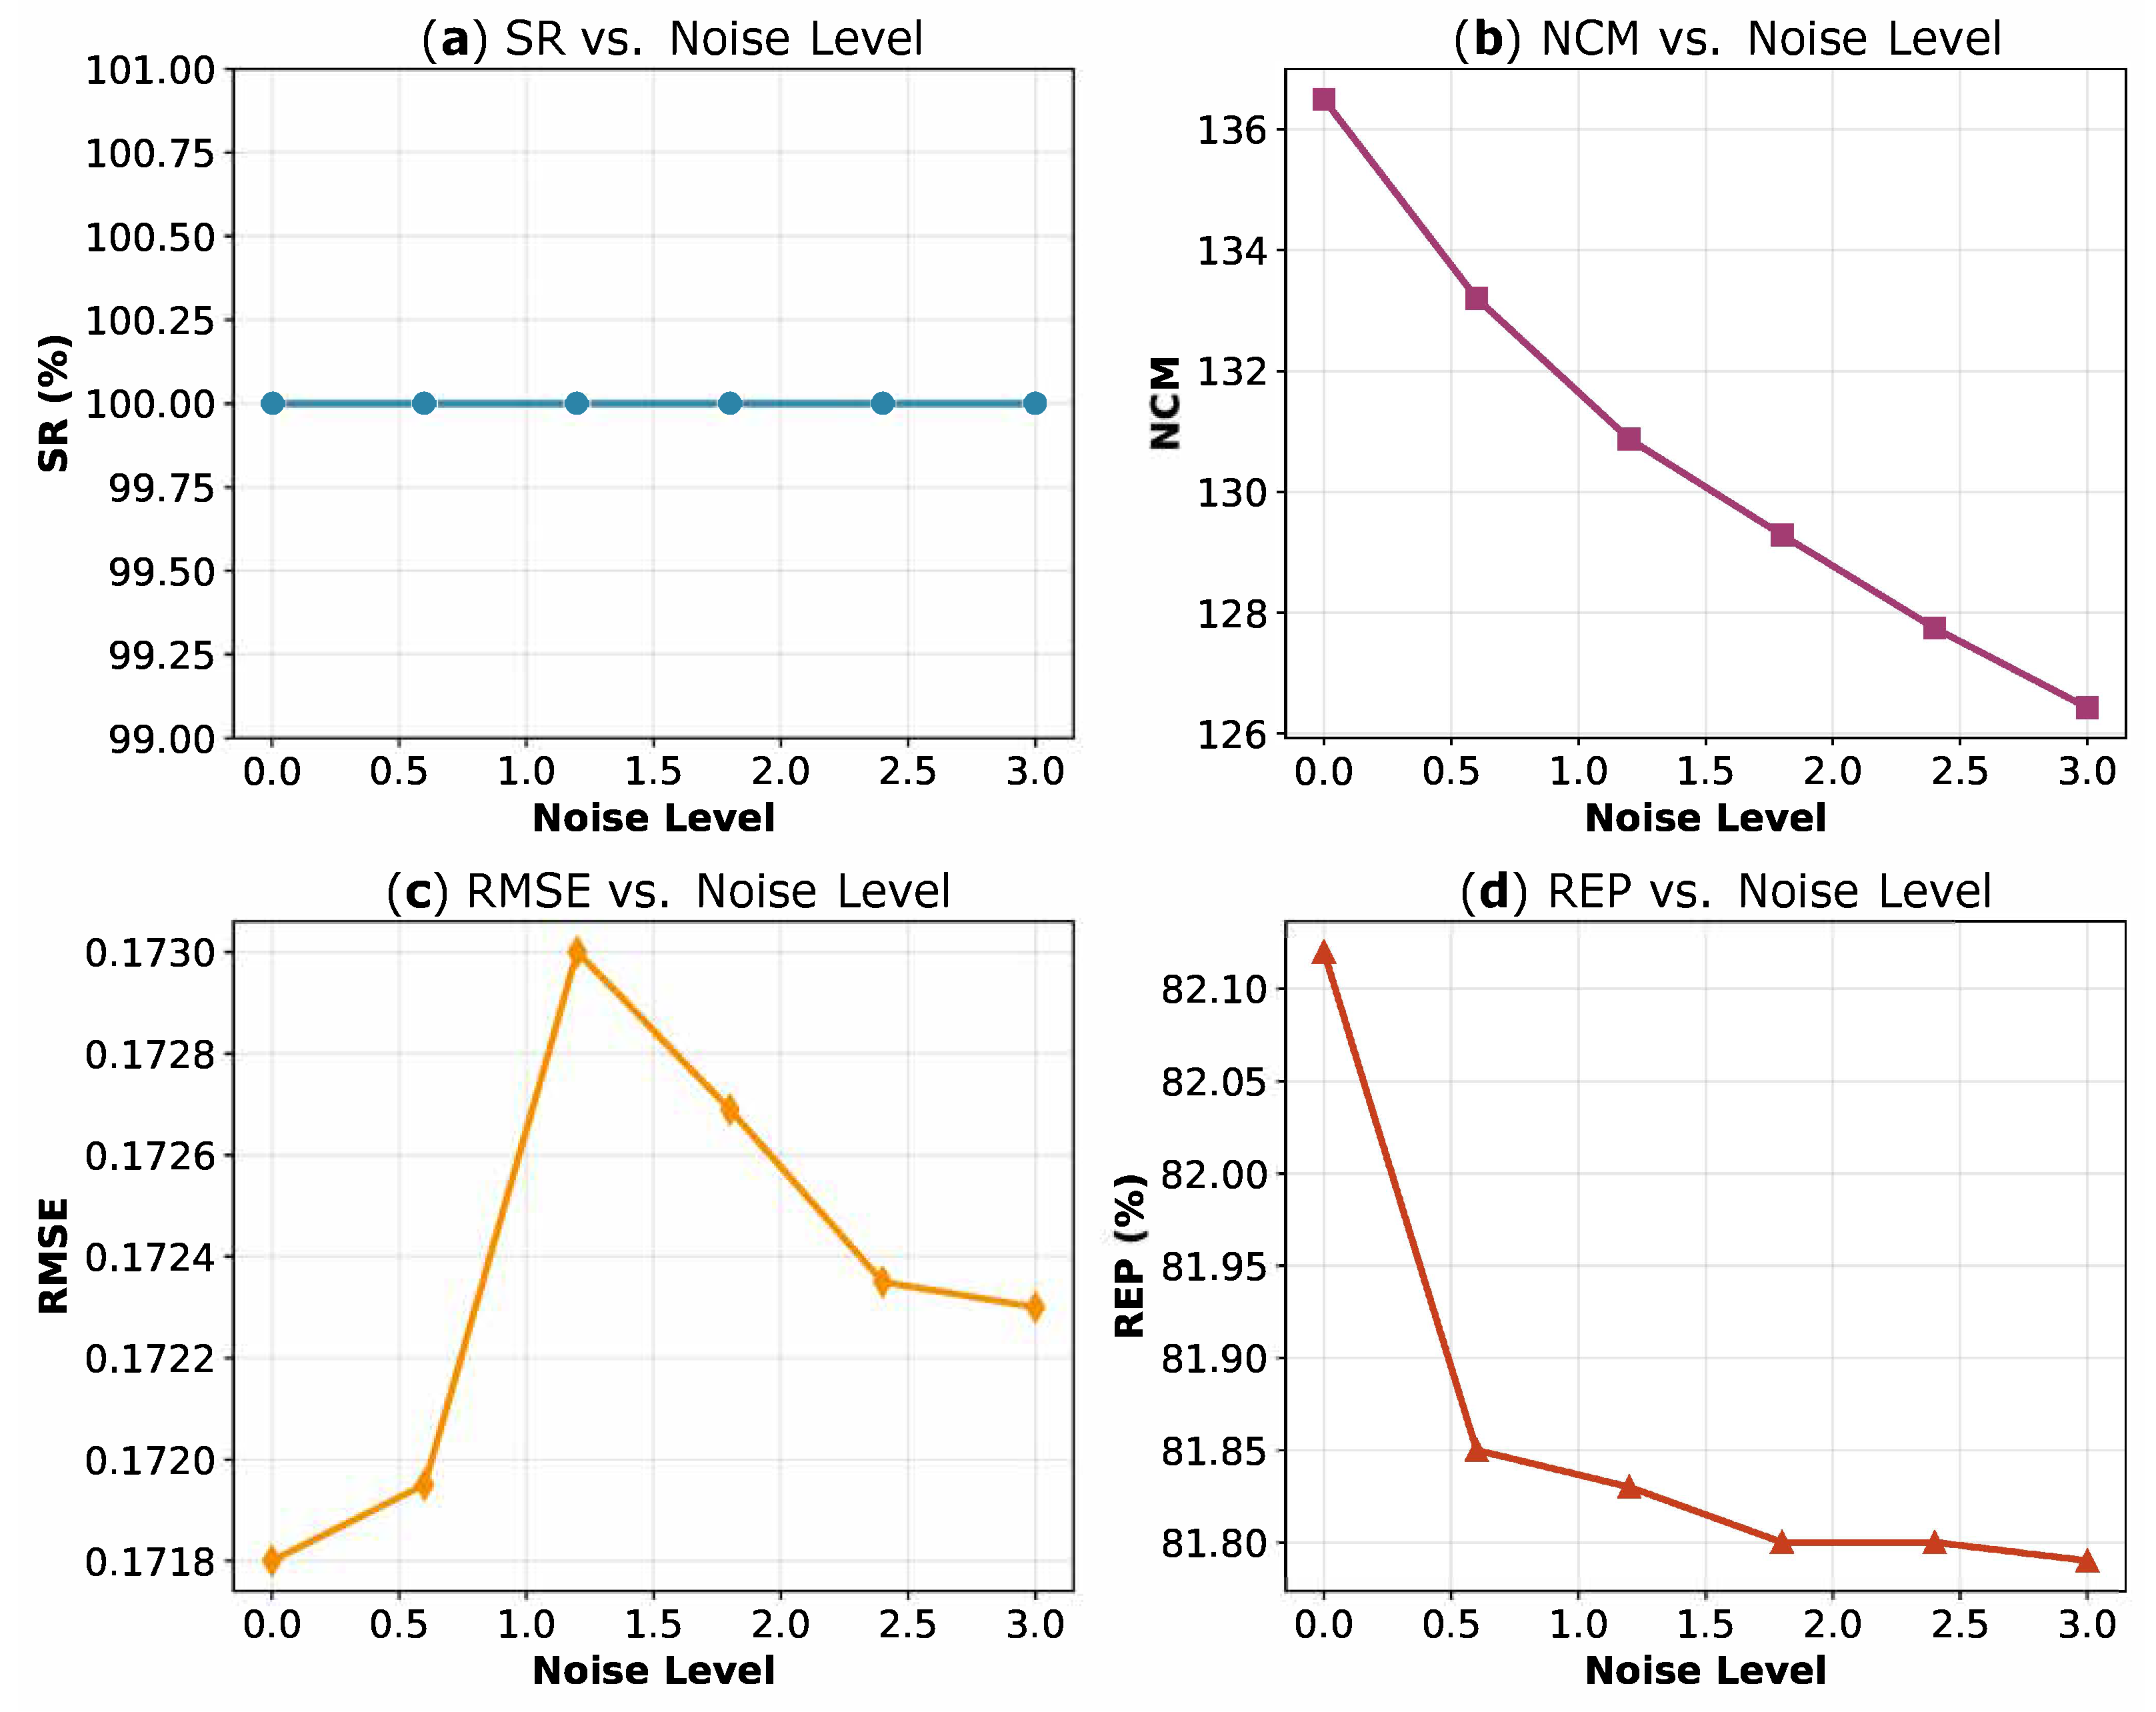
This section analyzes the effect of synthetic noise on the performance of PLISA. To simulate realistic noise while maintaining experimental control, we introduced two types of synthetic noise into pre-denoised SAR images. The first type was based on the original SAR sensor noise that had been initially removed from the SEN1-2 dataset using a Lee filter. We scaled this noise with coefficients of 0.6, 1.2, 1.8, 2.4, 3.0 and injected it back into the pre-denoised images. A coefficient of 1.0 corresponds exactly to the inherent noise level of the original SAR images, providing a realistic baseline for comparison. The second type was Gaussian noise, which was added at three intensity levels, with sigma values of 30, 50, and 70, into the pre-denoised SAR images.
As illustrated in Figure 12 for the first type of noise and Table 9 for the second type, all metrics exhibit consistent trends with increasing noise: the SR and NCM show a steady decline, while the RMSE rises slightly and the repeatability decreases modestly. Despite these variations, PLISA maintains robust performance across all noise levels, demonstrating its practical utility in real-world scenarios, where the image quality is often compromised.

4.7. Influence of Feature Point and Descriptor Decoupling Strategy

To evaluate the impact of the feature point and descriptor decoupling strategy on the experimental results, we conduct a comparative analysis of two different decoupling schemes and perform an in-depth study of their effects. Figure 13 illustrates the network architectures under these two decoupling strategies, with the key difference lying in the depth of the network at which the decoupling occurs: the first strategy, termed the early-stage decoupling strategy (EDS), separates the feature point detection and descriptor generation tasks at an earlier stage, while the second strategy, referred to as the deep-layer decoupling strategy (DDS), performs this separation at a deeper layer of the network.
Experimental results reflecting the changes in the metrics when applying the two decoupling strategies are shown in Table 10. On the SEN1-2 dataset, EDS achieved a lower RMSE of 0.171, compared to 0.177 under DDS, along with a higher NCM value of 136.496 versus 129.160. The improvement is even more pronounced on the more challenging OSdataset, where EDS attained an RMSE of 0.896—a reduction of 0.082 compared to DDS—and improved both the NCM and SR substantially.
The observed performance disparities are predominantly attributable to the distinct decoupling positions within the network architecture. Specifically, when decoupling is implemented at deeper layers of the network, the interplay between the feature point detection network and the descriptor generation network is intensified. This heightened interaction, while beneficial in certain contexts, may introduce complexities that impede the independent optimization of their respective tasks.
Conversely, adopting an early decoupling strategy enables each subnetwork to focus more singularly on its designated task. By minimizing the mutual interference between the two networks, early decoupling facilitates a more focused optimization process. This, in turn, enhances the overall performance of the system by allowing each subnetwork to operate more efficiently within its specialized domain.

4.8. Experiments with Adam and AdaBoB Optimizers

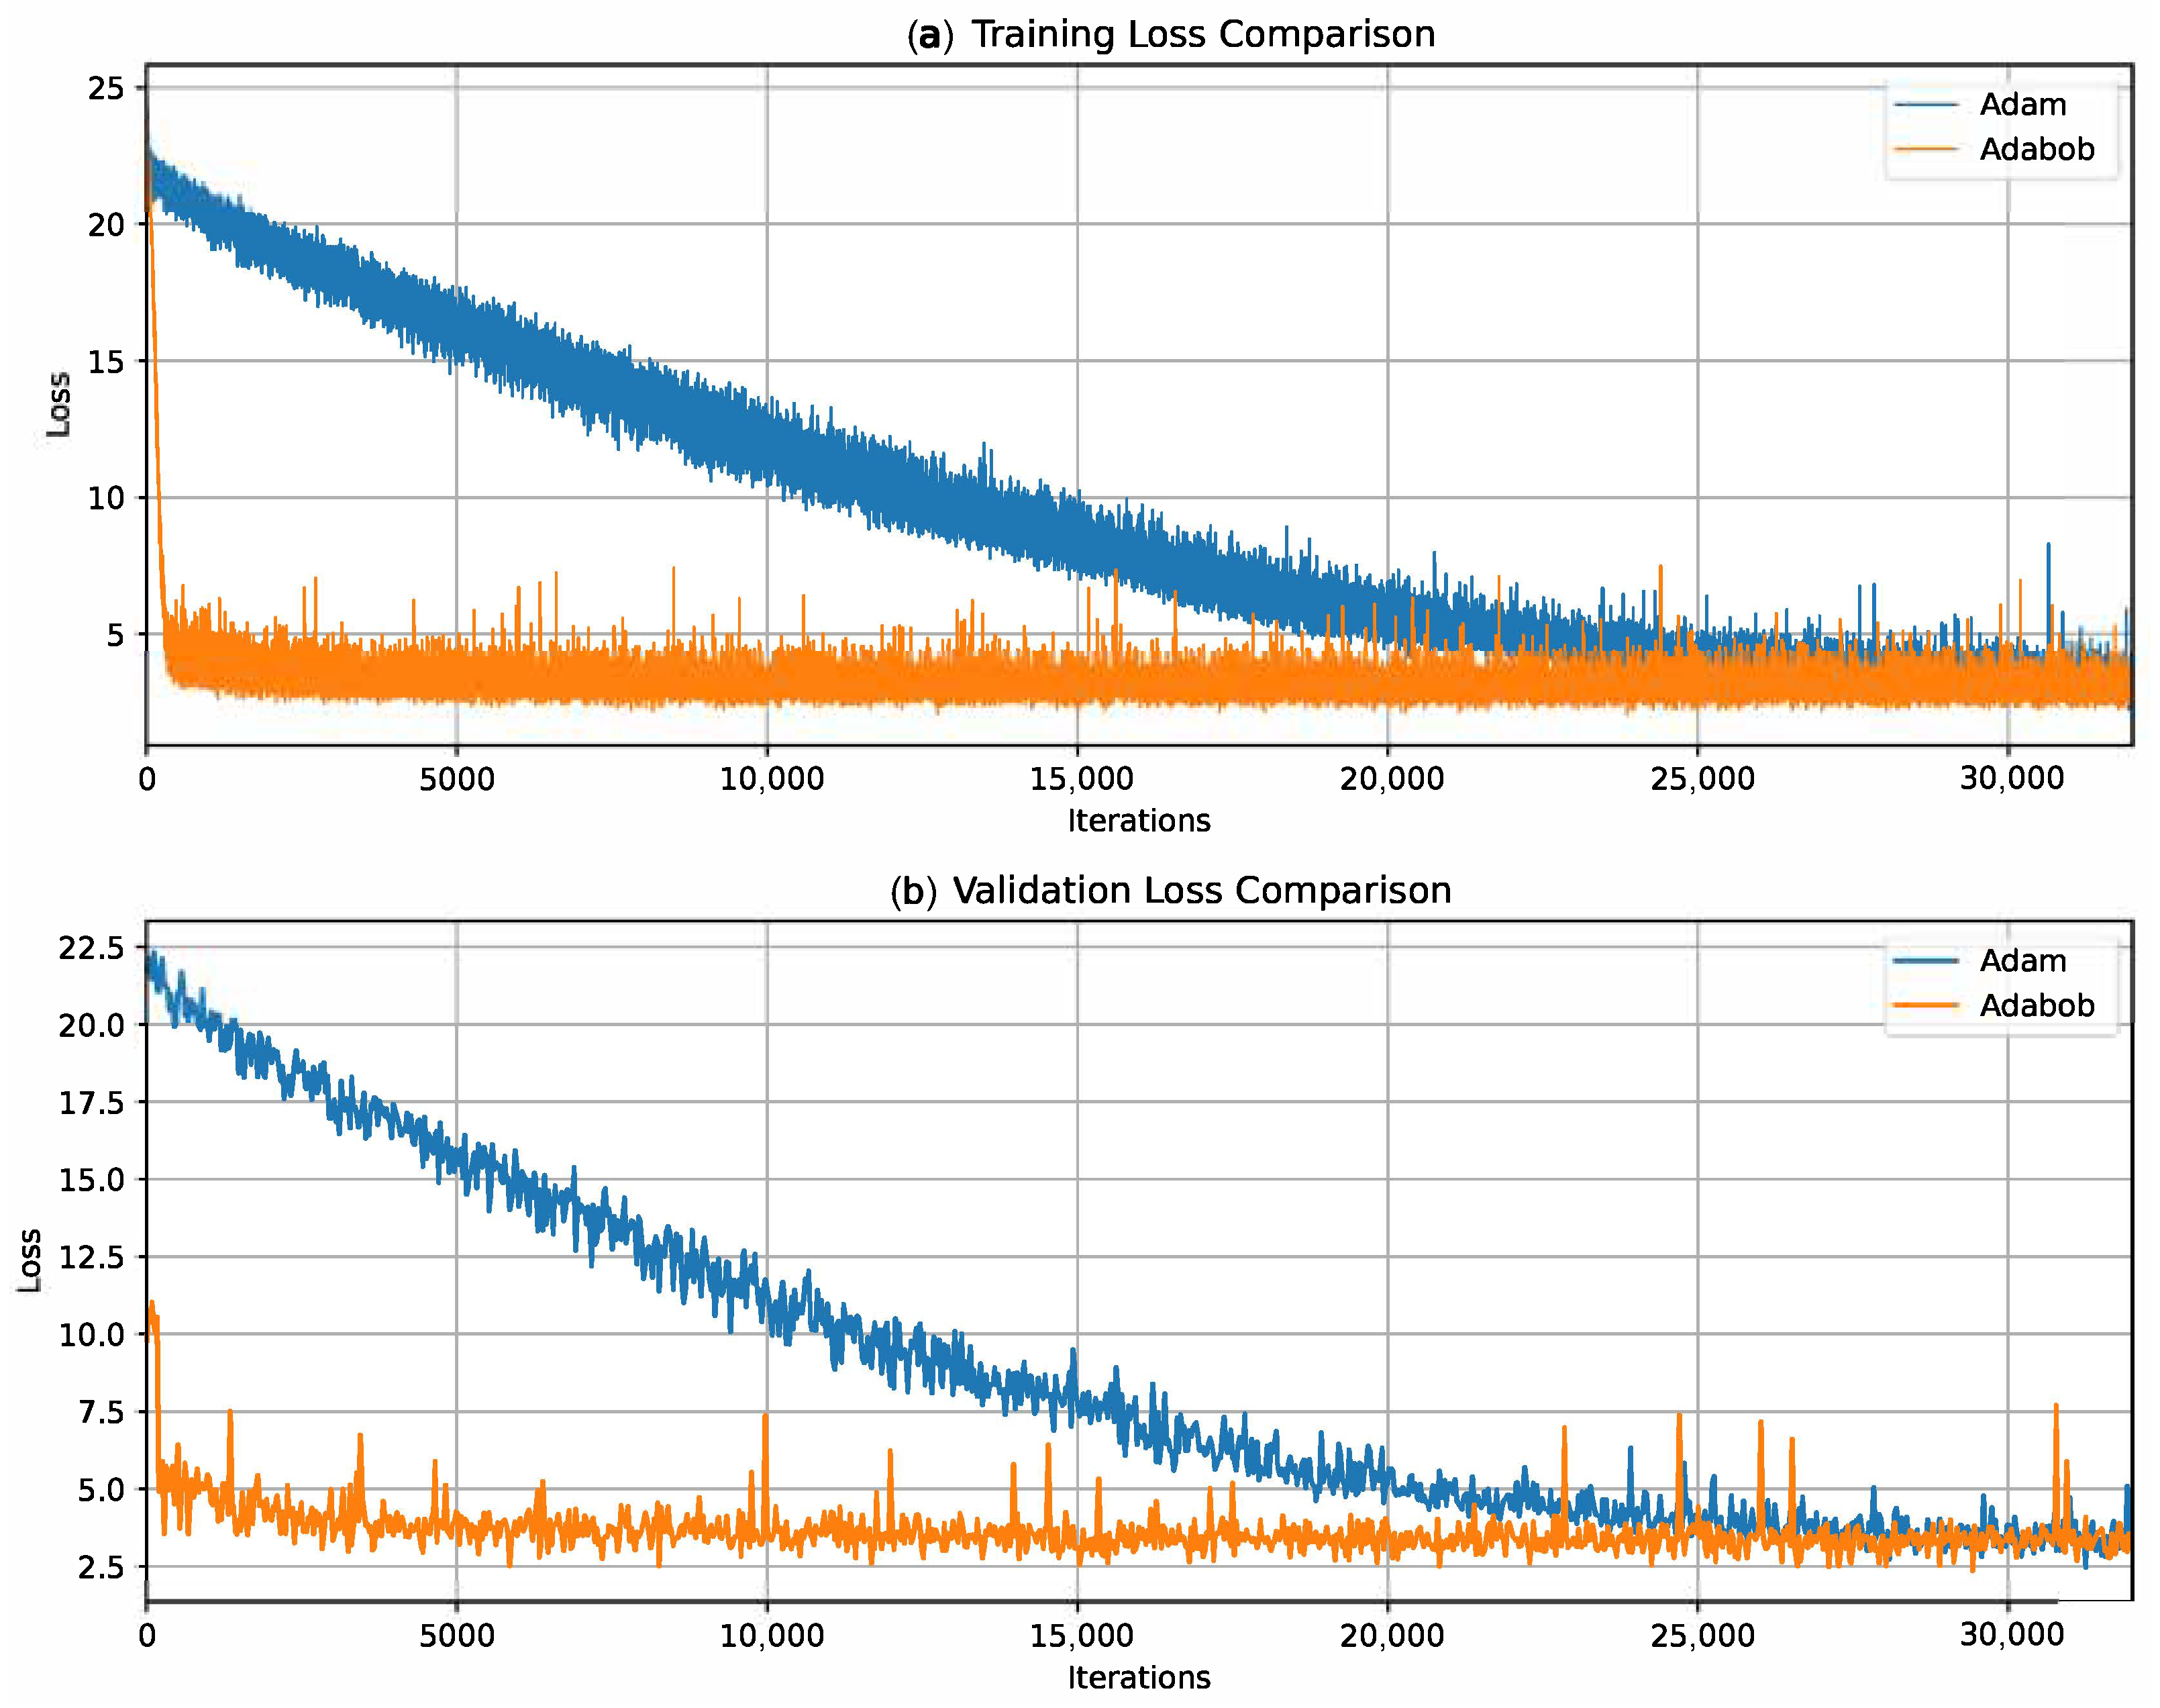
To evaluate the robustness and consistency of the proposed PLISA framework under different optimizers, we conducted comparative experiments using both the Adam and AdaBoB [76] optimizers. Adam is a classic and widely adopted optimization algorithm, well validated across numerous tasks. In contrast, AdaBoB [76] is a more recent method that integrates the gradient confidence mechanism from AdaBelief and the dynamic learning rate bounds from AdaBound. This combination ensures stable convergence, theoretical guarantees, and low computational complexity. The experiments were designed to compare the performance of PLISA under both optimizers. Default parameters were used for AdaBoB [76] throughout the experiments.
The quantitative results are summarized in Table 11. PLISA exhibits minimal performance variation between Adam and AdaBoB [76], with all metrics remaining highly consistent. This indicates that the method is robust to the choice of optimizer.
The training and validation loss curves are shown in Figure 14. Both optimizers effectively reduce the loss, with the training loss dropping rapidly from an initial value of 20–25 and eventually converging close to zero. AdaBoB, however, demonstrates smoother loss curves in the mid-to-late training phase, with almost no visible fluctuations. This aligns with its design goal of suppressing gradient noise and enforcing stable convergence through dynamic learning rate constraints.
In summary, PLISA maintains strong and consistent performance across both optimizers. These results confirm the optimization stability and reliability of the proposed framework.

4.9. Ablation Study

To validate the effectiveness of the components in our framework, we conducted an ablation study using the SEN1-2 dataset and OSdataset, with a particular focus on evaluating the contributions of the proposed CIA module and APLM.
The results, presented in Table 12, clearly show that removing either the CIA module or the APLM causes a substantial drop in performance across all evaluation metrics on both datasets. Specifically, the absence of the APLM leads to a complete failure in feature matching, underscoring its essential role in generating reliable pseudo-labels for supervisory signals. Conversely, removing the CIA module severely weakens cross-modal feature interaction, resulting in a sharp decline in matching accuracy. These findings strongly affirm that both components are critical for learning robust feature representations and achieving the accurate registration of optical–SAR image pairs.
Building upon the foundational ablation study, we further validate the efficacy of the proposed CIA module and justify its specific design choice by comparing its performance against two other representative interactive attention mechanisms: interactive channel attention (ICA) and interactive convolutional block attention (ICBAM). The quantitative results are presented in Table 13. It is essential to first elucidate the conceptual differences between these three interaction paradigms to provide context for their performance disparities.
The ICA mechanism is rooted in the channel attention paradigm. Its core operation focuses on modeling interdependencies between channels across modalities, generating channel-wise weights to recalibrate the feature importance. However, this interaction occurs on spatially compressed descriptors, which risks diluting the critical spatial information that is paramount for geometric registration tasks. In contrast, the ICBA module employs a cascaded structure, typically processing channel attention first and then spatial attention in sequence. A critical drawback of this design is the inherent risk of error propagation, where suboptimal interactions in the initial channel stage are passed into and amplified by the subsequent spatial stage.
Our CIA module is designed with a fundamentally different philosophy, prioritizing direct spatial interaction. It bypasses intricate channel recalibration and instead generates spatial attention maps from one modality to directly guide the feature selection of the other. This design is intrinsically aligned with the core objective of image registration—establishing precise spatial correspondences. It explicitly forces both modalities to focus on spatially co-occurring salient regions, thereby preserving the structural integrity and enhancing the geometric consistency.
As unequivocally evidenced in Table 13, the performance of both ICA and ICBA is significantly inferior to that of our proposed CIA module. This performance disparity is a direct consequence of the misalignment between their core operational principles and the intrinsic requirements of cross-modal registration. The limitation of ICA originates from its channel-centric optimization. In cross-modal scenarios, where feature channels can embody vastly different physical interpretations, forcibly performing interchannel interaction often disrupts modality-specific information and fails to establish meaningful correlations for geometric matching. ICBA’s failure, conversely, exposes the structural vulnerability of its cascaded pipeline. The sequential process propagates distortions from the first interaction stage directly into the second, causing the spatial attention weights to be computed from already corrupted representations, which in turn amplifies errors and leads to poor overall performance.
The superior efficacy of our CIA module is therefore attributed to its dedicated spatial interaction strategy. By enabling a mutual focus on spatially co-occurring regions, it directly augments the geometric consistency between modalities. This approach effectively preserves the unique characteristics of each modality while selectively suppressing irrelevant interference, making it uniquely powerful for building robust spatial correspondences between optical and SAR images.
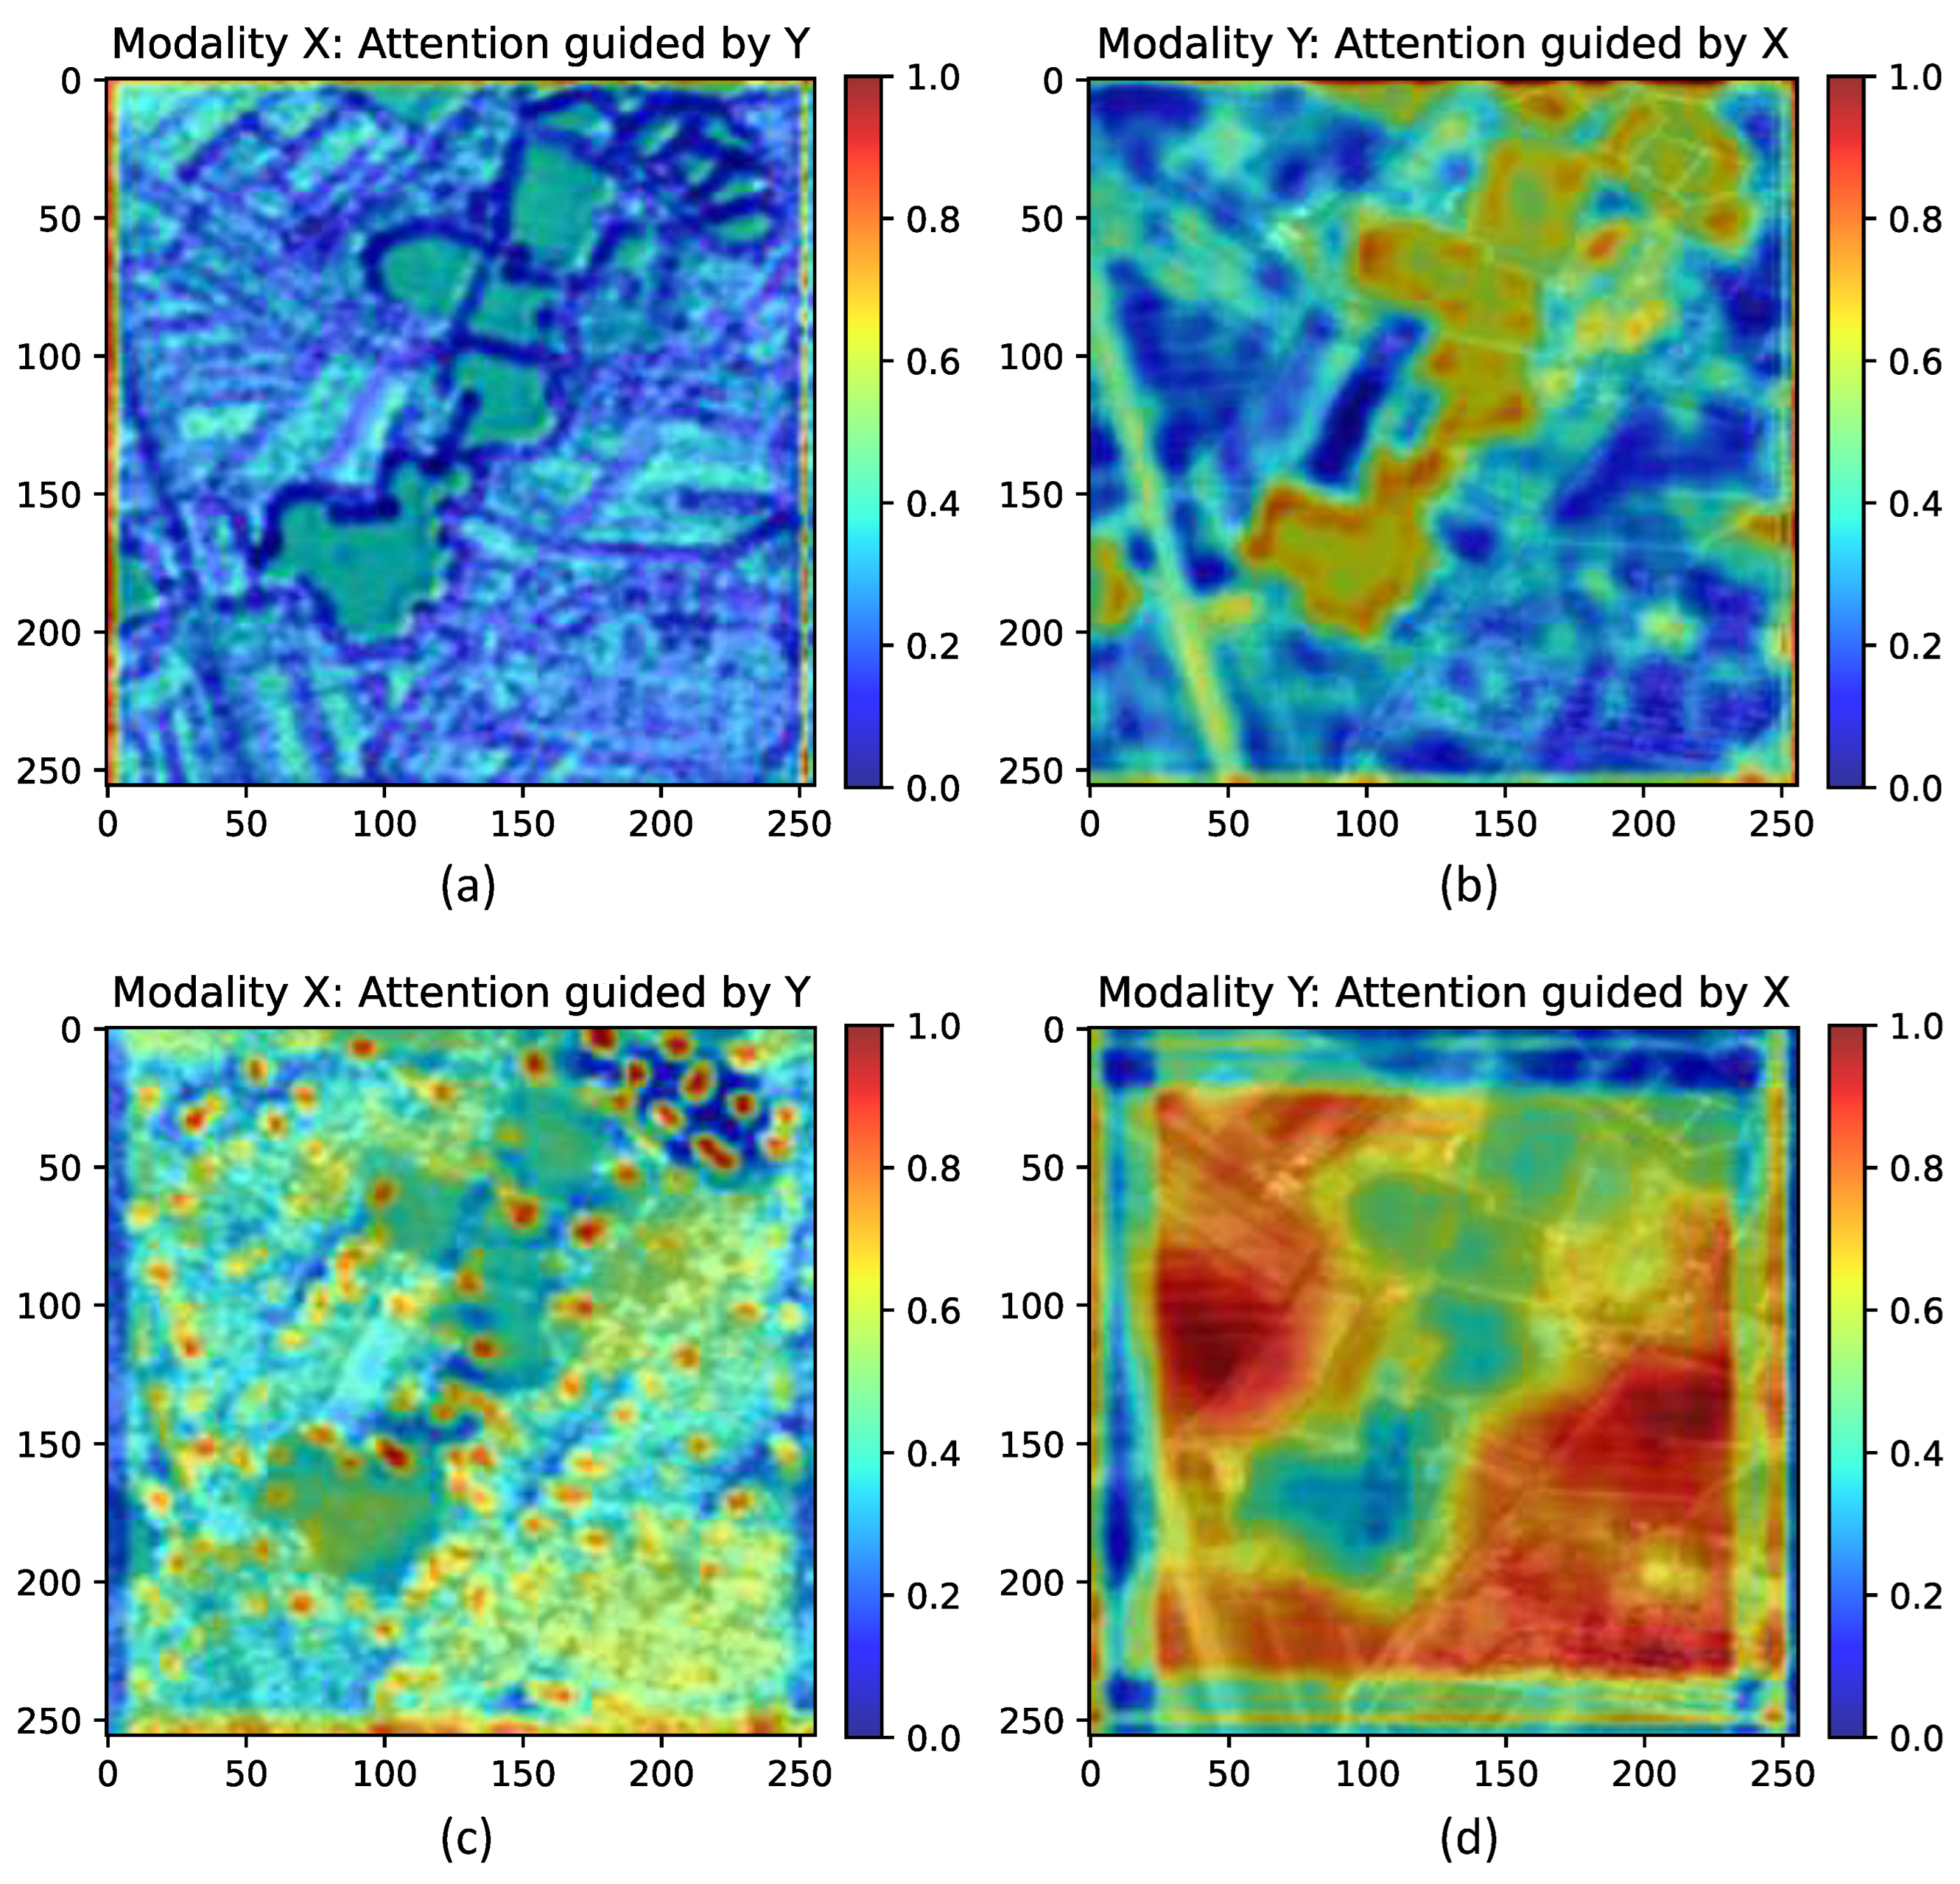
To validate the effectiveness of the CIA module, we conducted a visual analysis of the network outputs. Figure 15 illustrates the changes in the attention maps of optical and SAR images before and after one CIA module operation.
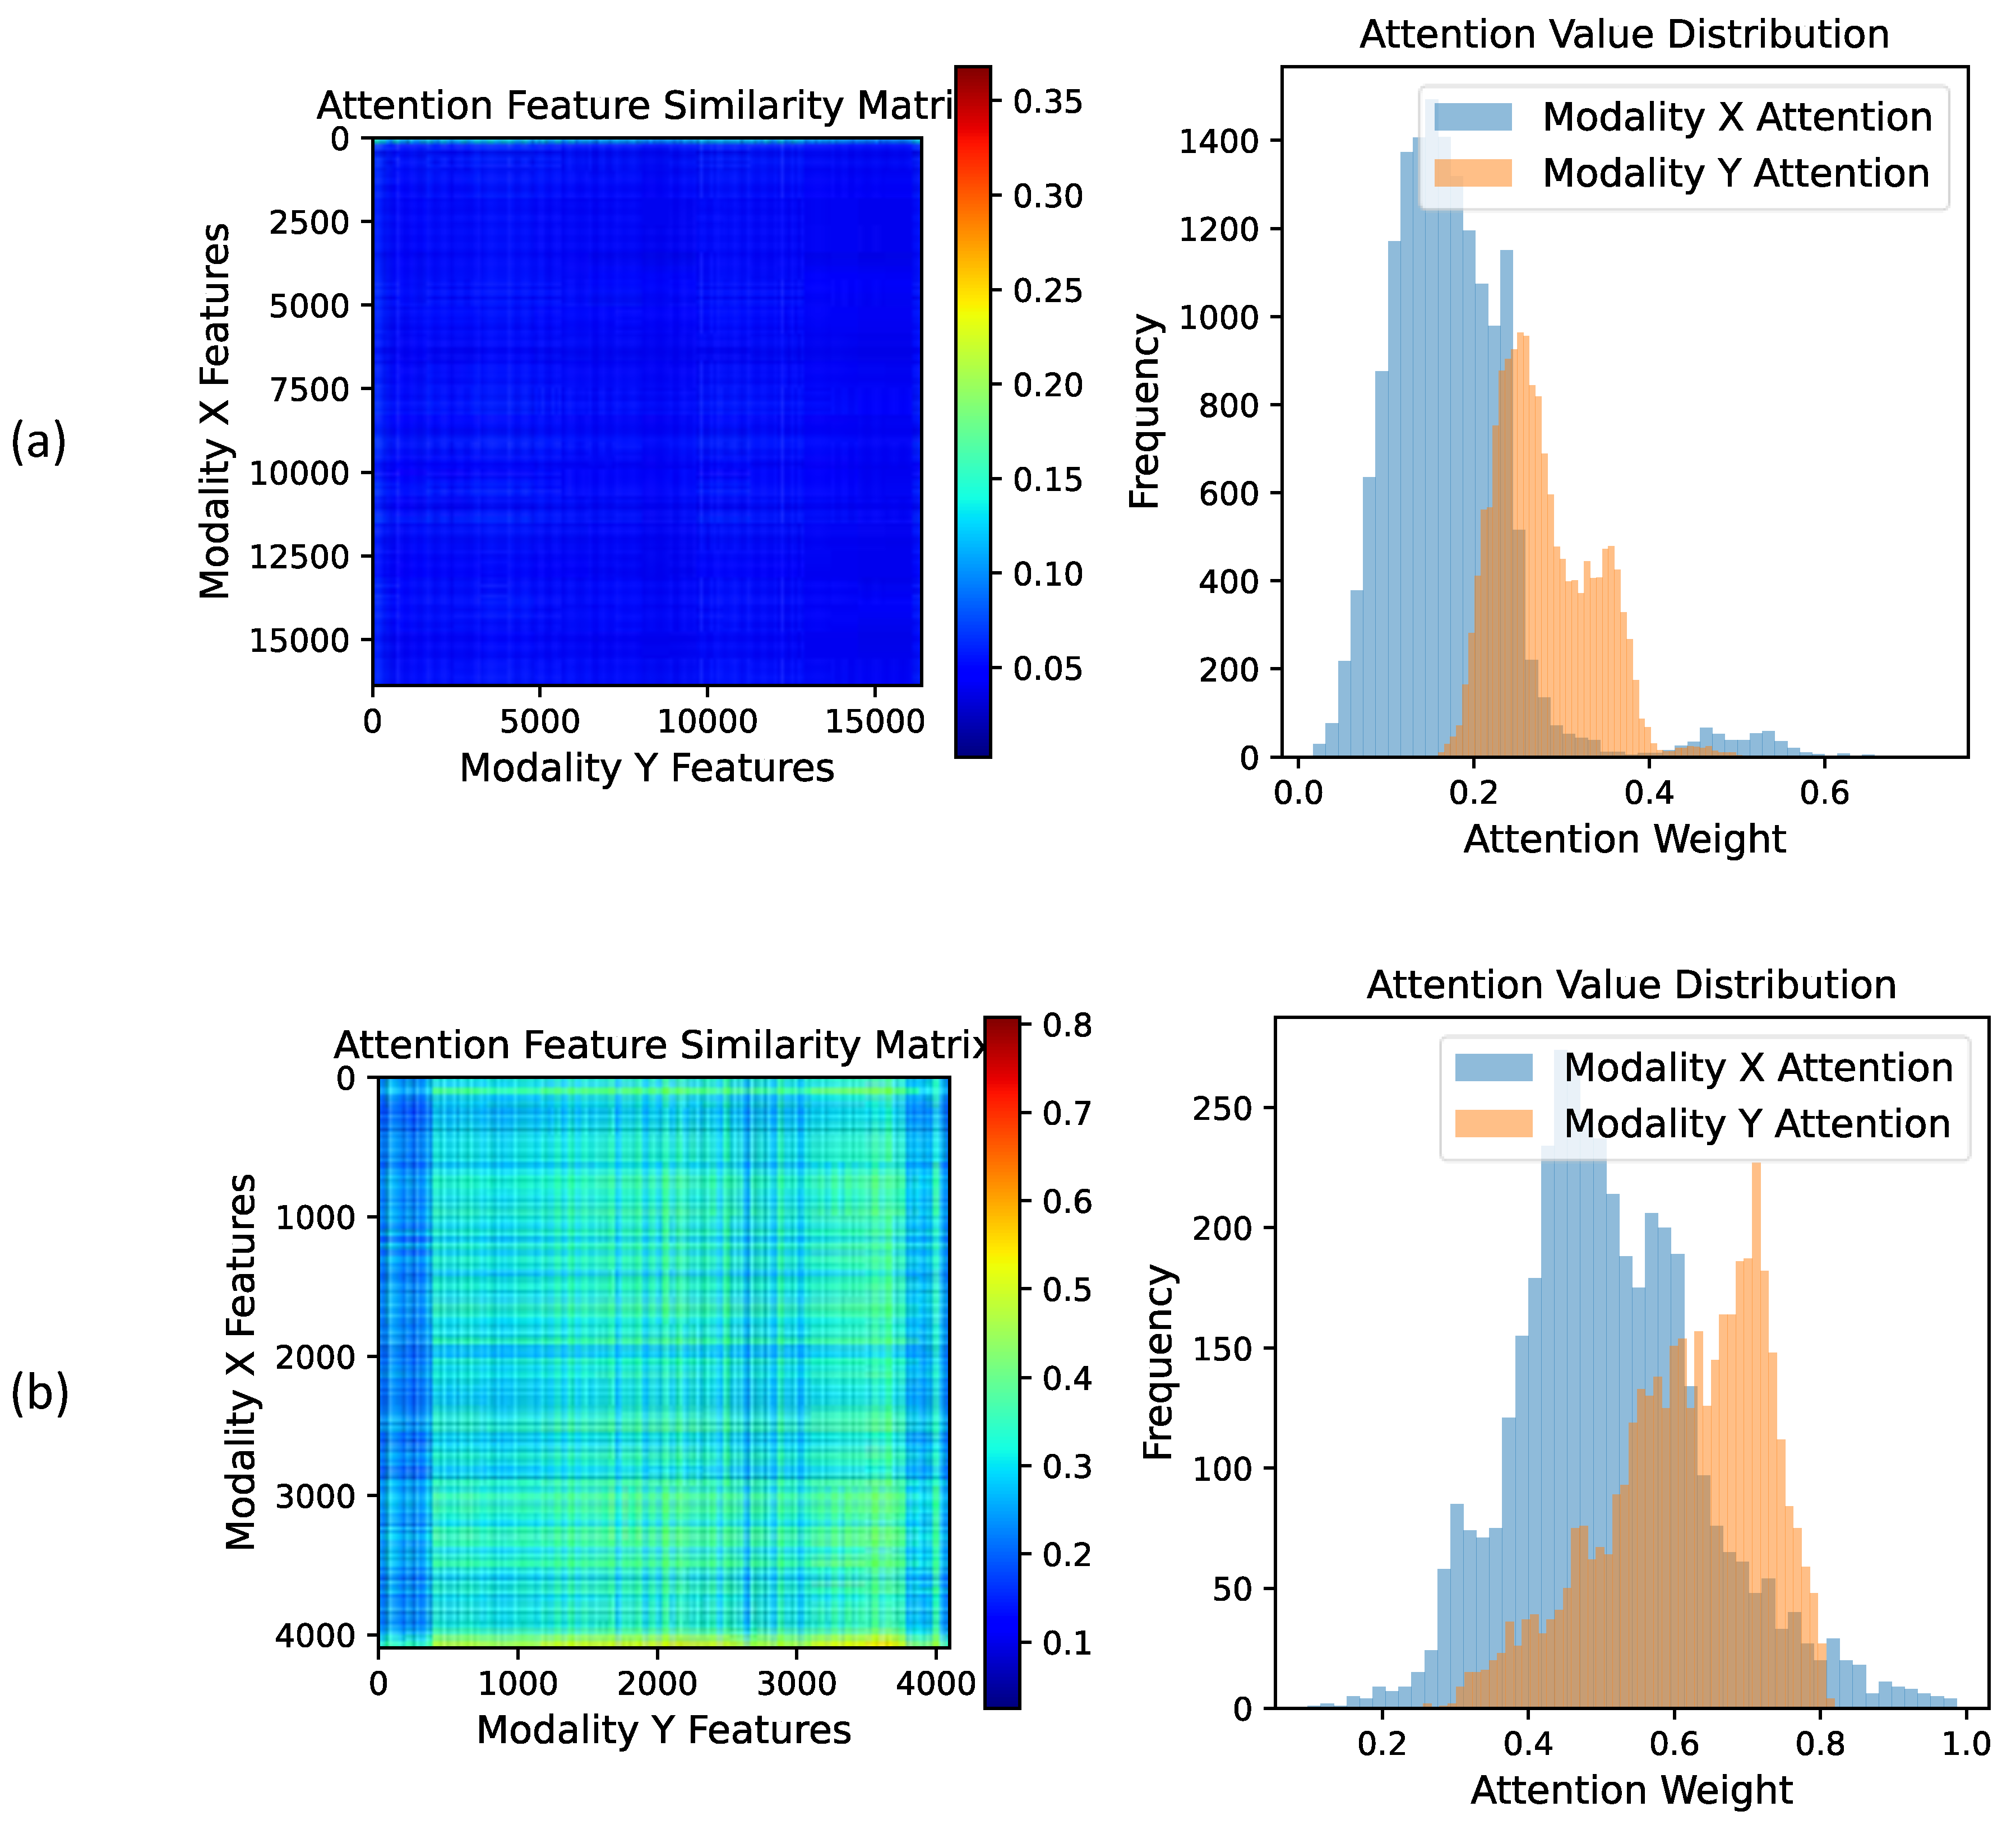
The results demonstrate that, without CIA, the attention maps of both modalities primarily focus on salient regions within their respective images, yet these regions exhibit significant discrepancies. For instance, salient regions in optical images focus on texture-rich areas, whereas SAR images emphasize regions with strong reflectivity. After CIA processing, however, the attention map of the optical image begins to converge towards salient regions of the SAR image and vice versa. This indicates that the CIA module enables mutual guidance between modalities, allowing it to learn complementary salient information and extract more consistent representations. Furthermore, Figure 16 presents the post-CIA attention value distribution and feature similarity matrix. The distribution of the attention weights reveals that, following the application of the CIA module, the alignment between modalities is significantly enhanced, as the distribution of the attention weights across different modalities becomes increasingly similar. By directing each modality to focus on the same salient regions as the other modality, the CIA module facilitates the extraction of more repeatable feature points and the generation of more similar feature vectors for the same point, which is crucial for multimodal image registration. The similarity matrix indicates a significant increase in cross-modal feature similarity after CIA processing, thereby demonstrating the module’s ability to extract more consistent features and, consequently, improving the accuracy of multimodal image registration.
Based on these experimental analyses, we conclude that the CIA module demonstrates significant effectiveness in optical–SAR image registration. By enabling mutual guidance between modalities, it facilitates the extraction of highly consistent cross-modal features, substantially enhancing the registration accuracy.

4.10. Parameter Analysis

As introduced in Section 3.2 and Section 3.3, the proposed method relies on several key hyperparameters, which can be categorized into two groups: the architectural parameter and functional parameters. The architectural parameter is the descriptor dimensionality and the functional parameters are λ and α .
For the architectural parameter, we observed that the model performance remains robust across a certain range. The analysis of the descriptor dimensionality, as detailed in Table 14, indicates a consistent trend. While the 128-dimensional configuration serves as a computationally efficient baseline, increasing the dimensionality to 256 brings consistent performance gains on both datasets. Specifically, on the SEN1-2 dataset, the 256-dimensional descriptor achieves the highest NCM and repeatability, showing a noticeable improvement over the 128-dimensional version. This trend is further supported on OSdataset, where the 256-dimensional setup also attains the highest NCM and the lowest RMSE. In contrast, the 512-dimensional descriptor introduces higher computational costs without outperforming the 256-dimensional configuration and even leads to a performance degradation regarding certain metrics. Thus, we conclude that the 256-dimensional descriptor offers the best balance, enhancing the representational capacity and matching accuracy while avoiding the unnecessary overhead of higher dimensions.
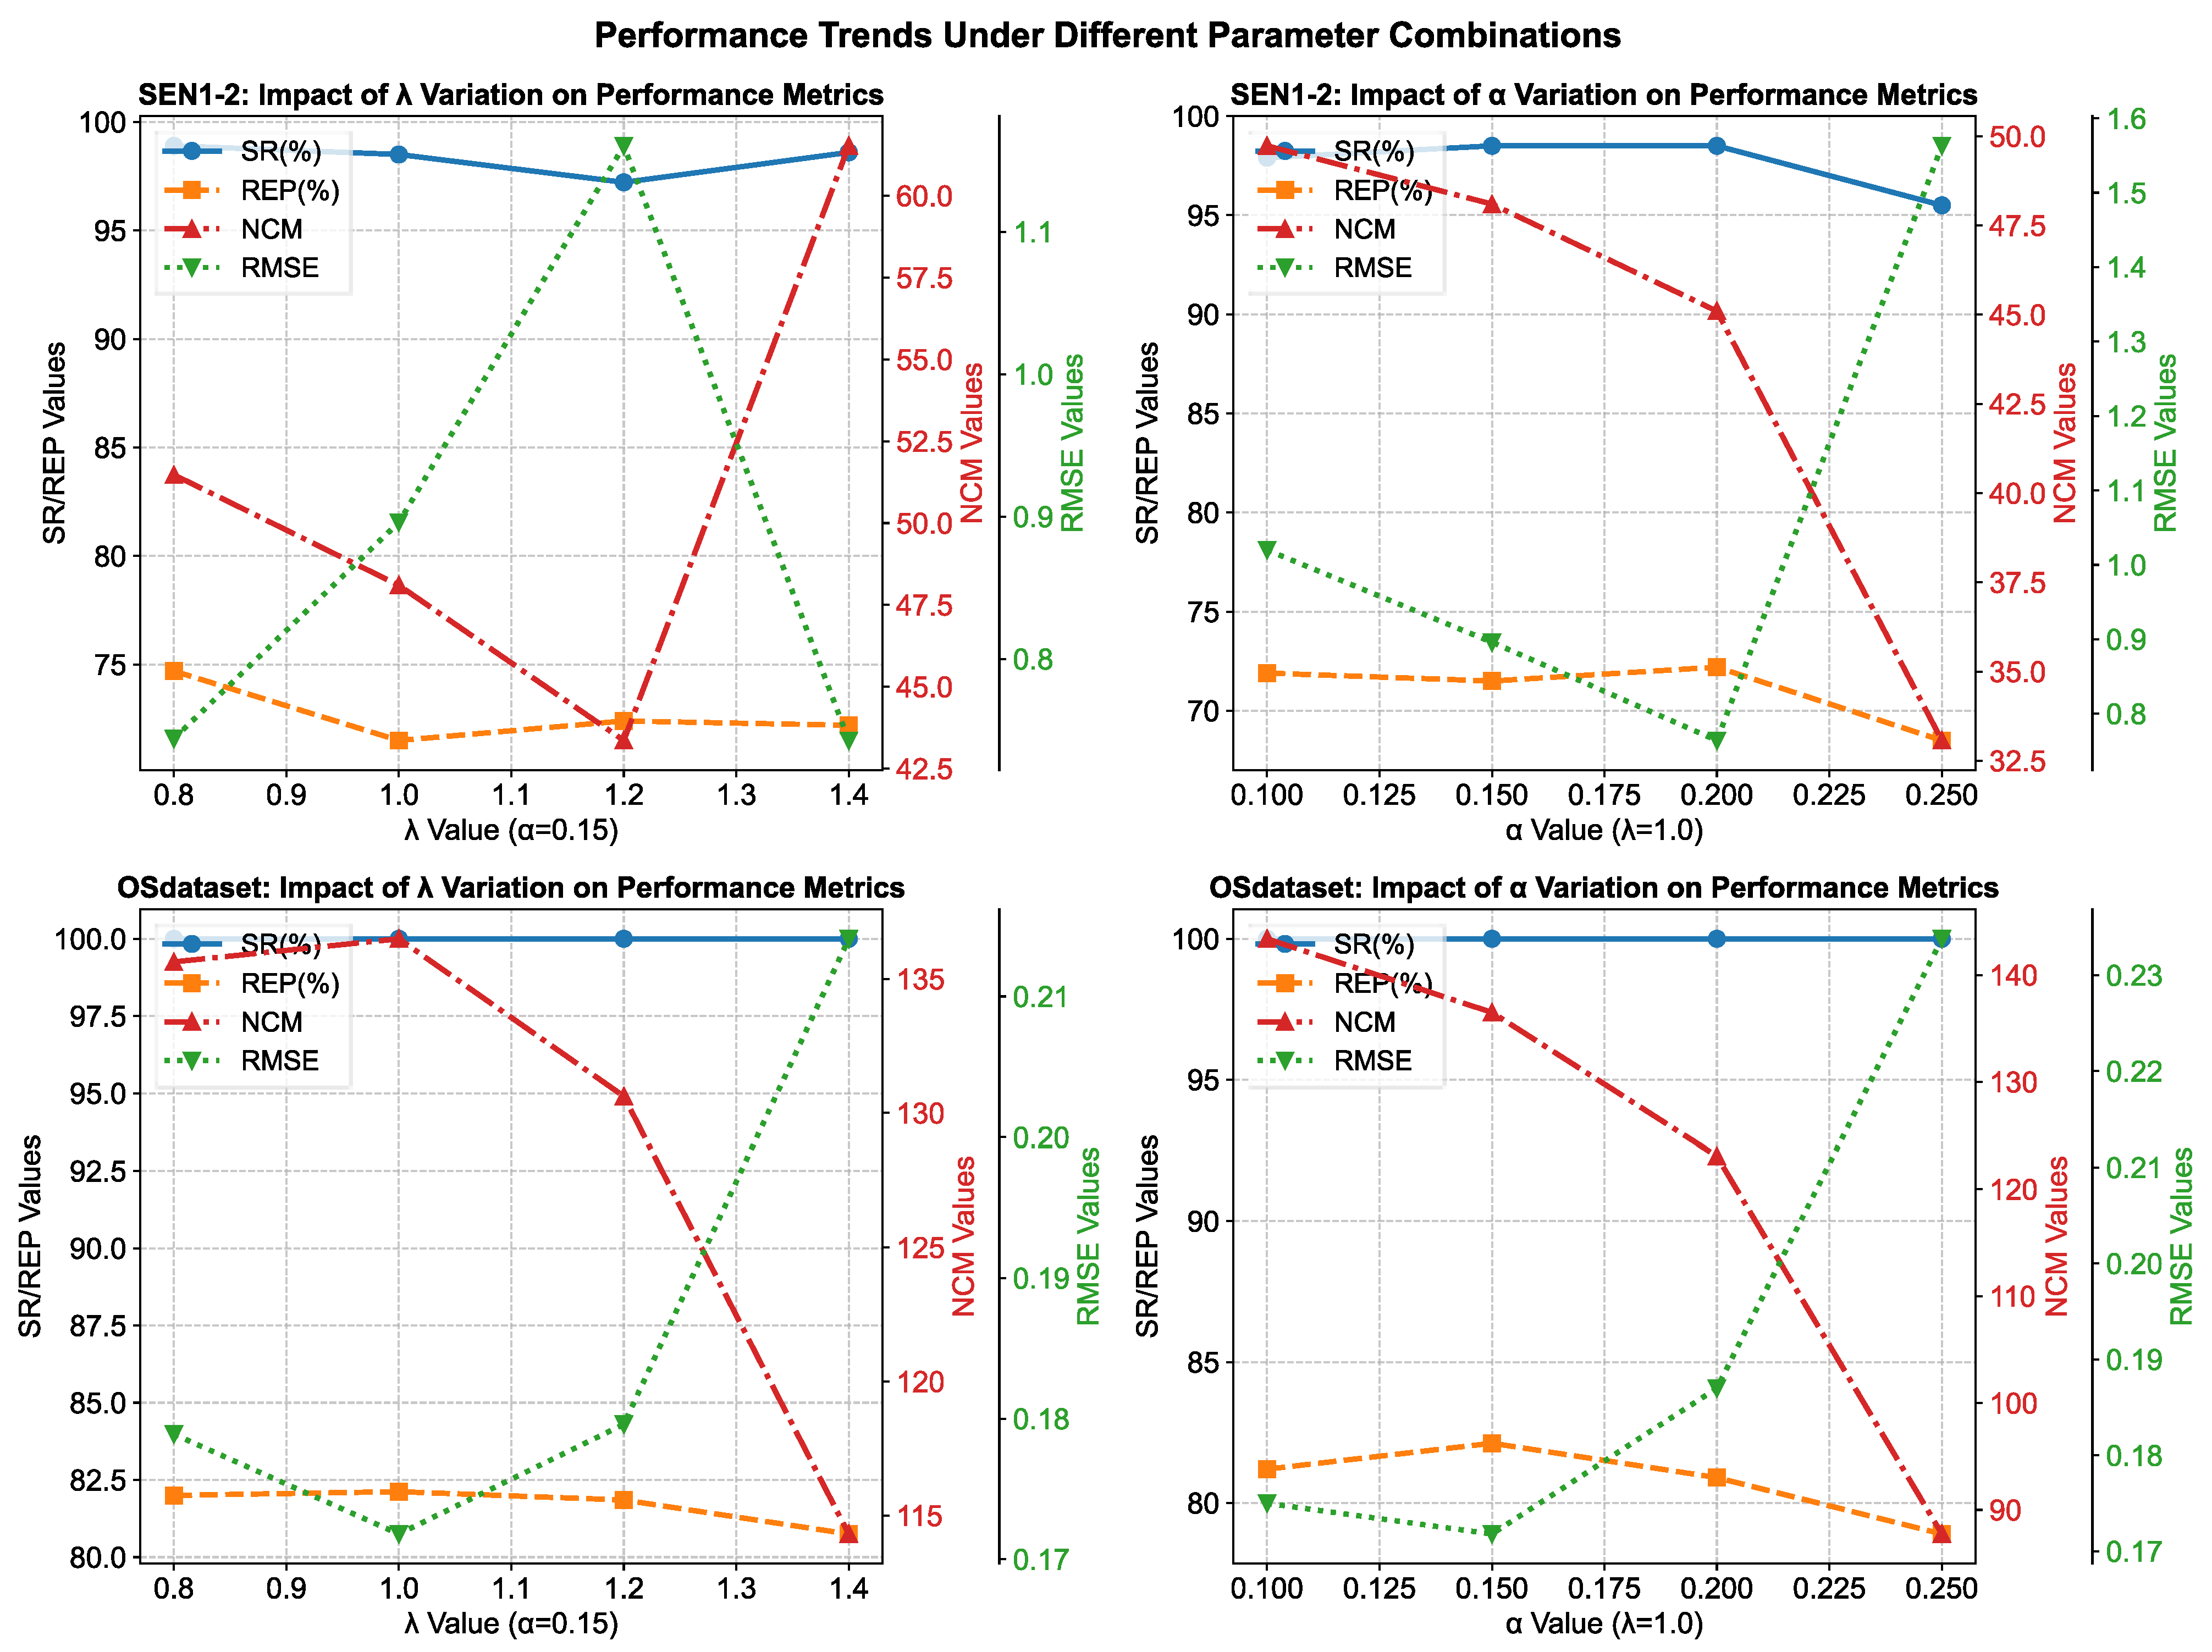
Regarding the functional parameters, λ controls the weight ratio of the descriptor loss in the loss function; a higher λ value increases the proportion of the descriptor loss in the total loss, potentially enhancing the network’s focus on the descriptor generation task. The α parameter determines the number of feature points selected from the SAR image; a larger α value means that fewer SAR image feature points are used, reducing the amount of SAR information introduced, while a smaller α value may result in the inclusion of excessive noise points, thereby interfering with the network’s learning process.
Through systematic ablation studies on the SEN1-2 dataset, we investigated the influences of hyperparameters λ and α on model performance. The experimental results demonstrate that both parameters impact the matching accuracy, yet they exhibit distinct effects across different metrics.
Our systematic ablation studies on the SEN1-2 dataset reveal influence patterns (Figure 17). For λ , we observe a performance peak at λ = 1.0 . When λ is too low, the model underfits the descriptor learning task, leading to a noticeable drop in matching accuracy. Conversely, an excessively high value causes the network to overprioritize descriptor optimization at the expense of feature detection. This indicates that λ is crucial for balancing the two core subtasks. Similarly, α exhibits a pronounced optimal range. The best overall performance is achieved at α = 0.15 . A smaller α introduces excessive feature points, including many low-quality and noisy candidates, which disrupts the matching process. A larger α overfilters the features, resulting in insufficient information for robust matching. This demonstrates that α effectively acts as a noise filter and information regulator.
Notably, on OSdataset—used exclusively to test generalization—the model maintained excellent performance across all parameter configurations. While the lowest RMSE was observed at λ = 1.0 , the highest NCM occurred at α = 0.10 , indicating dataset-specific characteristics. However, based on the comprehensive validation on SEN1-2, we fixed the parameters at λ = 1.0 and α = 0.15 for final evaluation. The model achieved remarkably strong performance on OSdataset even with these fixed parameters, demonstrating robust generalization capabilities.
These findings confirm that, while the optimal parameters may vary across datasets, the selected configuration provides an excellent balance between feature detection and descriptor learning, enabling robust performance across diverse scenarios.
5. Conclusions

This article proposes a novel heterogeneous remote sensing image registration method that aims to address the registration challenges between optical images and SAR images. By introducing the PLM and PTIF, the method significantly improves the performance of multimodal remote sensing image registration in multiple aspects. The PLM enhances the feature point detection repeatability by providing stable and repeatable feature pair annotations for optical–SAR image pairs. The PTIF concurrently extracts discriminative and complementary cross-modal features to optimize the cross-modal matching performance.
The experimental results reveal that the proposed PLISA exhibits outstanding performance in handling speckle noise inherent in SAR images, as well as rotational transformations and scale variations. Specifically, the proposed method demonstrates superiority in key metrics, while maintaining stability and reliability under geometric transformations and multimodal differences. In the future, we would like to prioritize research on network lightweighting by exploring model compression pathways—including knowledge distillation and model pruning—to significantly enhance the computational efficiency of PLISA. Concurrently, we aim to incorporate more advanced architectures—such as Transformers—and leverage pre-trained models to address key challenges in optical and SAR remote sensing image registration, thereby substantially improving the robustness. Furthermore, we plan to extend our method to tackle the registration of partially overlapping image pairs—a persistent and critical challenge in real-world scenarios.

Author Contributions

Conceptualization, Y.Z. and L.W.; methodology, Y.Z.; software, Y.Z.; validation, Y.Z. and R.L.; formal analysis, Y.Z.; investigation, Y.Z. and R.L.; resources, L.W., L.H. and Z.Z.; data curation, Y.Z.; writing—original draft preparation, Y.Z.; writing—review and editing, Y.Z. and L.W.; visualization, Y.Z.; supervision, L.W. and L.S.; project administration, Z.Z., L.S. and L.H.; funding acquisition, L.W. All authors have read and agreed to the published version of the manuscript.

Funding

The authors would like to thank the support from the Changchun City–Chinese Academy of Sciences Science and Technology Innovation Cooperation Special Project (Project No. 24SH13), and they also appreciate the National Natural Science Foundation of China for its support through the Key Project under Grant 62433003.

Data Availability Statement

The original contributions of the study have been presented in the article. More detailed data are available on request from the corresponding author.

Conflicts of Interest

The authors declare no conflicts of interest.

References

  1. Li, S.T.; Li, C.Y.; Kang, X.D. Development status and future prospects of multi-source remote sensing image fusion. Natl. Remote Sens. Bull. 2021, 25, 148–166. [Google Scholar]
  2. Yan, L.; Wang, Z.; Liu, Y.; Ye, Z. Generic and Automatic Markov Random Field-Based Registration for Multimodal Remote Sensing Image Using Grayscale and Gradient Information. Remote Sens. 2018, 10, 1228. [Google Scholar] [CrossRef]
  3. Quan, D.; Wei, H.; Wang, S.; Gu, Y.; Hou, B.; Jiao, L. A Novel Coarse-to-Fine Deep Learning Registration Framework for Multimodal Remote Sensing Images. IEEE Trans. Geosci. Remote Sens. 2023, 61, 1–16. [Google Scholar] [CrossRef]
  4. Zhu, B.; Ye, Y. Multimodal remote sensing image registration: A survey. J. Image Graph. 2024, 29, 2137–2161. [Google Scholar] [CrossRef]
  5. Cui, S.; Ma, A.; Wan, Y.; Zhong, Y.; Luo, B.; Xu, M. Cross-Modality Image Matching Network With Modality-Invariant Feature Representation for Airborne-Ground Thermal Infrared and Visible Datasets. IEEE Trans. Geosci. Remote Sens. 2022, 60, 1–14. [Google Scholar] [CrossRef]
  6. Deng, Y.; Ma, J. ReDFeat: Recoupling Detection and Description for Multimodal Feature Learning. IEEE Trans. Image Process. 2023, 32, 591–602. [Google Scholar] [CrossRef]
  7. Revaud, J.; Weinzaepfel, P.; De Souza, C.; Pion, N.; Csurka, G.; Cabon, Y.; Humenberger, M. R2D2: Repeatable and Reliable Detector and Descriptor. arXiv 2019, arXiv:1906.06195. [Google Scholar] [CrossRef]
  8. Detone, D.; Malisiewicz, T.; Rabinovich, A. SuperPoint: Self-Supervised Interest Point Detection and Description. In Proceedings of the IEEE Conference on Computer Vision and Pattern Recognition Workshops, Honolulu, HI, USA, 21–26 July 2017; pp. 224–236. [Google Scholar]
  9. Rosten, E. Machine learning for high-speed corner detection. In Proceedings of the European Conference on Computer Vision, Graz, Austria, 7–13 May 2006. [Google Scholar]
  10. Detone, D.; Malisiewicz, T.; Rabinovich, A. Deep Image Homography Estimation. arXiv 2016, arXiv:1606.03798. [Google Scholar] [CrossRef]
  11. Wang, S.; Zhou, J.; Yu, T. Model Compression Based on SAR-Optical Image Mapping Task. In Proceedings of the 2022 14th International Conference on Signal Processing Systems (ICSPS), Virtual, 18–20 November 2022; pp. 476–485. [Google Scholar] [CrossRef]
  12. Zhang, H.; Lei, L.; Ni, W.; Tang, T.; Wu, J.; Xiang, D.; Kuang, G. Explore Better Network Framework for High-Resolution Optical and SAR Image Matching. IEEE Trans. Geosci. Remote Sens. 2021, 60, 1–18. [Google Scholar] [CrossRef]
  13. Dusmanu, M.; Rocco, I.; Pajdla, T.; Pollefeys, M.; Sivic, J.; Torii, A.; Sattler, T. D2-Net: A Trainable CNN for Joint Detection and Description of Local Features. arXiv 2019, arXiv:1905.03561. [Google Scholar] [CrossRef]
  14. Zhang, H.; Ni, W.; Yan, W.; Xiang, D.; Wu, J.; Yang, X.; Bian, H. Registration of multimodal remote sensing image based on deep fully convolutional neural network. IEEE J. Sel. Top. Appl. Earth Obs. Remote Sens. 2019, 12, 3028–3042. [Google Scholar] [CrossRef]
  15. Mou, L.; Schmitt, M.; Wang, Y.; Zhu, X.X. A CNN for the identification of corresponding patches in SAR and optical imagery of urban scenes. In Proceedings of the 2017 Joint Urban Remote Sensing Event (JURSE), Dubai, United Arab Emirates, 6–8 March 2017; IEEE: Piscataway, NJ, USA, 2017; pp. 1–4. [Google Scholar]
  16. Hughes, L.H.; Marcos, D.; Lobry, S.; Tuia, D.; Schmitt, M. A deep learning framework for matching of SAR and optical imagery. ISPRS J. Photogramm. Remote Sens. 2020, 169, 166–179. [Google Scholar] [CrossRef]
  17. Ye, Y.; Shan, J.; Bruzzone, L.; Shen, L. Robust Registration of Multimodal Remote Sensing Images Based on Structural Similarity. IEEE Trans. Geosci. Remote Sens. 2017, 55, 2941–2958. [Google Scholar] [CrossRef]
  18. Ye, Y.; Bruzzone, L.; Shan, J.; Bovolo, F.; Zhu, Q. Fast and Robust Matching for Multimodal Remote Sensing Image Registration. IEEE Trans. Geosci. Remote Sens. 2019, 57, 9059–9070. [Google Scholar] [CrossRef]
  19. Wang, Z.; Yu, A.; Zhang, B.; Dong, Z.; Chen, X. A Fast Registration Method for Optical and SAR Images Based on SRAWG Feature Description. Remote Sens. 2022, 14, 5060. [Google Scholar] [CrossRef]
  20. Wan, G.; Ye, Z.; Xu, Y.; Huang, R.; Zhou, Y.; Xie, H.; Tong, X. Multimodal Remote Sensing Image Matching Based on Weighted Structure Saliency Feature. IEEE Trans. Geosci. Remote Sens. 2024, 62, 1–16. [Google Scholar] [CrossRef]
  21. Li, X.; Wang, T.; Cui, H.; Zhang, G.; Cheng, Q.; Dong, T.; Jiang, B. SARPointNet: An Automated Feature Learning Framework for Spaceborne SAR Image Registration. IEEE J. Sel. Top. Appl. Earth Obs. Remote Sens. 2022, 15, 6371–6381. [Google Scholar] [CrossRef]
  22. Pluim, J.; Maintz, J.; Viergever, M. Mutual-information-based registration of medical images: A survey. IEEE Trans. Med. Imaging 2003, 22, 986–1004. [Google Scholar] [CrossRef]
  23. Burger, W.; Burge, M.J. Principles of Digital Image Processing: Core Algorithms, 1st ed.; Springer Publishing Company, Incorporated: London, UK, 2009. [Google Scholar]
  24. Hisham, M.; Yaakob, S.N.; Raof, R.; Nazren, A.A.; Wafi, N. Template Matching using Sum of Squared Difference and Normalized Cross Correlation. In Proceedings of the 2015 IEEE Student Conference on Research and Development (SCOReD), Kuala Lumpur, Malaysia, 13–14 December 2015; pp. 100–104. [Google Scholar] [CrossRef]
  25. Quan, D.; Wei, H.; Wang, S.; Li, Y.; Chanussot, J.; Guo, Y.; Hou, B.; Jiao, L. Efficient and robust: A cross-modal registration deep wavelet learning method for remote sensing images. IEEE J. Sel. Top. Appl. Earth Obs. Remote Sens. 2023, 16, 4739–4754. [Google Scholar] [CrossRef]
  26. Moravec, H.P. Obstacle Avoidance and Navigation in the Real World by a Seeing Robot Rover. Ph.D. Thesis, Stanford University, Stanford, CA, USA, 1980. [Google Scholar]
  27. Harris, C.G.; Stephens, M.J. A combined corner and edge detector. In Proceedings of the Alvey Vision Conference, Manchester, UK, 31 August–2 September 1988. [Google Scholar]
  28. Lowe, D.G. Distinctive image features from scale-invariant keypoints. Int. J. Comput. Vis. 2004, 60, 91–110. [Google Scholar] [CrossRef]
  29. Rosten, E.; Porter, R.; Drummond, T. Faster and better: A machine learning approach to corner detection. IEEE Trans. Pattern Anal. Mach. Intell. 2008, 32, 105–119. [Google Scholar] [CrossRef]
  30. Bay, H.; Tuytelaars, T.; Gool, L.V. SURF: Speeded Up Robust Features. In Proceedings of the European Conference on Computer Vision, Graz, Austria, 7–13 May 2006. [Google Scholar]
  31. Dellinger, F.; Delon, J.; Gousseau, Y.; Michel, J.; Tupin, F. SAR-SIFT: A SIFT-like algorithm for SAR images. IEEE Trans. Geosci. Remote Sens. 2014, 53, 453–466. [Google Scholar] [CrossRef]
  32. Xiang, Y.; Wang, F.; You, H. OS-SIFT: A robust SIFT-like algorithm for high-resolution optical-to-SAR image registration in suburban areas. IEEE Trans. Geosci. Remote Sens. 2018, 56, 3078–3090. [Google Scholar] [CrossRef]
  33. Sedaghat, A.; Ebadi, H. Distinctive order based self-similarity descriptor for multi-sensor remote sensing image matching. ISPRS J. Photogramm. Remote Sens. 2015, 108, 62–71. [Google Scholar] [CrossRef]
  34. Sedaghat, A.; Mohammadi, N. Illumination-robust remote sensing image matching based on oriented self-similarity. ISPRS J. Photogramm. Remote Sens. 2019, 153, 21–35. [Google Scholar] [CrossRef]
  35. Li, J.; Hu, Q.; Ai, M. RIFT: Multi-Modal Image Matching Based on Radiation-Variation Insensitive Feature Transform. IEEE Trans. Image Process. 2020, 29, 3296–3310. [Google Scholar] [CrossRef] [PubMed]
  36. Merkle, N.; Luo, W.; Auer, S.; Müller, R.; Urtasun, R. Exploiting deep matching and SAR data for the geo-localization accuracy improvement of optical satellite images. Remote Sens. 2017, 9, 586. [Google Scholar] [CrossRef]
  37. Cao, S.Y.; Yu, B.; Luo, L.; Zhang, R.; Chen, S.J.; Li, C.; Shen, H.L. PCNet: A structure similarity enhancement method for multispectral and multimodal image registration. Inf. Fusion 2023, 94, 200–214. [Google Scholar] [CrossRef]
  38. Xiang, D.; Xu, Y.; Cheng, J.; Hu, C.; Sun, X. An algorithm based on a feature interaction-based keypoint detector and Sim-CSPNet for SAR image registration. J. Radars 2022, 11, 1081–1097. [Google Scholar]
  39. Hughes, L.H.; Schmitt, M.; Mou, L.; Wang, Y.; Zhu, X.X. Identifying Corresponding Patches in SAR and Optical Images with a Pseudo-Siamese CNN. IEEE Geosci. Remote Sens. Lett. 2018, 5, 784–788. [Google Scholar] [CrossRef]
  40. Zhou, L.; Ye, Y.; Tang, T.; Nan, K.; Qin, Y. Robust matching for SAR and optical images using multiscale convolutional gradient features. IEEE Geosci. Remote Sens. Lett. 2021, 19, 1–5. [Google Scholar] [CrossRef]
  41. Wei, H.; Shan, X.; Zheng, K.; Huo, L.; Tang, P. Review of SAR and Optical Image Registration Based on Deep Learning. Radio Eng. 2021, 51, 1363–1372. [Google Scholar]
  42. Du, W.L.; Zhou, Y.; Zhao, J.; Tian, X. K-Means Clustering Guided Generative Adversarial Networks for SAR-Optical Image Matching. IEEE Access 2020, 8, 217554–217572. [Google Scholar] [CrossRef]
  43. Merkle, N.; Auer, S.; Muller, R.; Reinartz, P. Exploring the Potential of Conditional Adversarial Networks for Optical and SAR Image Matching. IEEE J. Sel. Top. Appl. Earth Obs. Remote Sens. 2018, 11, 1811–1820. [Google Scholar] [CrossRef]
  44. Nie, H.; Luo, B.; Liu, J.; Fu, Z.; Liu, W.; Wang, C.; Su, X. A Novel Rotation and Scale Equivariant Network for Optical-SAR Image Matching. IEEE Trans. Geosci. Remote Sens. 2024, 62, 1–14. [Google Scholar] [CrossRef]
  45. James, L.; Nidamanuri, R.R.; Murali Krishnan, S.; Anjaneyulu, R.; Srinivas, C. A Novel Approach for SAR to Optical Image Registration using Deep Learning. In Proceedings of the 2023 International Conference on Machine Intelligence for GeoAnalytics and Remote Sensing (MIGARS), Hyderabad, India, 27–29 January 2023; Volume 1, pp. 1–4. [Google Scholar] [CrossRef]
  46. Song, Z.; Zhang, J.; Xiong, L.; He, H. Multimodal Image Registration Algorithm Using Style Transfer and Feature Points. Remote Sens. Inf. 2021, 36, 6. [Google Scholar]
  47. Li, Z.; Fu, Z.; Nie, H.; Chen, S. PM-Net: A Multi-Level Keypoints Detector and Patch Feature Learning Network for Optical and SAR Image Matching. Appl. Sci. 2022, 12, 5989. [Google Scholar] [CrossRef]
  48. Li, B.; Guan, D.; Zheng, X.; Chen, Z.; Pan, L. SD-CapsNet: A Siamese Dense Capsule Network for SAR Image Registration with Complex Scenes. Remote Sens. 2023, 15, 1871. [Google Scholar] [CrossRef]
  49. Liao, Y.; Di, Y.; Zhou, H.; Li, A.; Liu, J.; Lu, M.; Duan, Q. Feature Matching and Position Matching Between Optical and SAR With Local Deep Feature Descriptor. IEEE J. Sel. Top. Appl. Earth Obs. Remote Sens. 2022, 15, 448–462. [Google Scholar] [CrossRef]
  50. Xiang, D.; Xie, Y.; Cheng, J.; Xu, Y.; Zhang, H.; Zheng, Y. Optical and SAR Image Registration Based on Feature Decoupling Network. IEEE Trans. Geosci. Remote Sens. 2022, 60, 1–13. [Google Scholar] [CrossRef]
  51. Hoffmann, S.; Brust, C.A.; Shadaydeh, M.; Denzler, J. Registration of High Resolution SAR and Optical Satellite Imagery Using Fully Convolutional Networks. In Proceedings of the IGARSS 2019-2019 IEEE International Geoscience and Remote Sensing Symposium, Yokohama, Japan, 28 July–2 August 2019; IEEE: Piscataway, NJ, USA, 2019. [Google Scholar]
  52. Chen, H.; Luo, Z.; Zhang, J.; Zhou, L.; Bai, X.; Hu, Z.; Tai, C.L.; Quan, L. Learning to Match Features with Seeded Graph Matching Network. arXiv 2021, arXiv:2108.08771. [Google Scholar] [CrossRef]
  53. Sun, J.; Shen, Z.; Wang, Y.; Bao, H.; Zhou, X. LoFTR: Detector-Free Local Feature Matching with Transformers. In Proceedings of the Computer Vision and Pattern Recognition, Nashville, TN, USA, 20–25 June 2021. [Google Scholar]
  54. Wang, Y.; He, X.; Peng, S.; Tan, D.; Zhou, X. Efficient LoFTR: Semi-Dense Local Feature Matching with Sparse-Like Speed. In Proceedings of the 2024 IEEE/CVF Conference on Computer Vision and Pattern Recognition (CVPR), Seattle, WA, USA, 17–18 June 2024; pp. 21666–21675. [Google Scholar] [CrossRef]
  55. Lu, X.; Du, S. Raising the Ceiling: Conflict-Free Local Feature Matching with Dynamic View Switching. In Proceedings of the Computer Vision-ECCV 2024: 18th European Conference, Milan, Italy, 29 September–4 October 2024; Proceedings, Part XLII. Springer: Berlin/Heidelberg, Germany, 2024; pp. 256–273. [Google Scholar] [CrossRef]
  56. Liu, Y.; He, W.; Zhang, H. Grid: Guided refinement for detector-free multimodal image matching. IEEE Trans. Image Process. 2024, 33, 5892–5906. [Google Scholar] [CrossRef]
  57. Xiao, Y.; Zhang, C.; Chen, Y.; Jiang, B.; Tang, J. ADRNet: Affine and Deformable Registration Networks for Multimodal Remote Sensing Images. IEEE Trans. Geosci. Remote Sens. 2024, 62, 1–13. [Google Scholar] [CrossRef]
  58. Edstedt, J.; Sun, Q.; Bkman, G.; Wadenbck, M.; Felsberg, M. RoMa: Robust Dense Feature Matching. In Proceedings of the IEEE/CVF Conference on Computer Vision and Pattern Recognition, Vancouver, BC, Canada, 18–22 June 2023; IEEE: Piscataway, NJ, USA, 2023. [Google Scholar]
  59. Chen, J.; Chen, X.; Chen, S.; Liu, Y.; Rao, Y.; Yang, Y.; Wang, H.; Wu, D. Shape-Former: Bridging CNN and Transformer via ShapeConv for multimodal image matching. Inf. Fusion 2023, 91, 445–457. [Google Scholar] [CrossRef]
  60. Lin, M.; Liu, B.; Liu, Y.; Wang, Q. A CNN-Transformer Hybrid Feature Descriptor for Optical-SAR Image Registration. In Proceedings of the IGARSS 2023-2023 IEEE International Geoscience and Remote Sensing Symposium, Pasadena, CA, USA, 16–21 July 2023; pp. 6069–6072. [Google Scholar] [CrossRef]
  61. Chen, J.; Chen, S.; Chen, X.; Dai, Y.; Yang, Y. CSR-Net: Learning Adaptive Context Structure Representation for Robust Feature Correspondence. IEEE Trans. Image Process. 2022, 31, 3197–3210. [Google Scholar] [CrossRef] [PubMed]
  62. Ye, Y.; Yang, C.; Gong, G.; Yang, P.; Quan, D.; Li, J. Robust optical and SAR image matching using attention-enhanced structural features. IEEE Trans. Geosci. Remote Sens. 2024, 62, 1–12. [Google Scholar] [CrossRef]
  63. Mcdirmid, S.; Hsieh, W.C. SuperGlue: Component Programming with Object-Oriented Signals. In Proceedings of the European Conference on Object-Oriented Programming, Nantes, France, 3–7 July 2006. [Google Scholar]
  64. Lindenberger, P.; Sarlin, P.E.; Pollefeys, M. LightGlue: Local Feature Matching at Light Speed. In Proceedings of the ICCV, Paris, France, 1–6 October 2023. [Google Scholar]
  65. Li, J.; Yang, B.; Chen, C.; Habib, A. NRLI-UAV: Non-rigid registration of sequential raw laser scans and images for low-cost UAV LiDAR point cloud quality improvement. ISPRS J. Photogramm. Remote Sens. 2019, 158, 123–145. [Google Scholar] [CrossRef]
  66. Kang, S.; Liao, Y.; Li, J.; Liang, F.; Li, Y.; Zou, X.; Li, F.; Chen, X.; Dong, Z.; Yang, B. CoFiI2P: Coarse-to-Fine Correspondences for Image-to-Point Cloud Registration. IEEE Robot. Autom. Lett. 2023, 9, 10264–10271. [Google Scholar] [CrossRef]
  67. Liao, Y.; Li, J.; Kang, S.; Li, Q.; Zhu, G.; Yuan, S.; Dong, Z.; Yang, B. SE-Calib: Semantic Edge-Based LiDAR–Camera Boresight Online Calibration in Urban Scenes. IEEE Trans. Geosci. Remote Sens. 2023, 61, 1–13. [Google Scholar] [CrossRef]
  68. Zhang, W.; Zhao, R.; Yao, Y.; Wan, Y.; Wu, P.; Li, J.; Li, Y.; Zhang, Y. Multi-Resolution SAR and Optical Remote Sensing Image Registration Methods: A Review, Datasets, and Future Perspectives. arXiv 2025, arXiv:2502.01002. [Google Scholar] [CrossRef]
  69. Xie, Z. Research on Key Technology of Visible and SAR Remote Sensing Image Registration. Ph.D. Thesis, Changchun Institute of Optics, Fine Mechanics and Physics, Chinese Academy of Sciences, Changchun, China, 2022. [Google Scholar]
  70. Fan, J.; Ye, Y.; Li, J.; Liu, G.; Li, Y. A Novel Multiscale Adaptive Binning Phase Congruency Feature for SAR and Optical Image Registration. IEEE Trans. Geosci. Remote Sens. 2022, 60, 1–16. [Google Scholar] [CrossRef]
  71. Hu, X.; Wu, Y.; Li, Z.; Zhao, X.; Liu, X.; Li, M. Synthetic aperture radar and optical image registration using local and global feature learning by modality-shared attention network. J. Appl. Remote Sens. 2023, 17, 036504. [Google Scholar] [CrossRef]
  72. Xiang, Y.; Tao, R.; Wang, F.; You, H.; Han, B. Automatic Registration of Optical and SAR Images Via Improved Phase Congruency Model. IEEE J. Sel. Top. Appl. Earth Obs. Remote Sens. 2020, 13, 5847–5861. [Google Scholar] [CrossRef]
  73. Wang, C.; Lu, W.; Li, X.; Yang, J.; Luo, L. M4-SAR: A Multi-Resolution, Multi-Polarization, Multi-Scene, Multi-Source Dataset and Benchmark for Optical-SAR Fusion Object Detection. arXiv 2025, arXiv:2505.10931. [Google Scholar]
  74. Ebel, P.; Meraner, A.; Schmitt, M.; Zhu, X.X. Multisensor Data Fusion for Cloud Removal in Global and All-Season Sentinel-2 Imagery. IEEE Trans. Geosci. Remote Sens. 2020, 59, 5866–5878. [Google Scholar] [CrossRef]
  75. Ren, J.; Jiang, X.; Li, Z.; Liang, D.; Zhou, X.; Bai, X. MINIMA: Modality Invariant Image Matching. arXiv 2024, arXiv:2412.19412. [Google Scholar] [CrossRef]
  76. Xiang, Q.; Wang, X.; Song, Y.; Lei, L. Dynamic Bound Adaptive Gradient Methods with Belief in Observed Gradients. Pattern Recognit. 2025, 168, 111819. [Google Scholar] [CrossRef]
Figure 1. Overall architecture of the proposed PLISA. The proposed method consists of two main stages. In the first stage, the APLM labels the feature point locations in the input images, providing precise supervision for the subsequent feature point detection task. Here, Po denotes the feature point labels for both images. The second stage involves image registration, primarily conducted using the PTIF.
Remotesensing 17 03571 g001
Figure 2. The architecture of the APLM. The red and yellow circles superimposed on the images denote feature points detected by MagicPoint [8], representing optical and SAR image keypoints, respectively.
Remotesensing 17 03571 g002
Figure 3. The architecture of the CIA module. The CIA module is designed to enhance the learning capabilities across different modalities.
Remotesensing 17 03571 g003
Figure 4. Image samples from OSdataset and the SEN1-2 dataset. (Left) SEN1-2 dataset; (Right) OSdataset.
Remotesensing 17 03571 g004
Figure 5. Slight translation scenario. Results of image registration for three image pairs from the SEN1-2 dataset. The green lines represent correct matches, while the red ones represent incorrect matches.
Remotesensing 17 03571 g005
Figure 6. Slight translation scenario. Results of image registration for three image pairs from OSdataset. The green lines represent correct matches, while the red ones represent incorrect matches.
Remotesensing 17 03571 g006
Figure 7. Scale transformation scenario. Results of image registration for three image pairs from the SEN1-2 dataset. The green lines represent correct matches, while the red ones represent incorrect matches.
Remotesensing 17 03571 g007
Figure 8. Scale transformation scenario. Results of image registration for three image pairs from OSdataset. The green lines represent correct matches, while the red ones represent incorrect matches.
Remotesensing 17 03571 g008
Figure 9. Rotation and scale transformation scenario. Results of image registration for three image pairs from the SEN1-2 dataset. The green lines represent correct matches, while the red ones represent incorrect matches.
Remotesensing 17 03571 g009
Figure 10. Rotation and scale transformation scenario. Results of image registration for three image pairs from OSdataset. The green lines represent correct matches, while the red ones represent incorrect matches.
Remotesensing 17 03571 g010
Figure 11. Mosaic images. Registration results of the proposed method on two datasets.
Remotesensing 17 03571 g011
Figure 12. Impact of synthetic SAR speckle noise on registration accuracy. (a) SR(%) vs. noise level; (b) NCM vs. noise level; (c) RMSE vs. noise level; (d) REP(%) vs. noise level.
Remotesensing 17 03571 g012
Figure 13. Different network architectures. (a) EDS. (b) DDS.
Remotesensing 17 03571 g013
Figure 14. Training and validation loss curves under different optimizers. (a) Training loss. (b) Validation loss.
Remotesensing 17 03571 g014
Figure 15. Changes in attention maps of different modalities. Modality X corresponds to the visible light modality, while Modality Y refers to the SAR modality. (a) Initial attention map of optical image. (b) Initial attention map of SAR image. (c) Attention map of optical image after one CIA. (d) Attention map of SAR image after one CIA.
Remotesensing 17 03571 g015
Figure 16. Attention feature similarity matrix and attention value distribution. Modality X corresponds to the visible light modality, while Modality Y refers to the SAR modality. (a) Prior to CIA processing. (b) After one CIA module operation. The attention value distribution is depicted in the form of a histogram, providing a visual representation of the distribution of attention weights.
Remotesensing 17 03571 g016
Figure 17. Impacts of hyperparameters on model performance. The results are shown across two datasets.
Remotesensing 17 03571 g017
Table 1. Comparative summary of key characteristics of representative image registration methods.
MethodCore IdeaAdvantagesLimitationsKey Differentiation from PLISA
RIFT [35]Uses phase congruency to detect and describe features simultaneously.Maintains robustness under severe nonlinear radiometric differences.Computationally intensive, unsuitable for large-scale processing.PLISA achieves better efficiency with lower computational cost while maintaining comparable robustness.
SuperPoint [8]       Self-supervised framework using pseudo-labels for interest point detection.Excellent performance on optical images with strong generalization.Fails to handle domain shift in cross-modal scenarios.PLISA specifically addresses optical–SAR matching through adapted self-supervision.
CMM-Net [5]Pseudo-Siamese network with separate and shared layers for different features.Effectively combines modality-specific and invariant characteristics.Simple feature fusion without spatial modeling.PLISA introduces CIA module for dynamic spatial relationship modeling.
ReDFeat [6]Decoupled learning of detector and descriptor via mutual weighting.Enhances training stability and feature reliability.Cannot ensure consistent keypoints across modalities.PLISA employs APLM for consistent keypoint extraction across modalities.
ADRNet [57]Detector-free approach with deformable transformations and attention.Handles complex deformations and captures long-range dependencies.Prohibitively high computational requirements.PLISA uses efficient detector-based approach suitable for large-scale applications.
MINIMA—LG [75]Integrates LightGlue matching with generative data engine for cross-modal matching.Strong generalization via large-scale synthetic data, efficient matching.Limited effectiveness for optical–SAR modality registration.PLISA focuses on architectural innovations rather than data scaling.
MINIMA—RoMa [75]Combines RoMa’s robust matching with generative data scaling.Exceptional robustness to viewpoint/illumination changes, handles multimodal distributions.Detector-free approach suffers from slow inference and high GPU memory consumption.PLISA employs sparse matching for real-time performance.
Table 2. Slight translation scenario. Results of different methods on the SEN1-2 dataset and OSdataset. The bolded data indicates the optimal values.
MethodYearRef.SEN1-2OSdataset
SR (%)NCMRMSEREP (%)SR (%)NCMRMSEREP (%)
RIFT2019[35]72.61954.9732.82616.23272.46560.7474.22419.354
Superpoint2017[8]0.0000.07062.5649.2500.0001.85453.4218.400
CMM-Net2021[5]4.3608.9306.8916.6009.30011.4076.0777.670
ReDFeat2022[6]100.000200.4700.40818.90065.50037.18012.01019.000
ADRNet2024[57]100.000-0.242-77.830-2.092-
MINIMA-LG2024[75]12.60036.79143.38112.20036.90073.23528.29222.100
MINIMA-RoMa2024[75]99.4001341.5070.657-99.5005115.1100.421-
Ours--100.000258.5000.12088.36099.700101.4680.39881.100
Table 3. Scale transformation scenario. The bolded data indicates the optimal values.
MethodYearRef.SEN1-2OSdataset
SR (%)NCMRMSEREP (%)SR (%)NCMRMSEREP (%)
RIFT2019[35]37.06325.8264.80422.12545.99130.1646.00225.550
Superpoint2017[8]0.0000.03762.38410.8890.0001.11856.3779.330
CMM-Net2021[5]0.5506.8508.2716.5000.9407.9308.2026.140
ReDFeat2022[6]20.7006.90037.62523.70013.7005.64648.32423.660
ADRNet2024[57]1.667-19.1711-1.590-20.513-
MINIMA-LG2024[75]15.10047.58841.89815.30055.100140.96220.36537.700
MINIMA-RoMa2024[75]99.8001566.3010.564-99.8005220.6520.419-
Ours--100.000138.5400.14782.74098.99058.0000.72873.500
Table 4. Rotation and scale transformation scenario. The bolded data indicates the optimal values.
MethodYearRef.SEN1-2OSdataset
SR (%)NCMRMSEREP (%)SR (%)NCMRMSEREP (%)
RIFT2019[35]2.7773.49623.02622.0894.6583.58750.84023.748
Superpoint2017[8]0.0000.04865.32910.7000.0000.66762.6009.590
CMM-Net2021[5]0.1501.98021.3775.0100.1702.09025.8893.570
ReDFeat2022[6]7.3802.16077.63023.9901.6500.74192.71524.300
ADRNet2024[57]0.158-122.124-0.117-122.174-
MINIMA-LG2024[75]2.5007.25548.5312.50014.30029.58842.55410.400
MINIMA-RoMa2024[75]83.400401.5201.860-87.3001657.1541.481-
Ours--100.000136.4960.17182.12098.50048.1000.89671.500
Table 5. Partially overlapping dataset. The bolded data indicates the optimal values.
MethodYearRef.OSD-PO
SR (%)NCMRMSEREP (%)
RIFT2019[35]0.0000.71030.40814.400
Superpoint2017[8]0.0000.08080.4812.640
CMM-Net2021[5]0.0002.05429.5503.000
ReDFeat2022[6]5.3002.91543.52924.96
ADRNet2024[57]0.000-121.365-
MINIMA-LG2024[75]7.0009.60446.9825.300
MINIMA-RoMa2024[75]20.100258.24923.117-
Ours--5.5603.08031.85927.760
Table 6. Computational efficiency comparison.
MethodINFERENCE TIME (s)GPU MEMORY (Mib)
Superpoint0.7571654
CMM-Net0.2001744
ReDFeat0.060504
ADRNet0.0391930
MINIMA-LG0.1291452
MINIMA-RoMa2.43713,100
Ours0.1261680
Table 7. Cross-dataset generalization performance evaluation.
DatasetSR (%)NCMRMSEREP (%)
OSdataset98.50048.1000.89671.500
SEN1-2100.000136.4960.17182.120
M4-SAR96.05926.8811.47143.843
SEN12MS-CR100.00094.2140.24371.000
Table 8. Performance comparison under clean and noisy pseudo-labels.
SEN1-2OSdataset
SR (%)NCMRMSEREP (%)SR (%)NCMRMSEREP (%)
Clean100.000136.4960.17182.12098.50048.1000.89671.500
Noise100.000106.0470.20081.01097.50039.9411.308770.470
Table 9. Performance comparison different levels of Gaussian noise.
Noise LevelSEN1-2
SR (%)NCMRMSEREP (%)
σ = 0 100.000136.4960.17182.120
σ = 30 100.000136.2000.17182.100
σ = 50 100.000129.5600.17482.020
σ = 70 100.000122.5500.17981.900
Table 10. Performance comparison of different decoupling strategies.
StrategySEN1-2OSdataset
SR (%)NCMRMSESR (%)NCMRMSE
EDS100.000136.4960.17198.50048.10.896
DDS100.000129.1600.17798.10043.9500.978
Table 11. Performance comparison under different optimizers (Adam vs. AdaBoB).
MethodSEN1-2OSdataset
SR (%)NCMRMSEREP (%)SR (%)NCMRMSEREP (%)
Adam100.000136.4960.17182.12098.50048.1000.89671.500
AdaBoB100.000119.9390.16582.49098.30047.6530.89672.900
Table 12. Ablation study on the CIA module and the APLM.
MethodSEN1-2OSdataset
SR (%)NCMRMSEREP (%)SR (%)NCMRMSEREP (%)
Ours100.000136.4960.17182.12098.50048.1000.89671.500
w/o APLM0.0000.00050.0000.0000.0000.00049.950.01
w/o CIA0.3900.065100.96817.6370.2300.060116.60717.214
Table 13. Performance comparison of different network architectures for the CIA module.
MethodSEN1-2OSdataset
SR (%)NCMRMSEREP (%)SR (%)NCMRMSEREP (%)
CIA100.000136.4960.17182.12098.50048.1000.89671.500
ICA25.50013.83471.46034.0000.2000.138113.00017.500
ICBAM0---0---
Table 14. Performance comparison with different descriptor dimensions.
MethodSEN1-2OSdataset
SR (%)NCMRMSEREP (%)SR (%)NCMRMSEREP (%)
12899.469115.3170.36377.82098.50047.9400.89771.612
256100.000136.4960.17182.12098.50048.1000.89671.500
512100.000127.0570.17881.11398.29044.7241.01471.650
Disclaimer/Publisher’s Note: The statements, opinions and data contained in all publications are solely those of the individual author(s) and contributor(s) and not of MDPI and/or the editor(s). MDPI and/or the editor(s) disclaim responsibility for any injury to people or property resulting from any ideas, methods, instructions or products referred to in the content.