Article

Evaluation of CMORPH V1.0, IMERG V07A and MSWEP V2.8 Satellite Precipitation Products over Peninsular Spain and the Balearic Islands

1
Department of Earth Physics and Thermodynamics, Faculty of Physics, University of Valencia, 46100 Burjassot, Spain
2
Department of Geography, Faculty of Geography and History, University of Valencia, 46010 Valencia, Spain
3
Development and Applications Department, Agencia Estatal de Meteorología, 28040 Madrid, Spain
*
Author to whom correspondence should be addressed.
Remote Sens. 2025, 17(21), 3562; https://doi.org/10.3390/rs17213562
Submission received: 4 September 2025 / Revised: 16 October 2025 / Accepted: 23 October 2025 / Published: 28 October 2025

Highlights

What are the main findings?
  • Over our study area, CMORPH is not recommended and MSWEP is preferable over IMERG, these last two showing mainly CC and POD > 67% but FAR > 30%.
  • Worst performance occurs in those regions with simultaneously high orographical complexity, annual precipitation and altitude. Heavier intensities are easily detected but notably underestimated. Performance is more predictable in spring and autumn.
What are the implication of the main finding?
  • These SPPs should be used with caution.
  • We recommend first analysing their performance on the specific application of interest.

Abstract

Climate change is altering the global distribution of precipitation, especially in Mediterranean areas with heterogeneous climates. The spatiotemporal variability of precipitation complicates its monitoring. Satellite-derived precipitation products (SPPs) usually offer global continuous coverage at daily scale; however, their coarse spatial resolution and indirect measurement introduce relevant bias. We analysed the suitability of CMORPH V1.0, IMERG V07A and MSWEP V2.8 across Peninsular Spain and Balearic Islands using Agencia Estatal de Meteorología (AEMET) gauge data as reference, and investigated performance dependence on seasonality, precipitation intensity, altitude and orography. CMORPH is not recommended and MSWEP is preferable over IMERG, although MSWEP performs worse for lighter intensities and summer. IMERG and MSWEP show mainly Correlation Coefficient (CC) and Probability of Detection (POD) > 67 % , and False Alarm Ratio (FAR) > 30 % (vice versa for CMORPH). All products overestimate with lower frequency but greater magnitude (at least twice the reference value). Monthly performance is better than daily, but with increased underestimation. Performance for spring and autumn is similar to overall performance, while summer presents the most divergent patterns. For heavier intensities, all products improve their correlation with reference data and their detection capabilities, but also increase their underestimation rate and magnitude. Worst performance occurs in those regions with simultaneously higher orographical complexity, annual precipitation and altitude. These SPPs should be used with caution, and we recommend first analysing their performance on the specific application of interest.

1. Introduction

Climate change and global warming are affecting the spatio-temporal distribution of precipitation and the hydrological cycle around the globe. The International Panel on Climate Change (IPCC) reports have been indicating that the impacts of climate change show their greatest variability and uncertainty at local and regional scales [1]. This holds particularly true for Mediterranean regions, which have highly heterogeneous climates. It has been proven that, at Mediterranean latitudes, the cyclonic circumpolar vortex influence is undergoing a regression trend in favour of the Hadley cell [2], leading to a generalised rising in the temperatures across the Iberian Peninsula [3], to an increase in the quantity of tropical nights along its Mediterranean coastline [4] and to increased torrentiality in the precipitation patterns over the region [5,6,7]. Furthermore, previous studies have emphasized that hydric stress over the Iberian Mediterranean Basin (see [8] for details on the region) will be increased in the near future, and that it would alter fresh water availability for human purposes (agriculture, industry, urban uses…) and directly affect the related ecosystems [7,9]. Thus, there is interest for appropriate tools to monitor and study precipitation regimes over such regions.
Unfortunately, the highly variable spatio-temporal traits of precipitation renders this goal complicated. Precipitation is usually measured by ground gauges installed in meteorological stations, which collect precipitation and determine mass per unit area (usually expressed in kg m−2 or, equivalently, mm). This method is the most reliable, as it measures precipitation directly instead of estimating it. However, it is not exempt of possible errors generated from diverse types of gauges and diverse data recording, processing and monitoring methods [10], as well as to evaporative loss, wind, snow effects, etc. [11]. It is also common to find frequent time-series gaps and short temporal records on ground gauges [12] and, in addition, they have extremely limited spatial coverage and are unevenly distributed, with lesser concentration on mountainous and desert regions [13]. Their limited spatial coverage and uneven distribution are their main drawbacks, because local changes usually do not represent the behaviour on a whole region or on its hydrological recharge regions.
A ground-based, remote sensing alternative is the use of weather radars. They estimate precipitation over a much larger area at high spatio-temporal resolution, and can provide real-time monitoring [14]; nonetheless, they are also susceptible of biases from inaccurate relationships between radar reflectivity and precipitation rate depending on the type of precipitation, orography, attenuation, etc. [15,16]. In addition, they require significant maintenance costs and technical expertise, and hence can be prohibitive to regions with limited resources [17].
Satellite-derived precipitation products (SPPs) are gaining increasing popularity as an alternative to ground gauges and weather radars. SPPs usually are computed from infrared and passive microwave data (IR and PMW, respectively), and usually offer global (or quasi-global) continuous coverage (with spatial resolutions often coarser than 0.1°) at daily to sub-daily revisit times. Thus, SPPs are very interesting for their use over regions with few ground gauges or no gauges at all, and they have been adopted for various hydrometeorological applications [10]. But like ground gauges and weather radars, they are also exposed to sources of uncertainties, such as inherently indirect measurements, coarser spatial resolution, non-optimal sensitivity and retrieval algorithms and spatial inhomogeneity of precipitation [17]. Previous studies have noticed that these uncertainties also depend on atmospheric conditions, terrain features and other factors [14], and there have been attempts to calibrate these products with different algorithms and sources and improve their performance over mountainous, complex terrain [18]. Additionally, previous studies that have compared different SPPs over a specific region have not found an optimal SPP for all situations [12]. Therefore, SPPs performance must be assessed before using them in hydrological and meteorological operations, such as monitoring and trend analysis.
Here, we have assessed the suitability over Peninsular Spain and the Balearic Islands along the 2001–2020 period of three well-known SPPs, namely NOAA CPC Climate Morphing Technique (CMORPH) Climate Data Record (CDR) V1.0, NASA Integrated Multi-satellitE Retrievals for GPM (IMERG) V07A and GloH2O Multi-Source Weighted-Ensemble Precipitation (MSWEP) V2.8. We used Spanish Agencia Estatal de Meteorología (AEMET) ground gauges precipitation data as reference. We chose these products because they present a good compromise between enough temporal coverage, good spatial and temporal resolutions and reasonable performance according to the literature. CMORPH and IMERG are satellite-based products, whereas MSWEP is a fusion product.
The main contributions of this study are the assessing and comparison of the performance of these three SPPs across Peninsular Spain and Balearic Islands and the quantitative investigation on a possible performance dependence on certain parameters (season of year, precipitation intensity, altitude and orographic complexity), in order to correctly understand their precision and accuracy from diverse perspectives and determine whether they are appropriate tools for diverse applications in this region (hydrological modelling, trends on extreme precipitation patterns, analysis of changes in bioclimates, flood threshold exceedances, studies on agricultural water budget…). The applied methodology can be used in any region of the world with enough ground gauges, and our results could be extrapolated to other regions with similar climatic traits.
The paper follows the following scheme: in Section 2 and Section 3 we describe the most important characteristics of our study area and the data used in this study. In Section 4, we define the metrics used to evaluate the SPPs. Section 5 exposes the assessment results, whereas Section 6 analyses them. Section 7 summarizes the main findings and their discussion.

2. Study Area

The Iberian Peninsula and the Balearic Islands are located in the most southwestern region of the European continent, between the Atlantic Ocean and the Mediterranean Sea. Regarding the peninsular orography, the Meseta (plateau) is the biggest feature in extension, and has a mean altitude of 600 m [19]. Several mountain ranges partition the Peninsula: the Pyrenees and the Cantabrian range, at north; the Central and the Betic ranges, at the center and at south; and the Iberian range, at east [20]. This disposition creates a hydrological division into two main watersheds: the Atlantic one (which covers 70% of the Peninsula and harbours four of the five main river basins (Duero, Tajo, Guadiana and Guadalquivir) and the Mediterranean one (with the Ebro, Xúquer and Segura basins). Regarding the Balearic islands, the mountain relief is much less marked (except the Tramuntana range, north of Mallorca) and the river basins are much smaller. Iberian rivers are the most irregular of western Europe (both interannually and seasonally). Their basins are filled with ramblas, watercourses with torrential and ephemeral runoff waters that can cause unexpected floods. An altimetry map is presented in Figure 1.
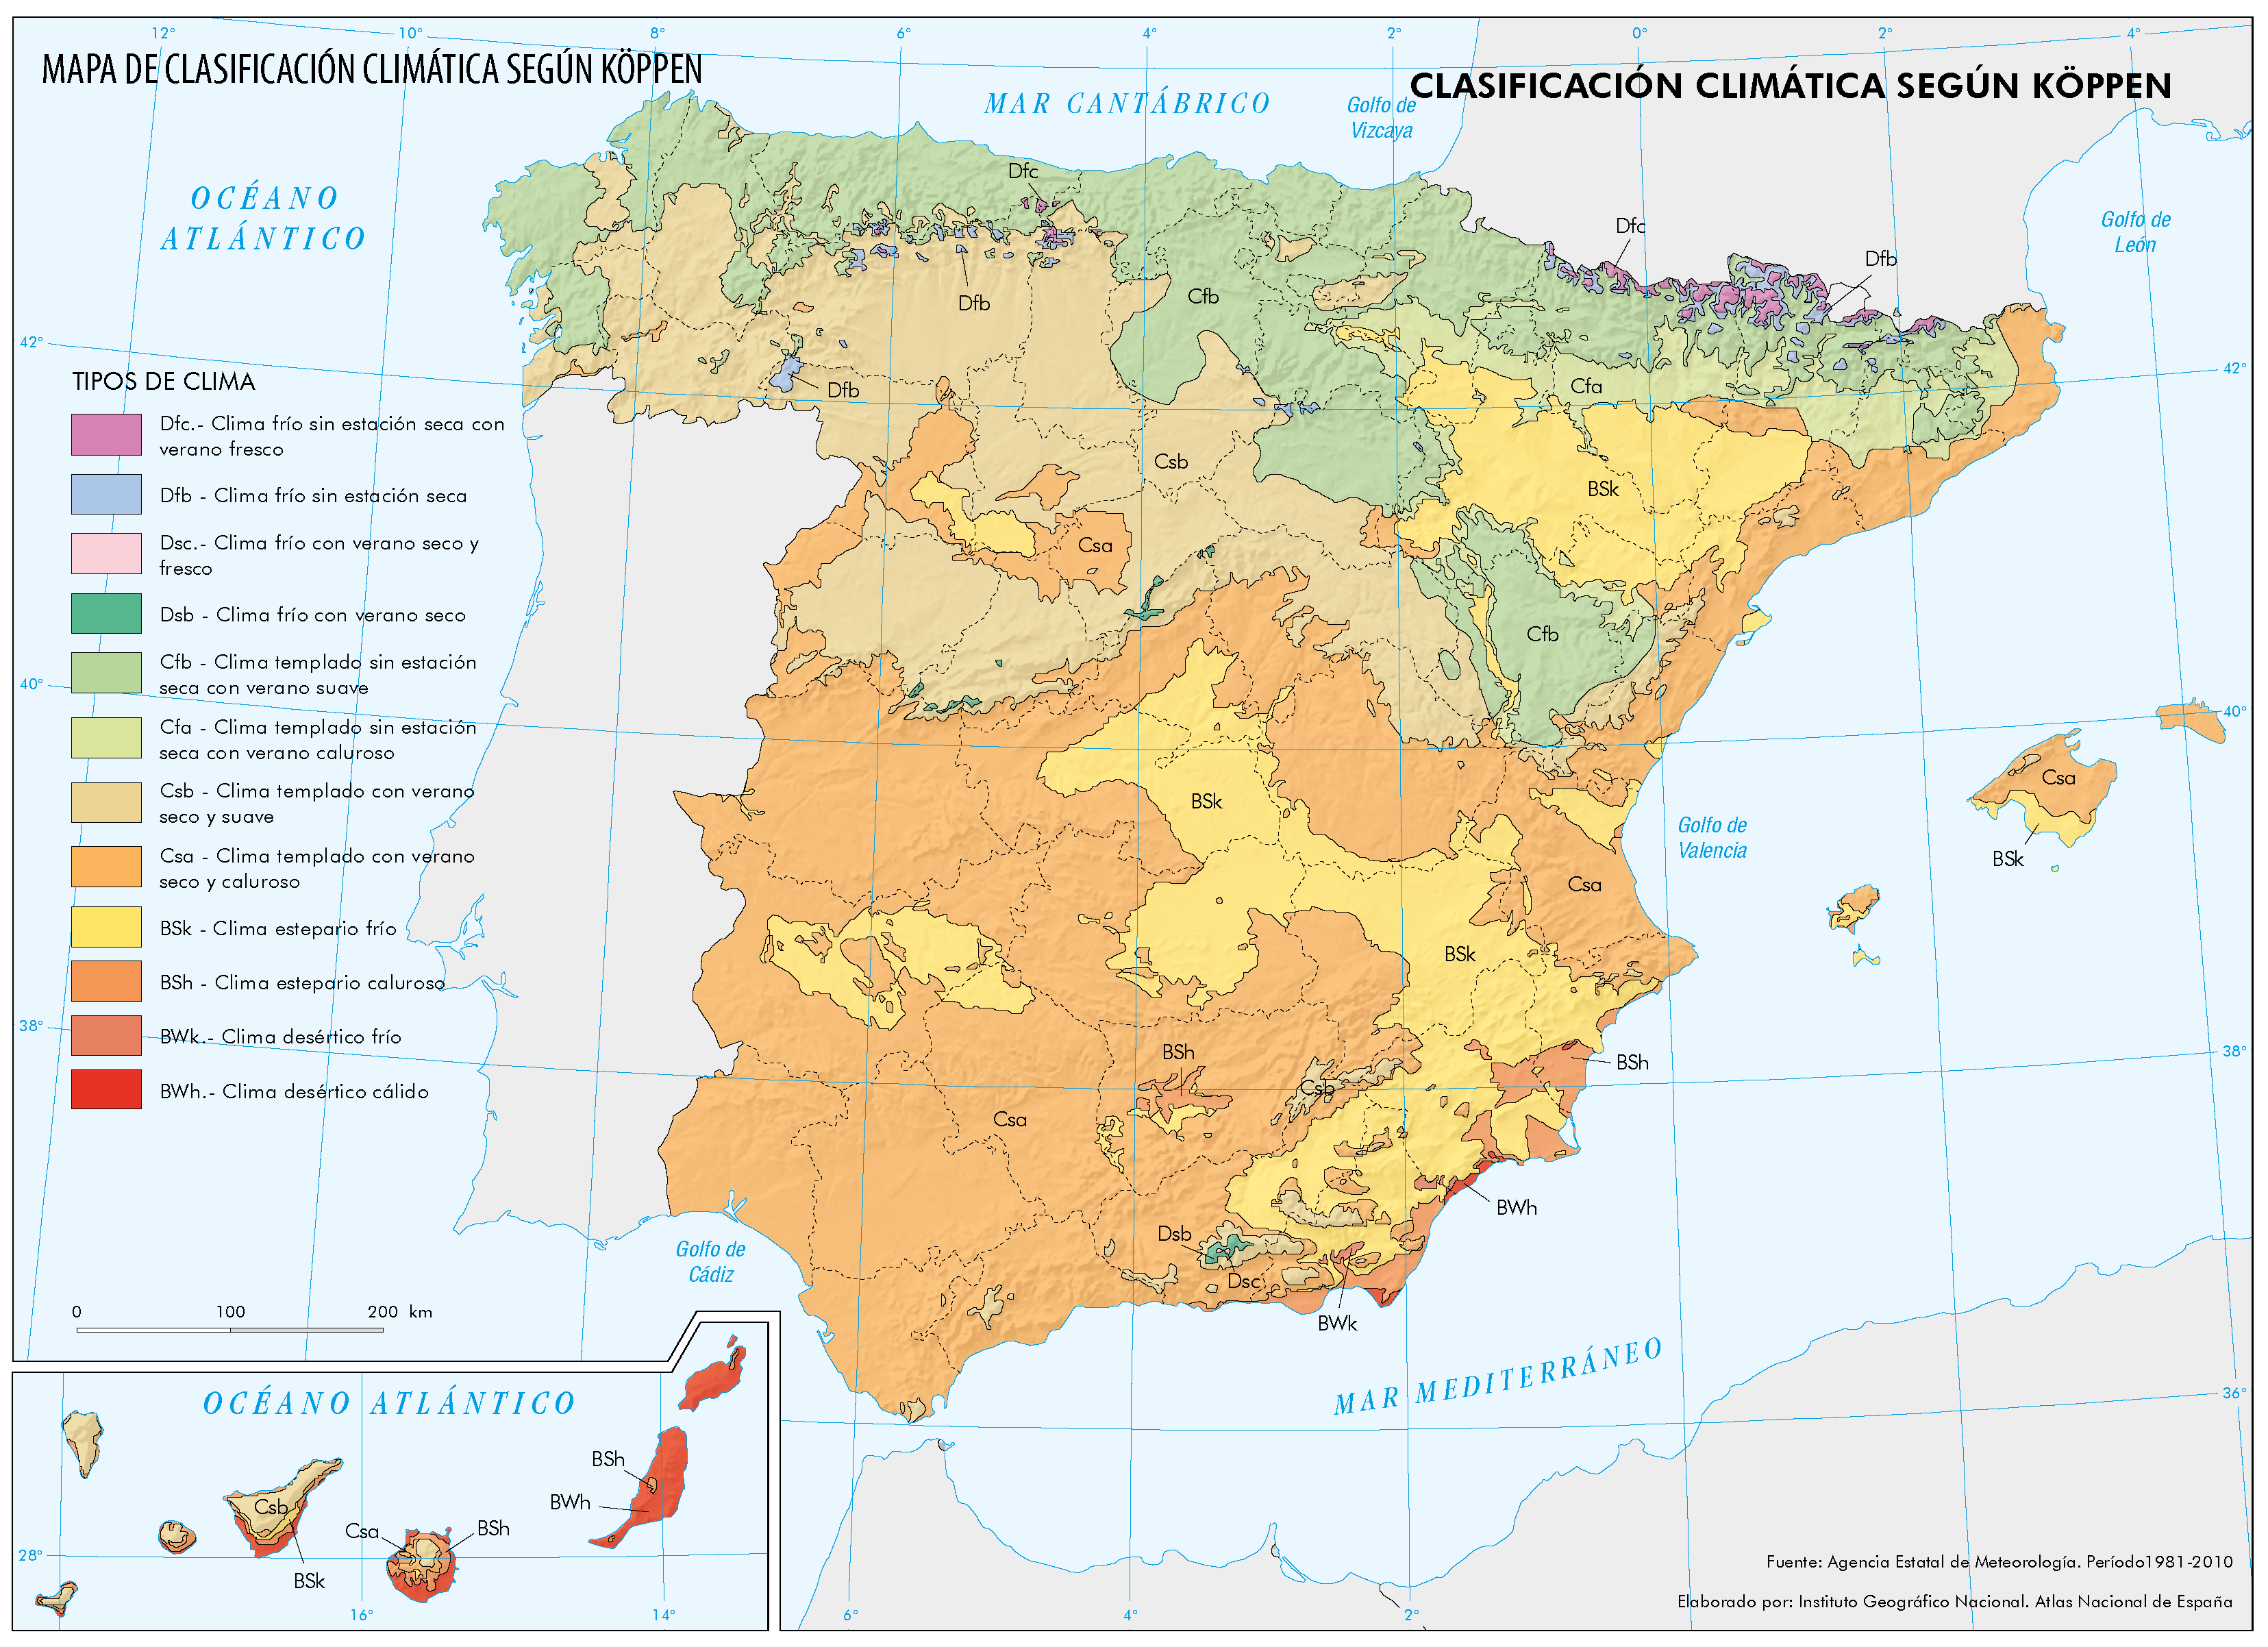
According to the Köppen–Geiger classification, the main climates found in the Peninsula and Balearic islands are Csa (temperate with dry or hot summer), Csb (temperate with dry or temperate summer), Cfb (temperate with a dry season and temperate summer) and Bsk (cold steppe) [21]. The Iberian Peninsula is generally cooler and wetter at north, and becomes hotter and drier to the south (with special emphasis south of the 39°N parallel, a region we will call the Southern Strip hereon), whereas the Balearic islands share climatic traits with the southern Peninsula. This climate classification is shown in Figure 2.
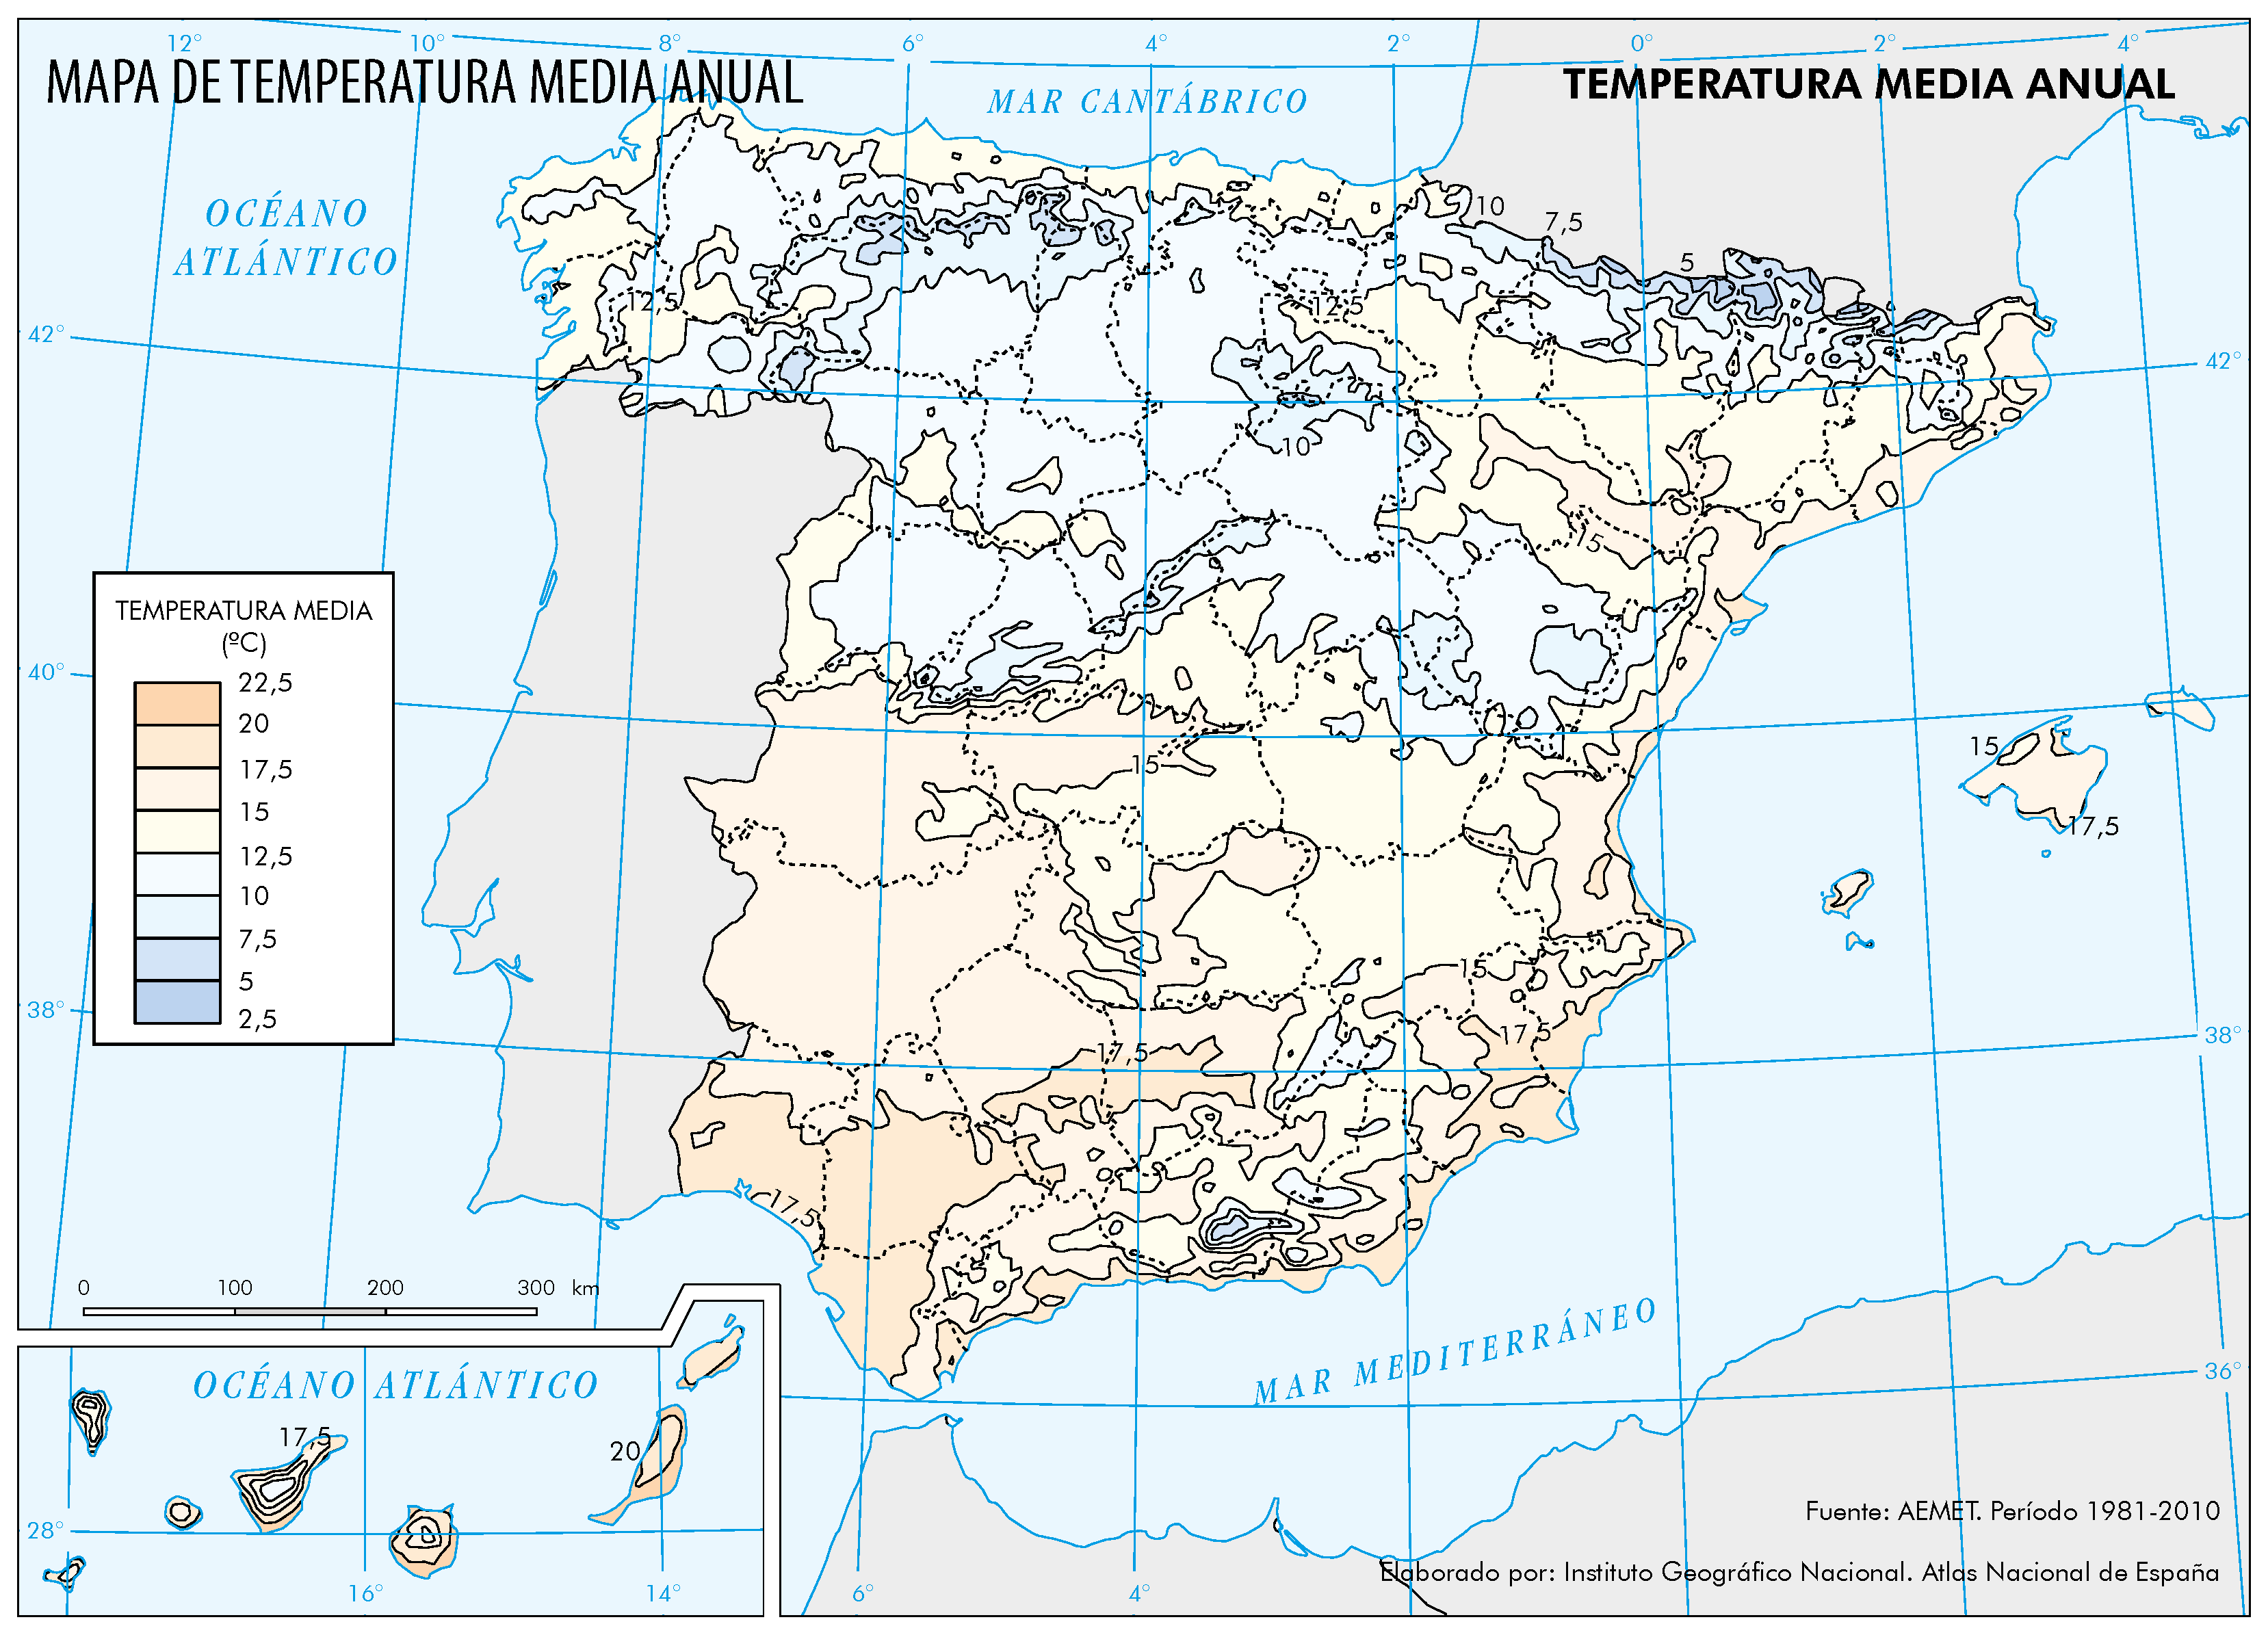
Average annual mean temperatures range from <2.5 °C at Pyrennes to >17 °C in southeastern Peninsula. In addition, the Southern Strip shows average maximum temperatures exceeding 22 °C, average minimum temperatures exceeding 15 °C and most days with maximum temperatures above 25 °C (more than 110   days   year 1 ). A map for annual mean temperature is shown in Figure 3.
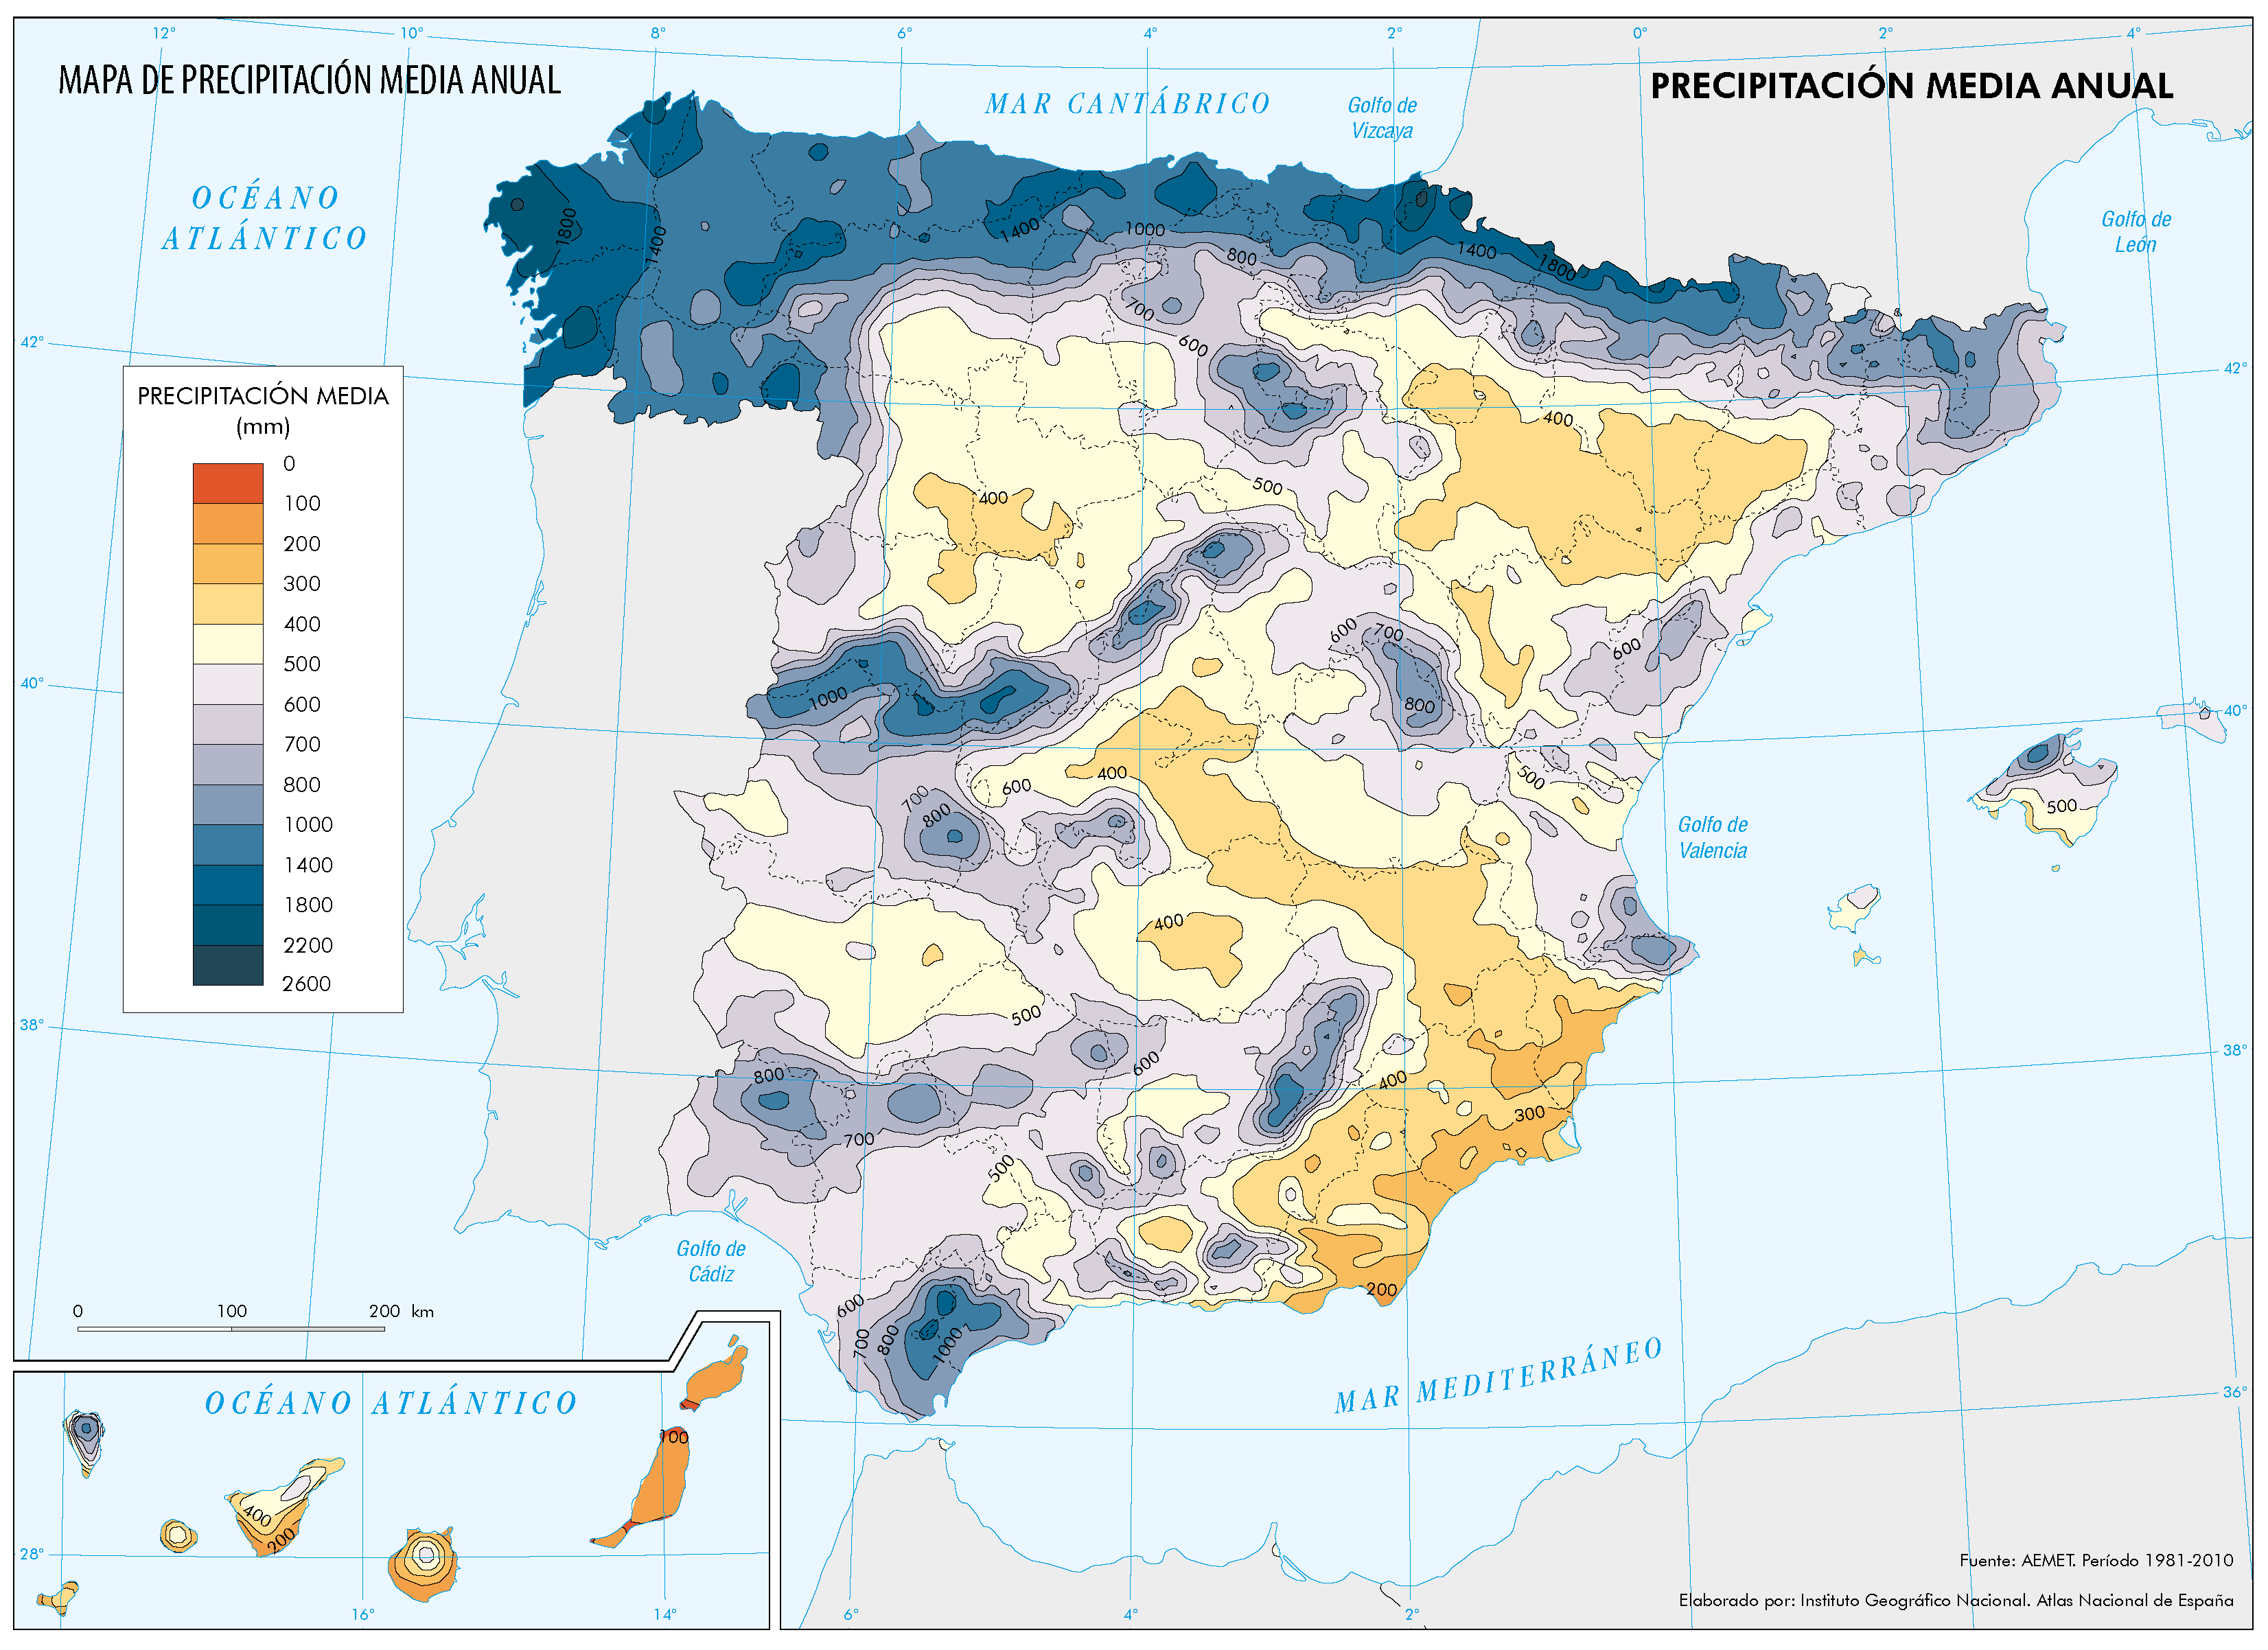
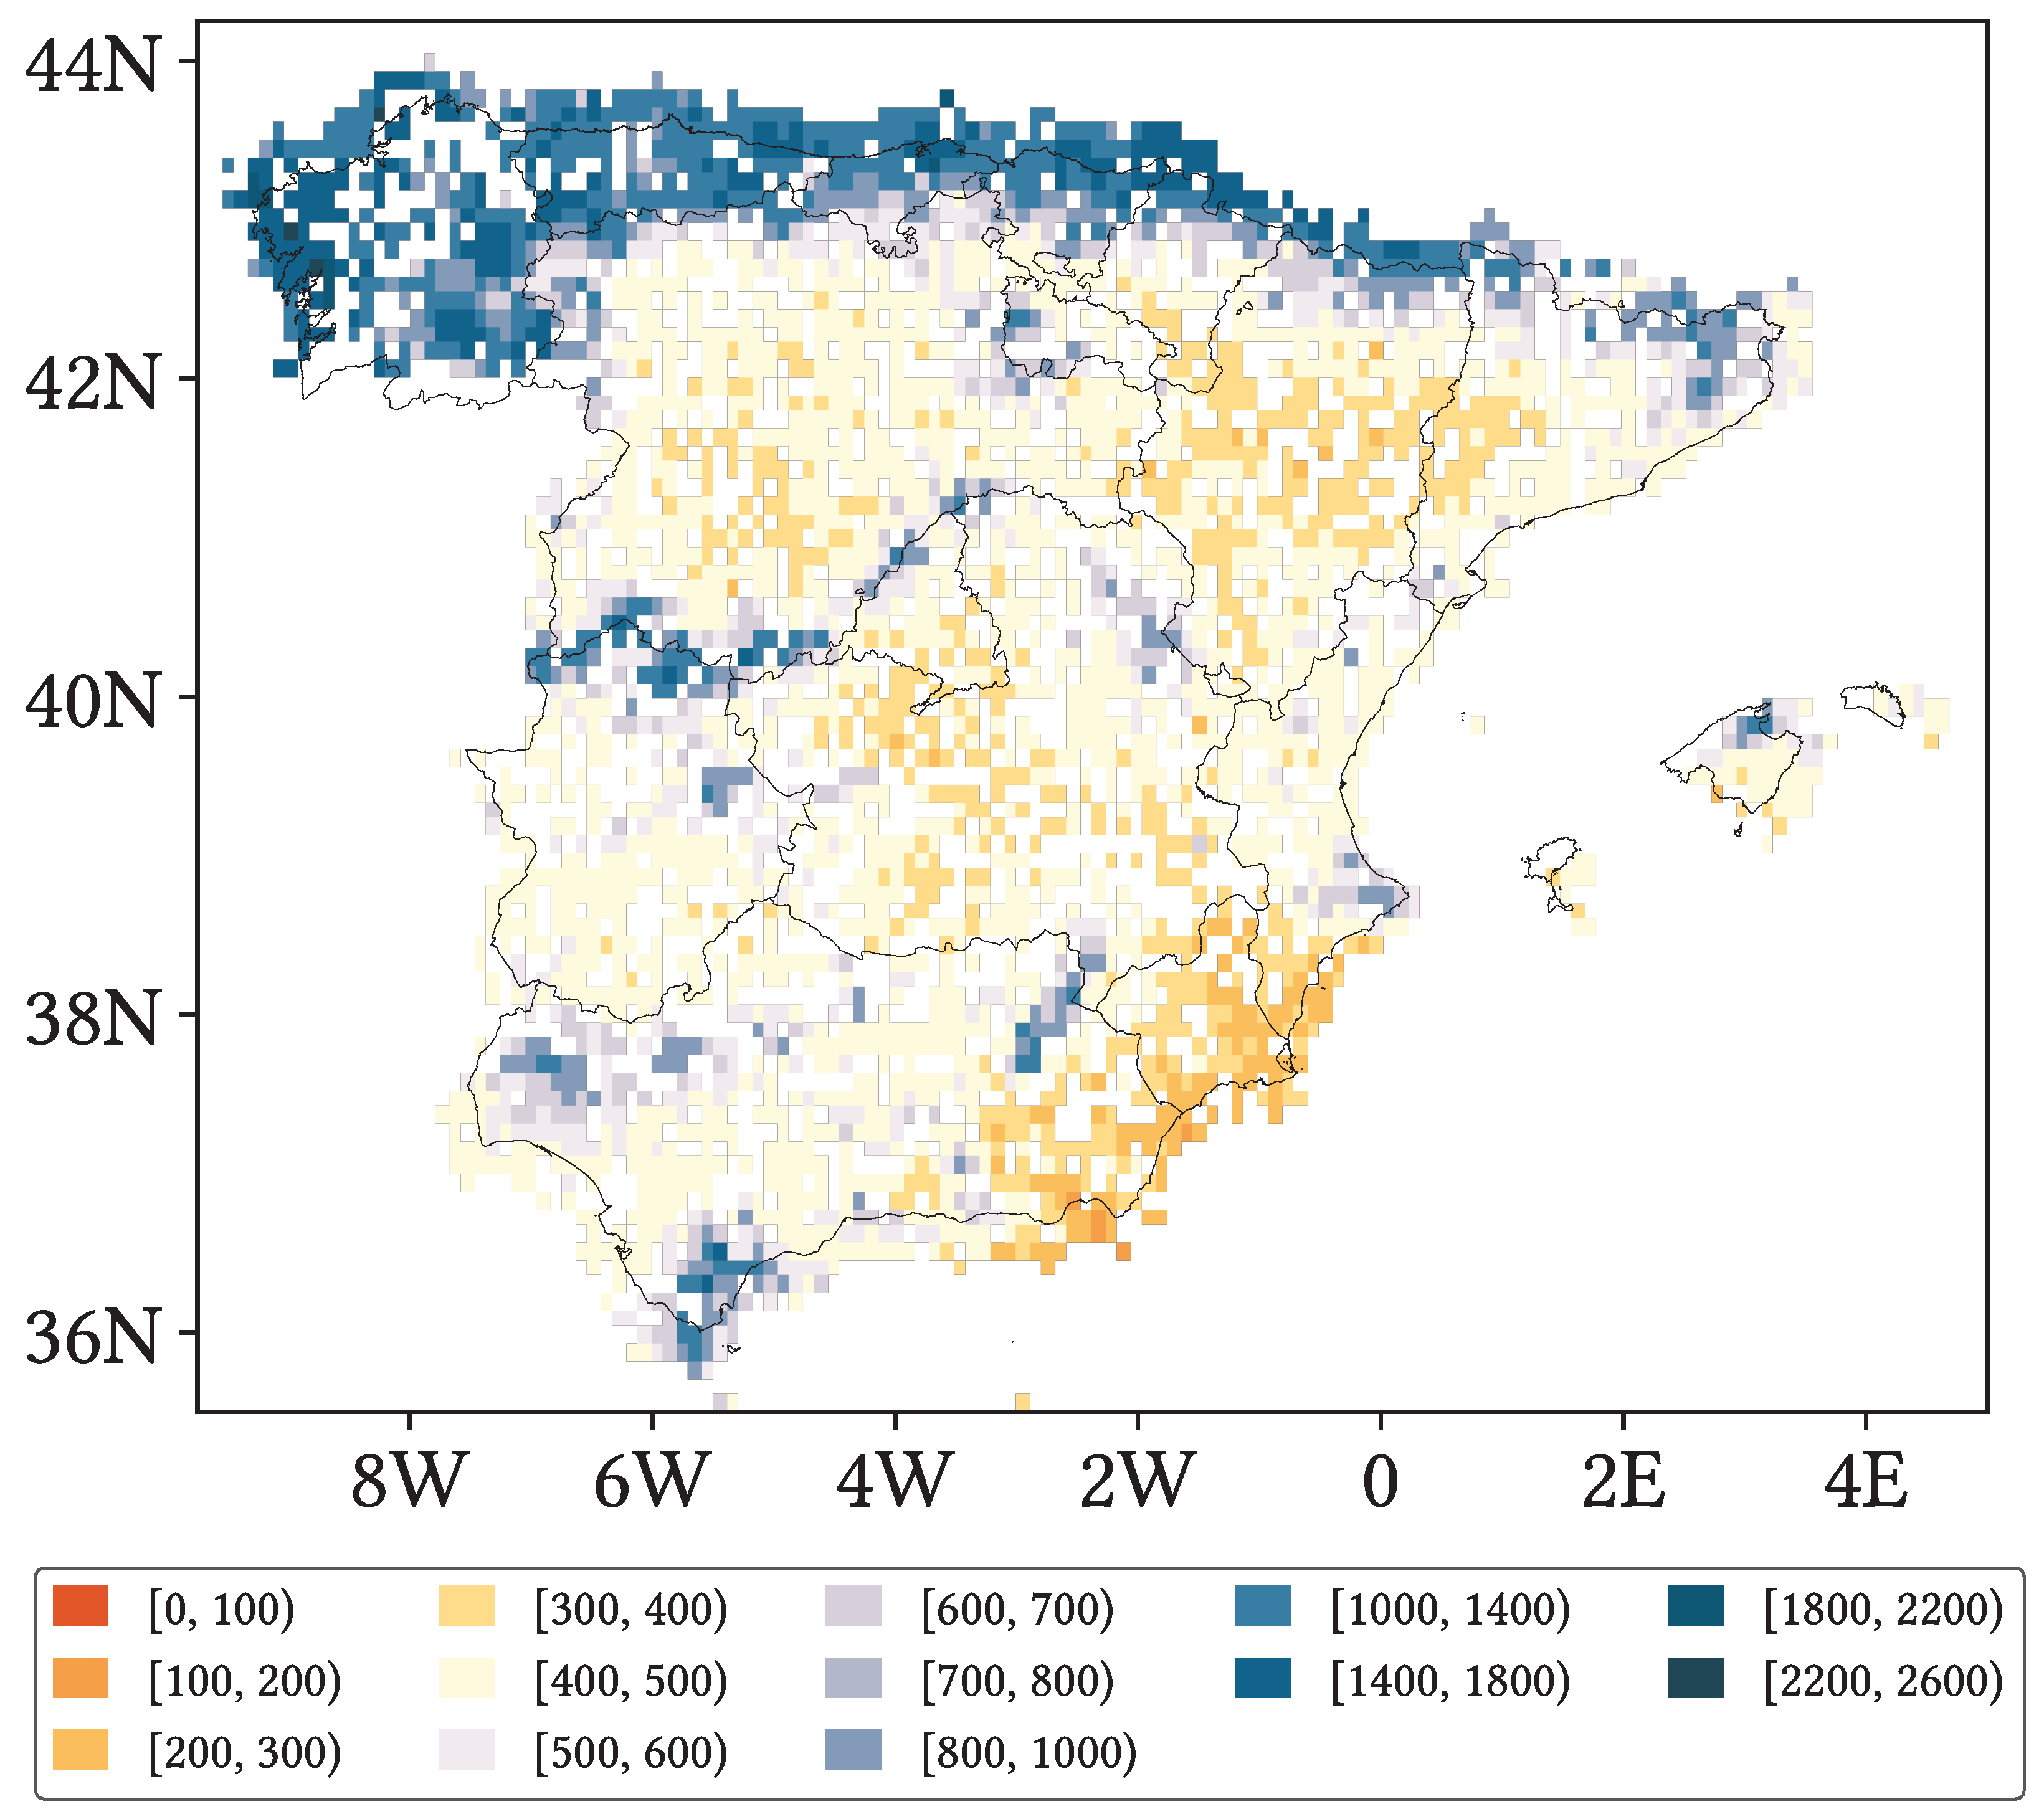
Mean accumulated annual precipitation ranges from greater than 2200   mm   year 1 at parts of the northern and the north-western littorals to lower than 300   mm   year 1 at the Southern Strip [21], with special remarks on Cape Gata, which presents values lower than 200   mm   year 1 and is the driest region of continental Europe [22]. Similarly, the number of wet days (days with precipitation greater than 1   mm   day 1 ) varies from more than 150   days   year 1 along coastal northern regions to less than 30   days   year 1 in southeastern Peninsula. Seasonality is accentuated in both seasonal accumulated precipitation and seasonal number of wet days, stronger at the Southern Strip and weaker at northeastern Peninsula. Regarding monthly precipitation, December is the wettest month (> 300   mm at northwestern Peninsula) and July is the driest one (< 5   mm along Southern Strip); regarding wet days, winter is the wettest season (50–75 days across the northern Peninsula) and summer is the driest one (1–3 days across the Southern Strip). Finally, the maximum number of days with precipitation greater than 30   mm are found in coastal northern and north-western regions (more than 20   days   year 1 ), whereas the minimum values (less than one day per year) are found in the inner plains of the Peninsula. A map for annual mean accumulated precipitation based on interpolated gauge data is represented in Figure 4.

3. Materials

3.1. Agencia Estatal de Meteorología (AEMET) Ground Gauge Data

AEMET is the Spanish agency in charge of the development, implementation and delivery of meteorological services within Spain, as well as the Spanish representation in international meteorological organisms.
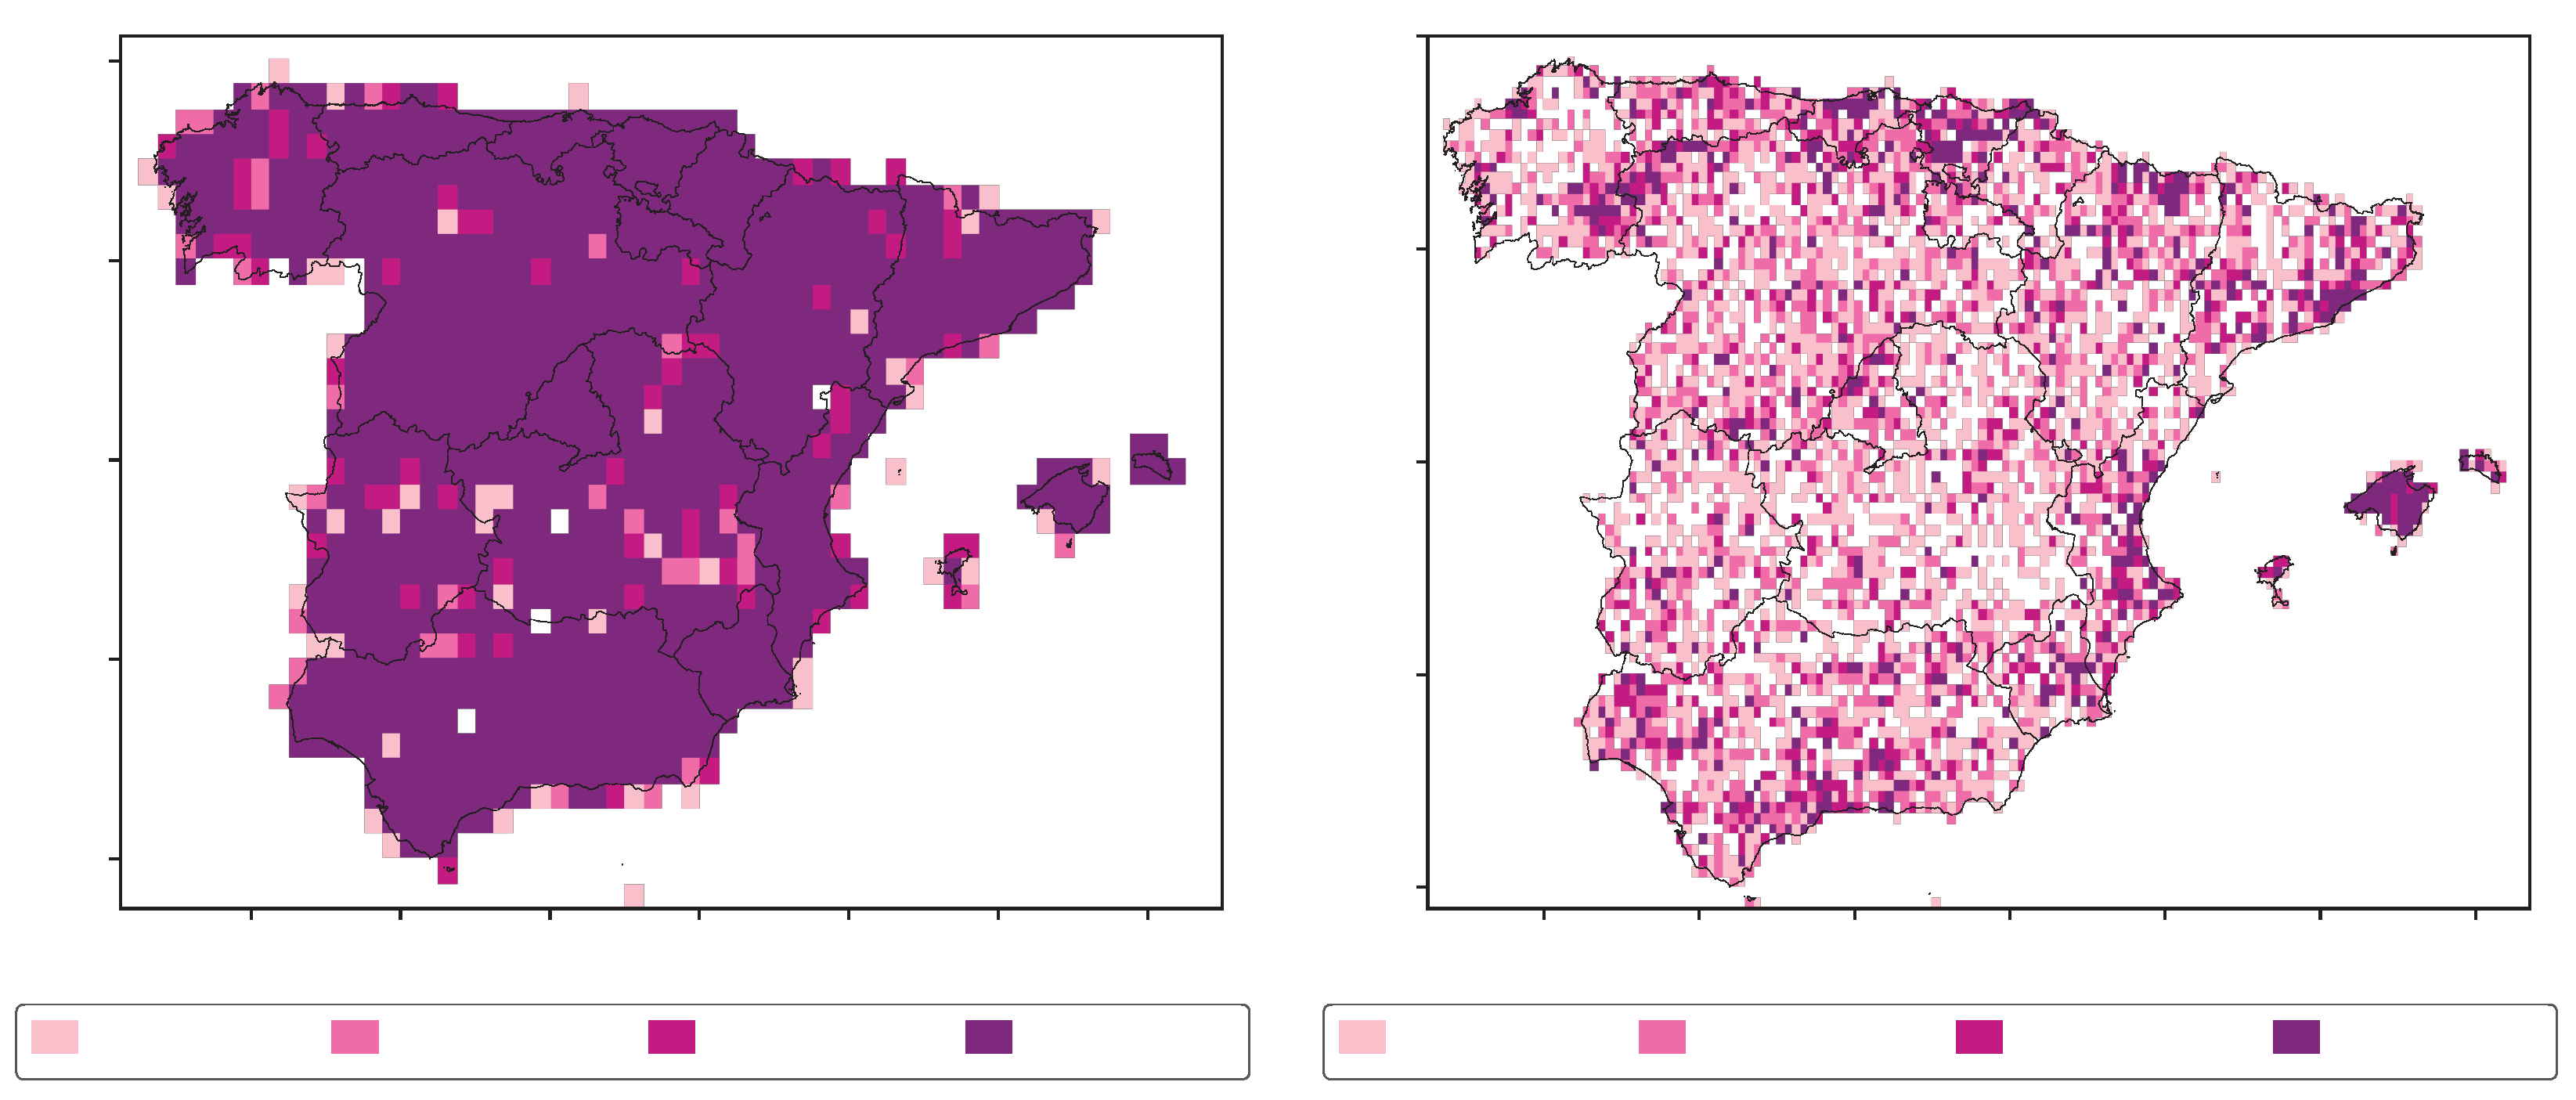
For this work, we used a standardised and homogenised dataset of 7846 ground gauges, with reports at daily resolution. The available temporal record spans from 1952 to 2022, but our study period extends from 1 January 2001 to 31 December 2020, the period where all three SPPs overlap. Most of the gauges belong to AEMET itself (> 95 % ), while a minor part come from the Sistema Integral de Atención al Regante (SIAR) and the Fundación Centro de Estudios Ambientales del Mediterráneo (CEAM). The dataset was constructed from the base of raw gauge data, whose frequent gaps were filled with the NLPCA–EOF–QM method and then homogenised by the ACMANT method (ACMANTv3.0–ACMANTP3day) [7,23,24,25]. Compared to those gauges involved in its confection and with which this dataset dissents the most, Root Mean Squared Error (RMSE) is no more than 3 mm day−1, Mean Absolute Error (MAE) is no more than 1.3 mm day−1 and Correlation Coefficient (CC) is no less than 0.87. In addition, there are no missing values in this dataset, and so it constitutes a faithful representation of the original ground gauge data. Figure 5 presents mean annual accumulated precipitation along the 1981–2010 period for the used AEMET-based dataset (which is extremely similar to Figure 4, based on gauge data, reassuring our trust in the dataset), and Figure 6 shows maps for density of associated gauges per pixel at 0.25° and 0.1° lat-lon resolutions. The chosen stratification for these maps is the same as the one used in our analysis (see Section 4.3).

3.2. NOAA CPC Climate Morphing Technique (CMORPH) Climate Data Record (CDR)

CMORPH provides a global analysis based on satellite precipitation estimations, later corrected in order to eliminate their statistical bias and reprocessed with the Morphing (MORPH) technique by the Climate Prediction Center (CPC) from the National Ocenic and Atmospheric Administration (NOAA). It has a spatial coverage that spans over all longitudes and over the 60°N–60°S latitude domain, and a temporal record from 1 January 1998 to 28 February 2025 (checked in June 2025). It is offered in three different resolutions: (8 km, 30 min), (0.25° lat-lon, 1 h) and (0.25° lat-lon, 1 day). We used CMORPH V1.0 daily at 0.25° from 1 January 2001 to 31 December 2020. No missing values are present during this period.
As a brief summary, CMORPH uses precipitation estimations from passive microwave low-earth-orbit satellite sensors, and propagates them in space and time (backward and forward) by means of cloud motion vectors estimated from infrared satellite data, using time distances as weighting factors. The generated maps are later corrected with ground gauge precipitation analysis made by both CPC and the Global Precipitation Climatology Project (GPCP, also from NOAA), and masked out using the snow and sea ice masks from the Interactive Multisensor Snow and Ice Mapping System (IMS). Detailed descriptions can be found in Joyce et al. [26] and in the Algorithm Theoretical Basis Document, ATBD [27], while performance assessment studies in regions with similar climates can be found in previous studies [10,28,29,30,31,32].

3.3. NASA Integrated Multi-SatellitE Retrievals for GPM (IMERG)

IMERG provides a global analysis developed by the National Aeronautics and Space Administration (NASA) Global Precipitation Measurement mission (GPM) from satellite data to estimate precipitation around the globe. It is offered in three runs: Early, Late and Final, and in 30 min, 1 day or 1 month resolutions; all of them at 0.1° lat-lon. It has full geographical coverage and a temporal record from 1 June 2000 to almost real time (Early and Late Run) or up to 31 December 2024 (Final Run; checked in June 2025). We used IMERG Final Run V07A at 0.1° lat-lon, daily resolution from 1 January 2001 to 31 December 2020. No missing values are present during this period.
IMERG is created through a very similar process to that of CMORPH: PMW-based precipitation estimations are propagated in space and time (backward and forward) making use of cloud motion vectors. In contrast, IMERG uses IR data for precipitation estimation where PMW data is not available and, in version V07, the cloud motion vectors are computed from a hierarchy of reanalysis/model variables (precipitation, total precipitable liquid water and then total precipitable water vapor). Additionally, it relies on the GPCP Satellite-Gauge product (based on PMW-calibrated IR data and on Global Precipitation Climatology Center –GPCC– ground gauges data) for the removal of statistical bias and on the NOAA Autosnow product for masking out unreliable data. IMERG Early and Late Run do not apply gauge correction (i.e., are based on satellite data only) and so are intended for risk assessment and disaster monitoring. IMERG Final Run does use ground gauge data at monthly scale for a more precise calibration and is thus intended for scientifical research.
Detailed descriptions are included in its ATBD [33], and performance assessment studies in regions with similar climates can be found in previous studies [10,34,35,36,37].

3.4. GloH2O Multi-Source Weighted-Ensemble Precipitation (MSWEP)

MSWEP provides a global analysis developed by the GloH2O organization from satellite precipitation estimations and ground gauge data. It is divided into two categories: Near Real Time (NRT) and Past, and is offered at 3 h, 1 day or 1 month resolutions; all of them at 0.1° lat-lon. It has full geographical coverage, and a temporal record from 1 January 1979 up to present day (for Near-Real Time, NRT) or up to 30 December 2020 (for Past; checked in June 2025). We used MSWEP Past at 0.1°lat-lon, daily resolution from 1 January 2001 to 31 December 2020. No missing values are present during this period.
MSWEP NRT relies uniquely on model-retrieved and satellite-retrieved low latency precipitation products. MSWEP Past includes many more data sources and has undergone a larger amount of corrections, and it is therefore more suitable for scientific research.
MSWEP Past, in contrast with CMORPH and IMERG, is produced from a combination of previous precipitation products and ground gauge data rather than from raw and post-processed satellite data. Very briefly, MSWEP computes correlation maps between satellite products and gauge data, harmonizes the satellite products (i.e., rescaling to common resolution, removal of wet days bias, smoothing of short time discontinuities, etc.) and uses the computed correlation maps as weight factors in the merging of the products. Finally, satellite bias is corrected using the ground gauge dataset. A thorough description is included in Beck et al. [38], and performance assessment studies in regions with similar climates can be found in previous studies [29,30,39].

3.5. NASA Shuttle Radar Topography Mission (SRTM)

The Shuttle Radar Topography Mission (SRTM) Digital Elevation Model (DEM) is a satellite-based, high resolution, near-global scale elevation product [40]. It is the most complete high-resolution digital topographic database of Earth, extending from 60°N to 56°S at 30 m (3 arcsecond) resolution. This DEM was obtained through a modified radar system onboard the Space Shuttle Endeavour during the STS-99 mission (February 2000), by means of radar interferometry.
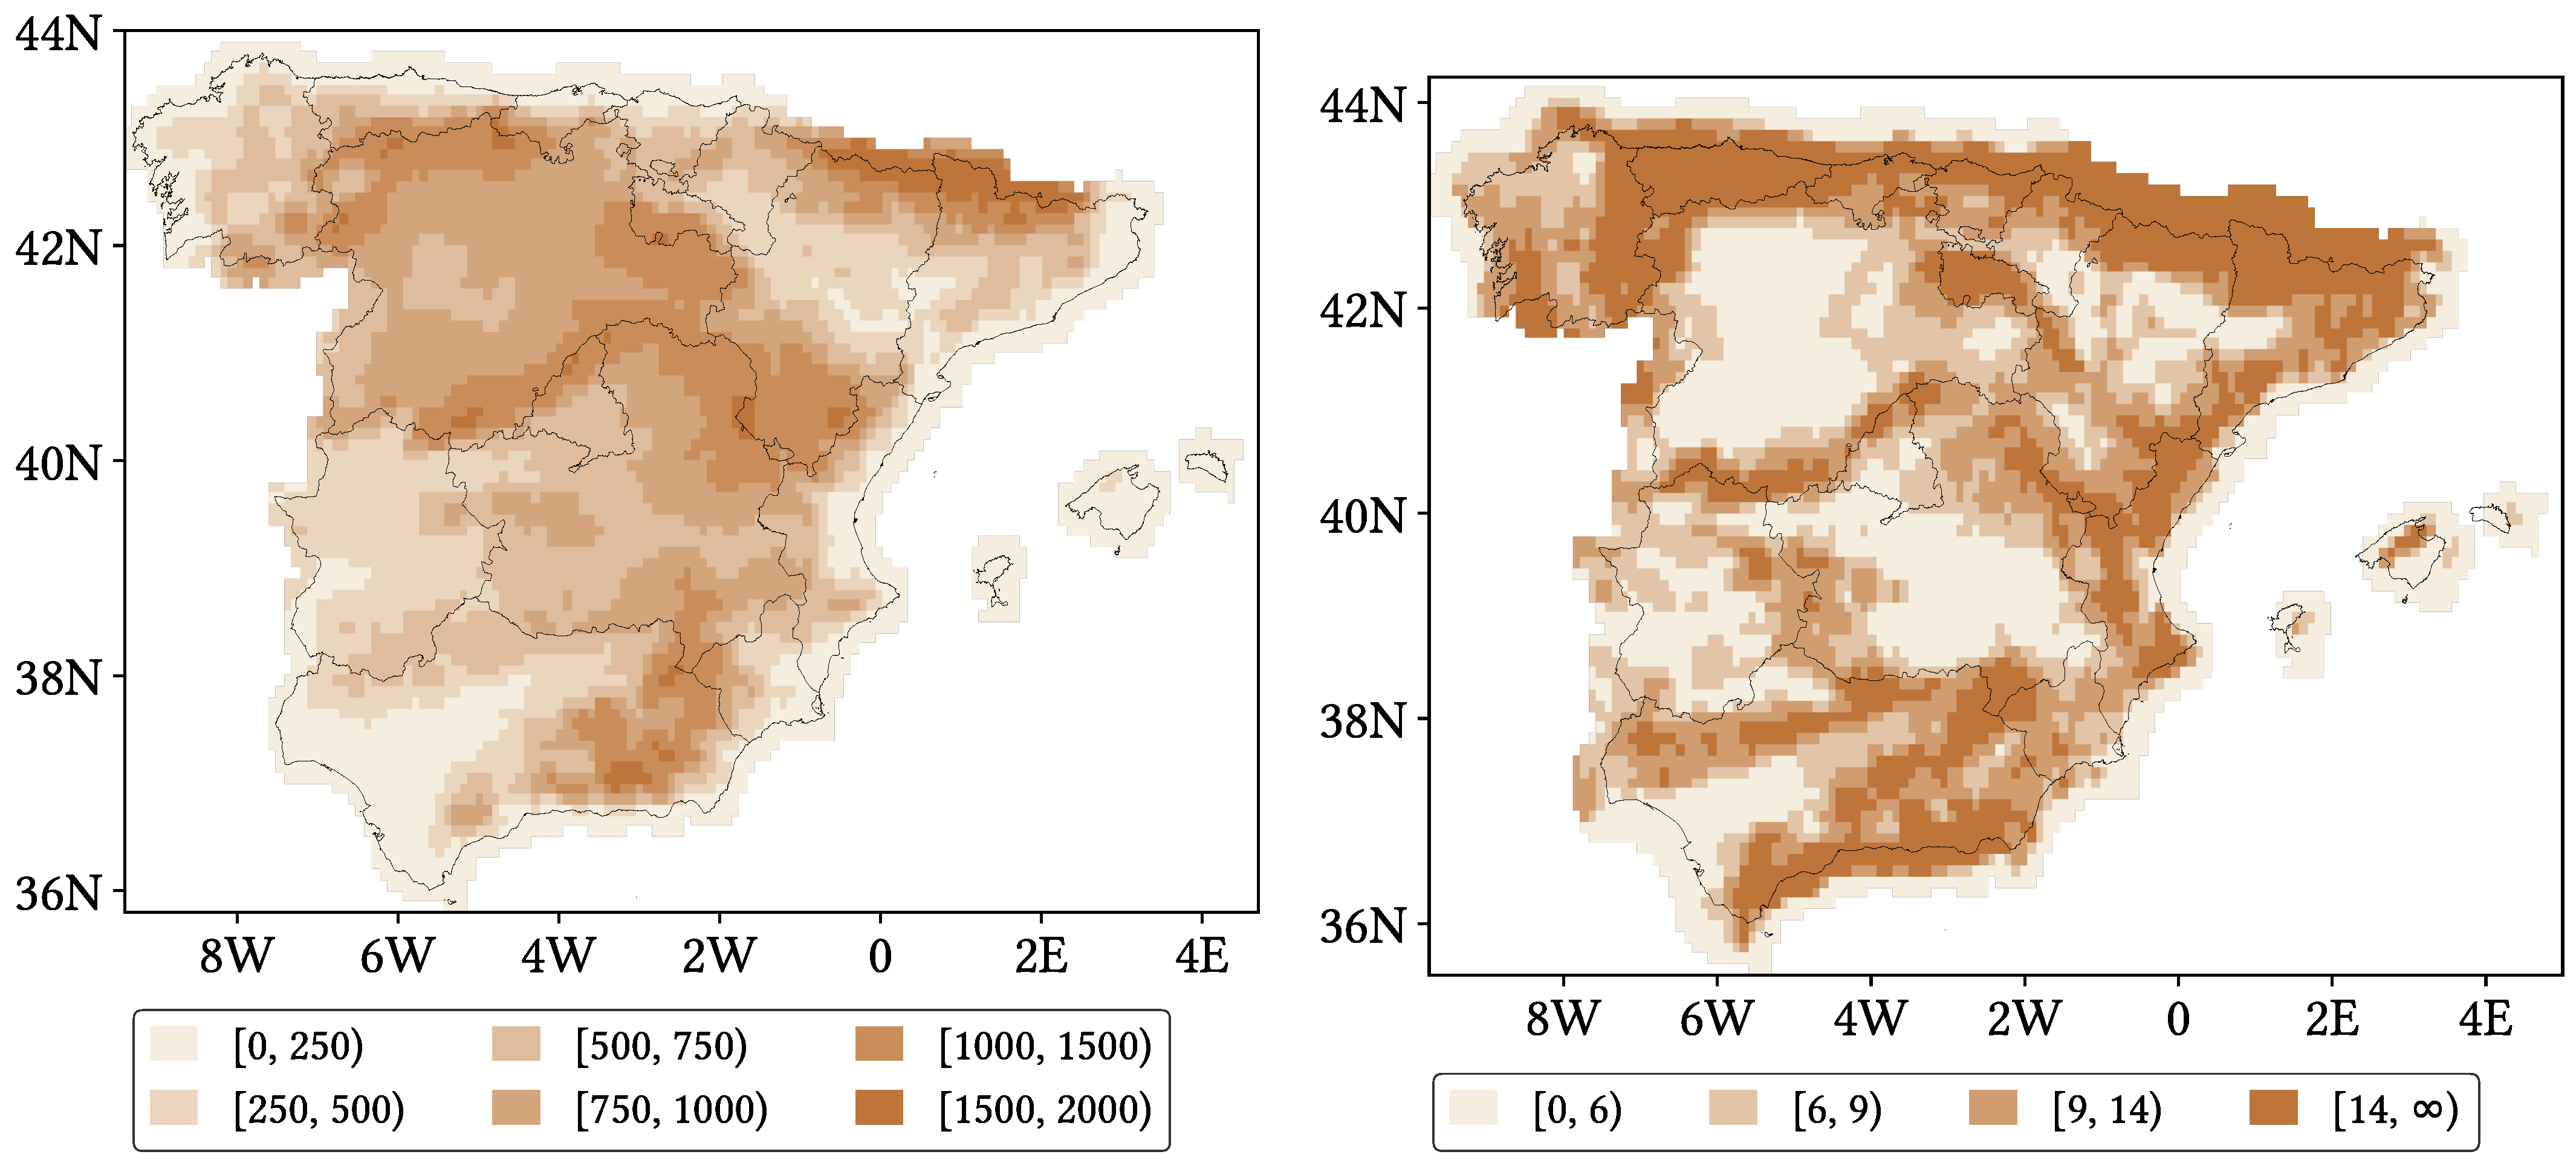
We have used a DEM product in order to investigate whether the SPP performance depends on altitude or orographic complexity (see Section 4.3). This particular product was chosen due to its high resolution and full satellite origin. In addition to the DEM, we have also obtained from it maps of Terrain Ruggedness Index (TRI) [41]. TRI is a quantitative measure of orographic heterogeneity, defined as the root summation of squared altitude differences between a central pixel and its eight neighbouring pixels. The altitude and TRI maps used in this study and constructed from the SRTM product are shown in Figure 7.

4. Method

4.1. Categorical and Statistical Metrics

There is a wide variety of uncertainty metrics used in the literature for assessing SPP performance. These metrics are usually divided into two categories: categorical metrics (which focus on how accurately SPPs detect precipitation) and statistical metrics (which focus on how accurately they estimate precipitation). We have chosen those metrics which, in our regard, best condense the most useful information. Table 1 includes their mathematical definition and optimal values.
Regarding categorical metrics, there are four kind of events defined in order to compute them: hit wet events (report of precipitation by both SPP and reference), hit dry events (null precipitation reported by both SPP and reference), false events (report of precipitation by SPP but not by reference) and miss events (report of precipitation by reference but not by SPP). Precipitation is considered to be detected when the reported value is greater than a minimum threshold, and for daily events, p = 1   mm is the recommended one by the World Climate Research Programme (WCRP) Expert Team on Climate Change Detection and Indices (ETCCDI) for their extreme precipitation indices [42]. With that in mind, we have employed the following categorical metrics:
  • Hit rate (HtR): global capability of the SPP for reporting hit wet and dry events.
  • Probability of Detection (POD): truthful detection capability of wet events.
  • False Alarm Ratio (FAR): ratio of false events to the wet events reported by the SPP.
  • Overestimation Rate (OvR): ratio of hit wet events which show overestimation.
  • Underestimation Rate (UdR): ratio of hit wet events which show underestimation.
For the statistical metrics, we have chosen Correlation Coefficient (CC) and relative Mean Absolute Error (rMAE). Originally, instead of rMAE, we intended to use Root Mean Square Error (RMSE) or Mean Absolute Error (MAE), more common in the literature; however, due to the high variability of precipitation, both in space and time, those indices lack enough depth in our context, as an equal value of error will have different relevance depending on the local precipitation pattern. Therefore, using an error estimate that takes into account these patterns is preferred. This introduces a new problem: how to define a relative error for false events (which would always yield infinite error) and for miss events (which would always yield unity error). For all of those cases, we divided the absolute error by the detection threshold of p = 1   mm , in order to establish a common, meaningful reference (as a false or missing report will be more problematic the more it differs from the detection threshold). Even though this definition might obfuscate the meaning of the index, it will boost its values when a notable amount of false or miss events are present, which is useful because this kind of event will always be more problematic than underestimated or overestimated hit events.

4.2. Error Components

Following Tian et al. [43], we performed an error decomposition of the SPPs to analyse their performance in greater detail. As a brief summary, provided a precipitation field R ( x , t ) (where x denotes geographical position), we can create a binary event mask  P ( x , t ) :
P ( x , t ) = 1 where R ( x , t ) p 0 where R ( x , t ) < p or has missing data
with p the minimum precipitation threshold, as mentioned in Section 4.1. This mask admits a boolean complement, the no-event mask P ¯ ( x , t ) , which equals 1 where R ( x , t ) < p or has missing data, and 0 otherwise. As its name and definition suggest, the event mask P ( x , t ) denotes those points in space and time where precipitation has been detected (i.e., the reported value is greater than the minimum threshold p).
Considering R s ( x , t ) (the SPP precipitation field), R g ( x , t ) (the ground gauges precipitation field), their corresponding event masks, P s ( x , t ) and P g ( x , t ) and the types of events defined in Section 4.1, it is possible to define three orthogonal masks:
  • Hit mask:  P g s ( x , t ) = P g ( x , t ) × P s ( x , t ) , i.e., the hit wet events mask.
  • False mask:  P g ¯ s ( x , t ) = P ¯ g ( x , t ) × P s ( x , t ) , i.e., the false events mask.
  • (3)
    Miss mask:  P g s ¯ ( x , t ) = P g ( x , t ) × P ¯ s ( x , t ) , i.e., the miss events mask.
    With all that in mind, it can be shown that
    E ( x , t ) = R s ( x , t ) R g ( x , t ) = H ( x , t ) + F ( x , t ) M ( x , t )
    H ( x , t ) = ( R s ( x , t ) R g ( x , t ) ) × P g s ( x , t )
    F ( x , t ) = R s ( x , t ) × P g ¯ s ( x , t )
    M ( x , t ) = R g ( x , t ) × P g s ¯ ( x , t )
    In other words, the Total bias, E ( x , t ) , which is satellite minus ground gauge values for each point in space and time, can be completely split into three orthogonal components: Hit bias, H ( x , t ) (bias from incorrect estimation of the precipitation intensity); False bias, F ( x , t ) (overestimation due to falsely detected precipitation), and Miss bias, M ( x , t ) (underestimation due to undetected precipitation). Their orthogonality means that, for a given point in space and time, Total bias can only be due to either Hit, False or Miss bias, and it becomes the combination of all three when accumulating or averaging it through a time series.
    This decomposition is very useful because it hints to the ultimate sources of disagreement. Focusing only on Total bias, we might get low values and assume good performance due to overestimation and underestimation cancelling out through the time series; however, with this decomposition, we can check whether that is the case or the SPPs actually exhibit good performance. This decomposition becomes even more relevant the shorter the time scale, precisely because overestimations and underestimations have less time to cancel out.
    Nonetheless, it is not straightforward to extract useful, meaningful information from it. First of all, it is not clear whether accumulating or averaging the biases is the best choice, and we encounter again the necessity of considering local precipitation patterns for better relevance. Furthermore, Hit bias presents the same problems of Total bias, in the sense of possible positive and negative values cancelling out when accumulating or averaging it. Considering all of that, we took the basis of this error decomposition and slightly tweaked each component, with the intention of making them more relevant:
    • Relative Total bias: accumulated Total bias divided by accumulated reference precipitation. It represents how large the accumulated error is compared to the local amount of precipitation. We would have defined it as the usual mean relative error (error divided by reference value) if precipitation could not be null.
    • Relative Positive (Negative) Hit bias: averaged relative error coming from days where precipitation has been correctly detected but overestimated (underestimated). We took advantage of these days presenting a non-zero reference value. We decided not to accumulate the bias and divide it by accumulated precipitation to prevent smoothing it.
    • Relative False bias: accumulated False bias divided by accumulated satellite precipitation. It represents how much of the satellite estimated precipitation is false.
    • Relative Miss bias: accumulated Miss bias divided by accumulated reference precipitation. It represents how much of the gauge detected precipitation has been missed.
    Finally, all types of bias (both the original definitions from [43] and our definitions) lose information about how probably an event will present one or another type of bias. Fortunately, the categorical metrics used in this study inform about that: the probability of finding False bias is given by the FAR metric, while that of finding Miss bias is given by the complementary of POD (i.e., 1 P O D ). Equivalently, the probability of occurring Positive (Negative) Hit bias is represented by the Overestimation (Underestimation) rate.

    4.3. Data Agroupation

    The previous performance metrics provide together a detailed insight into the shortcomings of satellite precipitation products. Nonetheless, we can extend this insight further if we also gather the data according to diverse, useful criteria. Thus, we have calculated all these metrics several times, each one with the data grouped by each of the following criteria (always per pixel and, if not stated otherwise, at daily scale):
    • No data grouping: overall comparison through the whole temporal record. We performed this comparison both at daily and monthly resolution. For this last one, we created monthly datasets by accumulating the daily ones through each month, and as there is no common definition for a wet month, we also used the threshold of p = 1   mm for defining a wet month and for the computation of rMAE.
    • Grouping by season of year, for all years at once (i.e., without focusing on every year individually). We have applied the usual climatological month agroupation.
    • Grouping by intensity intervals. The chosen thresholds are pixel-scale quartiles reported by reference (which are slightly different from pixel to pixel), once ignoring dry days.
    • Grouping by mean altitude intervals, obtained from the SRTM DEM resampled to both 0.25° and 0.1° lat-lon resolutions. The thresholds have been determined following the work of Navarro et al. [44].
    • Grouping by orographic complexity intervals, represented by the TRI calculated from the SRTM DEM at both resolutions too. The thresholds have been established according to pixel-scale quartiles. These quartiles were similar for the three SPPs, so we chose the same representative values for all of them.
    • Grouping by density of gauges per pixel. The chosen thresholds are 1, 2, 3 and more than 3 gauges per pixel, which have been established both according to quartiles at 0.1° lat-lon resolution and due to our interesent in performance variability for lower gauge densities.
    Table 2 gathers the different thresholds for the diverse agroupation. With all these information, we have created violin plots for every metric and every grouping criteria, in which each data point represents one pixel. Furthermore, we have created maps for every metric when not grouping the data and when grouping the data by season of year, in order to visualize possible spatial patterns in the performance.

    5. Results

    5.1. Probability Density Functions of Precipitation According to Reference and to Each SPP

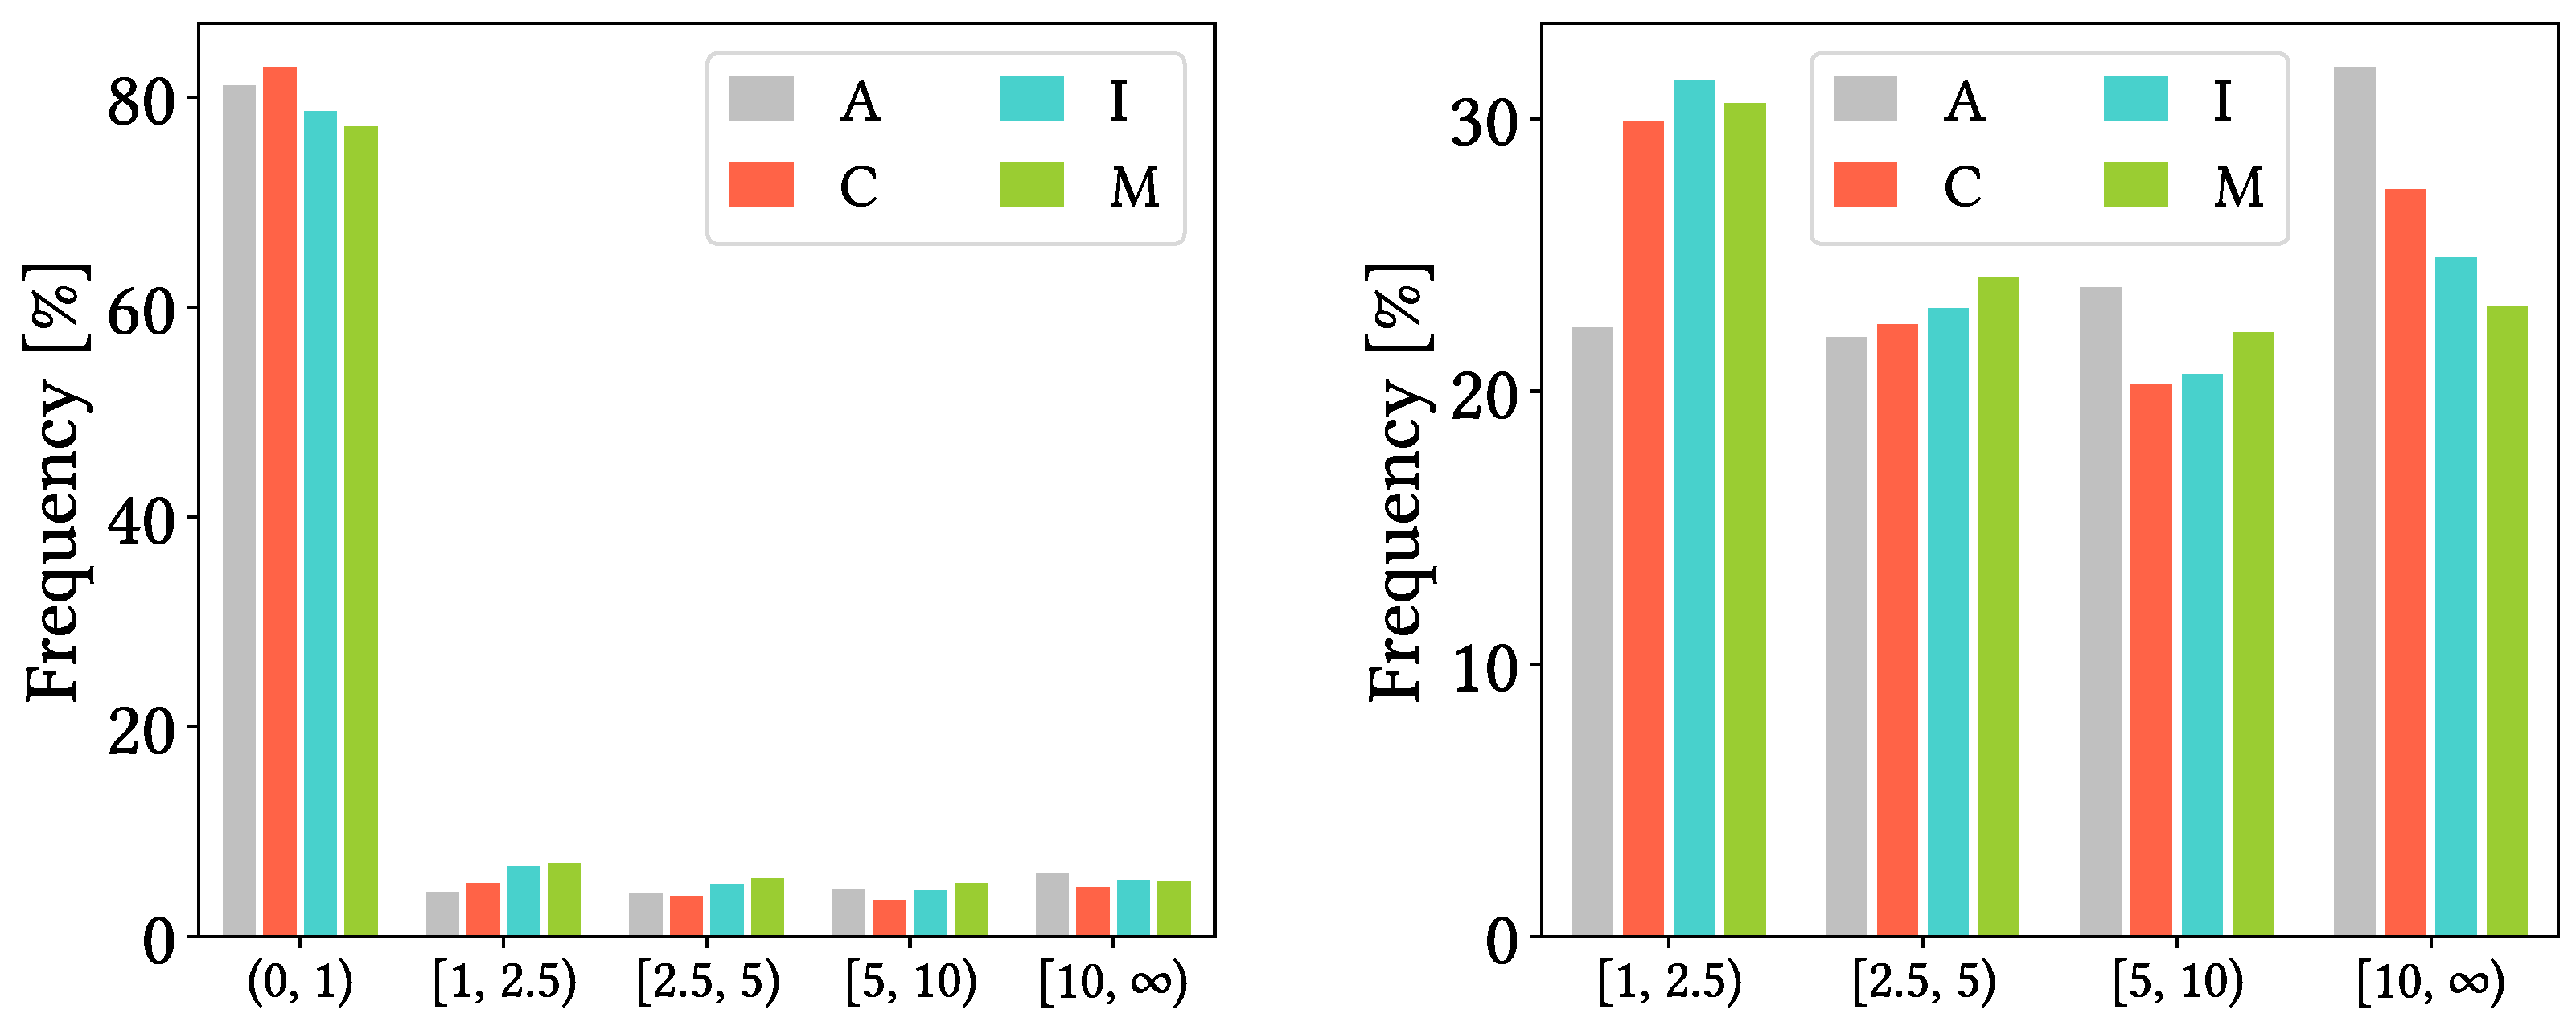
    Figure 8 presents probability density functions of precipitation reports based on the reference dataset from AEMET and on the SPP datasets, grouped by approximate reference quartiles (we did not use exact quartiles because we believe the chosen bin limits are easier to visualise). From left figure, we see that vastly most reports are dry reports, both according to AEMET and every SPP. From the right figure, which focus only on wet reports, we see that all SPPs tend to underestimation, as their probabilities of finding reports in the two lower bins are greater than those from AEMET, and vice versa for the two upper bins.

    5.2. Contributions and Occurrences of Each Type of Bias

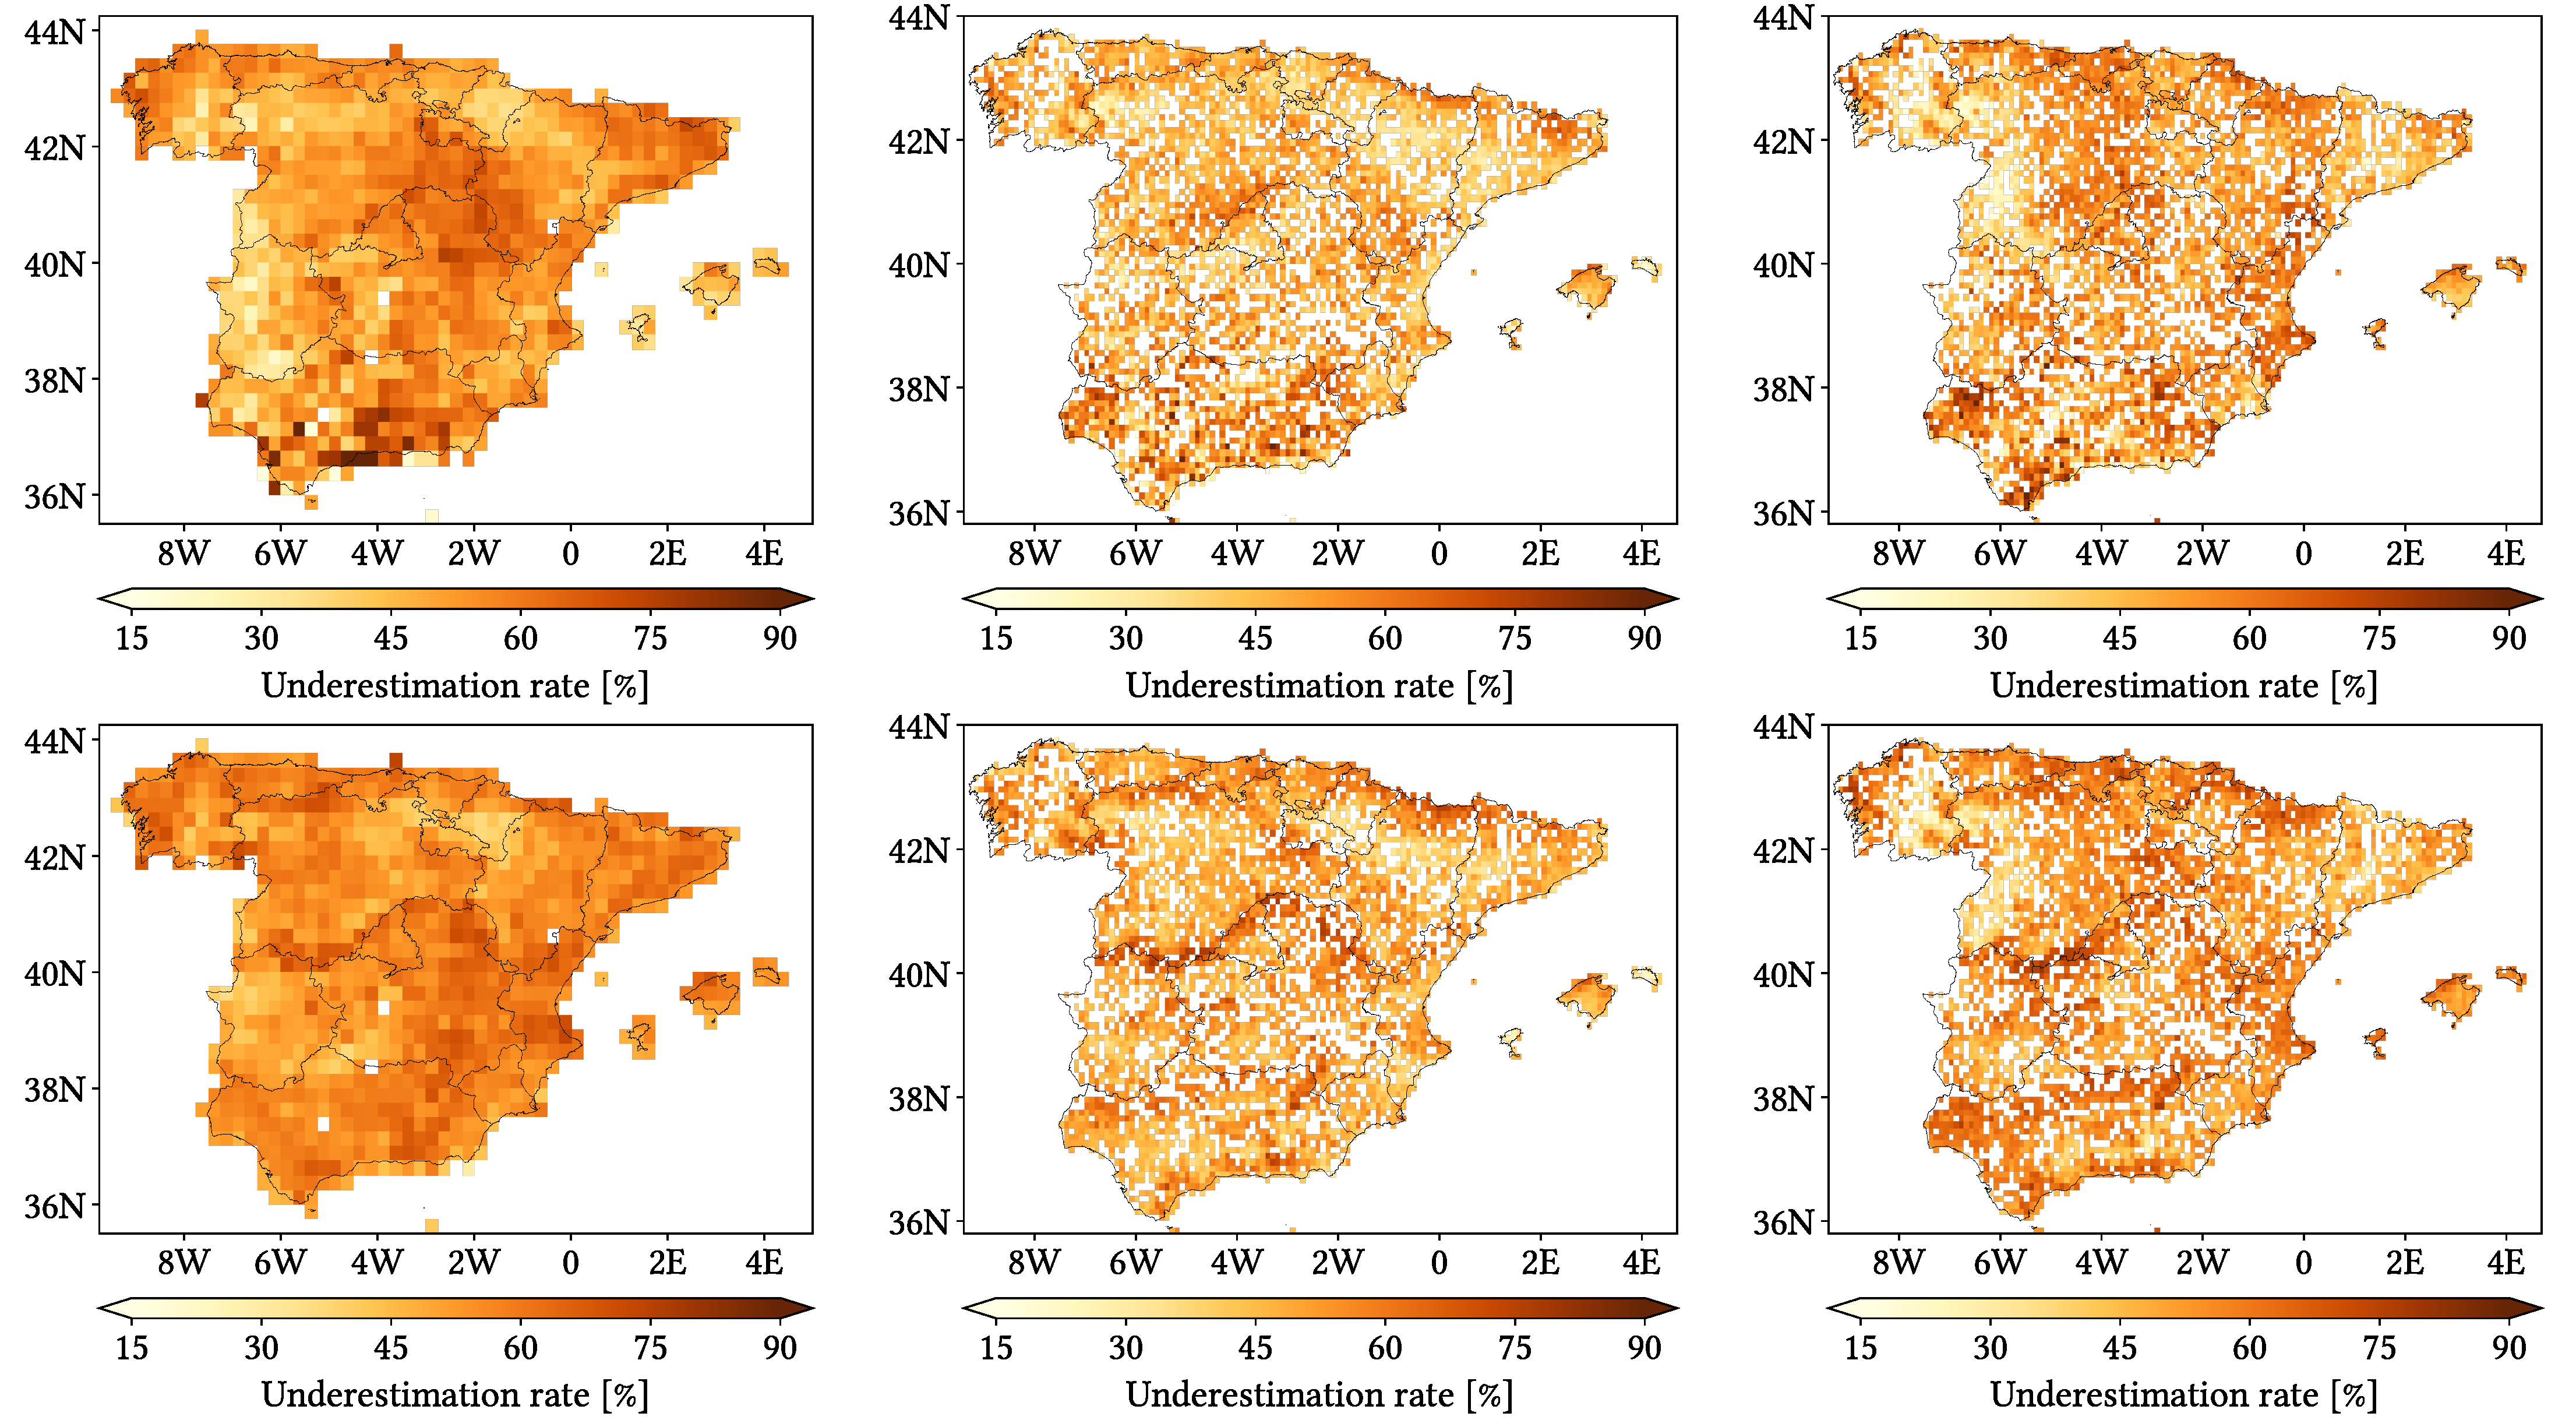
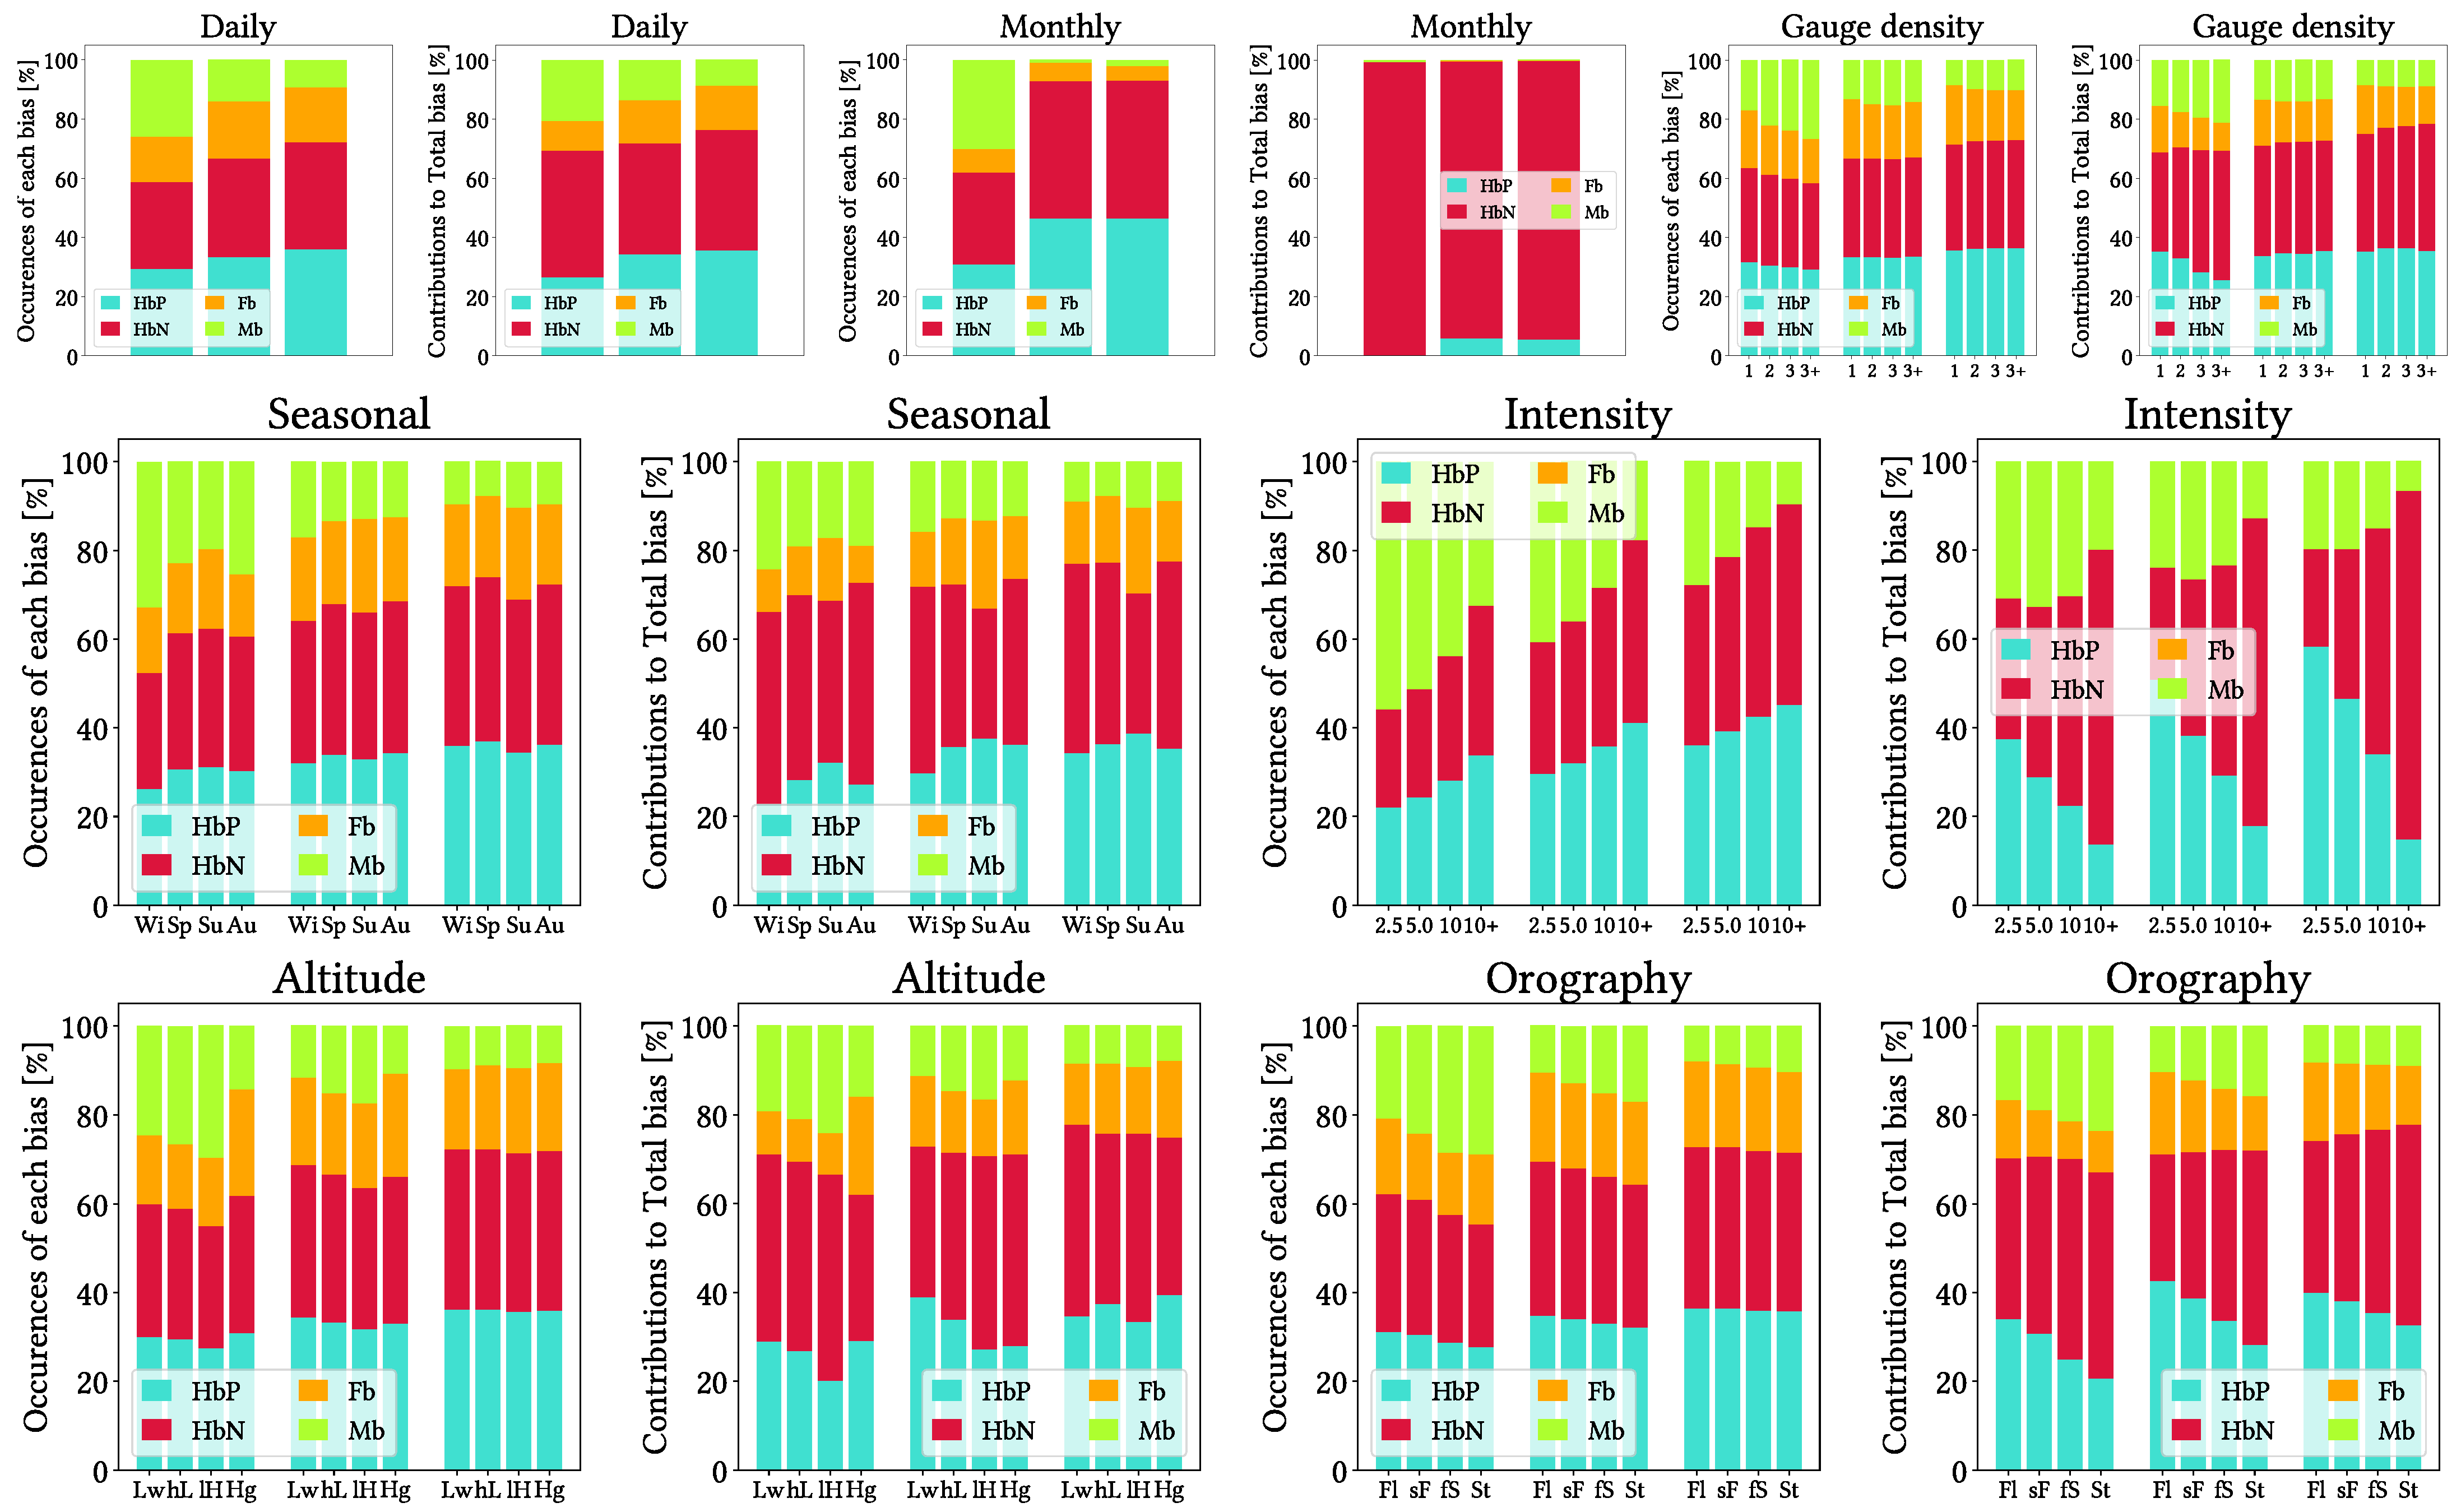
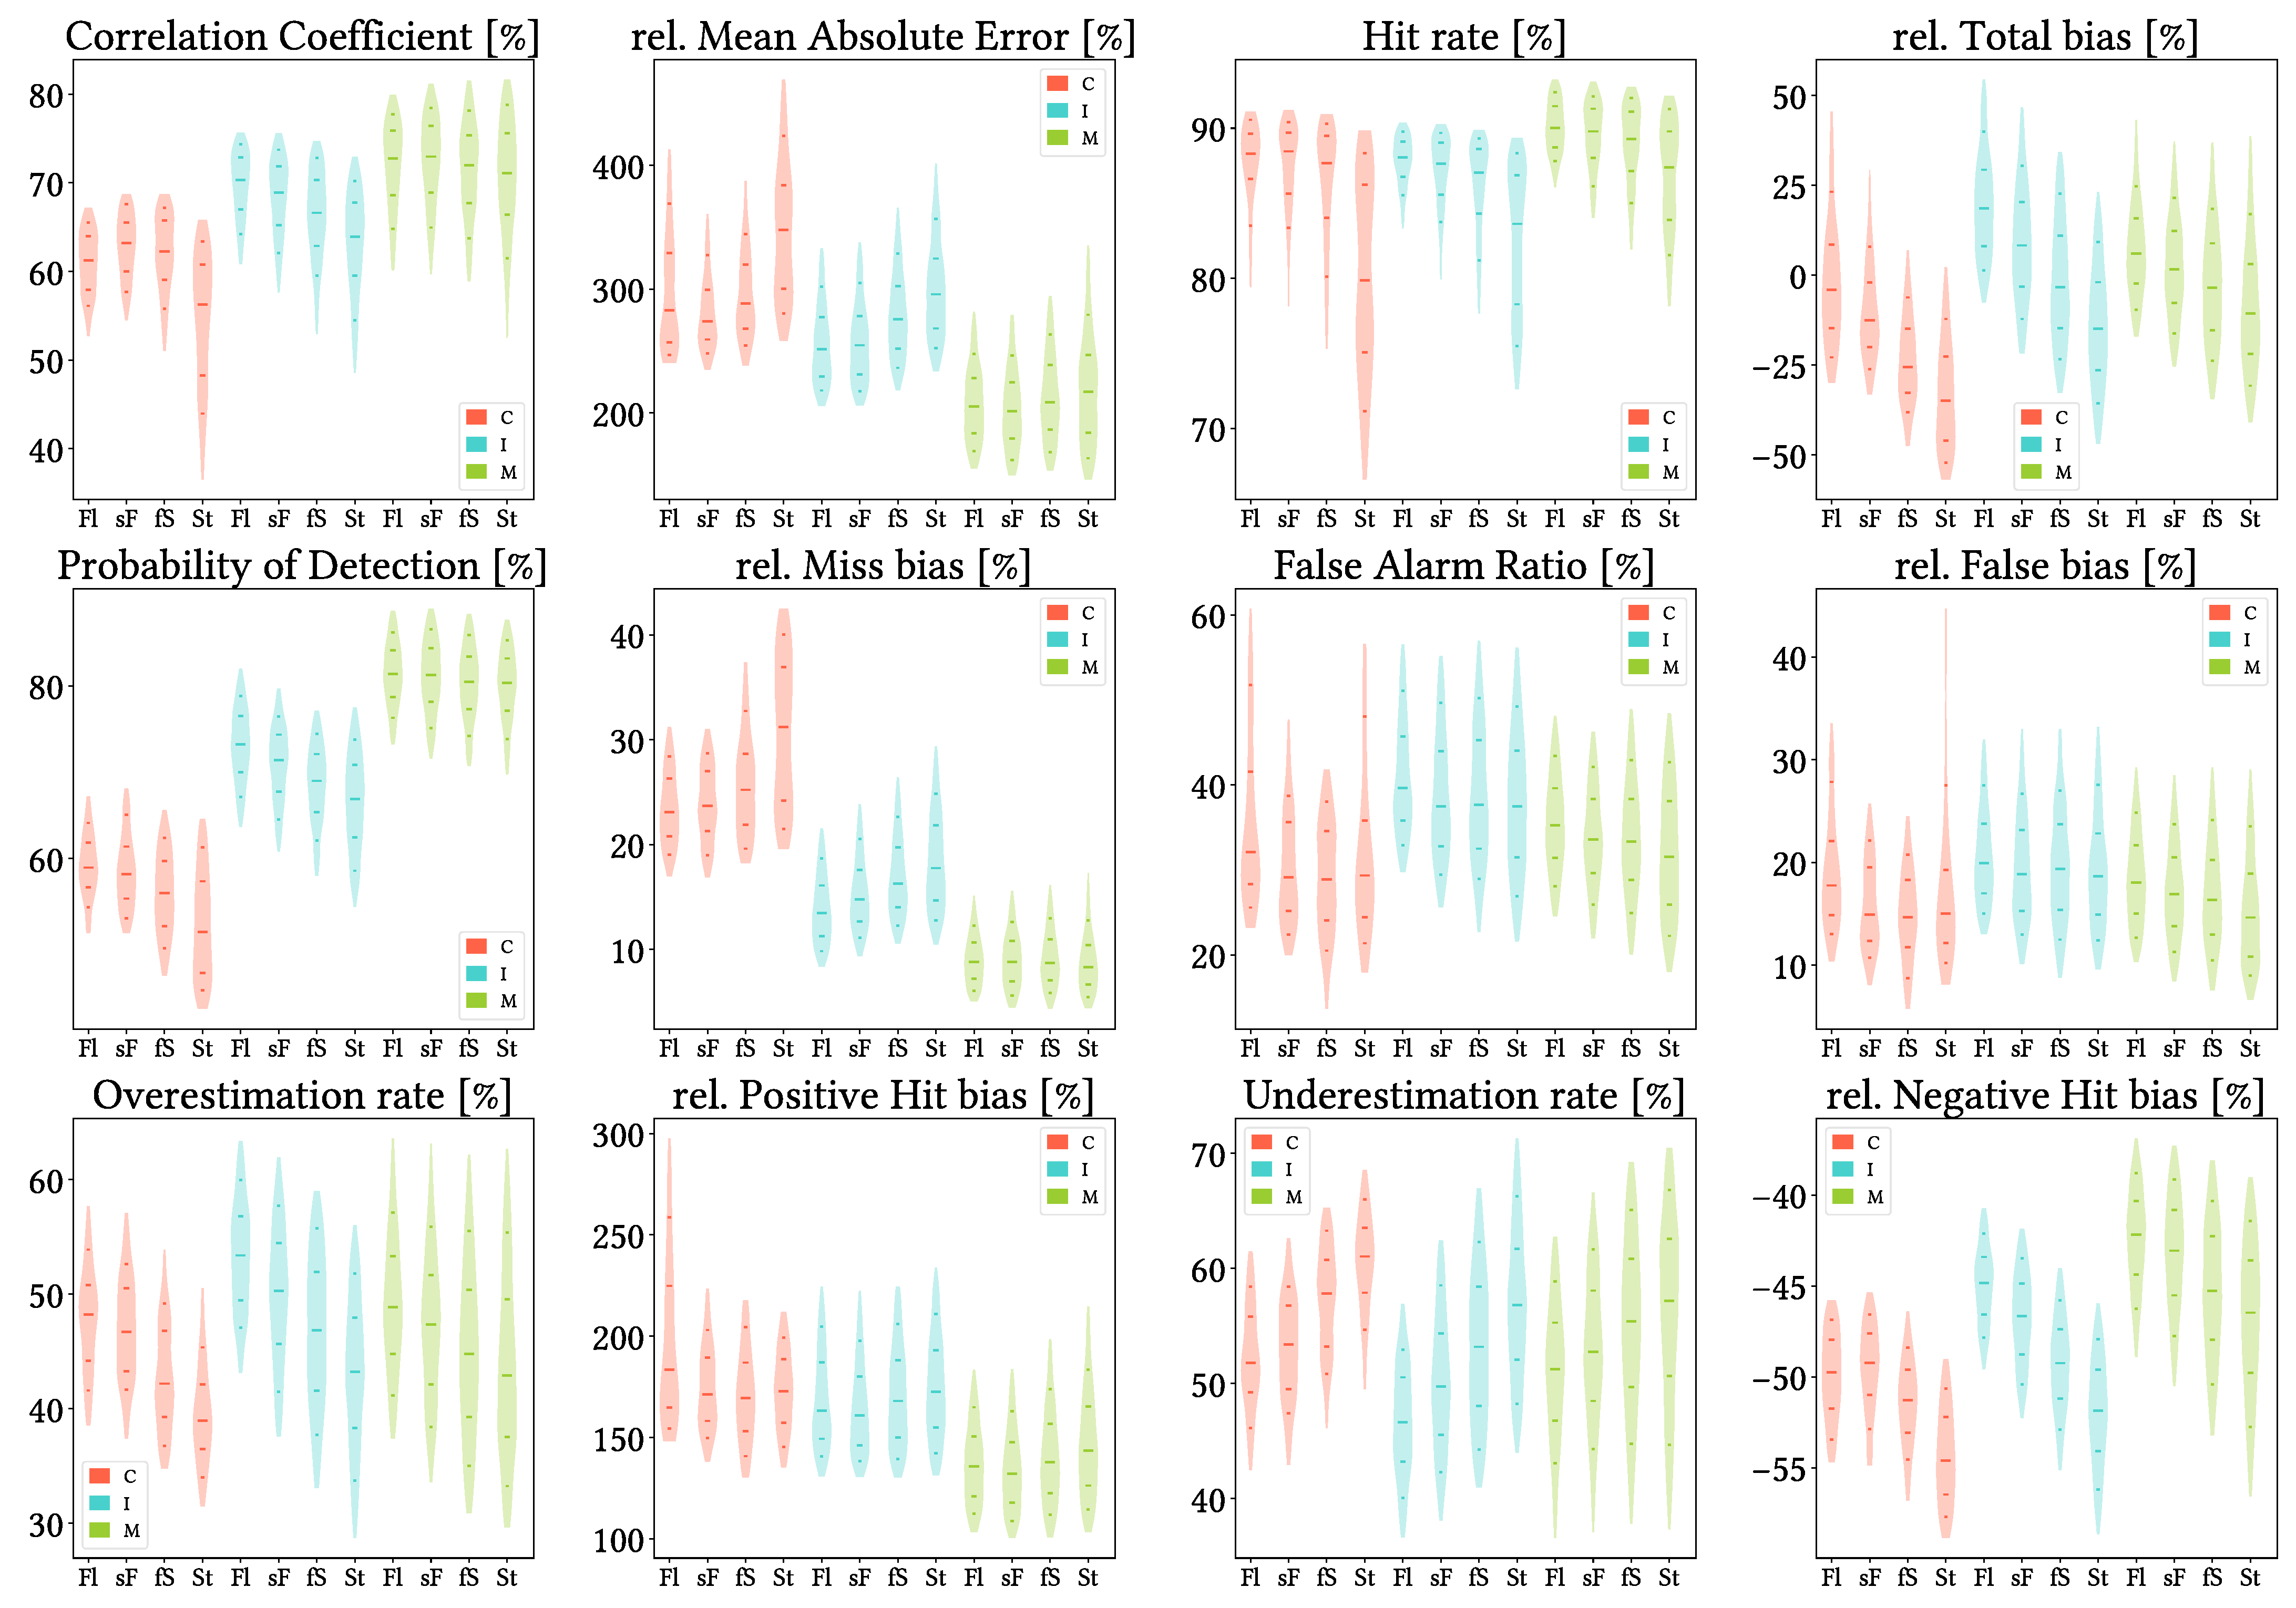
    Figure 9 present stacked bars charts of both occurrences and amount contribution for every type of bias, and for every applied grouping criteria. False bias is not present for the intensity-wise gathering as it cannot exist (SPP cannot report false precipitation when reference report is not null). From the plots for daily grouping, we can already tell that CMORPH is the most prone to underestimation and MSWEP the least, and that IMERG and MSWEP show similar proportions of False bias (in every case, both for occurrences and amounts). Monthly grouping confirms that further, and interestingly, even though overestimation and underestimation occur in similar frequencies, underestimation amounts are dramatically greater. Focusing on the grouping by gauge density, IMERG and MSWEP show extremely similar results to those for daily grouping no matter the gauge density, while CMORPH shows similar results too but there are trends as density increases (increased Miss bias in proportions and amounts and increased Negative Hit bias in amounts). A general tone independent of the grouping criteria is that False and Miss bias have greater ratio of occurrences than proportional contribution to bias, which could be due to them occurring for low precipitation intensities. This makes sense for False bias (if there has been no precipitation, atmospheric conditions are probably those that lead to low SPP report) and for Mis bias too (heavy rain should be easier to detect than light rain), and in this last case we can appreciate it through the charts for intensity grouping: the greater the intensity, the lesser the Miss bias frequency and contribution. It is also interesting to see that for greater intensities, overestimation and underestimation seem to occur in similar frequencies, but underestimation is vastly more important in amount contribution. From the seasonal grouping, we see that winter leads in Miss bias and summer in False bias; from the altitude grouping, MSWEP performs equally independent of altitude, while CMORPH and IMERG increase Miss bias up to 1500 m and then reduce it notably in favour of False bias; and for the grouping by orographic complexity, all increase Miss bias (frequency and amounts) and Negative Hit bias amounts for increased complexity, but CMORPH is the clearest example and MSWEP shows relatively stable performance (which could be partially explained by the coarser CMORPH resolution being unable to resolve orographic precipitation patterns associated to smaller orographic traits).

    5.3. Overall Daily Analysis

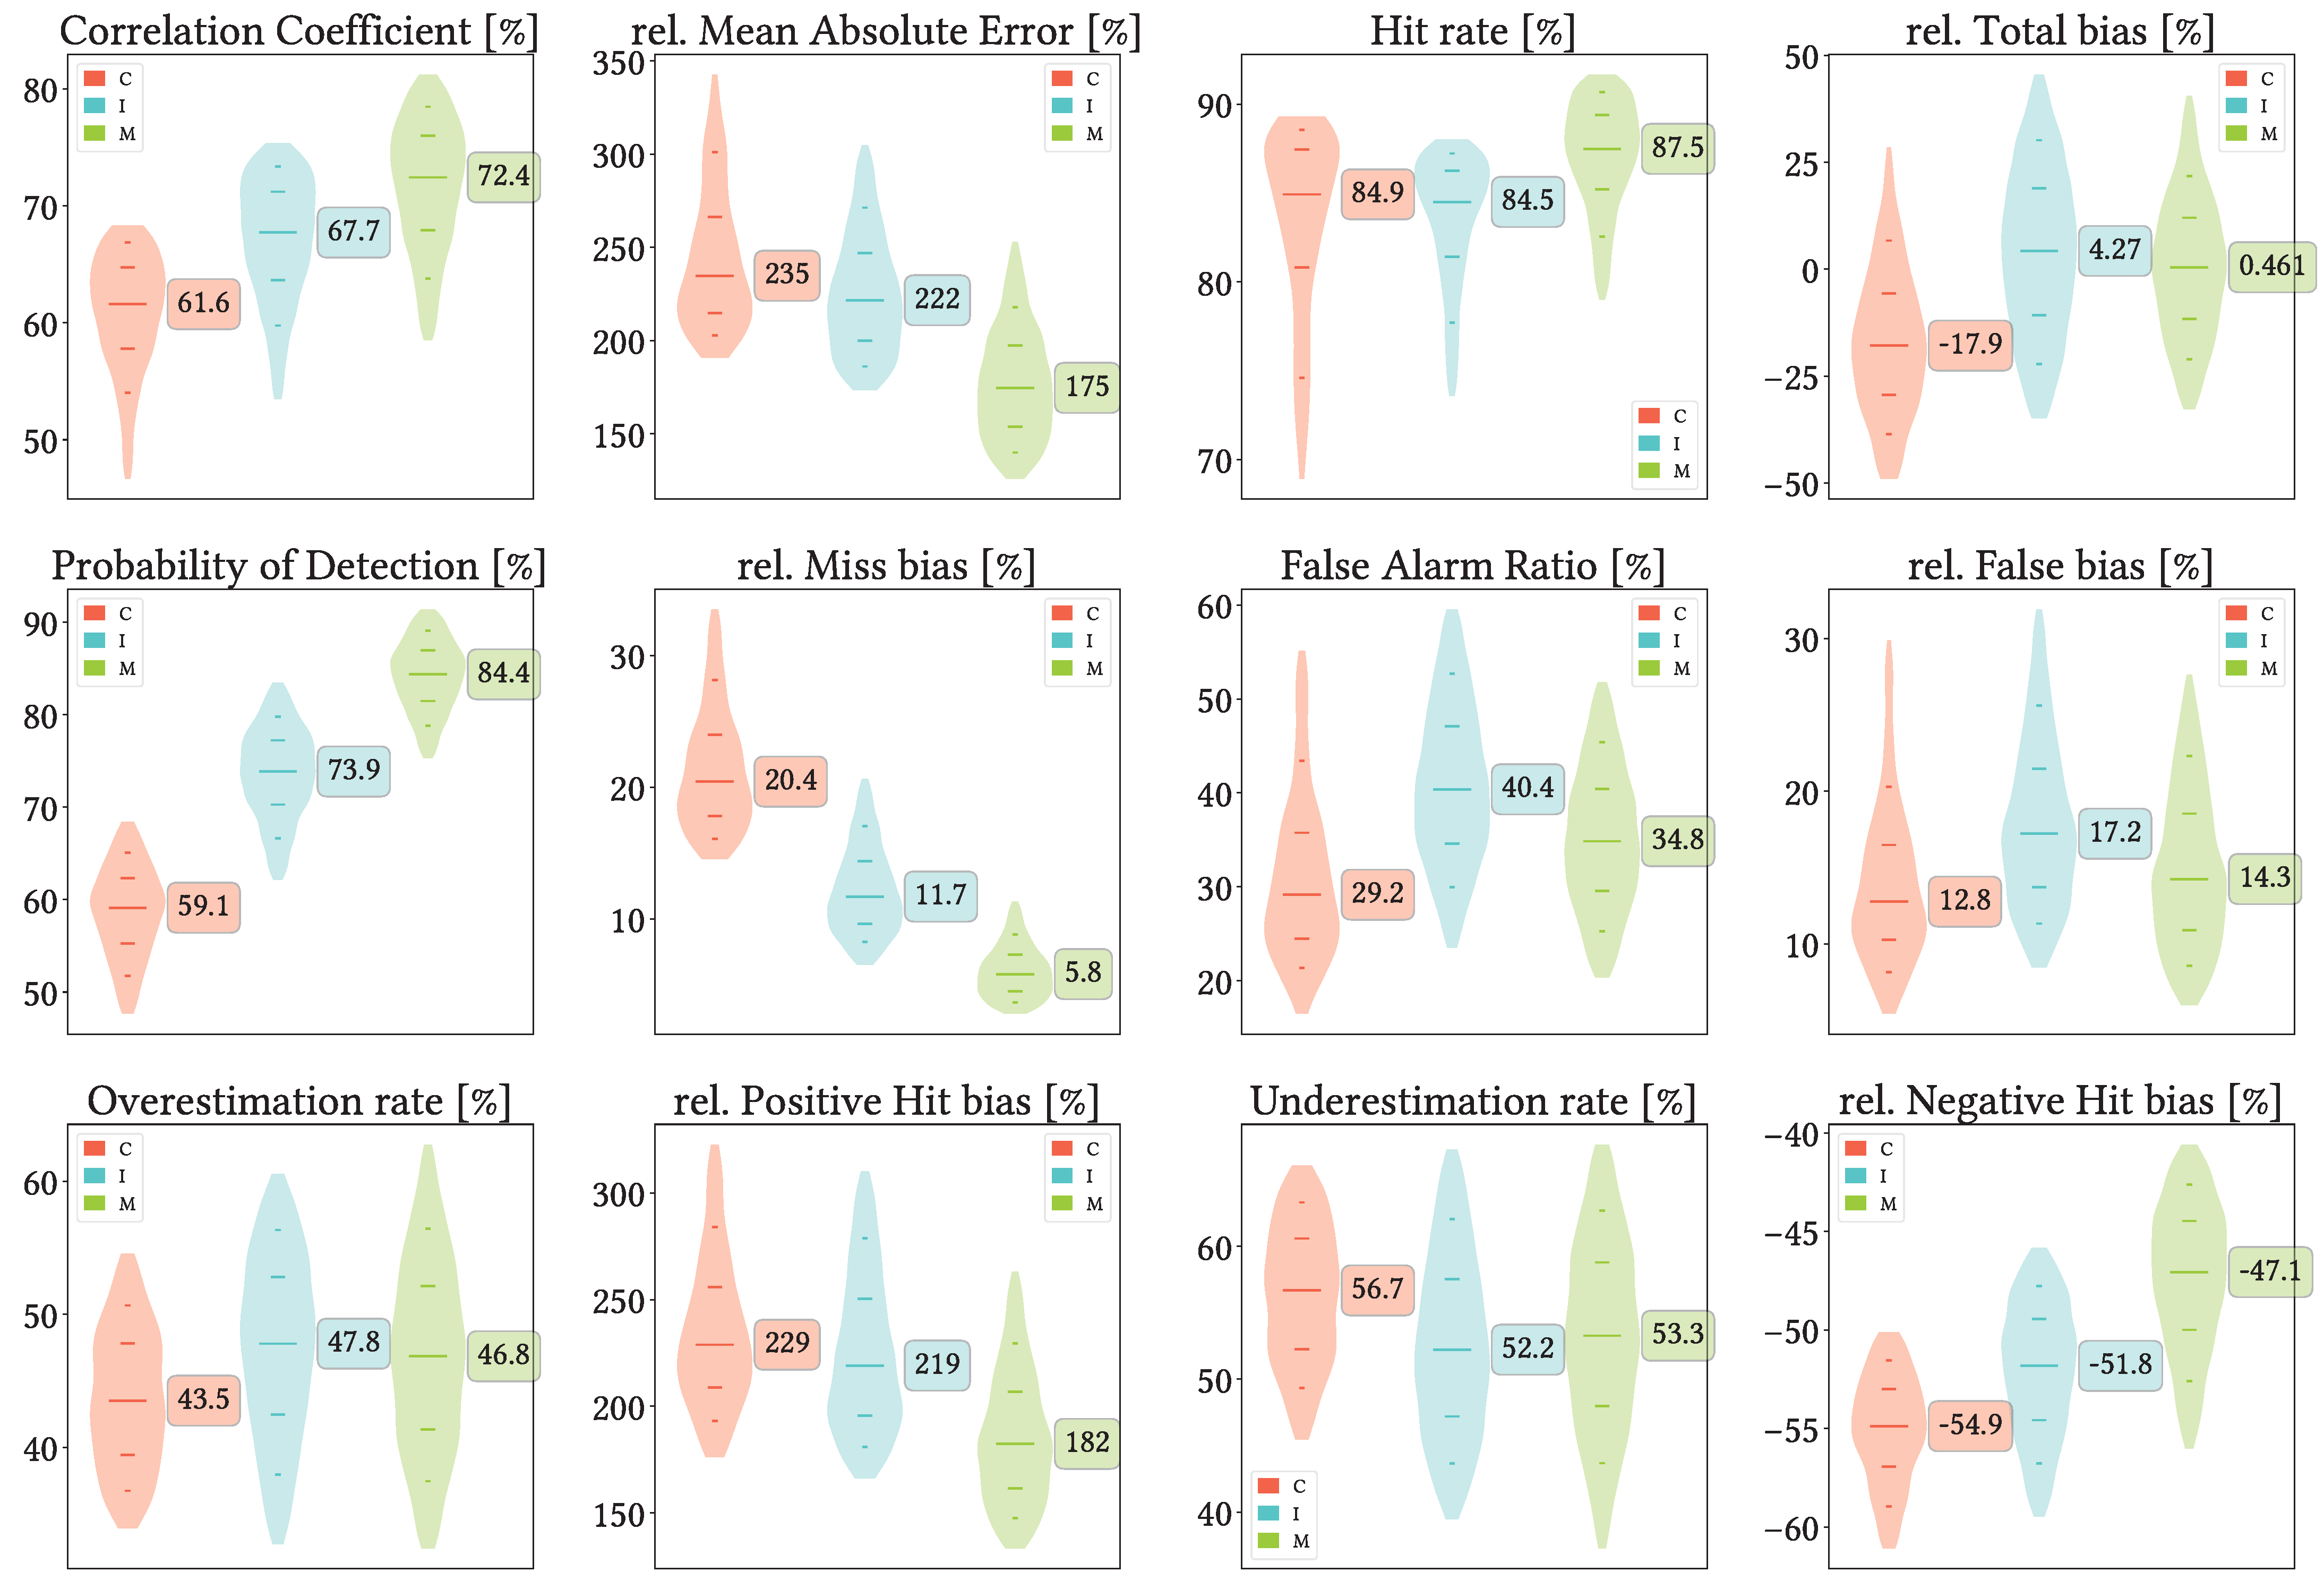
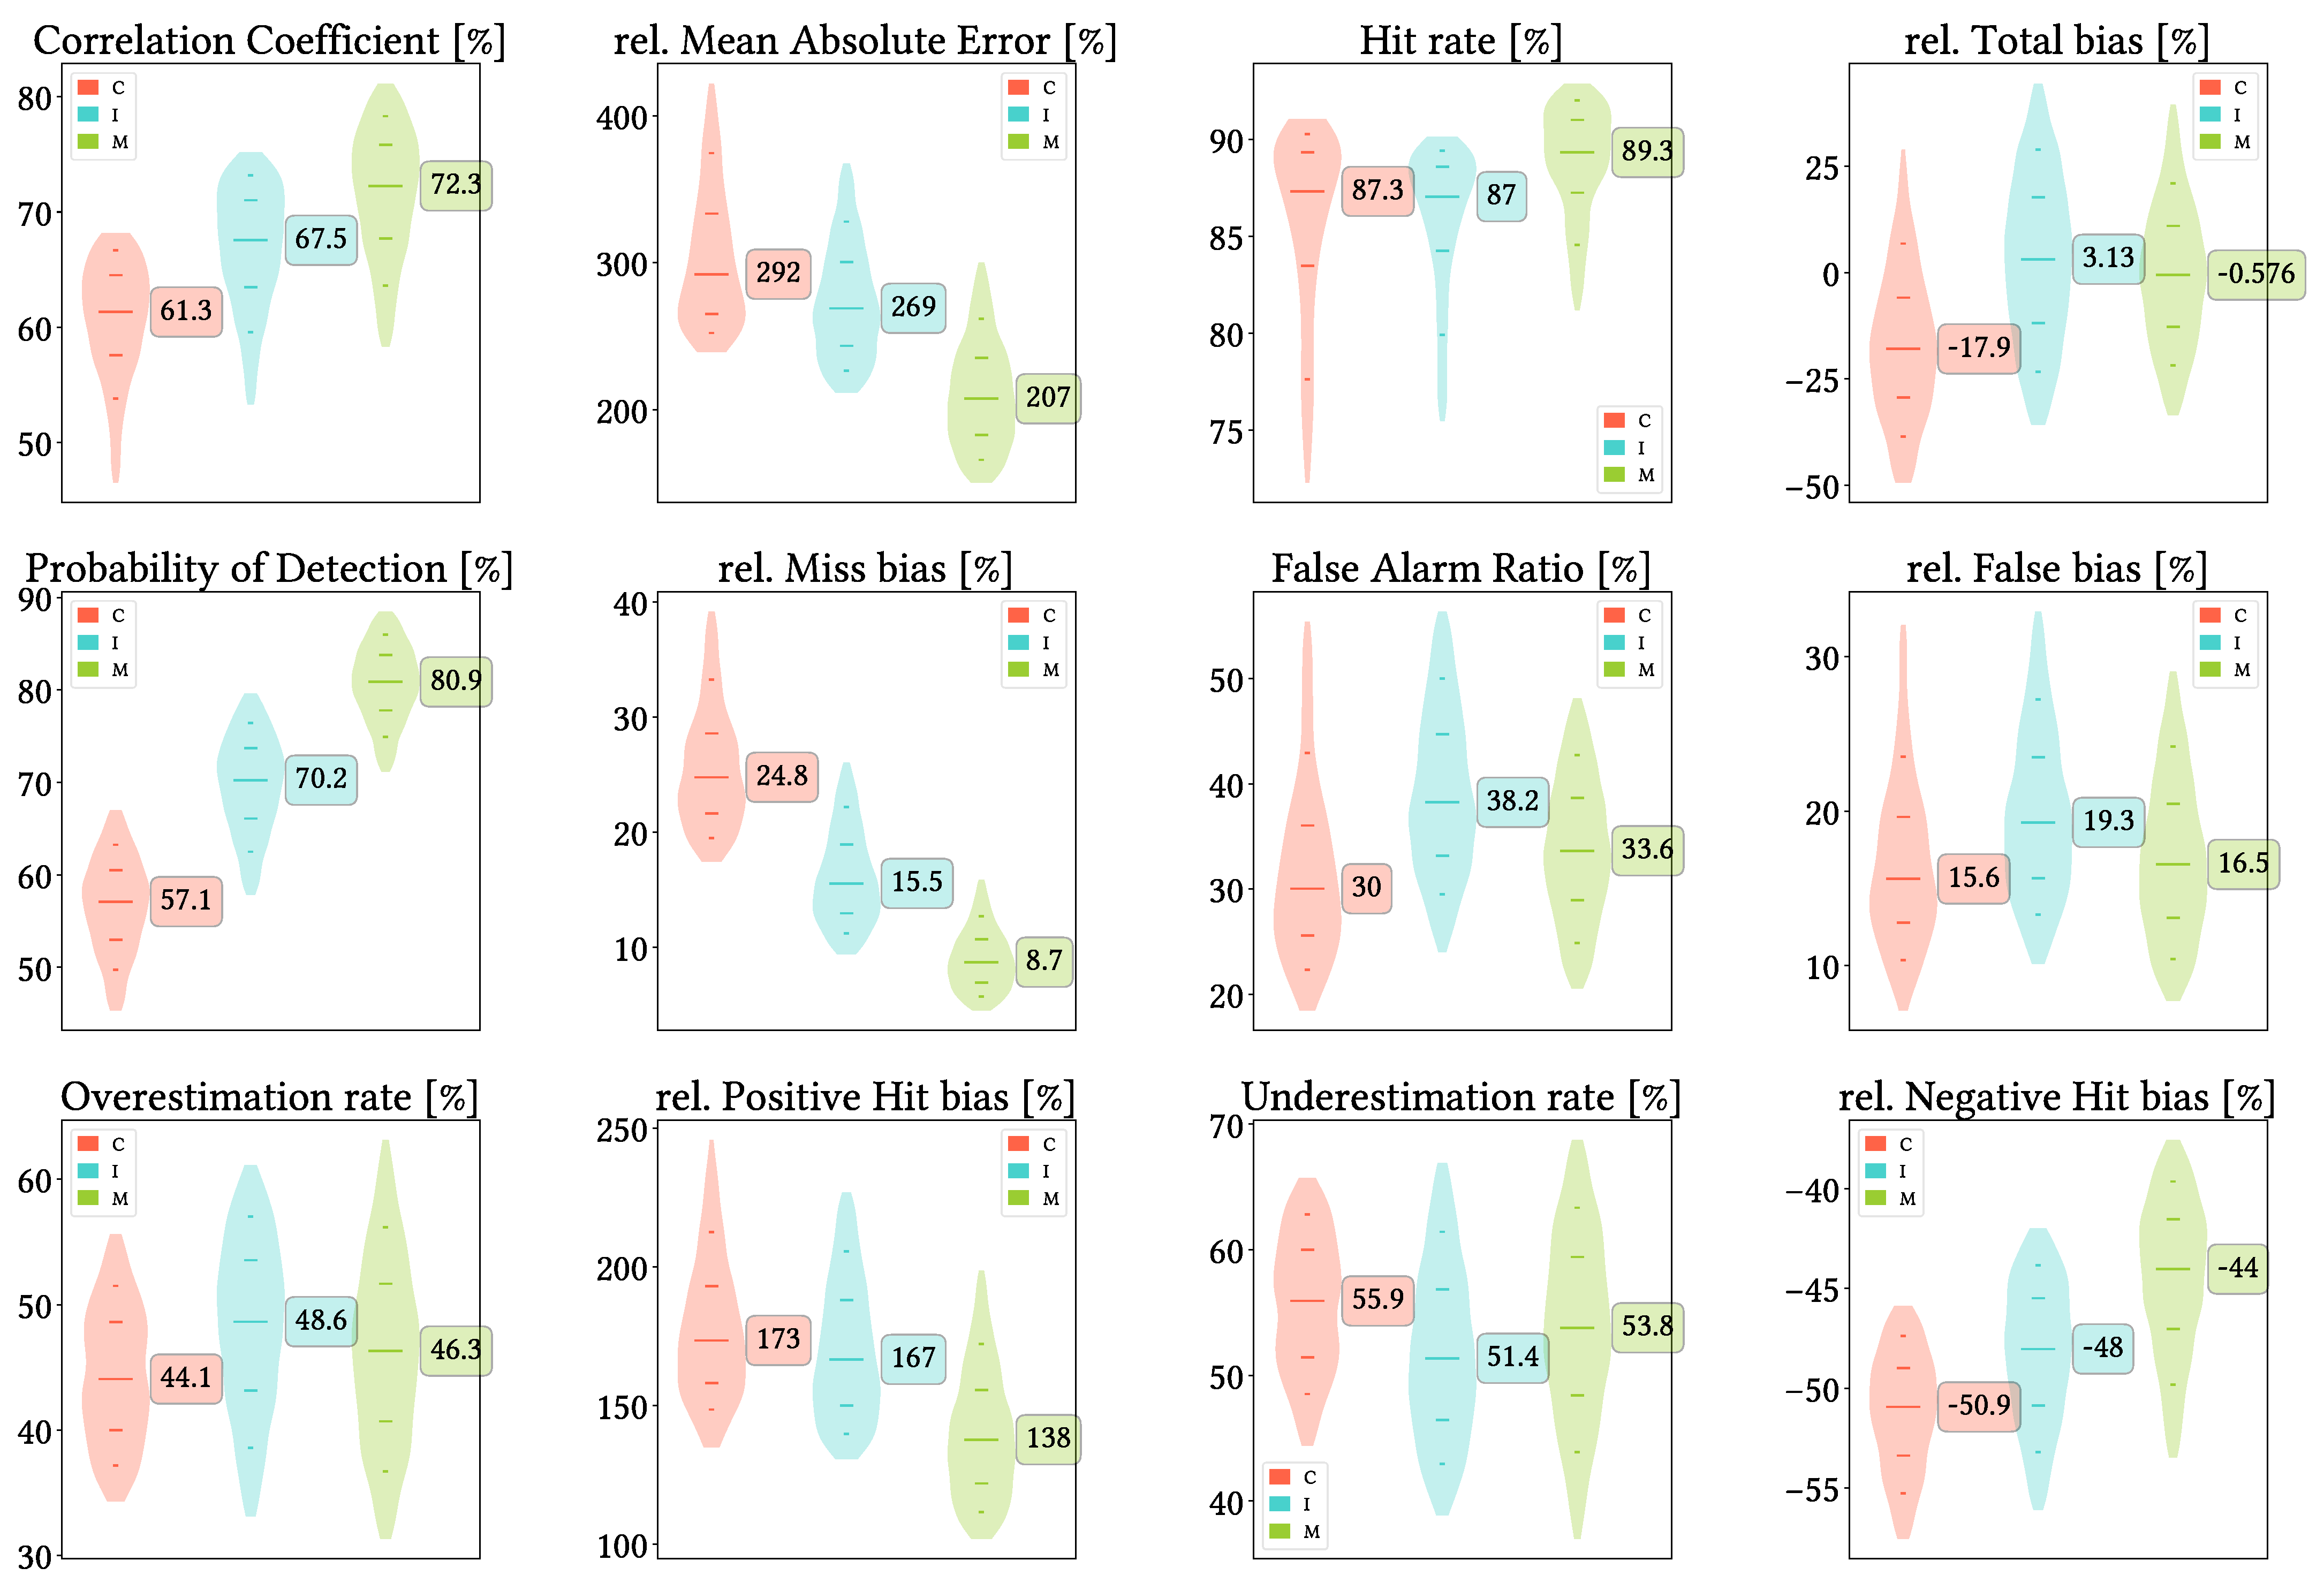
    Figure 10 shows violin plots from the overall analysis at daily scale, without data grouping. It can be clearly seen that, in general terms, MSWEP is the best performer followed by IMERG, while CMORPH performs usually the worst. In all metrics, MSWEP distributions are centered towards better values, and their worst values are still better than the worst values from the other products. IMERG performs better than CMORPH for CC, rMAE, POD, and Total, Hit and Miss bias, whereas CMORPH performs better than IMERG for FAR and False bias. IMERG and CMORPH are basically on par for HtR, as IMERG presents better values in its two lowest quartiles but worse for the two upper ones. It is more difficult to confirm whether CMORPH or IMERG performs better regarding Total bias, but IMERG still presents an slight advantage.
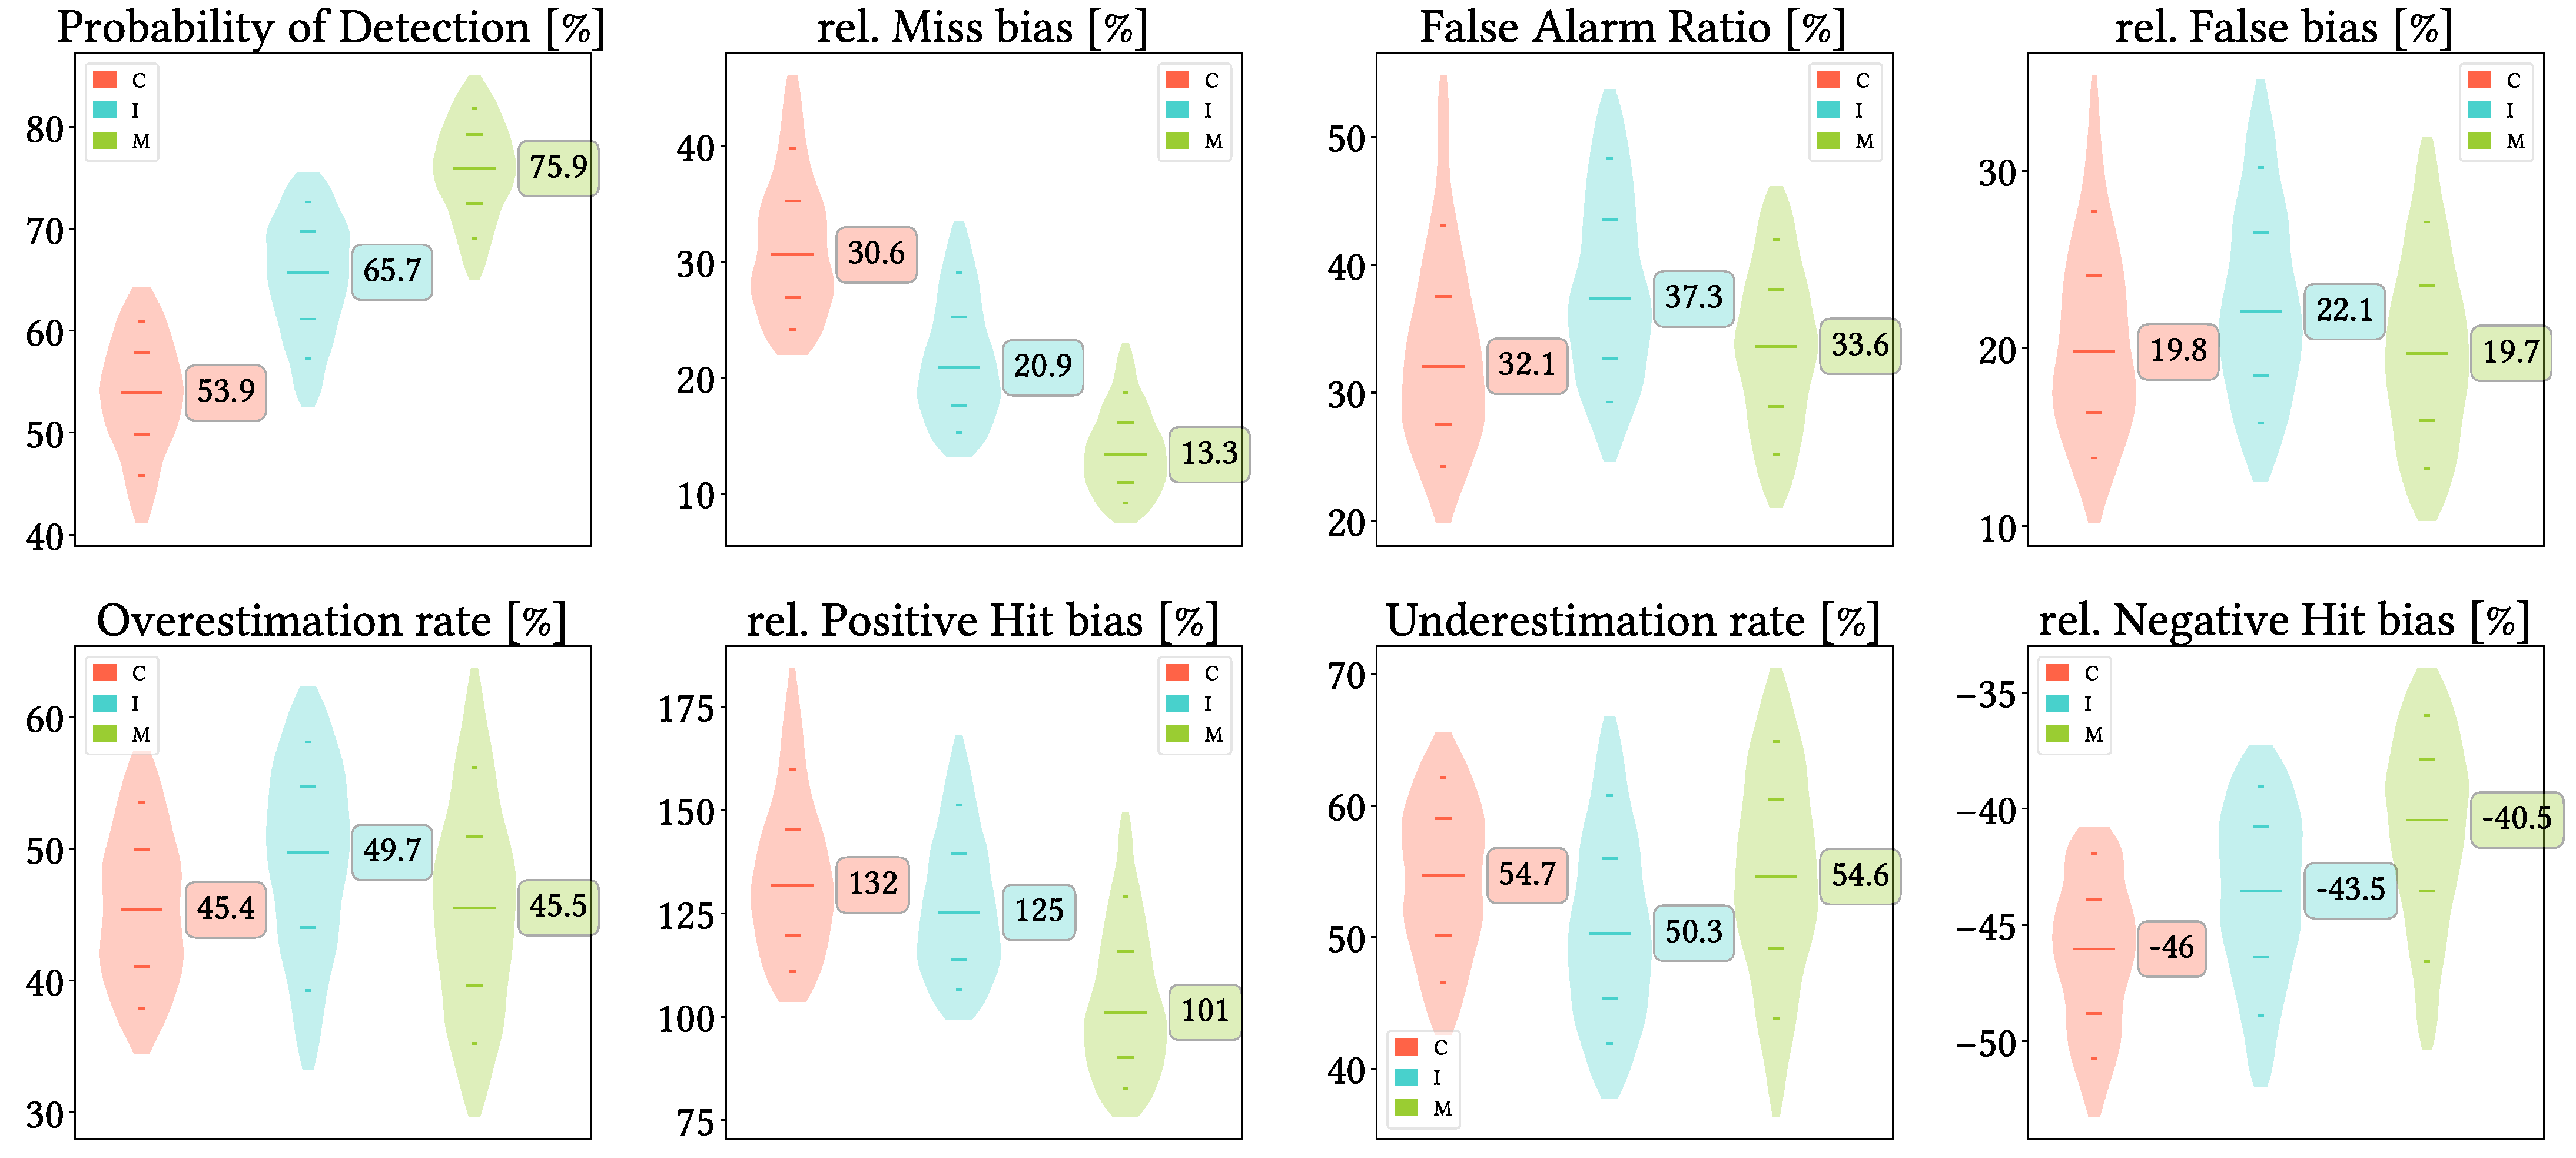
    Regarding biases, looking first at Total bias, we see that CMORPH is clearly prone to underestimation, IMERG is slightly prone to overestimation, and MSWEP is more equilibrated but very similar to IMERG. If we focus deeper in each type of bias, when correctly detecting precipitation, actually CMORPH both overestimates slightly more and underestimates clearly more than IMERG and MSWEP. Combined with the notably lower False bias and much greater Miss bias, all this leads to its observed underestimation. The reason behind IMERG slight overestimation probably lies in its Positive Hit bias (more than twice as large as its Negative Hit bias) and in its False bias, the greatest among the three products. Nonetheless, all products tend to underestimate more frequently than overestimate (UdR values greater than OvR ones), with CMORPH as the best example. We have included in Appendix A equivalent plots but changing the detection threshold first to p = 0.5   mm   day 1 and then to p = 2   mm   day 1 , to test its relevance and whether the order of preferable SPP might change. Results are basically the same as with the original threshold: the main difference is that lowering the detection threshold increases detection probability and vice versa, which probably explains why the greater threshold renders the products more problematic (focusing on rMAE).
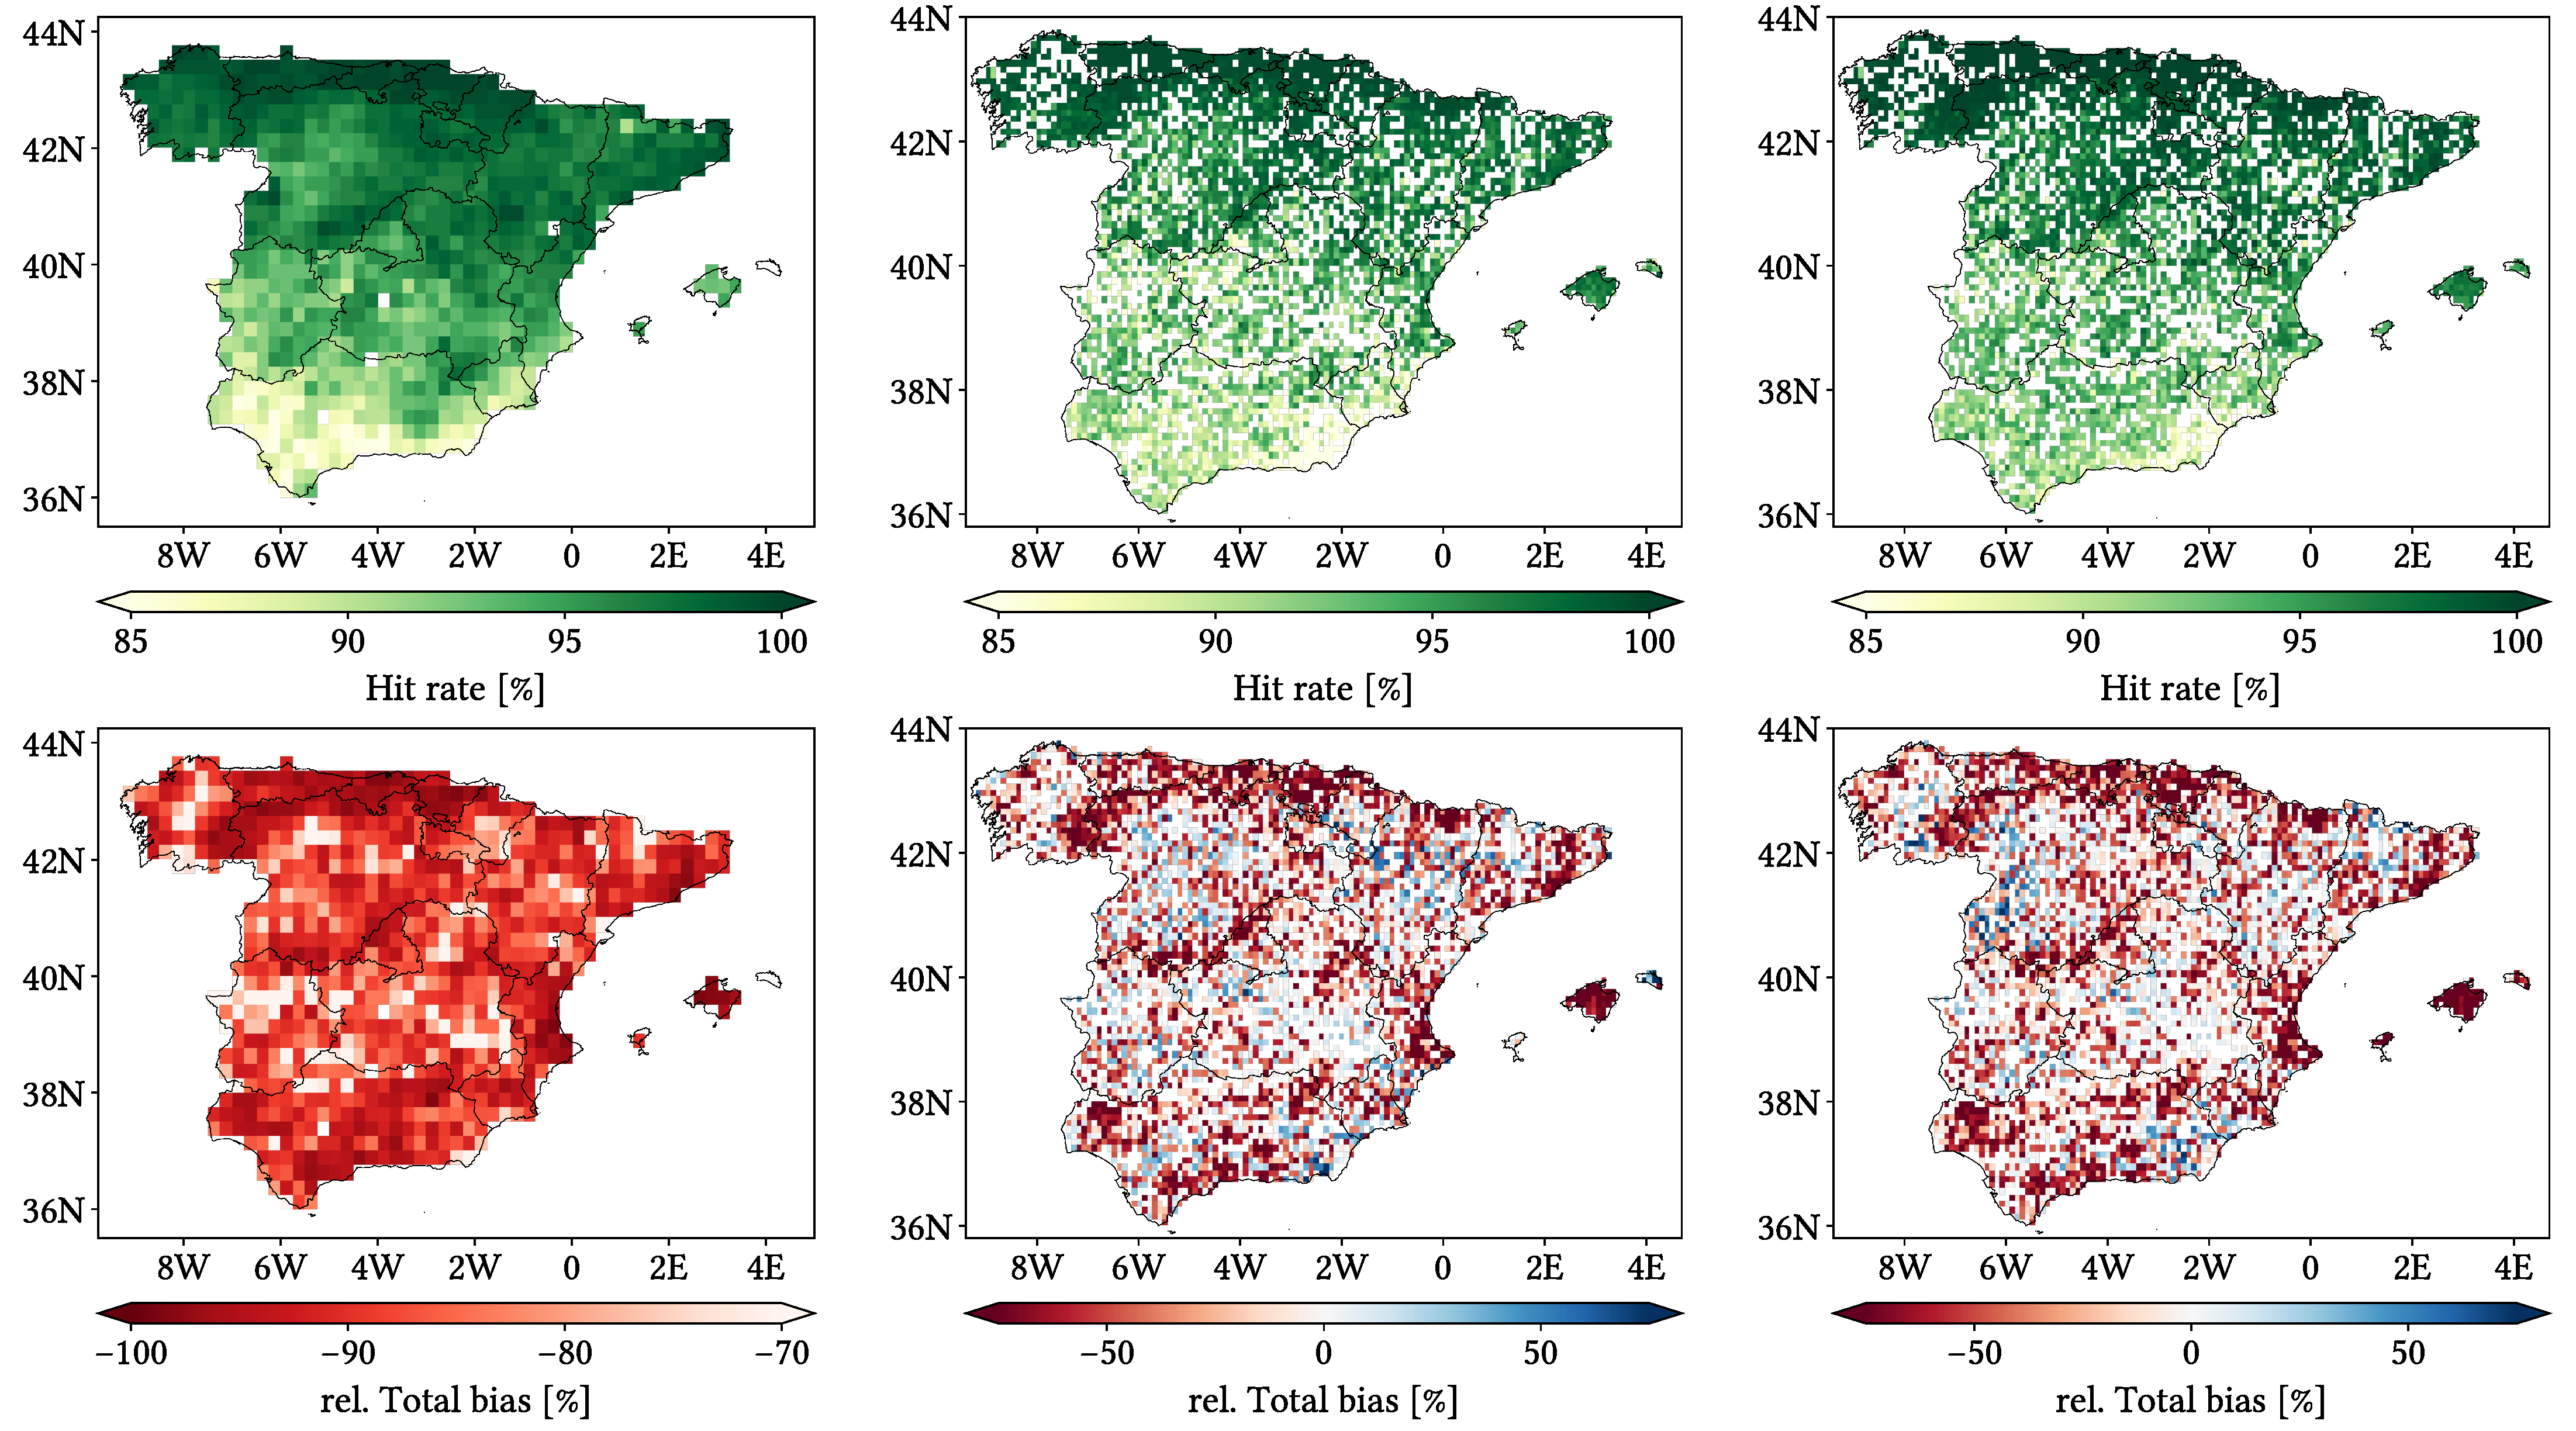
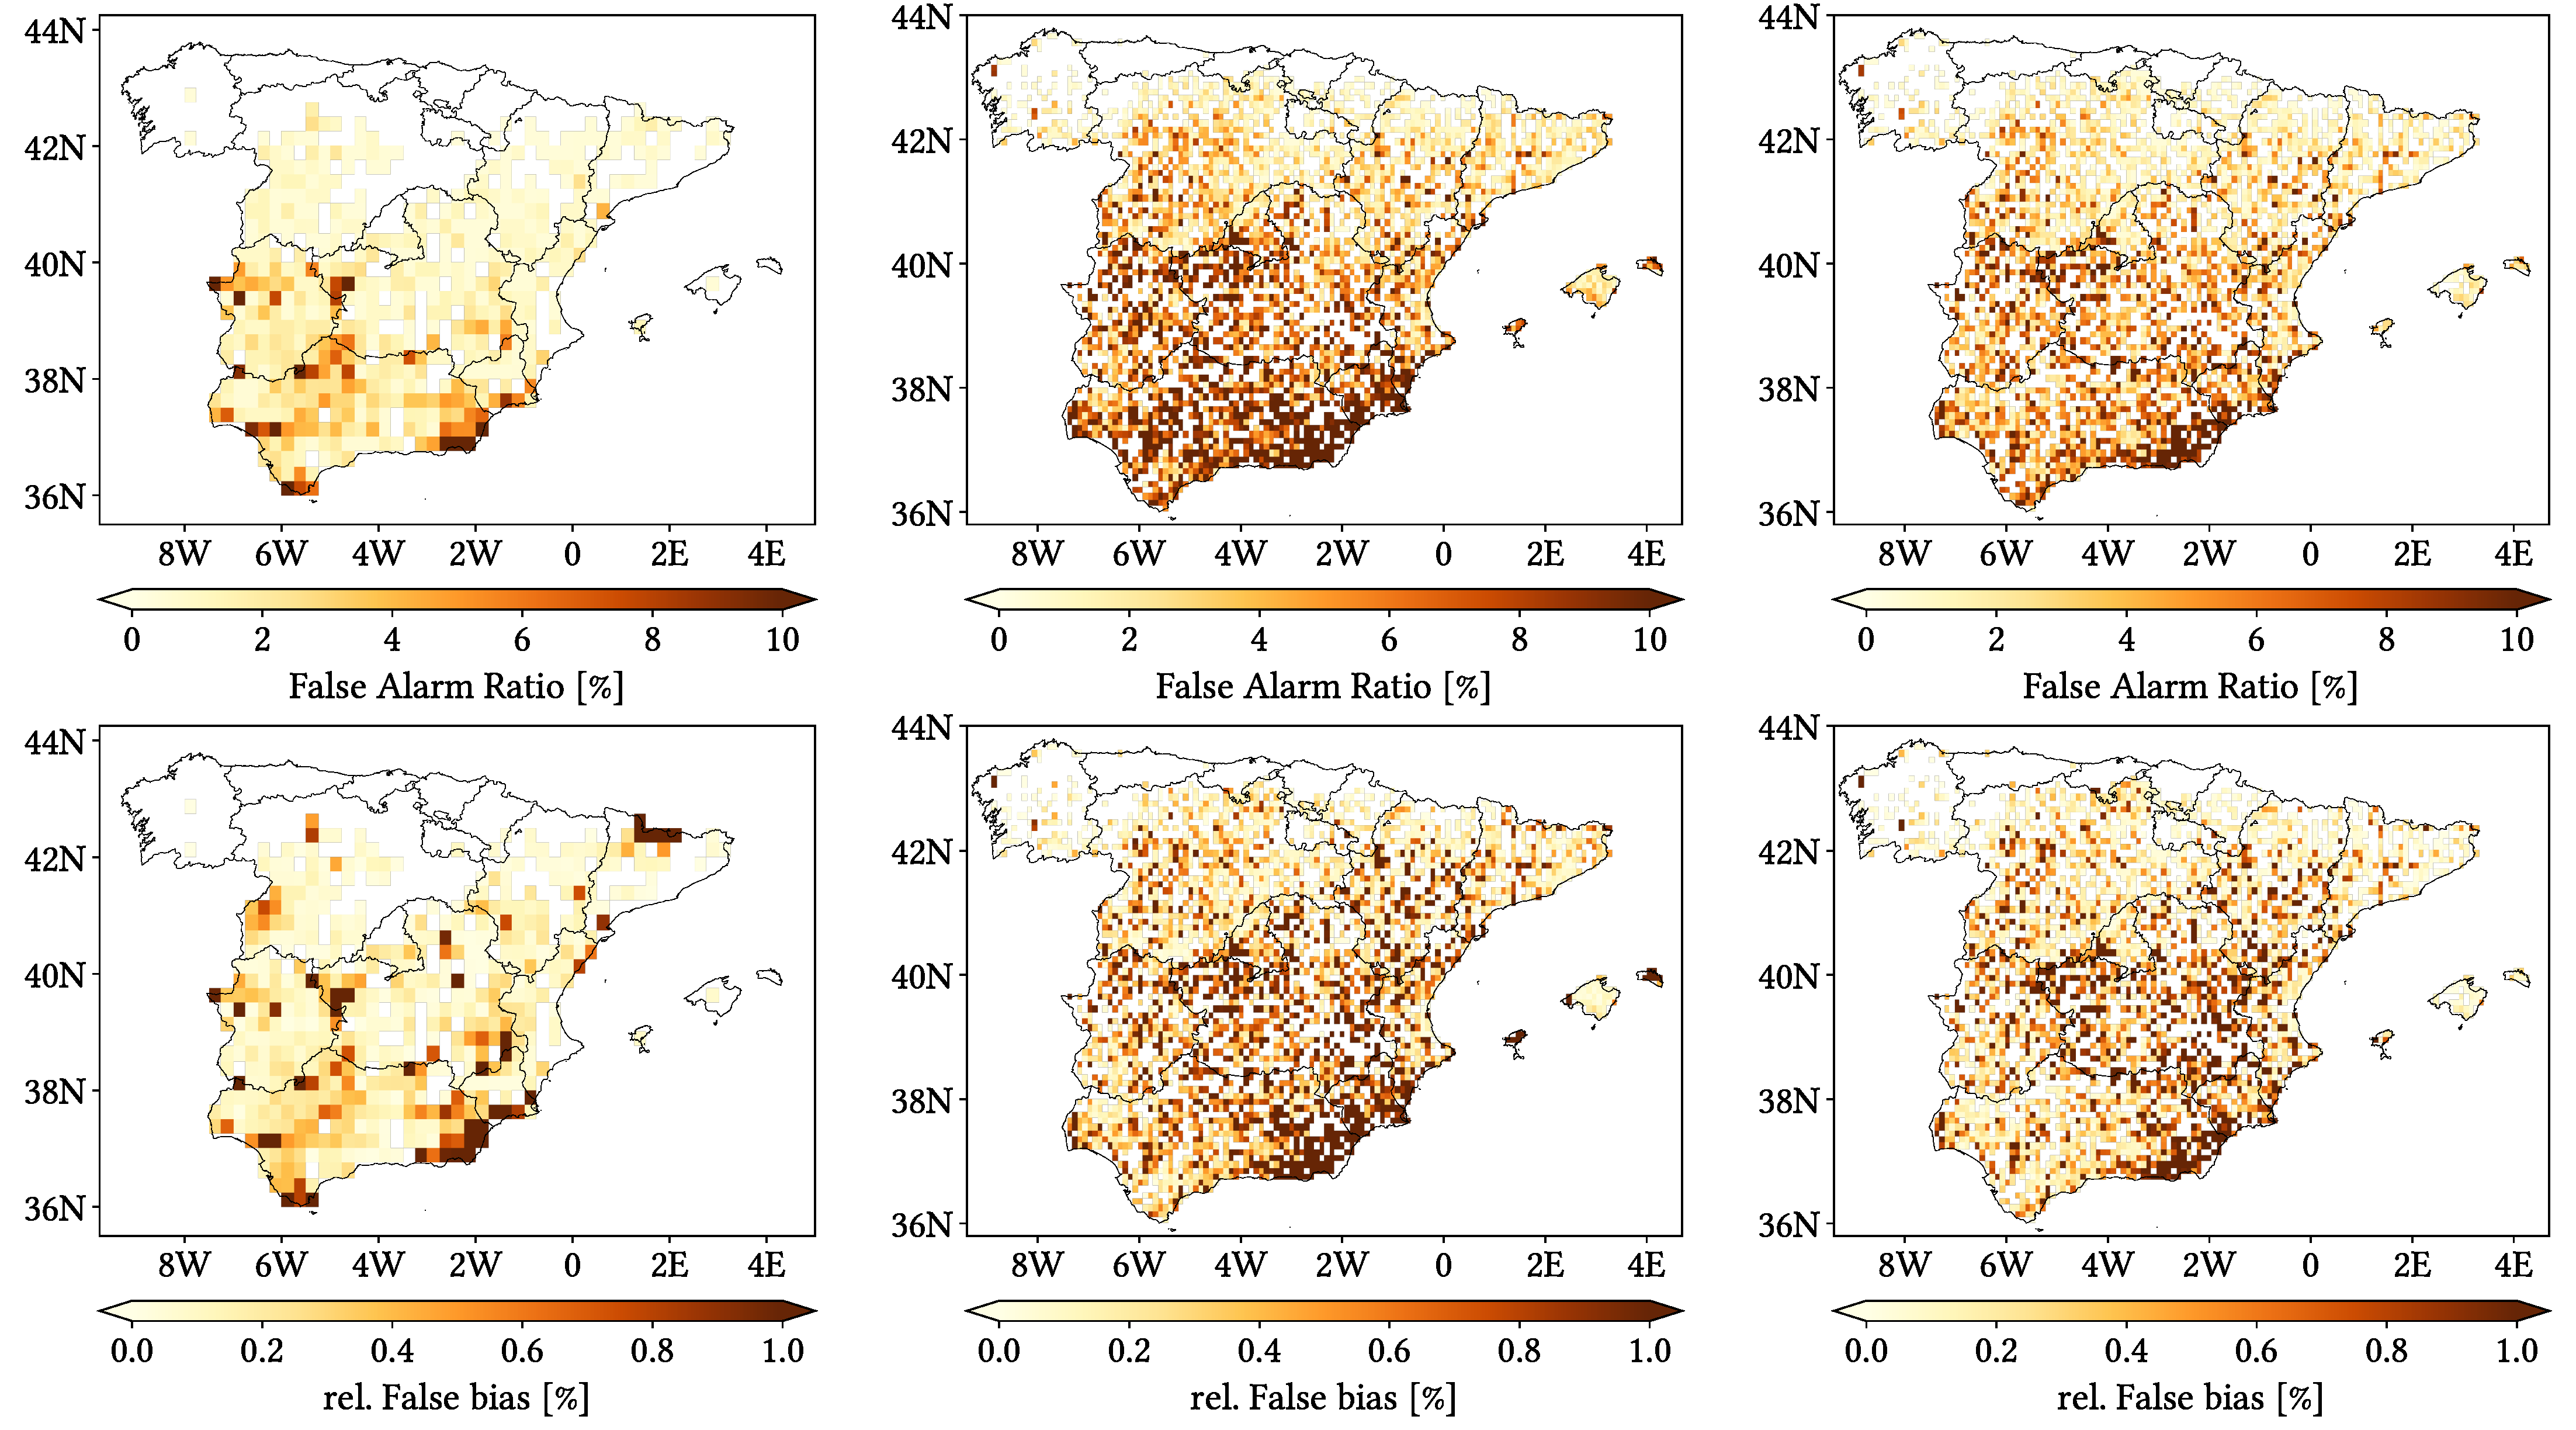
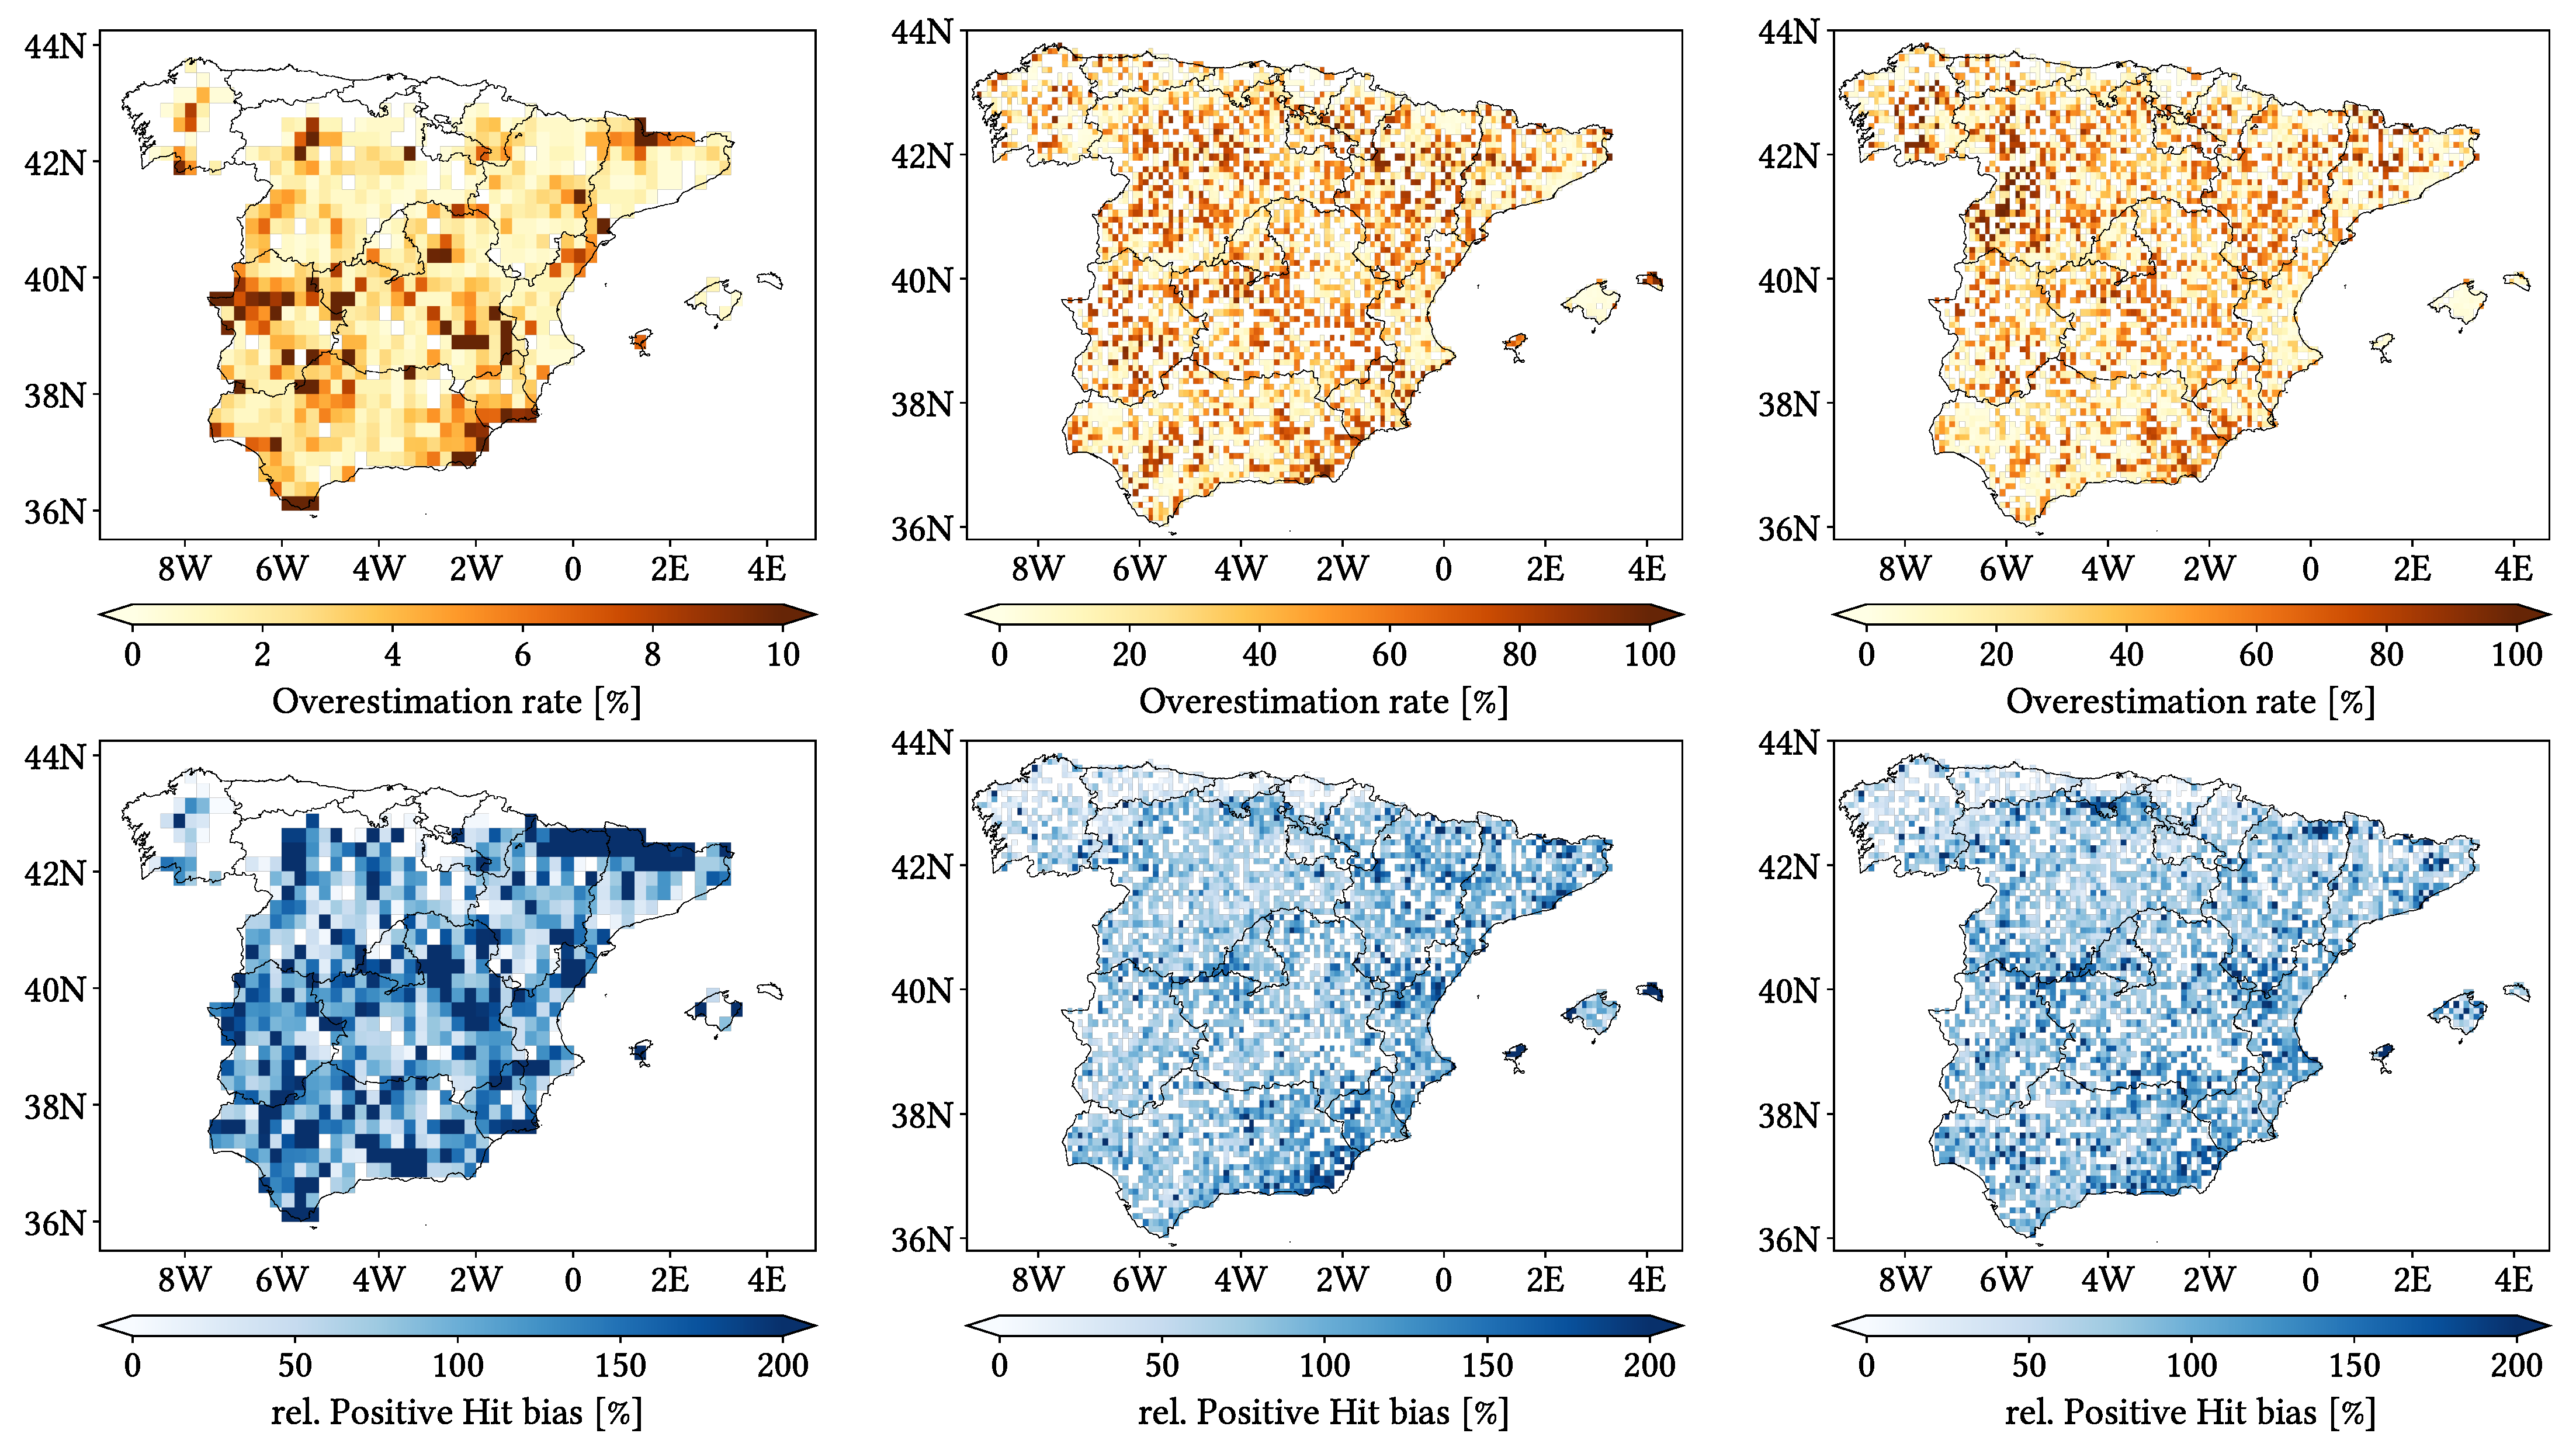
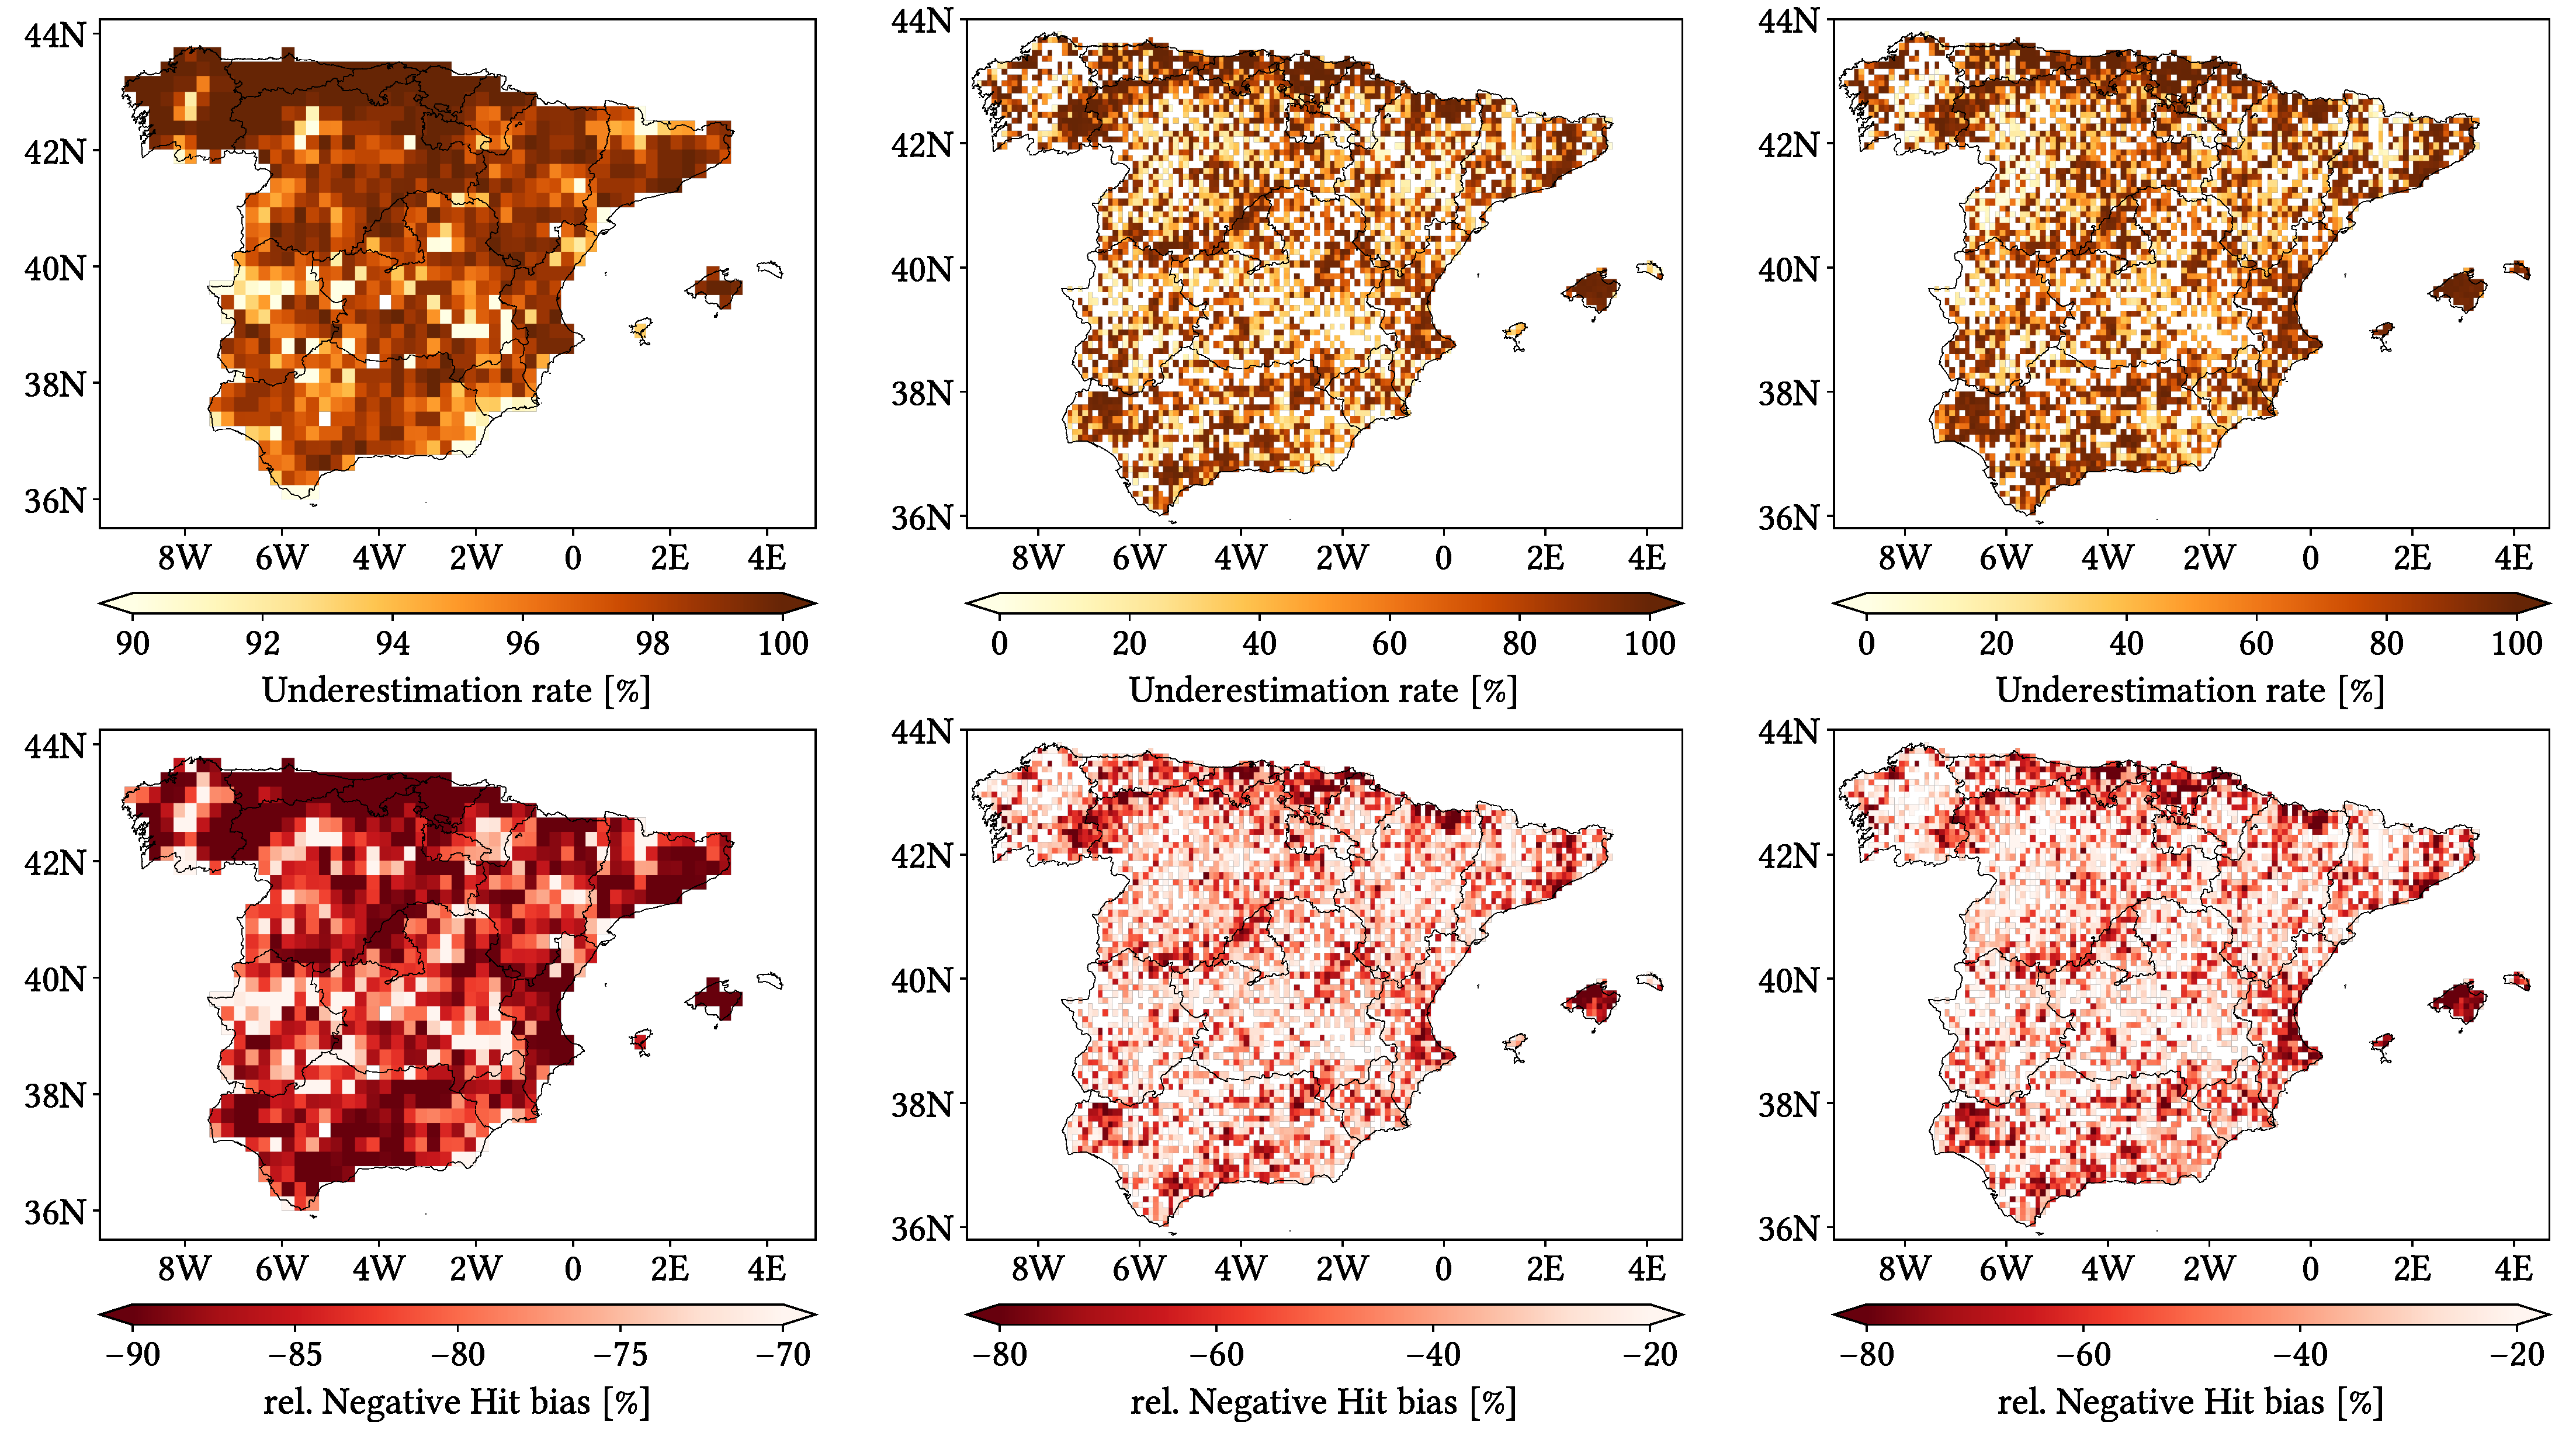
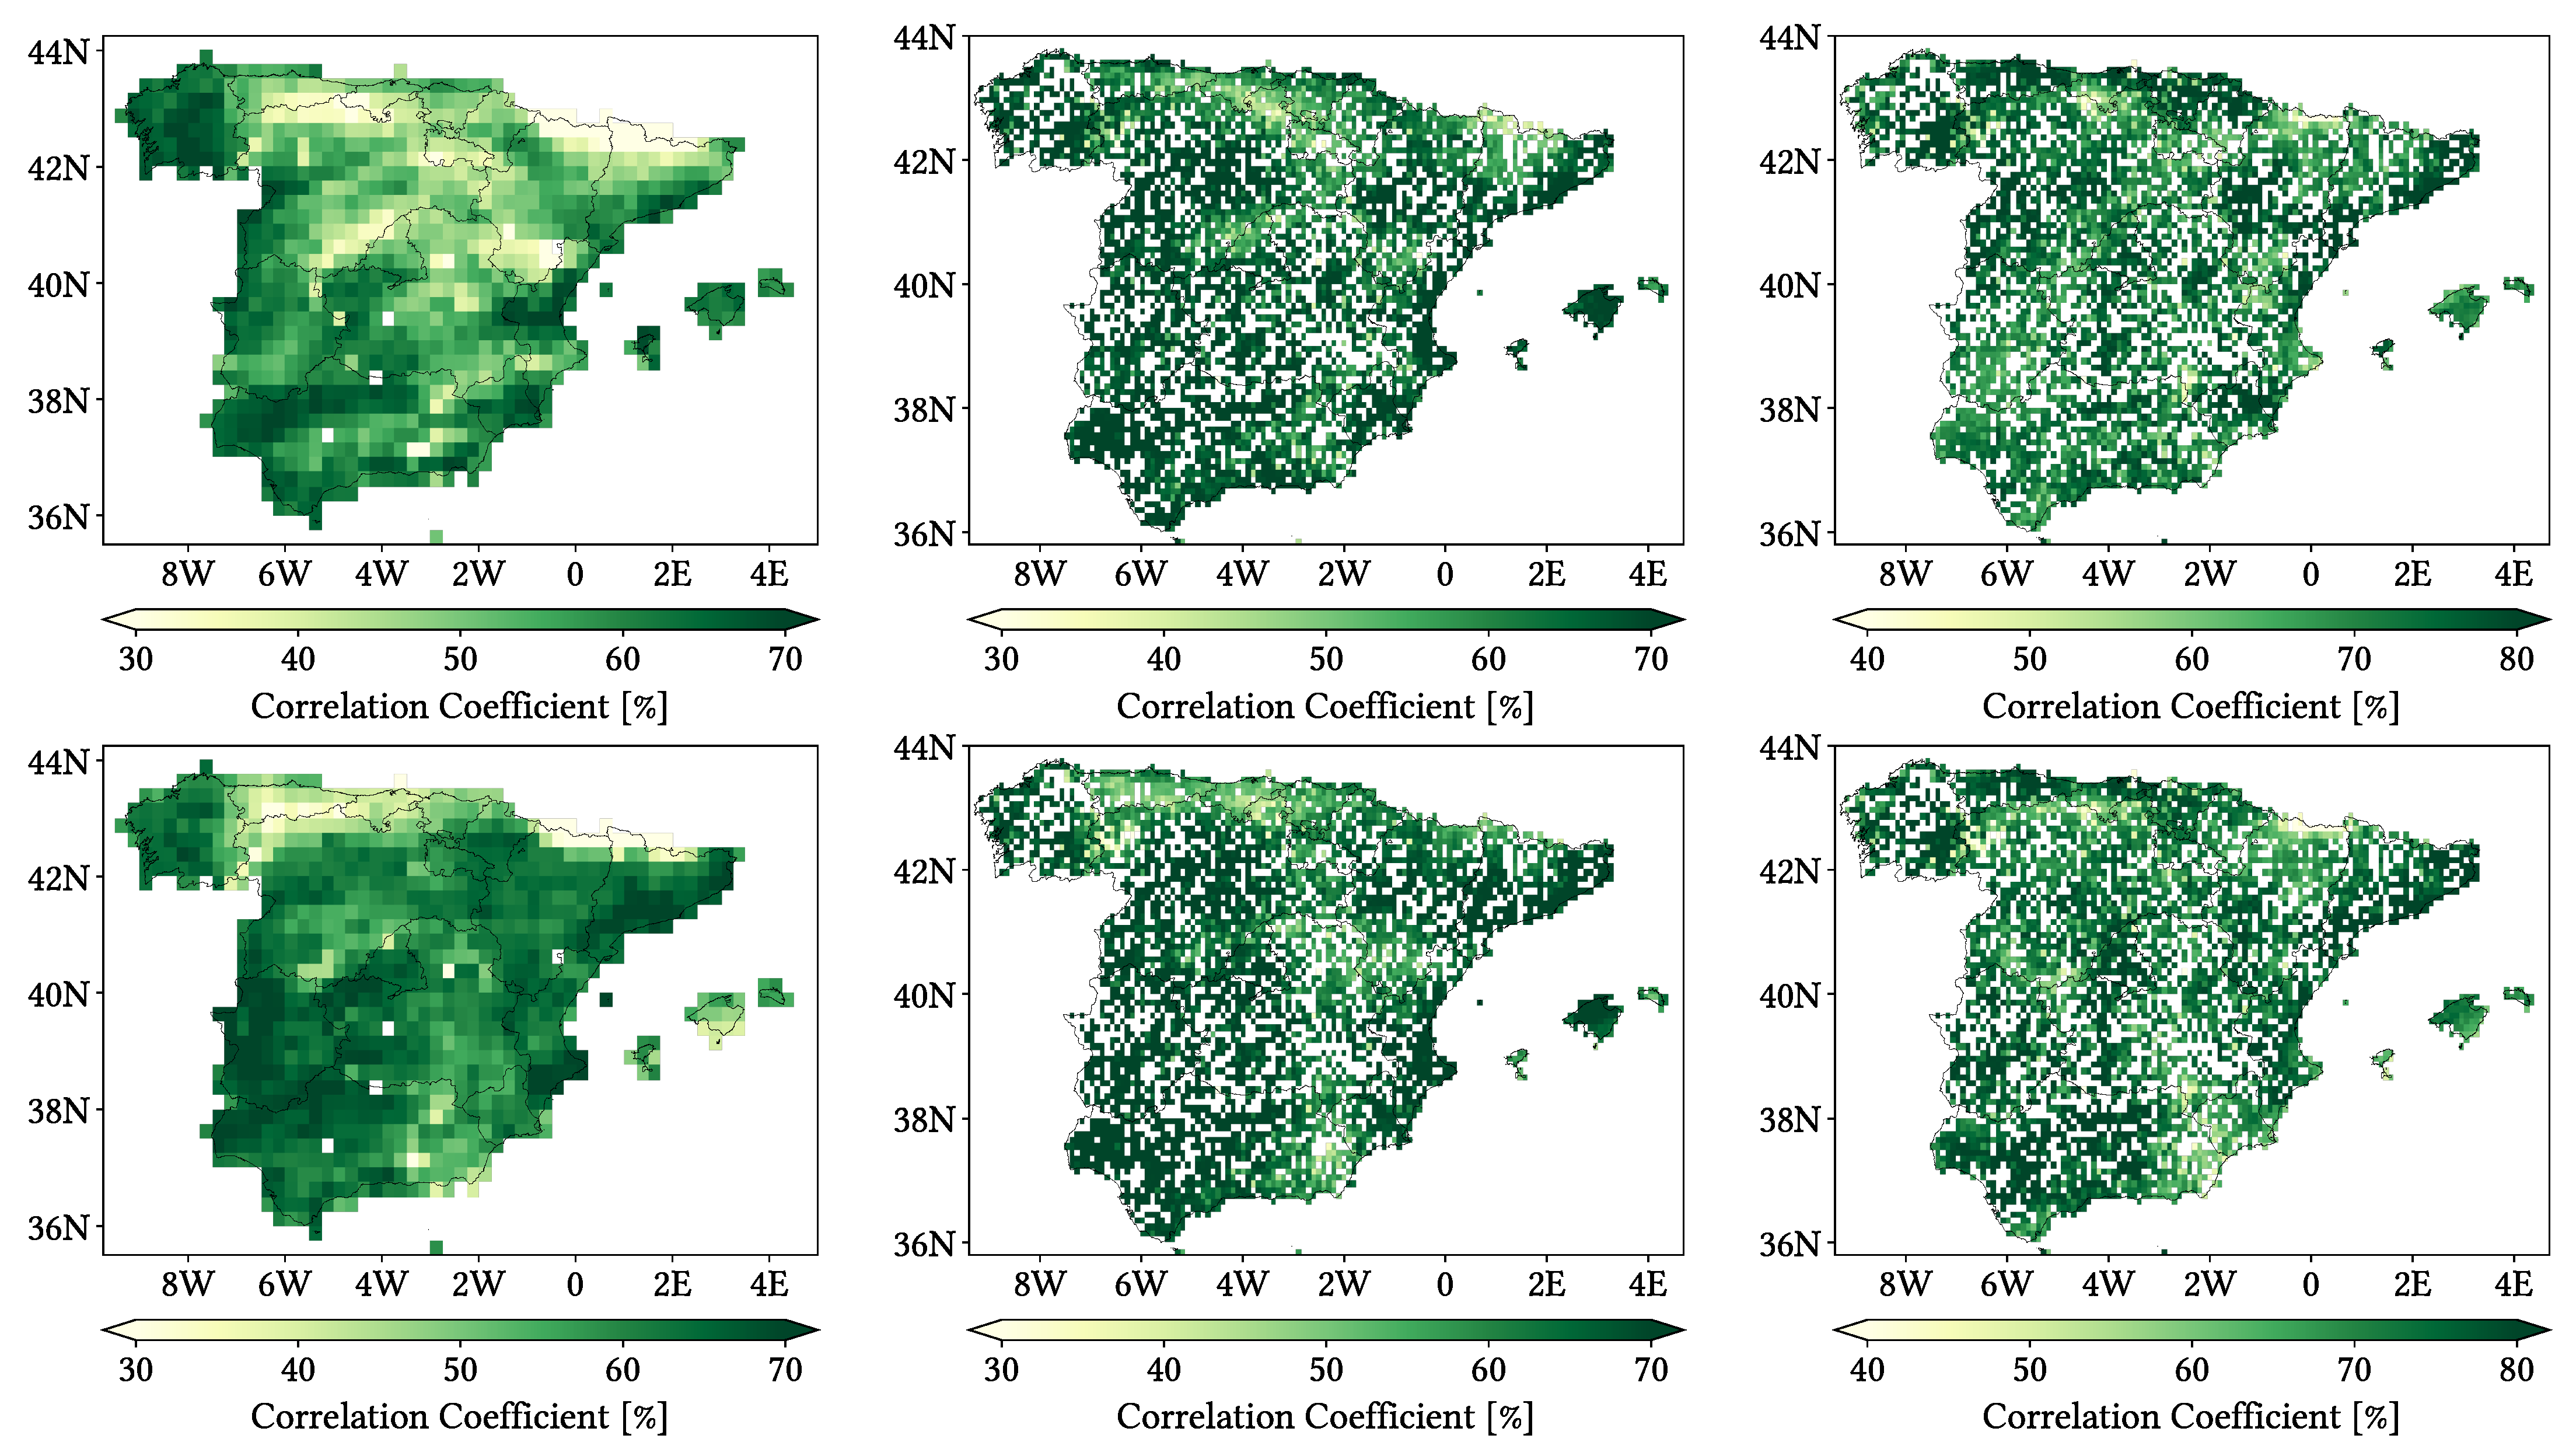
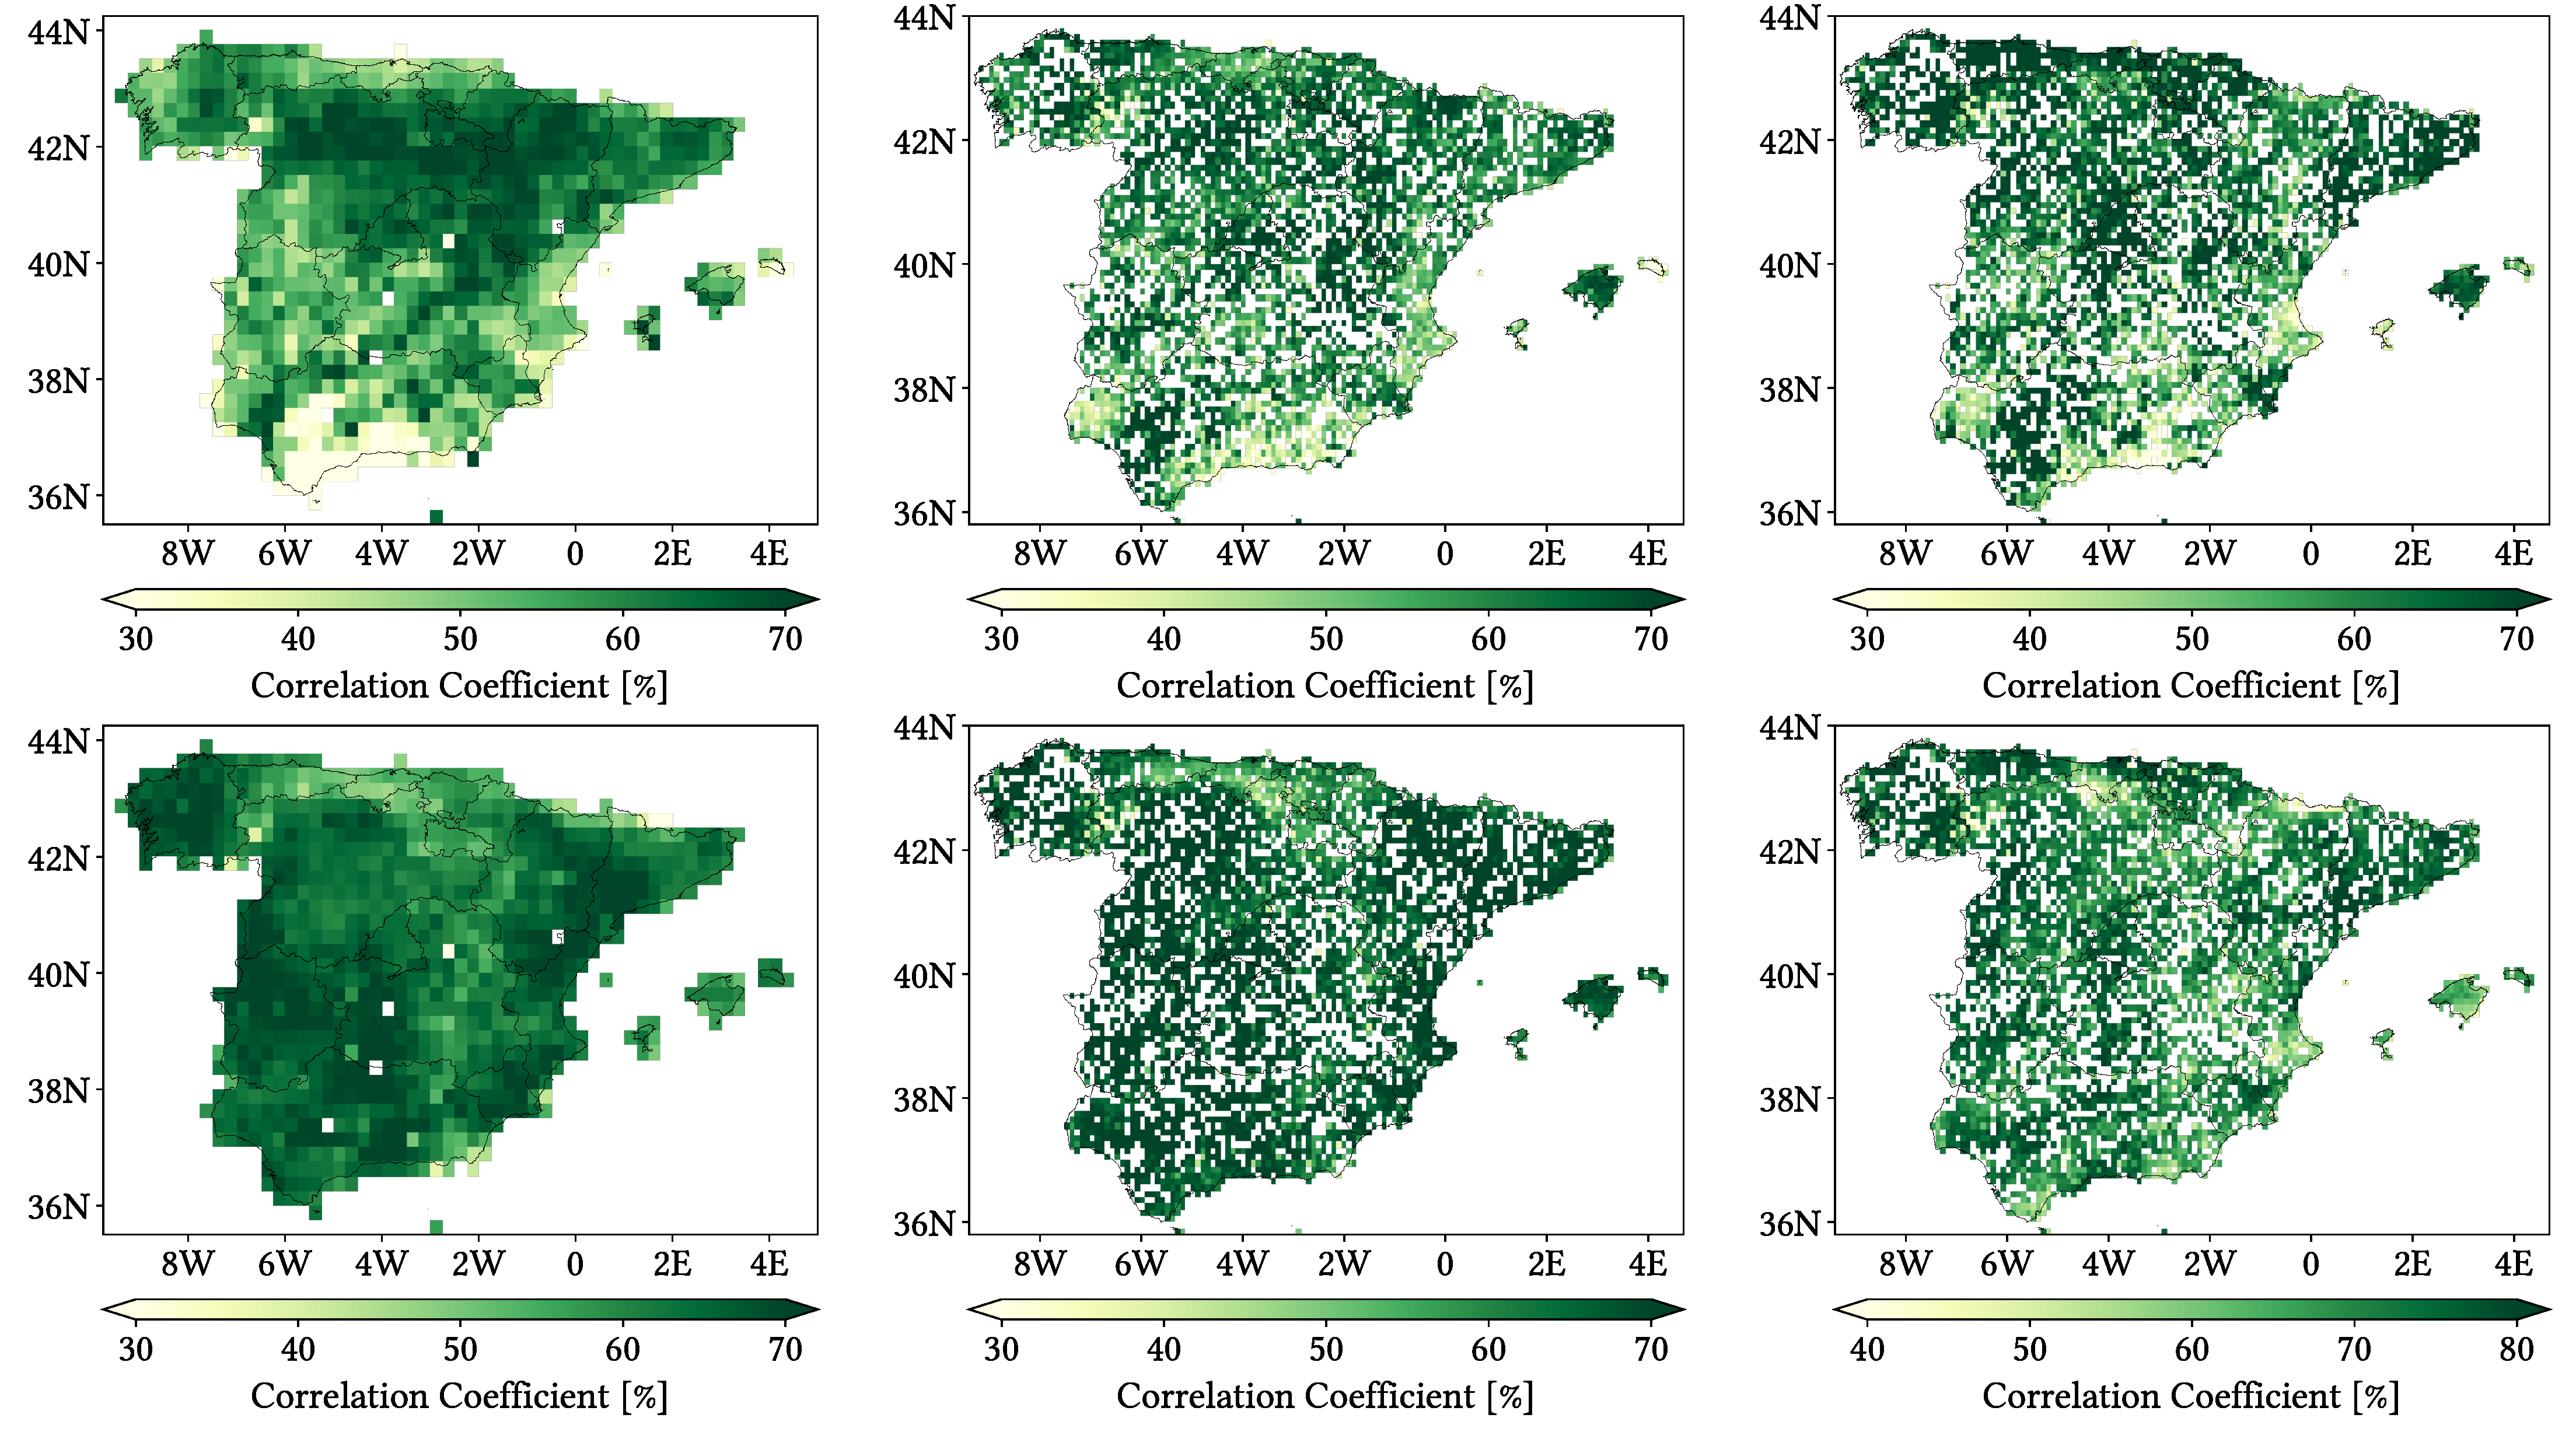
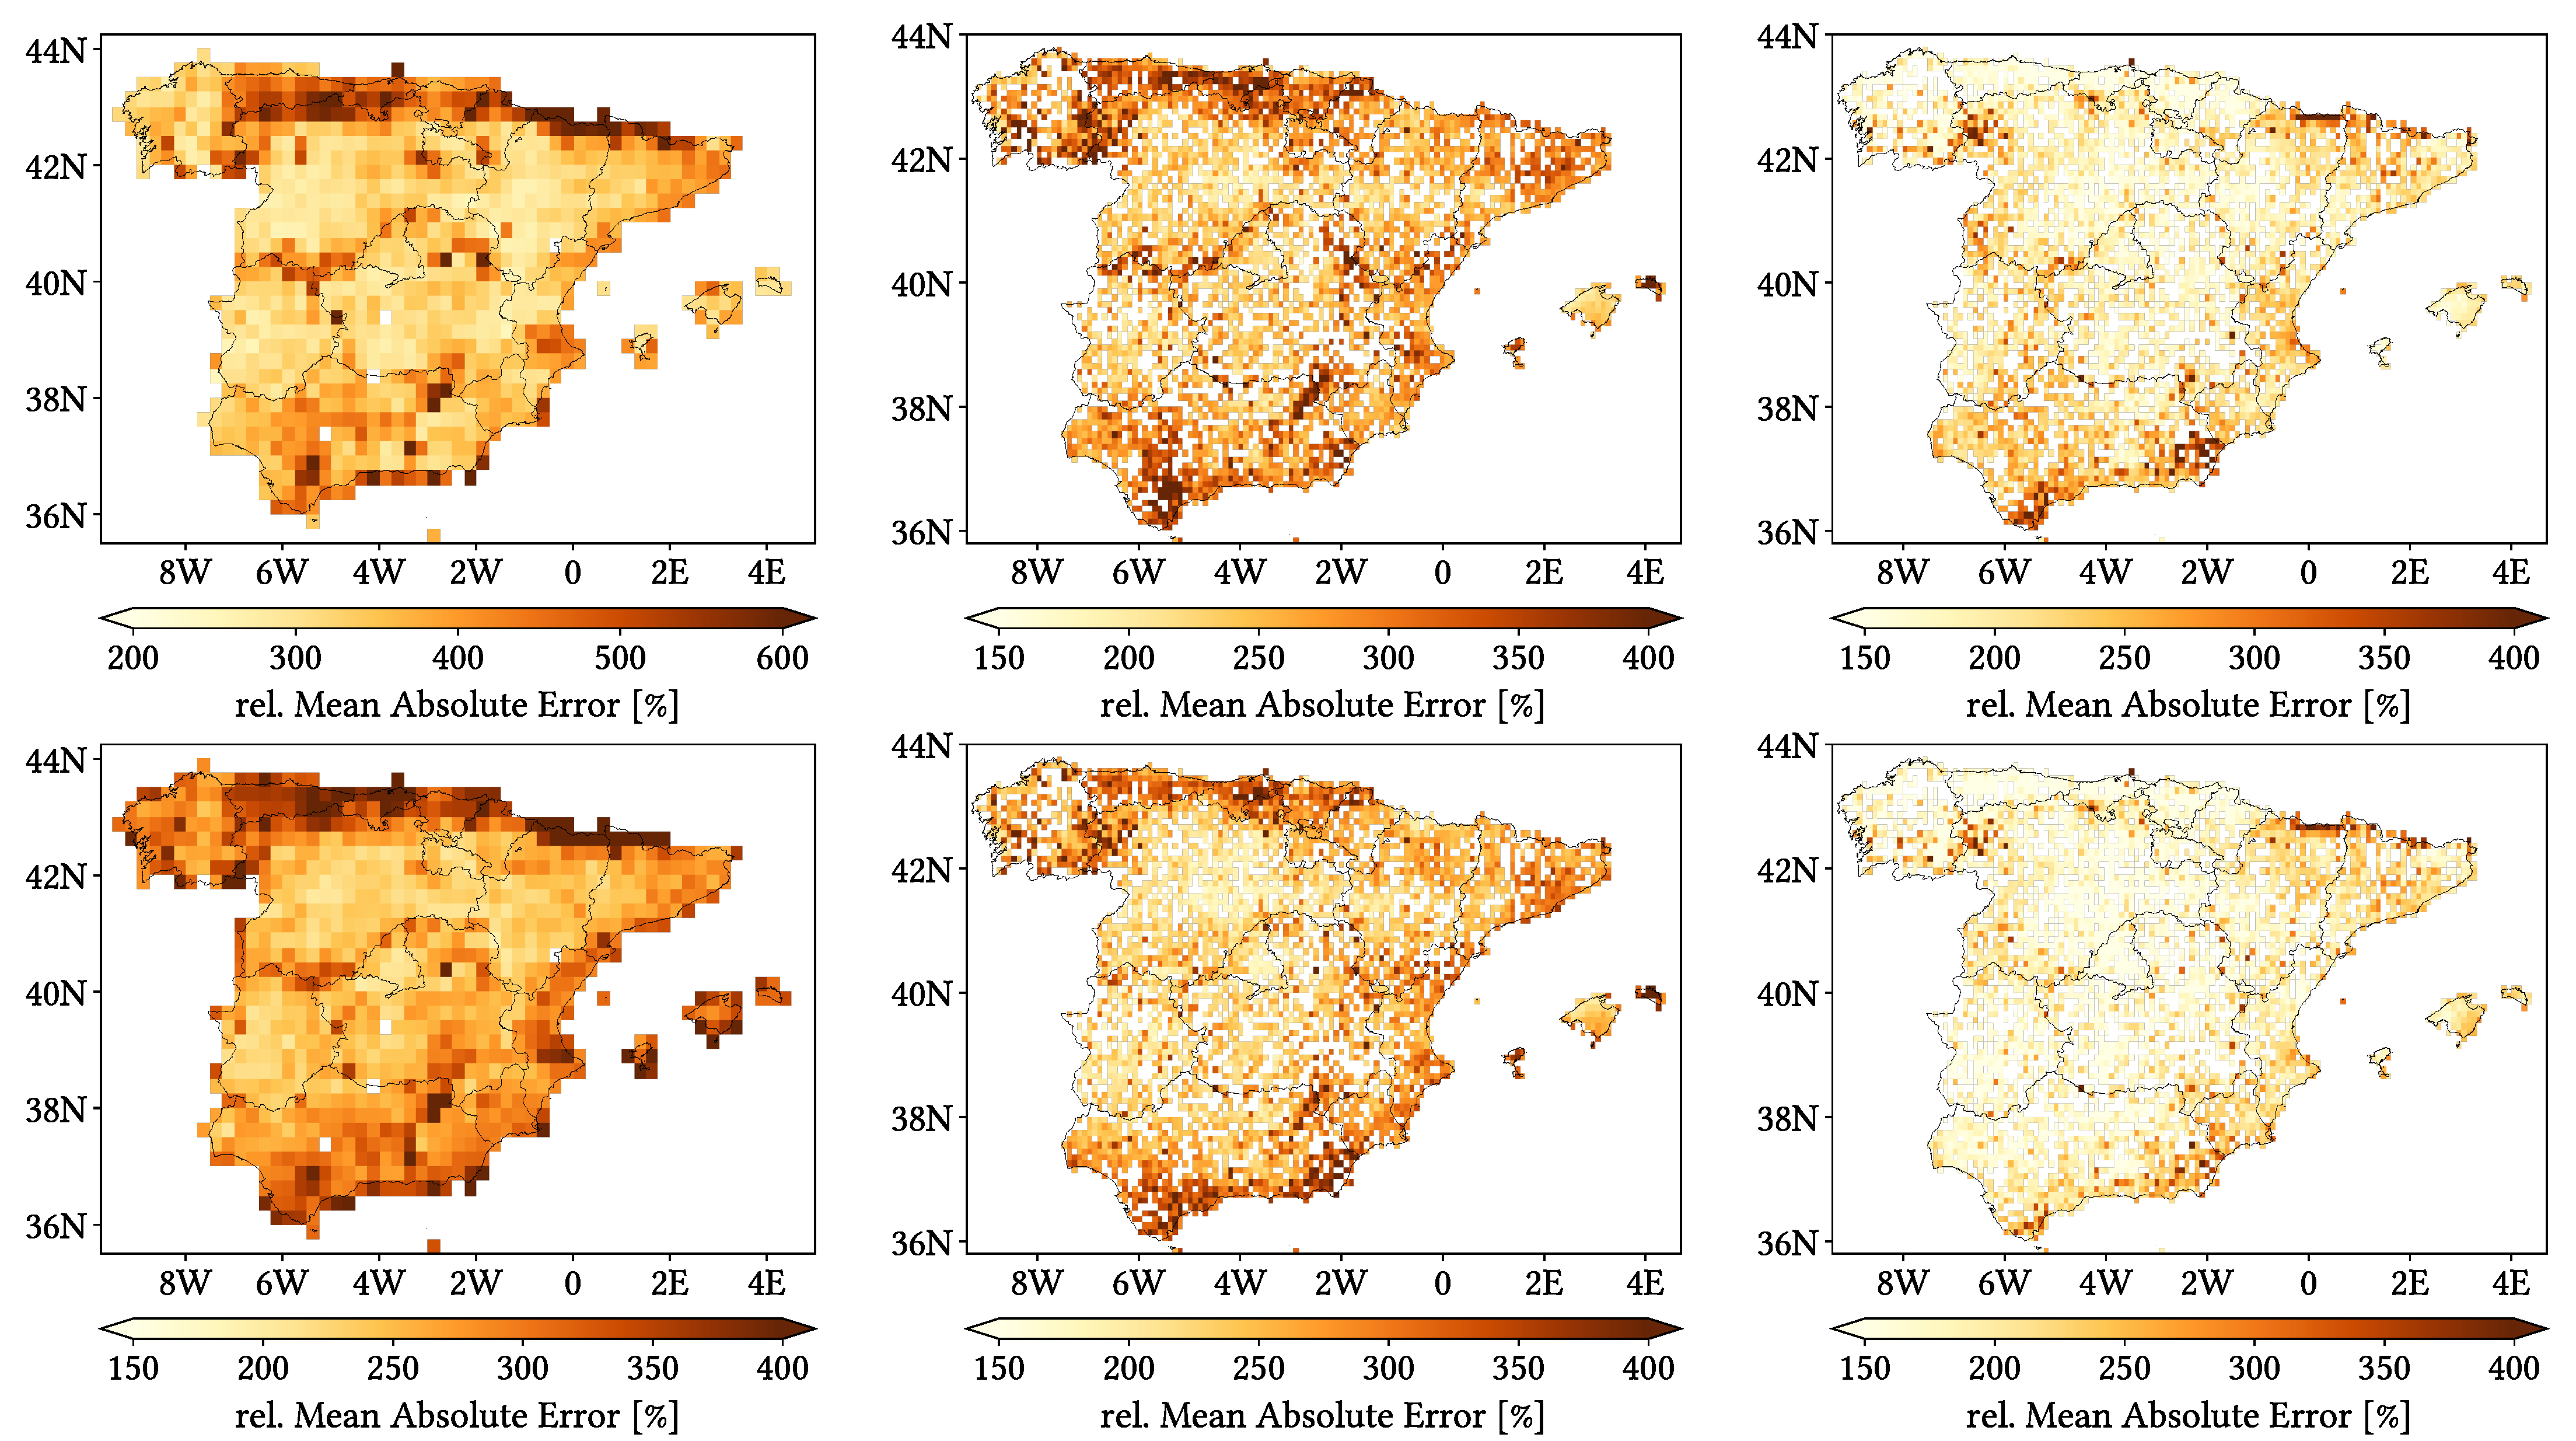
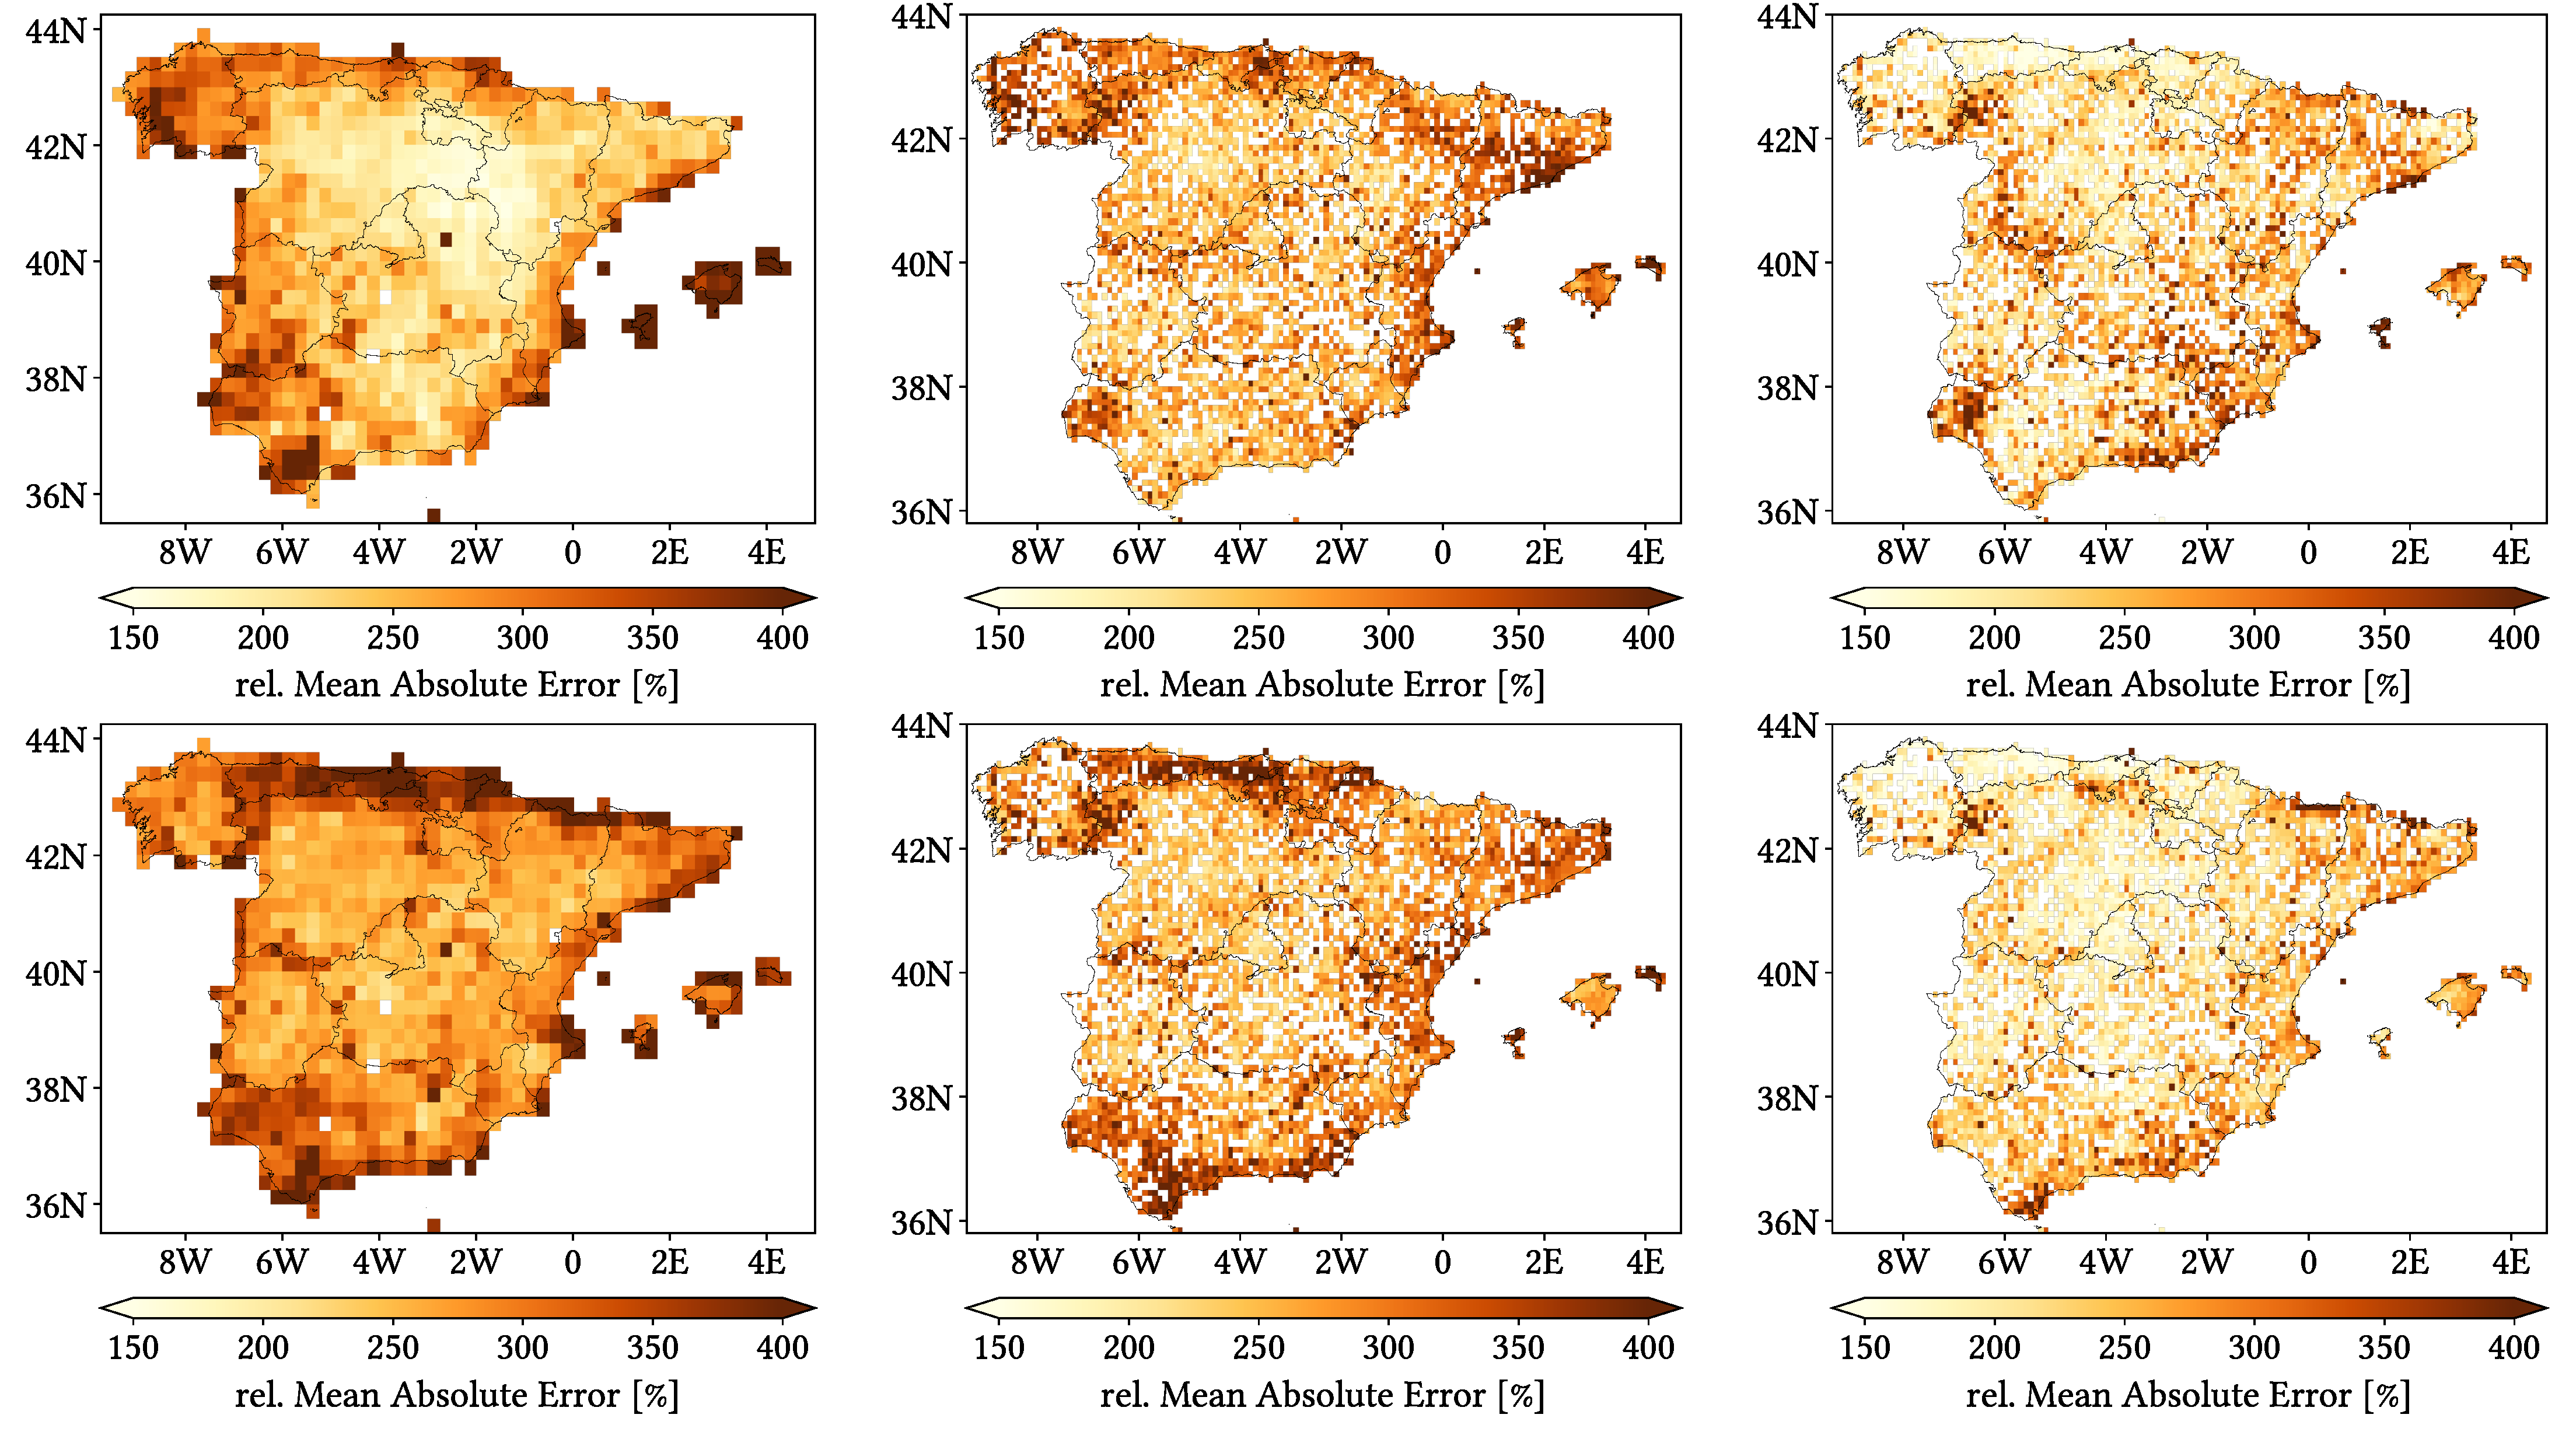
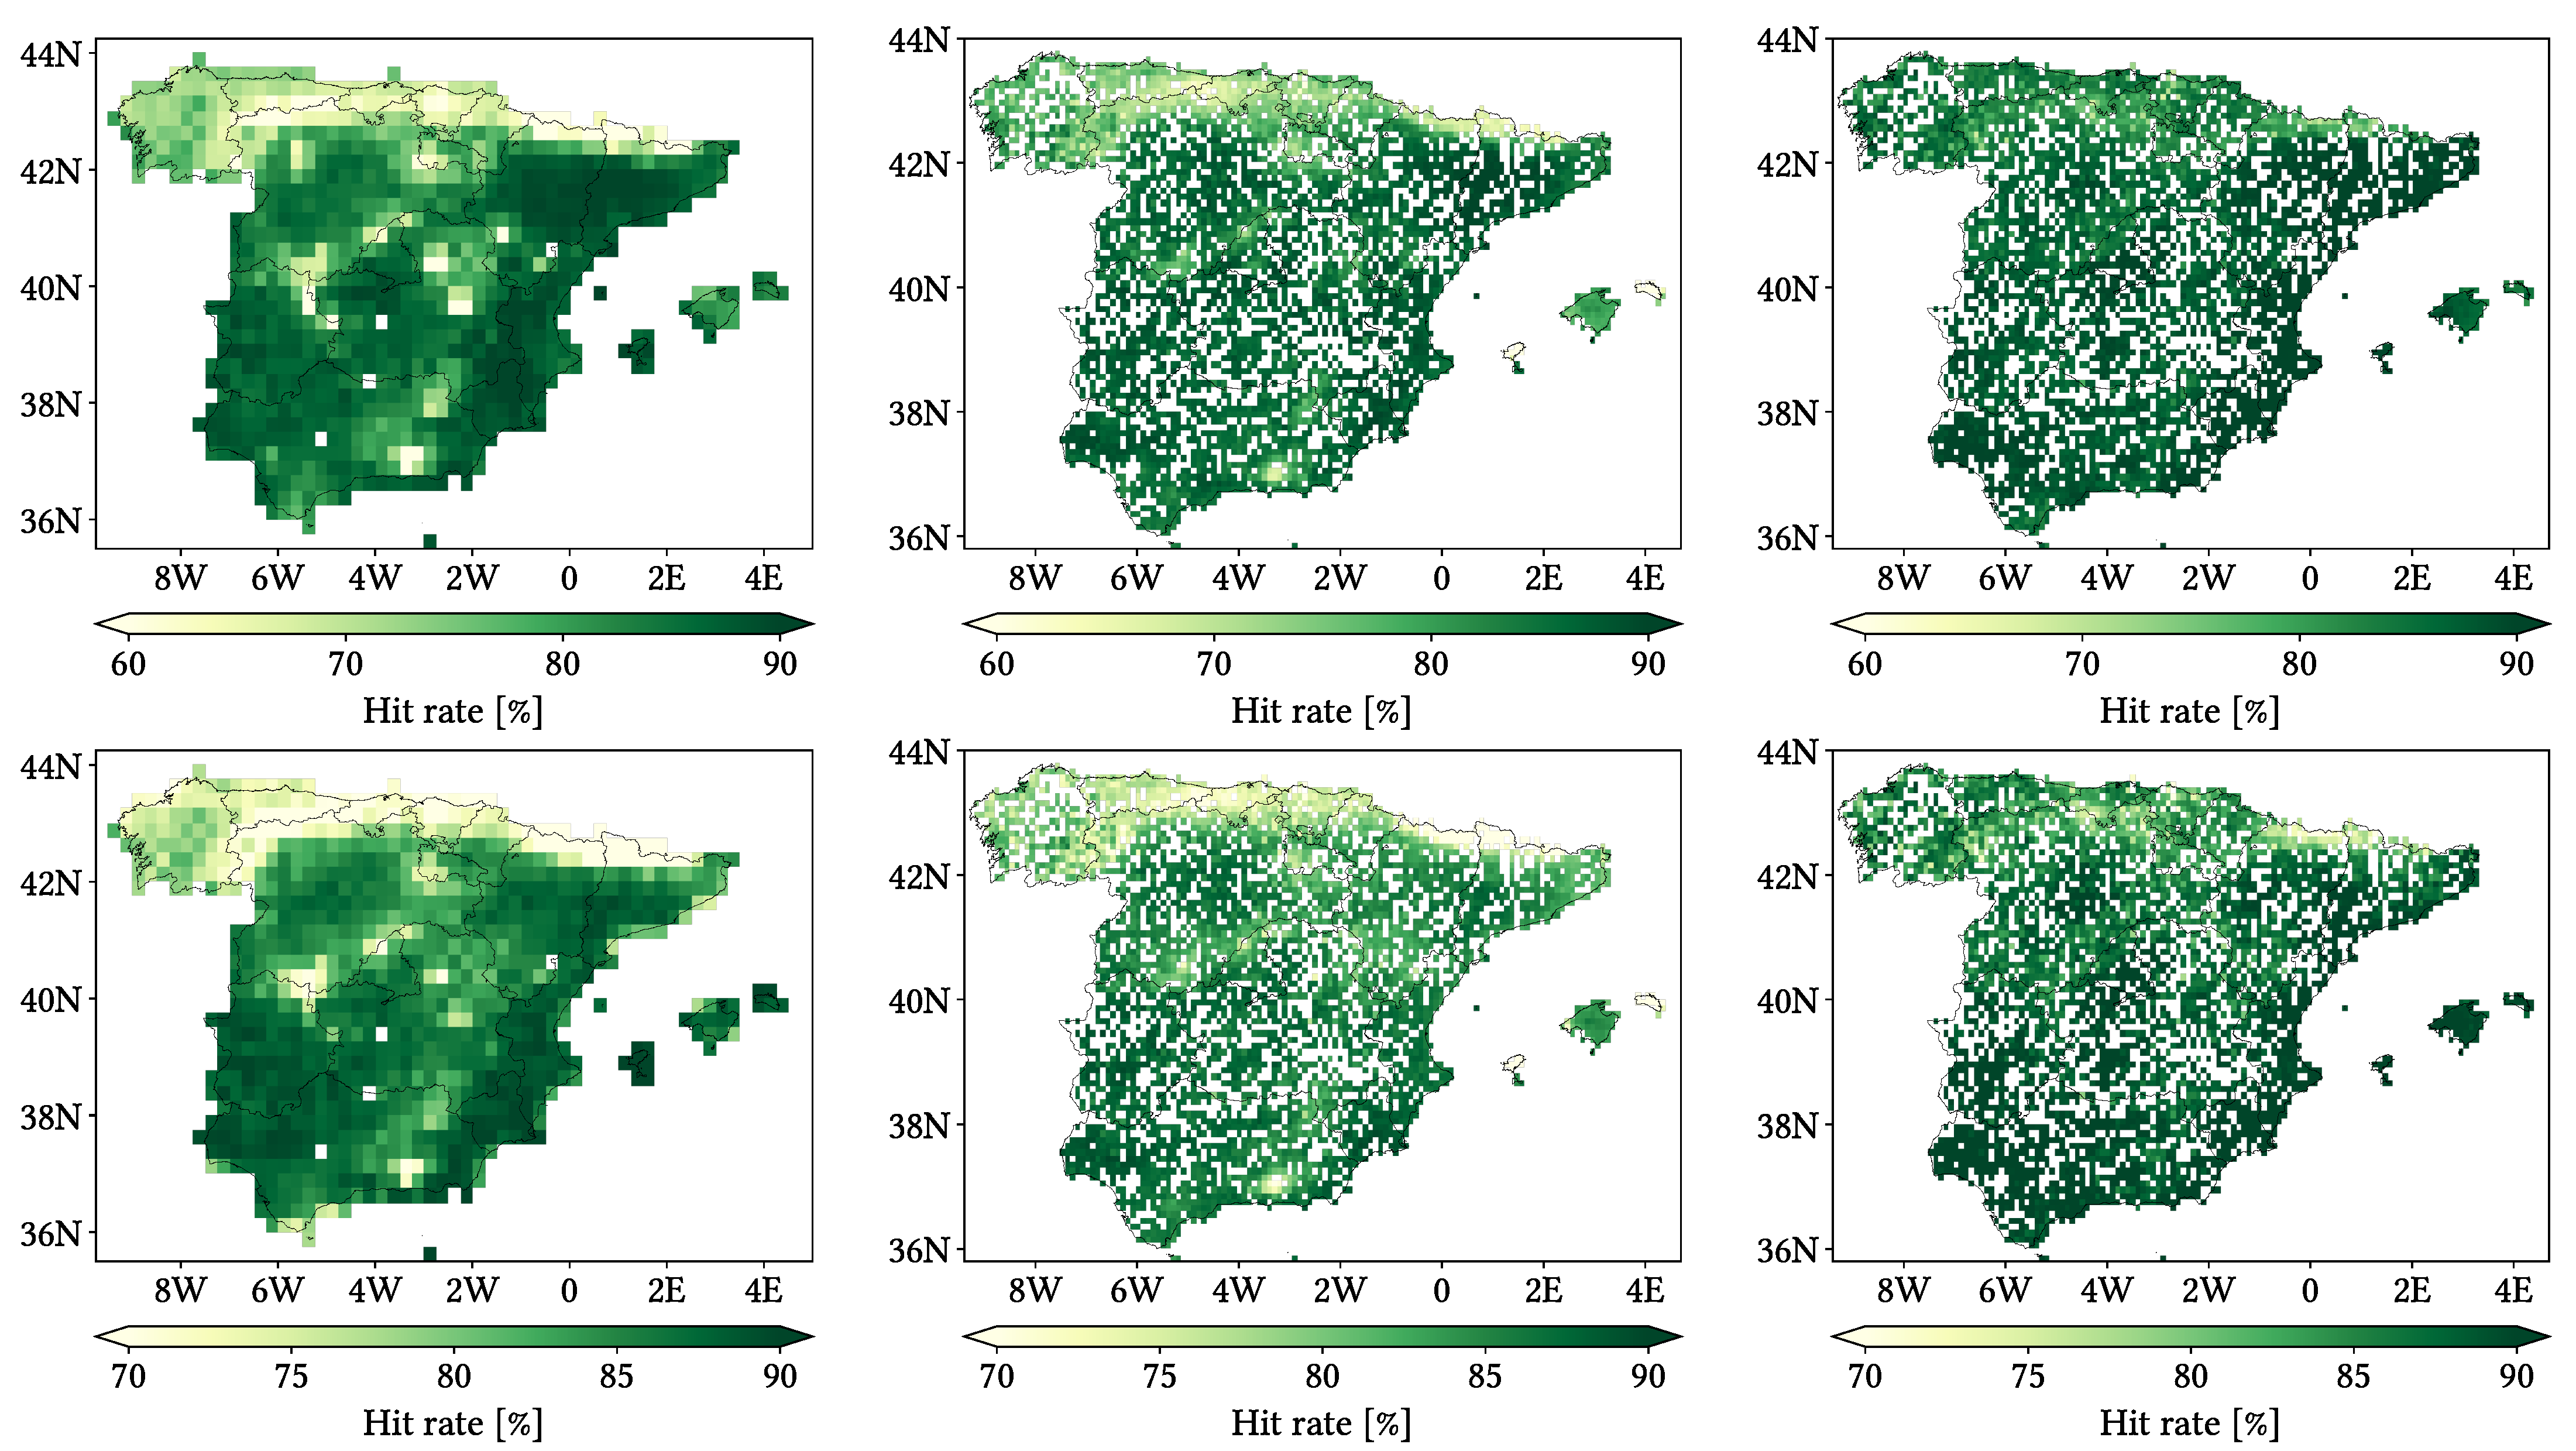
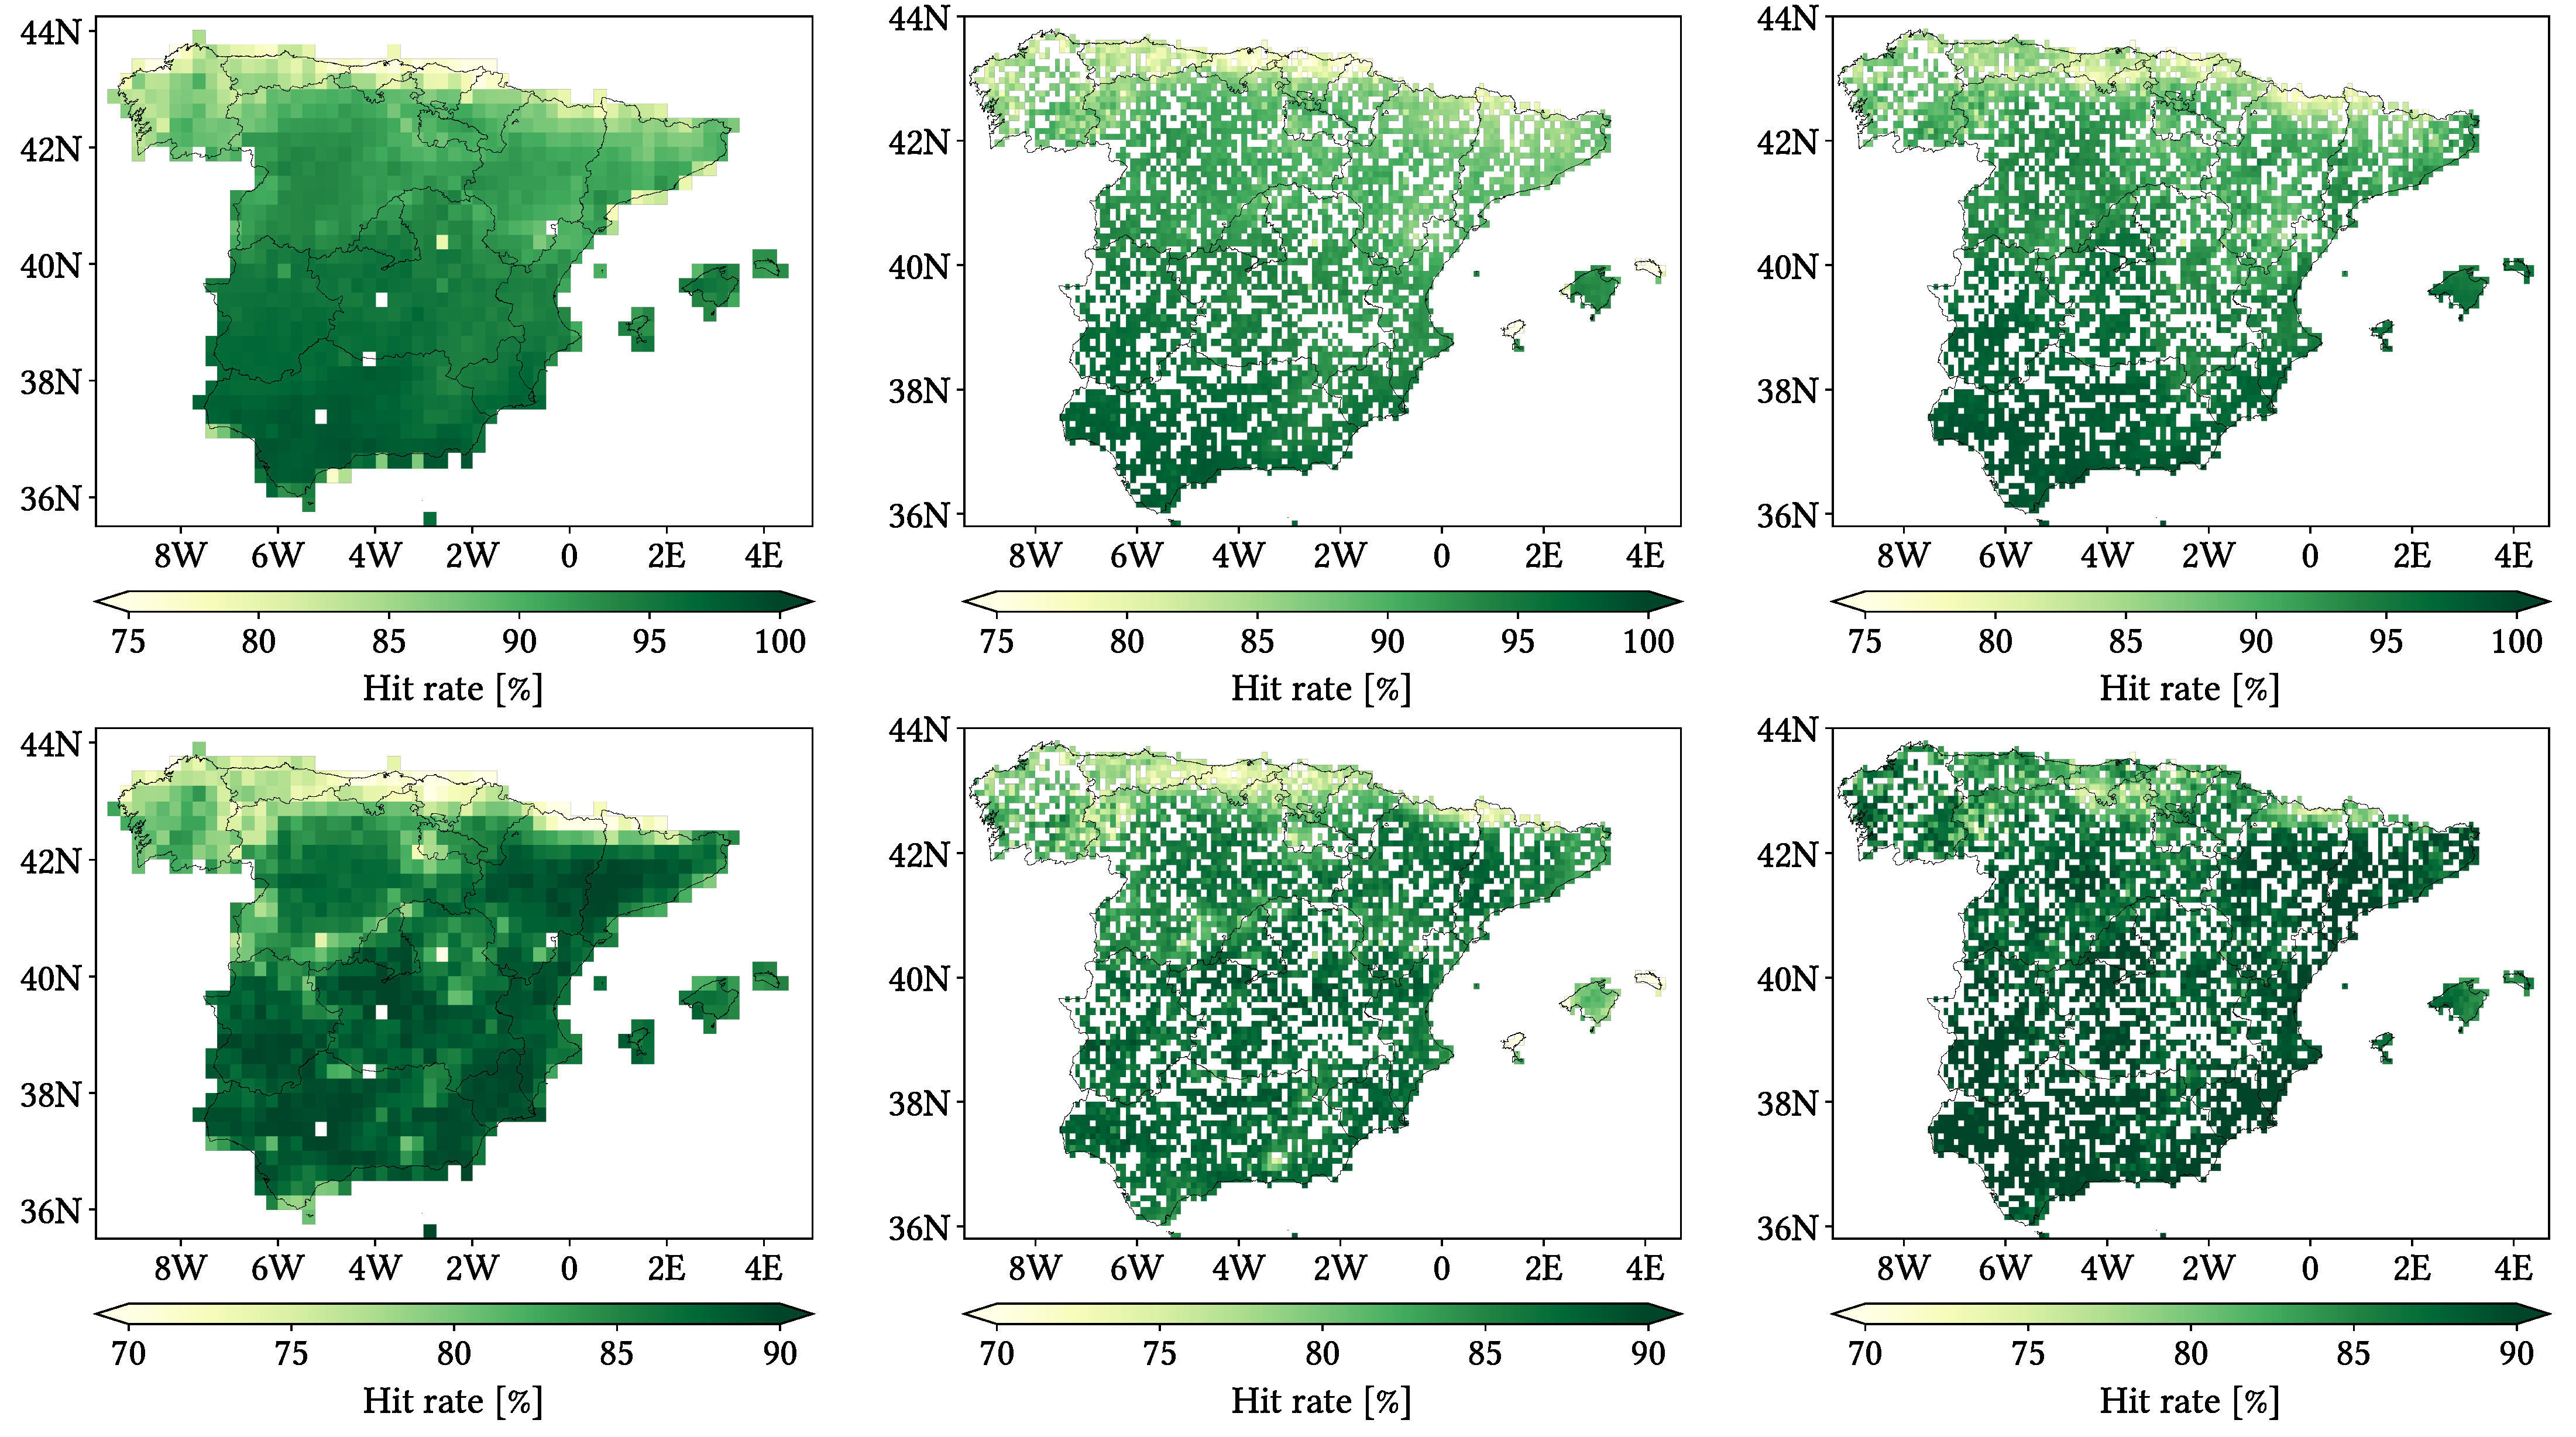
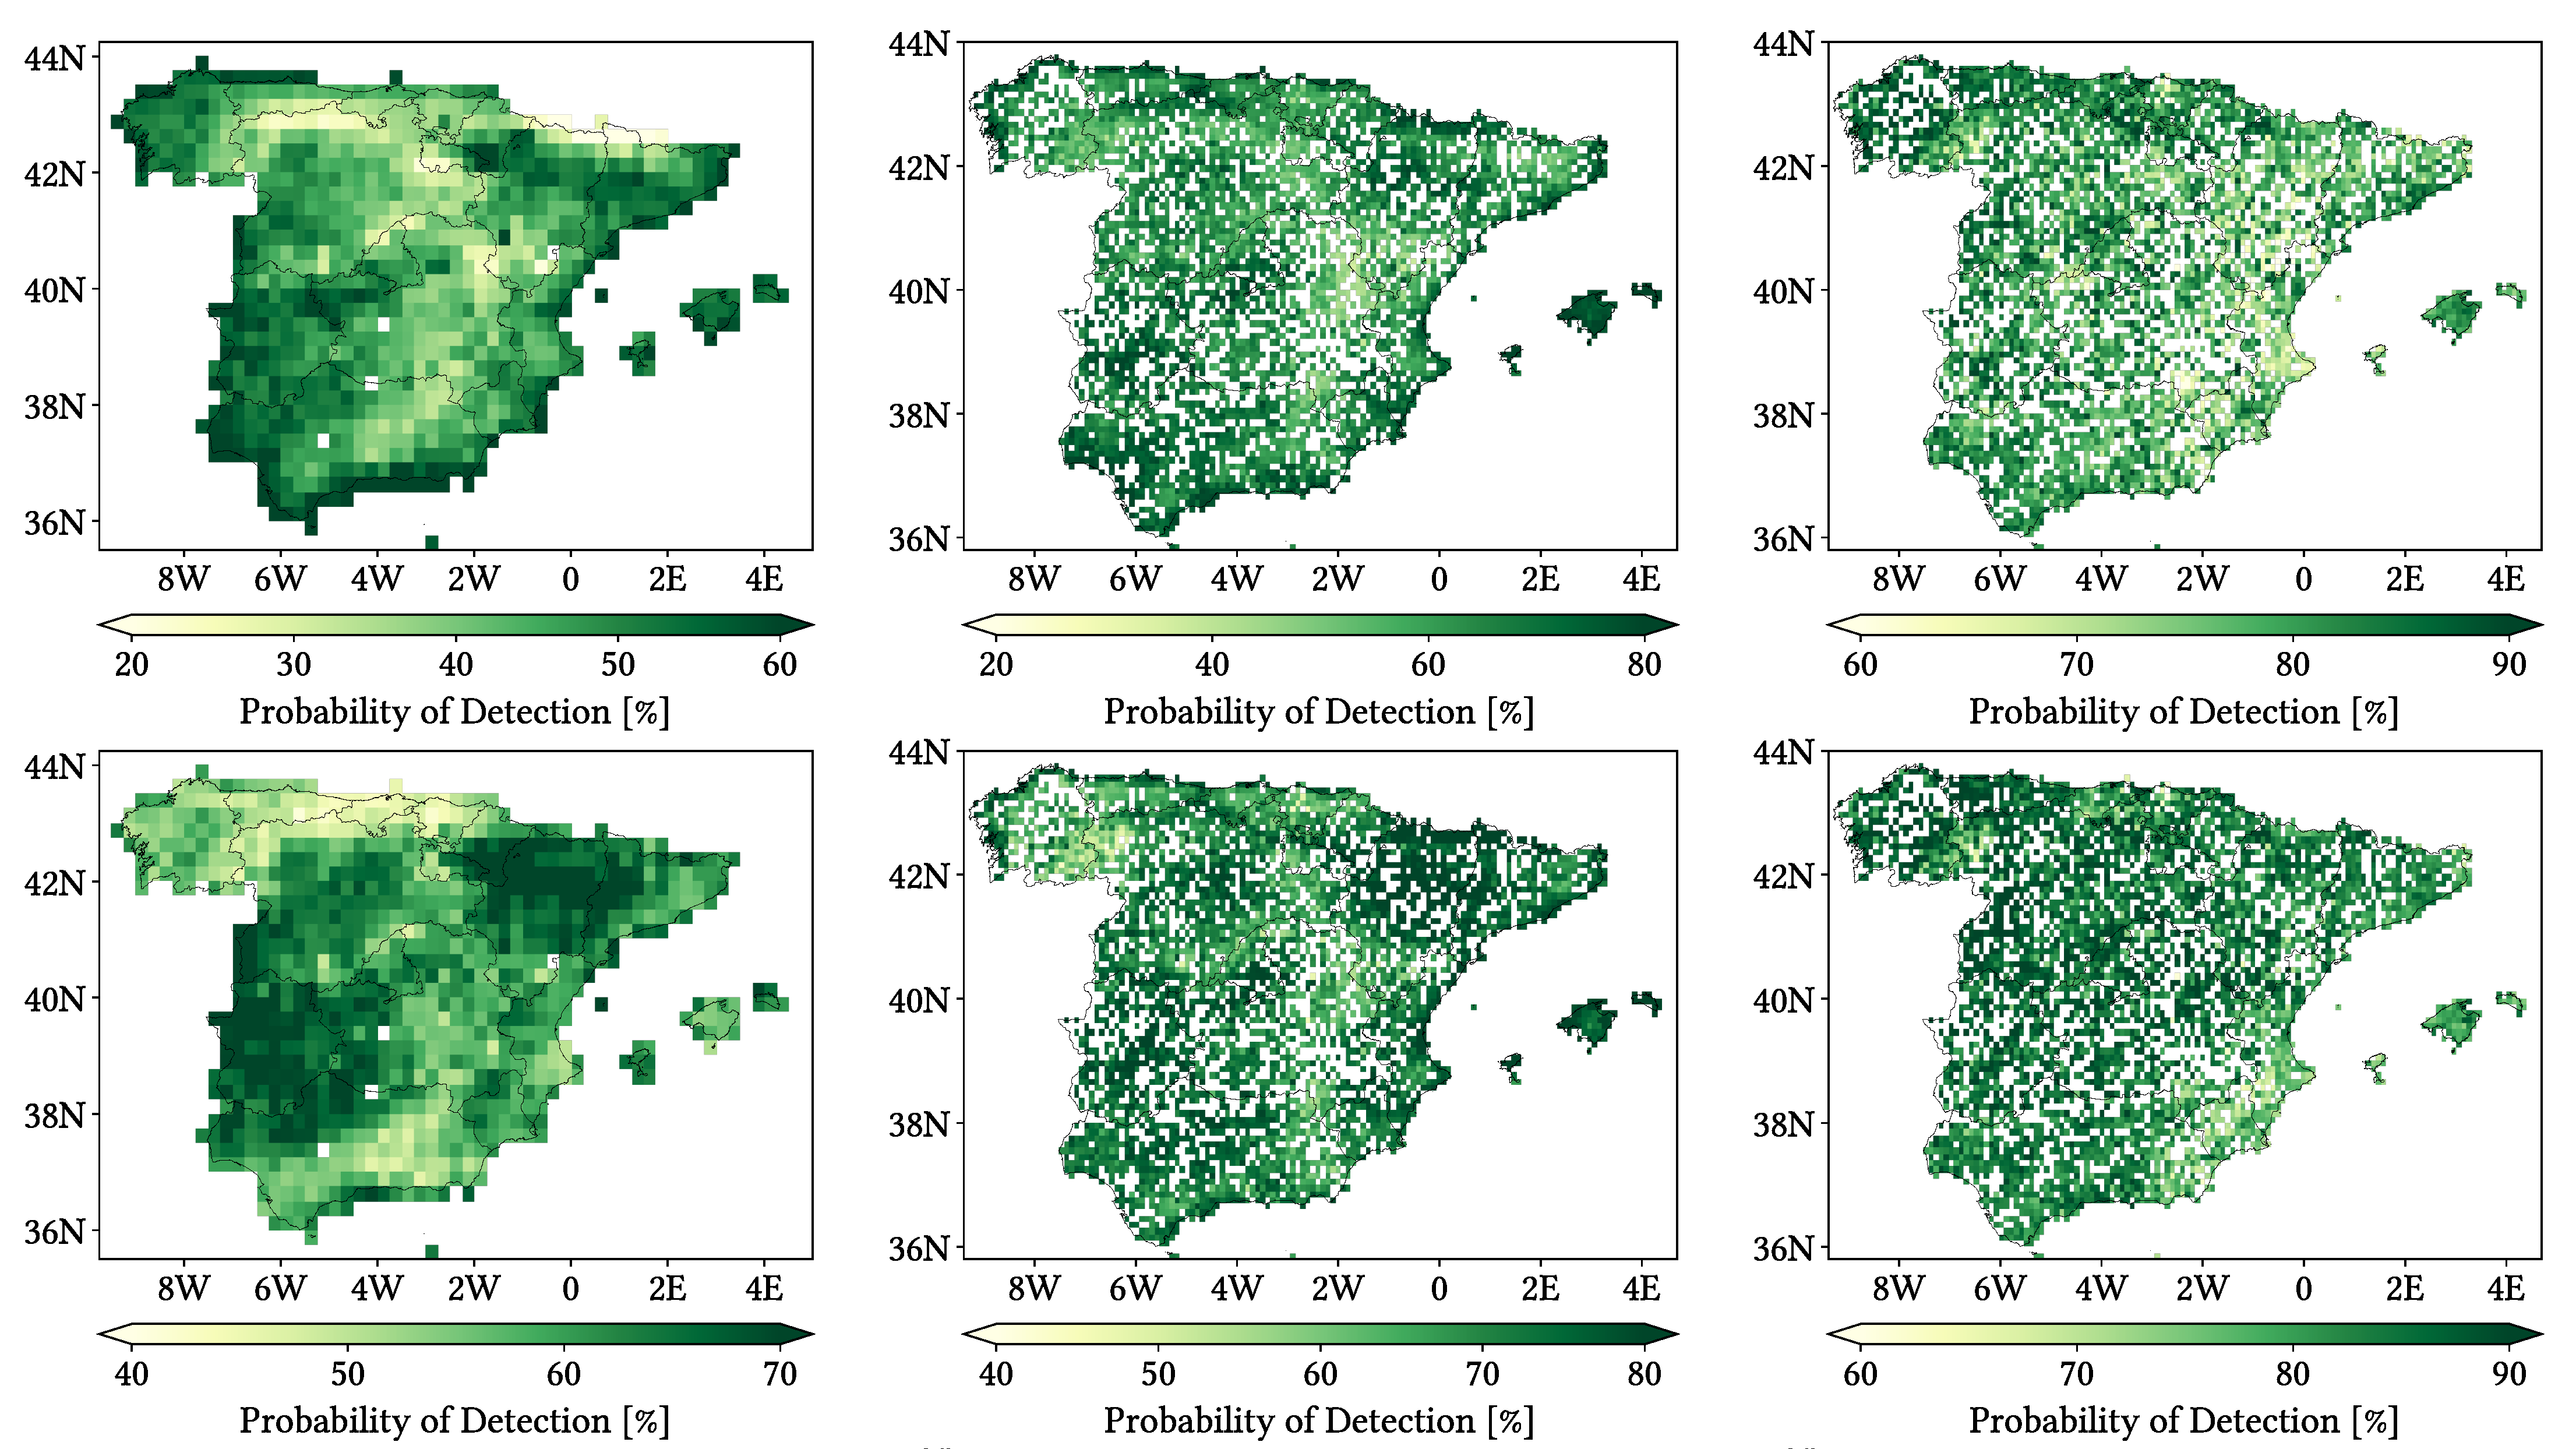
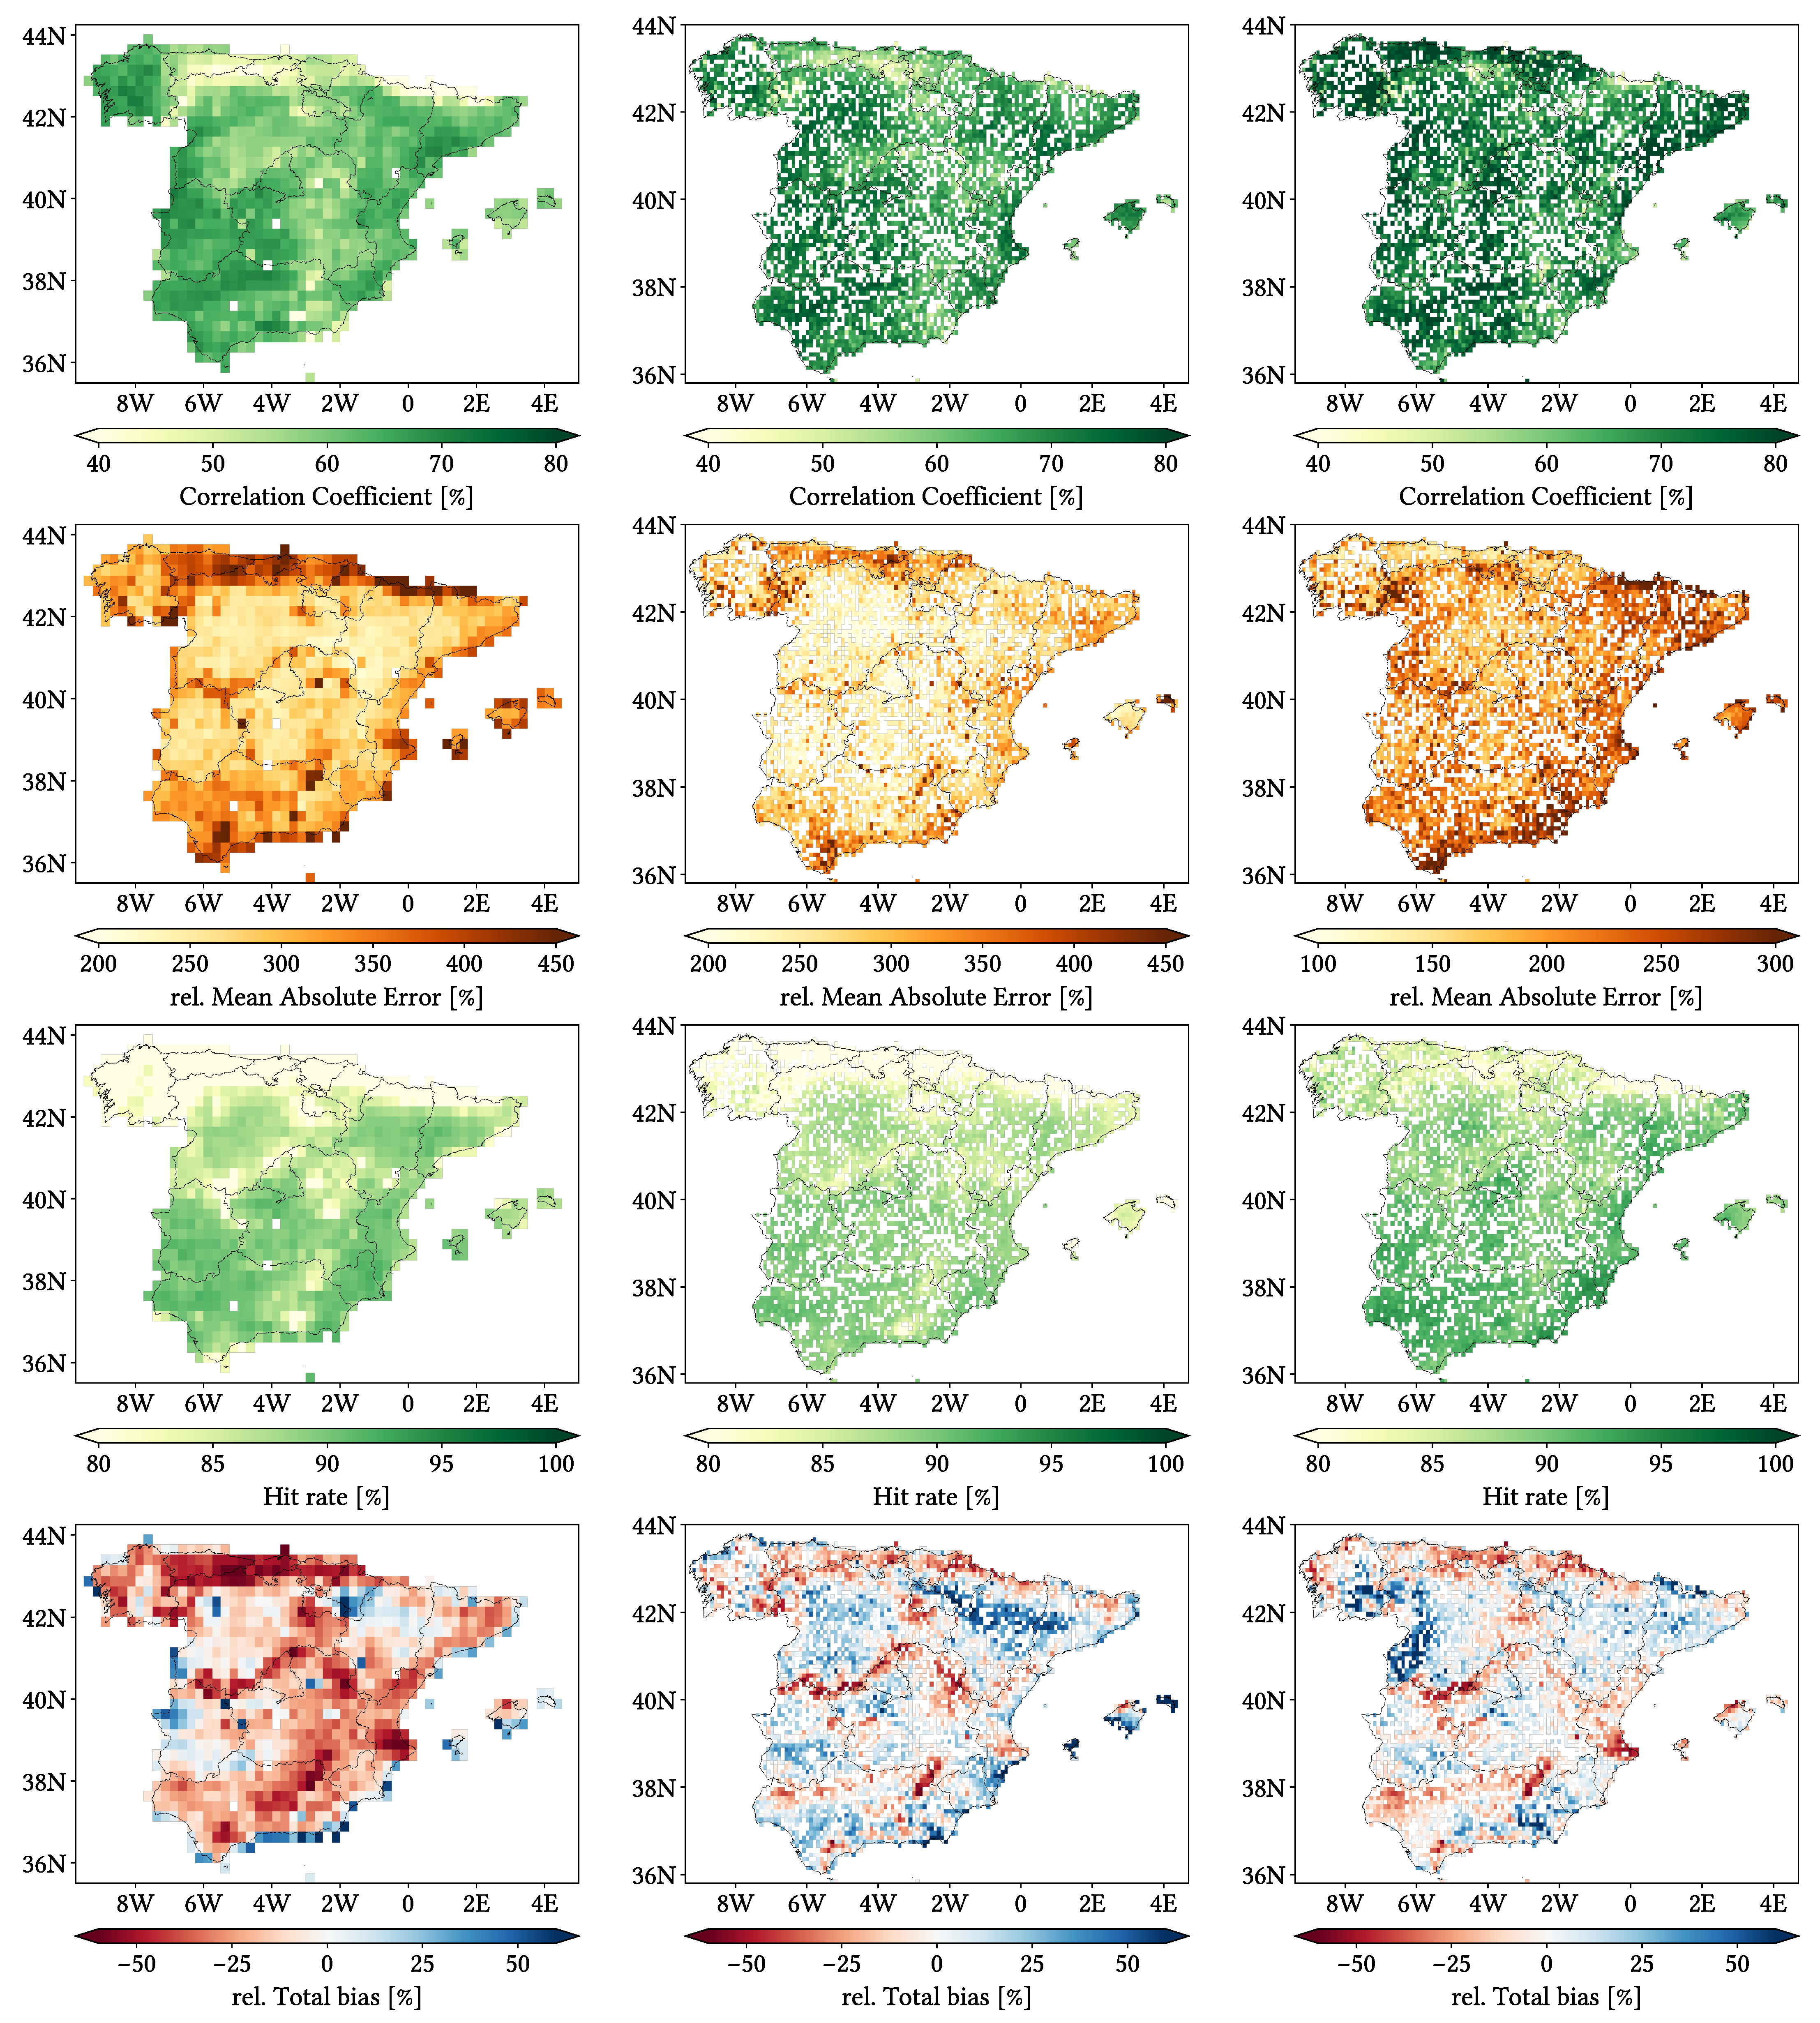
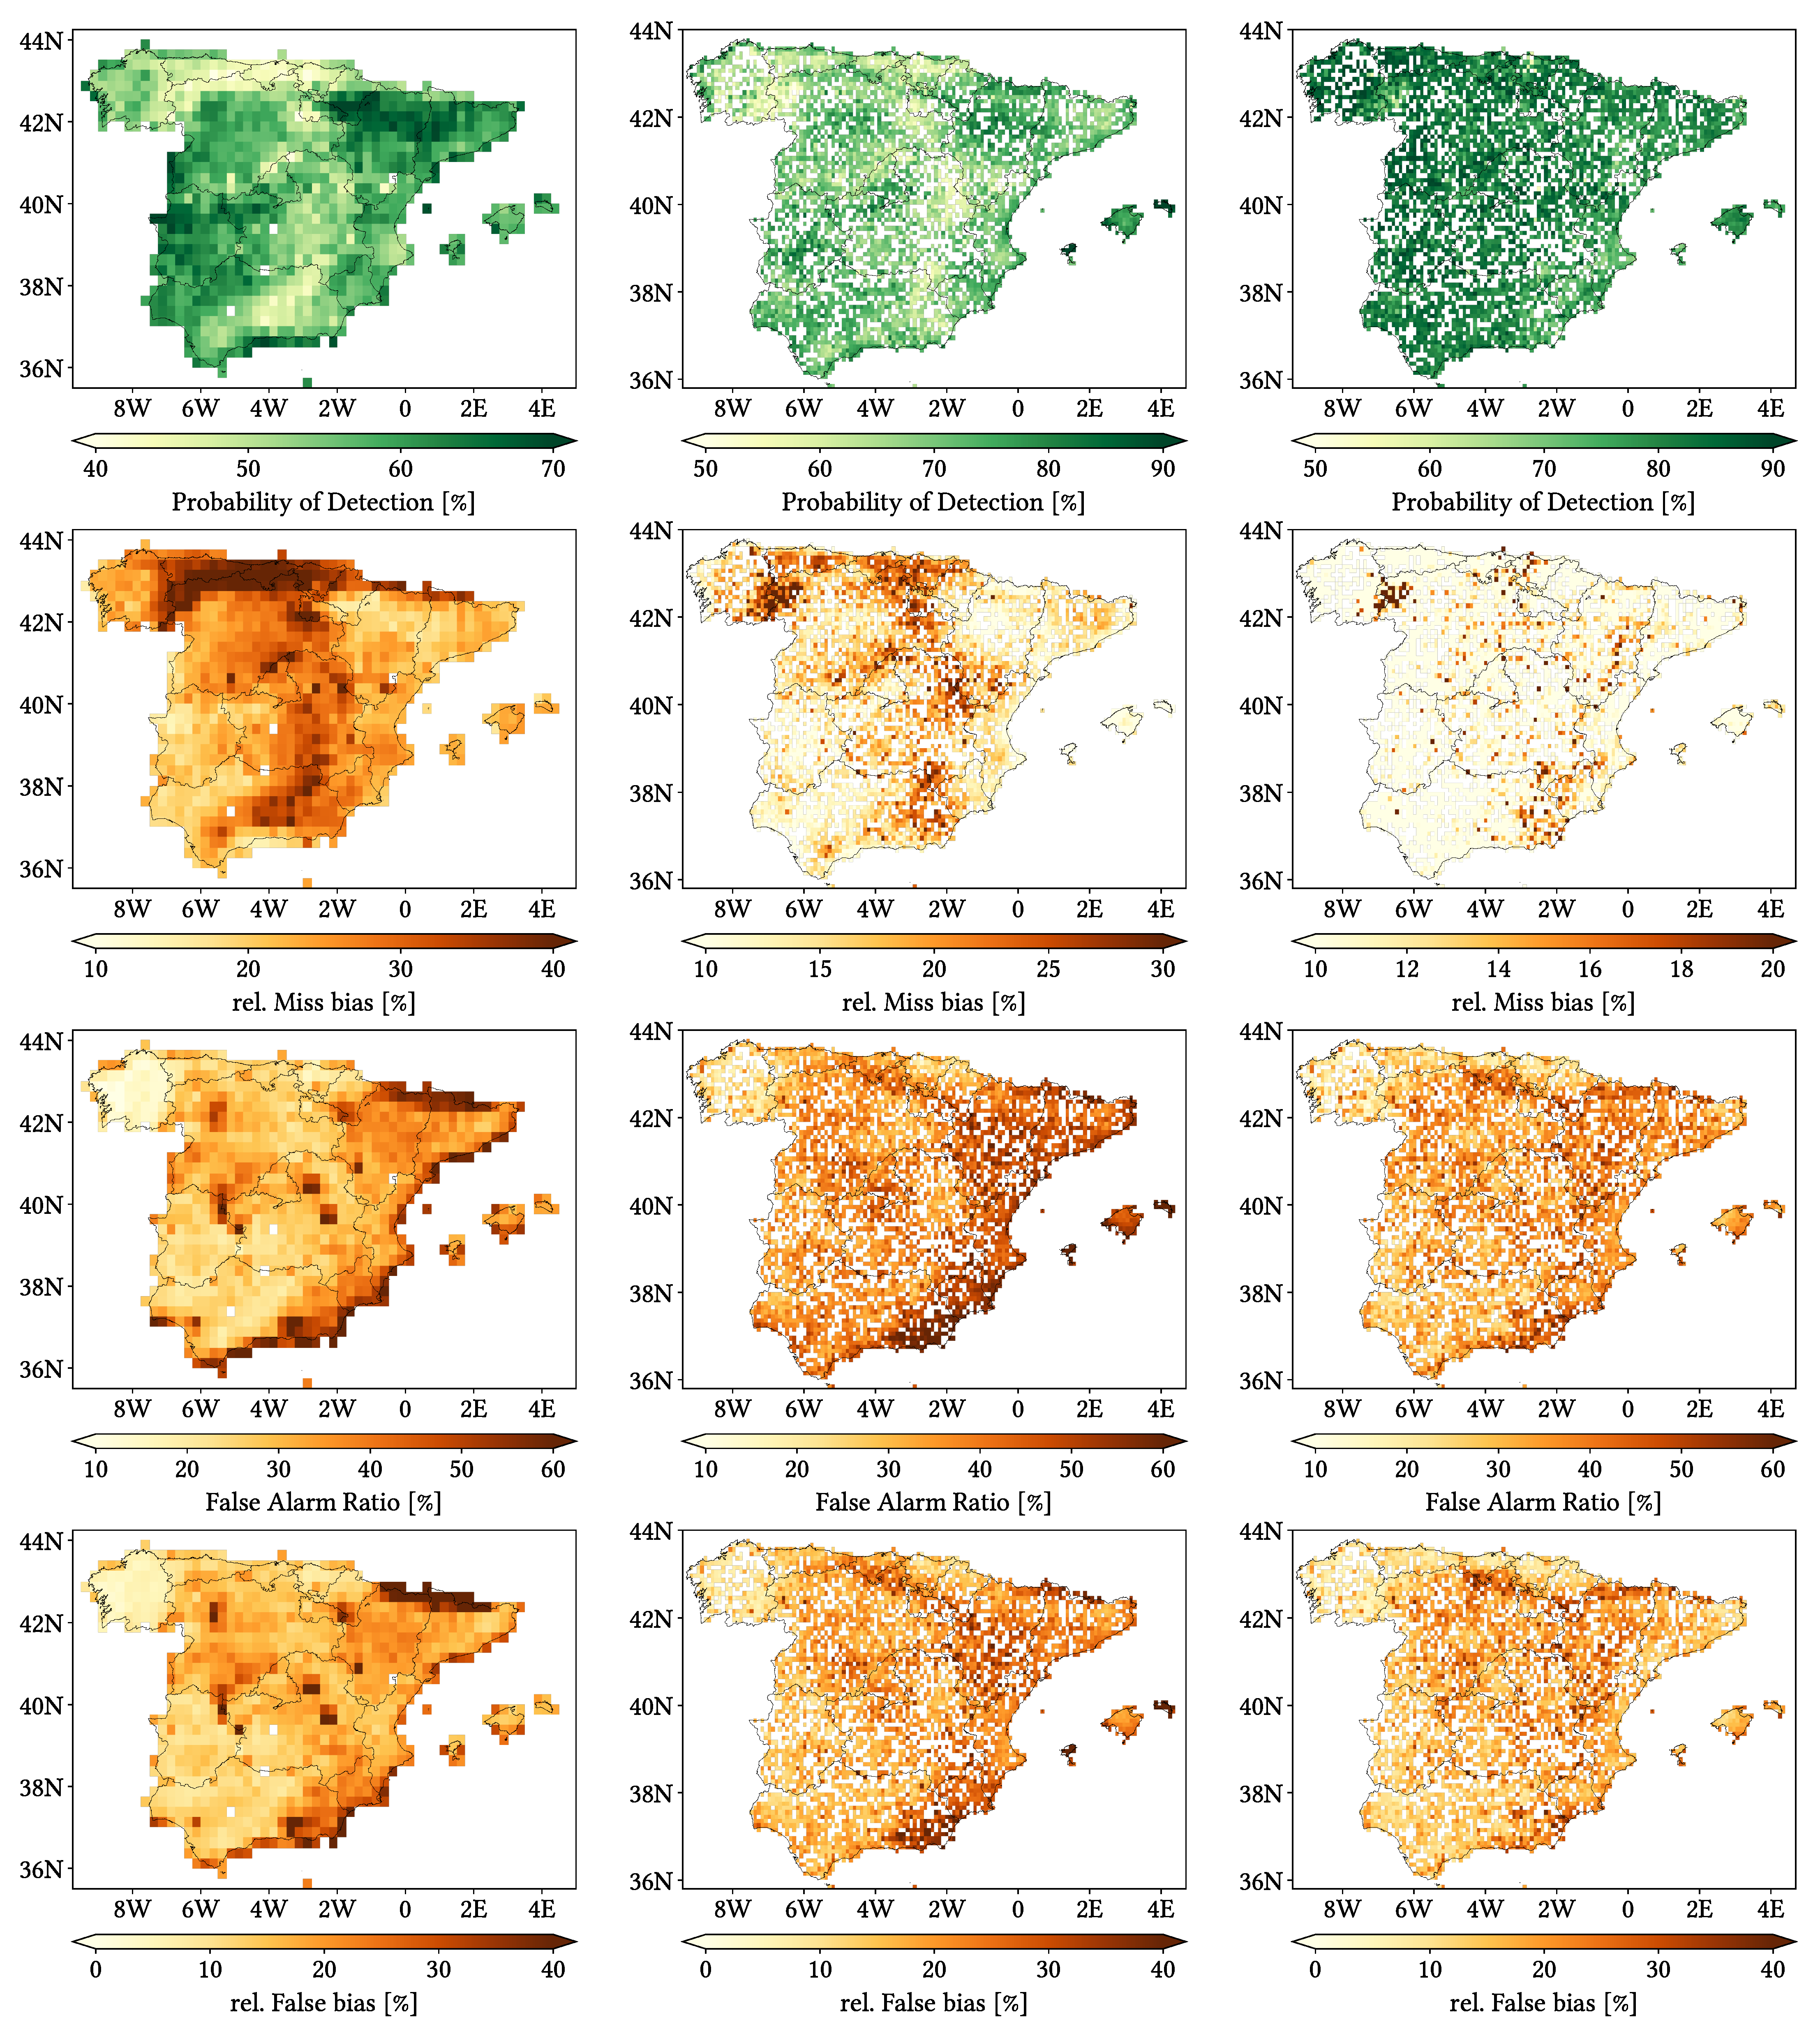
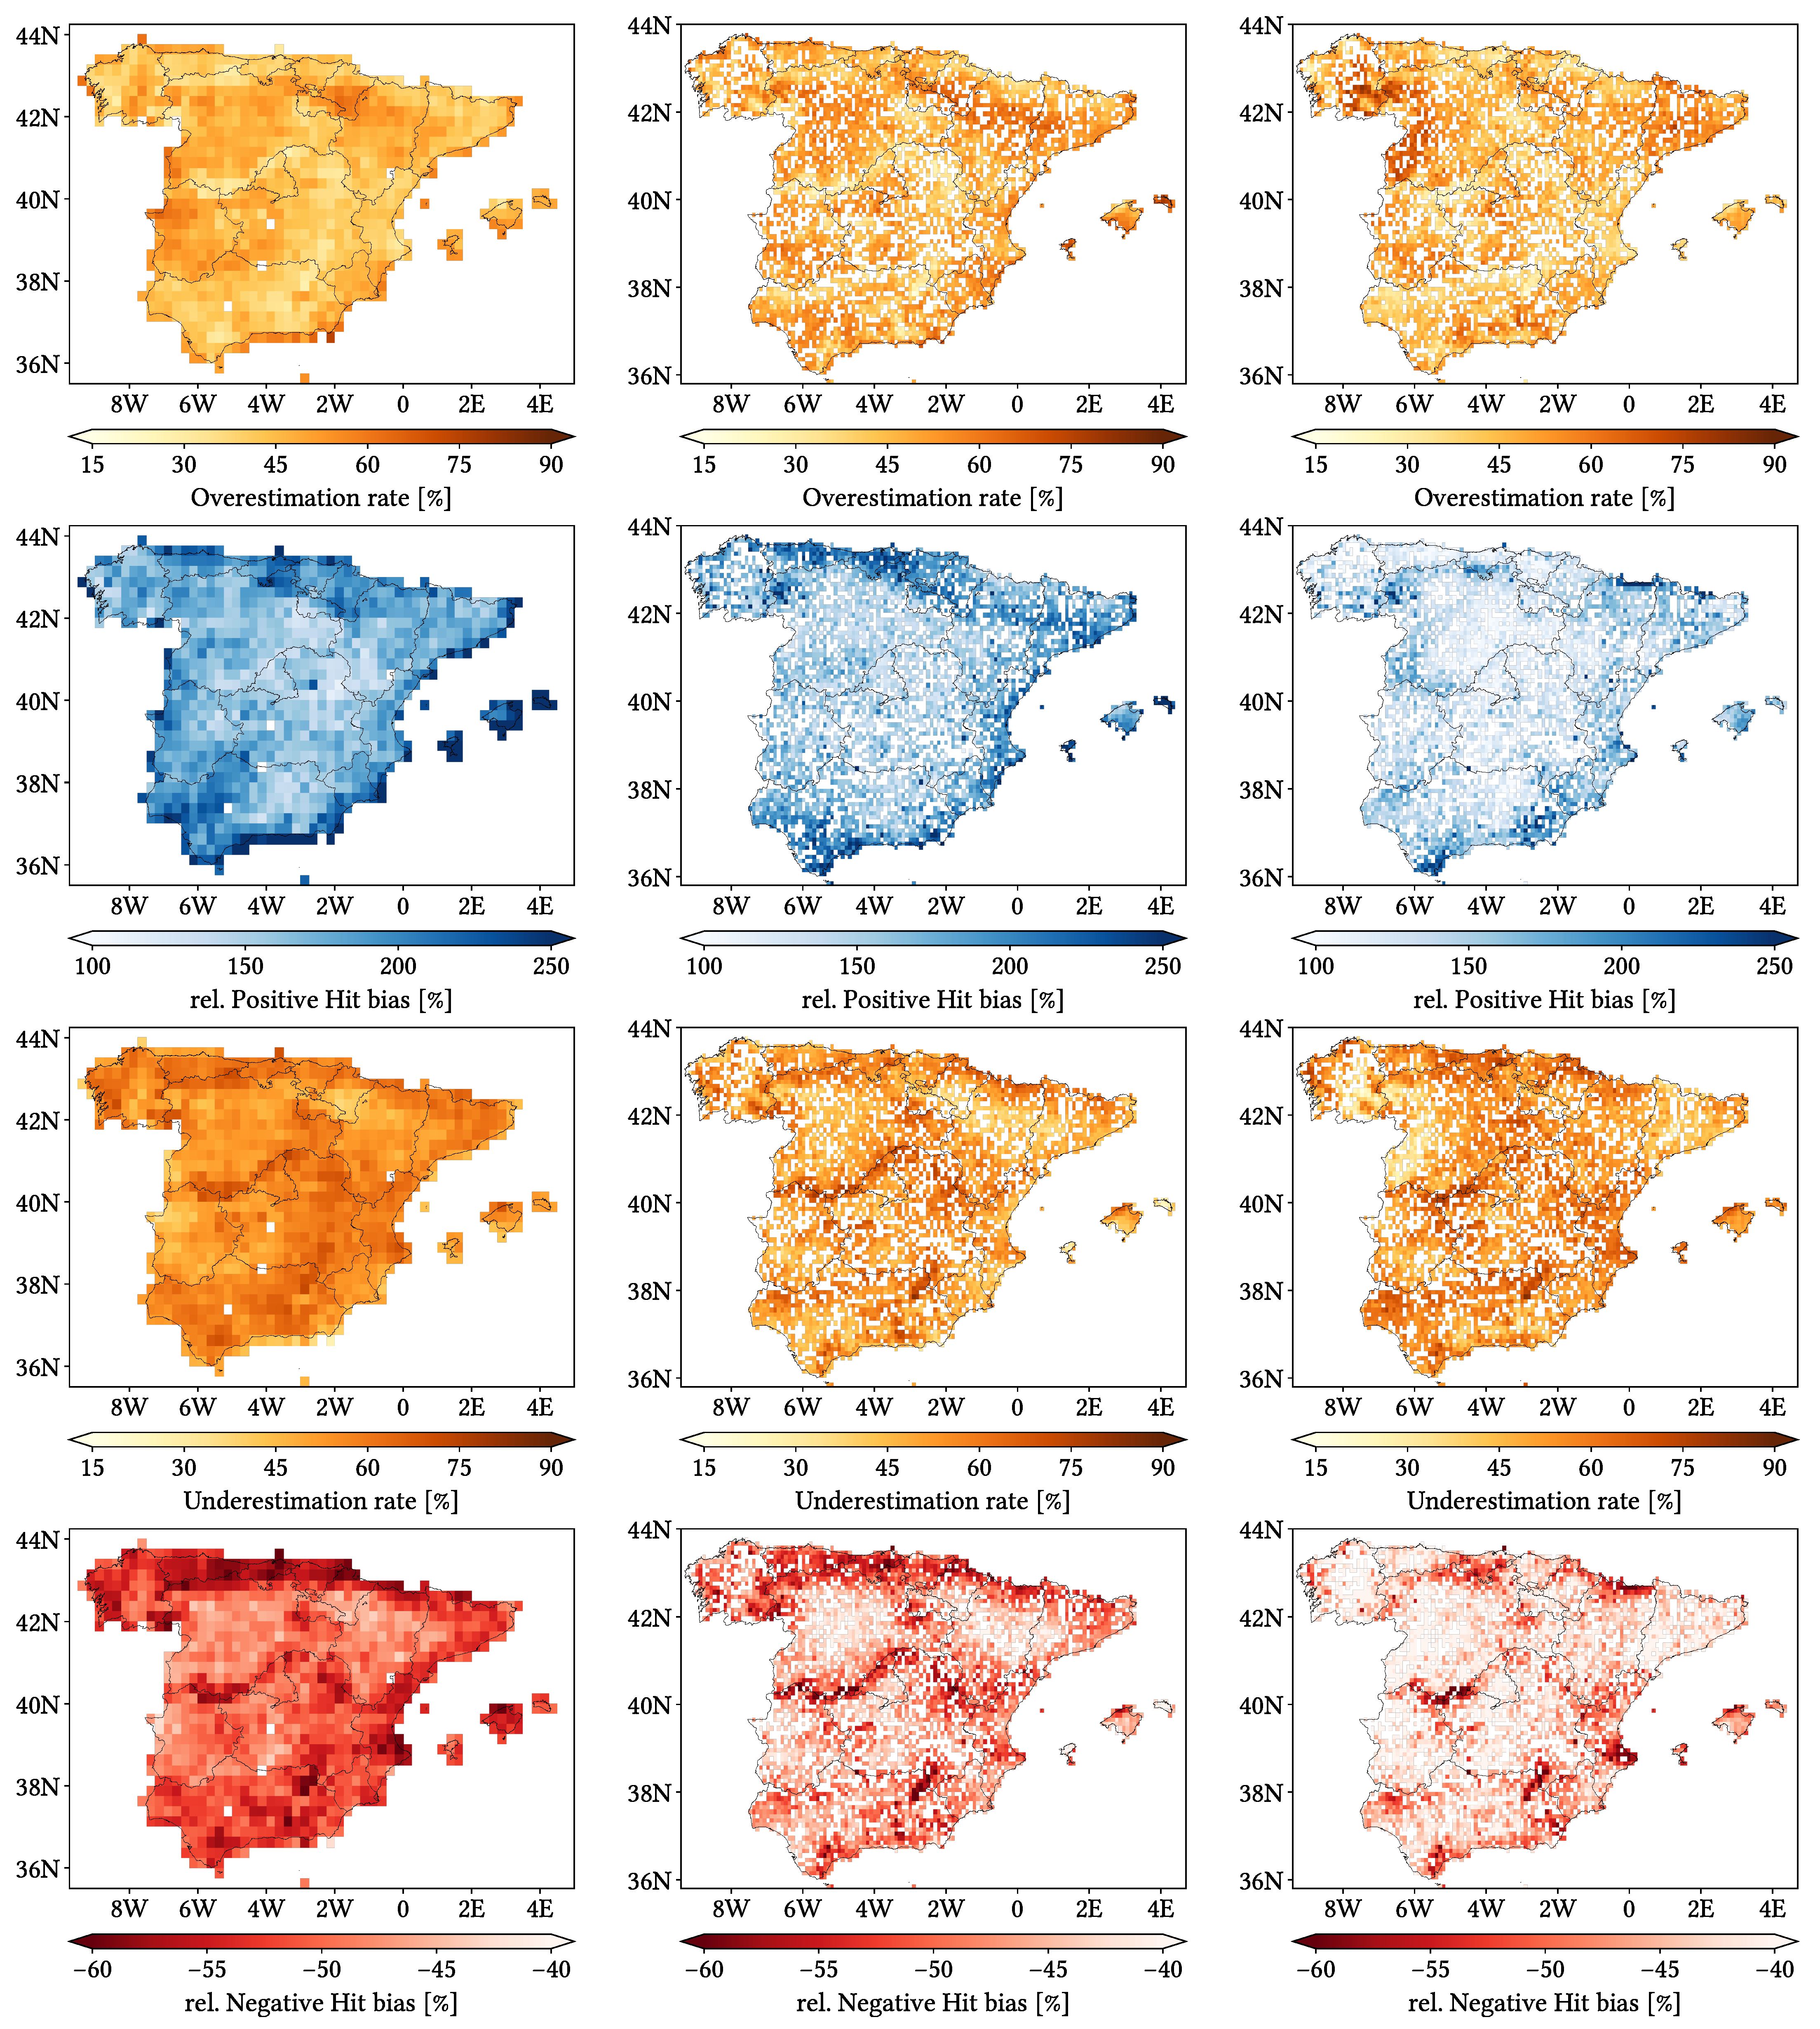
    Figure 11, Figure 12 and Figure 13 show maps over the study region of the daily performance metrics for the three products. Once again, we can appreciate that MSWEP is the best performer and CMORPH is the worst one for every metric. Regarding spatial patterns, some metrics share a common pattern, while others do not. CC shows no clear pattern for IMERG and MSWEP, whereas CMORPH seems to struggle across the northern littoral, Pyrenees, Septentrional Meseta and Iberian and Betic ranges. Through the rMAE, we see that CMORPH and IMERG are most problematic along the northern littoral (in the case of CMORPH, across the Balearic Islands too) and then along the Mediterranean littoral, whereas MSWEP is most problematic along the Mediterranean littoral, Ebro basin and Balearic islands. For HtR and POD, CMORPH and IMERG share similar patterns, whereas MSWEP deviates from them: for HtR, all products perform worse for the whole Atlantic/Cantabric regions, Pyrennes, the surroundings of the Septentrional Meseta and the Iberian range, but CMORPH and IMERG are problematic for the Betic range and the Balearic Islands too. A similar pattern can be noticed in POD for CMORPH and IMERG, but showing less problems across the Pyrenees and Balearic islands; contrarily, MSWEP shows a very homogeneous distribution of POD. Finally, as of FAR, all products show worse FAR across the Iberian Mediterranean Basin; however, CMORPH still presents even worse FAR values along the Mediterranean coastline and Pyrenees.
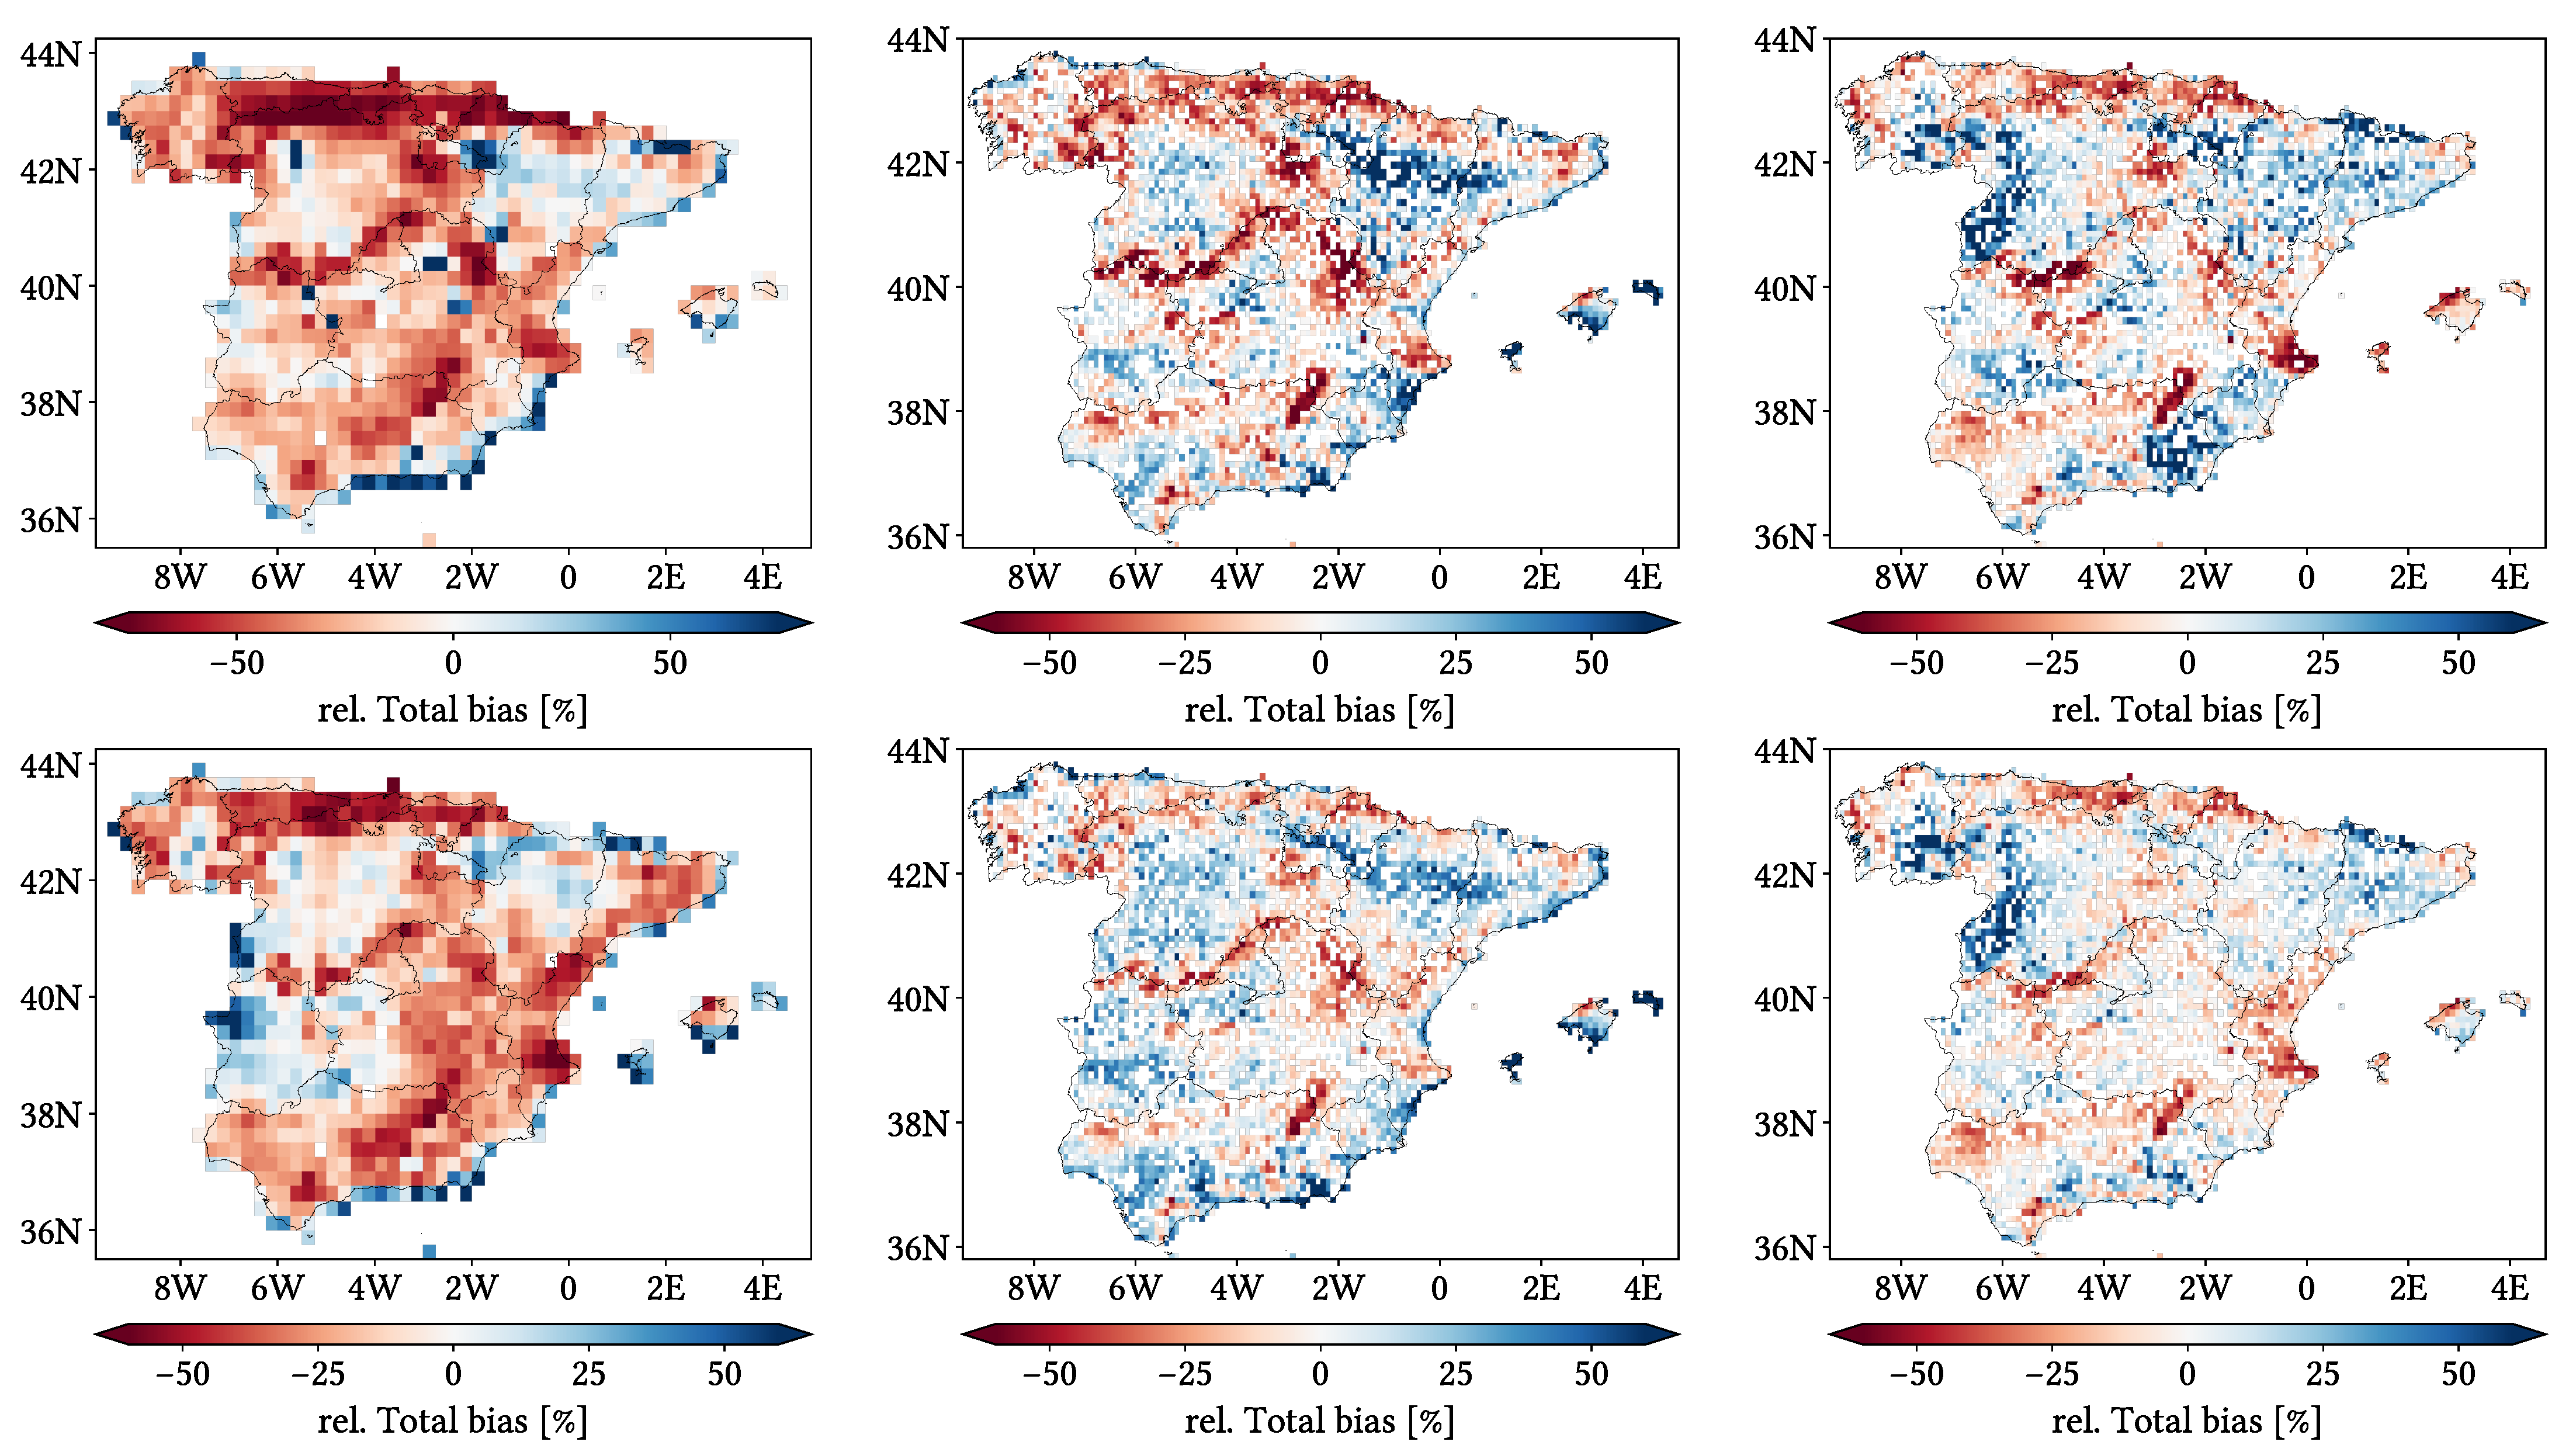
    Regarding biases, IMERG and MSWEP show similar patterns for Total and Negative Hit bias, while CMORPH and IMERG show similar patterns for the rest. In the case of Total bias, IMERG and MSWEP underestimation zones mainly align with the wettest and most orographically complex regions, which are generally the same ones (see Figure 4 and Figure 7), and their overestimation zones are located mainly across the driest and also least orographically complex regions (which include the basins of all main rivers except Guadalquivir). The same pattern of greater underestimation applies for Negative Hit bias for both products. CMORPH shows a similar pattern for both types of biases, but extends its underestimation zones through Meridional Meseta, Betic range, Guadalquivir basin and the end of the Ebro basin. As of the Positive Hit bias, CMORPH and IMERG are most problematic across all the littorals and the northeast border of the Septentrional Meseta, with IMERG being also more problematic along the Ebro basin and CMORPH along the Guadalquivir basin and the Balearic islands. MSWEP is most problematic along the Iberian Mediterranean Basin, Balearic islands and small sparse areas north of the Septentrional Meseta and across the Pyrenees. Regarding OvR and UdR, their patterns are the same but reversed (being UdR clearly more intense than OvR), and this pattern is the same we can in Total bias. Finally, as expected by their definitions, False and Miss bias follow the same patterns as FAR and the inverse of POD, respectively.

    5.4. Overall Monthly Analysis

    Figure 14 shows violin plots from the overall analysis at monthly scale, without data grouping. Results are better in almost every index, except for Total and Negative Hit bias. Again, CMORPH is clearly the worst choice and suffers from greater underestimation and poorer detection skills, while IMERG is still worst regarding false events and associated bias; however, at this resolution IMERG and MSWEP perform much more similar. Through rMAE we see that IMERG and MSWEP become notably less problematic at monthly scale, whereas CMORPH remains similar. Finally, all SPPs are way more prone to underestimation than overestimation at monthly scale, and even though both relative Positive and Negative Hit bias values are better than at daily scale (with distributions achieving worst extreme values but with the bulk concentrated in lower ones), the dominance of underestimation leads to a notably increased Total bias towards negative values.
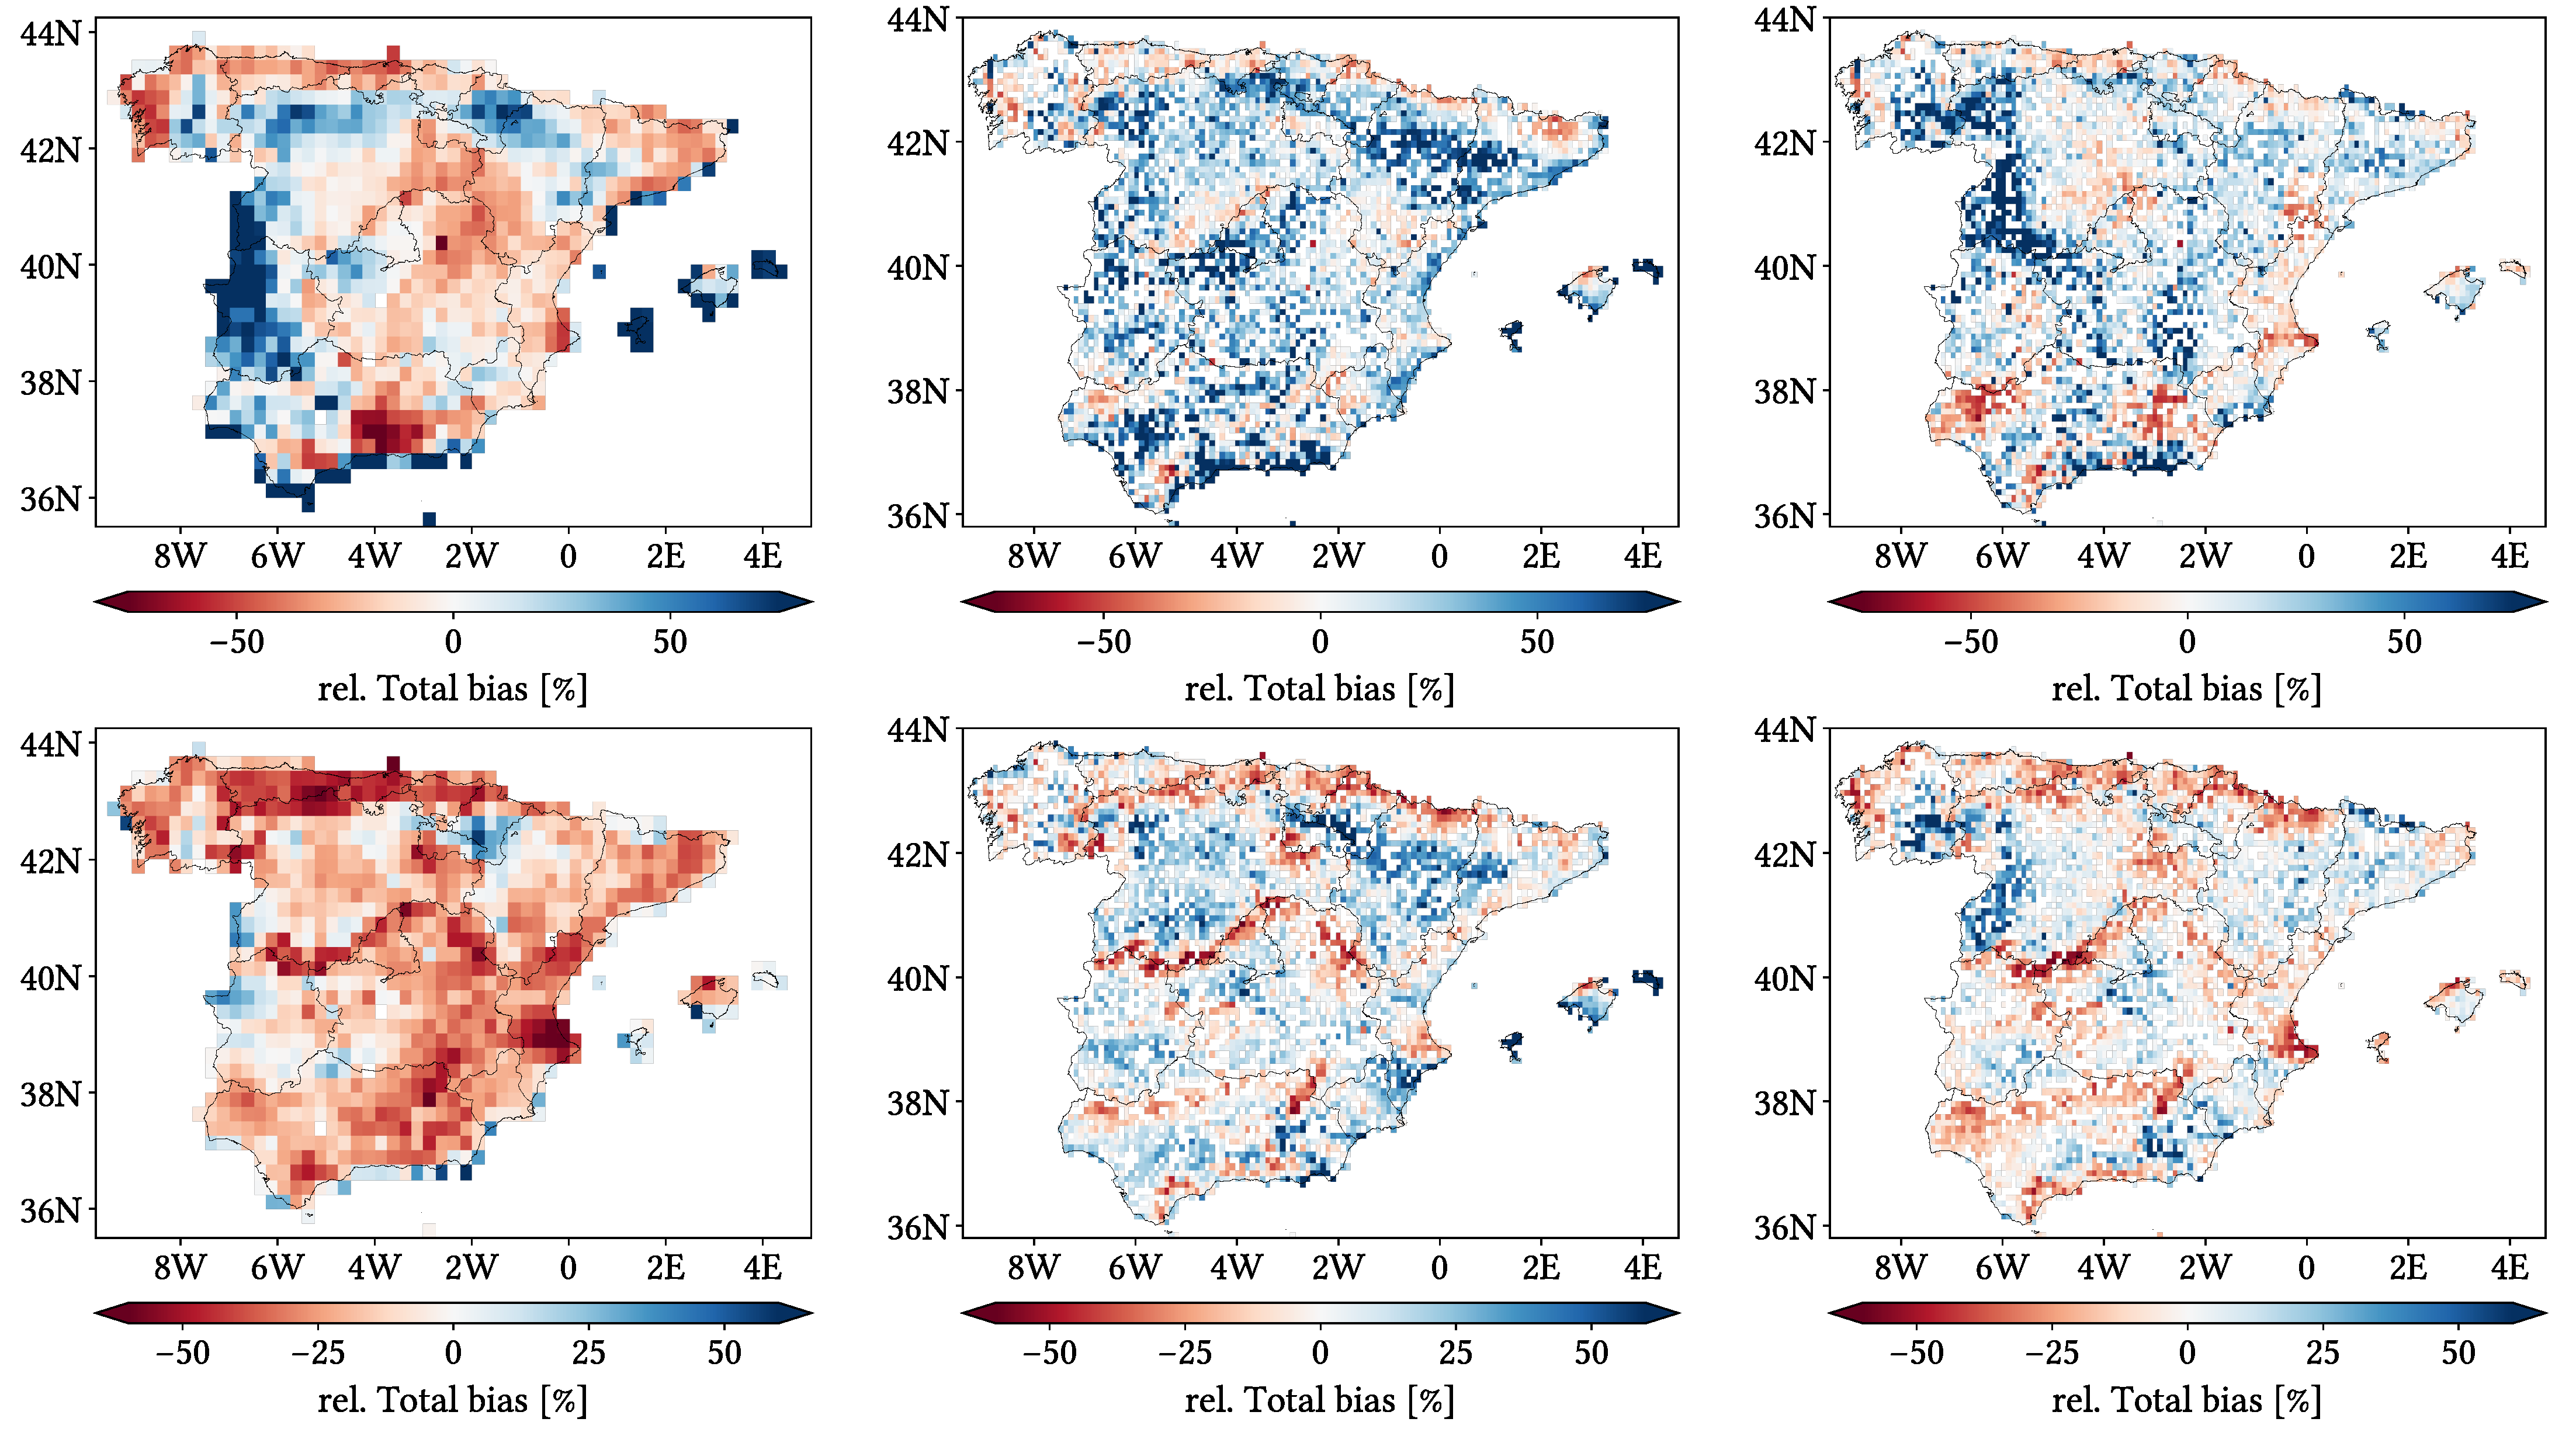
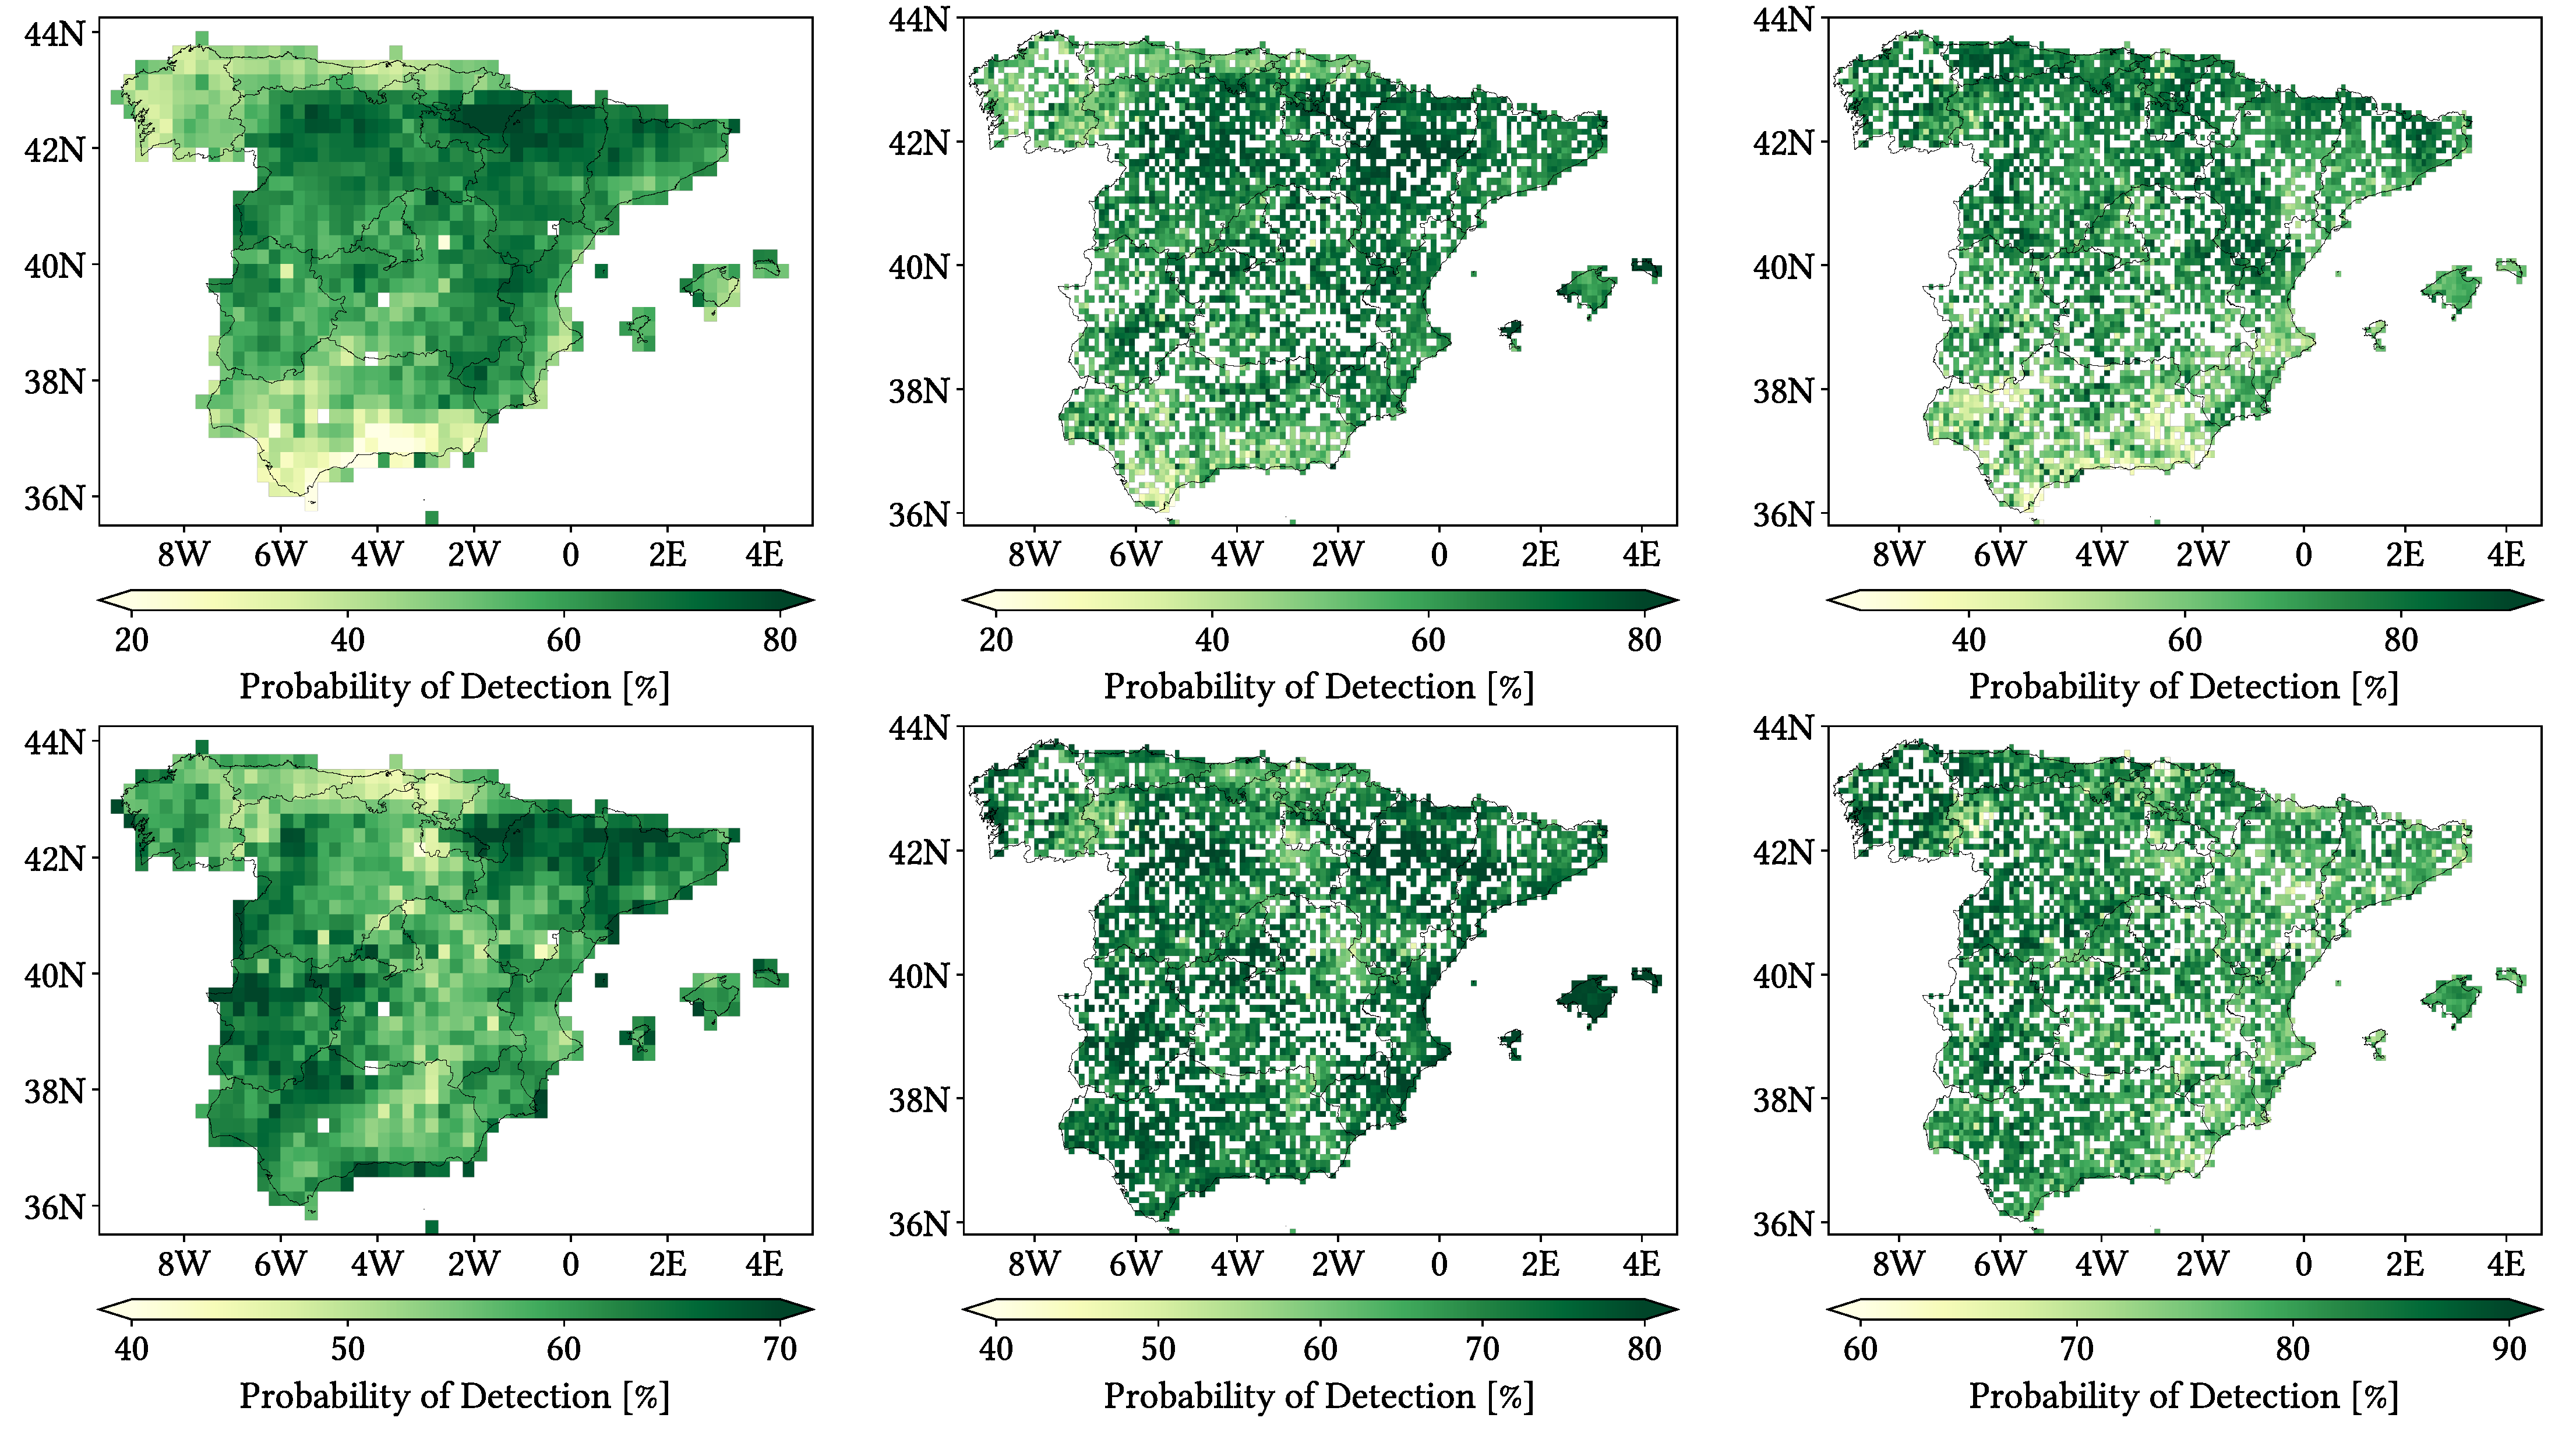
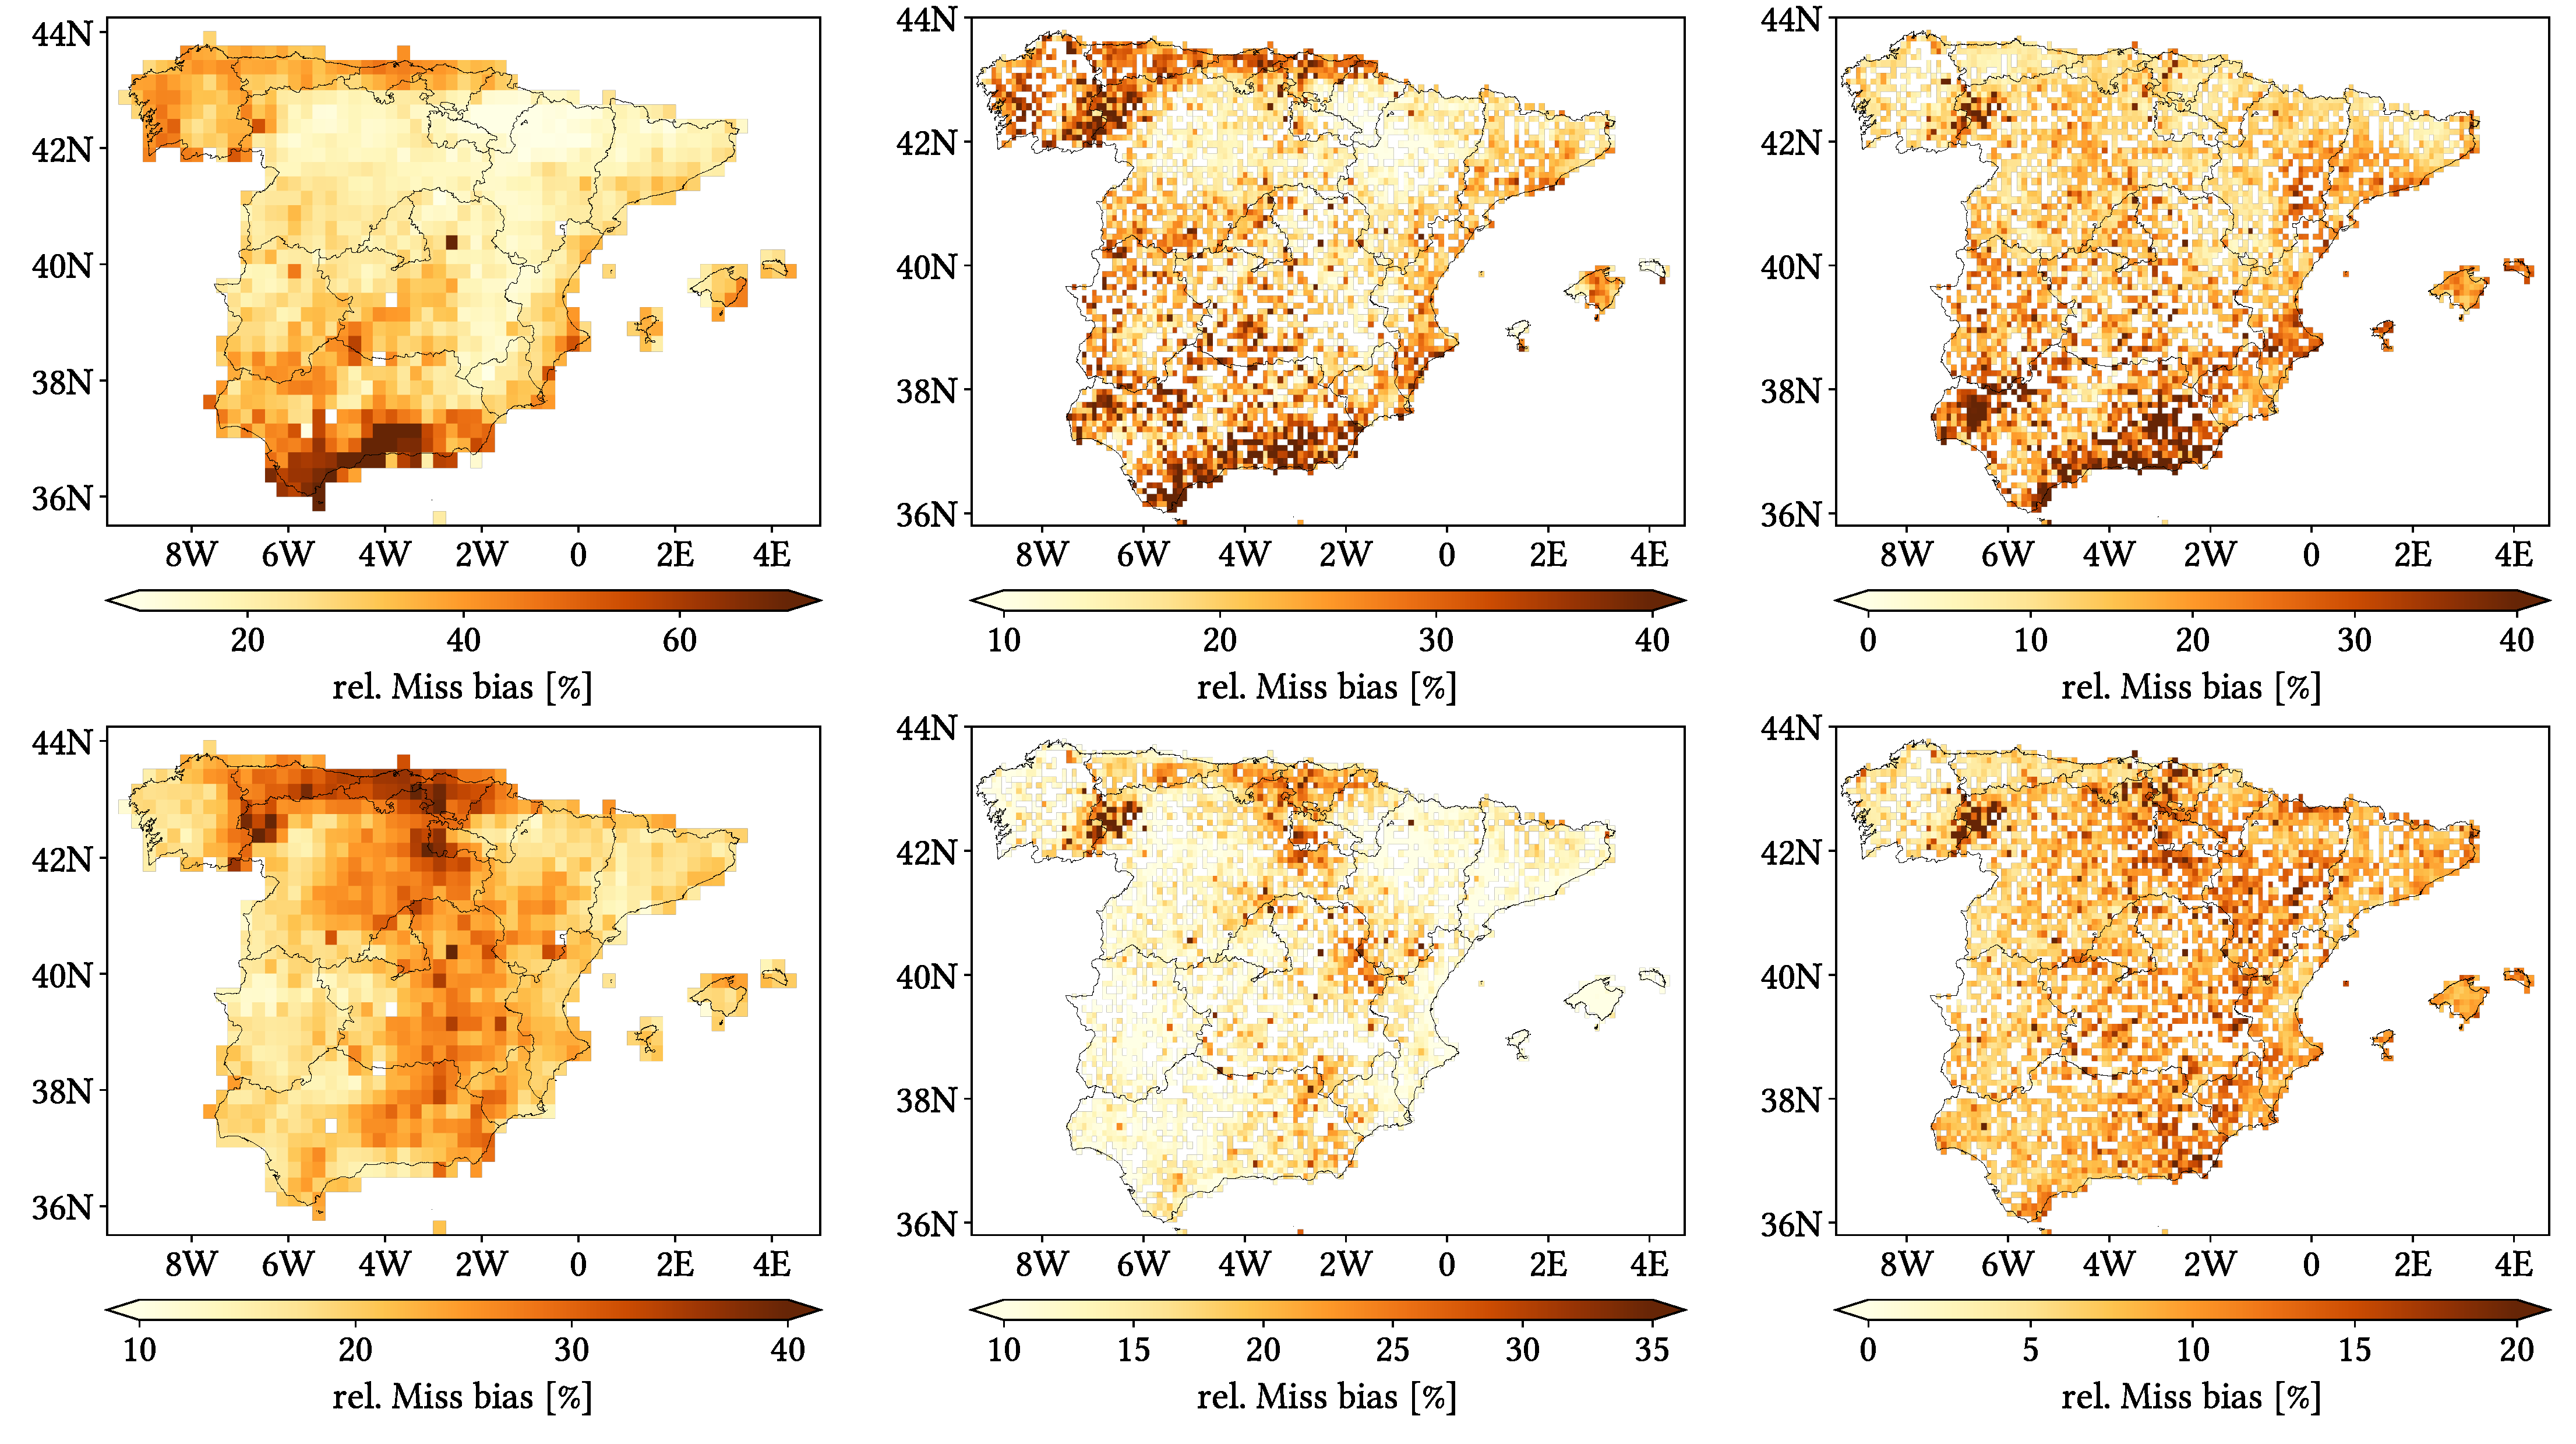
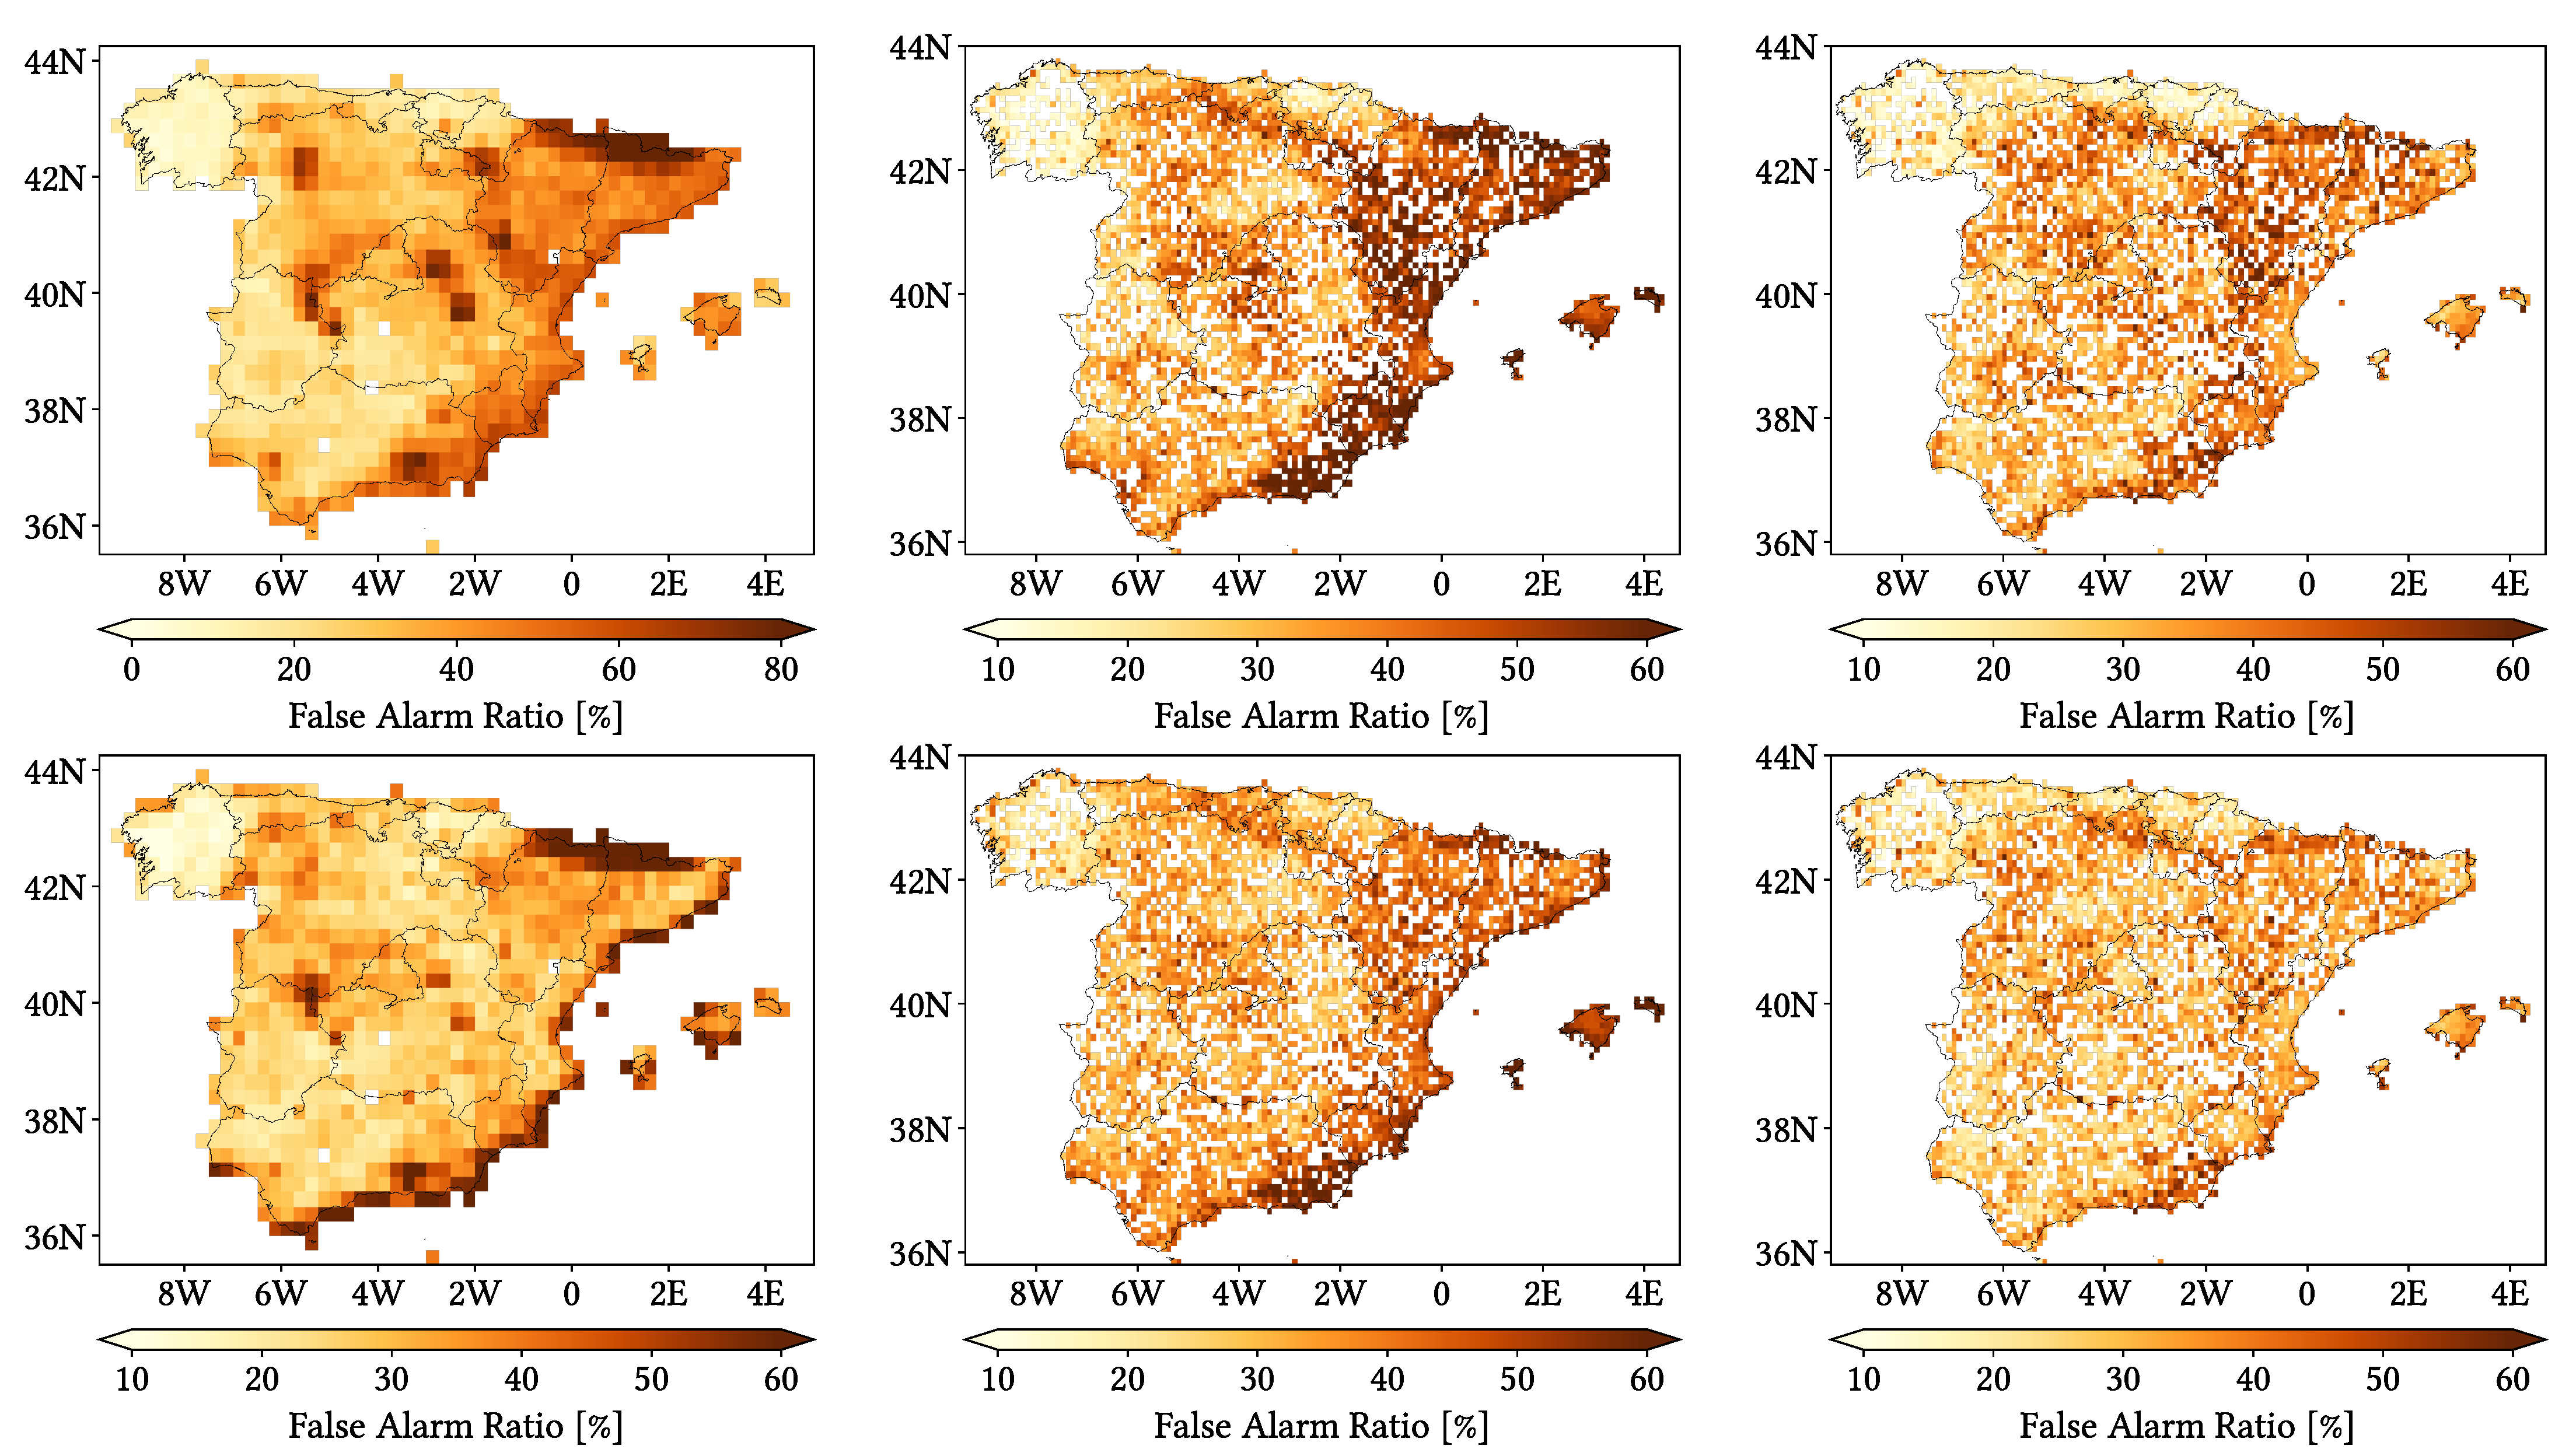
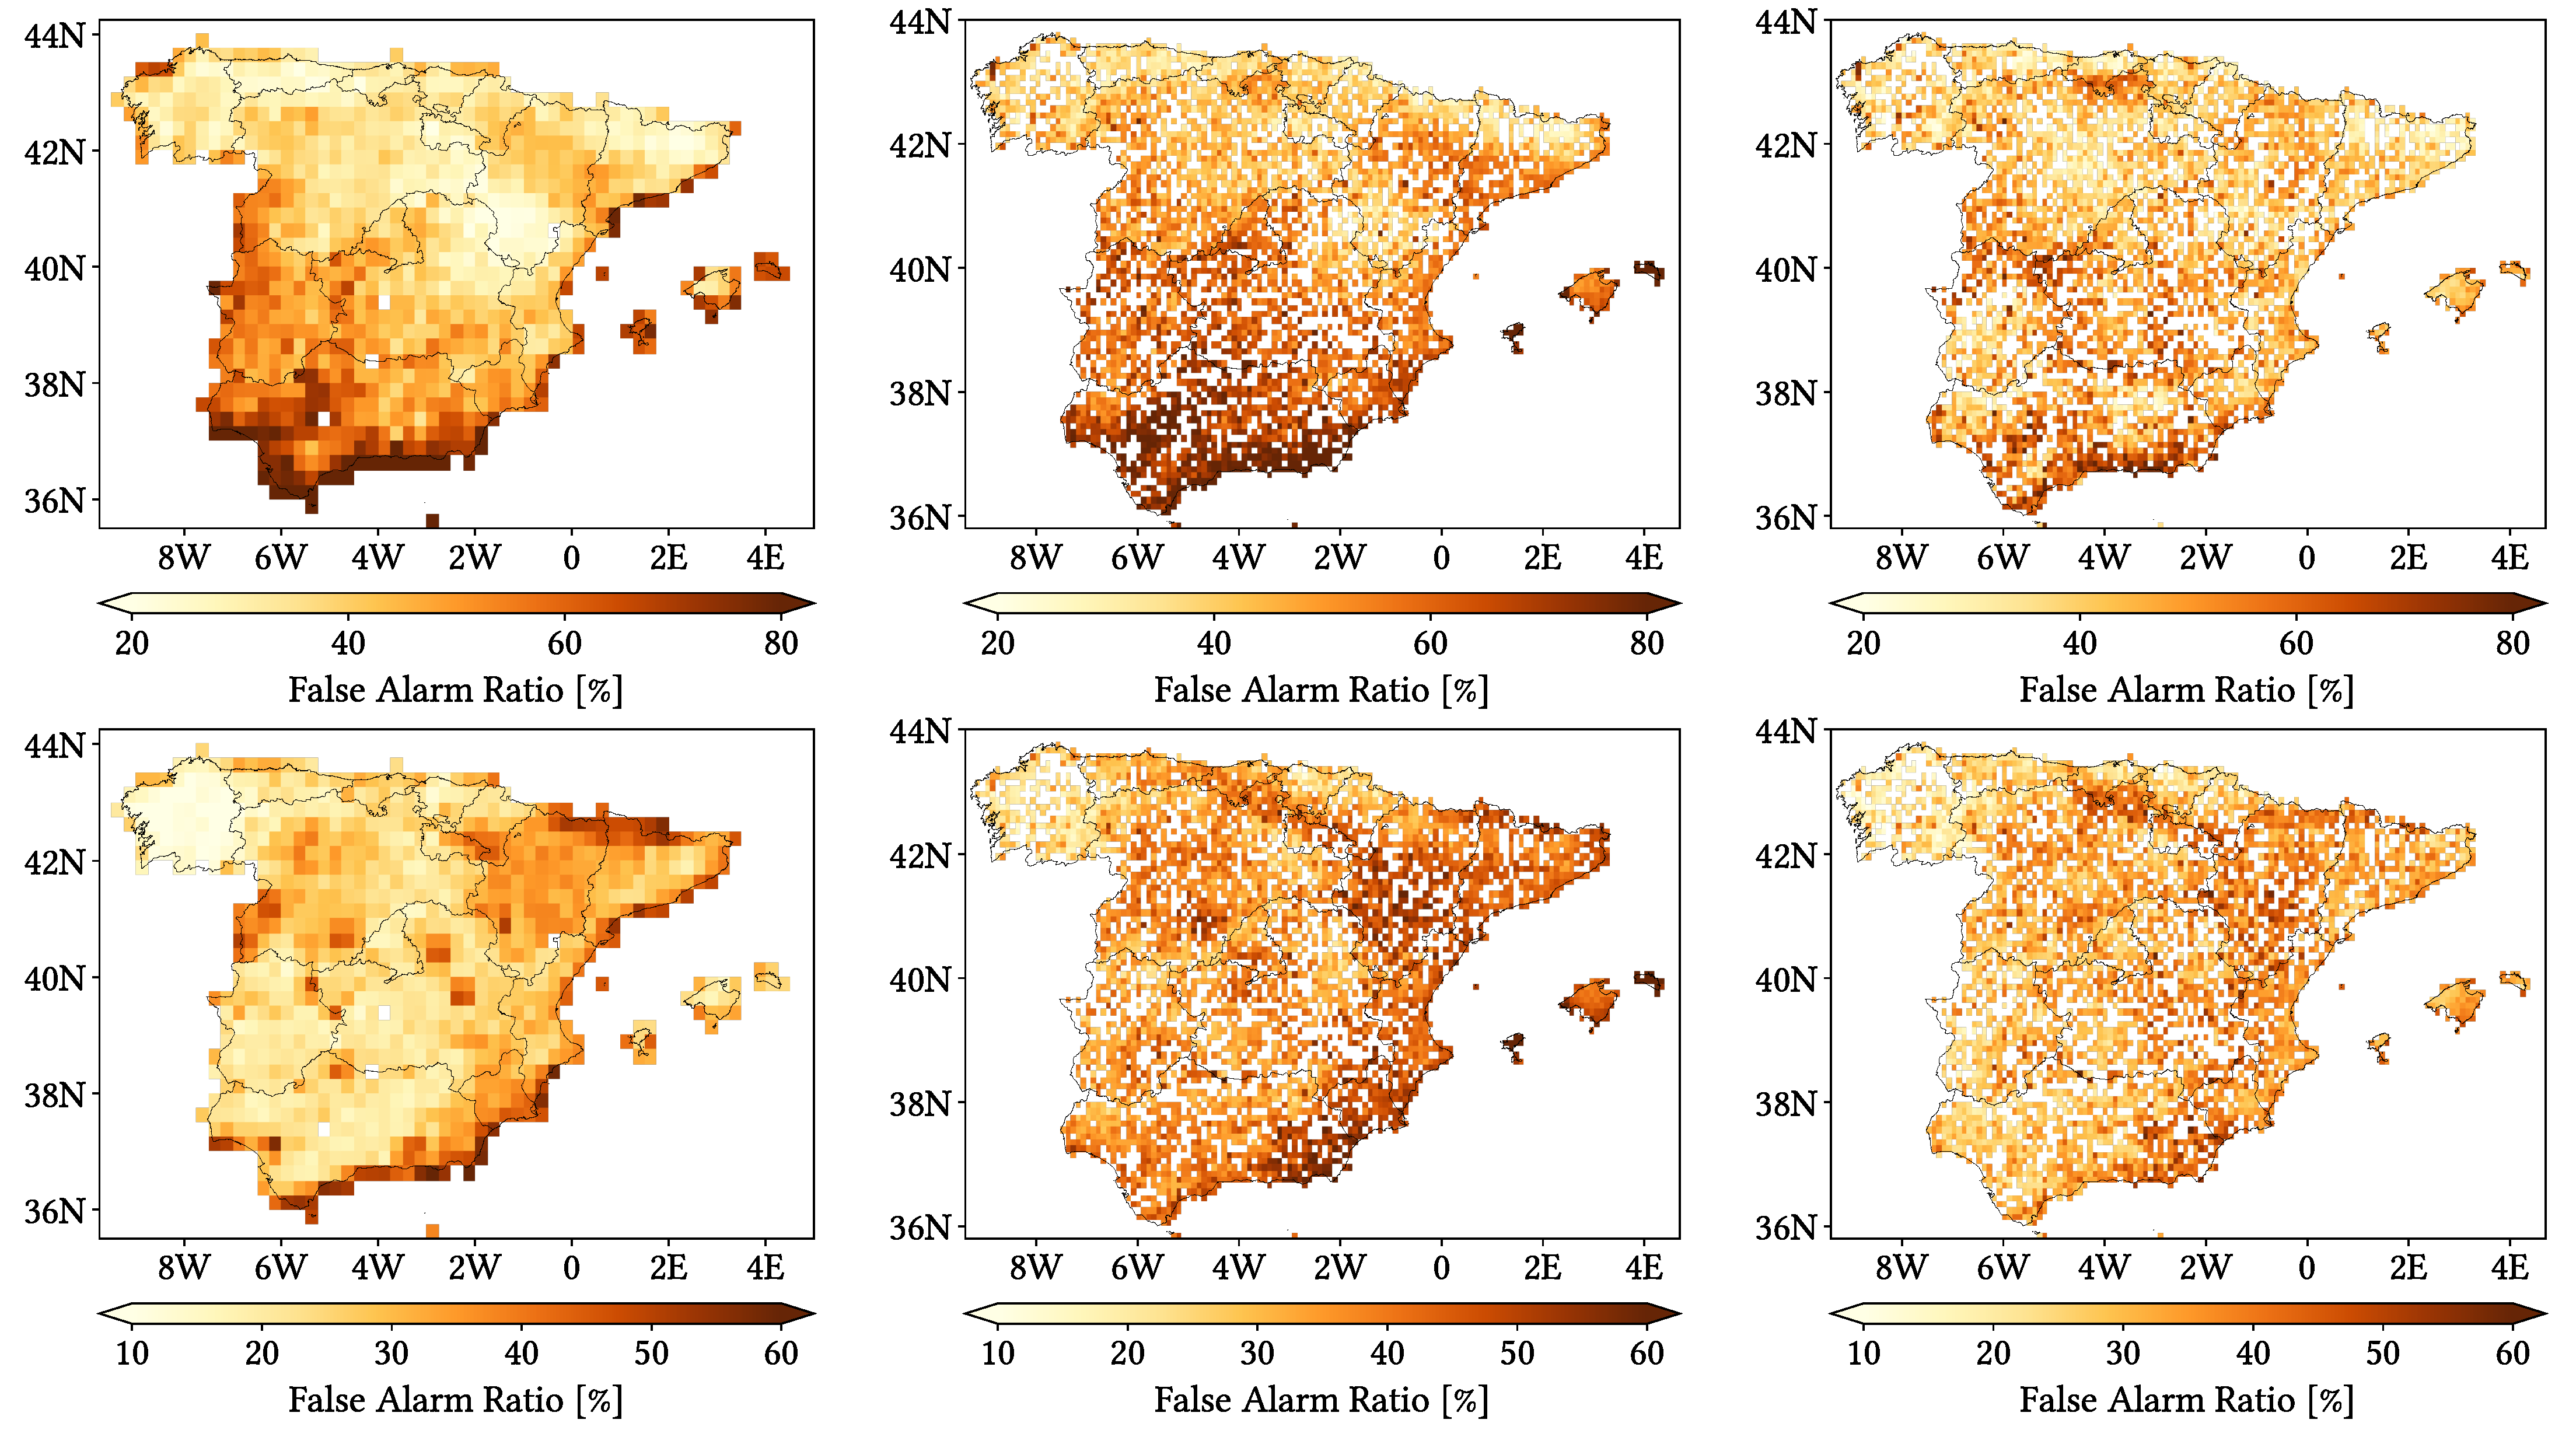
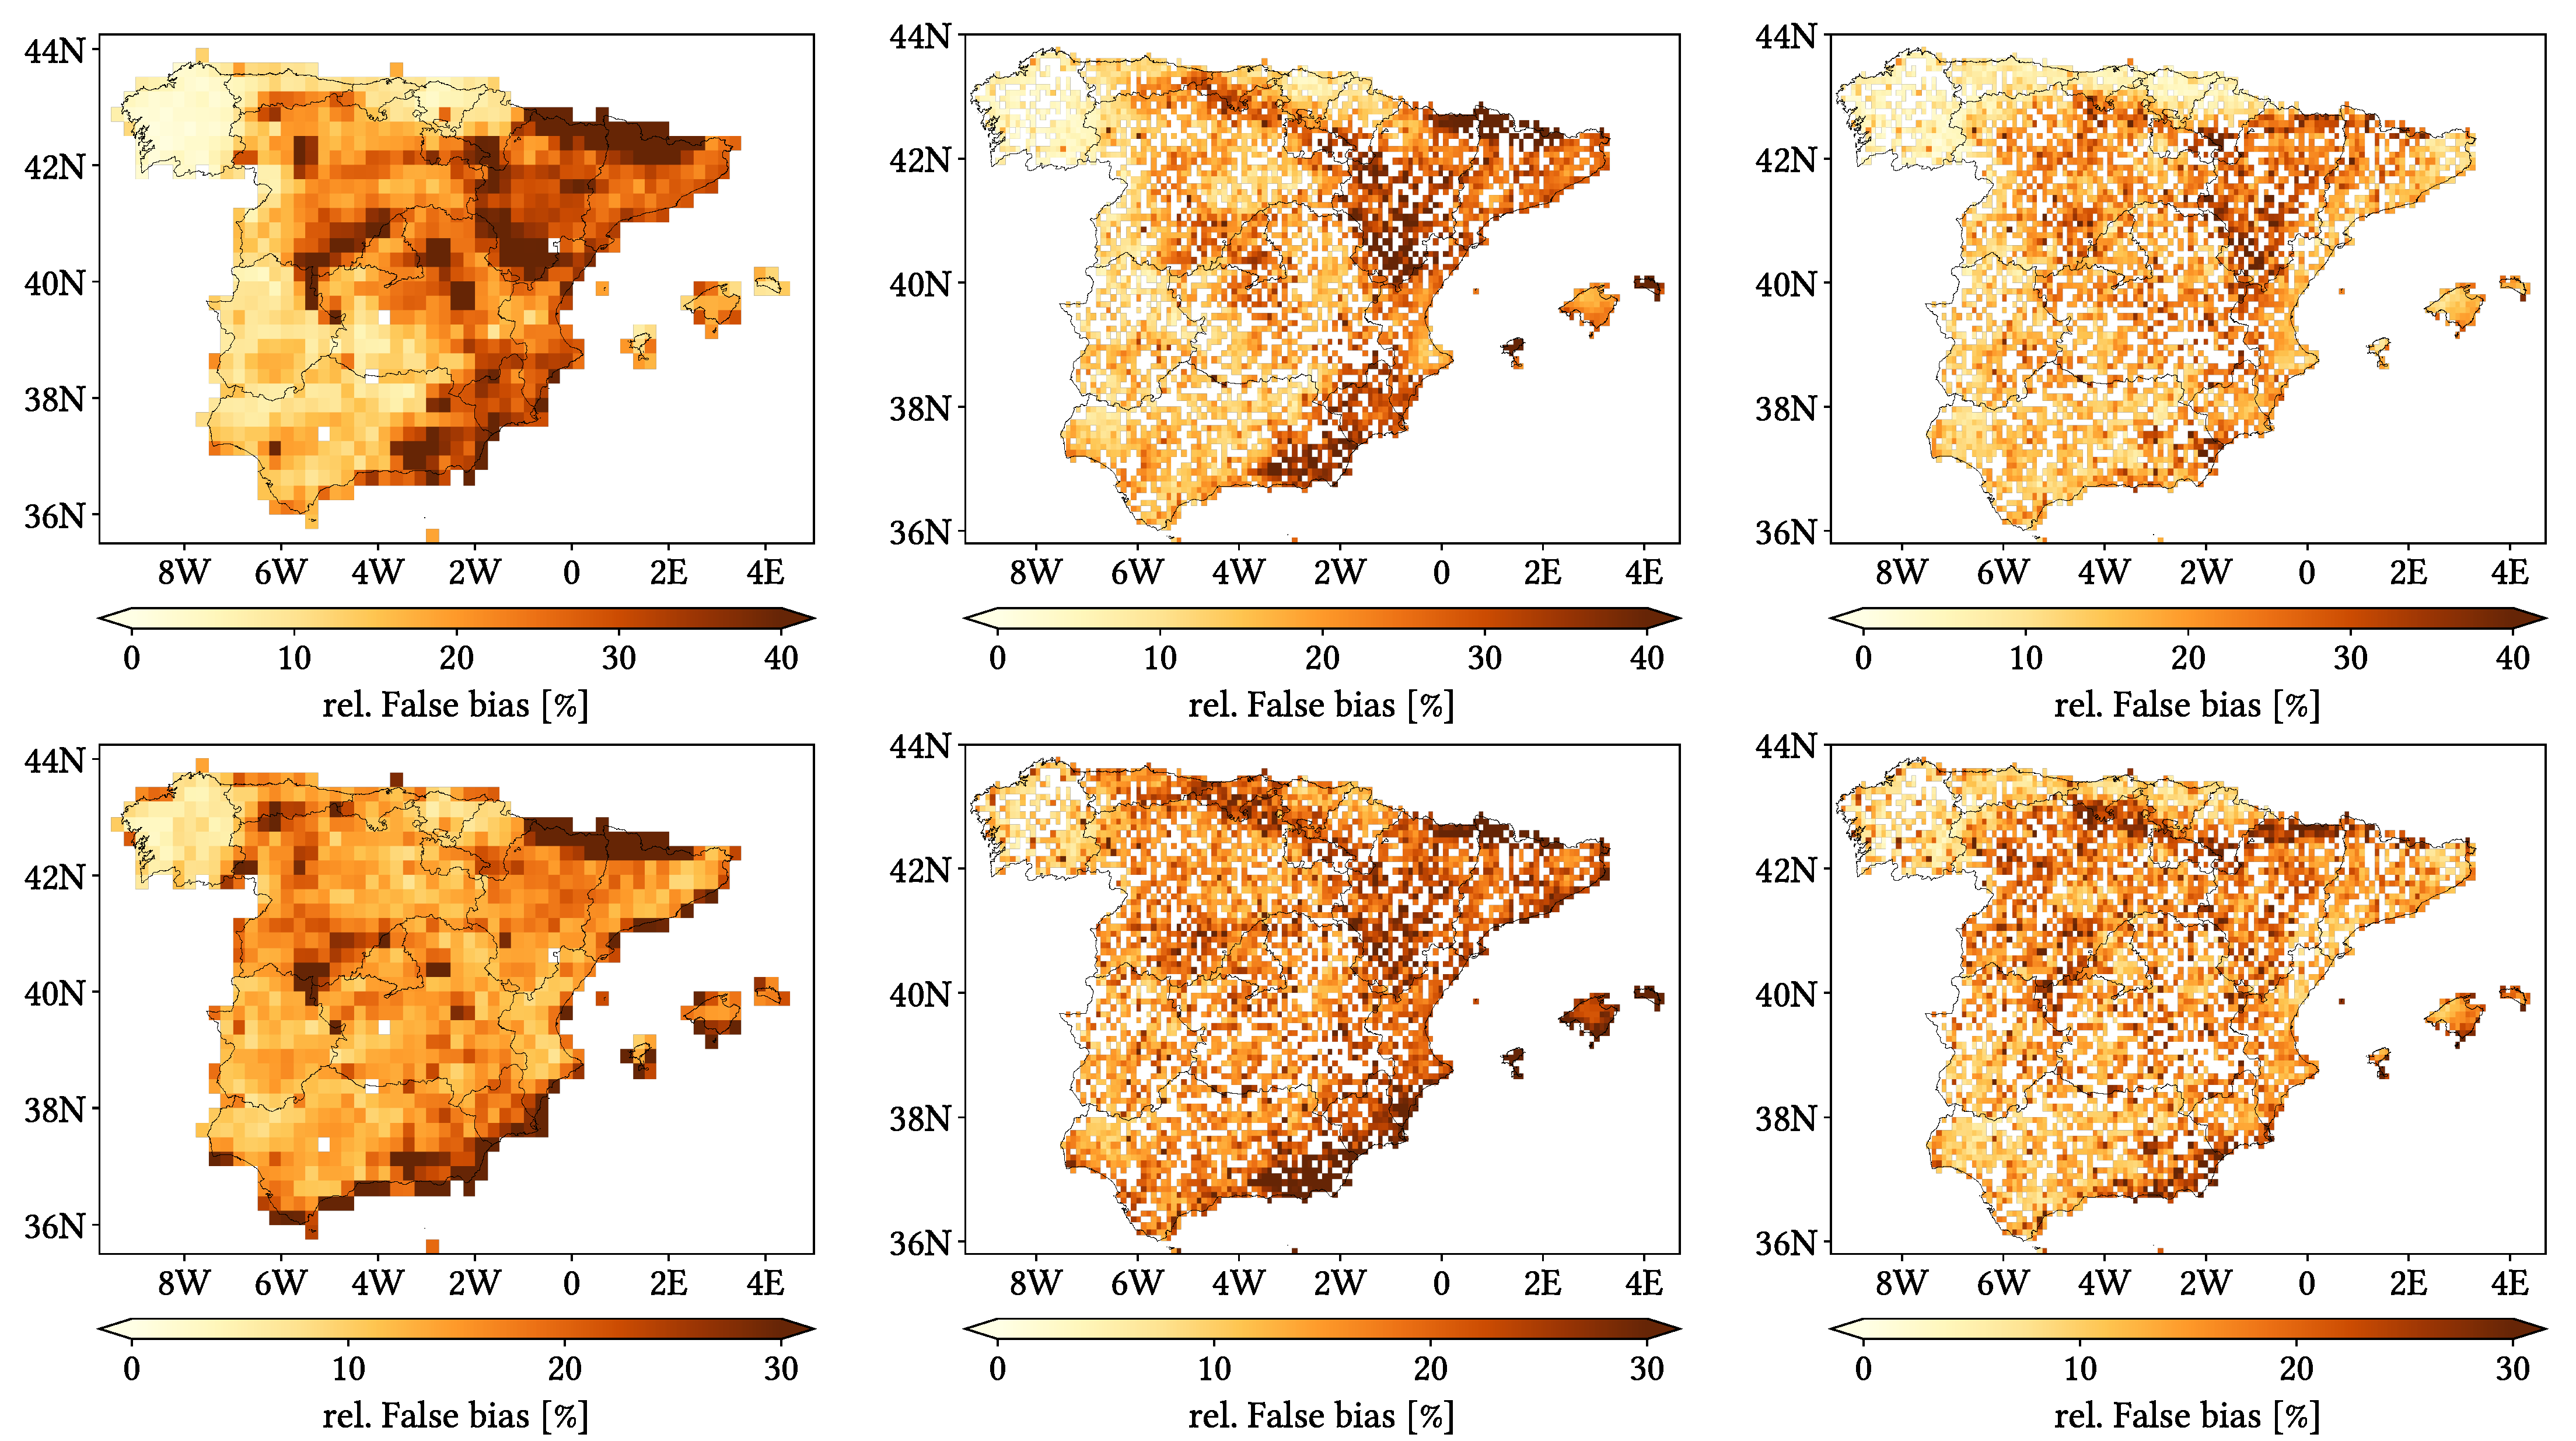
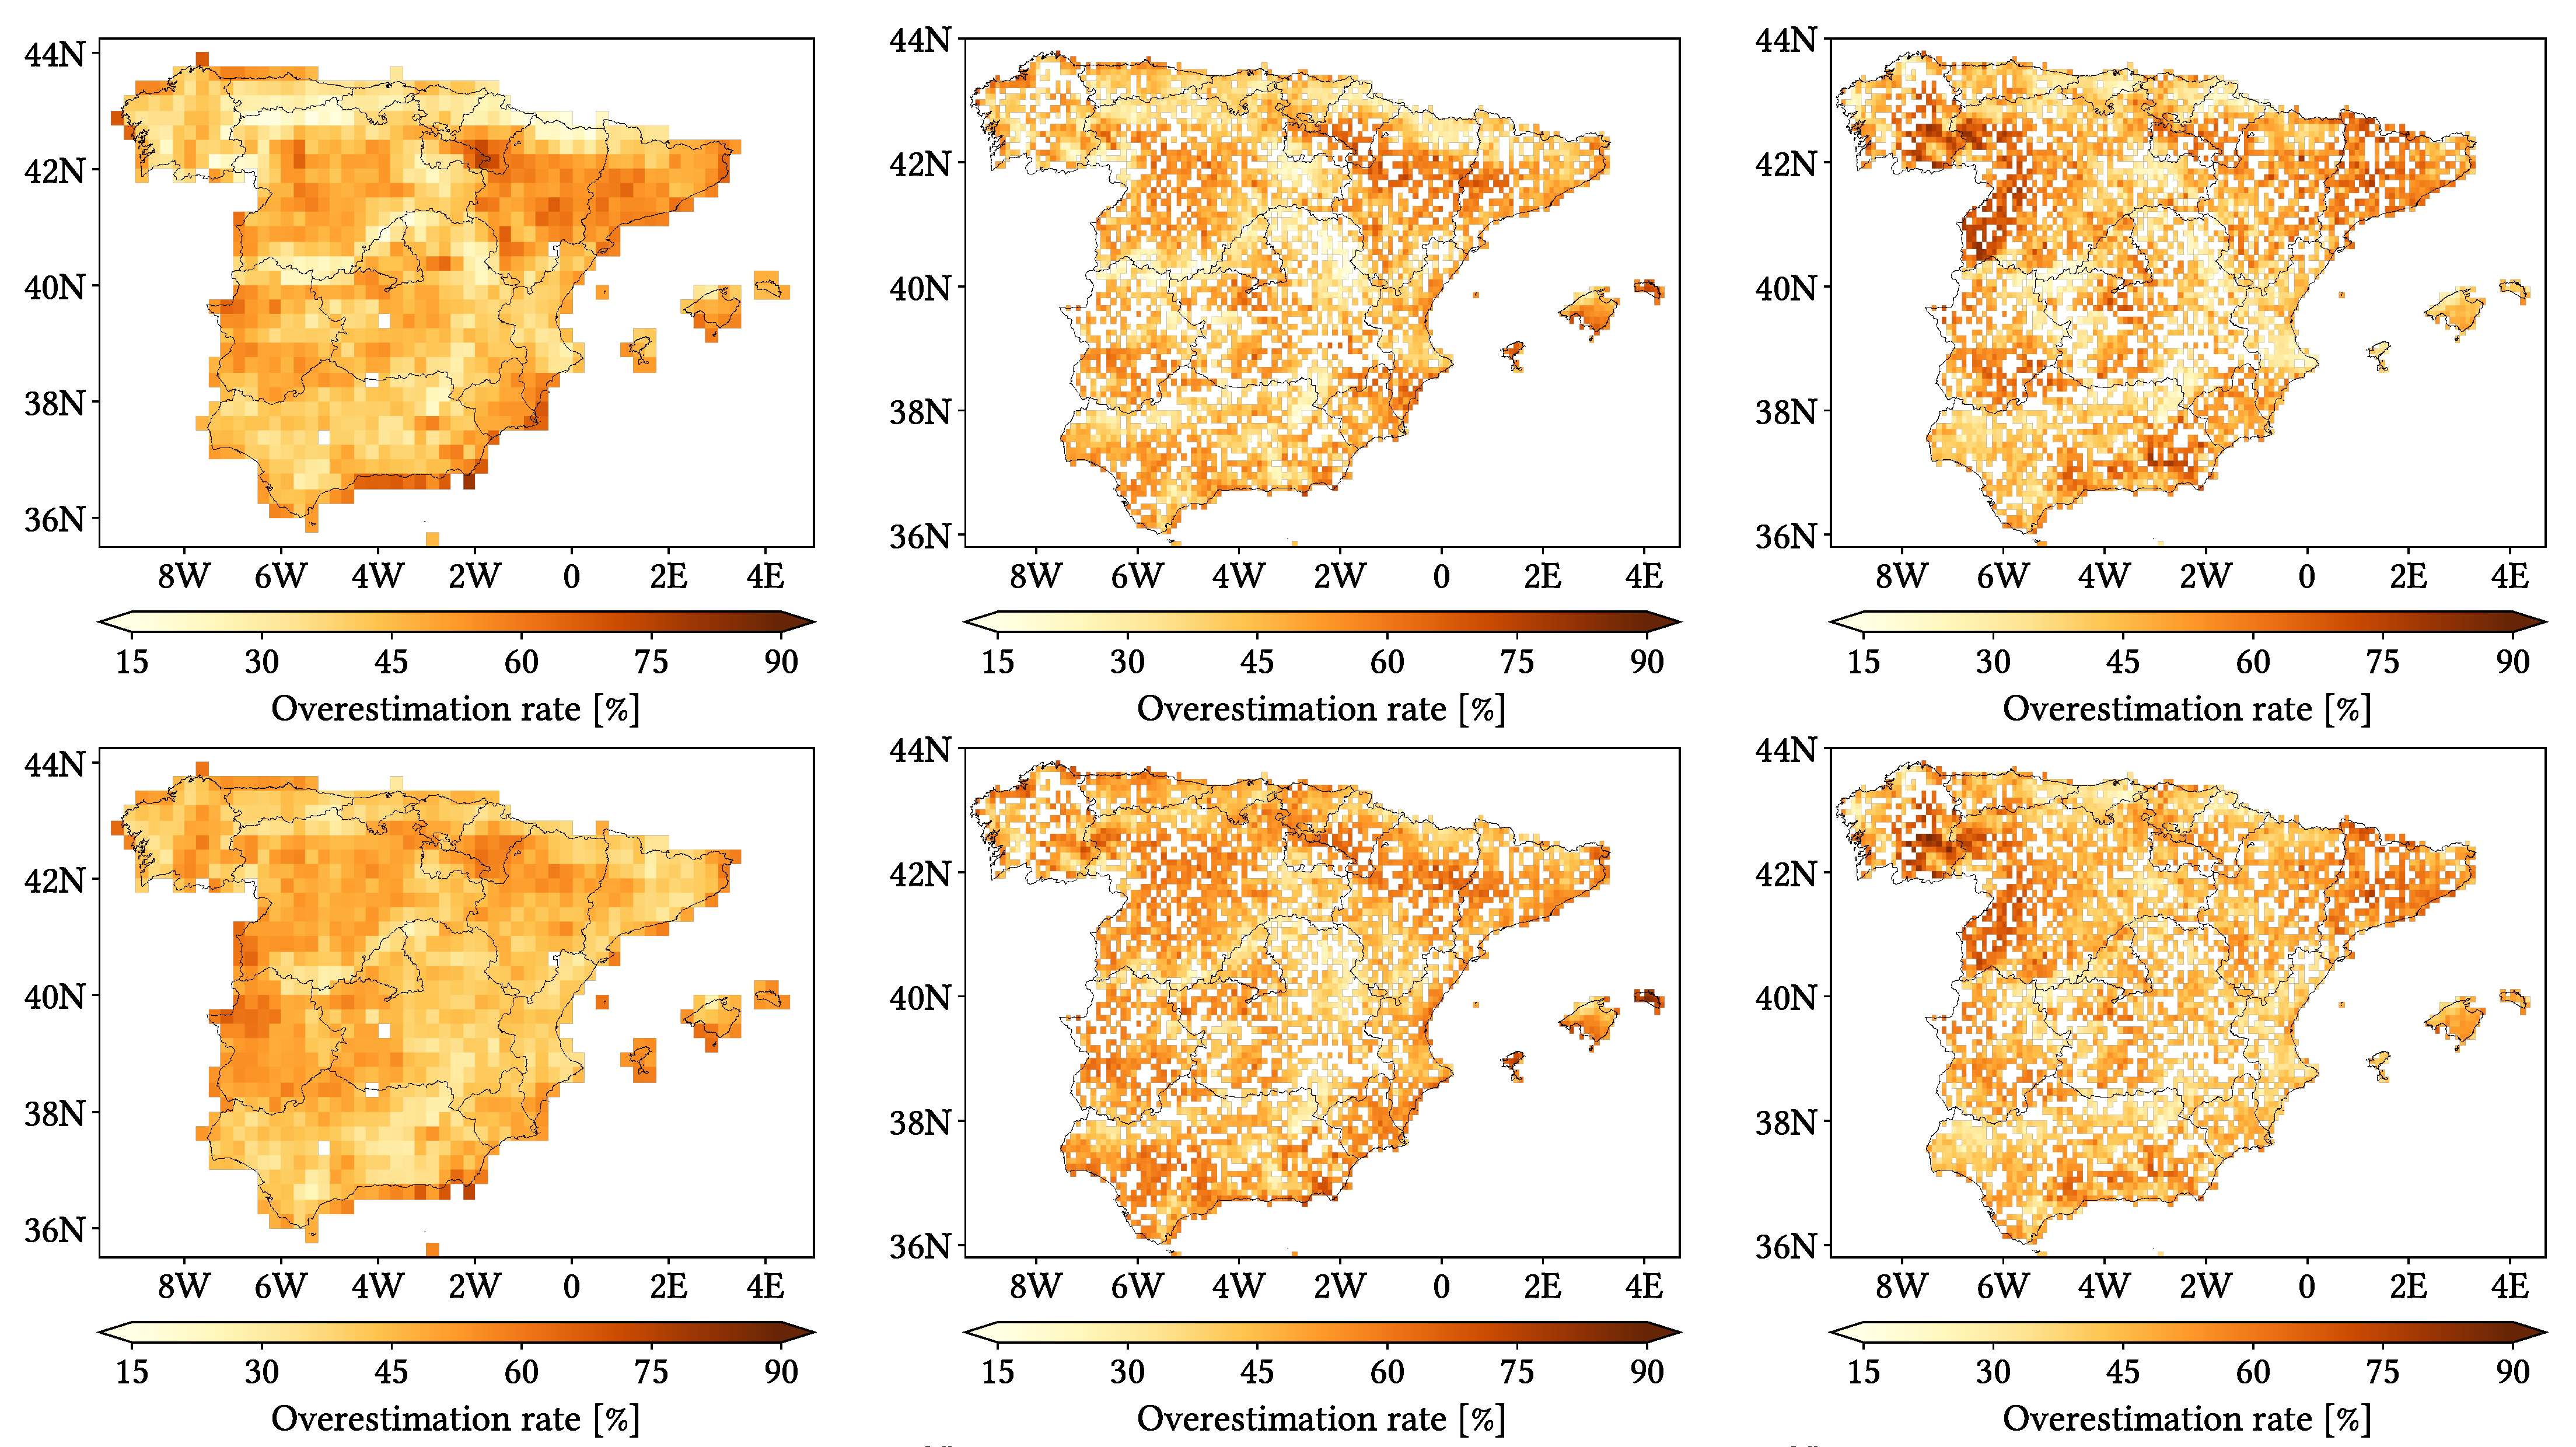
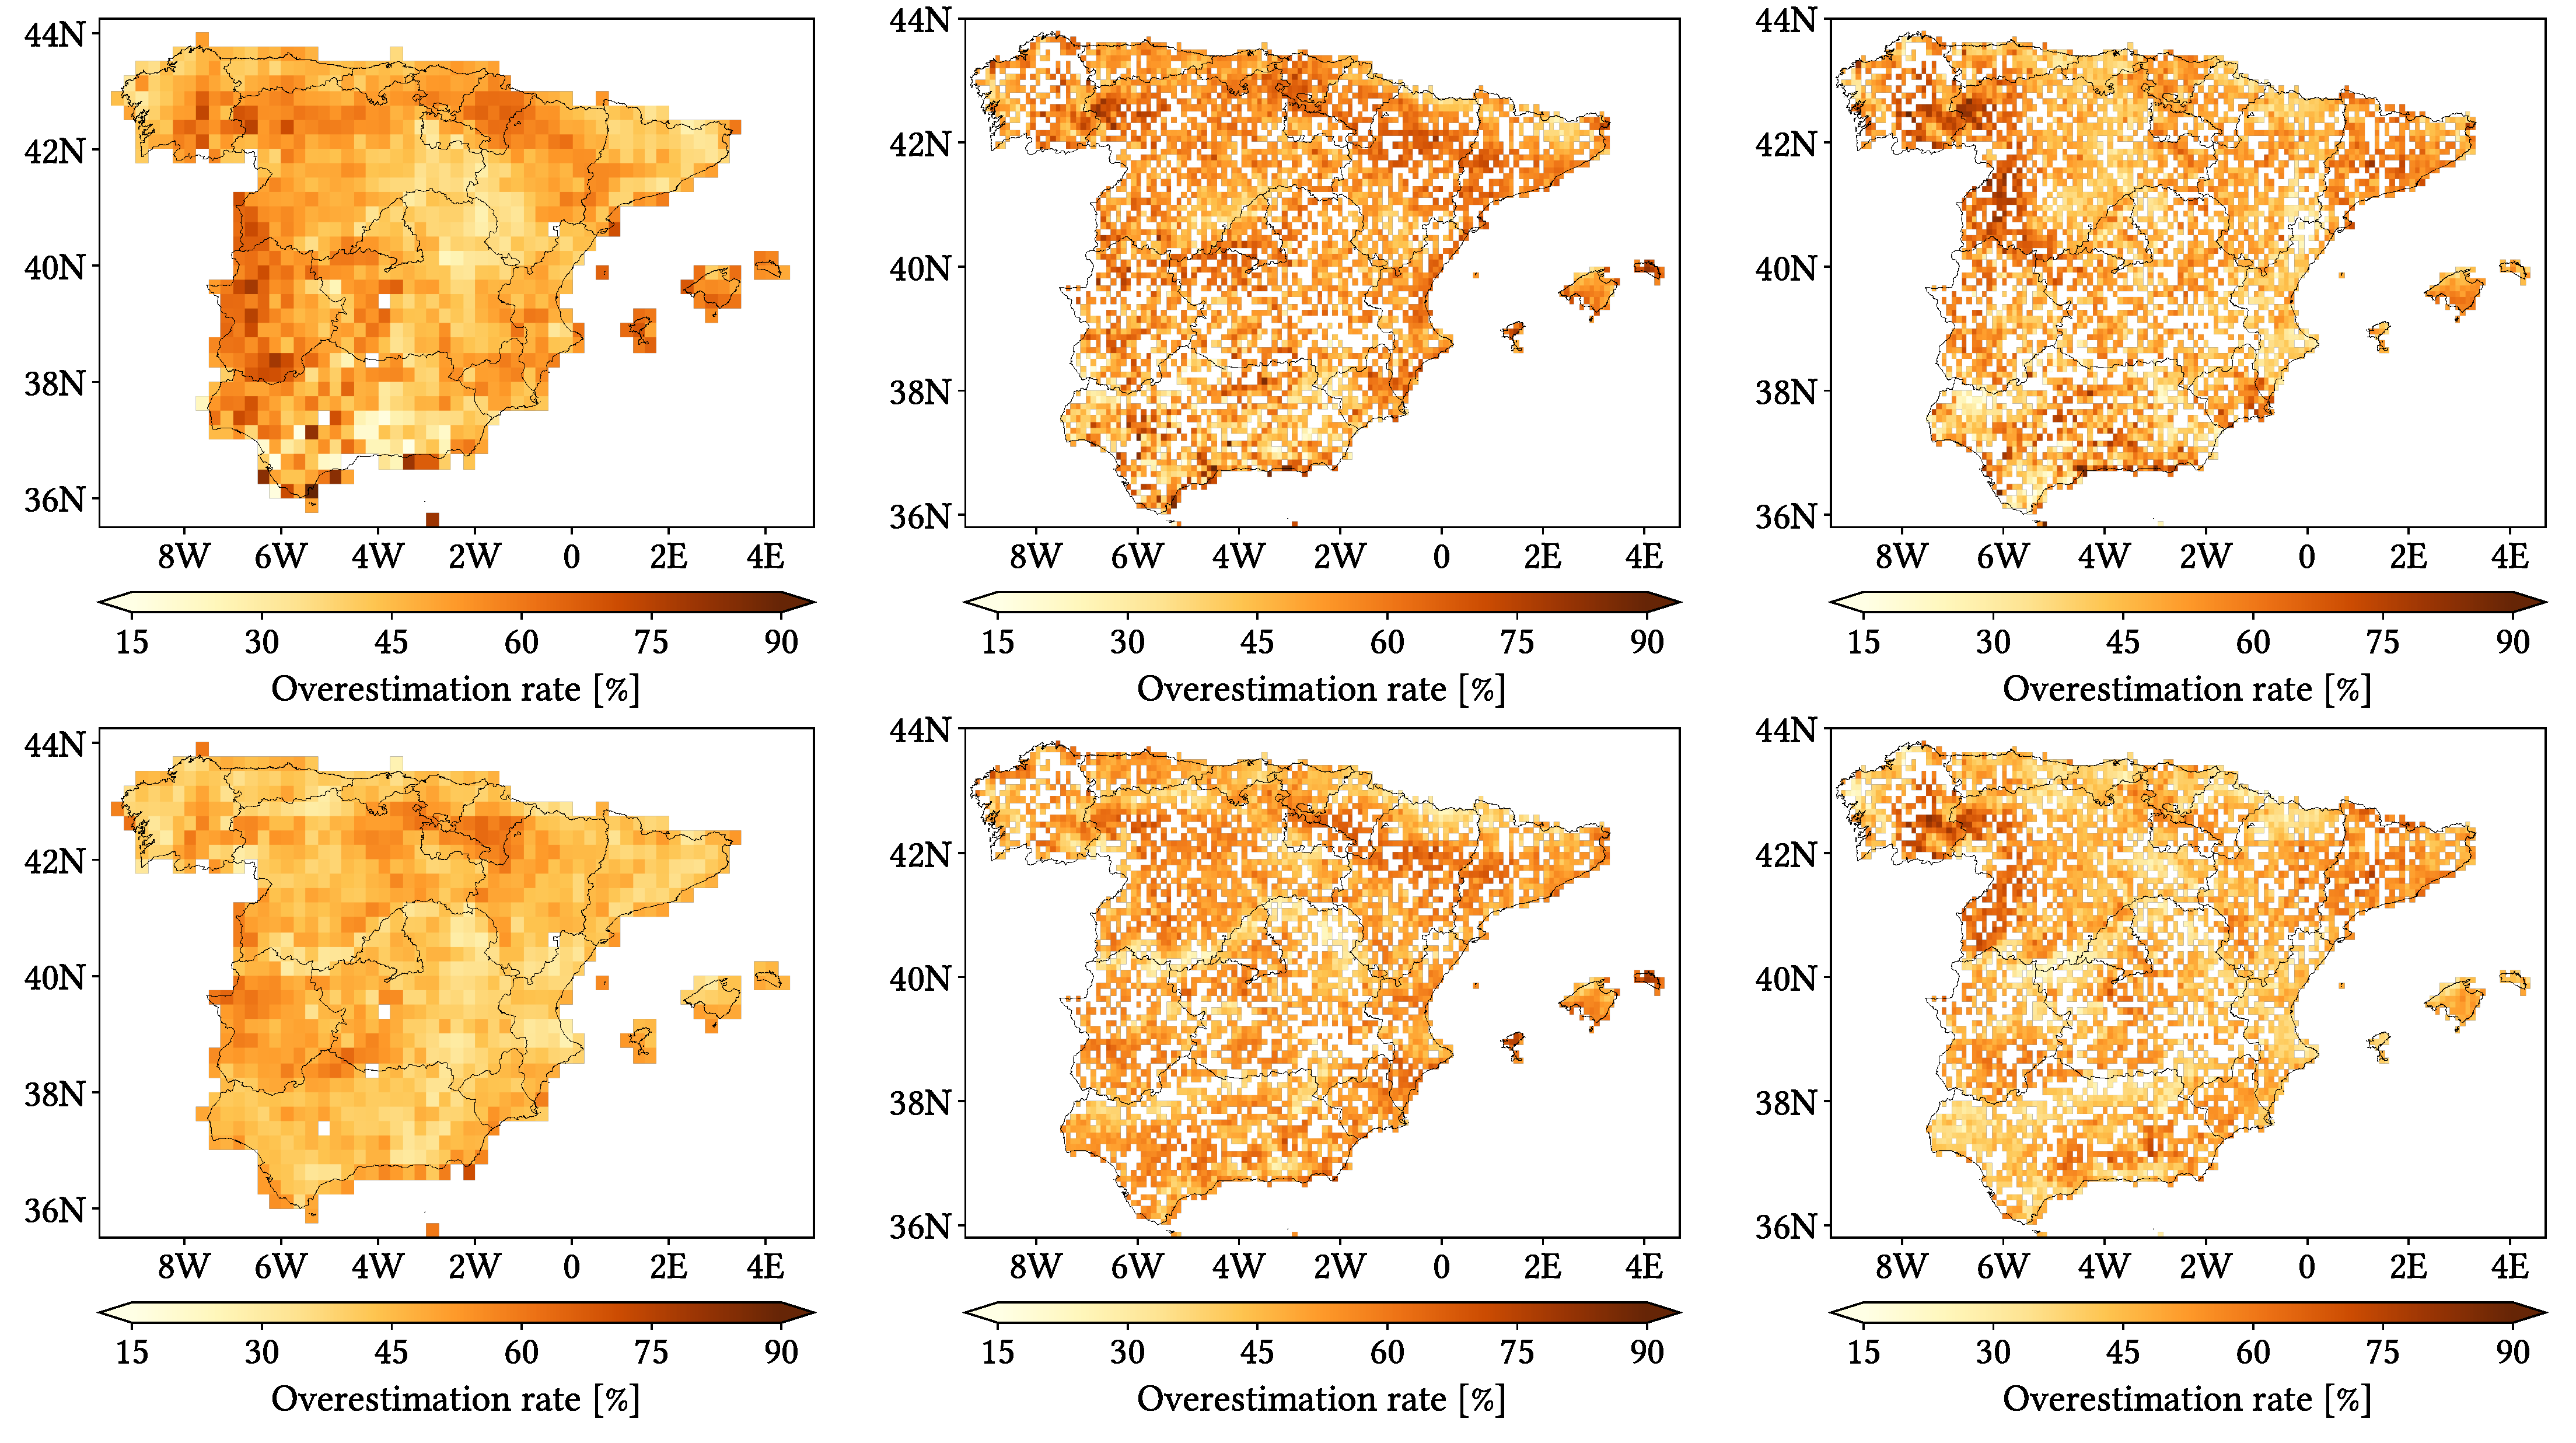
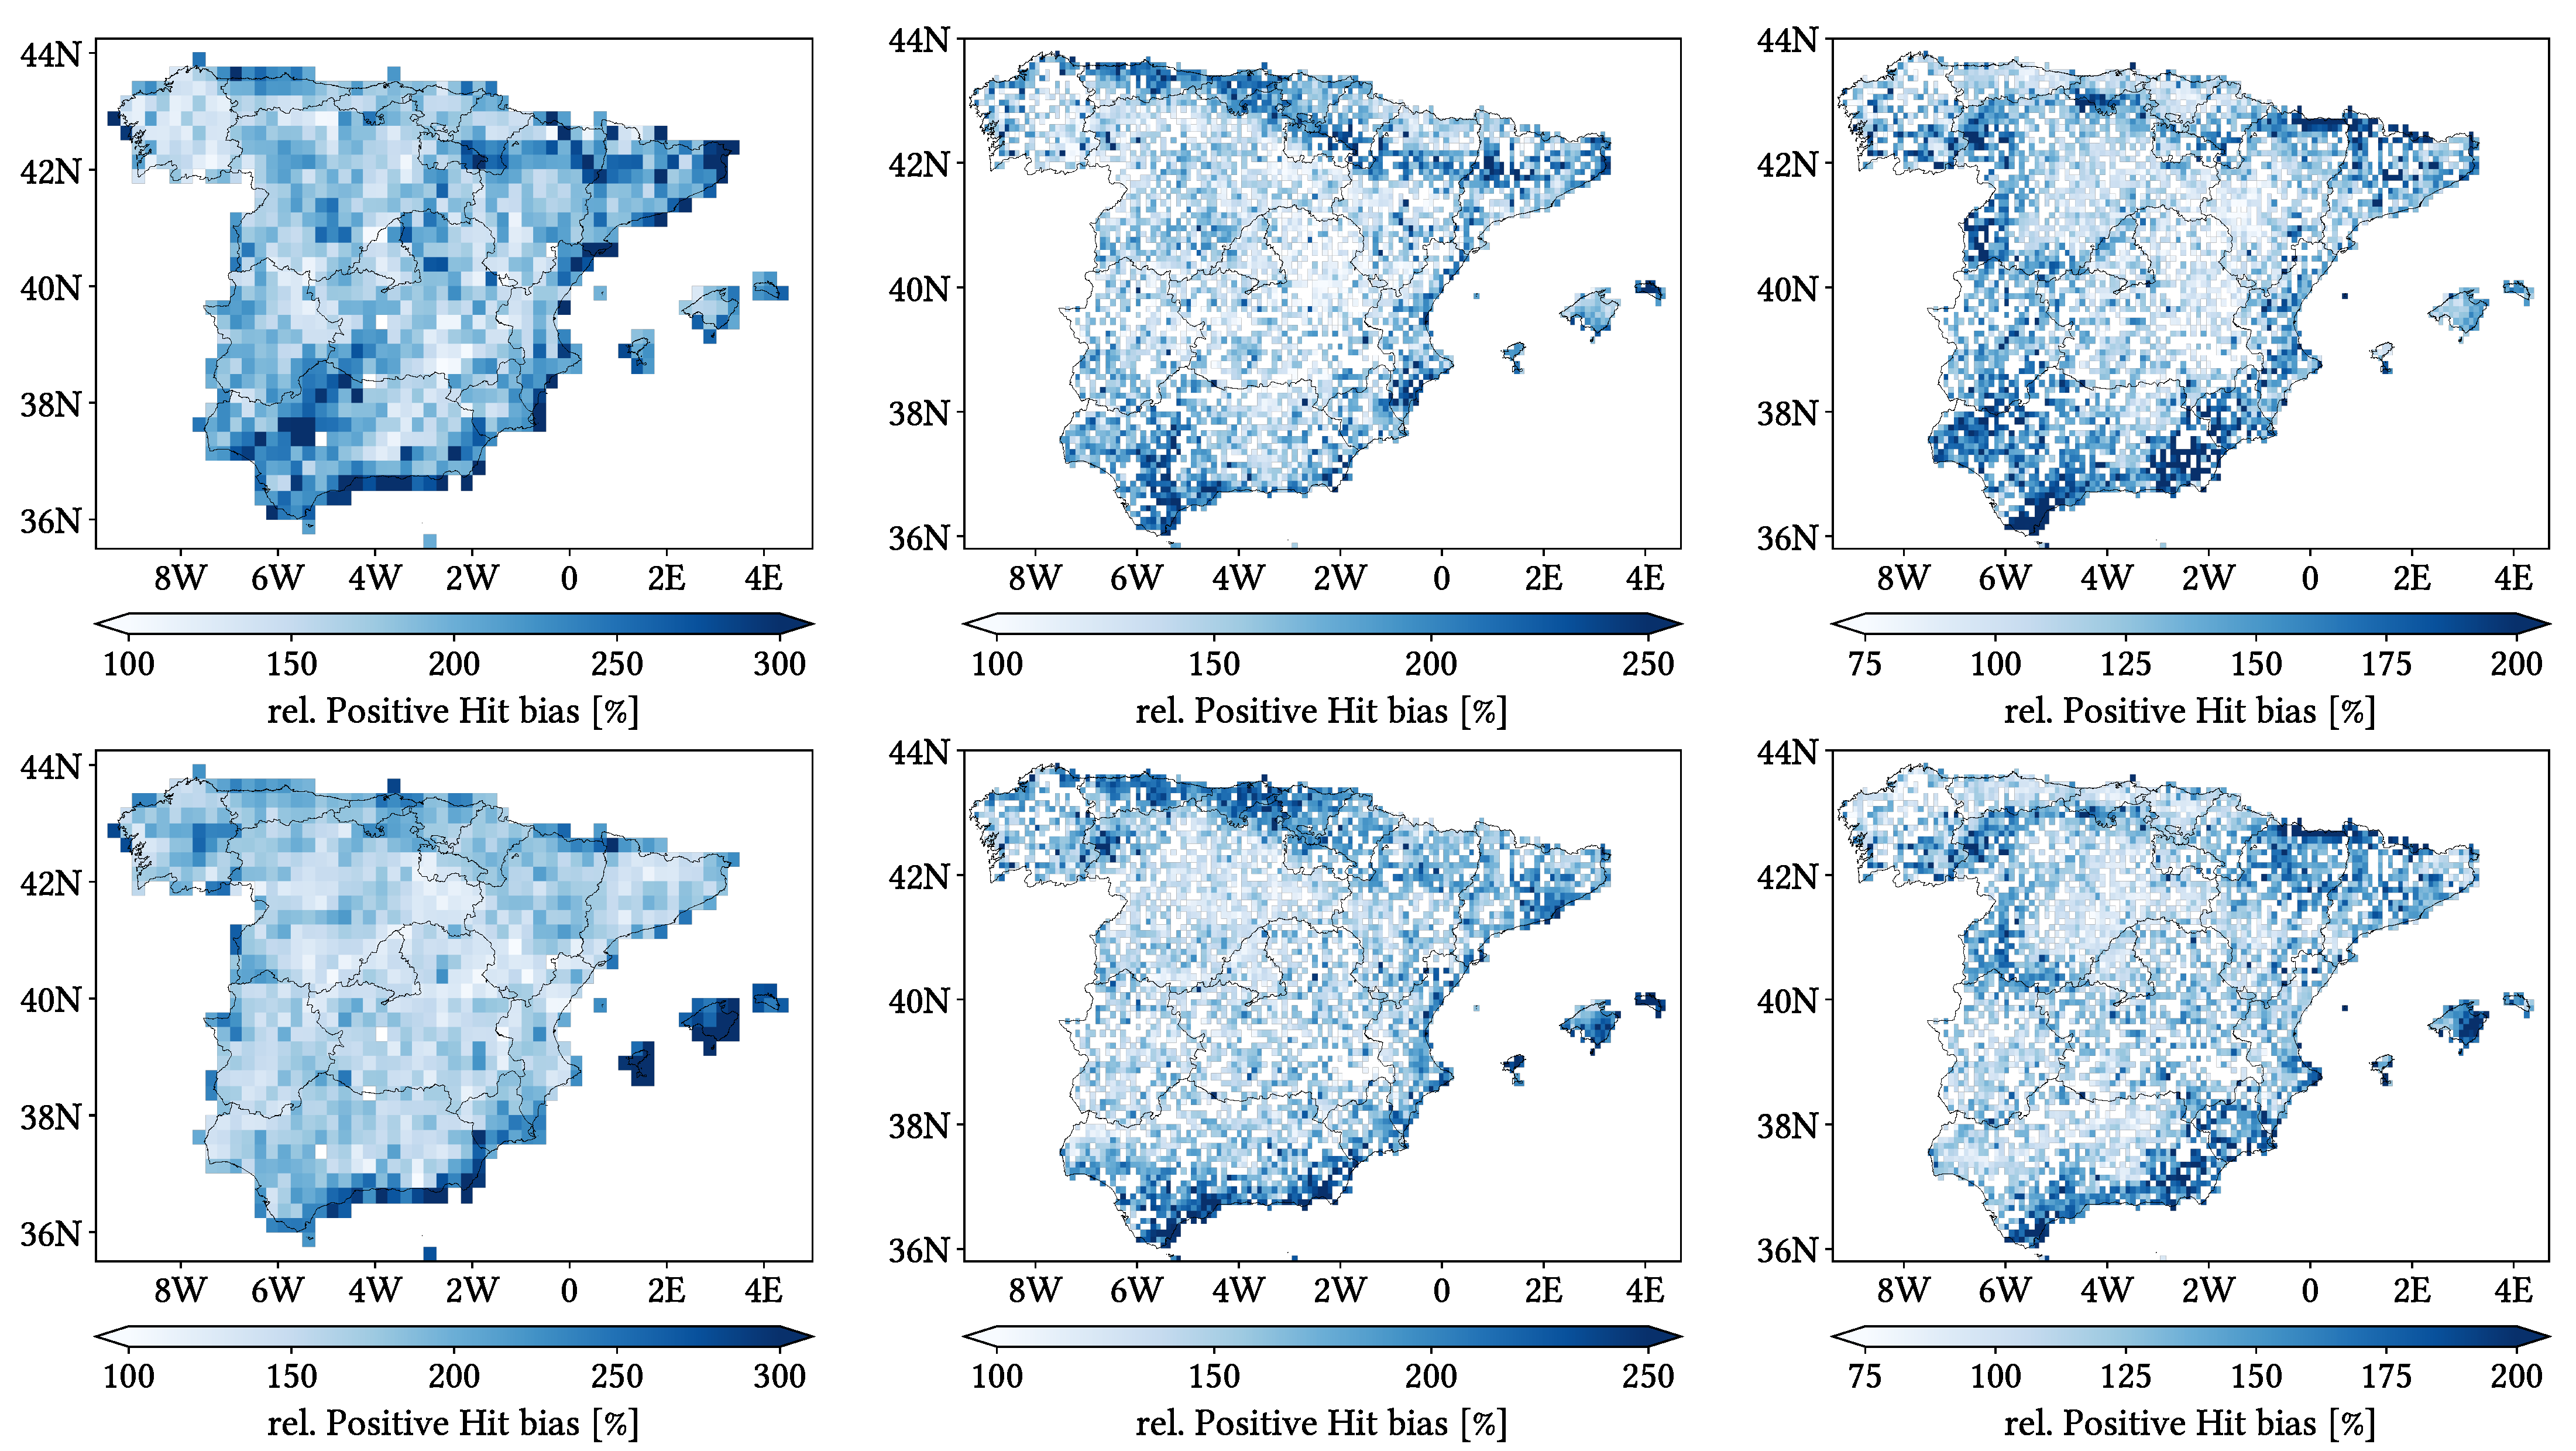
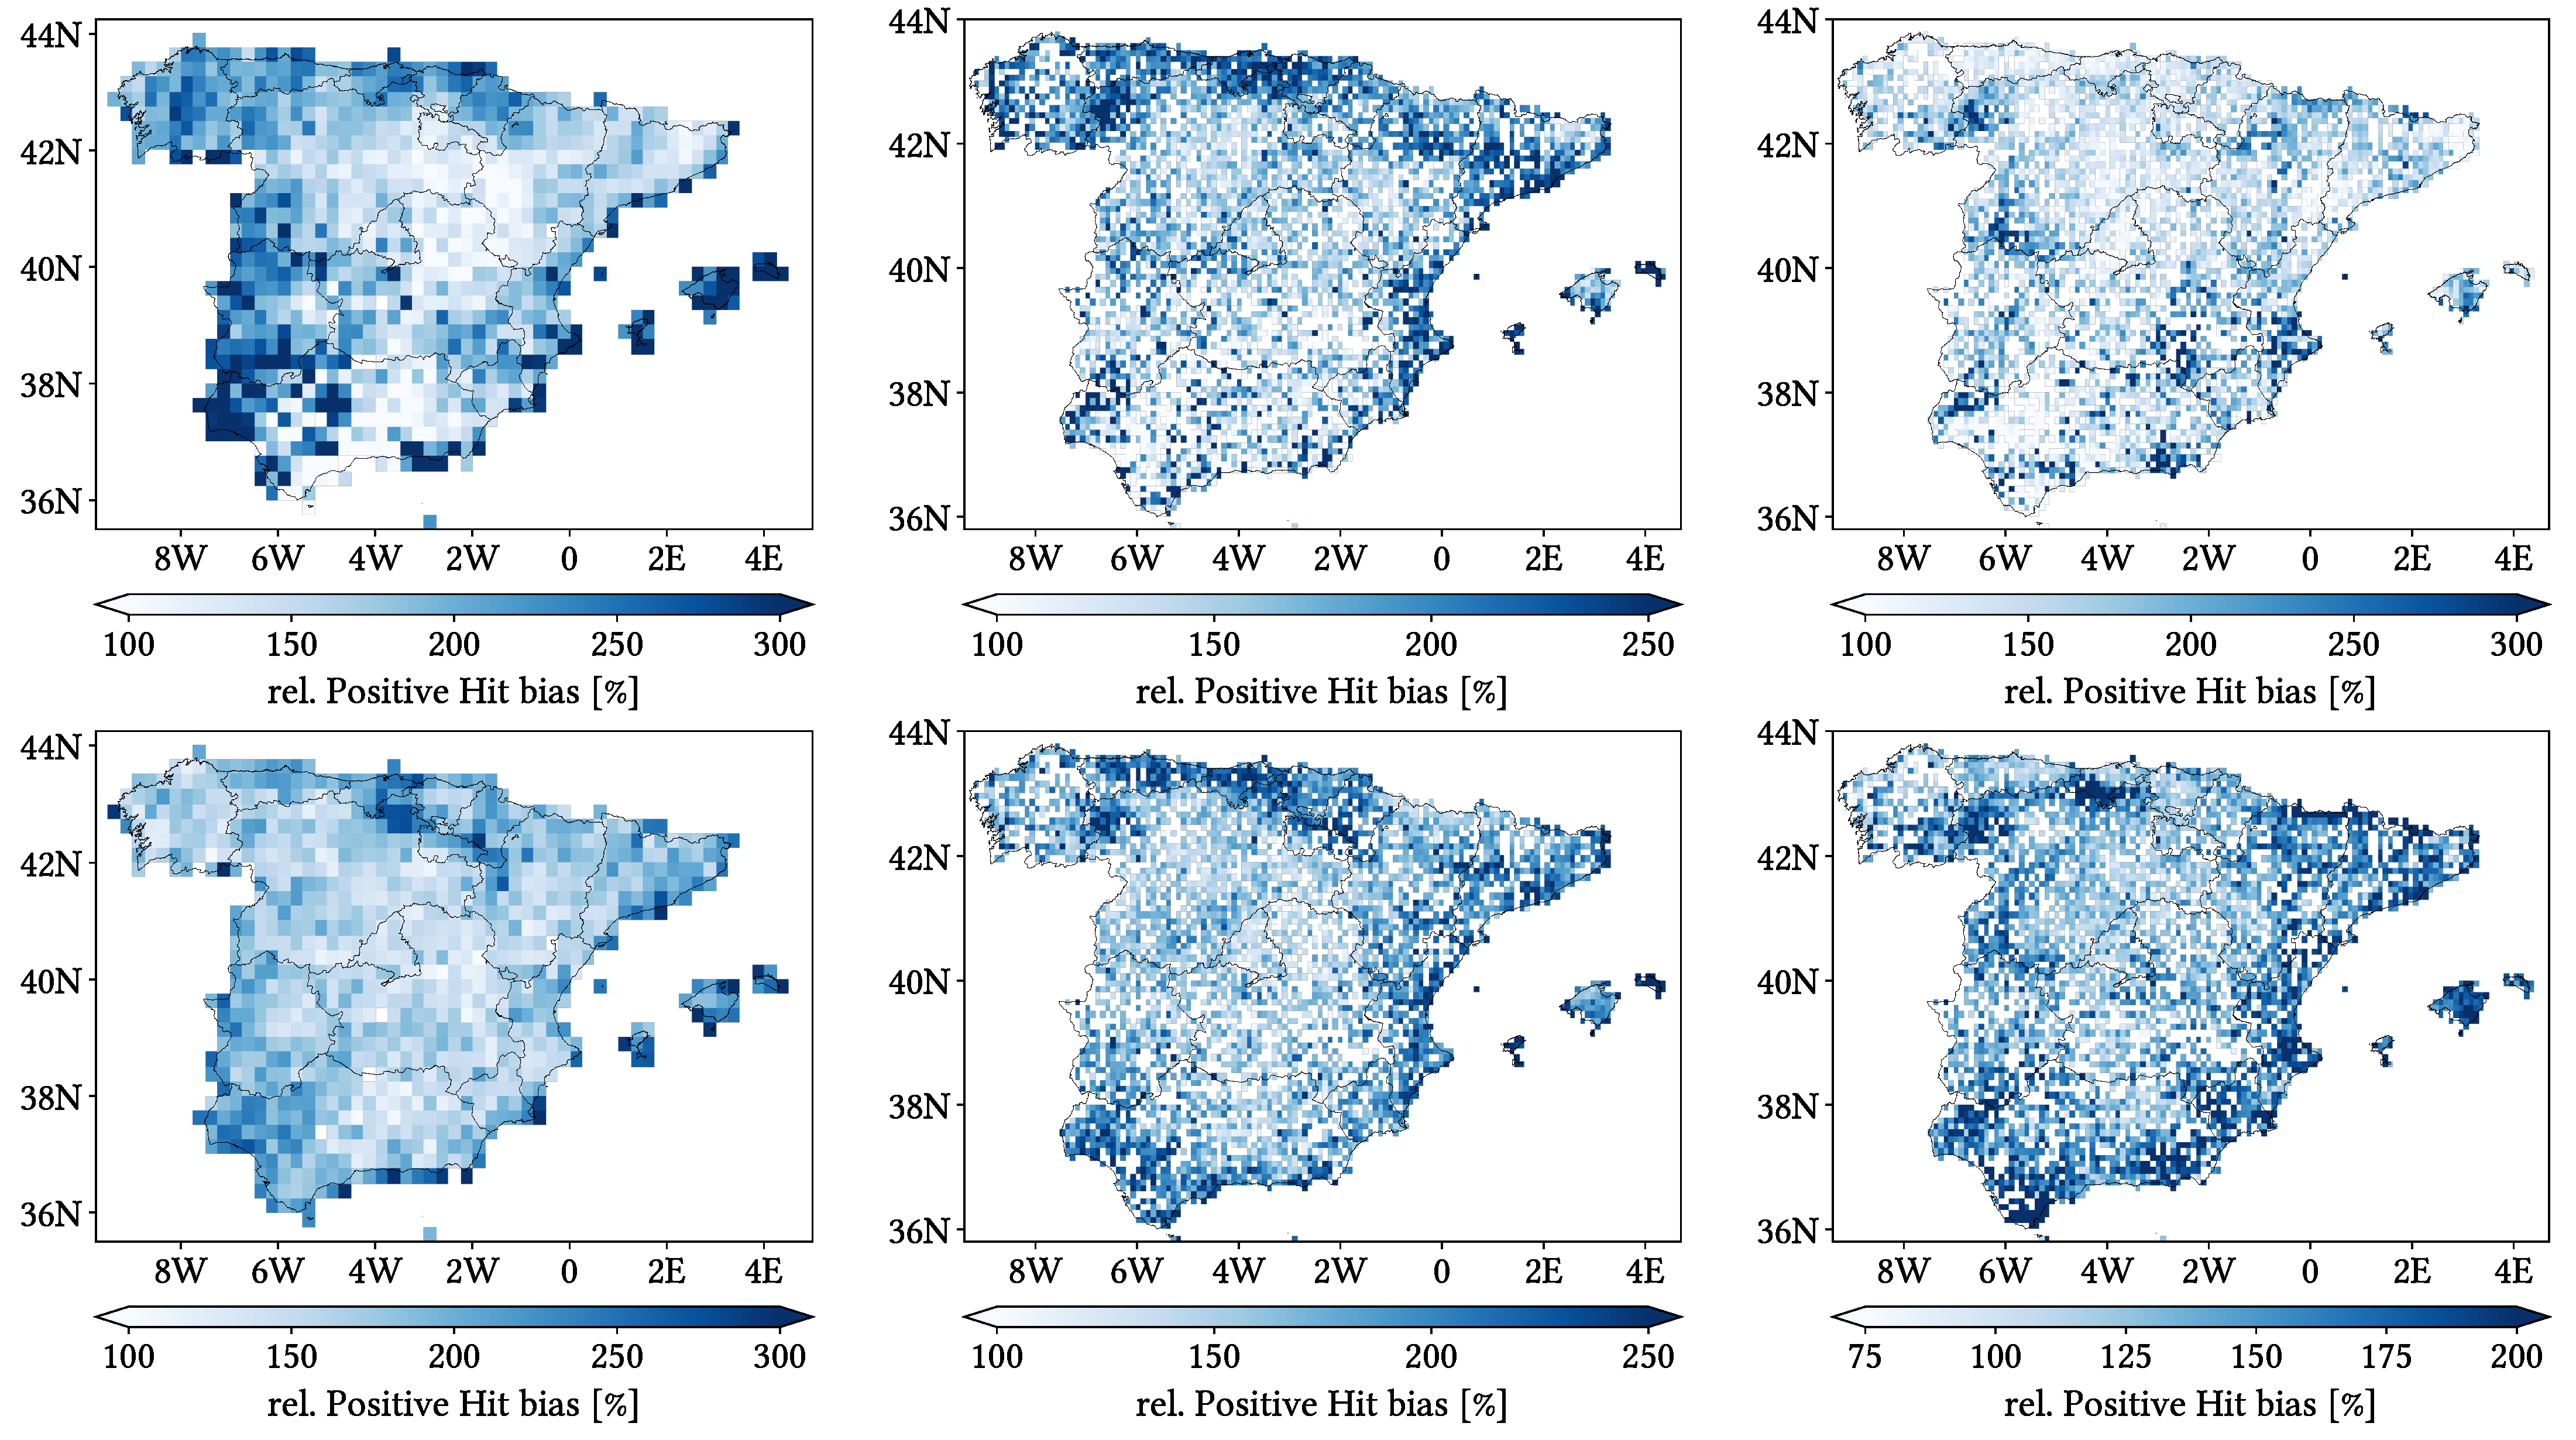
    We have included in Appendix B maps over the study region of the monthly performance metrics for the three products. Most indices follow similar spatial distributions to those from the daily comparison, even though with different values. Biggest difference takes place for HtR, POD and FAR (and consequently, Miss and False bias): at monthly scale, they present notably better values across northern Peninsula and show increasingly worse values when going south and southwest. CMORPH also becomes more problematic regarding Miss Bias and OvR at Pyrennes Cantabric and Iberian ranges, center of meridional Meseta and at Segura Basin.

    5.5. Analysis Regarding Season of Year

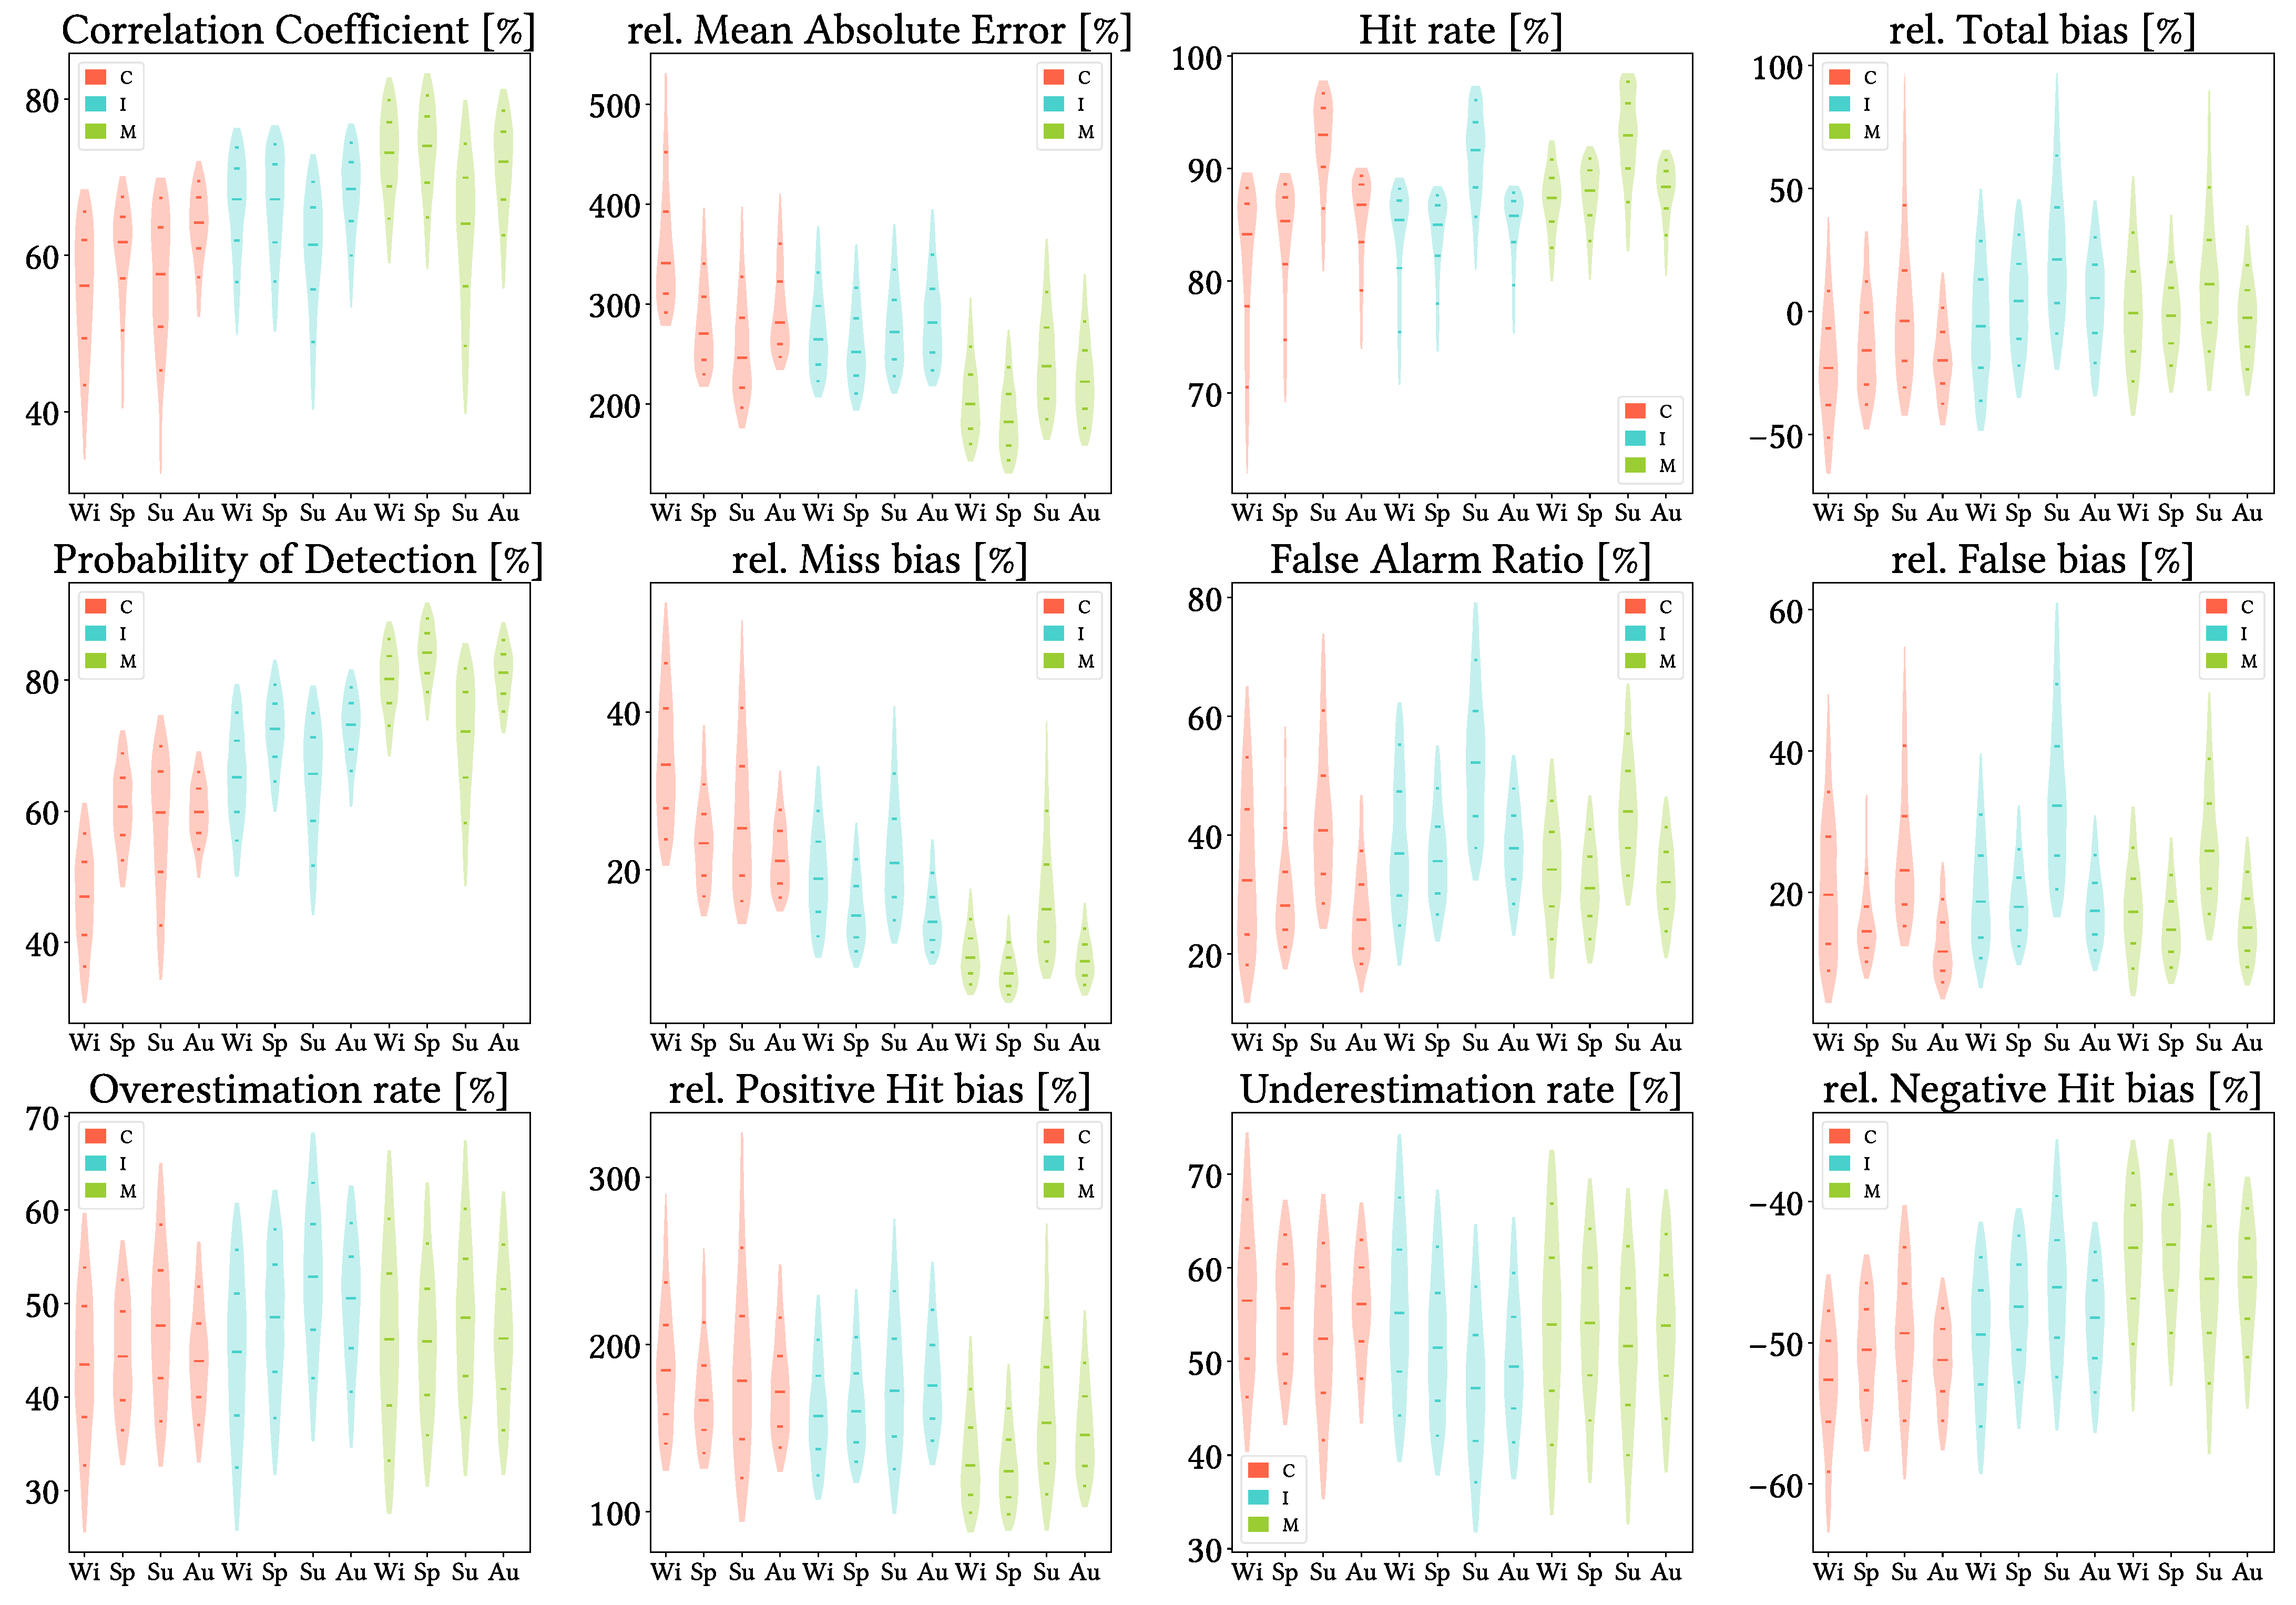
    Figure 15 shows violin plots from the analysis when grouping the data by season of year. We see again that MSWEP is the best performer for every metric, followed by IMERG. Another result is that summer season is the most divergent regarding performance, followed by winter. Summer shows, in the case of IMERG and MSWEP, the worst values regarding CC, POD, FAR and all types of biases, while winter shows the second-to-worst values for those same metrics. In the case of CMORPH, winter shows the worst values in CC, POD and Total, negative Hit and Miss bias, whereas summer shows the worst values for FAR and positive Hit and False bias; in addition, when either summer or winter show the worst values, the other one shows the second-to-worst values. The exceptional metrics are rMAE and HtR: HtR is always best for summer, whereas rMAE is worst in winter and best in summer for CMORPH, worst in autumn and best in spring (but actually very similar) for IMERG, and best in spring, second-to-best in winter and worst in summer for MSWEP. Finally, for winter, spring and autumn, CMORPH and IMERG underestimate more frequently (greater UdR values), and vice versa for summer. MSWEP shows approximately the same rates of underestimation and overestimation across all seasons.
    We have included in Appendix C maps of all metrics for all seasons for the three products at once. The most relevant finding is that winter, spring and autumn follow very similar patterns to those found in the global analysis (more or less accentuated depending on the metric), while summer generally presents a different one. For all three products, HtR shows a latitudinal gradient, with worst values towards the north. POD and FAR also show latitudinal dependence, but reversed, not as accentuated and with some exceptions (POD gets worse across north-eastern Peninsula and northern littoral for CMORPH and IMERG and FAR is also slightly worse across the Ebro basin for all products). Regarding CC and rMAE, CMORPH distributions for summer show better performance across Septentrional Meseta, Iberian range and inner Ebro basin, and worse performance the further away from these regions. IMERG and MSWEP summer patterns for CC are different from each other and from that of CMORPH, with no clear criteria, whereas their summer patterns for rMAE are similar to their autumn patterns (with better performance across the southern littoral for IMERG and worse performance across the Segura basin and the southwestern limit of the Septentrional Meseta).
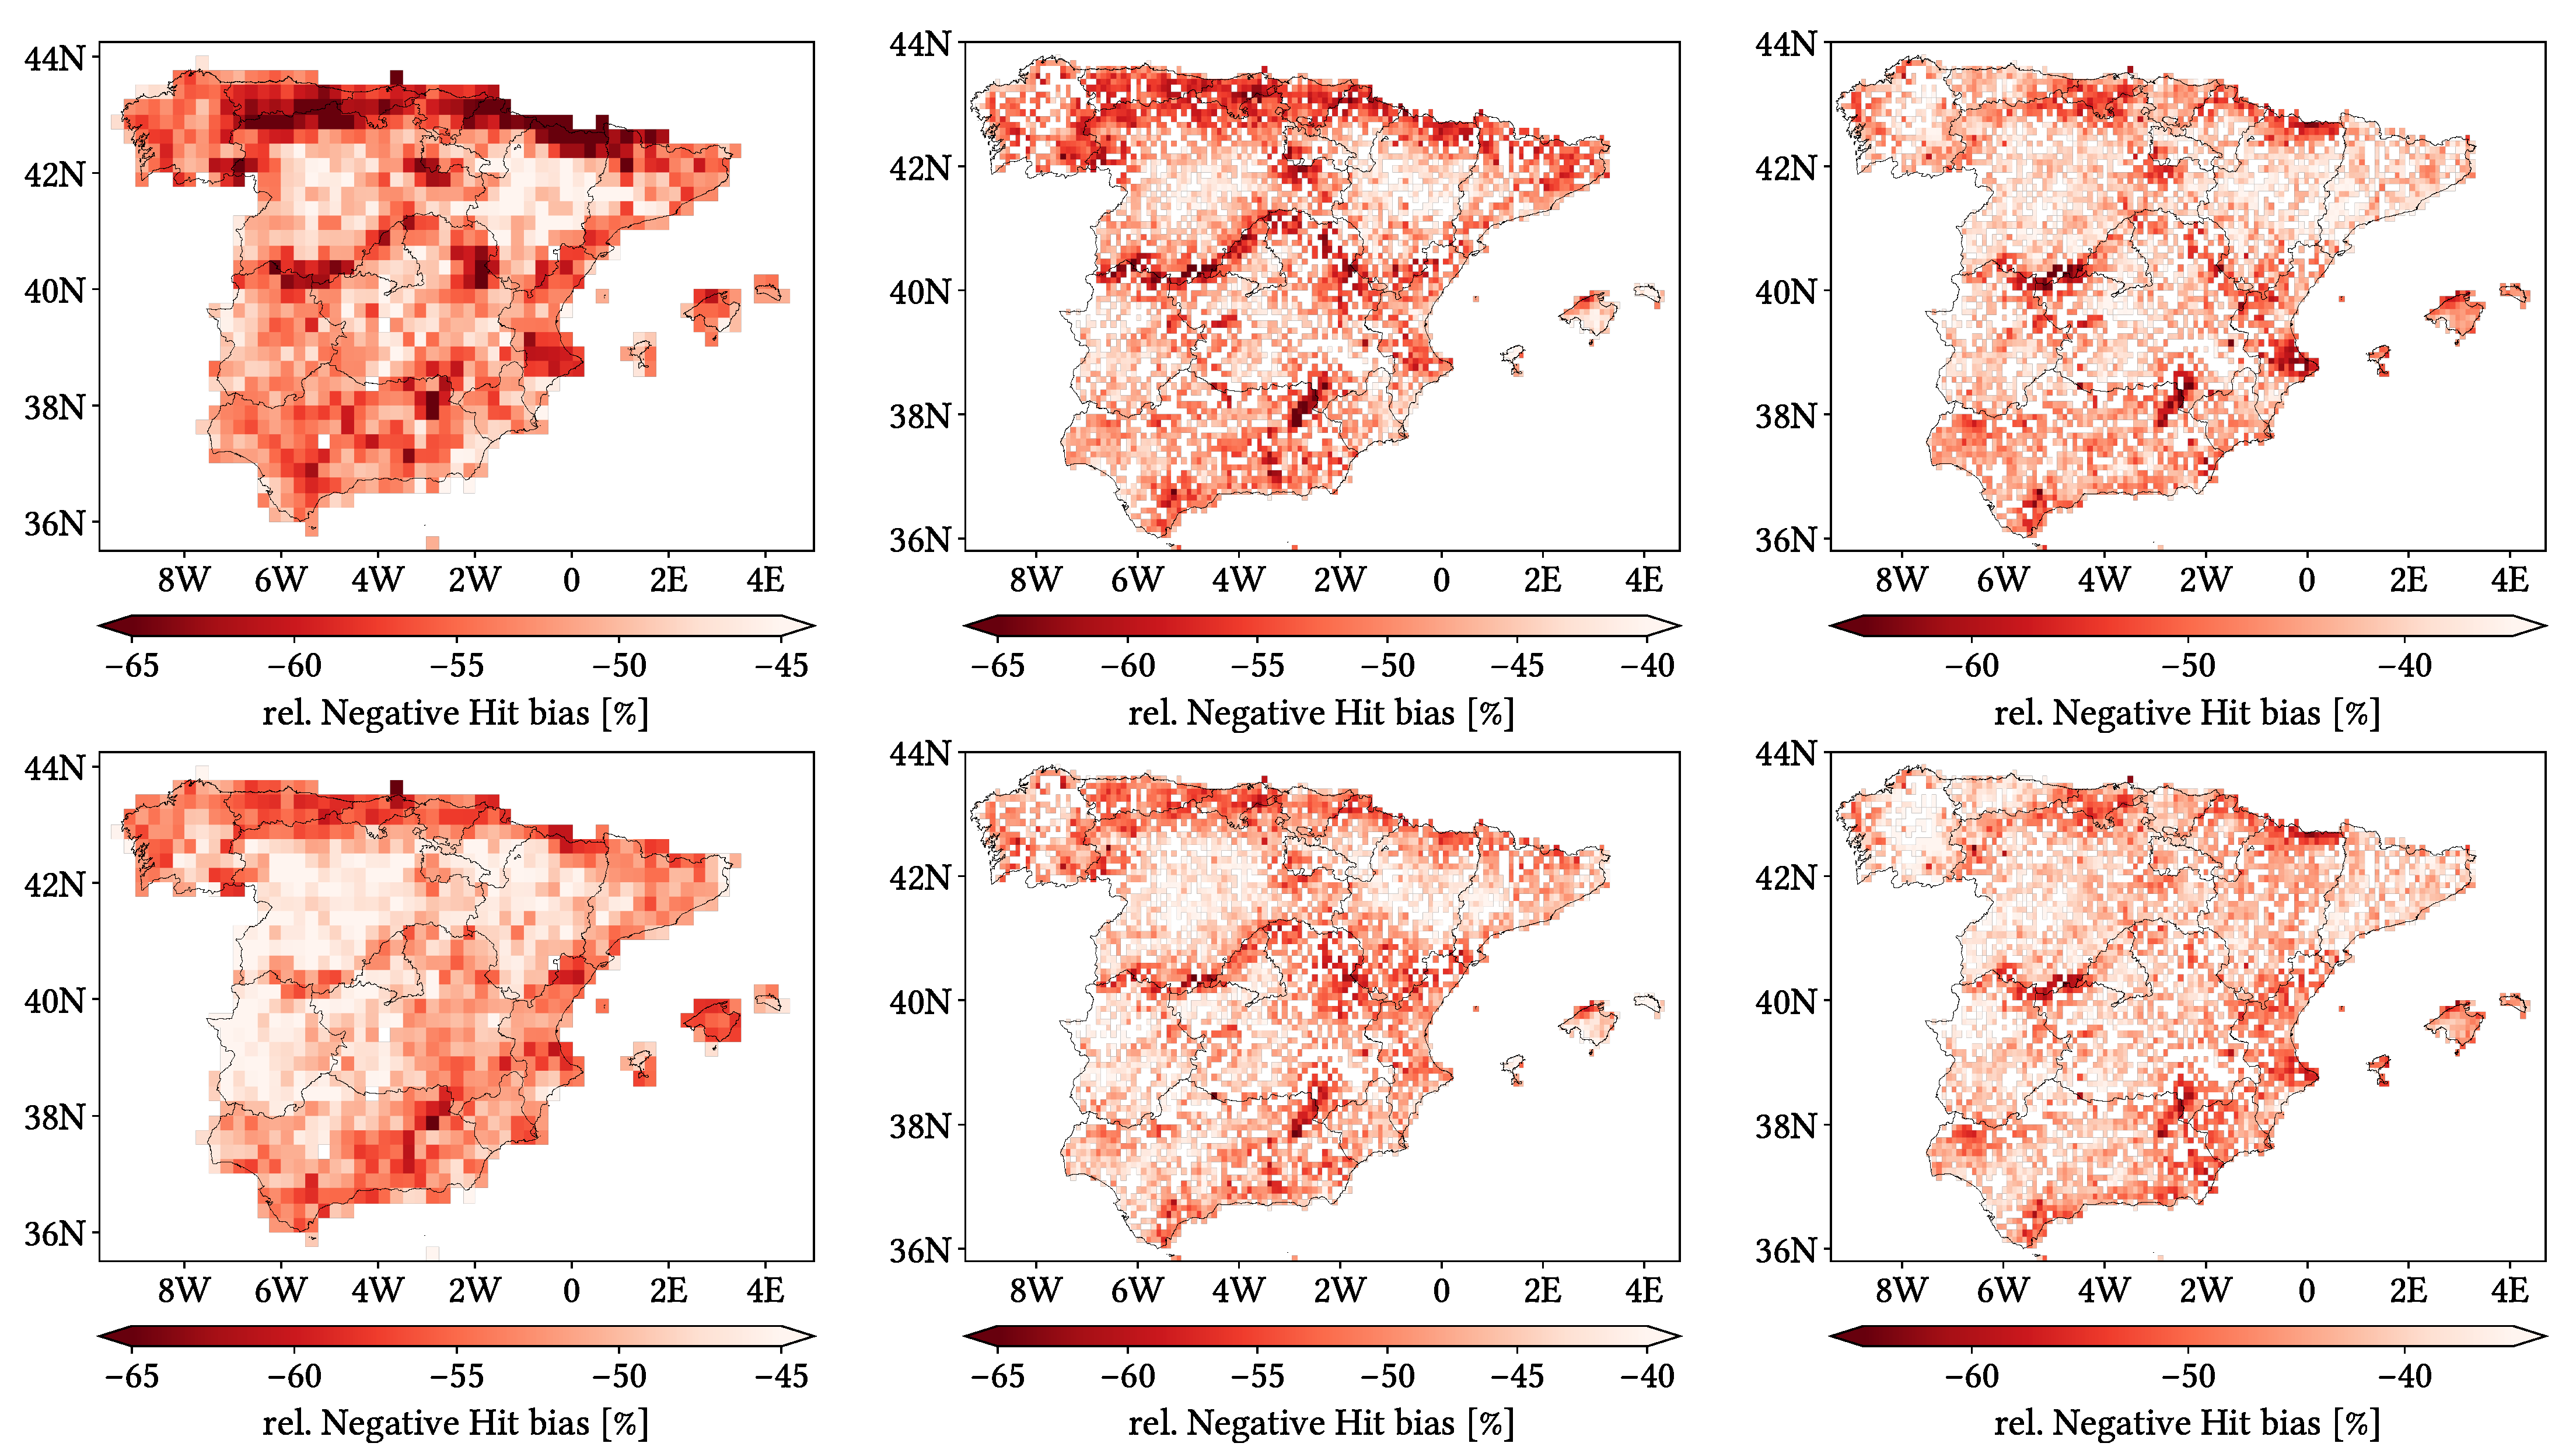
    Regarding Total bias, summer pattern for IMERG is not as different from the other seasons (mainly increased overestimation in the overestimation zones), while CMORPH and MSWEP show notably increased overestimation across different parts close to the frontier with Portugal. This can be seen in the pattern for positive Hit bias in the case of CMORPH, but not in the case of MSWEP. Indeed, positive Hit bias follows similar patterns to those from rMAE in the case of IMERG and MSWEP. Negative Hit bias patterns are stable through all seasons and follow those from the global analysis (even though CMORPH performs notably worse in some regions along the southern littoral). Finally, OvR patterns align with those of Positive Hit bias, UdR patterns are similar across all seasons to those of the global analysis and again False and Miss bias follow the same seasonal patterns as FAR and reversed POD.

    5.6. Analysis Regarding Reference Precipitation Intensity

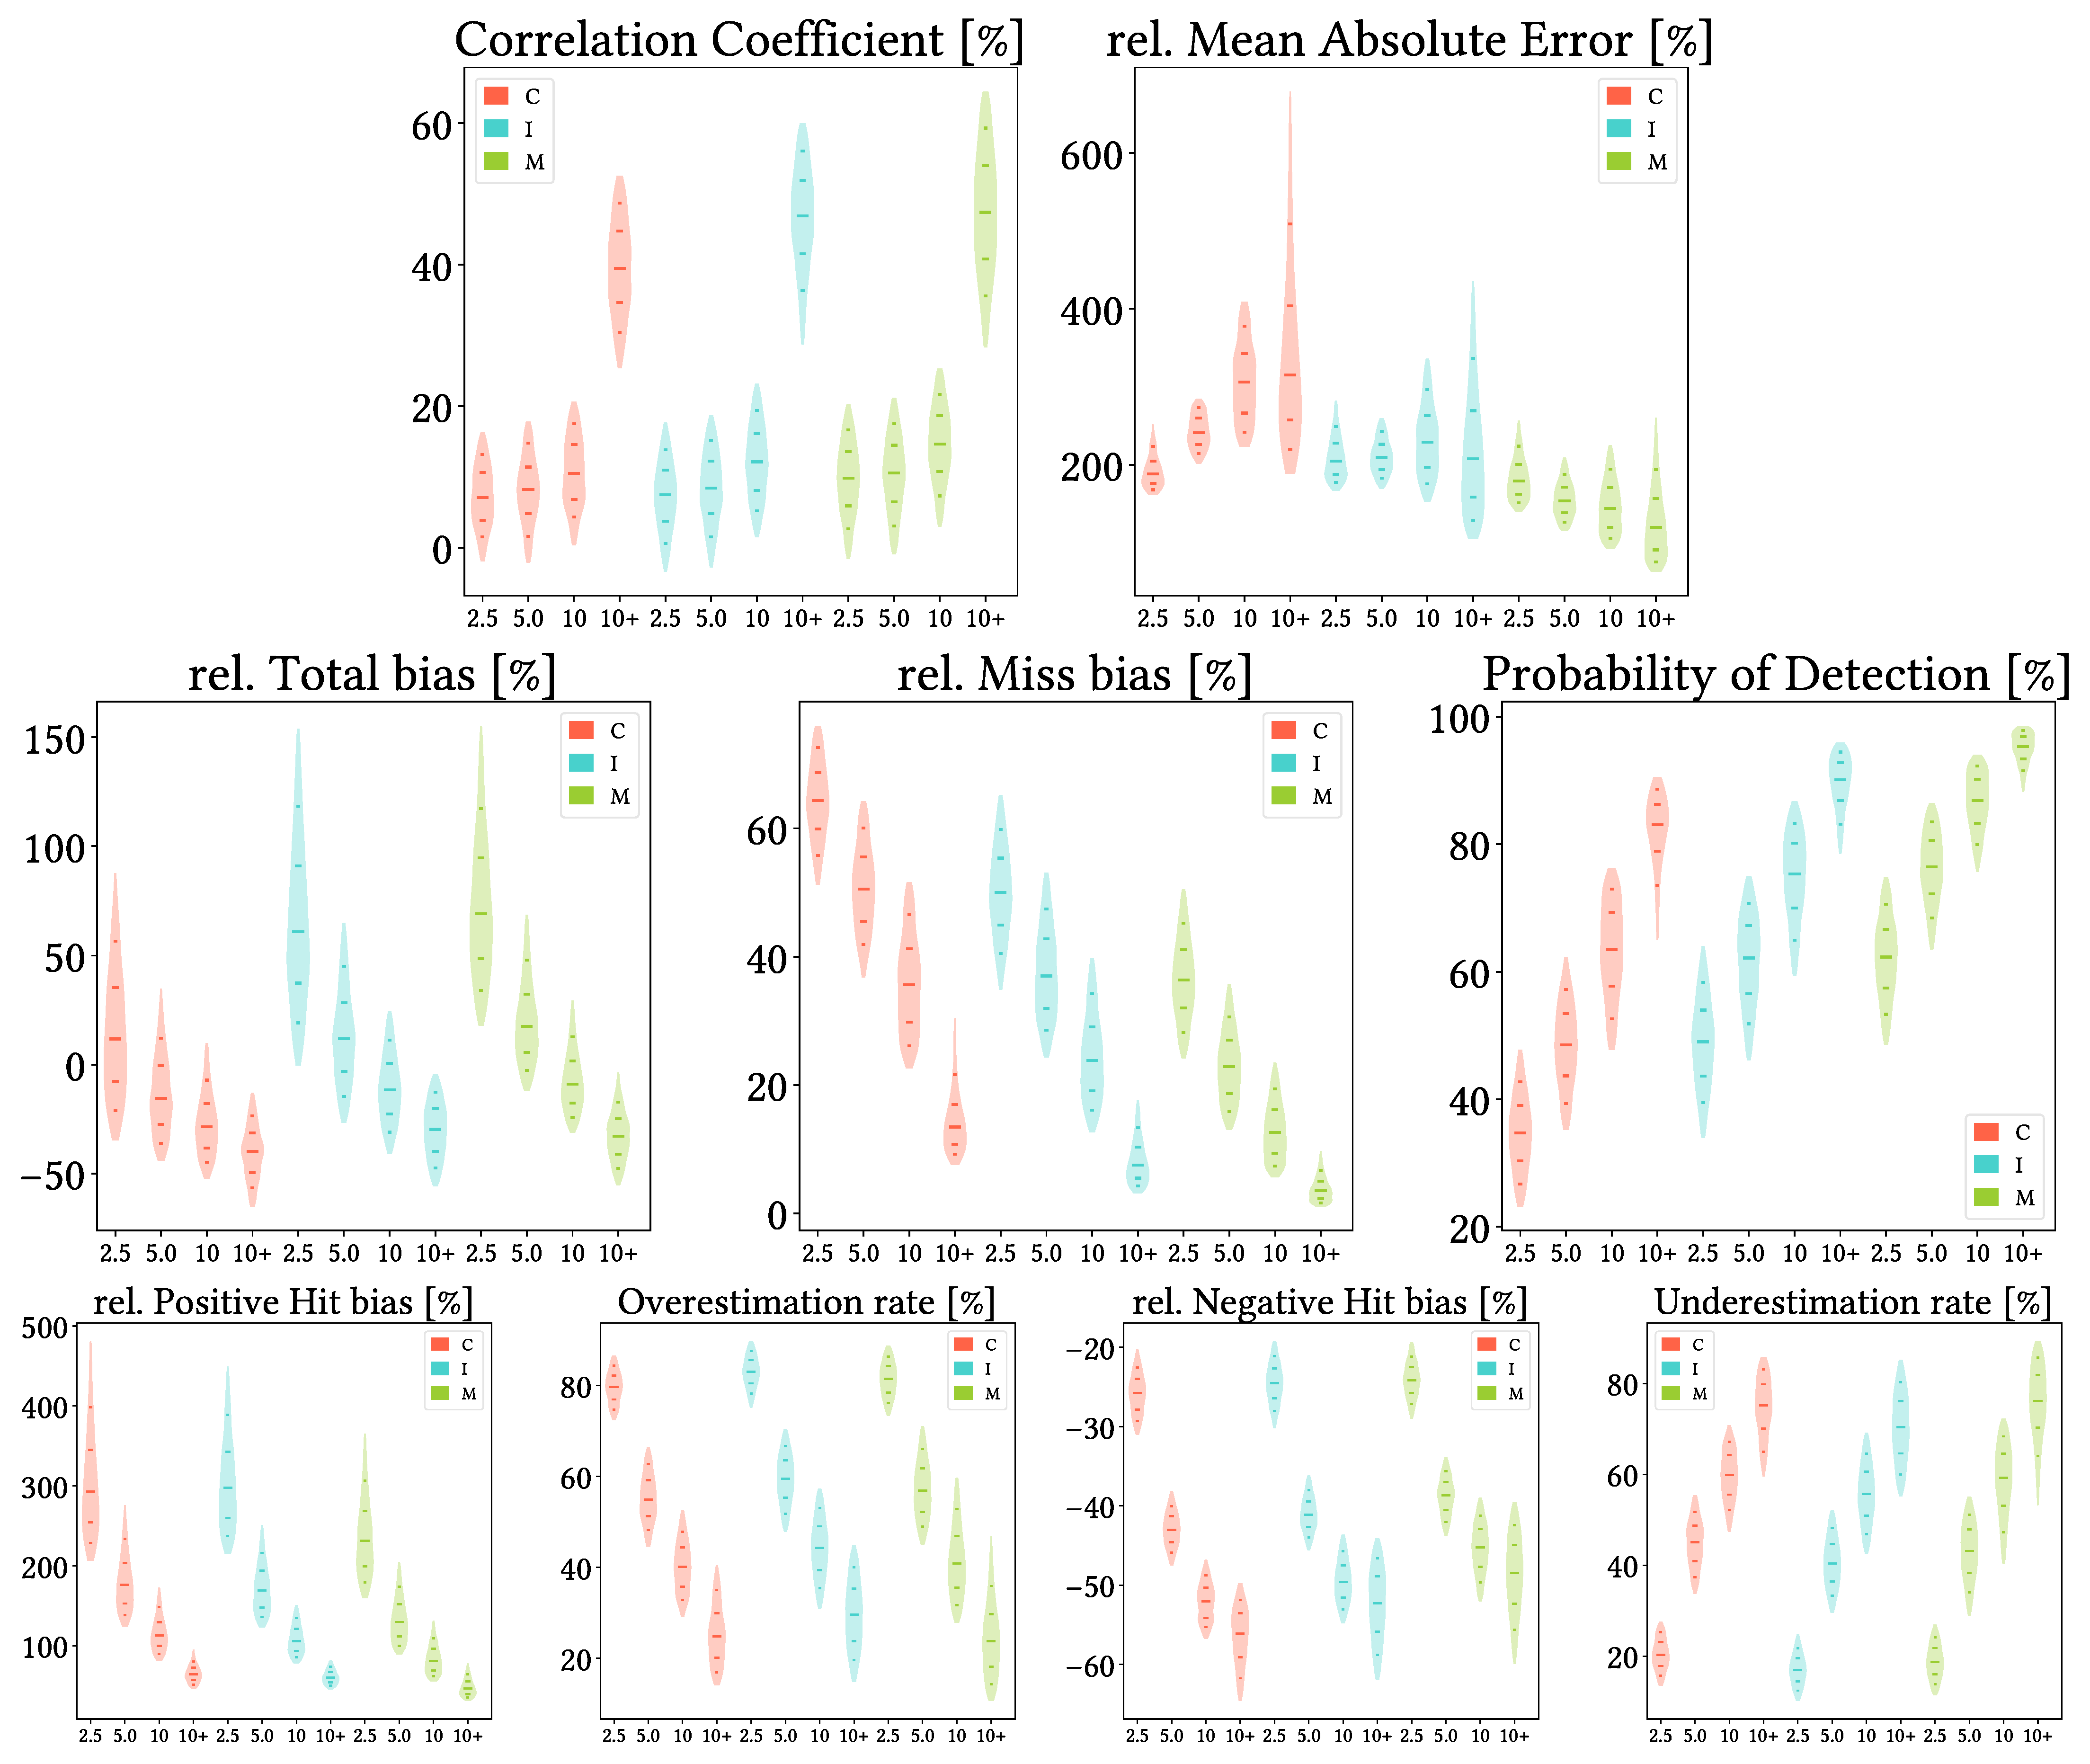
    Figure 16 shows violin plots from the analysis when grouping the data by intensity intervals based on approximate pixel-wise quartiles from the reference gauge data, once ignoring dry days. Due to their definition, neither FAR nor False bias can be defined (if the reference reports at least the minimum threshold, there cannot be false precipitation). In addition, HtR equals POD for this analysis (we only focus on days with detected precipitation and so correctly reporting wet or dry days reduces to just correctly reporting wet days), and thus HtR boxplots were redundant. Furthermore, to avoid showing excessive and not fully relevant data, we will not show associated maps, as either they did not show clear spatial patterns or they showed the same ones from the overall analysis.
    First, on all products, CC slightly improves for increasing intensity and notably improves for the fourth quartiles. Second, as expected, POD improves with increasing intensity on all products, and consequently so does Miss bias (i.e., heavier precipitation is easier to detect than lighter precipitation). An interesting finding is that all products increase their underestimation with increasing intensity. This can be first seen through Total bias and confirmed though the Hit biases and their rates: both Positive Hit bias and OvR decrease with increasing intensity, and vice versa for Negative Hit bias and UdR. Once again, Negative Hit bias is smaller but more common than Positive Hit bias. Finally, rMAE shows different behaviour for each product: it increases steadily along precipitation intensity for CMORPH, it is slightly worst for the third quartiles in the case of IMERG and it decreases along intensity for MSWEP.

    5.7. Analysis Regarding Altitude and Orographic Complexity

    Figure 17 shows results from the analysis when grouping the data by pixel mean-altitude. For this and the following analysis we have not created maps either, as they would be equivalent to the global analysis but with the respective mask applied. We can see that, in general terms, performance becomes worse with increasing altitude. The best metrics to illustrate it are CC and HtR, as all three products follow the mentioned trend. CMORPH becomes extremely problematic for altitudes higher than 1500 m (the last interval): CC values drop to lower than 40%, HtR drop to less than 75% and FAR rises to more than 50% (which also leads to False bias rising to more than 40%). MSWEP shows the most stable performance across all intervals for every metric, even though it always has worse performance for increasing altitude; nonetheless, there are metrics for which CMORPH and IMERG perform worse for the [ 1000 ,   1500 ) m interval than for altitudes higher than 1500 m. It is the case of POD for both, Total bias for CMORPH and Miss bias for IMERG. Anyway, all products always perform better for the two lower altitude intervals. Finally, all products lower their overestimation rate and increase their underestimation rate for higher altitudes.
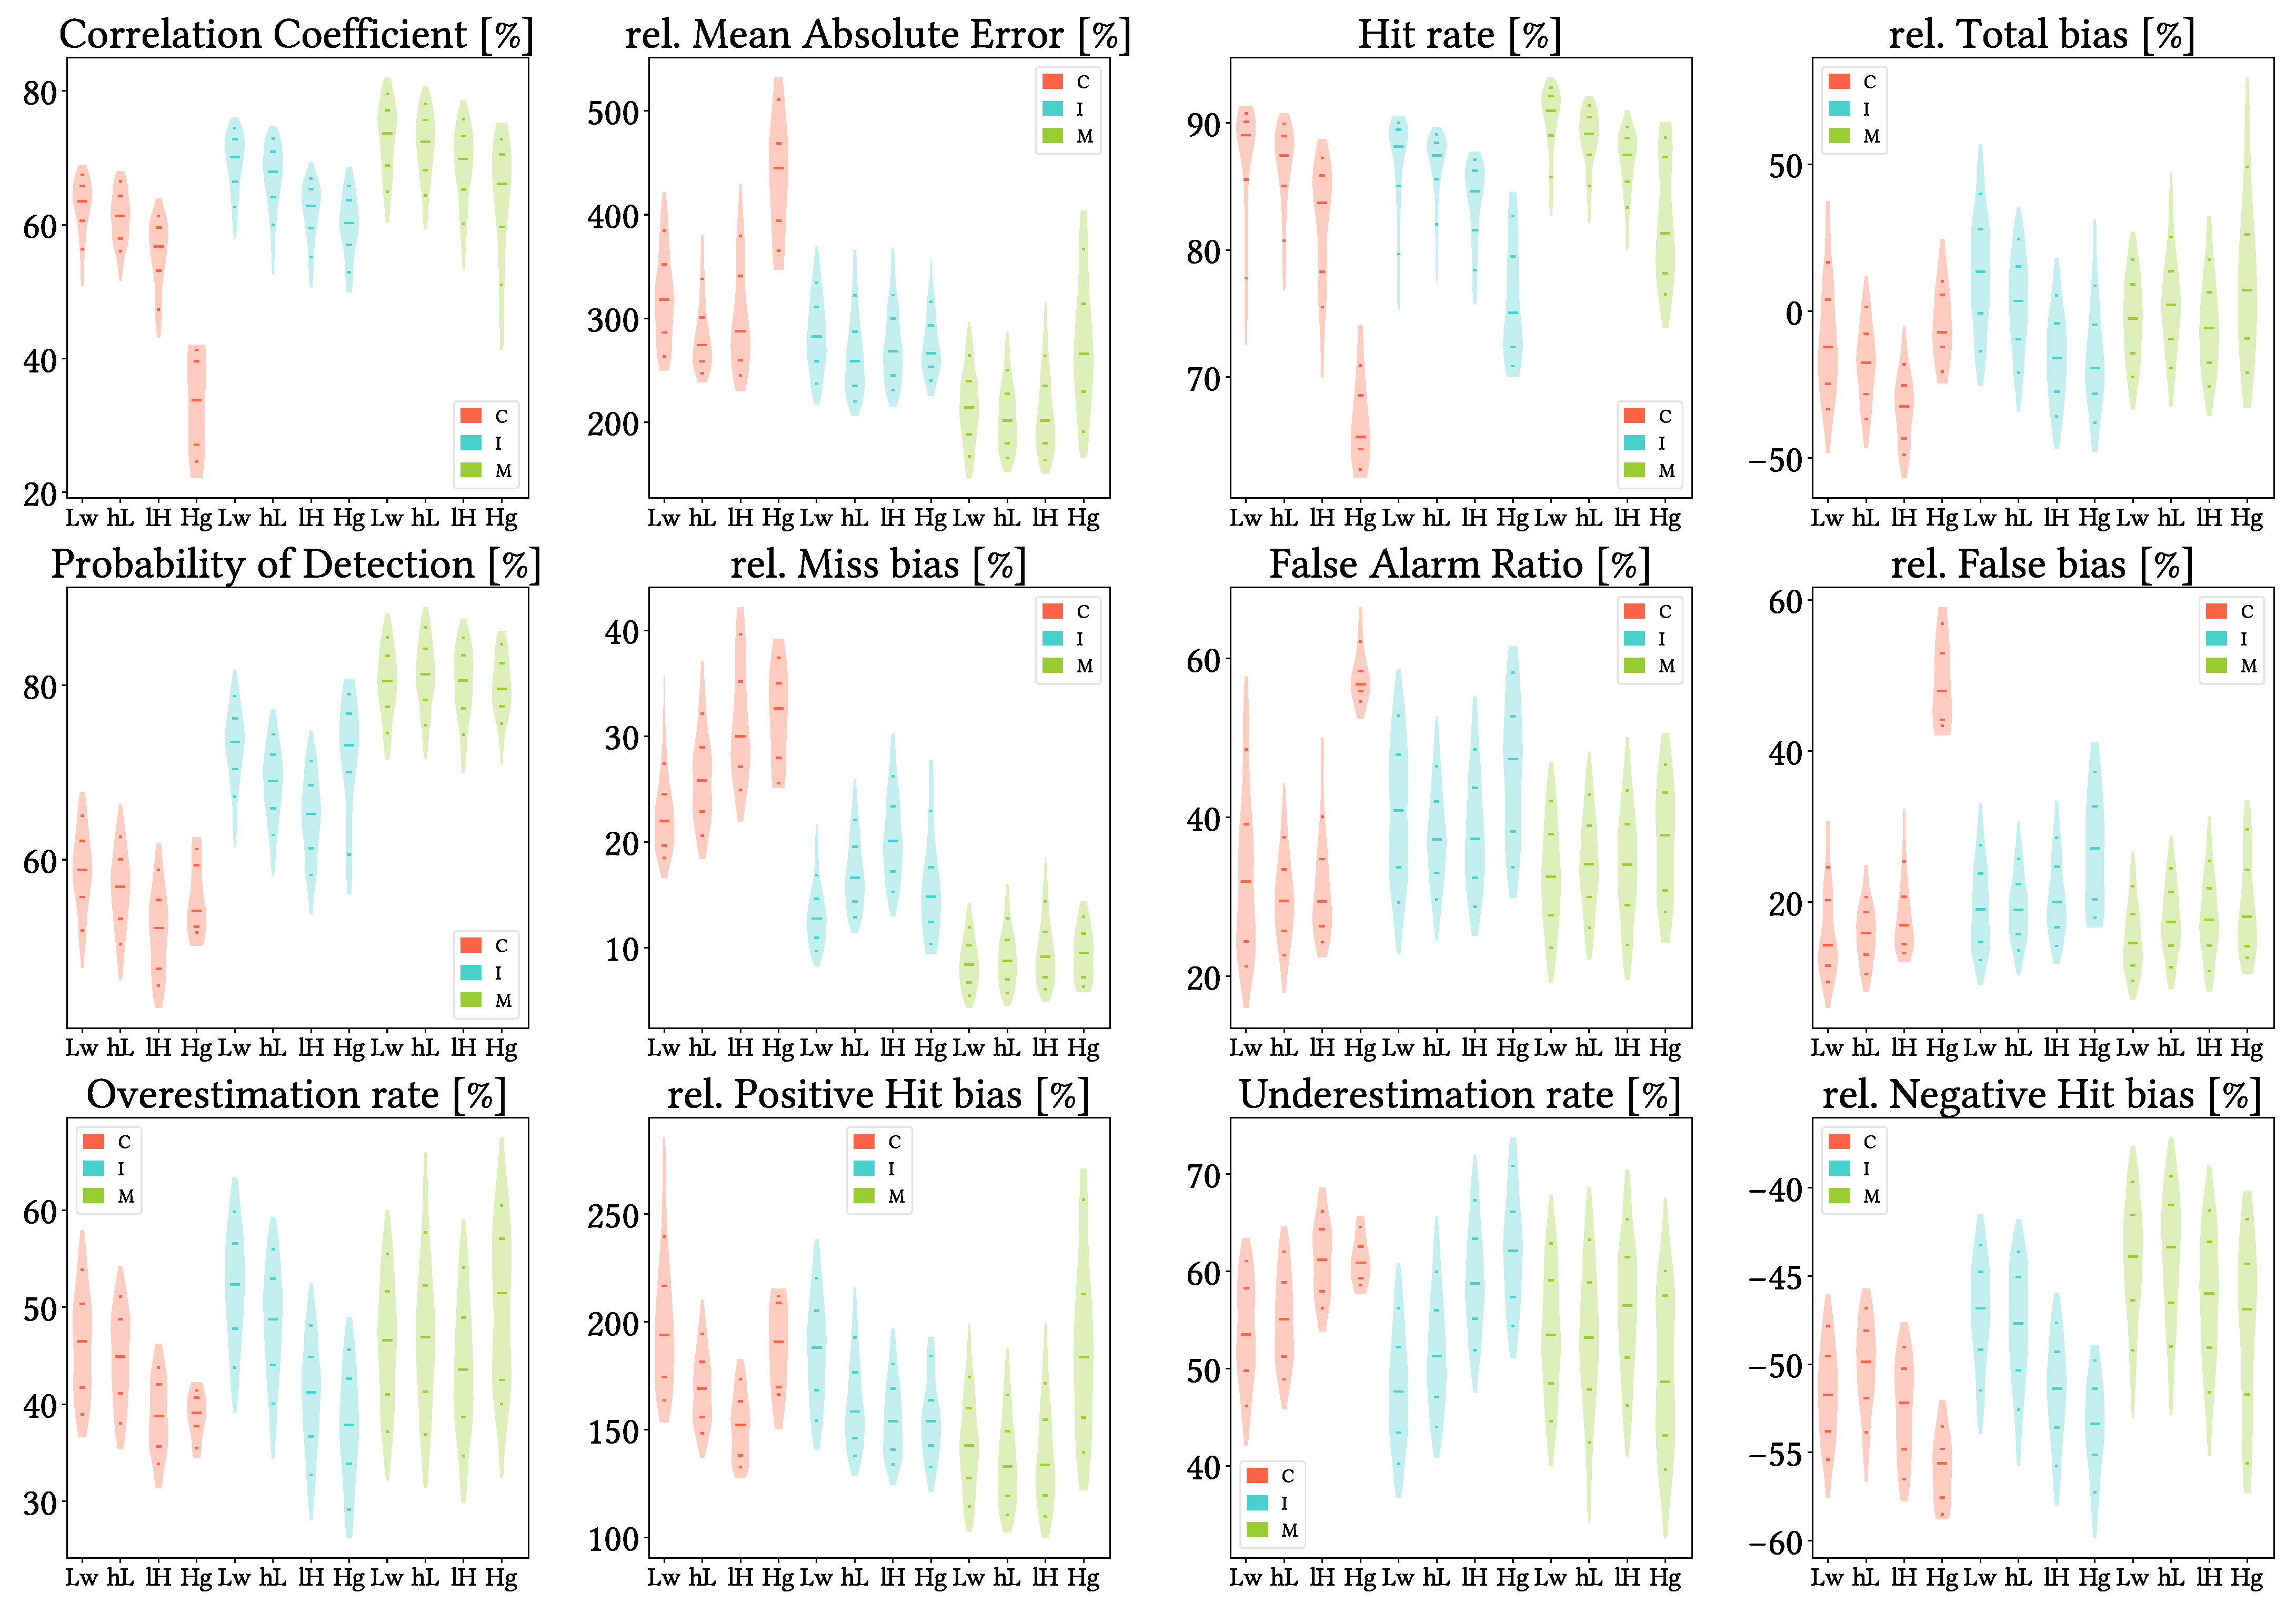
    Figure 18 shows results from the analysis when grouping the data by pixel mean TRI. These results agree with the spatial patterns found in the global and seasonal analysis: performance generally gets worse with increasing orographic complexity. It is the case for rMAE, HtR, POD, and Hit and Miss bias for all products, and for CC in the case of IMERG and MSWEP (CMORPH shows best CC for the stepper-Flat interval and worst for the Steep interval). FAR and False bias improve with increasing complexity, while Total bias depends on the product (it becomes worse with increasing complexity for CMORPH and MSWEP, whereas IMERG gets better at first and then it gets worse, due to its overestimation for the flatter pixels). Finally, equivalently to the previous analysis, all products lower their overestimation rate and increase their underestimation rate for more complex orography.

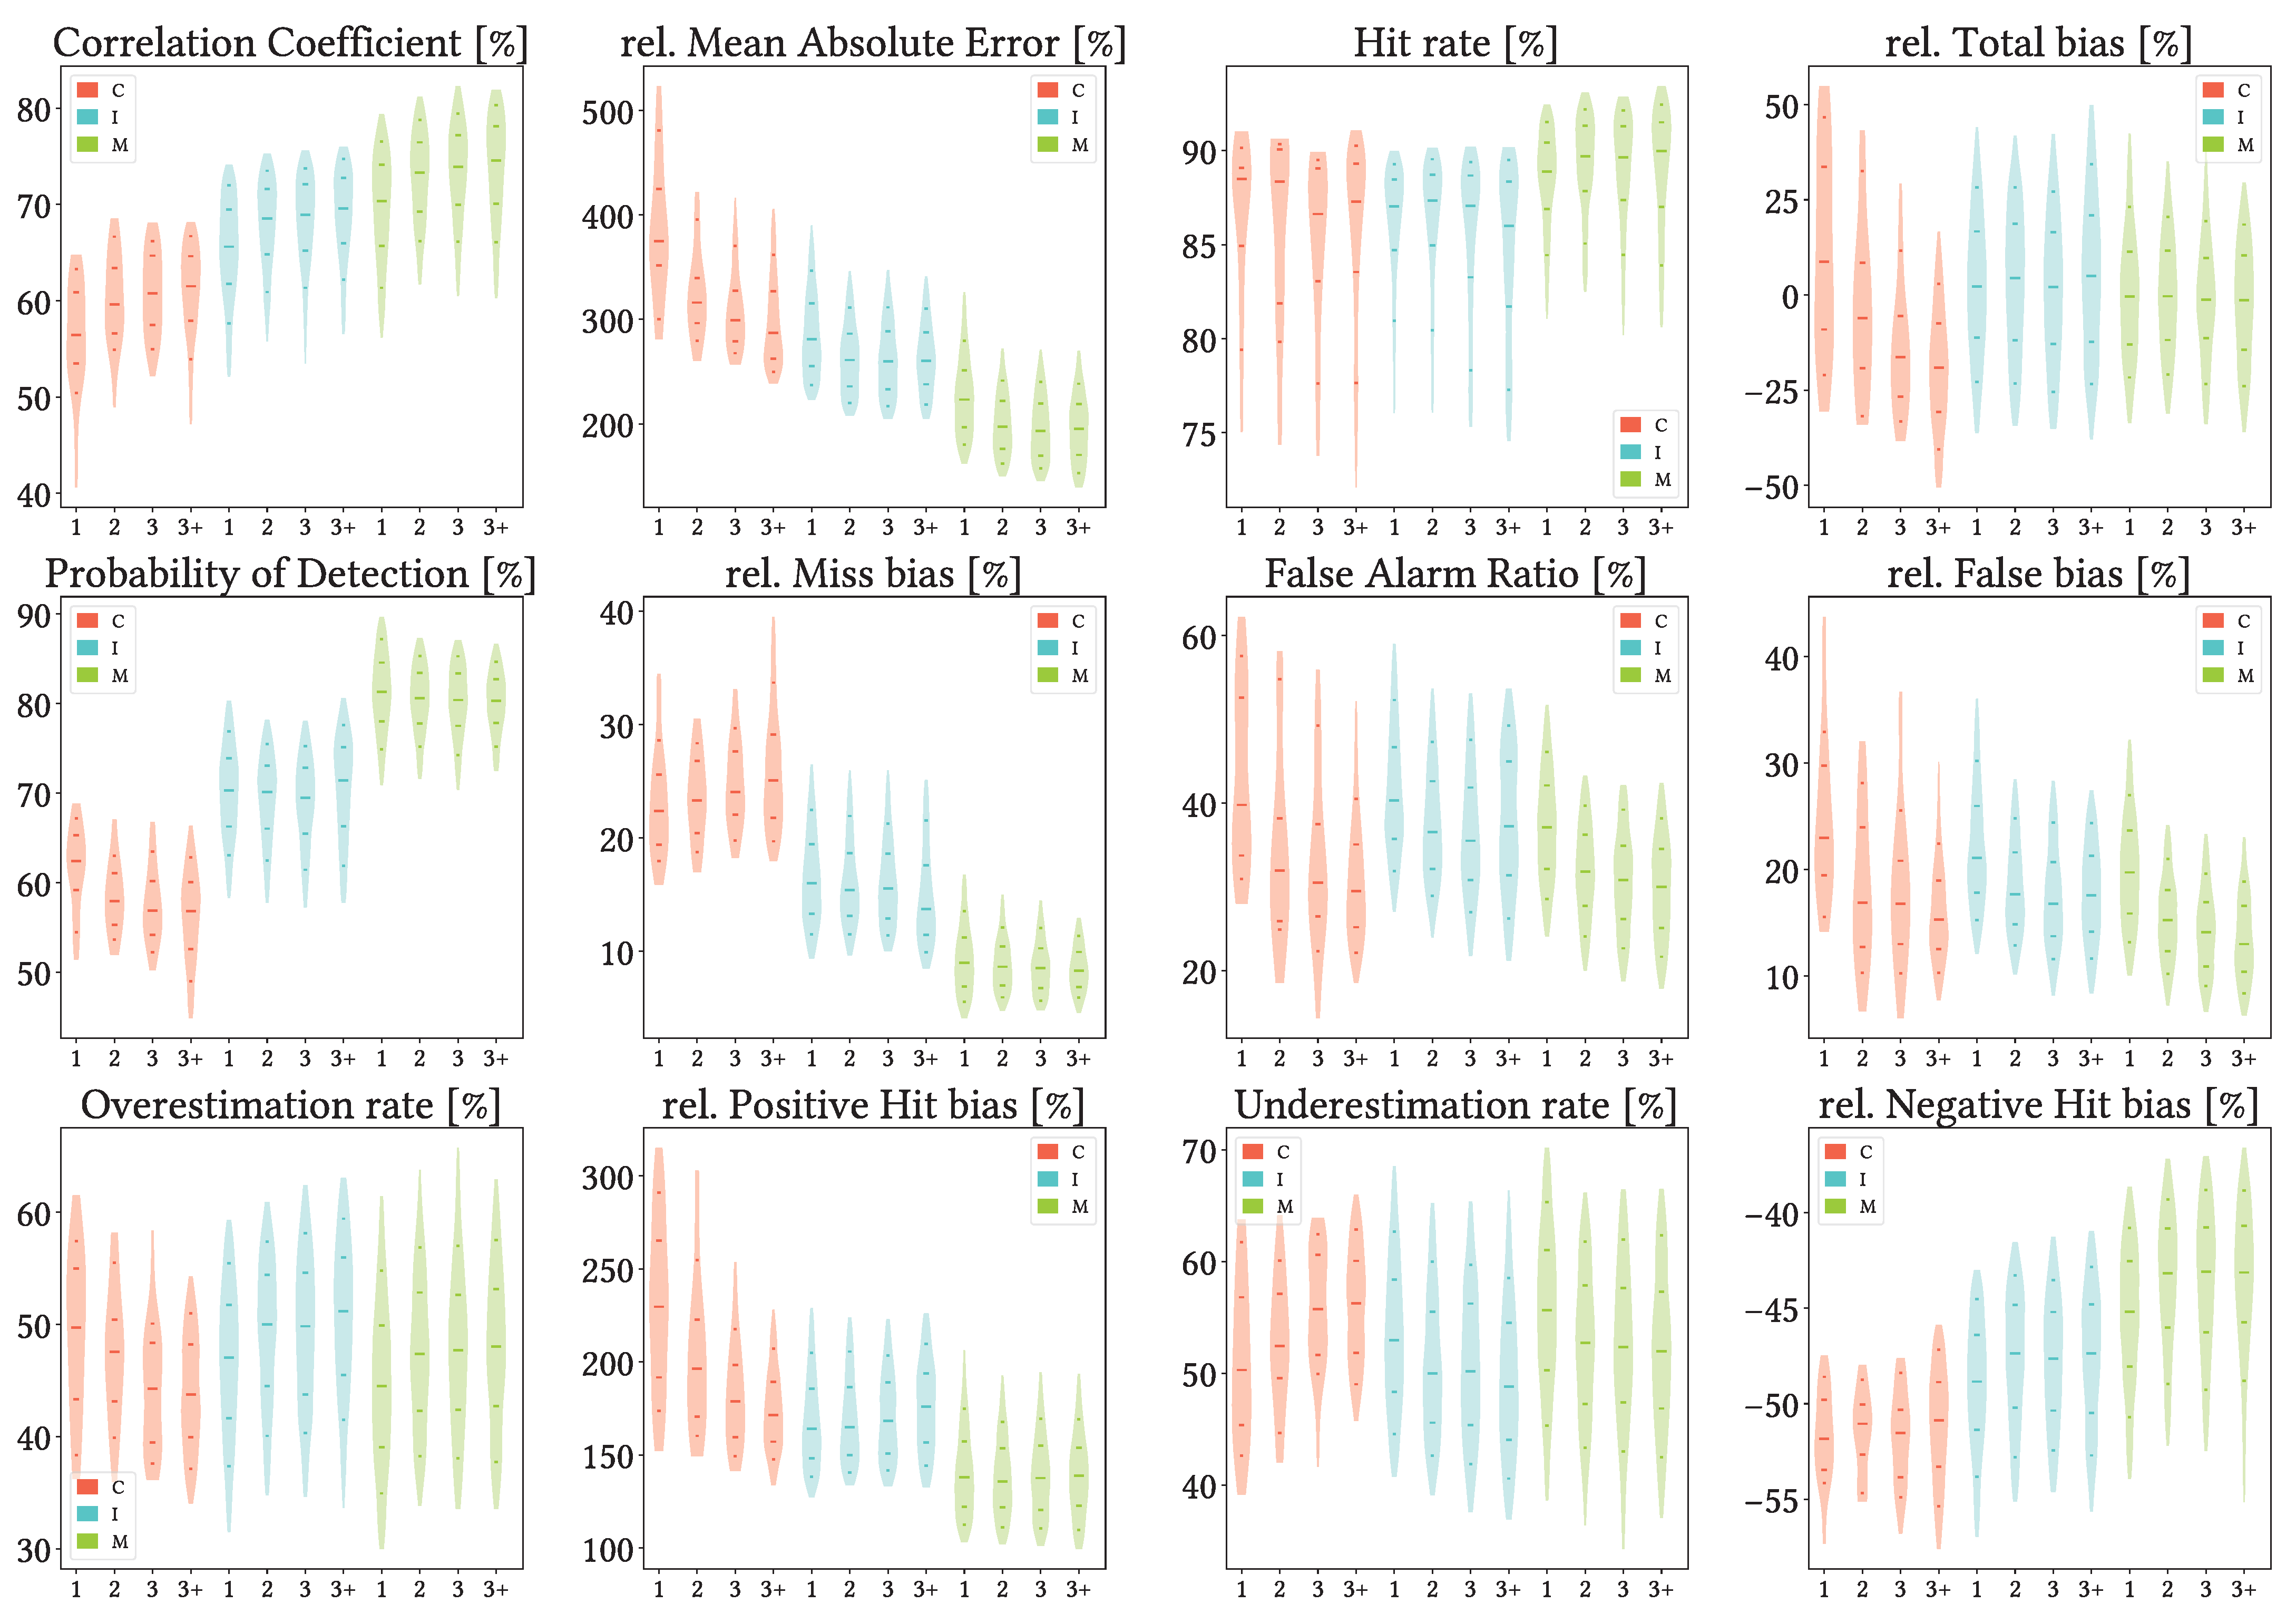
    5.8. Analysis Regarding Gauge Density by Pixel

    At last, Figure 19 shows results from the analysis when grouping the data by density of reference gauges per pixel. Impressively, performance remains quite similar no matter the amount of gauges per pixel, mainly for IMERG and MSWEP. In the case of CMORPH, for which more than three gauges per pixel is the usual situation, Total Bias, FAR and OvR decrease more notably (better performance) but so does POD (worse performance). In addition, values are always similar to those from the overall analysis.

    6. Discussion

    Considering actual metrics values from the overall daily analysis, CMORPH is clearly not recommended for this region, whereas IMERG and MSWEP could be used with proper caution. MSWEP is preferable over IMERG, as its lower rMAE values indicate. Focusing deeper on weakness and strengths, on one hand, CMORPH tops out at ∼ 67 % for CC and POD, which for the later means that it misses one of every three precipitation events. Its FAR values are not much better, with half of the pixels showing values greater than 30%; that is, roughly one of every three reported events is false across half of the study region. On the other hand, MSWEP shows similar but even worse values for FAR, but much better values of CC (mostly greater than 60%) and POD (always greater than 70%). In fact, the worst POD scenario for MSWEP is notably better than the best case scenario for CMORPH. IMERG lies in between for CC and POD but shows the worst FAR values. HtR is generally high across all products, quite probably due to them reporting dry days correctly (as it is the most common case in most of the study region).
    As of biases, once the precipitation is correctly detected, in the best cases MSWEP overestimates by reporting twice as much precipitation (100% relative bias) and underestimates by reporting one third of the real value (∼ 67 % relative bias). The situation is even worse for both CMORPH and IMERG. In all three products, Positive Hit bias is worse than the Negative one in terms of mean magnitude, but in terms of occurrence, Negative Hit bias is more frequent. About False bias, ∼ 75 % of both CMORPH and MSWEP pixels show values lower than 20%, while that is only true for half the pixels of IMERG. For all products, the worst cases lie around 33 % . Finally, regarding Miss bias, ∼ 75 % of MSWEP pixels miss less than 10 % of the real precipitation, whereas more than 75% of CMORPH pixels miss more than 20% of the real precipitation.
    These results agree with previous studies in climatic regions similar to those of our study region. Zambrano-Bigiarini et al. [29] obtained that MSWEP performed better than CMORPH overall. Several studies found a general underestimation of precipitation intensity by CMORPH [28,29,30,31,46,47,48], whereas others found general overestimation by IMERG [34,36,49,50,51,52,53], and some found overestimation by MSWEP [29,39,54] (Shaowei et al. [39] actually found high FAR but low False bias). Accordingly with our results, Zhou et al. [49] attributed IMERG V06 overestimation mainly to a large False bias, and indicated that, in case of underestimation, it came primarly from Hit bias. Interestingly, Peinó et al. [35], which studied IMERG V06 in Catalonia, found general underestimation. Catalonia is located at northeastern Peninsula (south of Pyrennes and at the end of the Ebro basin), and our results show general overestimation across that area.
    In relation to the overall monthly analysis, indices regarding Miss or False events (POD, Miss bias, FAR and False bias) were expected to be the most improved ones compared to the daily analysis: a dry month is naturally less probable than a dry day, and if there are several wet days along a month, chances are higher for the SPPs to at least detect one of them. That would also explain why POD, Miss Bias and HtR, contrarily to the daily comparison, show better results at north: northern Peninsula is the wettest region, both in precipitation amounts and number of wet days. Therefore, it may be easier to miss a single wet day, but it is more difficult to miss several of them in the same month and thus labelling it as dry. Finally, considering the general performance improvement respect to daily resolution, these SPPs would actually be better suited for monthly resolution if their increased Negative bias could be mitigated.
    Attending to the seasonal violin plots of HtR, POD, FAR, and False and Miss biases, summer shows the largest contrasts regarding performance: its HtR values mainly above 85% indicate that the products correctly identify the vast majority of dry days. However, at the same time, the products struggle more with correctly identifying wet days in this season, and also report the biggest amount of false wet days. FAR values across all products for the rest of the seasons are still suboptimal, though: as in the global analysis, the general tone is that roughly one third of the reported events are false. Winter also shows problems in those metrics, but its HtR across all products is in line with that of spring and autumn. Indeed, spring and autumn show very similar values across all metrics, and these values are usually the best ones. rMAE values confirm that summer is the most problematic season for MSWEP; contrarily, summer is actually the least problematic season for CMORPH, and winter is the most problematic. The reason for this behaviour in CMORPH could be decreased Negative Hit bias magnitude and rate for summer and vice versa for winter, along greater Positive Hit bias magnitude and Miss bias. In contrast, IMERG is similarly problematic across al seasons. Finally, across all seasons, once again the best cases of Positive Hit bias lie around 100%.
    Regarding the violin plots for the diverse intensity quartiles, CC values are low for all products and intensities, with just a few pixels from MSWEP showing correlations not much higher than 60%. As of detection capabilities, CMORPH presents poor performance up to the third quartiles, IMERG for the first two quartiles and MSWEP for the first quartiles: most of their pixels miss one third of precipitation events in those respective intervals (POD < 67 % ). In the case of CMORPH and IIMERG, most pixels miss more than half the events (POD < 50 % ). Finally, looking at rMAE, CMORPH performs globally worse in its third and fourth quartiles, which must be due to excessive Hit bias (of both types, but mainly Negative) and Miss bias, that counter-compensate the increase in CC. The opposite can be said for MSWEP, and unexpectedly, IMERG is most problematic for its third quartiles, which could not be deduced from the other metrics.
    Considering all of that, there is agreement between our analysis regarding seasonality and intensity, as summer is the driest season (best performance for CMORPH and worst for MSWEP) and winter is the wettest one (worst performance for CMORPH and second-to-best for MSWEP). The increased problematic for summer season regarding false and missed precipitation could also have been deduced from Figure 9: in all cases, False and Miss bias contribute in lesser relevance to Total bias compared to their frequency, which means they usually take place for lower precipitation amounts, the most usual cases in summer.
    Unfortunately, previous studies are not universally consistent regarding seasonal performance: several studies found general worse IMERG performance in winter than in summer [50,53,55,56,57,58,59], while in contrast [34,49] showed better IMERG performance in winter than in summer. [36,60] showed different results depending on the index or error component, Islam et al. [10] showed similar CC for the whole year, and [35,61] (the first one being focused in Catalonia and the second one in the whole Iberian Peninsula) indicated that IMERG reproduced temporal variability of precipitation intensity relatively well (which agrees with our results of IMERG being similarly problematic across all seasons). This last result was also found for MSWEP by Senent-Aparicio et al. [54] across diverse Iberian basins, even though it also indicated that MSWEP underestimates rainy months (which would agree with our analysis regarding intensity). Finally, in the case of CMORPH, some studies showed worse results for CMORPH in winter than in summer [31,46,62,63,64], whereas other ones showed opposite results [28,65,66] ([28] indicated that València presents better results for its warm season, though) and Roushdi [47] showed results highly dependent on both season and gauge location.
    On the other side, there is general consensus on the underestimation and overestimation patterns for different intensity intervals: most studies found more accused underestimation for heavier precipitation and overestimation for light precipitation in their respective studied products [28,29,35,37,49,50,58,59,61,64,66], which agrees with our findings. Contrarily, trends in POD and FAR are SPP-dependent, not always homogeneous and sometimes discrepant with our results. In the case of CMORPH, some studies showed worse POD for heavy precipitation and better POD for light precipitation [29,31,64,65,67], whereas Wang et al. [68] showed weak POD for light rainfall and Qin et al. [46] found overestimation on the amount of light precipitation events. In the case of IMERG, the results are inverted: most studies agreed on better POD for heavier precipitation [49,50,51,53,59,69], whereas [35,36] denoted opposite results. Song et al. [69] indeed declared better ability of IMERG for detecting intense rainfall events compared to drought events, and Wang and Yong [59] denoted better CC for intense precipitation (both in agreement with our results). Finally, in the case of MSWEP, Shaowei et al. [39] indicated problems for detecting and estimating light rainfall, and Zambrano-Bigiarini et al. [29] showed both worse POD and FAR for increasing intensity. There is also consensus regarding the aridity or humidity of the region: some studies showed better results for wet and/or notably vegetated areas compared to dry and/or sparsely vegetated regions [31,36,37,46,54,58,70], Lockhoff et al. [65] found bad results for cold/frozen areas, and El Kenawy et al. [71] suggested that the number of wet events was overestimated in the most arid regions and underestimated in semi-humid areas.
    Some of these studies have argued the reasons behind these diverse results. Regarding precipitation intensity and local aridity, Beck et al. [70] stated that worse results in arid regions were due to the shortlived nature of the convective rainfall and evaporation of falling rain, while Senent-Aparicio et al. [54] attributed it to uneven precipitation distribution. Peinó et al. [35] also indicated the evaporation of falling precipitation as a reason to high FAR in arid areas. In a related line, Gao and Liu [72] explained that correlation between rainfall and IR brightness temperature is faint if air profiles do not contain enough water, and thus peformance is weaker for lighter precipitation. Nan et al. [37] denoted that IMERG overestimation on light events was due to its algorithm over-correction, which led to an erroneous interpretation of no-rain events as light rain events, as well as to light rainfall being easily missed at ground gauges. Finally, El Kenawy et al. [71] did not recommend the use of CMORPH for assessments involving extreme wet events, as it reported misaligned intensity, location and timing. Other studies denoted worse performance in cold seasons for CMORPH and IMERG, and agreed in their suboptimal ability for detecting either non-convective precipitation from frontal systems due to PMW and IR sensors limitations [10,50,64] or solid precipitation, which comprises more complex radiative properties and weak signals at low microwave frequencies [53,56,58].
    Once looking at spatial patterns, we can effectively see that performance in summer differs notably from the other seasons, without adhering to a common pattern. For some metrics, summer spatial patterns follow an approximately latitudinal gradient; for other metrics, there is no clear one. On the contrary, one pattern we see recurrently, both in the daily and the seasonal analysis and for diverse metrics, is that of worse performance taking place over those regions which are both among the highest and the most orographically complex areas (which also tend to be notably humid). These regions are the surroundings of the Septentrional Meseta, the Iberian and Betic ranges, and the Pyrenees. It can be easily seen in CC, HtR, POD (and consequently Miss bias) and Total and Positive Hit bias, and to a lesser extent in FAR (and consequently False bias). This spatial pattern is supported by the analysis regarding altitude and orographic complexity: through the violin plots, we see that the performance generally decreases with both increasing altitude and TRI, which explains why those regions that happen to be both very high and very complex show such decreased performance. Nonetheless, we should remark that values presented through the violin plots do not differ significantly from one altitude or TRI interval to another, and are similar to those from the global analysis (as expected, as the values are exactly the same but with spatial masks applied).
    Nonetheless, there is another pattern that we can see in FAR (and thus False bias) and in Positive Hit bias (i.e., in both types of overestimation) that is apparently not related neither to mean temperatures, local wetness, altitude nor orographic complexity: these metrics perform worse over the Iberian Mediterranean Basin, surrounding regions, the Cantabric range and the Balearic islands. The Iberian Mediterranean Basin comprises both areas with high orographic complexity and very plain ones (mainly the Ebro, Xúquer and Segura basins), and same for both high and low altitude areas. Thus, the worse performance over these regions regarding overestimation must be related to other parameters. A plausible option could be that they are notably influenced by the Mediterranean sea: looking at Figure 1, we see that their limits are essentially defined by the first mountain ranges to be found when entering the Iberian Peninsula from the Mediterranean sea. Unfortunately, we are unsure about how its influence could lead to higher FAR, and we have not found any information about it in the literature.
    There is almost general consensus in the bibliography about geographic effects. Regarding trends versus altitude, most studies found worse SPP performance with increasing altitude [28,29,30,31,36,46,49,52,66,73], whereas Nan et al. [37] found better detection capability of light rain in high-elevation regions and best performance overall in low-elevation regions for moderate and heavy precipitation. Yu et al. [60] observed decreasing CC and RMSE with elevation, whereas Wang and Yong [59] found enworsement up to 400 m and improvement from 400 to 1500 m (and high CC up to 1500 m). El Kenawy et al. [71] found increasing CC and RMSE towards higher altitudes and worst underestimation between 1000 and 1400 m; Navarro et al. [44] showed the best results between 500 and 1500 m (in pixels with 1 or 2 gauges to calibrate), and [17] observed different results depending on the region. Regarding orography, most studies denoted worse performance for orographically complex area [48,53,57,58,59,61,64,69,73,74]; however, Satgé et al. [34] showed better FAR for high-sloped regions. It is also interesting to mention that several studies found problems near coastlines [48,61,65,66,74], which we also find for some metrics.
    We can also find possible explanations to these phenomena. Song et al. [69] considered that problems over complex orography were due to orography being crucial to moisture convergence and local convective precipitation, and to the limited gauges used in those regions for calibration. [44,61] found better results when there were some gauges to use for calibration lying within the pixel, which, as Song et al. [69] suggested, are less likely to be placed in orographically complex areas. Navarro et al. [74] denoted that GPCC coarse resolution could lead to excessive smoothing and GPCC scarcity could lead to major discrepancies in IMERG, and mentioned algorithm limitations as another probable reason to problems over complex orography. Tapiador et al. [61] also referred to algorithm limitations, as IMERG has to perform in regions where gauges are scarce and only monthly data is available. Finally, Derin et al. [17] observed that the use of total column water vapor for deriving motion vectors (which was the case of IMERG V06) worsened performance for light and heavy precipitation over complex terrain compared to the use of IR data (the case of IMERG V05). Regarding altitude influence, Nan et al. [37] explained that the estimated precipitation by satellite SPPs evaporated and dissipated due to air resistance before reaching the ground, and so the closer to the cloud-top a ground gauge was, the better its accuracy. This would be the same reason as why arid areas show worse performance. In contrast, Zhu et al. [52] suggested that altitude and distance from coastline indicated the dificulties for moisture and vapor to reach inland regions, while altitude and latitude might express the temperature, influential on air convection.
    Finally, we have found that all SPPs preserve general performance no matter the amount of gauges per pixel, with CMORPH showing the greater changes when increasing this amount. In its case, due to its pixels covering larger areas compared to those from IMERG and MSWEP, an increased gauge density may really help settling the correct precipitation amount and confirming there has been precipitation in the area (better for bias and false alarms), but also there are bigger chances of a gauge detecting precipitation in its area while there has been no precipitation over the other gauges (worse for detection capabilities). Anyway, the results suggest that calibration with only one gauge per pixel is enough for the products to perform as expected, but they also suggest that the suboptimal performance has its roots elsewhere, which could be external factors (as we have already discussed: precipitation intensity, altitude, orography…) as well as internal ones (physical limits for data extraction from satellite, suboptimal intermediate products and/or algorithms, etc.).

    7. Conclusions

    In this study we have assessed the suitability over Peninsular Spain and the Balearic Islands of CMORPH V1.0, IMERG V07A and MSWEP V2.8 using AEMET ground gauges precipitation data as reference, at pixel scale and for the 2001–2020 period. We have analysed the performance without grouping the data (at daily and monthly resolution) and grouping it by season of year, reference intensity quartiles, altitude, orographic complexity and density of gauges per pixel (all this at daily resolution). Here are the main conclusions:
    • MSWEP is preferred, CMORPH is unrecommended, and performance is generally better at monthly than at daily resolution. CMORPH exhibits much worse detection capabilities and underestimates in greater magnitude. IMERG shows general overestimation (due to higher False bias and greater tendency to overestimate, both in frequency and magnitude), while MSWEP is equilibrated in that regard. Once precipitation is correctly detected, all products tend to underestimate more frequently than to overestimate, but the overestimation is always greater in magnitude. In fact, when overestimating, the SPP reports are always at least twice as large as the reference. The quantity of false reports is about one third of the total across all products. Nonetheless, they exhibit good accuracy for correctly detecting wet or dry days, as dry days are majoritary in most of the study region. Monthly performance is generally better for all products, although they become more prone to underestimation and show substantially increased negative bias.
    • Performance for autumn and spring is similar, while it diverges in different ways for summer and winter. Performance for spring and autumn is similar to that of the global analysis, whereas the performance differs for winter and specially for summer. SPPs show worse detection capabilities and greater amount of false events across these two seasons (which also implies greater missed and falsely reported precipitation quantities), and summer also presents worse correlation values. Interestingly, this does not necessarily translate in winter and summer being more problematic overall, as overestimation and underestimation when correctly detecting precipitation have a notable influence. Indeed, winter is most problematic for CMORPH and summer is for MSWEP, whereas IMERG is similarly problematic across all seasons.
    • Correlation and detection capabilities increase along reference intensity, but so does underestimation magnitude and frequency. Correlations are still very low across all products and intensities (mainly lesser than 60%), and the detection capabilities of CMORPH for its first two quartiles and those of IMERG for its first quartiles are low, as most of their pixels miss more than half the events. Nonetheless, CMORPH is more problematic for heavier intensities, IMERG for its third quartiles (not by much) and MSWEP for lighter intensities.
    • Worse performance takes place in those regions that show both the greatest orographic complexity and high altitudes, which also tend to be considerably humid. These regions are the surroundings of the Septentrional Meseta, the Iberian and Betic ranges and the Pyrenees. The main problems are reduced detection capabilities and increased underestimation, and increased falsely reported precipitation to a lesser extent. Other regions with increased problematic are the northern littoral (reduced detection capabilities and increased underestimation) and the Iberian Mediterranean Basin (increased false precipitation).
    • Density of reference gauges per pixel has no noticeable influence on any of the products performance. This motivates their use, but at the same time it implies that sources of discrepancy must lie elsewhere.
    Previous studies have reasoned the source of disagreement for increased orographical complexity and intensity, but there is no consensus for the dependence on seasonality and altitude, and no other study has appreciated the increased false alarms over the Iberian Mediterranean Basin, Cantabric range and Balearic islands. This spatial extent suggests the influence of the Mediterranean sea as a plausible reason, but we do not currently have a possible explanation.
    All in all, CMORPH is not recommended and MSWEP is preferable over IMERG, even though MSWEP performs worse for lighter intensities and in summer and IMERG performs similarly for all intensities and seasons. Nonetheless, as their performances are still suboptimal, we recommend to first assess their performance for the particular use of interest (such as hydrological modelling, trends on extreme precipitation patterns, analysis of changes in bioclimates, flood threshold exceedances, studies on agricultural water budget…) before considering them reliable tools for future use.

    Author Contributions

    A.G.-T.: Conceptualization, Methodology, Software, Formal Analysis, Investigation, Writing—Original Draft, Visualization. R.N.: Conceptualization, Methodology, Project administration, Funding acquisition, Supervision, Writing—Review & Editing. E.V.: Conceptualization, Methodology, Supervision, Writing—Review & Editing. V.C.: Project administration, Funding acquisition. M.J.E.: Project administration, Funding acquisition, Resources. J.J.M.: Resources. Y.L.: Resources. F.B.: Resources. All authors have read and agreed to the published version of the manuscript.

    Funding

    This research was conducted within the framework of the Spanish national research project Tool4Extreme PID2020-118797RB-I00, supported by MCIN/AEI/10.13039/501100011033, and within the project PROMETEO/2021/016, supported by Generalitat Valenciana. A. García-Ten was hired within the program of research support staff funded by Generalitat Valenciana and the European Social fund (INVEST/2022/52), and later through a FPU grant funded by Ministerio de Universidades (FPU/22/02807).

    Data Availability Statement

    CMORPH V1.0 is available at CMORPH webpage (https://www.ncei.noaa.gov/products/climate-data-records/precipitation-cmorph, accessed on 24 October 2025), Data Access → Download. It is an online archive with no embedded support for download automatisation. The archive can be publicly accessed. File format is netCDF. IMERG V07A is available at Earth Science Data Systems (ESDS) archive and at Precipitation Processing System (PPS) Arthurhou server, both managed by NASA and accessible from IMERG webpage (https://gpm.nasa.gov/data/imerg, accessed on 24 October 2025), Data → Data Directory. We accessed the data through ESDS archive, for which creating an account is required. The archive easily allows delimiting the period of interest and supports download automatisation. File format is netCDF-4. MSWEP V2.8 data files are stored at GloH2O’s Google Drive and are accessible after previous request at MSWEP webpage (http://www.gloh2o.org/mswep/, accessed on 24 October 2025). If accepted, GloH2O will share their MSWEP folders with the Google account provided in the request. File format is netCDF. SRTM DEM files are accessible through diverse websites, such as Opentopography (https://doi.org/10.5069/G9445JDF, accessed on 24 October 2025) and the Earth Science Data Systems (ESDS) archive. We accessed the data through ESDS archive. File format is hgt, binary format from NASA. We used QGIS to read and compose the diverse tiles into a single image. AEMET ground gauge data is only available for research projects. Data was provided within the mark of the research projects mentioned in the Funding section.

    Conflicts of Interest

    The authors declare no conflicts of interest.

    Abbreviations

    The following abbreviations have been used in this manuscript:
    ATBDAlgorithm Theoretical Basis Document
    CPCClimate Prediction Center
    GPCCGlobal Precipitation Climatology Centre
    GPCPGlobal Precipitation Climatology Project
    GPMGlobal Precipitation Measurement Mission
    IMSIce Mapping System
    IPCCIntergovernmental Panel on Climate Change
    IRInfrared
    PMWPassive Microwave

    Appendix A

    Figure A1. Violin plots from the pixel-wise evaluation indices and error components for CMORPH V1.0 (C), IMERG V07A (I) and MSWEP V2.8 (M) versus AEMET ground gauges across the 2001–2020 period at daily resolution without any grouping, using the minimum threshold of p = 0.5   mm   day 1 . Values range from 5th to 95th percentiles for better clarity. Stripes indicate 10th, 25th, 50th, 75th and 90th percentiles. Median value is explicitly shown.
    Figure A1. Violin plots from the pixel-wise evaluation indices and error components for CMORPH V1.0 (C), IMERG V07A (I) and MSWEP V2.8 (M) versus AEMET ground gauges across the 2001–2020 period at daily resolution without any grouping, using the minimum threshold of p = 0.5   mm   day 1 . Values range from 5th to 95th percentiles for better clarity. Stripes indicate 10th, 25th, 50th, 75th and 90th percentiles. Median value is explicitly shown.
    Remotesensing 17 03562 g0a1
    Figure A2. Violin plots from the pixel-wise evaluation indices and error components for CMORPH V1.0 (C), IMERG V07A (I) and MSWEP V2.8 (M) versus AEMET ground gauges across the 2001–2020 period at daily resolution without any grouping, using the minimum threshold of p = 2   mm   day 1 . Values range from 5th to 95th percentiles for better clarity. Stripes indicate 10th, 25th, 50th, 75th and 90th percentiles. Median value is explicitly shown.
    Figure A2. Violin plots from the pixel-wise evaluation indices and error components for CMORPH V1.0 (C), IMERG V07A (I) and MSWEP V2.8 (M) versus AEMET ground gauges across the 2001–2020 period at daily resolution without any grouping, using the minimum threshold of p = 2   mm   day 1 . Values range from 5th to 95th percentiles for better clarity. Stripes indicate 10th, 25th, 50th, 75th and 90th percentiles. Median value is explicitly shown.
    Remotesensing 17 03562 g0a2aRemotesensing 17 03562 g0a2b

    Appendix B

    Figure A3. Maps from performance metrics and error components for CMORPH V1.0 (left), IMERG V07A (center) and MSWEP V2.8 (right) versus AEMET ground gauges across the 2001–2020 period at monthly resolution without any grouping.
    Figure A3. Maps from performance metrics and error components for CMORPH V1.0 (left), IMERG V07A (center) and MSWEP V2.8 (right) versus AEMET ground gauges across the 2001–2020 period at monthly resolution without any grouping.
    Remotesensing 17 03562 g0a3aRemotesensing 17 03562 g0a3b
    Figure A4. Maps from performance metrics and error components for CMORPH V1.0 (left), IMERG V07A (center) and MSWEP V2.8 (right) versus AEMET ground gauges across the 2001–2020 period at monthly resolution without any grouping.
    Figure A4. Maps from performance metrics and error components for CMORPH V1.0 (left), IMERG V07A (center) and MSWEP V2.8 (right) versus AEMET ground gauges across the 2001–2020 period at monthly resolution without any grouping.
    Remotesensing 17 03562 g0a4aRemotesensing 17 03562 g0a4b
    Figure A5. Maps from performance metrics and error components for CMORPH V1.0 (left), IMERG V07A (center) and MSWEP V2.8 (right) versus AEMET ground gauges across the 2001–2020 period at monthly resolution without any grouping.
    Figure A5. Maps from performance metrics and error components for CMORPH V1.0 (left), IMERG V07A (center) and MSWEP V2.8 (right) versus AEMET ground gauges across the 2001–2020 period at monthly resolution without any grouping.
    Remotesensing 17 03562 g0a5aRemotesensing 17 03562 g0a5b

    Appendix C
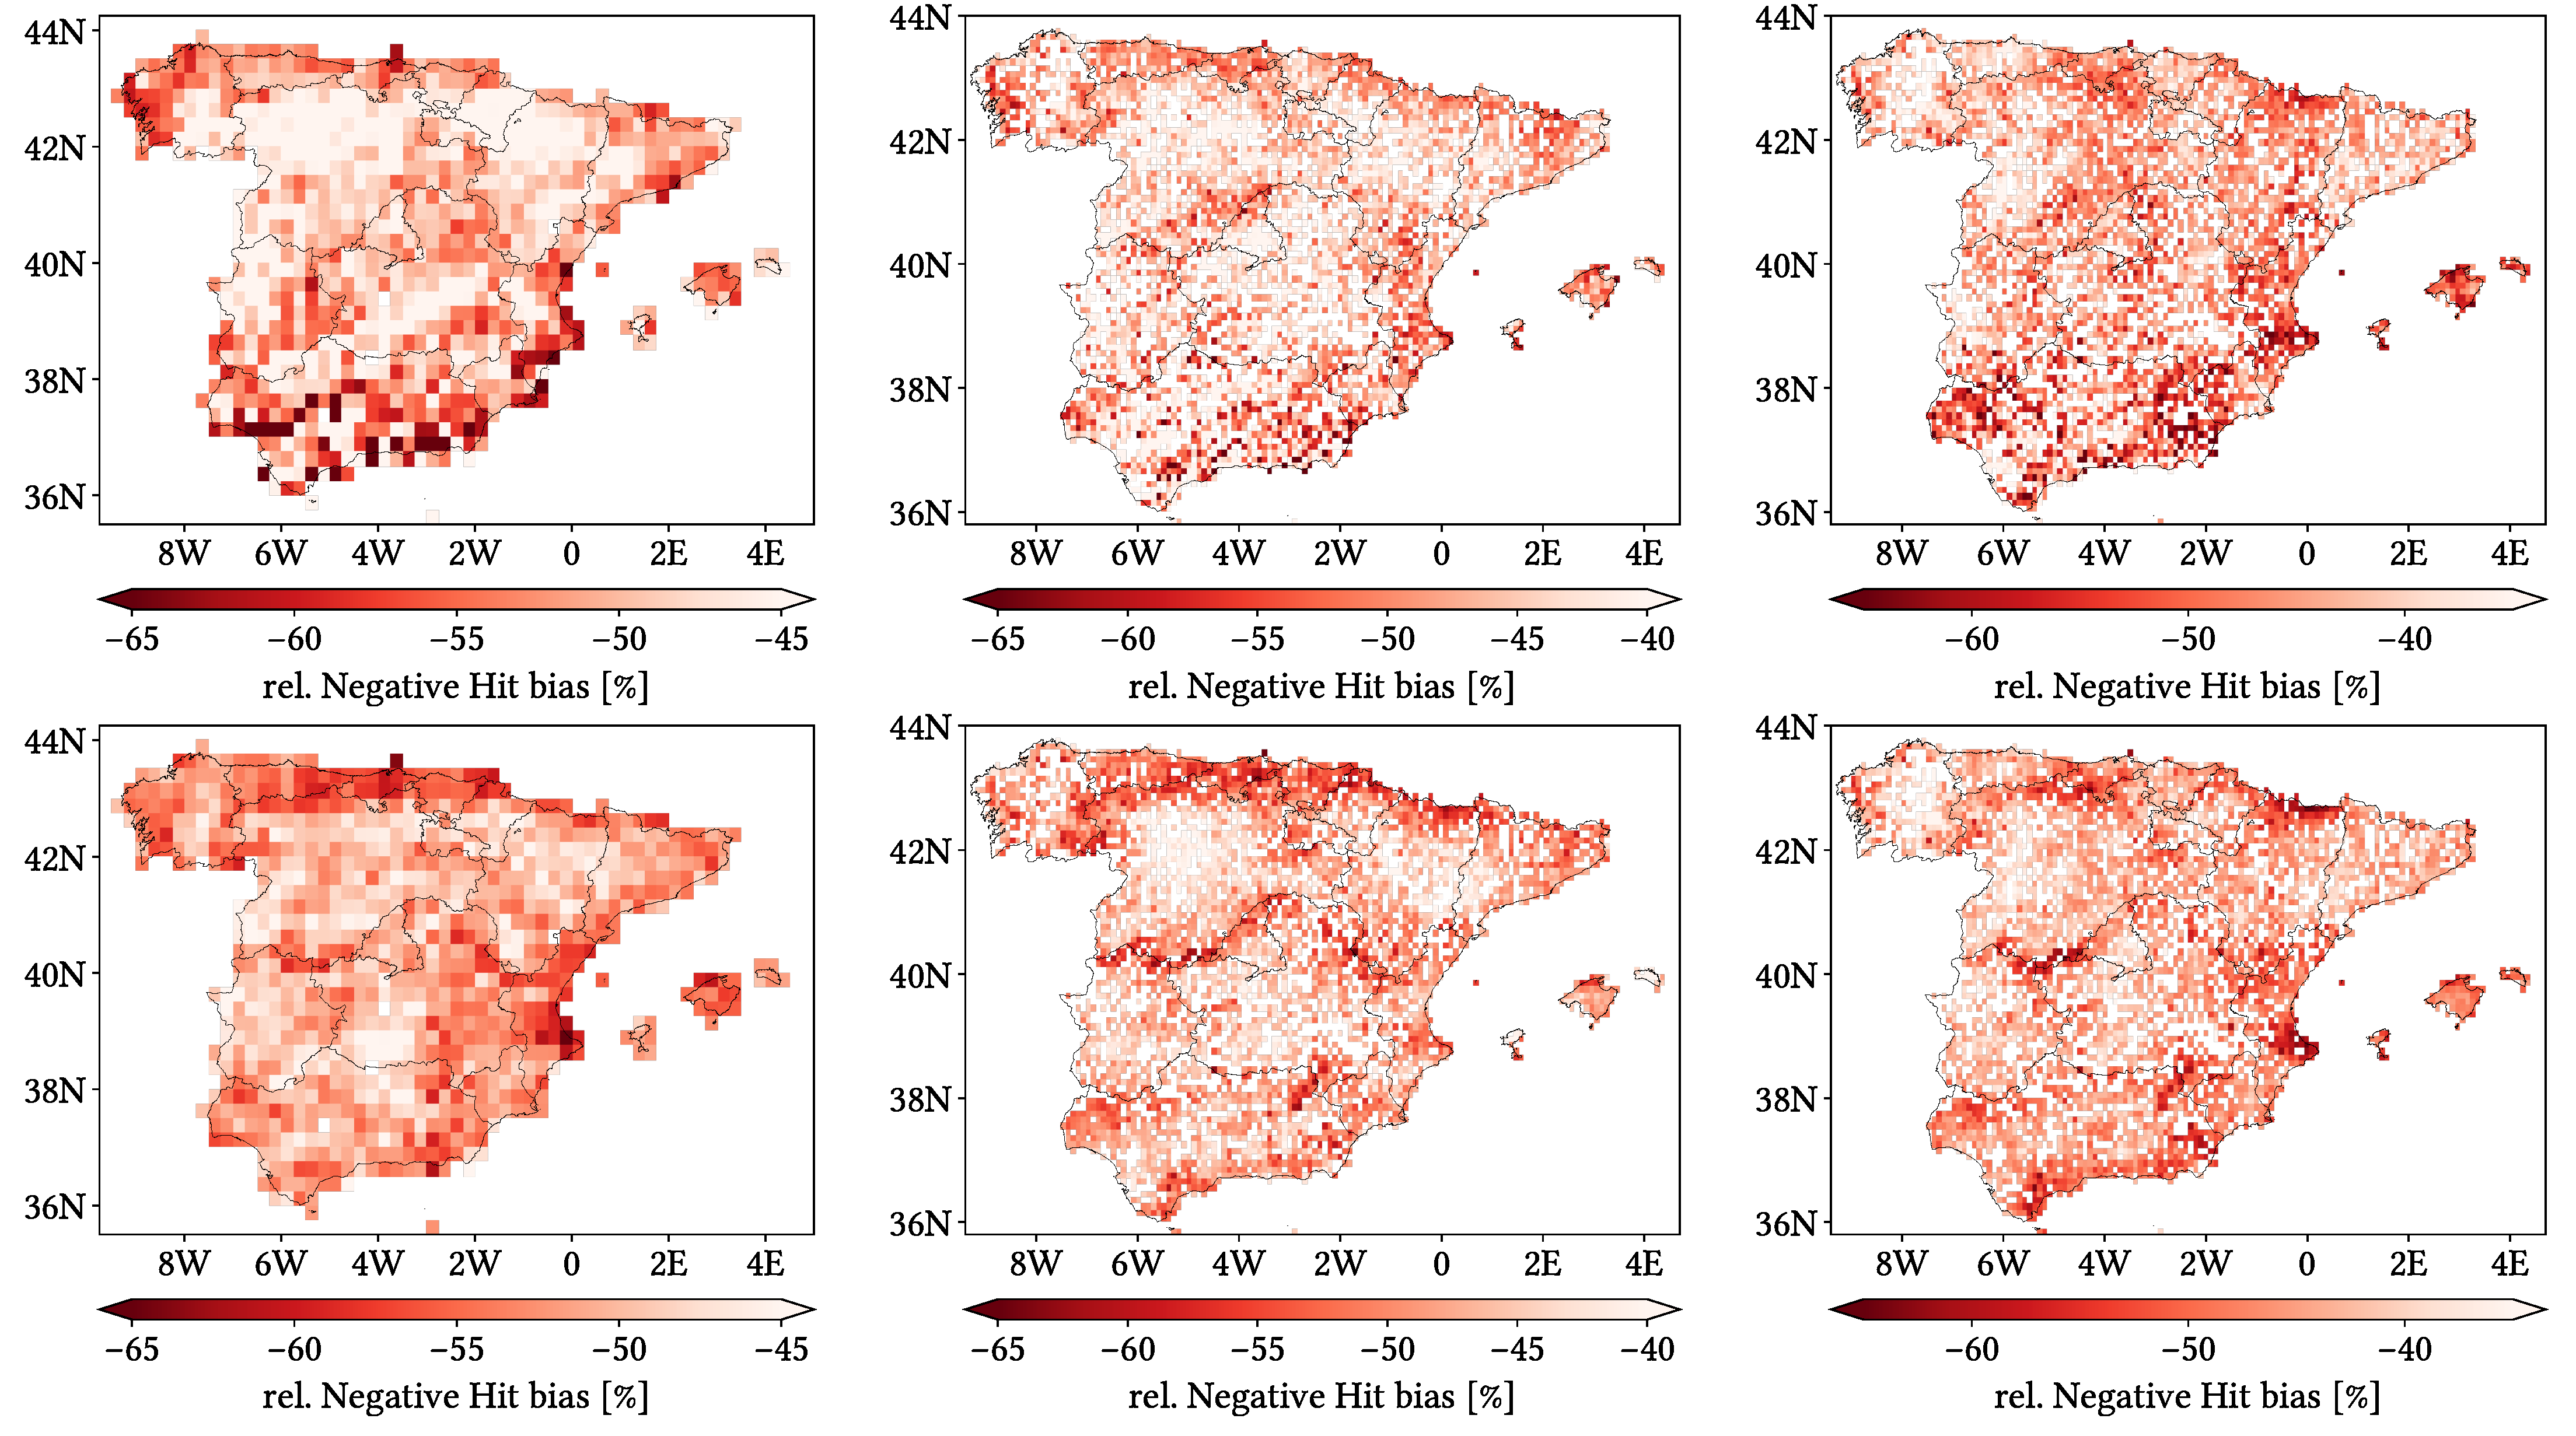
    Figure A6. Correlation Coefficient maps for CMORPH V1.0 (left), IMERG V07A (center) and MSWEP V2.8 (right) versus AEMET ground gauges across the 2001–2020 period at daily resolution grouping by season of year (from top to bottom: winter, spring, summer and autumn).
    Figure A6. Correlation Coefficient maps for CMORPH V1.0 (left), IMERG V07A (center) and MSWEP V2.8 (right) versus AEMET ground gauges across the 2001–2020 period at daily resolution grouping by season of year (from top to bottom: winter, spring, summer and autumn).
    Remotesensing 17 03562 g0a6aRemotesensing 17 03562 g0a6b
    Figure A7. Relative Mean Error maps for CMORPH V1.0 (left), IMERG V07A (center) and MSWEP V2.8 (right) versus AEMET ground gauges across the 2001–2020 period at daily resolution grouping by season of year (from top to bottom: winter, spring, summer and autumn).
    Figure A7. Relative Mean Error maps for CMORPH V1.0 (left), IMERG V07A (center) and MSWEP V2.8 (right) versus AEMET ground gauges across the 2001–2020 period at daily resolution grouping by season of year (from top to bottom: winter, spring, summer and autumn).
    Remotesensing 17 03562 g0a7aRemotesensing 17 03562 g0a7b
    Figure A8. Hit Rate maps for CMORPH V1.0 (left), IMERG V07A (center) and MSWEP V2.8 (right) versus AEMET ground gauges across the 2001–2020 period at daily resolution grouping by season of year (from top to bottom: winter, spring, summer and autumn).
    Figure A8. Hit Rate maps for CMORPH V1.0 (left), IMERG V07A (center) and MSWEP V2.8 (right) versus AEMET ground gauges across the 2001–2020 period at daily resolution grouping by season of year (from top to bottom: winter, spring, summer and autumn).
    Remotesensing 17 03562 g0a8aRemotesensing 17 03562 g0a8b
    Figure A9. Relative Total bias maps for CMORPH V1.0 (left), IMERG V07A (center) and MSWEP V2.8 (right) versus AEMET ground gauges across the 2001–2020 period at daily resolution grouping by season of year (from top to bottom: winter, spring, summer and autumn).
    Figure A9. Relative Total bias maps for CMORPH V1.0 (left), IMERG V07A (center) and MSWEP V2.8 (right) versus AEMET ground gauges across the 2001–2020 period at daily resolution grouping by season of year (from top to bottom: winter, spring, summer and autumn).
    Remotesensing 17 03562 g0a9aRemotesensing 17 03562 g0a9b
    Figure A10. Probability of Detection maps for CMORPH V1.0 (left), IMERG V07A (center) and MSWEP V2.8 (right) versus AEMET ground gauges across the 2001–2020 period at daily resolution grouping by season of year (from top to bottom: winter, spring, summer and autumn).
    Figure A10. Probability of Detection maps for CMORPH V1.0 (left), IMERG V07A (center) and MSWEP V2.8 (right) versus AEMET ground gauges across the 2001–2020 period at daily resolution grouping by season of year (from top to bottom: winter, spring, summer and autumn).
    Remotesensing 17 03562 g0a10aRemotesensing 17 03562 g0a10b
    Figure A11. Relative Miss bias maps for CMORPH V1.0 (left), IMERG V07A (center) and MSWEP V2.8 (right) versus AEMET ground gauges across the 2001–2020 period at daily resolution grouping by season of year (from top to bottom: winter, spring, summer and autumn).
    Figure A11. Relative Miss bias maps for CMORPH V1.0 (left), IMERG V07A (center) and MSWEP V2.8 (right) versus AEMET ground gauges across the 2001–2020 period at daily resolution grouping by season of year (from top to bottom: winter, spring, summer and autumn).
    Remotesensing 17 03562 g0a11aRemotesensing 17 03562 g0a11b
    Figure A12. False Alarm Ratio maps for CMORPH V1.0 (left), IMERG V07A (center) and MSWEP V2.8 (right) versus AEMET ground gauges across the 2001–2020 period at daily resolution grouping by season of year (from top to bottom: winter, spring, summer and autumn).
    Figure A12. False Alarm Ratio maps for CMORPH V1.0 (left), IMERG V07A (center) and MSWEP V2.8 (right) versus AEMET ground gauges across the 2001–2020 period at daily resolution grouping by season of year (from top to bottom: winter, spring, summer and autumn).
    Remotesensing 17 03562 g0a12aRemotesensing 17 03562 g0a12b
    Figure A13. Relative False bias maps for CMORPH V1.0 (left), IMERG V07A (center) and MSWEP V2.8 (right) versus AEMET ground gauges across the 2001–2020 period at daily resolution grouping by season of year (from top to bottom: winter, spring, summer and autumn).
    Figure A13. Relative False bias maps for CMORPH V1.0 (left), IMERG V07A (center) and MSWEP V2.8 (right) versus AEMET ground gauges across the 2001–2020 period at daily resolution grouping by season of year (from top to bottom: winter, spring, summer and autumn).
    Remotesensing 17 03562 g0a13aRemotesensing 17 03562 g0a13b
    Figure A14. Overestimation Rate maps for CMORPH V1.0 (left), IMERG V07A (center) and MSWEP V2.8 (right) versus AEMET ground gauges across the 2001–2020 period at daily resolution grouping by season of year (from top to bottom: winter, spring, summer and autumn).
    Figure A14. Overestimation Rate maps for CMORPH V1.0 (left), IMERG V07A (center) and MSWEP V2.8 (right) versus AEMET ground gauges across the 2001–2020 period at daily resolution grouping by season of year (from top to bottom: winter, spring, summer and autumn).
    Remotesensing 17 03562 g0a14aRemotesensing 17 03562 g0a14b
    Figure A15. Relative Positive Hit bias maps for CMORPH V1.0 (left), IMERG V07A (center) and MSWEP V2.8 (right) versus AEMET ground gauges across the 2001–2020 period at daily resolution grouping by season of year (from top to bottom: winter, spring, summer and autumn).
    Figure A15. Relative Positive Hit bias maps for CMORPH V1.0 (left), IMERG V07A (center) and MSWEP V2.8 (right) versus AEMET ground gauges across the 2001–2020 period at daily resolution grouping by season of year (from top to bottom: winter, spring, summer and autumn).
    Remotesensing 17 03562 g0a15aRemotesensing 17 03562 g0a15b
    Figure A16. Underestimation Rate maps for CMORPH V1.0 (left), IMERG V07A (center) and MSWEP V2.8 (right) versus AEMET ground gauges across the 2001–2020 period at daily resolution grouping by season of year (from top to bottom: winter, spring, summer and autumn).
    Figure A16. Underestimation Rate maps for CMORPH V1.0 (left), IMERG V07A (center) and MSWEP V2.8 (right) versus AEMET ground gauges across the 2001–2020 period at daily resolution grouping by season of year (from top to bottom: winter, spring, summer and autumn).
    Remotesensing 17 03562 g0a16aRemotesensing 17 03562 g0a16b
    Figure A17. Relative Negative Hit bias maps for CMORPH V1.0 (left), IMERG V07A (center) and MSWEP V2.8 (right) versus AEMET ground gauges across the 2001–2020 period at daily resolution grouping by season of year (from top to bottom: winter, spring, summer and autumn).
    Figure A17. Relative Negative Hit bias maps for CMORPH V1.0 (left), IMERG V07A (center) and MSWEP V2.8 (right) versus AEMET ground gauges across the 2001–2020 period at daily resolution grouping by season of year (from top to bottom: winter, spring, summer and autumn).
    Remotesensing 17 03562 g0a17aRemotesensing 17 03562 g0a17b

    References

    1. IPCC. Climate Change 2013: The Physical Science Basis. Contribution of Working Group I to the Fifth Assessment Report of the Intergovernmental Panel on Climate Change; Stocker, T.F., Qin, D., Plattner, G.-K., Tignor, M., Allen, S.K., Boschung, J., Nauels, A., Xia, Y., Bex, V., Midgley, P.M., Eds.; Cambridge University Press: Cambridge, UK; New York, NY, USA, 2013; p. 1535. [Google Scholar] [CrossRef]
    2. Graff, L.S.; Lacasce, J. Changes in Cyclone Characteristics in Response to Modified SSTs. J. Clim. 2014, 27, 4273–4295. [Google Scholar] [CrossRef]
    3. del Río, S.; Cano-Ortiz, A.; Herrero, L.; Penas, A. Recent trends in mean maximum and minimum air temperatures over Spain (1961–2006). Theor. Appl. Climatol. 2012, 109, 605–626. [Google Scholar] [CrossRef]
    4. Olcina-Cantos, J.; Notivoli, R.S.; Miró, J.; Meseguer-Ruiz, O. Tropical nights on the Spanish Mediterranean coast, 1950–2014. Clim. Res. 2019, 78, 225–236. [Google Scholar] [CrossRef]
    5. Estrela, M.J.; Miró, J.; Pastor, F.; Millán, M. Frontal Atlantic Rainfall Component in the Western Mediterranean Basin. Variability and Spatial Distribution. ESF-MedCLIVAR Workshop on “Hydrological, Socioeconomic and Ecological Impacts of the North Atlantic Oscillation in the Mediterranean Region”. 2010, Volume 036931. Available online: https://www.researchgate.net/publication/235901141_FRONTAL_ATLANTIC_RAINFALL_COMPONENT_IN_THE_WESTERN_MEDITERRANEAN_BASIN_VARIABILITY_AND_SPATIAL_DISTRIBUTION (accessed on 24 October 2025).
    6. Gonzalez-Hidalgo, J.C.; Lopez-Bustins, J.; Štepánek, P.; Martin-Vide, J.; de Luis, M. Monthly precipitation trends on the Mediterranean fringe of the Iberian Peninsula during the second-half of the twentieth century (1951–2000). Int. J. Climatol. 2009, 29, 1415–1429. [Google Scholar] [CrossRef]
    7. Miró, J.J.; Estrela, M.J.; Caselles, V.; Gómez, I. Spatial and temporal rainfall changes in the Júcar and Segura basins (1955–2016): Fine-scale trends. Int. J. Climatol. 2018, 38, 4699–4722. [Google Scholar] [CrossRef]
    8. Estrela, M.J.; Corell, D.; Valiente, J.A.; Azorin-Molina, C.; Chen, D. Spatio-temporal variability of fog-water collection in the eastern Iberian Peninsula: 2003–2012. Atmos. Res. 2019, 226, 87–101. [Google Scholar] [CrossRef]
    9. Miró, J.J.; Estrela, M.J.; Olcina-Cantos, J. Statistical downscaling and attribution of air temperature change patterns in the Valencia region (1948–2011). Atmos. Res. 2015, 156, 189–212. [Google Scholar] [CrossRef]
    10. Islam, M.A.; Yu, B.; Cartwright, N. Assessment and comparison of five satellite precipitation products in Australia. J. Hydrol. 2020, 590, 125474. [Google Scholar] [CrossRef]
    11. Michaelides, S.; Levizzani, V.; Anagnostou, E.; Bauer, P.; Kasparis, T.; Lane, J. Precipitation: Measurement, remote sensing, climatology and modeling. Atmos. Res. 2009, 94, 512–533. [Google Scholar] [CrossRef]
    12. Wu, X.; Zhao, N. Evaluation and Comparison of Six High-Resolution Daily Precipitation Products in Mainland China. Remote Sens. 2023, 15, 223. [Google Scholar] [CrossRef]
    13. Sharifi, E.; Eitzinger, J.; Dorigo, W. Performance of the state-of-the-art gridded precipitation products over mountainous terrain: A regional study over Austria. Remote Sens. 2019, 11, 2018. [Google Scholar] [CrossRef]
    14. Alsumaiti, T.S.; Hussein, K.; Ghebreyesus, D.T.; Sharif, H.O. Performance of the CMORPH and GPM IMERG products over the United Arab Emirates. Remote Sens. 2020, 12, 1426. [Google Scholar] [CrossRef]
    15. Maggioni, V.; Meyers, P.C.; Robinson, M.D. A Review of Merged High-Resolution Satellite Precipitation Product Accuracy during the Tropical Rainfall Measuring Mission (TRMM) Era. J. Hydrometeorol. 2016, 17, 1101–1117. [Google Scholar] [CrossRef]
    16. Mei, Y.; Anagnostou, E.N.; Nikolopoulos, E.I.; Borga, M. Error Analysis of Satellite Precipitation Products in Mountainous Basins. J. Hydrometeorol. 2014, 15, 1778–1793. [Google Scholar] [CrossRef]
    17. Derin, Y.; Anagnostou, E.; Berne, A.; Borga, M.; Boudevillain, B.; Buytaert, W.; Che-Hao, C.; Chen, H.; Delrieu, G.; Hsu, Y.C.; et al. Evaluation of GPM-era Global Satellite Precipitation Products over Multiple Complex Terrain Regions. Remote Sens. 2019, 11, 2936. [Google Scholar] [CrossRef]
    18. Ma, Z.; Xu, J.; Zhu, S.; Yang, J.; Tang, G.; Yang, Y.; Shi, Z.; Hong, Y. AIMERG: A new Asian precipitation dataset (0.1°/half-hourly, 2000–2015) by calibrating the GPM-era IMERG at a daily scale using APHRODITE. Earth Syst. Sci. Data 2020, 12, 1525–1544. [Google Scholar] [CrossRef]
    19. López-Davalillo Larrea, J. Geografía Regional de España; Colección Grado, UNED— Universidad Nacional de Educación a Distancia: Madrid, Spain, 2014. [Google Scholar]
    20. IGN. Atlas Nacional de España (Instituto Geográfico Nacional); IGN: Madrid, Spain, 2019. [Google Scholar]
    21. AEMET; IMP. Atlas Climático Ibérico (Agencia Estatal de Meteorología e Instituto de Meteorologia de Portugal); AEMET: Madrid, Spain; IMP: Lisboa, Portugal, 2011. [Google Scholar]
    22. Martín Vide, J.; Olcina Cantos, J. Climas y Tiempos de España; Alianza: Madrid, Spain, 2001. [Google Scholar]
    23. Domonkos, P. Homogenization of precipitation time series with ACMANT. Theor. Appl. Climatol. 2015, 122, 303–314. [Google Scholar] [CrossRef]
    24. Miró, J.J.; Caselles, V.; Estrela, M.J. Multiple imputation of rainfall missing data in the Iberian Mediterranean context. Atmos. Res. 2017, 197, 313–330. [Google Scholar] [CrossRef]
    25. Miró, J.J.; Lemus-Canovas, M.; Serrano-Notivoli, R.; Olcina Cantos, J.; Estrela, M.; Martin-Vide, J.; Sarricolea, P.; Meseguer-Ruiz, O. A component-based approximation for trend detection of intense rainfall in the Spanish Mediterranean coast. Weather Clim. Extrem. 2022, 38, 100513. [Google Scholar] [CrossRef]
    26. Joyce, R.J.; Janowiak, J.E.; Arkin, P.A.; Xie, P. CMORPH: A Method that Produces Global Precipitation Estimates from Passive Microwave and Infrared Data at High Spatial and Temporal Resolution. J. Hydrometeorol. 2004, 5, 487–503. [Google Scholar] [CrossRef]
    27. Xie, P.; Joyce, R.; Wu, S. Bias-Corrected CMORPH - Climate Algorithm Theoretical Basis Document, NOAA Climate Dara Record Program (CDRP-ATBD-0812 by CDRP Document Manager), Rev. 0 (2018). 2018. Available online: https://www.ncei.noaa.gov/products/climate-data-records/precipitation-cmorph (accessed on 24 October 2025).
    28. Stampoulis, D.; Anagnostou, E.N. Evaluation of Global Satellite Rainfall Products over Continental Europe. J. Hydrometeorol. 2012, 13, 588–603. [Google Scholar] [CrossRef]
    29. Zambrano-Bigiarini, M.; Nauditt, A.; Birkel, C.; Verbist, K.; Ribbe, L. Temporal and spatial evaluation of satellite-based rainfall estimates across the complex topographical and climatic gradients of Chile. Hydrol. Earth Syst. Sci. 2017, 21, 1295–1320. [Google Scholar] [CrossRef]
    30. Alijanian, M.; Rakhshandehroo, G.R.; Mishra, A.K.; Dehghani, M. Evaluation of satellite rainfall climatology using CMORPH, PERSIANN-CDR, PERSIANN, TRMM, MSWEP over Iran. Int. J. Climatol. 2017, 37, 4896–4914. [Google Scholar] [CrossRef]
    31. Huang, A.; Zhao, Y.; Zhou, Y.; Yang, B.; Zhang, L.; Dong, X.; Fang, D.; Wu, Y. Evaluation of multisatellite precipitation products by use of ground-based data over China. J. Geophys. Res. Atmos. 2016, 121, 10,654–10,675. [Google Scholar] [CrossRef]
    32. Serrat-Capdevila, A.; Merino, M.; Valdes, J.B.; Durcik, M. Evaluation of the Performance of Three Satellite Precipitation Products over Africa. Remote Sens. 2016, 8, 836. [Google Scholar] [CrossRef]
    33. Huffman, G.J.; Bolvin, D.T.; Joyce, R.; Nelkin, E.J.; Tan, J.; Braithwaite, D.; Hsua, K.; Kelley, O.A.; Nguyen, P.; Sorooshian, S.; et al. NASA Global Precipitation Measurement (GPM) Integrated Multi-satellitE Retrievals for GPM (IMERG): Algorithm Theoretical Basis Document (ATBD) Version 07. 2023. Available online: https://gpm.nasa.gov/resources/documents/imerg-v07-atbd (accessed on 24 October 2025).
    34. Satgé, F.; Xavier, A.; Pillco Zolá, R.; Hussain, Y.; Timouk, F.; Garnier, J.; Bonnet, M.P. Comparative Assessments of the Latest GPM Mission’s Spatially Enhanced Satellite Rainfall Products over the Main Bolivian Watersheds. Remote Sens. 2017, 9, 369. [Google Scholar] [CrossRef]
    35. Peinó, E.; Bech, J.; Udina, M. Performance Assessment of GPM IMERG Products at Different Time Resolutions, Climatic Areas and Topographic Conditions in Catalonia. Remote Sens. 2022, 14, 5085. [Google Scholar] [CrossRef]
    36. Ge, Z.; Yu, R.; Zhu, P.; Hao, Y.; Li, Y.; Liu, X.; Zhang, Z.; Ren, X. Applicability evaluation and error analysis of TMPA and IMERG in Inner Mongolia Autonomous Region, China. Theor. Appl. Climatol. 2023, 151, 1449–1467. [Google Scholar] [CrossRef]
    37. Nan, L.; Yang, M.; Wang, H.; Xiang, Z.; Hao, S. Comprehensive Evaluation of Global Precipitation Measurement Mission (GPM) IMERG Precipitation Products over Mainland China. Water 2021, 13, 3381. [Google Scholar] [CrossRef]
    38. Beck, H.E.; Wood, E.F.; Pan, M.; Fisher, C.K.; Miralles, D.G.; van Dijk, A.I.J.M.; McVicar, T.R.; Adler, R.F. MSWEP V2 Global 3-Hourly 0.1° Precipitation: Methodology and Quantitative Assessment. Bull. Am. Meteorol. Soc. 2019, 100, 473–500. [Google Scholar] [CrossRef]
    39. Shaowei, N.; Jie, W.; Juliang, J.; Xiaoyan, X.; Yuliang, Z.; Fan, S.; Linlin, Z. Comprehensive evaluation of satellite-derived precipitation products considering spatial distribution difference of daily precipitation over eastern China. J. Hydrol. Reg. Stud. 2022, 44, 101242. [Google Scholar] [CrossRef]
    40. NASA. Shuttle Radar Topography Mission (SRTM) Global; Distributed by OpenTopography; NASA: Washington, DC, USA, 2013. [Google Scholar] [CrossRef]
    41. Riley, S.; DeGloria, S.; Elliot, S. A Terrain Ruggedness Index that Quantifies Topographic Heterogeneity. Int. J. Sci. 1999, 5, 23–27. [Google Scholar]
    42. Zhang, X.; Alexander, L.; Hegerl, G.C.; Jones, P.; Tank, A.K.; Peterson, T.C.; Trewin, B.; Zwiers, F.W. Indices for monitoring changes in extremes based on daily temperature and precipitation data. WIREs Clim. Chang. 2011, 2, 851–870. [Google Scholar] [CrossRef]
    43. Tian, Y.; Peters-Lidard, C.D.; Eylander, J.B.; Joyce, R.J.; Huffman, G.J.; Adler, R.F.; Hsu, K.l.; Turk, F.J.; Garcia, M.; Zeng, J. Component analysis of errors in satellite-based precipitation estimates. J. Geophys. Res. 2009, 114. [Google Scholar] [CrossRef]
    44. Navarro, A.; García-Ortega, E.; Merino, A.; Sánchez, J.L.; Tapiador, F.J. Orographic biases in IMERG precipitation estimates in the Ebro River basin (Spain): The effects of rain gauge density and altitude. Atmos. Res. 2020, 244, 105068. [Google Scholar] [CrossRef]
    45. Li, J.; Lu, C.; Chen, J.; Zhou, X.; Yang, K.; Xu, X.; Wu, X.; Zhu, L.; He, X.; Wu, S.; et al. The combined effects of convective entrainment and orographic drag on precipitation over the Tibetan Plateau. Sci. China Earth Sci. 2025, 68, 2615–2630. [Google Scholar] [CrossRef]
    46. Qin, Y.; Chen, Z.; Shen, Y.; Zhang, S.; Shi, R. Evaluation of Satellite Rainfall Estimates over the Chinese Mainland. Remote Sens. 2014, 6, 11649–11672. [Google Scholar] [CrossRef]
    47. Roushdi, M. Spatio-Temporal Assessment of Satellite Estimates and Gauge-Based Rainfall Products in Northern Part of Egypt. Climate 2022, 10, 134. [Google Scholar] [CrossRef]
    48. Awange, J.; Ferreira, V.; Forootan, E.; Khandu; Andam-Akorful, S.; Agutu, N.; He, X. Uncertainties in remotely sensed precipitation data over Africa. Int. J. Climatol. 2016, 36, 303–323. [Google Scholar] [CrossRef]
    49. Zhou, Z.; Guo, B.; Xing, W.; Zhou, J.; Xu, F.; Xu, Y. Comprehensive evaluation of latest GPM era IMERG and GSMaP precipitation products over mainland China. Atmos. Res. 2020, 246, 105132. [Google Scholar] [CrossRef]
    50. Bogerd, L.; Overeem, A.; Leijnse, H.; Uijlenhoet, R. A Comprehensive Five-Year Evaluation of IMERG Late Run Precipitation Estimates over the Netherlands. J. Hydrometeorol. 2021, 22, 1855–1868. [Google Scholar] [CrossRef]
    51. Su, J.; Lü, H.; Ryu, D.; Zhu, Y. The Assessment and Comparison of TMPA and IMERG Products over the Major Basins of Mainland China. Earth Space Sci. 2019, 6, 2461–2479. [Google Scholar] [CrossRef]
    52. Zhu, S.; Shen, Y.; Ma, Z. A New Perspective for Charactering the Spatio-temporal Patterns of the Error in GPM IMERG over Mainland China. Earth Space Sci. 2021, 8, 1. [Google Scholar] [CrossRef]
    53. Ramsauer, T.; Weiß, T.; Marzahn, P. Comparison of the GPM IMERG Final Precipitation Product to RADOLAN Weather Radar Data over the Topographically and Climatically Diverse Germany. Remote Sens. 2018, 10, 2029. [Google Scholar] [CrossRef]
    54. Senent-Aparicio, J.; López-Ballesteros, A.; Pérez-Sánchez, J.; Segura-Méndez, F.J.; Pulido-Velazquez, D. Using Multiple Monthly Water Balance Models to Evaluate Gridded Precipitation Products over Peninsular Spain. Remote Sens. 2018, 10, 922. [Google Scholar] [CrossRef]
    55. Moazami, S.; Najafi, M. A comprehensive evaluation of GPM-IMERG V06 and MRMS with hourly ground-based precipitation observations across Canada. J. Hydrol. 2021, 594, 125929. [Google Scholar] [CrossRef]
    56. Zhang, J.; Lin, L.F.; Bras, R.L. Evaluation of the Quality of Precipitation Products: A Case Study Using WRF and IMERG Data over the Central United States. J. Hydrometeorol. 2018, 19, 2007–2020. [Google Scholar] [CrossRef]
    57. Sun, W.; Sun, Y.; Li, X.; Wang, T.; Wang, Y.; Qiu, Q.; Deng, Z. Evaluation and Correction of GPM IMERG Precipitation Products over the Capital Circle in Northeast China at Multiple Spatiotemporal Scales. Adv. Meteorol. 2018, 2018, 4714173. [Google Scholar] [CrossRef]
    58. Xin, Y.; Yang, Y.; Chen, X.; Yue, X.; Liu, Y.; Yin, C. Evaluation of IMERG and ERA5 precipitation products over the Mongolian Plateau. Sci. Rep. 2022, 12, 21776. [Google Scholar] [CrossRef]
    59. Wang, H.; Yong, B. Quasi-Global Evaluation of IMERG and GSMaP Precipitation Products over Land Using Gauge Observations. Water 2020, 12, 243. [Google Scholar] [CrossRef]
    60. Yu, L.; Leng, G.; Python, A.; Peng, J. A Comprehensive Evaluation of Latest GPM IMERG V06 Early, Late and Final Precipitation Products across China. Remote Sens. 2021, 13, 1208. [Google Scholar] [CrossRef]
    61. Tapiador, F.J.; Navarro, A.; García-Ortega, E.; Merino, A.; Sánchez, J.L.; Marcos, C.; Kummerow, C. The contribution of rain gauges in the calibration of the IMERG product: Results from the first validation over Spain. J. Hydrometeorol. 2020, 21, 161–182. [Google Scholar] [CrossRef]
    62. Tang, G.; Clark, M.P.; Papalexiou, S.M.; Ma, Z.; Hong, Y. Have satellite precipitation products improved over last two decades? A comprehensive comparison of GPM IMERG with nine satellite and reanalysis datasets. Remote Sens. Environ. 2020, 240, 111697. [Google Scholar] [CrossRef]
    63. Kidd, C.; Bauer, P.; Turk, J.; Huffman, G.J.; Joyce, R.; Hsu, K.L.; Braithwaite, D. Intercomparison of High-Resolution Precipitation Products over Northwest Europe. J. Hydrometeorol. 2012, 13, 67–83. [Google Scholar] [CrossRef]
    64. Chua, Z.W.; Kuleshov, Y.; Watkins, A. Evaluation of Satellite Precipitation Estimates over Australia. Remote Sens. 2020, 12, 678. [Google Scholar] [CrossRef]
    65. Lockhoff, M.; Zolina, O.; Simmer, C.; Schulz, J. Representation of Precipitation Characteristics and Extremes in Regional Reanalyses and Satellite- and Gauge-Based Estimates over Western and Central Europe. J. Hydrometeorol. 2019, 20, 1123–1145. [Google Scholar] [CrossRef]
    66. Lo Conti, F.; Hsu, K.L.; Noto, L.V.; Sorooshian, S. Evaluation and comparison of satellite precipitation estimates with reference to a local area in the Mediterranean Sea. Atmos. Res. 2014, 138, 189–204. [Google Scholar] [CrossRef]
    67. Salio, P.; Hobouchian, M.P.; García Skabar, Y.; Vila, D. Evaluation of high-resolution satellite precipitation estimates over southern South America using a dense rain gauge network. Atmos. Res. 2015, 163, 146–161. [Google Scholar] [CrossRef]
    68. Wang, Q.; Zeng, Y.; Mannaerts, C.; Golroudbary, V.R. Determining Relative Errors of Satellite Precipitation Data over The Netherlands. In Proceedings of the 2nd International Electronic Conference on Remote Sensing, Online, 22 March–5 April 2018; Volume 22. [Google Scholar] [CrossRef]
    69. Song, L.; Xu, C.; Long, Y.; Lei, X.; Suo, N.; Cao, L. Performance of Seven Gridded Precipitation Products over Arid Central Asia and Subregions. Remote Sens. 2022, 14, 6039. [Google Scholar] [CrossRef]
    70. Beck, H.E.; Vergopolan, N.; Pan, M.; Levizzani, V.; van Dijk, A.I.J.M.; Weedon, G.P.; Brocca, L.; Pappenberger, F.; Huffman, G.J.; Wood, E.F. Global-scale evaluation of 22 precipitation datasets using gauge observations and hydrological modeling. Hydrol. Earth Syst. Sci. 2017, 21, 6201–6217. [Google Scholar] [CrossRef]
    71. El Kenawy, A.M.; McCabe, M.F.; Lopez-Moreno, J.I.; Hathal, Y.; Robaa, S.M.; Al Budeiri, A.L.; Jadoon, K.Z.; Abouelmagd, A.; Eddenjal, A.; Domínguez-Castro, F.; et al. Spatial assessment of the performance of multiple high-resolution satellite-based precipitation data sets over the Middle East. Int. J. Climatol. 2019, 39, 2522–2543. [Google Scholar] [CrossRef]
    72. Gao, Y.C.; Liu, M.F. Evaluation of high-resolution satellite precipitation products using rain gauge observations over the Tibetan Plateau. Hydrol. Earth Syst. Sci. 2013, 17, 837–849. [Google Scholar] [CrossRef]
    73. Camici, S.; Ciabatta, L.; Massari, C.; Brocca, L. How reliable are satellite precipitation estimates for driving hydrological models: A verification study over the Mediterranean area. J. Hydrol. 2018, 563, 950–961. [Google Scholar] [CrossRef]
    74. Navarro, A.; García-Ortega, E.; Merino, A.; Sánchez, J.L.; Kummerow, C.; Tapiador, F.J. Assessment of IMERG precipitation estimates over Europe. Remote Sens. 2019, 11, 2470. [Google Scholar] [CrossRef]
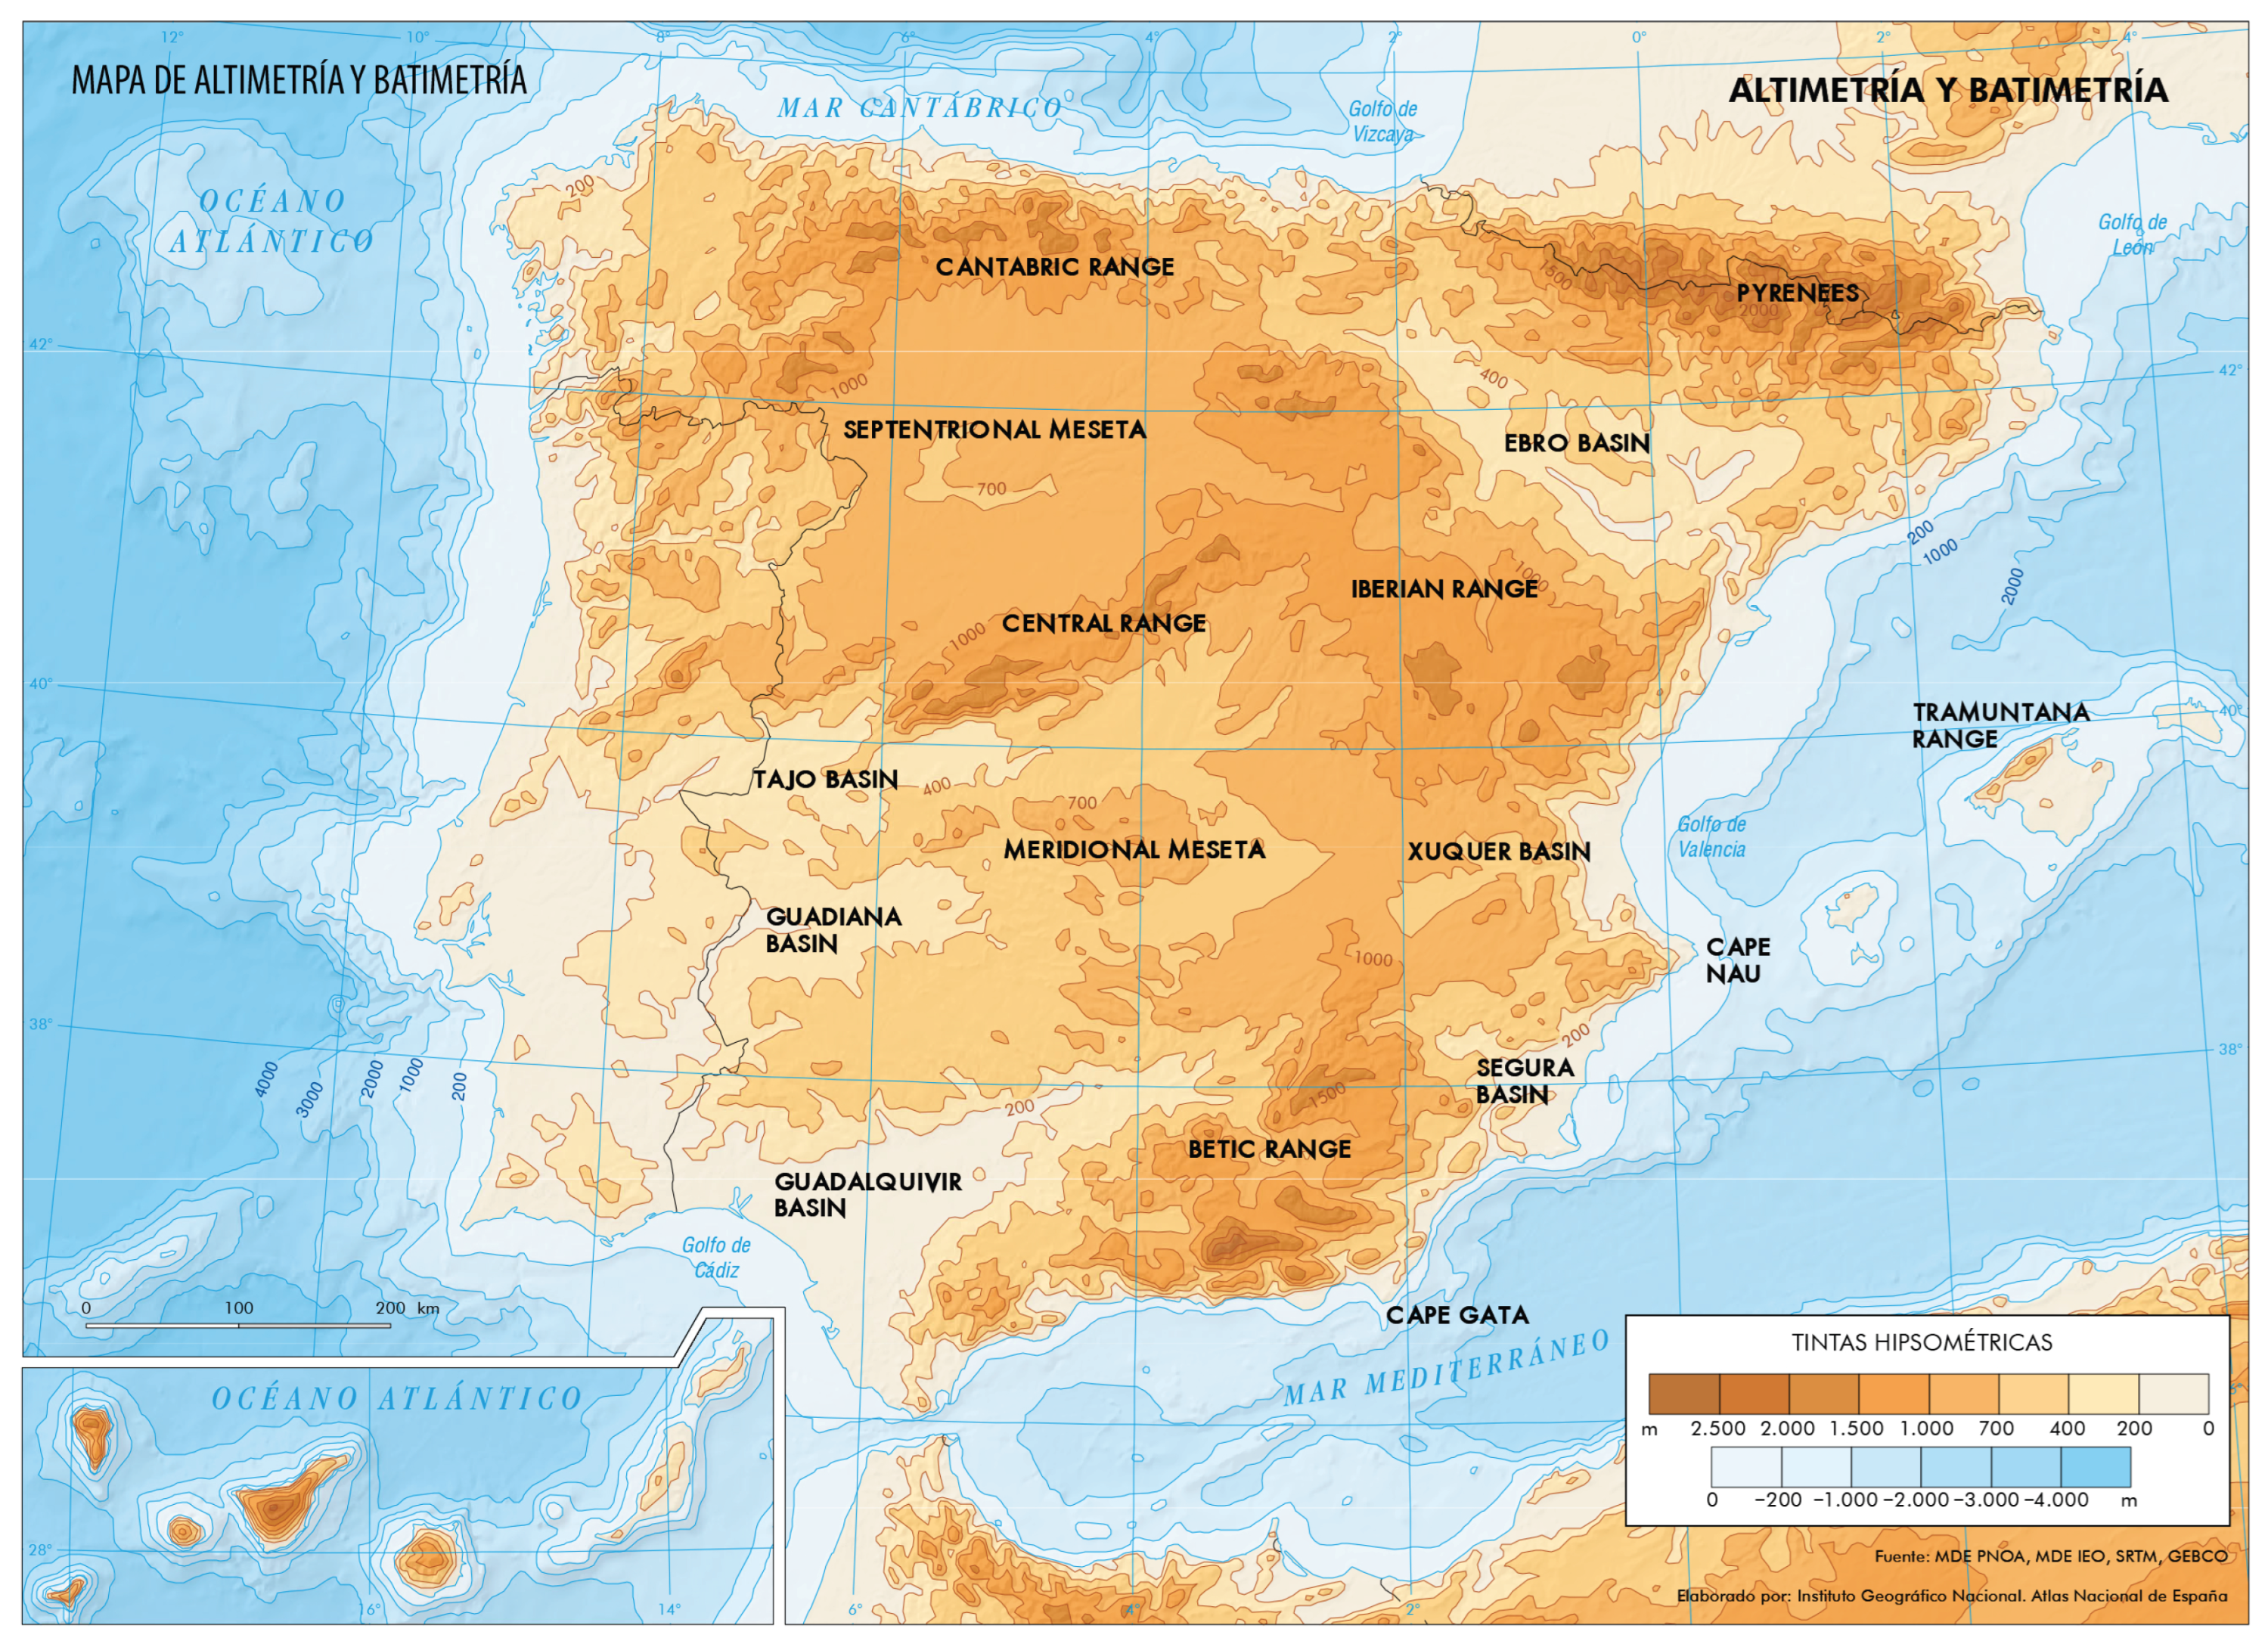
    Figure 1. Altimetry and bathymetry (in metres) across Spain and surroundings [20]. Indications of the main geographical features were made on top of the original map. (Tintas hipsométricas: hypsometric intervals).
    Figure 1. Altimetry and bathymetry (in metres) across Spain and surroundings [20]. Indications of the main geographical features were made on top of the original map. (Tintas hipsométricas: hypsometric intervals).
    Remotesensing 17 03562 g001
    Figure 2. Köppen–Geiger climate classification across Spain for the 1981–2010 period [20].
    Figure 2. Köppen–Geiger climate classification across Spain for the 1981–2010 period [20].
    Remotesensing 17 03562 g002
    Figure 3. Mean annual temperature (in °C) across Spain for the 1981–2010 period [20]. Decimal point is represented by a comma in this figure.
    Figure 3. Mean annual temperature (in °C) across Spain for the 1981–2010 period [20]. Decimal point is represented by a comma in this figure.
    Remotesensing 17 03562 g003
    Figure 4. Mean annual accumulated precipitation (in mm) across Spain for the 1981–2010 period [20].
    Figure 4. Mean annual accumulated precipitation (in mm) across Spain for the 1981–2010 period [20].
    Remotesensing 17 03562 g004
    Figure 5. Mean annual accumulated precipitation (in mm) across the study area along the 1981–2010 period for our AEMET-based dataset at 0.1° lat-lon resolution.
    Figure 5. Mean annual accumulated precipitation (in mm) across the study area along the 1981–2010 period for our AEMET-based dataset at 0.1° lat-lon resolution.
    Remotesensing 17 03562 g005
    Figure 6. Pixel-wise density of gauges associated to the employed AEMET dataset for 0.25° and 0.1° lat-lon resolutions.
    Figure 6. Pixel-wise density of gauges associated to the employed AEMET dataset for 0.25° and 0.1° lat-lon resolutions.
    Remotesensing 17 03562 g006
    Figure 7. Mean pixel altitude in metres from NASA SRTM DEM (left) and mean pixel TRI calculated from NASA SRTM DEM (right) across the study area, resampled at 0.1° lat-lon resolution from the original 3 arcsec lat-lon resolution.
    Figure 7. Mean pixel altitude in metres from NASA SRTM DEM (left) and mean pixel TRI calculated from NASA SRTM DEM (right) across the study area, resampled at 0.1° lat-lon resolution from the original 3 arcsec lat-lon resolution.
    Remotesensing 17 03562 g007
    Figure 8. Probability density functions of precipitation grouped by approximate reference quartiles (in mm   day 1 ) for reference AEMET dataset (A), CMORPH V1.0 (C), IMERG V07A (I) and MSWEP V2.8 (M). Left figure includes dry days to cover all data, while right figure excludes them for focusing on wet days. Plots are inspired in those found in chino [45].
    Figure 8. Probability density functions of precipitation grouped by approximate reference quartiles (in mm   day 1 ) for reference AEMET dataset (A), CMORPH V1.0 (C), IMERG V07A (I) and MSWEP V2.8 (M). Left figure includes dry days to cover all data, while right figure excludes them for focusing on wet days. Plots are inspired in those found in chino [45].
    Remotesensing 17 03562 g008
    Figure 9. Stacked bars charts for absolute value contributions of each type of bias (Positive Hit bias, Negative Hit bias, False bias and Miss bias) to Total bias and for ratios of occurrences (reports of any gauge and any day) of each type of bias to the total of bias occurrences. In each chart, left bars correspond to CMORPH V1.0, middle ones to IMERG V07A and right ones to MSWEP V2.8. For intensity grouping, labels indicate median quartiles across all pixels (in mm   day 1 ).
    Figure 9. Stacked bars charts for absolute value contributions of each type of bias (Positive Hit bias, Negative Hit bias, False bias and Miss bias) to Total bias and for ratios of occurrences (reports of any gauge and any day) of each type of bias to the total of bias occurrences. In each chart, left bars correspond to CMORPH V1.0, middle ones to IMERG V07A and right ones to MSWEP V2.8. For intensity grouping, labels indicate median quartiles across all pixels (in mm   day 1 ).
    Remotesensing 17 03562 g009
    Figure 10. Violin plots from the pixel-wise evaluation indices and error components for CMORPH V1.0 (C), IMERG V07A (I) and MSWEP V2.8 (M) versus AEMET ground gauges across the 2001–2020 period at daily resolution without any grouping. Values range from 5th to 95th percentiles for better clarity. Stripes indicate 10th, 25th, 50th, 75th and 90th percentiles. Median value is explicitly shown.
    Figure 10. Violin plots from the pixel-wise evaluation indices and error components for CMORPH V1.0 (C), IMERG V07A (I) and MSWEP V2.8 (M) versus AEMET ground gauges across the 2001–2020 period at daily resolution without any grouping. Values range from 5th to 95th percentiles for better clarity. Stripes indicate 10th, 25th, 50th, 75th and 90th percentiles. Median value is explicitly shown.
    Remotesensing 17 03562 g010
    Figure 11. Maps from performance metrics and error components for CMORPH V1.0 (left), IMERG V07A (center) and MSWEP V2.8 (right) versus AEMET ground gauges across the 2001–2020 period at daily resolution without any grouping.
    Figure 11. Maps from performance metrics and error components for CMORPH V1.0 (left), IMERG V07A (center) and MSWEP V2.8 (right) versus AEMET ground gauges across the 2001–2020 period at daily resolution without any grouping.
    Remotesensing 17 03562 g011
    Figure 12. Maps from performance metrics and error components for CMORPH V1.0 (left), IMERG V07A (center) and MSWEP V2.8 (right) versus AEMET ground gauges across the 2001–2020 period at daily resolution without any grouping.
    Figure 12. Maps from performance metrics and error components for CMORPH V1.0 (left), IMERG V07A (center) and MSWEP V2.8 (right) versus AEMET ground gauges across the 2001–2020 period at daily resolution without any grouping.
    Remotesensing 17 03562 g012
    Figure 13. Maps from performance metrics and error components for CMORPH V1.0 (left), IMERG V07A (center) and MSWEP V2.8 (right) versus AEMET ground gauges across the 2001–2020 period at daily resolution without any grouping.
    Figure 13. Maps from performance metrics and error components for CMORPH V1.0 (left), IMERG V07A (center) and MSWEP V2.8 (right) versus AEMET ground gauges across the 2001–2020 period at daily resolution without any grouping.
    Remotesensing 17 03562 g013
    Figure 14. Violin plots from the pixel-wise evaluation indices and error components for CMORPH V1.0 (C), IMERG V07A (I) and MSWEP V2.8 (M) versus AEMET ground gauges across the 2001–2020 period at monthly resolution without any grouping. Values range from 5th to 95th percentiles for better clarity. Stripes indicate 10th, 25th, 50th, 75th and 90th percentiles. Median value is explicitly shown.
    Figure 14. Violin plots from the pixel-wise evaluation indices and error components for CMORPH V1.0 (C), IMERG V07A (I) and MSWEP V2.8 (M) versus AEMET ground gauges across the 2001–2020 period at monthly resolution without any grouping. Values range from 5th to 95th percentiles for better clarity. Stripes indicate 10th, 25th, 50th, 75th and 90th percentiles. Median value is explicitly shown.
    Remotesensing 17 03562 g014
    Figure 15. Violin plots from the pixel-wise evaluation indices and error components for CMORPH V1.0 (C), IMERG V07A (I) and MSWEP V2.8 (M) versus AEMET ground gauges across the 2001–2020 period at daily resolution and seasonal grouping (Wi: Winter, Sp: Spring, Su: Summer, Au: Autumn; see Section 4.3). Values range from 5th to 95th percentiles for better clarity. Stripes indicate 10th, 25th, 50th, 75th and 90th percentiles.
    Figure 15. Violin plots from the pixel-wise evaluation indices and error components for CMORPH V1.0 (C), IMERG V07A (I) and MSWEP V2.8 (M) versus AEMET ground gauges across the 2001–2020 period at daily resolution and seasonal grouping (Wi: Winter, Sp: Spring, Su: Summer, Au: Autumn; see Section 4.3). Values range from 5th to 95th percentiles for better clarity. Stripes indicate 10th, 25th, 50th, 75th and 90th percentiles.
    Remotesensing 17 03562 g015
    Figure 16. Violin plots from the pixel-wise evaluation indices and error components for CMORPH V1.0 (C), IMERG V07A (I) and MSWEP V2.8 (M) versus AEMET ground gauges across the 2001–2020 period at daily resolution and grouping by approximate pixel-wise quartiles from the reference gauge data (median values shown as labels, in mm   day 1 ). Values range from 5th to 95th percentiles for better clarity. Stripes indicate 10th, 25th, 50th, 75th and 90th percentiles.
    Figure 16. Violin plots from the pixel-wise evaluation indices and error components for CMORPH V1.0 (C), IMERG V07A (I) and MSWEP V2.8 (M) versus AEMET ground gauges across the 2001–2020 period at daily resolution and grouping by approximate pixel-wise quartiles from the reference gauge data (median values shown as labels, in mm   day 1 ). Values range from 5th to 95th percentiles for better clarity. Stripes indicate 10th, 25th, 50th, 75th and 90th percentiles.
    Remotesensing 17 03562 g016
    Figure 17. Violin plots from the pixel-wise evaluation indices and error components for CMORPH V1.0 (C), IMERG V07A (I) and MSWEP V2.8 (M) versus AEMET ground gauges across the 2001–2020 period at daily resolution and grouping by SRTM-based altitude intervals (Lw: Low, hL: higher-Low, lH: lower-High, Hg: High; see Section 4.3). Values range from 5th to 95th percentiles for better clarity. Stripes indicate 10th, 25th, 50th, 75th and 90th percentiles.
    Figure 17. Violin plots from the pixel-wise evaluation indices and error components for CMORPH V1.0 (C), IMERG V07A (I) and MSWEP V2.8 (M) versus AEMET ground gauges across the 2001–2020 period at daily resolution and grouping by SRTM-based altitude intervals (Lw: Low, hL: higher-Low, lH: lower-High, Hg: High; see Section 4.3). Values range from 5th to 95th percentiles for better clarity. Stripes indicate 10th, 25th, 50th, 75th and 90th percentiles.
    Remotesensing 17 03562 g017
    Figure 18. Violin plots from the pixel-wise evaluation indices and error components for CMORPH V1.0 (C), IMERG V07A (I) and MSWEP V2.8 (M) versus AEMET ground gauges across the 2001–2020 period at daily resolution and grouping by SRTM-based TRI intervals (Fl: Flat, sF: stepper-Flat, fS: flatter-Steep, St: Steep; see Section 4.3). Values range from 5th to 95th percentiles for better clarity. Stripes indicate 10th, 25th, 50th, 75th and 90th percentiles.
    Figure 18. Violin plots from the pixel-wise evaluation indices and error components for CMORPH V1.0 (C), IMERG V07A (I) and MSWEP V2.8 (M) versus AEMET ground gauges across the 2001–2020 period at daily resolution and grouping by SRTM-based TRI intervals (Fl: Flat, sF: stepper-Flat, fS: flatter-Steep, St: Steep; see Section 4.3). Values range from 5th to 95th percentiles for better clarity. Stripes indicate 10th, 25th, 50th, 75th and 90th percentiles.
    Remotesensing 17 03562 g018
    Figure 19. Violin plots from the pixel-wise evaluation indices and error components for CMORPH V1.0 (C), IMERG V07A (I) and MSWEP V2.8 (M) versus AEMET ground gauges across the 2001–2020 period at daily resolution and grouping by amount of gauges per pixel. Values range from 5th to 95th percentiles for better clarity. Stripes indicate 10th, 25th, 50th, 75th and 90th percentiles. Median value is explicitly shown.
    Figure 19. Violin plots from the pixel-wise evaluation indices and error components for CMORPH V1.0 (C), IMERG V07A (I) and MSWEP V2.8 (M) versus AEMET ground gauges across the 2001–2020 period at daily resolution and grouping by amount of gauges per pixel. Values range from 5th to 95th percentiles for better clarity. Stripes indicate 10th, 25th, 50th, 75th and 90th percentiles. Median value is explicitly shown.
    Remotesensing 17 03562 g019
    Table 1. Definition of metrics to assess the SPPs performance, where: s i = SPP precipitation value, g i = ground gauge precipitation value, hW = hit wet events, hD = hit dry events, M = miss events and F = false events. Overbar represents mean value. For rMAE, if s i or g i is zero, g i is set to the detection threshold p = 1   mm .
    Table 1. Definition of metrics to assess the SPPs performance, where: s i = SPP precipitation value, g i = ground gauge precipitation value, hW = hit wet events, hD = hit dry events, M = miss events and F = false events. Overbar represents mean value. For rMAE, if s i or g i is zero, g i is set to the detection threshold p = 1   mm .
    NameAbbreviationDefinitionBest Value
    Hit RateHtR h W + h D h W + h D + F + M 1
    Probability of DetectionPOD h W h W + M 1
    False Alarm RatioFAR F h W + F 0
    Overestimation RateOvR h W [ s i g i > 0 ] h W 0
    Underestimation RateUdR h W [ s i g i < 0 ] h W 0
    Correlation CoefficientCC ( s i s ¯ ) ( g i g ¯ ) ( s i s ¯ ) 2 ( g i g ¯ ) 2 1
    Relative Mean Absolute ErrorrMAE s i g i g i ¯ 0
    Table 2. Details on the agroupation criteria used to gather the precipitation data for deeper performance analysis.
    Table 2. Details on the agroupation criteria used to gather the precipitation data for deeper performance analysis.
    SeasonalAltitudeOrography
    Winter: December, January and FebruaryLow altitude = DEM [ 0 , 500 ) m Flat terrain: TRI [ 0 , 6 )
    Spring: March, April and Mayhigher-Low altitude = DEM [ 500 , 1000 ) m steepper-Flat terrain: TRI [ 6 , 9.5 )
    Summer: June, July and Augustlower-High altitude = DEM [ 1000 , 1500 ) m flatter-Steep terrain: TRI [ 9.5 , 14 )
    Autumn: September, October and NovemberHigh altitude = DEM [ 1500 , ) m Steep terrain: TRI [ 14 , )
    Disclaimer/Publisher’s Note: The statements, opinions and data contained in all publications are solely those of the individual author(s) and contributor(s) and not of MDPI and/or the editor(s). MDPI and/or the editor(s) disclaim responsibility for any injury to people or property resulting from any ideas, methods, instructions or products referred to in the content.

    Share and Cite

    MDPI and ACS Style

    García-Ten, A.; Niclòs, R.; Valor, E.; Caselles, V.; Estrela, M.J.; Miró, J.J.; Luna, Y.; Belda, F. Evaluation of CMORPH V1.0, IMERG V07A and MSWEP V2.8 Satellite Precipitation Products over Peninsular Spain and the Balearic Islands. Remote Sens. 2025, 17, 3562. https://doi.org/10.3390/rs17213562

    AMA Style

    García-Ten A, Niclòs R, Valor E, Caselles V, Estrela MJ, Miró JJ, Luna Y, Belda F. Evaluation of CMORPH V1.0, IMERG V07A and MSWEP V2.8 Satellite Precipitation Products over Peninsular Spain and the Balearic Islands. Remote Sensing. 2025; 17(21):3562. https://doi.org/10.3390/rs17213562

    Chicago/Turabian Style

    García-Ten, Alejandro, Raquel Niclòs, Enric Valor, Vicente Caselles, María José Estrela, Juan Javier Miró, Yolanda Luna, and Fernando Belda. 2025. "Evaluation of CMORPH V1.0, IMERG V07A and MSWEP V2.8 Satellite Precipitation Products over Peninsular Spain and the Balearic Islands" Remote Sensing 17, no. 21: 3562. https://doi.org/10.3390/rs17213562

    APA Style

    García-Ten, A., Niclòs, R., Valor, E., Caselles, V., Estrela, M. J., Miró, J. J., Luna, Y., & Belda, F. (2025). Evaluation of CMORPH V1.0, IMERG V07A and MSWEP V2.8 Satellite Precipitation Products over Peninsular Spain and the Balearic Islands. Remote Sensing, 17(21), 3562. https://doi.org/10.3390/rs17213562

    Note that from the first issue of 2016, this journal uses article numbers instead of page numbers. See further details here.

    Article Metrics

    Back to TopTop