Highlights
What are the main findings?
- The study identified the integrated Soil Moisture–Vegetation Health Index (SM-VHI) as an effective method for detecting drought in East Africa, with optimal performance achieved at an α value of 0.5 and a Critical Success Index (CSI) of 0.78.
- Strong correlations between SM-VHI and other drought indicators (such as the Soil Moisture Index and SPEI-1) were observed, highlighting regional variations in soil moisture dynamics.
What are the implications of the main finding?
- The reliability of the SM-VHI underscores its potential for enhancing drought monitoring, which can inform better agricultural practices and policy formulation aimed at improving food security.
- Recognizing drought severity patterns can facilitate the development of tailored management strategies to address challenges posed by drought in a changing climate.
Abstract
This study presents a comprehensive analysis of the integrated Soil Moisture–Vegetation Health Index (SM-VHI) as a robust tool for drought detection and agricultural monitoring across East Africa using data from 2000 to 2020. A sensitivity analysis within the SM-VHI algorithm identified an optimal parameter weighting (α = 0.5), which improved detection accuracy, achieving a Critical Success Index (CSI) of 0.78. The SM-VHI exhibited strong correlations with independent drought indicators, including the Standardized Soil Moisture Index (SSMI), Vegetation Health Index (VHI), and one-month Standardized Precipitation-Evapotranspiration Index (SPEI-1), confirming its reliability in capturing agricultural drought dynamics and vegetation stress responses across diverse climatic conditions. Through spatial and temporal trend analyses, we identified patterns of drought severity and recovery, which emphasized the importance of tailored management strategies. Furthermore, the analysis incorporated historical maize yield data to evaluate the effectiveness of SM-VHI in representing agricultural drought conditions. A notable positive correlation (R = 0.45–0.72) was identified between SM-VHI anomalies and detrended maize yield throughout East Africa, suggesting that enhanced vegetation and soil moisture conditions are strongly linked to increased crop productivity. This validation demonstrates the capability of SM-VHI to effectively capture drought-induced yield variability. The findings confirm the effectiveness of SM-VHI as a reliable remote-sensing tool for monitoring drought conditions and have strong potential to inform agricultural practices and policy decisions aimed at enhancing food security in a changing climate.
1. Introduction
Drought represents a significant challenge to water security, agricultural productivity, and rural livelihoods in East Africa, a region characterized by its interannual climate variability and susceptibility to hydro-meteorological extremes [1,2]. The socio-economic impacts of drought are profound, affecting millions of people whose livelihoods depend on agricultural output and access to water resources [3,4]. As climate change exacerbates rainfall variability and temperature extremes, understanding and monitoring drought conditions becomes increasingly critical for food security and sustainable development [5,6]. Traditional approaches to drought assessment often rely on singular indicators that address only specific components of the complex hydrological vegetation system [7,8]. For instance, soil-moisture metrics provide valuable insights into water availability for plants, while vegetation-based indices capture the ecosystem’s responses to drought stress.
However, drought is a multi-faceted phenomenon that unfolds through interconnected soil–plant–atmosphere processes. It is evident that focusing on individual indicators can lead to an incomplete understanding of drought dynamics, underscoring the need for integrative drought indicators that synthesize hydrological and biological signals [9,10]. Such integrative approaches can enhance detection, monitoring, and early warning capabilities, ultimately enabling stakeholders to respond effectively to drought conditions, provided adequate water resources are available.
Existing drought indices offer valuable perspectives on water availability and plant stress but can sometimes yield discordant results [9]. Several indices offer different perspectives, each with its own strengths and limitations. For example, the Vegetation Health Index (VHI) summarizes vegetation condition using remotely sensed reflectance and thermal data [11,12]. While it provides a vegetation-centric view of drought impacts, it doesn’t directly represent soil water status, which is crucial for understanding overall ecosystem health [13]. Conversely, the Standardized Soil Moisture Index (SSI/SSMI) emphasizes soil-column water content and can be an excellent measure of dryness within the soil [14]. However, it may underrepresent plant physiological stress during extreme conditions or not adequately account for feedback loops between vegetation and soil moisture [15,16]. Other indices, like the Visible and Shortwave infrared Drought Index (VSDI) and the Multivariate Standardized Drought Index (MSDI), offer valuable insights but also have limitations that SM-VHI aims to address. The VSDI, developed by Zhang, Hong [17], uses optical spectral bands in the Blue, Red, and Shortwave infrared (SWIR) regions to effectively monitor soil and vegetation moisture throughout growing seasons, but its application in East Africa warrants further examination due to the region’s unique climatic and environmental conditions [18]. The MSDI extends the univariate Standardized Precipitation Index (SPI) by utilizing joint distributions of precipitation and soil moisture, providing a comprehensive characterization of meteorological and agricultural droughts [19]; however, it may not fully capture the integrated effects of soil moisture and vegetation health specific to the challenges faced in East African agriculture. Additionally, the Standardized Precipitation Evapotranspiration Index (SPEI) particularly SPEI-1 captures moisture anomalies by integrating precipitation data and atmospheric evaporative demand [20,21]. While it offers valuable insights into meteorological conditions, it lacks the ability to directly reflect vegetation status or account for the critical interactions between soil moisture and plant responses [21,22]. These shortcomings highlight the necessity for more comprehensive drought monitoring tools that can holistically address both soil moisture dynamics and vegetation health. Operational drought monitoring platforms in East Africa thus face critical gaps in providing timely, multi-scalar, and cross-validated assessments that are essential for informing various sectors such as agriculture, water management, and disaster response. To fill this gap, there is a compelling need for the development of an innovative composite drought indicator that explicitly integrates soil moisture and vegetation health to deliver a coherent and regionally calibrated metric of drought risk and severity.
In response to this need, we present the integrated Soil Moisture–Vegetation Health Index (SM-VHI). This novel index fuses near-real-time soil moisture signals with metrics of vegetation condition to create a holistic and climate-responsive indicator of drought. The main goals of this study are threefold: (i) to construct an operational index that harnesses complementary information from both soil moisture and vegetation health, enabling a more nuanced capture of the intricate interactions between soil, plants, and the atmosphere; (ii) to calibrate and validate the SM-VHI against established drought indicators specifically the Vegetation Health Index (VHI), Standardized Soil Moisture Index (SSI/SSMI), and one-month Standardized Precipitation-Evapotranspiration Index (SPEI-1), as well as detrended maize yield data, to ensure that the index is interpretable, comparable, and robust for assessing agricultural drought conditions; and (iii) to demonstrate the utility of the composite index for effective drought monitoring in East Africa. Upon achieving these objectives, we intend to deliver actionable implications for early warning systems, agricultural planning, water resources management and regional resilience efforts, which will improve communities’ capacity to adapt to and mitigate drought effects.
2. Materials and Methods
2.1. Study Area
The study area encompasses the Eastern African region, including Djibouti, Eritrea, Rwanda, Burundi, Tanzania, Kenya, Uganda, Somalia, and Ethiopia (Figure 1). Geographically, this region lies approximately between 15°N and 12°S latitude, and 30°E and 52°E longitude, covering an area of approximately 4 million square kilometers. This region is characterized by diverse landscapes and climatic zones, ranging from arid lowlands to tropical highlands. The climate is primarily tropical, with significant variations due to topography. Eastern Africa has two primary rainfall seasons: the “long rains” from March–May and the “short rains” from October–December [23,24]. Annual rainfall ranges from less than 200 mm in arid areas to over 2000 mm in highlands, with mean annual temperatures varying from 10 °C in the highlands to 30 °C in the lowlands. The region’s agricultural landscape is diverse, including the highlands of Ethiopia, Kenya, and Tanzania, known for coffee, tea, and horticulture; the Lake Victoria basin, supporting mixed crop-livestock systems; and semi-arid regions where pastoralism and drought-resistant crops like sorghum and millet are common. The topography is marked by the East African Rift System, featuring notable landmarks such as Mount Kilimanjaro, Mount Kenya, and the Danakil Depression. This varied geography and climate make Eastern Africa particularly vulnerable to agricultural drought, underlining the importance of accurate and timely drought monitoring systems. Overall, the study area focuses on the socio-ecological system of Eastern Africa, with a specific focus on agricultural drought vulnerability.
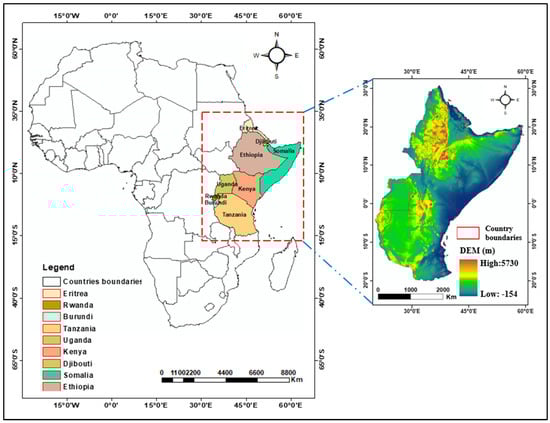
Figure 1.
Location map of the study area.
2.2. Data Sources
2.2.1. Meteorological Data
The TerraClimate archive served as our primary source for monthly climate fields and water-balance variables tailored to land surfaces. Operating at a native spatial resolution of 4 km, TerraClimate provides precipitation (PRE) and potential evapotranspiration (PET) data for the period from 1981 to 2021. Notably, the PET values are computed using the Penman-Monteith method, a robust standard in the field. This combination of extensive temporal coverage and fine spatial resolution is essential for tracking drought dynamics across East Africa and supporting agricultural risk management. We complemented these data with the ERA5-Land reanalysis, which delivers gridded climate information at monthly intervals with a nominal spatial resolution of ~9 km [25,26]. Given its relevance for dryland environments, we used the 1-km resolution Global Daily Surface Soil Moisture Dataset (2000–2020) from the National Tibetan Plateau Data Center (TPDC) to extract soil moisture (SM). This dataset, available at https://doi.org/10.11888/RemoteSen.tpdc.272760, was developed using a machine learning approach based on the ESA Climate Change Initiative (ESA-CCI) dataset and is suitable for arid and semi-arid environments. For this study, we used monthly SM spanning 2000 to 2020 and resampled it to 5 km via bilinear interpolation to harmonize with the other datasets. To assess and validate the proposed index, we employed the one-month time scale Standardized Precipitation–Evapotranspiration Index (SPEI-1), the Vegetation Health Index (VHI), and Standardized Soil Moisture Index (SSMI), thereby supporting our goal of constructing a more holistic drought indicator for East Africa that jointly represents vegetation status and soil moisture conditions.
2.2.2. Vegetation Data
We used two MODIS products to characterize vegetation and thermal conditions. MOD11A2 supplies land surface temperature (LST) at an 8-day cadence with a native spatial resolution of 1 km, whereas MOD13A3 provides the normalized difference vegetation index (NDVI) at 1 km resolution with a 16-day temporal frequency. Both datasets were retrieved from NASA’s Earth Data Portal: https://ladsweb.modaps.eosdis.nasa.gov/search/ (accessed on 10 June 2023). For compositing, both MODIS products were aggregated to produce monthly averages. During this process, we utilized a cloud masking technique to exclude observations affected by cloud cover, ensuring more accurate representations of land conditions. For the 2000–2020 period, we derived the Vegetation Condition Index (VCI) from NDVI and the Temperature Condition Index (TCI) from LST. These components were subsequently combined to compute the Vegetation Health Index (VHI), which we used to validate the newly developed agricultural drought index for East Africa.
2.2.3. Crop Yield Data
Maize yield data were obtained from the Food and Agriculture Organization of the United Nations (FAO) database through its FAOSTAT online platform (https://www.fao.org/faostat, accessed on 1 January 2020). The dataset provides national-level annual maize production statistics for all East African countries considered in this study.
The data cover the period 2000–2020, offering a temporal resolution of one year for each country. As FAO yield data are compiled from official national agricultural statistics, they represent mean production conditions aggregated over the main maize-growing regions within each country. Therefore, the data provide a spatial resolution at the national scale, suitable for large-region comparative drought assessments and interannual variability analysis. Prior to analysis, maize yield values were detrended to remove the effects of technological improvements, management changes, and long-term productivity trends, ensuring that observed yield fluctuations reflected primarily climatic and drought-related variability. The yield anomalies were then correlated with the corresponding SM-VHI anomalies to assess the index’s ability to capture agricultural drought impacts and interannual variations in crop productivity.
3. Methodology
3.1. NDVI-Based Feature Space Analysis
Figure 2 visually represents key components related to remote sensing analysis, focusing on the relationships between spectral reflectance values, vegetation characteristics, NDVI, and soil moisture [27,28,29]. At its core, the diagram emphasizes remote sensing analysis as the foundation for interpreting data. The triangular distribution, highlighted in green, illustrates the reflectance values in the Red-NIR spectral space and signifies its importance in analyzing the interplay between these two spectral bands. Adjacent to this, the section marked in orange represents vegetation characteristics, demonstrating how insights gained from the triangular distribution contribute to understanding plant health and structure. The blue segment focuses on NDVI and soil moisture (SM) iso-lines, showing how NDVI values correlate with varying soil moisture levels, with parallel lines indicating consistent relationships across these parameters. Lastly, the yellow area emphasizes soil moisture content, highlighting its significance in relation to both plant health and soil dynamics. The flowing color scheme throughout the figure illustrates the interconnectedness of these concepts, making the complexities of remote sensing analysis more accessible. The Normalized Difference Vegetation Index (NDVI) is computed using Equation (1) below.
where NIR is the near-infrared reflectance and RED is the red reflectance.
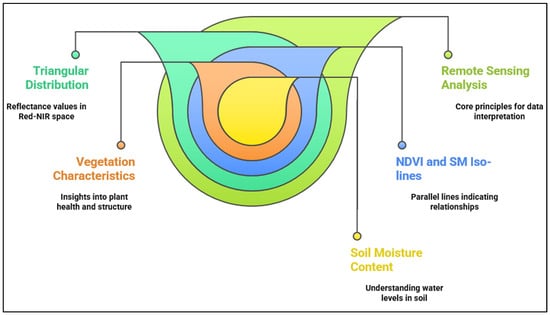
Figure 2.
The triangle distribution of the reflectance values in the Red-NIR spectral space and the NDVI and soil moisture (SM) iso-lines.
3.2. Remote Sensing-Based Drought Indices Computation
3.2.1. Standardized Precipitation Evapotranspiration Index (SPEI)
The Standardized Precipitation Evapotranspiration Index (SPEI) is a robust drought monitoring tool because it integrates both precipitation and temperature-influenced evapotranspiration, providing a more complete assessment than indices based solely on precipitation, like the Standardized Precipitation Index (SPI) [30].
Instead of calculating potential evapotranspiration (PET) using Thornthwaite [31] method as described by Vicente-Serrano, Beguería [32], this study directly uses pre-calculated PET data from TerraClimate. TerraClimate PET utilizes the Penman-Monteith method, a widely recognized approach leveraging comprehensive meteorological data. To maintain the integrity of TerraClimate’s original values and methodologies, the TerraClimate PET data was used directly without reprocessing in the SPEI calculations. These PET values, combined with precipitation data, are used to calculate the monthly water deficit (D) (Equation (2)). The Standardized Precipitation-Evapotranspiration Index (SPEI) is calculated and categorized into five categories (Table 1) [13,33] for effective drought assessment and early warning.

Table 1.
SPEI drought classification.
The SPEI index is computed as follows: First, compute the monthly water deficit (D) for year i and month j as the subtraction of precipitation and potential evapotranspiration:
Next, form the k-month accumulation of deficits, using a rolling window. Two cases handle whether the window crosses the year boundary (Equations (3) and (4)).
If j < k (the window extends into the previous year):
If j ≥ k (the entire window falls within the same year):
Then, model the distribution of the accumulated deficits with a three-parameter log-logistic distribution, with parameters estimated via L-moments [34]. Its cumulative distribution function is shown in Equation (5):
where α (scale), β (shape), and γ (origin) are the respective parameters.
Finally, compute the SPEI from using the Abramowitz and Stegun [35] approximation (Equations (6)–(9)):
where C0 = 2.515517, C1 = 0.802853, C2 = 0.010328, d1 = 1.432788, d2 = 0.189269 and d3 = 0.001308.
3.2.2. Standardized Soil Moisture Index (SSMI)
Soil moisture, defined as the water content within the unsaturated layers of the soil, is fundamental to agriculture and natural ecosystems [36,37]. Agricultural drought occurs when available soil water does not meet plant transpiration demand, which disrupts physiological functions and can reduce yields [38]. Soil moisture is also closely related to precipitation patterns and surface temperature [39]. Therefore, monitoring soil moisture is essential for assessing agricultural drought. Because plant growth and physiological activity depend directly on moisture in the root zone, variations in soil water at these depths serve as a primary indicator of agricultural drought conditions [40]. In our analysis, we utilized surface soil moisture data from the TPDC dataset, which specifically reflects conditions at the soil surface. This choice was made to represent the immediate moisture conditions affecting plant transpiration and root uptake [41]. However, absolute soil moisture values can vary considerably across different regions due to varying natural conditions. To account for these regional differences, the Standardized Soil Moisture Index (SSMI) normalizes these variations, effectively highlighting deviations and making it an integral component of numerous drought monitoring systems [42,43]. The SSMI is typically expressed as follows (Equation (10)) [42,43]:
where denotes the soil moisture at pixel i during 2000–2020, is the mean soil moisture used for standardization, and the corresponding standard deviation over the same period.
3.2.3. Vegetation Condition Index (VCI)
Multiple drought indices exist to characterize intensity, duration, severity, and spatial extent [44,45]. The VCI, derived from remote sensing, is directly linked to vegetation state and cover [46]. It is well suited for evaluating vegetation stress and for analyzing vegetation responses to anomalous conditions. Compared with NDVI, VCI isolates the weather component and reflects precipitation-related dynamics [47]. It also summarizes the cumulative influence of environmental factors on vegetation [48,49]. Beyond describing vegetation status, VCI supports the estimation of changes across space and time, and evaluating how weather affects vegetation. In this study, we computed the Vegetation Condition Index (VCI) using smoothed monthly NDVI from the MOD13A3 product as input. Kogan [50], reported that VCI is effective for detecting drought and for quantifying its onset time, intensity, duration, and vegetation impacts. Here, we apply the VCI to evaluate agricultural drought across the study area as specified in Equation (11).
where NDVI denotes the smoothed monthly value, and NDVImax and NDVImin are the absolute maximum and minimum NDVI values, respectively, observed over the period 2000–2020.
3.2.4. Temperature Condition Index (TCI)
The TCI is a satellite-derived drought metric that evaluates drought severity using land surface temperature (LST) data [50]. It is computed as (Equation (12)):
where LSTmax is the maximum LST, and LSTmin is the minimum LST over the reference period. The index ranges from 0 to 100, suggesting that lower values imply more severe drought.
3.2.5. Vegetation Health Index (VHI)
The VHI is a composite drought index that fuses the Vegetation Condition Index (VCI) and the Temperature Condition Index (TCI) to present a more comprehensive picture of vegetation stress under drought [51]. It is defined as (Equation (13)):
Lower VHI values indicate more severe drought. Both TCI and VHI have been widely employed in drought monitoring and assessment across many regions, including East Africa [52,53]. The VHI values are classified into five drought-severity categories, ranging from 0 to 100, as summarized in Table 2. An extreme drought condition (VHI < 10) signifies severe stress on vegetation, while severe drought (VHI 10–20) indicates substantial stress that can impact agricultural outputs. A moderate drought (VHI 20–30) shows moderate stress with signs of wilting, necessitating close monitoring. Mild drought (VHI 30–40) suggests slight stress, manageable with vigilance. Conversely, no drought (VHI > 40) indicates healthy vegetation with adequate moisture for optimal growth conditions.
Table 2.
VHI drought classifications [54].
3.3. Development and Calculation of the Integrated Soil Moisture Vegetation Health Index (SM-VHI)
The Integrated Soil Moisture Vegetation Health Index (SM-VHI) is designed to provide a comprehensive assessment of agricultural drought by integrating information from both vegetation and soil moisture indices. This approach leverages the complementary nature of vegetation and soil moisture, where vegetation indices capture plant response to water stress, and soil moisture represents the water available in the root zone [55,56]. The α value, a weighting parameter, was determined through a combination of literature review, sensitivity analysis, and optimization. Specifically, SM-VHI performance was evaluated for α values ranging from 0.1 to 0.9 (in 0.1 increments) by correlating the index with established drought indices and maize yields. The α value that maximized this correlation, accounting for potential spatial variations, was selected. The SM-VHI calculation involves several steps: First, long-term minimum and maximum values for the Normalized Difference Vegetation Index (NDVI) and soil moisture (SM) are calculated. Next, the VCI is derived from the NDVI, ultimately contributing to the VHI. Simultaneously, the Soil Moisture Condition Index (SMCI) is calculated from soil moisture using the following equation [57] (Equation (14)):
where SMij is the reanalyzed soil moisture in the ith month of the jth year, SMmin is the minimum soil moisture over the study period, and SMmax is the maximum soil moisture over the study period. Finally, the VHI and SMCI components are integrated using the selected α value to generate monthly and yearly SM-VHI maps for the study period. The SM-VHI is calculated as follows (Equation (15)):
where VHI represents the vegetation health index, SMCI is soil moisture condition index (both range from 0 to 100), and α is a weighting parameter. The min and max subscripts denote the minimum and maximum values over the study period for each variable. SM-VHI values vary from 0 to 100, with decreasing values signaling greater drought severity (Table 3).
Table 3.
Drought Classification Based on SM-VHI.
Sensitivity to the α Parameter
The Soil Moisture Vegetation Health Index (SM-VHI) algorithm uses an α parameter to tune its sensitivity to drought detection thresholds. α weights environmental factors, like soil moisture and vegetation health, when determining drought conditions. A lower α increases the model’s sensitivity, allowing it to detect subtle changes and potentially leading to more conservative drought classifications. Conversely, a higher α value decreases sensitivity, potentially leading to more robust drought detection while risking the oversight of minor moisture fluctuations. This flexibility in adjusting α allows researchers to tailor the index to specific regional conditions and agricultural needs. To rigorously assess the influence of this parameter on drought identification accuracy, we performed a systematic threshold sensitivity analysis as follows: The SM-VHI was calculated for a range of α values, specifically from 0.1 to 0.9 in increments of 0.1. For each α value, we compared the SM-VHI-derived drought classifications against the existing drought indices. This comparison facilitated the quantification of the impacts of the α parameter on both false positive and false negative rates in drought detection.
The statistical basis for selecting the optimal α was primarily informed by the Critical Success Index (CSI). The CSI evaluates model performance by integrating prediction accuracy and balancing correct detections with errors. We assessed different α values based on their respective CSI scores, allowing us to identify the threshold that maximized overall predictive accuracy. This approach is consistent with methodologies employed in similar studies, such as Zhang, Liu [58] and Katiraie-Boroujerdy, Nasrollahi [59], which also utilized CSI for performance assessment in drought detection models. Based on the findings from the threshold sensitivity analysis, we identified the α value that optimized overall accuracy in the SM-VHI for drought detection. The model’s accuracy was evaluated using the CSI metric, which was deemed particularly relevant since it provides an integrated measure of model performance in predicting drought conditions while accounting for errors in both directions (false positives and false negatives) [59]. The CSI metric is mathematically represented as follows:
where TP denotes the number of correctly predicted drought events, FN refers to the missed drought events, and FP indicates the incorrectly predicted drought events.
3.4. Validation and Performance Evaluation Methods
To assess the performance of the Soil Moisture Vegetation Health Index (SM-VHI), we employed a comprehensive, multi-faceted approach utilizing established drought indicators. Our evaluation was anchored on several key statistical measures: Pearson’s correlation coefficient (R), relative bias (RB), and root mean square error (RMSE). Each of these indicators was selected for its relevance in drought monitoring. Pearson’s correlation coefficient (R) is particularly useful for determining the strength and direction of the relationship between SM-VHI and reference indices, thus providing insights into the consistency of drought response across different metrics [60]. Relative bias (RB) allows us to quantify systematic discrepancies, highlighting any consistent under- or overestimations in SM-VHI relative to established indices [61]. RMSE serves as an overall measure of error, indicating the precision of SM VHI in relation to the reference indices, which is crucial for evaluating its reliability [62]. To ensure robustness, we benchmarked significant drought events against documented reports and quantitatively analyzed the SM-VHI in comparison to three reference indices: the 1-month Standardized Precipitation Evapotranspiration Index (SPEI 1), the original Vegetation Health Index (VHI), and a standardized Soil Moisture-based Drought Index (SSMI). In addition, detrended maize yield data were incorporated as historical records to further validate the agricultural drought detection capability of the SM-VHI. The relationship between SM-VHI anomalies and yield anomalies was examined using the same performance metrics, enabling an assessment of how well the index captures drought-induced yield variability across East Africa. The concurrent agreement between SM-VHI and each reference index was quantified using the Pearson’s correlation coefficients. Pearson’s coefficient was calculated as follows (Equation (17)):
where xi and yi are paired observations from SM-VHI and a given reference indices and detrended maize yield, and and are sample means. The formulas for calculating relative bias (RB) and root mean square error (RMSE) are provided below [63]:
where N represents the number of data; i represents the i-th data; RV represents SM-VHI; RR represents SPEI 1, VHI, and SSMI.
4. Results
4.1. Sensitivity Analysis of the SM-VHI to Different α Values
The sensitivity analysis of the α parameter within the SM-VHI algorithm produced significant insights regarding its effect on drought detection accuracy. By evaluating α values from 0.1 to 0.9, noteworthy variations in SM-VHI derived drought classifications were observed, specifically impacting the rates of false positives and false negatives.
The results indicated that as the α value increased, the model’s performance varied correspondingly. The analysis revealed that α values between 0.3 and 0.5 achieved a balanced sensitivity, characterized by reduced false negative rates while maintaining acceptable levels of false positives. The correlation coefficients with independent drought indicators peaked at α = 0.5, indicating an effective threshold for drought detection.
Following a comprehensive evaluation, the optimal α value was identified as α = 0.5, which yielded a Critical Success Index (CSI) of 0.78. This result signifies that 78% of accurately predicted drought events corresponded with observed occurrences (Table 4).
Table 4.
Selection of Optimal α Value Based on Critical Success Index (CSI).
4.2. Accuracy Assessment of the SM-VHI
4.2.1. Evaluation Using VHI Anomaly and SSMI
Figure 3 illustrates the correlation between z-score anomalies of Soil Moisture (SM-VHI), Vegetation Health Index (VHI), and Standardized Soil Moisture Index (SSMI) across several East African countries: Djibouti, Eritrea, Rwanda, Burundi, Tanzania, Kenya, Uganda, Somalia, and Ethiopia. The scatter plots reveal consistent positive correlations, with R values approaching 0.97 for some regions, indicating a strong relationship between the SM-VHI anomaly and SSMI. For instance, Djibouti and Burundi exhibit robust correlations, while other countries, such as Tanzania and Uganda, demonstrate slightly weaker relationships. RMSE (Root Mean Square Error) values also vary across the plots, reflecting the predictive accuracy of the models used; notably, lower RMSE values in Djibouti suggest a better model fit. The observed differences in performance of SM-VHI across countries in Figure 3 can be attributed to several factors, including variations in vegetation cover (type and density), which influences the sensitivity of VHI to soil moisture changes. Additionally, differing climatic conditions and rainfall regimes across these regions can impact the relationship between vegetation health and actual soil moisture. The quality and resolution of the SSMI data used for comparison, as well as potential scale mismatches between the SM-VHI and SSMI data, may also contribute to the observed variations in correlation and RMSE values. These findings underscore the effectiveness of VHI and SSMI as indicators of soil moisture conditions, essential for monitoring drought and informing agricultural practices.
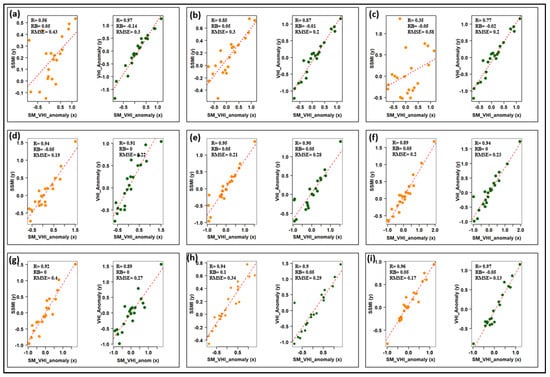
Figure 3.
Scatter plots of SM-VHI anomaly against VHI anomaly and SSMI under different country of the East Africa including: (a) Djibouti, (b) Eritrea, (c) Rwanda, (d) Burundi, (e) Tanzania, (f) Kenya, (g) Uganda, (h) Somalia, (i) Ethiopia.
4.2.2. Evaluation Based on SPEI-1
Figure 4 presents time series plots (2000–2020) of SM-VHI anomaly, VHI anomaly, SSMI, and SPEI-1 for several East African countries including Djibouti, Eritrea, Rwanda, Burundi, Tanzania, Kenya, Uganda, Somalia, and Ethiopia. The plots illustrate the temporal fluctuations of these indices, providing insights into moisture dynamics within each country. In Djibouti, a noticeable increase in SM-VHI anomaly is apparent, alongside fluctuations in VHI anomaly, SSMI, and SPEI-1, indicating variable moisture availability. Eritrea demonstrates similar oscillating fluctuations across all indices, particularly evident between 2007 and 2015. Rwanda displays a weaker correlation between SM-VHI and VHI anomalies compared to other countries, suggesting differing local climatic drivers. Burundi and Tanzania show a relatively consistent relationship between SM-VHI anomaly and SSMI, while SPEI-1 exhibits greater volatility. In Kenya and Uganda, SM-VHI anomalies closely track SSMI values, especially during drought periods, suggesting a strong link between soil moisture and overall drought conditions. However, Somalia and Ethiopia reveal periods of divergence between SM indicators (SM-VHI and SSMI) and SPEI-1. This discrepancy requires further investigation to understand the underlying causes. Potential factors contributing to these differences could include variations in vegetation cover impacting VHI, differences in rainfall patterns captured by SPEI-1 versus soil moisture conditions, or the influence of groundwater resources not fully reflected in these surface-level indicators. Furthermore, the scale and resolution of the data might not fully capture localized conditions within these large and diverse countries. Different land management practices, soil types, and irrigation schemes could also contribute to the observed variations. A more in-depth analysis incorporating these factors is needed to fully explain the observed performance differences of SM-VHI across these East African nations.
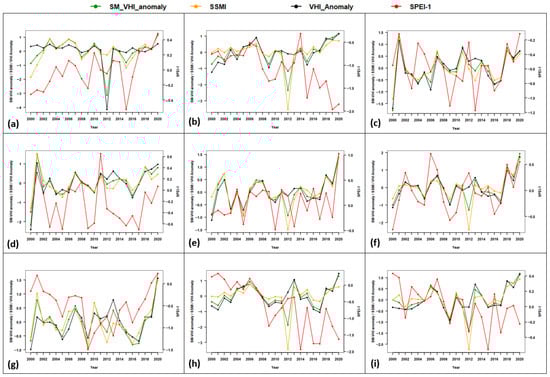
Figure 4.
Time series plots of SM-VHI anomaly, VHI anomaly, SSMI, and SPEI03, for each country of the East Africa (a) Djibouti, (b) Eritrea, (c) Rwanda, (d) Burundi, (e) Tanzania, (f) Kenya, (g) Uganda, (h) Somalia, (i) Ethiopia.
4.2.3. Evaluation of SM-VHI in Relation to Detrended Maize Yield
Figure 5 presents the relationship between soil moisture–vegetation health index (SM-VHI) anomaly and detrended maize yield for nine East African countries. Overall, a consistent positive relationship was observed, indicating that higher SM-VHI anomaly values representing improved vegetation and soil moisture conditions were associated with increased maize yield. The strength of correlation coefficients (R) ranged from 0.45 to 0.72, demonstrating a moderate to strong positive association between satellite-derived vegetation health conditions and actual crop performance. Spatially, the results reveal some heterogeneity across the region. The highest correlation (R = 0.72) occurred in Ethiopia (Figure 5i), suggesting that SM-VHI effectively captures the variability in maize yield under Ethiopian agro-climatic conditions. Similarly, comparatively strong relationships were observed in Tanzania (R = 0.68) and Kenya (R = 0.67), reflecting the responsiveness of maize yield to vegetation health variations in these major maize-growing zones. In contrast, relatively lower correlations were found in Burundi (R = 0.45) and Eritrea (R = 0.46), implying that other environmental or management factors may obscure the yield–SM-VHI linkage in these areas. These correlations highlight the potential of SM-VHI as a reliable remote-sensing indicator for monitoring maize yield variability across East Africa. The positive yield–SM-VHI association supports the capacity of vegetation health indices to track interannual variations in crop production driven by soil moisture and vegetation stress. Integrating SM-VHI into early warning and yield forecasting systems can improve crop performance assessment and food security risk prediction across the region, thereby strengthening agricultural drought management capabilities.
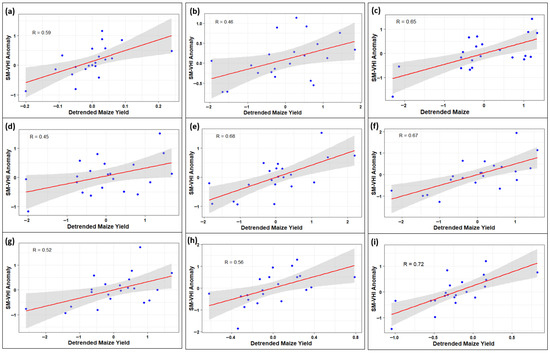
Figure 5.
SM-VHI anomaly and detrended maize yield correlation for validation in East Africa: (a) Djibouti, (b) Eritrea, (c) Rwanda, (d) Burundi, (e) Tanzania, (f) Kenya, (g) Uganda, (h) Somalia, (i) Ethiopia.
4.2.4. Monthly Spatial Validation of SM-VHI
Figure 6 shows that SM–VHI depicts a progressive intensification and spread of agricultural drought across East Africa from February to September, with the strongest dryness evident in June–September. Conditions then begin to ease from November into January, with partial recovery in many areas and renewed drying toward the end of the year.
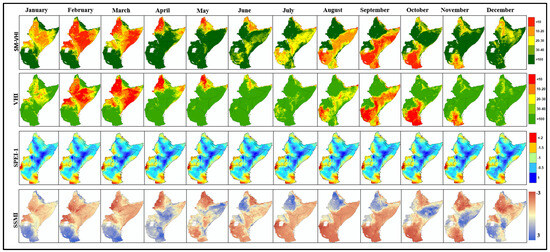
Figure 6.
Spatial distribution maps of monthly SM-VHI, VHI, SPEI-1, and SSMI from 2000 to 2020.
The spatial distribution captured by VHI is broadly consistent with SM–VHI across months, indicating coherent vegetation–soil moisture patterns. For SPEI-1, the monthly means indicate drier conditions in July–September and February, while relatively wetter conditions prevail in March–June and October–December. SSMI further corroborates these patterns, highlighting mid-year soil-moisture deficits and subsequent improvement.
This month-by-month agreement among SM–VHI, VHI, SPEI-1, and SSMI supports the use of SM–VHI for mapping the spatial distribution of agricultural drought at monthly scale over the region.
4.3. Analysis of Spatial and Temporal Trends of SM-VHI
4.3.1. Analysis of Temporal Drought Patterns
Figure 7 illustrates the annual evolution of SM-VHI across various countries in East Africa, including Djibouti, Eritrea, Rwanda, Burundi, Tanzania, Kenya, Uganda, Somalia, and Ethiopia, from 2000 to 2020. The variation slopes are positive across all countries, indicating a general shift toward wetter conditions despite year-to-year variability. Notable observations include: Djibouti shows a slight upward with lows in 2006–2007, 2012 and 2015, followed by recovery; Eritrea exhibits a gradual increase with a minimum around 2011–2012; Rwanda displays a positive with peaks after 2010; Burundi shows a positive slope but high variability, with elevated values in 2000–2001 and after 2016; Tanzania has a modest positive fluctuation with a low near 2011–2012; Kenya shows a clearer positive with lows around 2005 and 2011–2012 followed by marked increases; Uganda records a slight positive with oscillations; Somalia indicates a weak positive fluctuation amid high variability with a minimum around 2011–2012; and Ethiopia reveals a positive with lows near 2008 and 2011–2012. A regional drought is evident around 2011–2012, but the consistent positive slopes suggest gradual improvement in SM-VHI across East Africa.
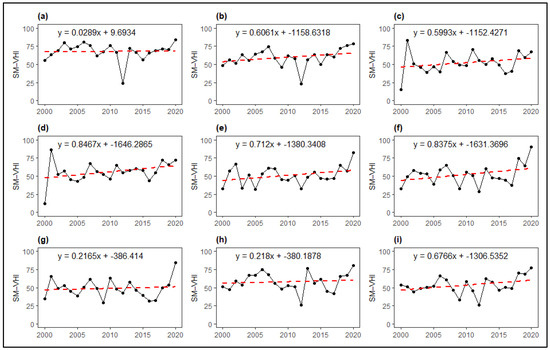
Figure 7.
Temporal evolution of SM-VHI in different countries of the East Africa: (a) Djibouti, (b) Eritrea, (c) Rwanda, (d) Burundi, (e) Tanzania, (f) Kenya, (g) Uganda, (h) Somalia, (i) Ethiopia.
Figure 8 presents the percentage of drought-affected areas across various countries in East Africa from 2000 to 2020, segmented by drought classification: extreme, severe, moderate, mild, and no drought. The data reveals notable temporal variations in drought conditions throughout this period. For several countries, including Djibouti, Eritrea, and Kenya, a noticeable percentage of the land was affected by extreme and severe drought in specific years, particularly noticeable during the peaks in 2001 and 2007.
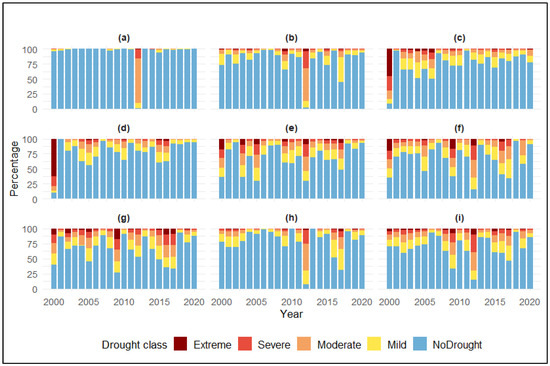
Figure 8.
Percentage of drought-affected area in each country of the East Africa from 2000 to 2020: (a) Djibouti, (b) Eritrea, (c) Rwanda, (d) Burundi, (e) Tanzania, (f) Kenya, (g) Uganda, (h) Somalia, (i) Ethiopia.
In contrast, mild and moderate drought conditions, represented by yellow and orange segments, appeared more frequently in other years, indicating a fluctuating but less severe drought experience. For instance, the data for Burundi and Tanzania showcases spontaneous variations, with certain years experiencing a substantial portion of drought-affected land, while other years exhibit a predominance of no drought conditions, marked in blue. Somalia and Ethiopia also displayed a mixture of drought conditions across the years, illustrating the diverse climate impacts throughout the region.
4.3.2. Spatial Distribution of SM-VHI Derived Drought Patterns
Figure 9 depicts the spatial distribution of Soil Moisture VHI (SM-VHI) across East Africa from 2000 to 2020, illustrating the variability of drought conditions over these two decades. In 2000, the region shows predominantly green areas, indicating minimal drought conditions. However, observed changes become apparent in 2001, where a considerable area is marked by extreme (red) and severe (orange) drought, affecting large portions of the northern and central regions. As we move to 2002 and 2003, there is a noticeable decrease in drought-affected areas, although some regions continue to experience fluctuations in drought intensity.
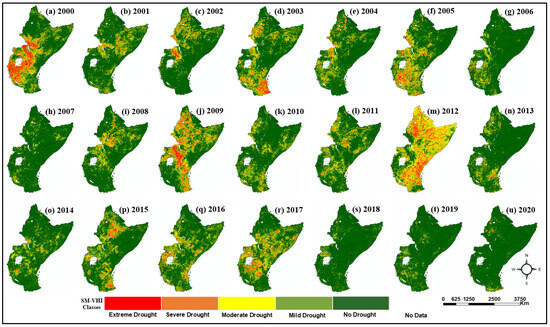
Figure 9.
Spatial distribution maps of SM-VHI in East Africa from 2000 to 2020.
By 2004, the drought area expands again, particularly in the midstream regions, leading to another peak in drought severity in 2005, especially in the central basin. The impact of these droughts continues to be evident in subsequent years, with areas of extreme, severe, and moderate drought still prominent. From 2006 to 2011, drought conditions remain variable, with specific years exhibiting spikes in affected areas. Notably, in 2012, the drought area reaches its lowest point, marking the year as the wettest in the dataset from 2000 to 2020, where extreme and severe drought conditions nearly disappear from the map.
In the years following 2012, from 2013 to 2020, drought predominantly impacts the central and western regions, as indicated by persistent patches of yellow and orange, while the downstream areas show a trend of recovery.
To investigate the spatial variability of the Integrated Soil Moisture–Vegetation Health Index (SM-VHI) in East Africa from 2000 to 2020, this study utilized Theil–Sen Median trend analysis and the Mann–Kendall test. These methods allowed for the quantification of drought trends across the study area, reflecting underlying dynamics across diverse landscapes. Figure 10a illustrates the Theil–Sen slope trend analysis, categorizing drought trends into three distinct classes: escalating drought trend, stable drought trend, and improving drought trend. The analysis reveals that areas experiencing an improving drought trend constitute approximately 45% of the region, signifying that a significant proportion of East Africa is witnessing favorable changes in moisture conditions. Conversely, the stable drought trend accounts for 31%, suggesting regions where drought conditions have not shown significant year-to-year fluctuations. Notably, escalating drought trends are confined to 24% of the area, indicating specific regions are at risk of worsening conditions, which is especially concerning for food security and water resource management. The Mann–Kendall test results presented in Figure 10b categorize drought change characteristics into five types: significant decrease, insignificant decrease, constant, insignificant increase, and significant increase, where an increase signifies higher SM VHI (wetter conditions, reduced drought) and a decrease signifies lower SM VHI (drier conditions, intensified drought). For the period analysed (2000–2020), the data indicates the following distribution across East Africa: 31% of the area exhibits a significant increase in SM VHI (wetter), 18% an insignificant increase, 19% no change (constant), 15% an insignificant decrease, and 17% a significant decrease (drier). Consequently, during this specific timeframe, areas experiencing increasing SM VHI slightly outnumbered those with decreasing SM VHI, although nearly one third of the region remained relatively unchanged. It’s important to acknowledge that these trends are specific to the 2000–2020 period and are susceptible to temporal variability; analyzing a different time period would likely yield a different distribution of these trends, reflecting the inherent fluctuations in weather patterns.
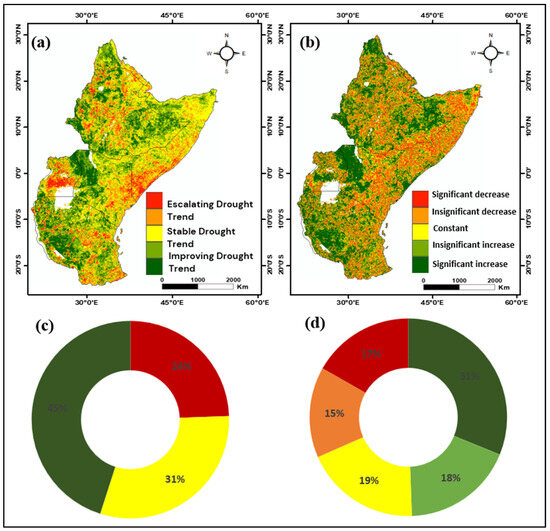
Figure 10.
Drought variation in the study region (2000–2020): (a) Theil–Sen slope trends, (b) drought change attributes, (c,d) area percentages.
5. Discussion
5.1. Interpretation of the SM-VHI Results and Its Implications for Agricultural Drought Monitoring
The results from the SM-VHI analysis reveal its effectiveness in accurately detecting drought conditions across East Africa, corroborating findings by previous studies that have highlighted the utility of vegetation indices in drought assessment. For instance, studies by Zhang, Hong [17] demonstrate that vegetation health indices, particularly those incorporating soil moisture data, can substantially improve drought monitoring efforts. The identification of an optimal α value of 0.5 in this study aligns with observations made in similar research, which suggests that such thresholds are crucial for balancing sensitivity and specificity in drought detection [64,65].
The Critical Success Index (CSI) of 0.78 achieved at this α value indicates a reliable correspondence between predicted and observed drought occurrences, resembling results in other studies where vegetation indices successfully tracked drought indicators. The correlation coefficients observed between the SM-VHI and independent drought indicators such as the Soil Moisture Index (SSMI) and Standardized Precipitation-Evapotranspiration Index (SPEI-3) underscore the findings of previous research, confirming the robustness of these metrics in depicting local soil moisture dynamics [66,67]. Regions exhibiting strong correlations, like Djibouti and Burundi, suggest that localized data integration is essential for improving drought assessments, resonating with the recommendations of Zhao, Huang [68], who stress the necessity for context-specific approaches in drought management. The observed variations in SM-VHI performance across East African countries, as highlighted in Figure 3 and Figure 4, likely stem from a complex interplay of factors beyond simple moisture availability. Vegetation cover differences can significantly influence VHI readings, while rainfall patterns captured by SPEI-1 may not always directly correlate with soil moisture conditions reflected in SM-VHI and SSMI. The influence of groundwater resources, which aren’t fully represented in surface-level indicators, could also contribute to discrepancies. Furthermore, data resolution may obscure localized variations within these large and diverse countries, and differing land management practices, soil types, and irrigation schemes are likely significant contributing factors [69]. Building on these findings, the correlation analysis between SM-VHI anomaly and detrended maize yield provides additional evidence of the practical utility of SM-VHI for agricultural monitoring. Across East Africa, a generally positive relationship (R = 0.45 to 0.72) was observed, confirming that improved vegetation and soil moisture conditions correspond closely with higher maize yields. Stronger correlations in Ethiopia, Kenya, and Tanzania align with previous work by Holzman, Rivas [70], who demonstrated that the integration of soil moisture and vegetation indicators enhances the detection of yield responses to climatic variability. In contrast, lower correlations in Eritrea and Burundi may reflect the influence of localized irrigation, soil heterogeneity, or management practices not fully captured by satellite indices [71,72]. These findings are consistent with Petersen [73] and Leroux, Baron [74], who reported that soil moisture and related vegetation health metrics reliably track interannual variations in cereal yields across Africa. Therefore, integrating SM-VHI into early warning and yield forecasting frameworks could enhance the capacity of regional food security systems to anticipate agricultural stress and production shortfalls. A more comprehensive analysis, incorporating these elements, is essential for a complete understanding of SM-VHI performance variations across East Africa. These findings indicate critical application areas for agricultural drought monitoring, as policymakers can leverage the SM-VHI to inform timely interventions, enabling adaptive management strategies that enhance agricultural resilience in response to changing environmental conditions.
5.2. Strengths and Limitations of the SM-VHI Approach
While the SM-VHI presents several strengths, its reliance on remote sensing data introduces inherent limitations. The consistent, scalable, and real-time data provided by the SM-VHI model is commendable; however, as highlighted by Bulgin, Merchant [75], atmospheric conditions such as cloud cover can result in inaccuracies. Previous studies have also noted that vegetation indices may not fully account for localized soil properties, land use practices, and microclimates, complicating the interpretation of drought impacts [76,77,78]. Additionally, the temporal lag between vegetation response and actual drought conditions is a concern, particularly considering the spatial resolution of remote sensing data used. Although AghaKouchak, Farahmand [79] emphasize the critical role of integrating remote sensing with traditional ground-based measurements, further research is needed to improve the real-time applicability of the SM-VHI for immediate agricultural management decisions, taking into account how the scale of remote sensing data impacts its effectiveness. This can be addressed by combining the SM-VHI approach with other predictive models and localized climate forecasts, thus improving the accuracy and timeliness of drought assessments.
5.3. Potential Applications and Policy Implications for the Study Region
The Soil Moisture–Vegetation Health Index (SM-VHI) results point to clear, actionable pathways for drought management and policy in East Africa. Consistent with guidance from [80,81], agencies can use SM-VHI to target drought response where persistent or escalating trends are detected, prioritizing investments in water conservation (e.g., rainwater harvesting, efficient irrigation), contingency inputs, and risk-transfer instruments. Integrating SM-VHI into agricultural policy frameworks can strengthen food security by enabling proactive support to farmers during drought, including temporary financial assistance, crop and variety diversification, and extension services focused on drought-ready practices. As argued by Jarvis, Lau [82] and Suprayitno, Iskandar [83], embedding scientific evidence into policy design is essential for effective adaptation, especially in regions reliant on rain-fed agriculture. SM-VHI’s value in East Africa lies in capturing the coupled dynamics of soil moisture and vegetation condition across diverse agro-ecologies from Kenya’s semi-arid zones to Ethiopia’s humid highlands, where crop sensitivity varies with soils, rainfall regimes, and management. To situate these findings, SM-VHI should be used alongside established indices. SPI and PDSI provide precipitation- and water-balance-based context; ESI contributes information on evaporative stress. However, SPI may miss early warning signals tied to soil moisture depletion and emerging vegetation stress that SM-VHI can detect. Case evidence from major droughts (e.g., 2010–2011, 2016–2017 Horn of Africa) can further validate SM-VHI’s capacity to capture extremes and align them with observed agricultural impacts, strengthening early warning and preparedness. Several comparative studies highlight the complementary nature of different drought monitoring approaches in the region. For instance, while the Vegetation Condition Index (VCI) effectively tracks vegetation greenness, it can lag behind in detecting soil moisture deficits [84]. Evapotranspiration-based monitoring, as explored by Verhoeve, Keijzer [85], provides valuable insights but can be complicated by the presence of irrigation. Machine learning approaches relying solely on rainfall data, such as that of Tegegn, Berlie [86], assist in forecasting but would gain accuracy from integrating observation-driven indicators. The consensus suggests that combining the Soil Moisture Vegetation Health Index (SM-VHI) with indices like the Standardized Precipitation Index (SPI), Palmer Drought Severity Index (PDSI), Evaporative Stress Index (ESI), and rainfall-based prediction models holds the potential to enhance both accuracy and lead time in drought monitoring and prediction. Policy design should reflect spatial heterogeneity. Drought exposure and crop responses differ between semi-arid and humid highland systems, implying tailored interventions, resource allocation, and timing [87]. Mapping SM-VHI hotspots enables prioritization of high-risk districts for targeted support, equitable distribution of resources, and monitoring of program effectiveness. Beyond immediate agricultural gains, such policies can advance environmental sustainability objectives highlighted by recent climate action assessments [88].
6. Conclusions
This study has successfully demonstrated the capabilities of the integrated soil moisture vegetation health index (SM-VHI) in detecting drought conditions across East Africa, highlighting its effectiveness as a reliable indicator of soil moisture dynamics. The analysis identified an optimal α value of 0.5, resulting in improved drought detection accuracy, as evidenced by a Critical Success Index (CSI) of 0.78. Strong correlations between SM-VHI and independent drought indicators such as the SSMI and SPEI-1 reinforced the model’s robustness and versatility in reflecting local environmental conditions. Spatial and temporal trend analyses revealed critical patterns of drought severity and recovery, indicating considerable regional variations influenced by local weather and climatic conditions.
Additionally, the correlation between SM-VHI anomaly and detrended maize yield across East Africa confirmed the practical applicability of SM-VHI for agricultural monitoring. Positive relationships, ranging from moderate to strong, indicated that improved vegetation and soil moisture conditions were closely associated with higher maize yields. Regions such as Ethiopia, Kenya, and Tanzania exhibited particularly strong associations, demonstrating that SM-VHI effectively captures vegetation responses linked to crop productivity. This relationship underscores the potential of SM-VHI to serve not only as a drought indicator but also as a proxy for monitoring yield variability and production risk.
Building on these findings, future research should emphasize integrating SM-VHI with ground-based measurements and regional climate forecasts to improve its sensitivity and spatial precision. Further analysis of land use practices, soil characteristics, and microclimatic factors will enhance the understanding of SM-VHI performance under diverse agricultural systems. From an operational perspective, agricultural planners and policymakers can utilize SM-VHI data to design timely drought response and crop management strategies. Incorporating SM-VHI within early warning and yield forecasting frameworks offers opportunities to strengthen agricultural resilience and food security preparedness. Overall, the integration of SM-VHI into agricultural monitoring systems provides a robust approach for identifying water stress, anticipating yield anomalies, and guiding adaptive management decisions. By promoting the operational use of this remote-sensing tool, stakeholders can better mitigate drought impacts and support more sustainable agricultural practices across East Africa.
Author Contributions
A.P.M.: writing—original draft. data curation, formal analysis, and methodology. J.B.: project administration, resources, supervision, and writing—review and editing. L.L.: project administration, resources, supervision, and writing—review and editing. H.F.: data curation, and formal analysis. P.M.K.: data curation, validation, and formal analysis. O.C.P.: formal analysis, and validation, M.F.: data curation, validation, and formal analysis. L.B.: data curation, and formal analysis. All authors have read and agreed to the published version of the manuscript.
Funding
The study was funded and supported by the project of Overseas Science and Education Cooperation Center of the Chinese Academy of Sciences (Grant Number: SAJC202527ZD05).
Data Availability Statement
The data supporting the findings of this study are available within the article. Further inquiries can be directed to the corresponding author.
Acknowledgments
The authors extend their heartfelt thanks to the Alliance of International Science Organizations (ANSO) under the Chinese Academy of Sciences (CAS) for awarding the doctoral scholarship. They also wish to acknowledge the Xinjiang Institute of Ecology and Geography, Chinese Academy of Science, and University of Chinese Academy of Sciences (UCAS), for providing a supportive and conducive environment that facilitated the successful completion of this research project. In addition, the authors are grateful for the opportunity to use the advanced laboratory facilities at these institutions, which significantly contributed to the success of this research endeavor.
Conflicts of Interest
The authors declare that there are no conflicts of interest.
References
- Seka, A.M.; Zhang, J.; Prodhan, F.A.; Ayele, G.T.; Finsa, M.M.; Sharma, T.P.P.; Mekonnen, A. Hydrological drought impacts on water storage variations: A focus on the role of vegetation changes in the East Africa region. A systematic review. Environ. Sci. Pollut. Res. 2022, 29, 80237–80256. [Google Scholar] [CrossRef] [PubMed]
- Mulugeta, S.B. Drought, Vulnerability and Adaptation: Risk of Food and Livelihoods Insecurity for Pastoralists and Agro-pastoralists in Borana Zone, Southern Ethiopia. Ph.D. Thesis, University of Nairobi, Nairobi, Kenya, 2023. [Google Scholar]
- Chand, K.; Biradar, N. Socio-economic impacts of drought in India. In Drought Mitigation and Management; Scientific Publishers: New Delhi, India, 2017; pp. 245–263. [Google Scholar]
- Tofu, D.A.; Haile, F.; Tolossa, T. Livelihood vulnerability and socio-economic determinants of households to climate change-induced recurrent drought in Ethiopia. GeoJournal 2023, 88, 5043–5067. [Google Scholar] [CrossRef]
- Saleem, A.; Anwar, S.; Nawaz, T.; Fahad, S.; Saud, S.; Ur Rahman, T.; Khan, M.N.R.; Nawaz, T. Securing a sustainable future: The climate change threat to agriculture, food security, and sustainable development goals. J. Umm Al-Qura Univ. Appl. Sci. 2024, 1, 595–611. [Google Scholar] [CrossRef]
- Kotir, J.H. Climate change and variability in Sub-Saharan Africa: A review of current and future trends and impacts on agriculture and food security. Environ. Dev. Sustain. 2011, 13, 587–605. [Google Scholar] [CrossRef]
- Le, T.; Sun, C.; Choy, S.; Kuleshov, Y.; Tran, T.D. Agricultural drought risk assessments: A comprehensive review of indicators, algorithms, and validation for informed adaptations. Geomat. Nat. Hazards Risk 2024, 15, 2383774. [Google Scholar] [CrossRef]
- Bilal, S.B.; Gupta, V. Tracing Vegetation Resilience and Recovery Pathways to Drought Through Time Series Decomposition. Hydrol. Process. 2025, 39, e70208. [Google Scholar] [CrossRef]
- Bachmair, S.; Stahl, K.; Collins, K.; Hannaford, J.; Acreman, M.; Svoboda, M.; Knutson, C.; Smith, K.H.; Wall, N.; Fuchs, B. Drought indicators revisited: The need for a wider consideration of environment and society. Wiley Interdiscip. Rev. Water 2016, 3, 516–536. [Google Scholar] [CrossRef]
- Suleymanov, F. A review of the multifaceted relationship between drought dynamics and conflicts. Hydrol. Process. 2024, 38, e15262. [Google Scholar] [CrossRef]
- Kogan, F. Vegetation health method. In Remote Sensing for Food Security; Springer: Cham, Switzerland, 2018; pp. 51–73. [Google Scholar]
- Kogan, F. New satellite-based vegetation health technology. In Remote Sensing for Malaria: Monitoring and Predicting Malaria from Operational Satellites; Springer: Cham, Switzerland, 2020; pp. 103–134. [Google Scholar]
- Hang, Q.; Guo, H.; Meng, X.; Wang, W.; Cao, Y.; Liu, R.; De Maeyer, P.; Wang, Y. Optimizing the vegetation health index for agricultural drought monitoring: Evaluation and application in the yellow river basin. Remote Sens. 2024, 16, 4507. [Google Scholar] [CrossRef]
- Bhardwaj, K.; Shah, D.; Aadhar, S.; Mishra, V. Propagation of meteorological to hydrological droughts in India. J. Geophys. Res. Atmos. 2020, 125, e2020JD033455. [Google Scholar] [CrossRef]
- Fu, Z.; Ciais, P.; Wigneron, J.-P.; Gentine, P.; Feldman, A.F.; Makowski, D.; Viovy, N.; Kemanian, A.R.; Goll, D.S.; Stoy, P.C. Global critical soil moisture thresholds of plant water stress. Nat. Commun. 2024, 15, 4826. [Google Scholar] [CrossRef] [PubMed]
- Wang, C.; Fu, B.; Zhang, L.; Xu, Z. Soil moisture–plant interactions: An ecohydrological review. J. Soils Sediments 2019, 19, 1–9. [Google Scholar] [CrossRef]
- Zhang, N.; Hong, Y.; Qin, Q.; Liu, L. VSDI: A visible and shortwave infrared drought index for monitoring soil and vegetation moisture based on optical remote sensing. Int. J. Remote Sens. 2013, 34, 4585–4609. [Google Scholar] [CrossRef]
- Zhang, N.; Hong, Y.; Qin, Q.; Zhu, L. Evaluation of the visible and shortwave infrared drought index in China. Int. J. Disaster Risk Sci. 2013, 4, 68–76. [Google Scholar] [CrossRef]
- Khan, M.I.; Zhu, X.; Arshad, M.; Zaman, M.; Niaz, Y.; Ullah, I.; Anjum, M.N.; Uzair, M. Assessment of spatiotemporal characteristics of agro-meteorological drought events based on comparing Standardized Soil Moisture Index, Standardized Precipitation Index and Multivariate Standardized Drought Index. J. Water Clim. Change 2020, 11 (Suppl. S1), 1–17. [Google Scholar] [CrossRef]
- Kamruzzaman, M.; Almazroui, M.; Salam, M.; Mondol, M.A.H.; Rahman, M.M.; Deb, L.; Kundu, P.K.; Zaman, M.A.U.; Islam, A.R.M.T. Spatiotemporal drought analysis in Bangladesh using the standardized precipitation index (SPI) and standardized precipitation evapotranspiration index (SPEI). Sci. Rep. 2022, 12, 20694. [Google Scholar] [CrossRef] [PubMed]
- He, Q.; Wang, M.; Liu, K.; Wang, B. High-resolution Standardized Precipitation Evapotranspiration Index (SPEI) reveals trends in drought and vegetation water availability in China. Geogr. Sustain. 2025, 6, 100228. [Google Scholar] [CrossRef]
- Peng, L.; Sheffield, J.; Wei, Z.; Ek, M.; Wood, E.F. An enhanced Standardized Precipitation–Evapotranspiration Index (SPEI) drought-monitoring method integrating land surface characteristics. Earth Syst. Dyn. 2024, 15, 1277–1300. [Google Scholar] [CrossRef]
- Camberlin, P.; Okoola, R. The onset and cessation of the “long rains” in eastern Africa and their interannual variability. Theor. Appl. Climatol. 2003, 75, 43–54. [Google Scholar] [CrossRef]
- Palmer, P.I.; Wainwright, C.M.; Dong, B.; Maidment, R.I.; Wheeler, K.G.; Gedney, N.; Hickman, J.E.; Madani, N.; Folwell, S.S.; Abdo, G. Drivers and impacts of Eastern African rainfall variability. Nat. Rev. Earth Environ. 2023, 4, 254–270. [Google Scholar] [CrossRef]
- Muñoz-Sabater, J.; Dutra, E.; Agustí-Panareda, A.; Albergel, C.; Arduini, G.; Balsamo, G.; Boussetta, S.; Choulga, M.; Harrigan, S.; Hersbach, H. ERA5-Land: A state-of-the-art global reanalysis dataset for land applications. Earth Syst. Sci. Data 2021, 13, 4349–4383. [Google Scholar] [CrossRef]
- Hersbach, H.; Bell, B.; Berrisford, P.; Hirahara, S.; Horányi, A.; Muñoz-Sabater, J.; Nicolas, J.; Peubey, C.; Radu, R.; Schepers, D. The ERA5 global reanalysis. Q. J. R. Meteorol. Soc. 2020, 146, 1999–2049. [Google Scholar] [CrossRef]
- Felegari, S.; Sharifi, A.; Moravej, K.; Golchin, A.; Tariq, A. Investigation of the relationship between ndvi index, soil moisture, and precipitation data using satellite images. Sustain. Agric. Syst. Technol. 2022, 314–325. [Google Scholar]
- Zhang, H.; Chang, J.; Zhang, L.; Wang, Y.; Li, Y.; Wang, X. NDVI dynamic changes and their relationship with meteorological factors and soil moisture. Environ. Earth Sci. 2018, 77, 582. [Google Scholar] [CrossRef]
- Kaleita, A.L.; Tian, L.F.; Hirschi, M.C. Relationship between soil moisture content and soil surface reflectance. Trans. ASAE 2005, 48, 1979–1986. [Google Scholar] [CrossRef]
- Xaba, N.; Deenadayalu, N. Assessing and forecasting droughts in eThekwini municipality: SPI, SPEI, and Time Series Insights for Sustainable Resource Management. Int. J. Bus. Ecosyst. Strategy (2687-2293) 2025, 7, 253–269. [Google Scholar] [CrossRef]
- Thornthwaite, C.W. An approach toward a rational classification of climate. Geogr. Rev. 1948, 38, 55–94. [Google Scholar] [CrossRef]
- Vicente-Serrano, S.M.; Beguería, S.; López-Moreno, J.I. A multiscalar drought index sensitive to global warming: The standardized precipitation evapotranspiration index. J. Clim. 2010, 23, 1696–1718. [Google Scholar] [CrossRef]
- Yue, Y.; Liu, H.; Mu, X.; Qin, M.; Wang, T.; Wang, Q.; Yan, Y. Spatial and temporal characteristics of drought and its correlation with climate indices in Northeast China. PLoS ONE 2021, 16, e0259774. [Google Scholar] [CrossRef]
- Hosking, J.R. L-moments: Analysis and estimation of distributions using linear combinations of order statistics. J. R. Stat. Soc. Ser. B Stat. Methodol. 1990, 52, 105–124. [Google Scholar] [CrossRef]
- Abramowitz, M.; Stegun, I.A. (Eds.) Handbook of Mathematical Functions with Formulas, Graphs and Mathematical Tables; National Bureau of Standards Applied Mathematics Series No. 55; United States Department of Commerce: Washington, DC, USA, 1965; Volume 55, 953p. [Google Scholar]
- Srivastava, P.K. Satellite soil moisture: Review of theory and applications in water resources. Water Resour. Manag. 2017, 31, 3161–3176. [Google Scholar] [CrossRef]
- Dobriyal, P.; Qureshi, A.; Badola, R.; Hussain, S.A. A review of the methods available for estimating soil moisture and its implications for water resource management. J. Hydrol. 2012, 458, 110–117. [Google Scholar] [CrossRef]
- Bodner, G.; Nakhforoosh, A.; Kaul, H.-P. Management of crop water under drought: A review. Agron. Sustain. Dev. 2015, 35, 401–442. [Google Scholar] [CrossRef]
- Feng, H.; Liu, Y. Combined effects of precipitation and air temperature on soil moisture in different land covers in a humid basin. J. Hydrol. 2015, 531, 1129–1140. [Google Scholar] [CrossRef]
- Peng, C.; Deng, M.; Di, L. Relationships between remote-sensing-based agricultural drought indicators and root zone soil moisture: A comparative study of Iowa. IEEE J. Sel. Top. Appl. Earth Obs. Remote Sens. 2014, 7, 4572–4580. [Google Scholar] [CrossRef]
- Yadav, B.K.; Mathur, S.; Siebel, M.A. Soil moisture dynamics modeling considering the root compensation mechanism for water uptake by plants. J. Hydrol. Eng. 2009, 14, 913–922. [Google Scholar] [CrossRef]
- Carrão, H.; Russo, S.; Sepulcre-Canto, G.; Barbosa, P. An empirical standardized soil moisture index for agricultural drought assessment from remotely sensed data. Int. J. Appl. Earth Obs. Geoinf. 2016, 48, 74–84. [Google Scholar] [CrossRef]
- Xu, Y.; Wang, L.; Ross, K.W.; Liu, C.; Berry, K. Standardized soil moisture index for drought monitoring based on soil moisture active passive observations and 36 years of north American land data assimilation system data: A case study in the southeast United States. Remote Sens. 2018, 10, 301. [Google Scholar] [CrossRef] [PubMed]
- Huang, S.; Wang, L.; Wang, H.; Huang, Q.; Leng, G.; Fang, W.; Zhang, Y. Spatio-temporal characteristics of drought structure across China using an integrated drought index. Agric. Water Manag. 2019, 218, 182–192. [Google Scholar] [CrossRef]
- He, B.; Lü, A.; Wu, J.; Zhao, L.; Liu, M. Drought hazard assessment and spatial characteristics analysis in China. J. Geogr. Sci. 2011, 21, 235–249. [Google Scholar] [CrossRef]
- Jiao, W.; Zhang, L.; Chang, Q.; Fu, D.; Cen, Y.; Tong, Q. Evaluating an enhanced vegetation condition index (VCI) based on VIUPD for drought monitoring in the continental United States. Remote Sens. 2016, 8, 224. [Google Scholar] [CrossRef]
- Kogan, F.N. Remote sensing of weather impacts on vegetation in non-homogeneous areas. Int. J. Remote Sens. 1990, 11, 1405–1419. [Google Scholar] [CrossRef]
- Bento, V.A.; Gouveia, C.M.; DaCamara, C.C.; Trigo, I.F. A climatological assessment of drought impact on vegetation health index. Agric. For. Meteorol. 2018, 259, 286–295. [Google Scholar] [CrossRef]
- Singh, R.P.; Roy, S.; Kogan, F. Vegetation and temperature condition indices from NOAA AVHRR data for drought monitoring over India. Int. J. Remote Sens. 2003, 24, 4393–4402. [Google Scholar] [CrossRef]
- Kogan, F.N. Application of vegetation index and brightness temperature for drought detection. Adv. Space Res. 1995, 15, 91–100. [Google Scholar] [CrossRef]
- Kogan, F.N. Global drought watch from space. Bull. Am. Meteorol. Soc. 1997, 78, 621–636. [Google Scholar] [CrossRef]
- Gidey, E.; Dikinya, O.; Sebego, R.; Segosebe, E.; Zenebe, A. Analysis of the long-term agricultural drought onset, cessation, duration, frequency, severity and spatial extent using Vegetation Health Index (VHI) in Raya and its environs, Northern Ethiopia. Environ. Syst. Res. 2018, 7, 13. [Google Scholar] [CrossRef]
- Wassie, S.B.; Mengistu, D.A.; Birlie, A.B. Agricultural drought assessment and monitoring using MODIS-based multiple indices: The case of North Wollo, Ethiopia. Environ. Monit. Assess. 2022, 194, 787. [Google Scholar] [CrossRef]
- Bhuiyan, C.; Saha, A.; Bandyopadhyay, N.; Kogan, F. Analyzing the impact of thermal stress on vegetation health and agricultural drought—A case study from Gujarat, India. GIScience Remote Sens. 2017, 54, 678–699. [Google Scholar] [CrossRef]
- Narasimha Rao, P.; Venkataratnam, L.; Krishna Rao, P.; Ramana, K.; Singarao, M. Relation between root zone soil moisture and normalized difference vegetation index of vegetated fields. Int. J. Remote Sens. 1993, 14, 441–449. [Google Scholar] [CrossRef]
- Akuraju, V.R.; Ryu, D.; George, B. Estimation of root-zone soil moisture using crop water stress index (CWSI) in agricultural fields. GIScience Remote Sens. 2021, 58, 340–353. [Google Scholar] [CrossRef]
- Inocêncio, T.d.M.; Ribeiro, A.; Souza, A.G. Soil moisture obtained through remote sensing to assess drought events. Rev. Bras. De Eng. Agrícola E Ambient. 2020, 24, 575–580. [Google Scholar] [CrossRef]
- Zhang, L.; Liu, Y.; Ren, L.; Teuling, A.J.; Zhu, Y.; Wei, L.; Zhang, L.; Jiang, S.; Yang, X.; Fang, X. Analysis of flash droughts in China using machine learning. Hydrol. Earth Syst. Sci. 2022, 26, 3241–3261. [Google Scholar] [CrossRef]
- Katiraie-Boroujerdy, P.-S.; Nasrollahi, N.; Hsu, K.-l.; Sorooshian, S. Quantifying the reliability of four global datasets for drought monitoring over a semiarid region. Theor. Appl. Climatol. 2016, 123, 387–398. [Google Scholar] [CrossRef]
- Schober, P.; Boer, C.; Schwarte, L.A. Correlation coefficients: Appropriate use and interpretation. Anesth. Analg. 2018, 126, 1763–1768. [Google Scholar] [CrossRef]
- Ma, N.; Niu, G.Y.; Xia, Y.; Cai, X.; Zhang, Y.; Ma, Y.; Fang, Y. A systematic evaluation of Noah-MP in simulating land-atmosphere energy, water, and carbon exchanges over the continental United States. J. Geophys. Res. Atmos. 2017, 122, 12245–12268. [Google Scholar] [CrossRef]
- Hodson, T.O. Root mean square error (RMSE) or mean absolute error (MAE): When to use them or not. Geosci. Model Dev. Discuss. 2022, 15, 5481–5487. [Google Scholar] [CrossRef]
- Ji, L.; Peters, A.J. Assessing vegetation response to drought in the northern Great Plains using vegetation and drought indices. Remote Sens. Environ. 2003, 87, 85–98. [Google Scholar] [CrossRef]
- Li, H.; Hu, Y.; Ao, Z. Identification of critical drought thresholds affecting vegetation on the Mongolian Plateau. Ecol. Indic. 2024, 166, 112507. [Google Scholar] [CrossRef]
- Zuo, G.; Feng, N.; Zheng, D. Enhancing Early Drought Detection in Plants: The Consideration of Organ Sensitivity, Parameter Selection, and Measurement Timing. Plants 2025, 14, 1571. [Google Scholar] [CrossRef] [PubMed]
- Albertson, J.D.; Montaldo, N. Temporal dynamics of soil moisture variability: 1. Theoretical basis. Water Resour. Res. 2003, 39, 1274. [Google Scholar] [CrossRef]
- Gruber, A.; Dorigo, W.A.; Zwieback, S.; Xaver, A.; Wagner, W. Characterizing coarse-scale representativeness of in situ soil moisture measurements from the International Soil Moisture Network. Vadose Zone J. 2013, 12, vzj2012.0170. [Google Scholar] [CrossRef]
- Zhao, H.; Huang, Y.; Wang, X.; Li, X.; Lei, T. The performance of SPEI integrated remote sensing data for monitoring agricultural drought in the North China Plain. Field Crops Res. 2023, 302, 109041. [Google Scholar] [CrossRef]
- Erb, K.H.; Luyssaert, S.; Meyfroidt, P.; Pongratz, J.; Don, A.; Kloster, S.; Kuemmerle, T.; Fetzel, T.; Fuchs, R.; Herold, M. Land management: Data availability and process understanding for global change studies. Glob. Change Biol. 2017, 23, 512–533. [Google Scholar] [CrossRef] [PubMed]
- Holzman, M.E.; Rivas, R.; Piccolo, M.C. Estimating soil moisture and the relationship with crop yield using surface temperature and vegetation index. Int. J. Appl. Earth Obs. Geoinf. 2014, 28, 181–192. [Google Scholar] [CrossRef]
- Wardle, J. Datacube-Driven Spatiotemporal Analyses of Vegetation Trends in Djibouti Using Digital Earth Africa Cloud-Based Computational Platform. Ph.D. Thesis, Saint Louis University, St. Louis, MO, USA, 2025. [Google Scholar]
- Lobell, D.B.; Ortiz-Monasterio, J.I. Satellite monitoring of yield responses to irrigation practices across thousands of fields. Agron. J. 2008, 100, 1005–1012. [Google Scholar] [CrossRef]
- Petersen, L.K. Real-time prediction of crop yields from MODIS relative vegetation health: A continent-wide analysis of Africa. Remote Sens. 2018, 10, 1726. [Google Scholar] [CrossRef]
- Leroux, L.; Baron, C.; Zoungrana, B.; Traoré, S.B.; Seen, D.L.; Bégué, A. Crop monitoring using vegetation and thermal indices for yield estimates: Case study of a rainfed cereal in semi-arid West Africa. IEEE J. Sel. Top. Appl. Earth Obs. Remote Sens. 2015, 9, 347–362. [Google Scholar] [CrossRef]
- Bulgin, C.E.; Merchant, C.J.; Ghent, D.; Klüser, L.; Popp, T.; Poulsen, C.; Sogacheva, L. Quantifying uncertainty in satellite-retrieved land surface temperature from cloud detection errors. Remote Sens. 2018, 10, 616. [Google Scholar] [CrossRef]
- Vicente-Serrano, S.M.; Cabello, D.; Tomás-Burguera, M.; Martín-Hernández, N.; Beguería, S.; Azorin-Molina, C.; El Kenawy, A. Drought variability and land degradation in semiarid regions: Assessment using remote sensing data and drought indices (1982–2011). Remote Sens. 2015, 7, 4391–4423. [Google Scholar] [CrossRef]
- Stabler, L.B.; Martin, C.A.; Brazel, A.J. Microclimates in a desert city were related to land use and vegetation index. Urban For. Urban Green. 2005, 3, 137–147. [Google Scholar] [CrossRef]
- Yengoh, G.T.; Dent, D.; Olsson, L.; Tengberg, A.E.; Tucker, C.J., III. Use of the Normalized Difference Vegetation Index (NDVI) to Assess Land Degradation at Multiple Scales: Current Status, Future Trends, and Practical Considerations; Springer: Cham, Switzerland, 2015. [Google Scholar]
- AghaKouchak, A.; Farahmand, A.; Melton, F.S.; Teixeira, J.; Anderson, M.C.; Wardlow, B.D.; Hain, C.R. Remote sensing of drought: Progress, challenges and opportunities. Rev. Geophys. 2015, 53, 452–480. [Google Scholar] [CrossRef]
- Dube, N.; Sithole, M.; Ngwenya, T.; Muhwati, T.; Moyo, E.; Manyanga, K. Impact of climate change on sustainability in semi-arid, rural Africa: Lessons from rural Zimbabwe. Cogent Soc. Sci. 2018, 4, 1553327. [Google Scholar] [CrossRef]
- Fao, F. Food and Agriculture Organization of the United Nations. Rome. 2018. Available online: http://faostat.fao.org (accessed on 1 January 2020).
- Jarvis, A.; Lau, C.; Cook, S.; Wollenberg, E.; Hansen, J.; Bonilla, O.; Challinor, A. An integrated adaptation and mitigation framework for developing agricultural research: Synergies and trade-offs. Exp. Agric. 2011, 47, 185–203. [Google Scholar] [CrossRef]
- Suprayitno, D.; Iskandar, S.; Dahurandi, K.; Hendarto, T.; Rumambi, F.J. Public policy in the era of climate change: Adapting strategies for sustainable futures. Migr. Lett. 2024, 21 (Suppl. S6), 945–958. [Google Scholar]
- Barrett, A.B.; Duivenvoorden, S.; Salakpi, E.E.; Muthoka, J.M.; Mwangi, J.; Oliver, S.; Rowhani, P. Forecasting vegetation condition for drought early warning systems in pastoral communities in Kenya. Remote Sens. Environ. 2020, 248, 111886. [Google Scholar] [CrossRef]
- Verhoeve, S.L.; Keijzer, T.; Kaitila, R.; Wickama, J.; Sterk, G. Vegetation resilience under increasing drought conditions in northern Tanzania. Remote Sens. 2021, 13, 4592. [Google Scholar] [CrossRef]
- Tegegn, M.G.; Berlie, A.B.; Utallo, A.U. Spatiotemporal variability and trends of intra-seasonal rainfall and temperature in the drought-prone districts of Northwestern Ethiopia. Discov. Sustain. 2024, 5, 230. [Google Scholar] [CrossRef]
- Tripathi, P.M.; Agarwal, V.; Mishra, V.; Singh, B.V.R. Options and strategies for managing droughts: Case studies from agro-ecological regions. In Water Sustainability and Hydrological Extremes; Elsevier: Amsterdam, The Netherlands, 2025; pp. 315–331. [Google Scholar]
- Legg, S. IPCC, 2021: Climate change 2021—The physical science basis. Interaction 2021, 49, 44–45. [Google Scholar]


Disclaimer/Publisher’s Note: The statements, opinions and data contained in all publications are solely those of the individual author(s) and contributor(s) and not of MDPI and/or the editor(s). MDPI and/or the editor(s) disclaim responsibility for any injury to people or property resulting from any ideas, methods, instructions or products referred to in the content. |
© 2025 by the authors. Licensee MDPI, Basel, Switzerland. This article is an open access article distributed under the terms and conditions of the Creative Commons Attribution (CC BY) license (https://creativecommons.org/licenses/by/4.0/).