Highlights
What are the main findings?
- The enhanced iTransformer model achieves high-precision BeiDou navigation satellite system (BDS) state space representation (SSR) prediction with orbit errors below 0.2 m and clock errors under 0.5 ns for 2 h windows.
- Real-time precise point positioning (PPP) using predicted SSR maintains sub-decimeter accuracy (E/N/U < 10 cm) during 30 min outages.
What are the implications of the main findings?
- Enhances real-time PPP robustness against SSR interruptions, providing reliable backup for high-precision navigation.
- Establishes a scalable framework with foundational insights for multi-global navigation satellite system (GNSS) interoperability in next-generation systems.
Abstract
The interruption of real-time state space representation (SSR) corrections significantly degrades the performance of precise point positioning (PPP). To address this challenge, we propose a novel residual-enhanced iTransformer model specifically designed for BeiDou navigation satellite system (BDS) SSR prediction. Unlike conventional approaches including polynomial fitting, harmonic modeling, and autoregressive moving average (ARMA) methods, our framework innovatively integrates residual networks with the iTransformer architecture to effectively capture the complex nonlinear characteristics and non-stationary patterns in satellite clock offsets. The model demonstrates remarkable performance improvements, achieving 72–85% reduction in prediction error compared with traditional ARMA models. Experimental results show that, within 2 h prediction windows, orbit corrections achieve better than 0.1 m (radial), 0.2 m (along-track), and 0.2 m (cross-track) accuracy, while clock corrections maintain sub-0.5 ns precision. Most importantly, during 30 min SSR outages, BDS real-time PPP utilizing our predicted corrections sustains positioning accuracy within 10 cm in all east, north, and up directions, representing over 80% improvement compared with traditional time-differenced carrier phase (TDCP) methods. This work establishes an effective solution for maintaining high-precision positioning services during SSR interruptions.
1. Introduction
Precise point positioning (PPP) is a primary method to achieve high-precision positioning in global navigation satellite systems (GNSS), delivering centimeter-to-decimeter-level accuracy [1,2,3,4]. The international GNSS service (IGS) initiated its real-time service (RTS) in 2013. Leveraging the IGS global infrastructure, RTS provides precise satellite orbit and clock corrections, enabling real-time PPP (RT-PPP) and associated applications [5,6,7,8]. Despite RTS products offering high-accuracy satellite ephemeris and clock data, significant operational challenges persist: frequent data gaps, outliers, clock jumps, and interruptions and latency induced by server anomalies or network delays [9,10]. Furthermore, satellite clock offsets for all GNSS constellations, including BDS, Galileo, and GPS, exhibit complex nonlinear behaviors—including periodic oscillations and stochastic variations—driven by external environmental factors [11,12,13]. These universal limitations hinder applications requiring stringent timeliness and precision. Addressing these issues necessitates robust, constellation-specific strategies to sustain PPP performance during SSR data outages. This study focuses on developing and validating such a strategy for the BDS.
To ensure reliable real-time PPP, continuous and stable reception of SSR corrections streams is essential. Existing research has addressed interruptions in real-time SSR data, specifically orbit and clock corrections. For mitigating SSR outages, Hadas et al., 2015 [14] proposed orbit corrections prediction via polynomial fitting. This method confines orbit corrections errors below 2 cm for up to 8 min (GPS) and 4 min (GLONASS). El-Mowafy et al., 2017 [15] proposed using higher-order polynomials to compensate for short-term (minute-level) orbit outages for GPS, while switching to IGS ultra-rapid products (IGU) predicted orbits for longer outages. The GPS clock offsets were predicted by modeling them with a second-order polynomial plus a sinusoidal term. Experiments demonstrated that this approach can maintain GPS positioning accuracy better than 10 cm within 2 h. Yan et al., 2020 [16] proposed a linear regression-based clock offsets prediction approach for GNSS, achieving 1 ns precision within 900 s through optimization of the historical data window (300 s). Janicka et al., 2020 [17] proposed the direct prediction of SSR orbit corrections variations for GPS satellites using linear, quadratic, and constant models. Their experimental results demonstrated negligible differences among these approaches, indicating that utilizing the latest available corrections suffices for practical implementation. Qafisheh et al., 2022 [18] proposed utilizing ARMA and SVR models to predict SSR corrections for GPS and GLONASS to address latency issues. Experiments demonstrated reductions in positioning error by 13% and 9%. Li et al., 2022 [19] proposed combining a quadratic polynomial with an eighth-order harmonic function to resolve data outages for GPS satellites. The extrapolation achieved an accuracy of 0.81 ns within 6 h, significantly outperforming IGS ultra-rapid products. Mu et al., 2024 [20] proposed a real-time multi-system PPP method resilient to SSR latency. During communication anomalies, positioning stability was maintained by extrapolating using the time-differenced carrier phase (TDCP) method. Under a 10 min latency, horizontal accuracy reached 0.7 cm and vertical accuracy reached 5.0 cm. Since satellite clocks are susceptible to external environmental influences, clock corrections inevitably contain noise, resulting in periodic and stochastic variations in the satellite clock corrections [21,22].
Current research primarily focuses on using traditional methods to predict orbit and clock corrections over short time periods. Compared with traditional models, which have limitations in representing the nonlinear characteristics of clock offsets and face accuracy improvement bottlenecks, neural networks, due to their sensitivity to nonlinear problems, can overcome these traditional limitations and achieve higher-precision predictions. Lv et al., 2022 [23] proposed a BP neural network model for GPS clock corrections prediction based on heterogeneous ensemble learning and dynamic multi-swarm particle swarm optimization (DMS-PSO). Experimental results showed that the average prediction accuracy reached 0.15 ns within 60 min, meeting centimeter-level positioning requirements. While traditional recurrent neural networks and their improved versions (such as LSTM and GRU) have mitigated the vanishing gradient problem through gating unit designs, they still face challenges when processing very long time-series data, such as limited memory capacity and dilution of temporal features [24,25]. Moreover, existing research has primarily focused on clock offsets sequence prediction, without fully considering the correlation between real-time orbit and clock offsets. It should be noted that reference [26] proposed the iTransformer model for time-series forecasting, which innovatively reverses the dimensional features of the Transformer. By treating the full time series of each variable as independent tokens, the model constructs a multivariate correlation capture framework based on the attention mechanism and integrates a feedforward network to extract non-linear features. This approach addresses the computational bottlenecks and dependency modeling limitations of traditional Transformers in long-sequence tasks, while enhancing the model’s ability to capture multivariate relationships, thus opening new paths for time-series forecasting.
It is noteworthy that research on long-term prediction of real-time orbit and clock offsets for the BeiDou-2/3 integrated system remains limited. Satellite-based augmentation services urgently require robust prediction frameworks to mitigate positioning degradation during SSR outages. To address this challenge, this paper proposes a novel deep learning framework based on a residual-enhanced iTransformer architecture for predicting SSR offsets. The study aims to resolve several key challenges identified in BeiDou SSR corrections, including significant non-stationarity with substantial fluctuations, complex periodic patterns particularly in orbital components, and occasional anomalous behaviors in clock offsets. We design a residual convolutional-attention fusion mechanism that enhances local feature extraction while maintaining global temporal dependencies. The framework specifically focuses on modeling cross-variable interactions among orbital components and clock offsets to overcome limitations of traditional approaches that treat these parameters separately. Validation using stations from the multi-GNSS experiment (MGEX) network and low-cost receivers will evaluate the method’s capability to maintain precise positioning performance during extended SSR interruptions.
2. Materials and Methods
2.1. iTransformer Fundamentals
Previous Transformer-based models for time-series forecasting typically treat each time step as a token by concatenating the multivariate observations at that step, thereby computing attention along the temporal dimension [27,28]. However, this paradigm suffers from a fundamental limitation: it directs the model’s focus towards interdependencies between temporal points, while failing to explicitly capture the intrinsic dependencies among variables. These complex inter-variable interactions are often the key driver behind the evolution of multivariate series, yet they are obscured within the temporal attention maps, hindering the model’s ability to learn meaningful multivariate representations.
To overcome this limitation, we introduce the iTransformer model, which reframes the representation learning paradigm for multivariate series. The core of our approach is to represent each individual variable’s entire lookback sequence as a distinct “variable token.” This token encapsulates the unique characteristics and temporal dynamics of that variable. The self-attention mechanism is then applied across these variable tokens, enabling the model to directly and adaptively learn the associations between variables. Finally, each representation, now enriched by inter-variable attention, is processed independently by feedforward networks to decode future sequence values. By shifting the modeling priority from temporal dependencies to variable dependencies, our method establishes a more powerful representational foundation for multivariate forecasting. Within the iTransformer framework, the process of predicting the future sequence of each specific variable based on historical sequences is formally formulated as
where contains N embedding tokens with dimension D, and the superscripts denote layer indices. The embedding function Embedding: and the projection function Projection: are both implemented by multi-layer perceptrons (MLPs). The obtained variable tokens interact via self-attention and are independently processed by a shared feedforward network in each TrmBlock.
2.2. SSR Data Characteristics
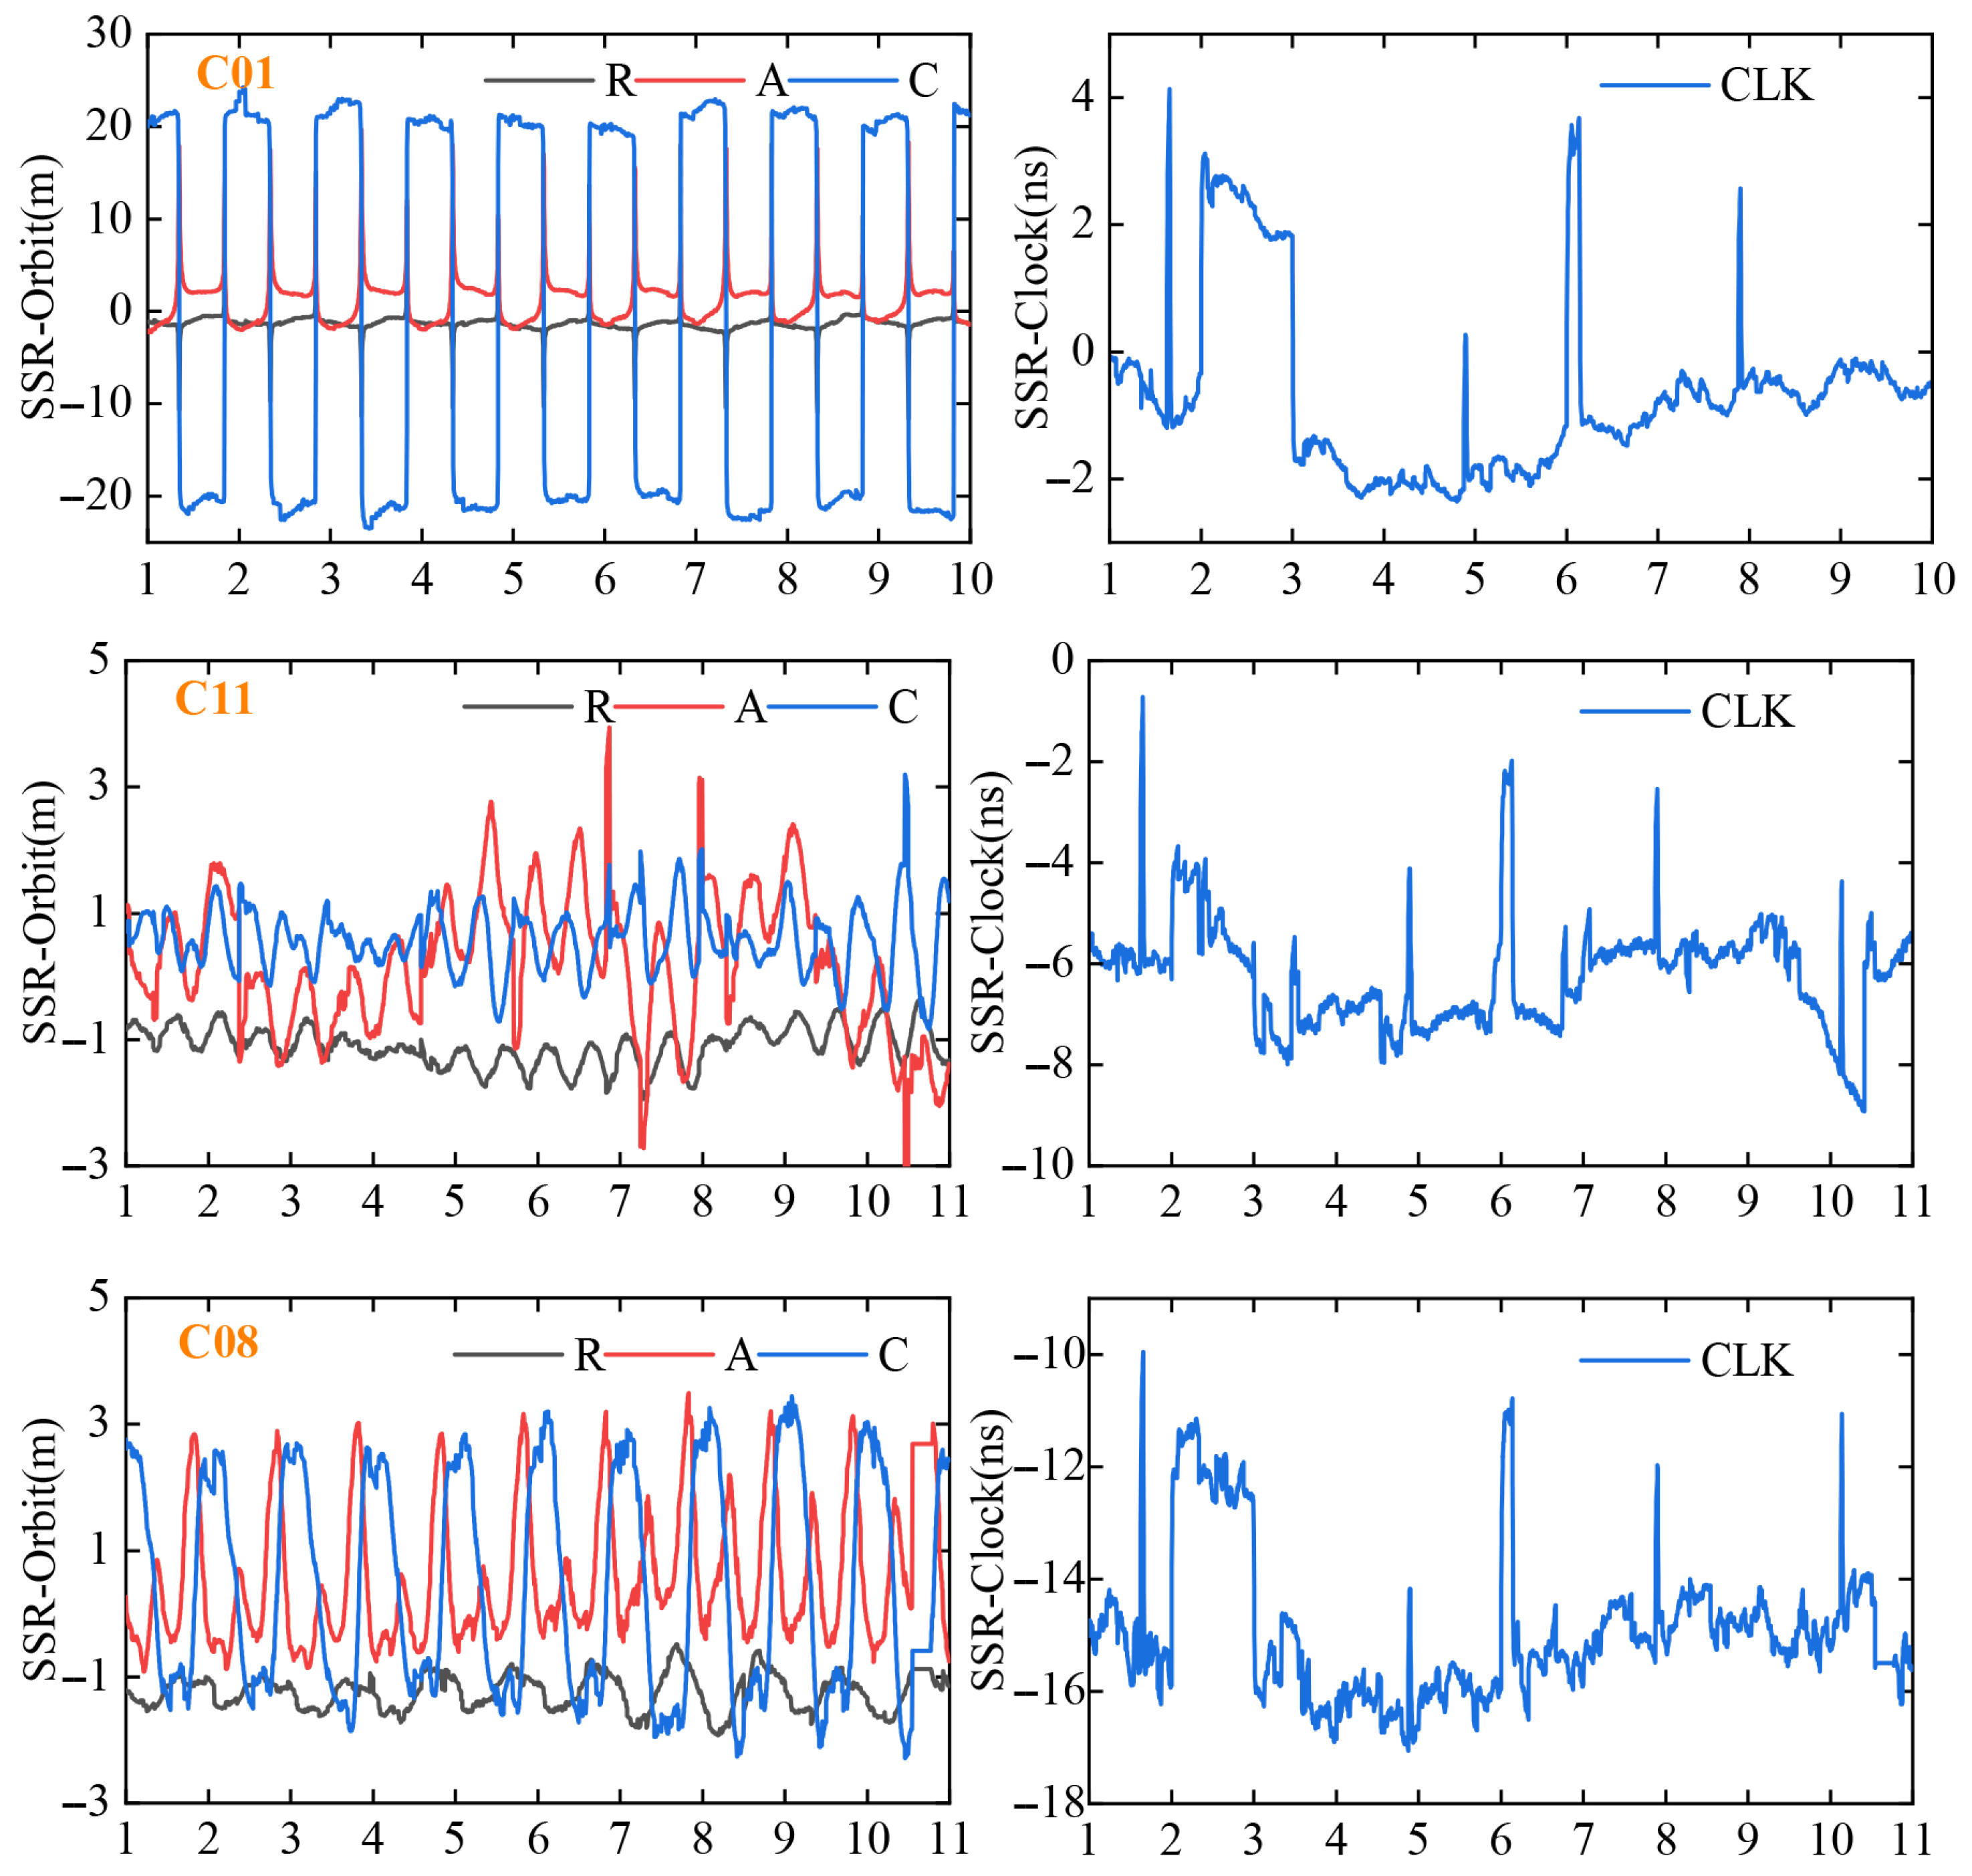
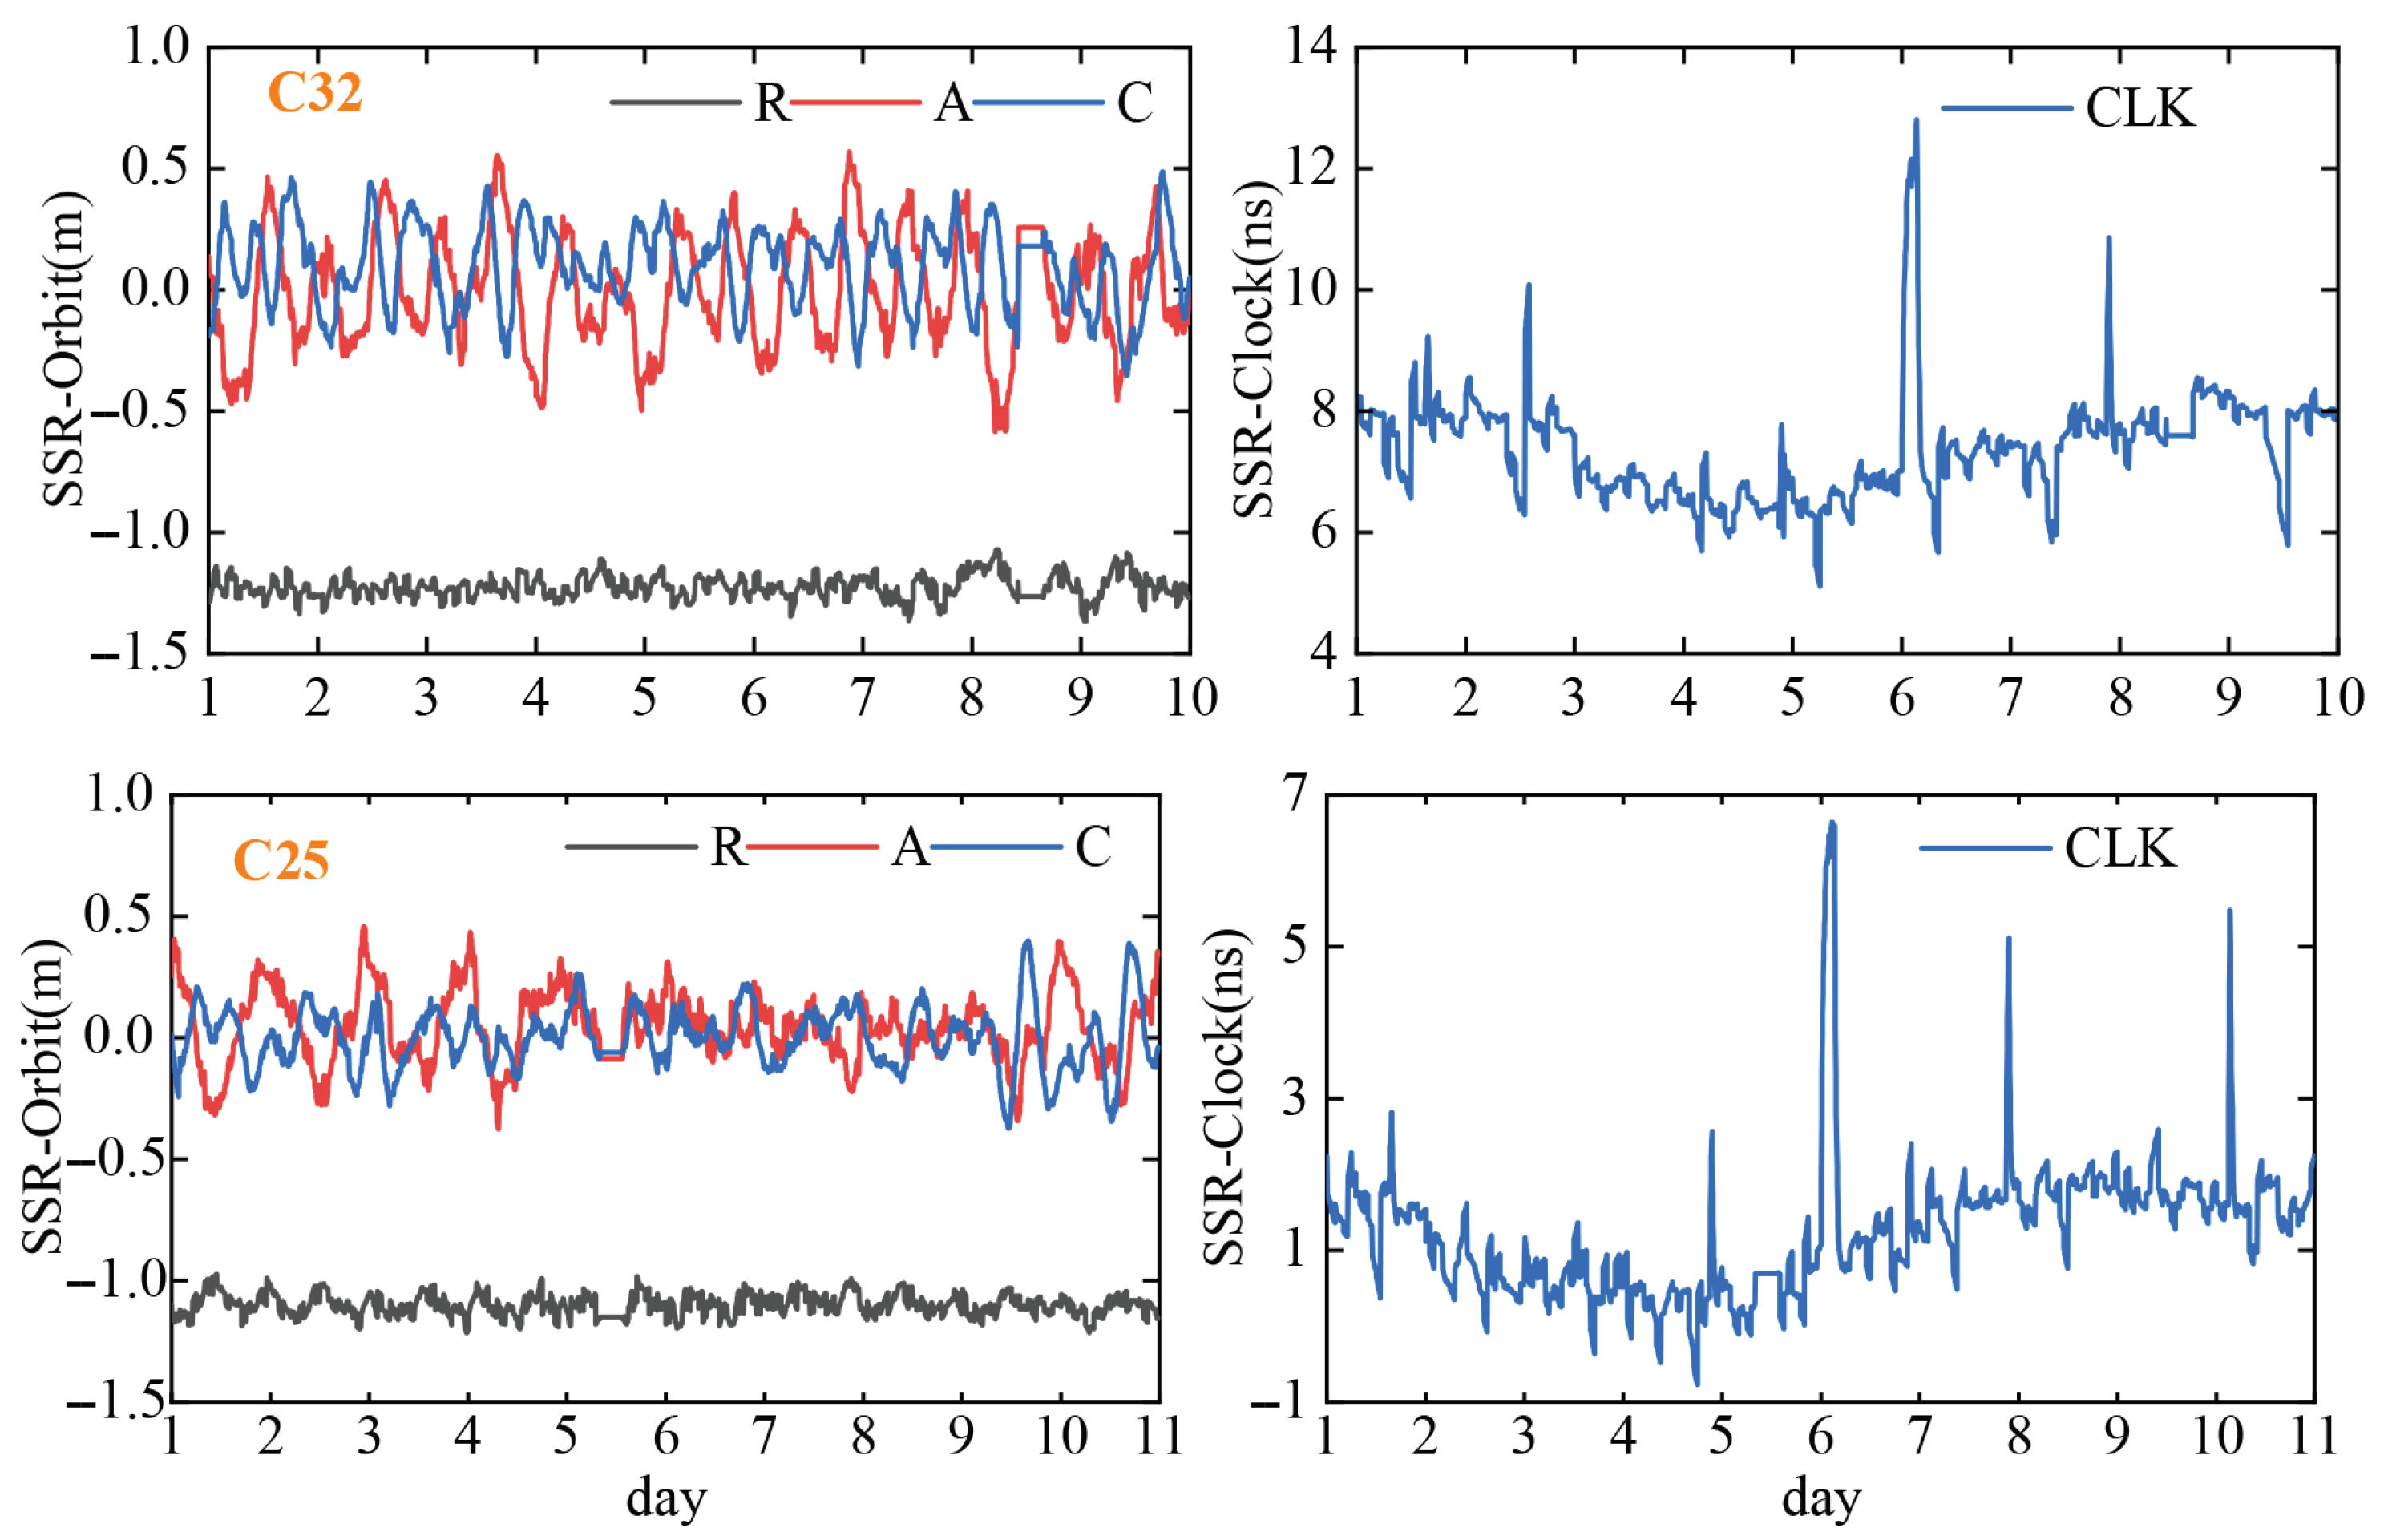
To investigate the long-term time-varying characteristics of the BDS orbit and clock correction parameters, this study performed a systematic analysis. The data used in this study comprise a 20-day continuous series of real-time correction sequences for orbits and clocks, sourced from the Wuhan University IGS data center, commencing on the day of year (DOY) 341, 2024. The corresponding data visualizations are presented in Figure 1.
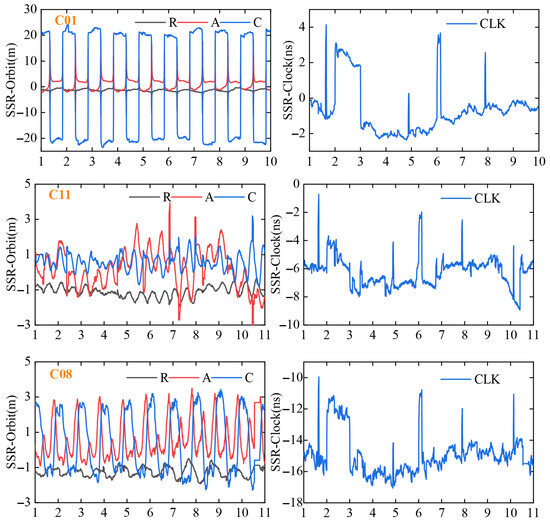
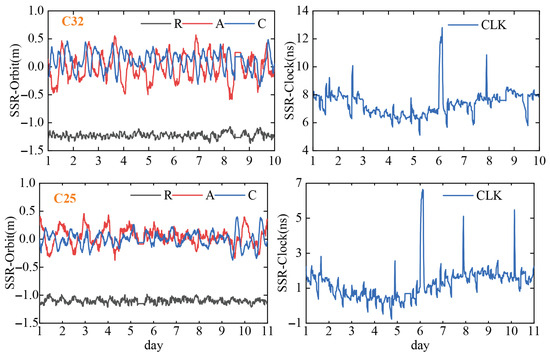
Figure 1.
Ten-day continuous sequences of real-time orbits and clock corrections for satellites C01, C08, C11, C25, and C32.
Regarding orbit correction parameters, distinct characteristics are observed across different satellites. The along-track (A) and cross-track (C) variations of Satellite C01 exhibit a high degree of correlation and periodic oscillations, while the radial variation remains relatively stable. For Satellite C08, the radial (R) component demonstrates smaller correction amplitudes, while its A and C components exhibit pronounced periodic fluctuations. All three-dimensional correction amplitudes remain within ±3 m. In contrast, Satellite C11 displays aperiodic characteristics in 3D orbit corrections, with the A component showing the most significant fluctuations (maximum amplitude > 5 m), whereas the R component maintains a relatively confined variation range. In contrast, Satellite C25 presents unique orbital dynamics: its R component remains stable, while the A and C components exhibit submeter-level fluctuations during days 5–8 of observation, with all variations constrained below 1 m. All components of Satellite C32 are highly similar to those of C25.
Regarding clock correction parameters, none of the three satellites exhibit periodic characteristics in their time-series variations. Analysis of the 10-day continuous correction sequences reveals significant temporal continuity, characterized by stable variation gradients between consecutive days. In particular, distinct clock jumps exceeding 2 ns in magnitude were observed at specific epochs (days 1, 4, 6, and 8). During non-jump intervals, the clock corrections for C08 and C25 maintain stability with fluctuations constrained within a 2 ns threshold; by comparison, C11 demonstrates relatively pronounced fluctuation behavior.
2.3. The Proposed Residual-Enhanced iTransformer Model
As evidenced by the preceding time-series analysis, orbit correction demonstrates relatively smooth variations, whereas clock correction exhibits intricate patterns with heightened noise levels. This necessitates dedicated processing modules for clock corrections when employing the same prediction network for both orbit and clock parameters.
Residual neural networks (ResNets) [29] mitigate gradient degradation in deep network training by incorporating residual learning modules into traditional convolutional neural network (CNN) architectures. This is achieved through identity mapping shortcuts that enable multi-path gradient propagation via skip connections, thereby enhancing model convergence and feature representation capabilities. For clock offset prediction, this residual learning mechanism enables the model to focus on capturing the differential features between normal variations and anomalous jumps. By explicitly modeling these residuals, the network develops enhanced sensitivity to abrupt changes and demonstrates improved robustness in handling gross errors, allowing for quicker recovery of prediction stability following clock jump events. The modified residual block structure and our proposed network architecture are illustrated in Figure 2, with the ResNet output formulated as

Figure 2.
Improved iTransformer model architecture and residual module (left: residual block structure; right: proposed framework).
The real-time BDS orbit and clock correction sequences undergo processing via a sliding window sampling strategy, which segments continuous time-series data into contiguous overlapping subsequences. Each timestamp is mapped to a feature vector, transforming raw data into a feature matrix. These subsequences are then fed into an inverse dimension embedding module that independently embeds each univariate time series as a token. Subsequently, the embedded clock corrections and associated temporal features are processed by a residual module employing 1D causal convolutions. This architecture enables each time step to incorporate localized temporal context, capturing short-term dependencies. Following layer normalization and residual connections, three such blocks are stacked to model long-range dependencies. Finally, the processed orbital and clock features are channel-wise concatenated for downstream network processing.
2.4. Experimental Setup for SSR Prediction
This subsection describes the dataset, training configuration, and evaluation metrics specifically for the SSR corrections prediction task.
2.4.1. Dataset and Preprocessing
The experimental dataset comprises 20 consecutive days (DOY 341-360, 2024) of SSR-derived satellite clock and orbit correction parameters. Given the original 5 s broadcast frequency exhibiting negligible variations within 1–2 h intervals, rendering it suboptimal for direct model input, we downsampled the data to 5 min resolution. Predictions were subsequently linearly interpolated to restore 5 s temporal resolution. To preserve the inherent chronological order of this time-series dataset, samples maintain strict temporal sequencing without shuffling. The dataset was partitioned sequentially into training, validation, and test sets at a 7:1:2 ratio.
2.4.2. Evaluation Metrics
The evaluation employs mean absolute error (MAE) and root mean square error (RMSE) as primary prediction performance metrics. These indicators facilitate quantification of the deviation between predicted and actual values while providing complementary assessment perspectives, thereby contributing to model accuracy and reliability verification.
2.4.3. Loss Function
Based on the characteristics of high-frequency noise interference in clock corrections within this experimental scenario, the Huber loss function with robust characteristics was adopted for optimization training. This function introduces a dynamic threshold mechanism: it preserves mean squared error properties within the threshold range, while transitioning to a linear loss function beyond the threshold. This piecewise characteristic simultaneously maintains gradient stability and significantly reduces sensitivity to anomalous samples, thereby mitigating overfitting while preserving model convergence efficiency. The mathematical expression of the Huber loss function is defined as follows:
2.5. Experimental Setup for PPP Positioning Performance Validation
To systematically evaluate the impact of SSR data predicted by the residual network-based iTransformer model on real-time PPP performance, this study employed simulated SSR data interruption scenarios. The model was used to predict future SSR information to maintain positioning continuity. To validate the model’s generalization capability across different device environments, the experimental design utilized two platforms: MGEX stations and a self-developed low-cost receiver (UM980 module). This design facilitates a comparative analysis of the positioning error distribution, convergence time, and robustness differences when using predicted SSR data in geodetic-grade reference stations (millimeter-level accuracy) versus low-cost terminals (centimeter-level accuracy).
2.5.1. BDS PPP Positioning Experiment
We utilized the post-processing module of the RTKLIB software package (version 2.4.3) [30] to simulate and achieve real-time BDS PPP positioning. This choice was based on its robust implementation of standard PPP algorithms, including built-in procedures for cycle-slip detection and ambiguity resolution. All specific parameter settings governing the positioning filter and error modeling are provided in Table 1. The CUSV station is sourced from the IGS MGEX network. The precise reference coordinates for the station CUSV in the ITRF2014 reference frame were obtained from the IGS data center at scripps orbit and permanent array center (SOPAC). The coordinates used were X = −1,248,307.769 m, Y = −4,818,425.225 m, Z = 3,976,507.439 m.

Table 1.
PPP solution parameter settings.
To evaluate the effectiveness of the predicted data in real-time PPP, the proposed method is compared against both the TDCP model—which accounts for SSR delays, as introduced by Mu et al., 2024 [20]—and the original iTransformer model. The TDCP approach utilizes high-rate observation data and calculates differences in phase observations between consecutive epochs. This process mitigates the impact of various errors over short time spans, enabling the estimation of receiver position increments between epochs.
To evaluate the positioning accuracy, the derived geocentric coordinates (ITRF2014) were directly compared against the known reference coordinates of the station CUSV. This comparison and the transformation of the coordinate differences into East-North-Up (ENU) components were performed automatically by the RTKLIB rnx2rtkp module during the solution output.
2.5.2. Low-Cost Receiver Positioning Experiment
To validate the positioning performance (accuracy and reliability) of the proposed method in real-world scenarios, this study conducted a static BDS positioning experiment based on the UM980 low-cost receiver module. The experiment was carried out on 30 December 2024, from 08:30 to 14:00, lasting for 5.5 h. The observation environment was an open rooftop area (free of signal obstructions) to ensure data collection quality. After data collection, post-processing analysis was performed using the RTKLIB software (version 2.4.3). The parameter settings for the RTK post-processing solution are consistent with those of the PPP experiment (see Table 1), with the following key exceptions: The RTK method adopts a relative positioning mode, with reference station coordinates sourced from the China Mobile continuously operating reference station (CORS) network at a baseline length of approximately 35 km; it utilizes between-station differencing techniques to eliminate ionospheric and tropospheric errors, and ultimately achieves fixed integer ambiguity resolution.
To obtain high-precision reference coordinates for positioning error assessment, this study utilized the entire collected static observation data. The PPP technique was employed, combined with the final precise orbit and clock products released by the IGS, to compute the station’s coordinates in the earth-centered, earth-fixed (ECEF) frame as the reference truth: (−1,695,038.185 m, 5,015,952.426 m, 3,545,214.553 m).
For the positioning algorithm verification, to simulate and improve real-time SSR services, this study used SSR data saved from the two days preceding the experiment. Orbit and clock corrections at 5 min intervals were extracted as the input sequence. A pre-trained model was used to perform time-series prediction of the real-time orbit and clock corrections during the observation period, aiming to compensate for potential gaps and delays in the real-time data stream. The prediction results were then linearly interpolated to a 5 s interval to match the requirements of high-frequency positioning solutions.
3. Results
This section presents the experimental findings of this study in two main parts: the accuracy of the SSR corrections prediction and the resulting PPP positioning performance during simulated SSR outages.
3.1. SSR Prediction Performance
3.1.1. Prediction Accuracy for Individual Satellites
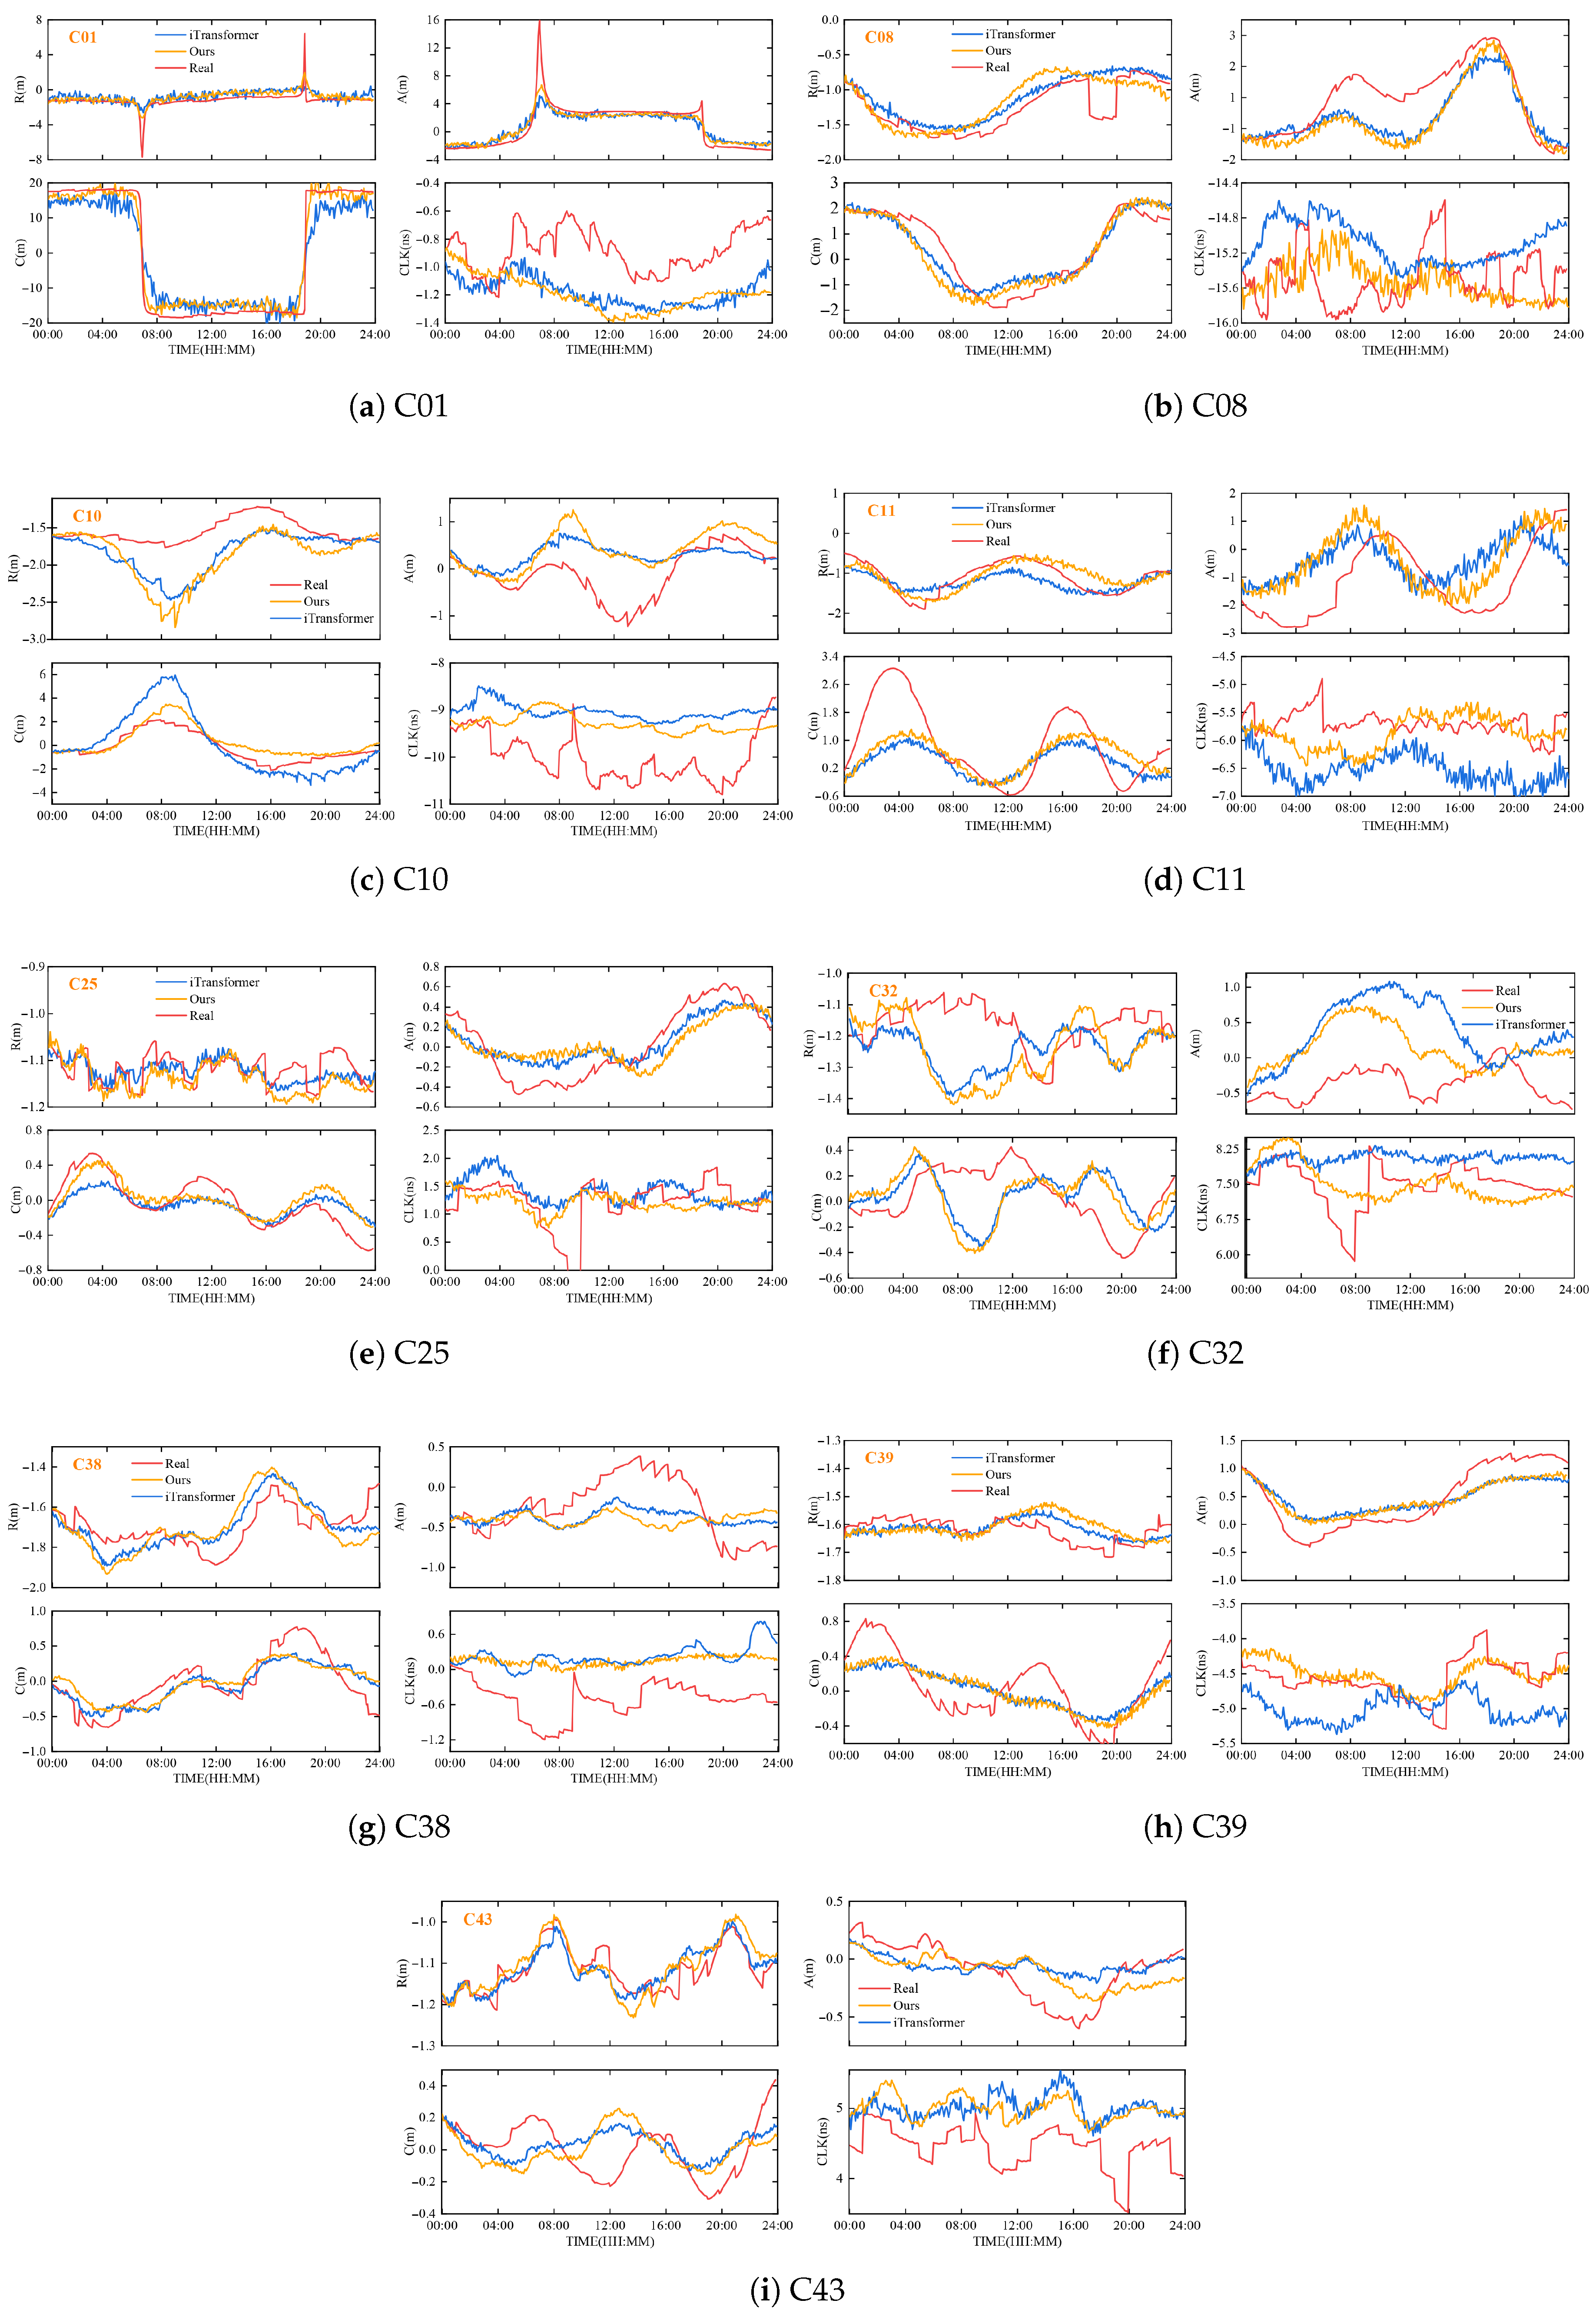
Based on the obtained model training results, time-series prediction was conducted for SSR data on day of year (DOY) 361, 2024. The input time series had a length of 336 with a data interval of 5 min, and the prediction duration was 24 h, performed in a step-by-step manner. Figure 3 illustrates the 24 h predicted versus actual data for nine representative (C01, C08, C10, C11, C25, C32,C38, C39, C43) satellites covering the prediction performance of orbit corrections (R, A, C components) and clock corrections.
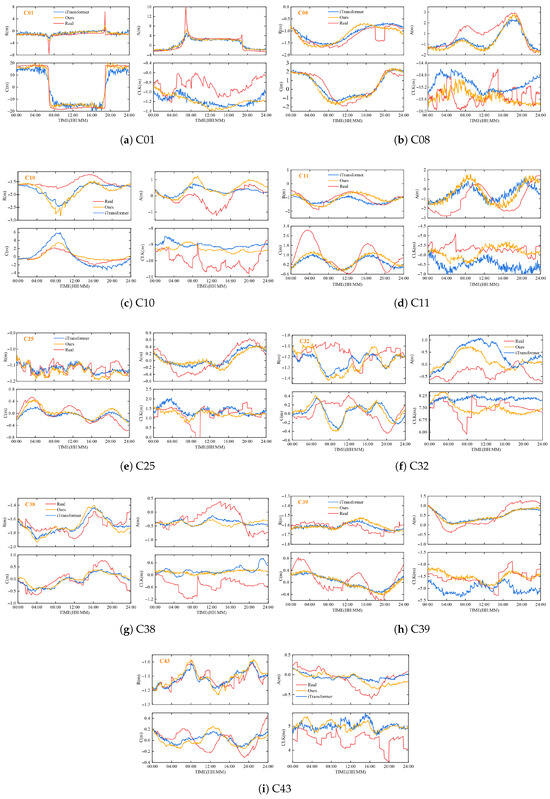
Figure 3.
Prediction results comparison of SSR data for satellites.
Orbit Corrections: Prediction performance for orbit corrections varied across the three components and satellite types, yet demonstrated overall competence in capturing primary trends. The R component exhibited the highest stability, with prediction errors for most satellites (e.g., C32, C38, C43) strictly confined within m, effectively tracing main trends and suppressing noise. Notable fluctuations, such as jumps for C01 and a sharp decline for C08, were captured in the trend, though not fully in magnitude, with errors reaching ∼0.15 m under extreme variations. The A component showed greater variability, achieving strong agreement for C01 and C25, but suffering from increased errors up to m for C08 during daytime and exceeding m for C11 and C39, likely due to maneuver-induced nonlinearities. In contrast, the C component demonstrated the most robust and accurate performance overall. Predictions for C01 and C08 closely followed the true curves with reduced high-frequency noise, and the general motion trends were well captured for C10 and C38. However, the model’s limitation in handling highly complex sequences was reflected in C11 and C39, where the C component bias consistently remained above m.
Clock Corrections: The improved model significantly enhances clock bias prediction accuracy for Satellite C01 during the 00:00–04:00 period, reducing the root mean square error (RMS) from 1.2 ns in the original model to 0.8 ns. For the other satellites (C08, C10, C11, C25, C32, C38, C39, C43), the predicted curves align more closely with the true trends, particularly during stable intervals where the RMS decreases by approximately 30%. However, in regions with notable clock bias jumps—such as those observed for C32 at 08:00, C25 at 11:00, and C39 at 15:00—the model fails to accurately predict the transient peaks, exhibiting a maximum absolute error of up to 2.5 ns.
Based on a quantitative analysis of the SSR data prediction accuracy metrics for nine satellites over the 24 h prediction period (Table 2), the performance advantages of the improved model are clearly demonstrated. The RMS statistics indicate systematic optimization in clock error prediction achieved by the enhanced neural network: except for Satellite C01, whose clock error increased from 0.3332 ns to 0.3629 ns (a rise of 8.9%), all other satellites showed significant improvements. Notably, C39 exhibited a 60.8% reduction in error (from 0.5473 ns to 0.2140 ns), while C08, C11, and C32 achieved error reductions of 31.5%, 51.9%, and 33.8%, respectively. Satellites C10, C38, and C43 demonstrated more moderate improvements, with error reduction rates of 18.2%, 11.2%, and 6.8%, respectively. For orbit corrections, the optimization effect exhibited component-specific characteristics, with the most consistent and significant improvements observed in the cross-track component.

Table 2.
RMS values of SSR data prediction for satellites C01, C08, C10, C11, C25, C32, C38, C39, and C43.
3.1.2. Prediction Accuracy Across Satellite Types
A comprehensive evaluation based on 41 BDS satellites (C01–C45) reveals distinct performance variations across satellite types (Table 3). While the proposed model generally maintained stable orbit corrections, its effectiveness in clock error reduction differed notably between BDS generations. For BDS-2 satellites, performance was heterogeneous.

Table 3.
RMS values of SSR data prediction for different BDS satellite types.
GEO satellites showed limited improvement, with clock error increasing slightly from 0.6000 ns to 0.6192 ns, whereas IGSO and MEO types achieved noticeable reductions from 0.6327 ns to 0.5627 ns and from 0.7807 ns to 0.7212 ns, respectively. In contrast, BDS-3 satellites demonstrated more consistent and significant gains, with IGSO types achieving a pronounced 31.3% reduction in clock error (from 0.6591 ns to 0.4526 ns) and MEO types also showing clear improvement, underscoring the model’s enhanced compatibility with the newer generation satellites.
3.1.3. Prediction Accuracy over Time
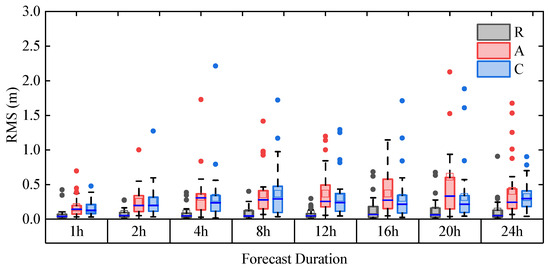
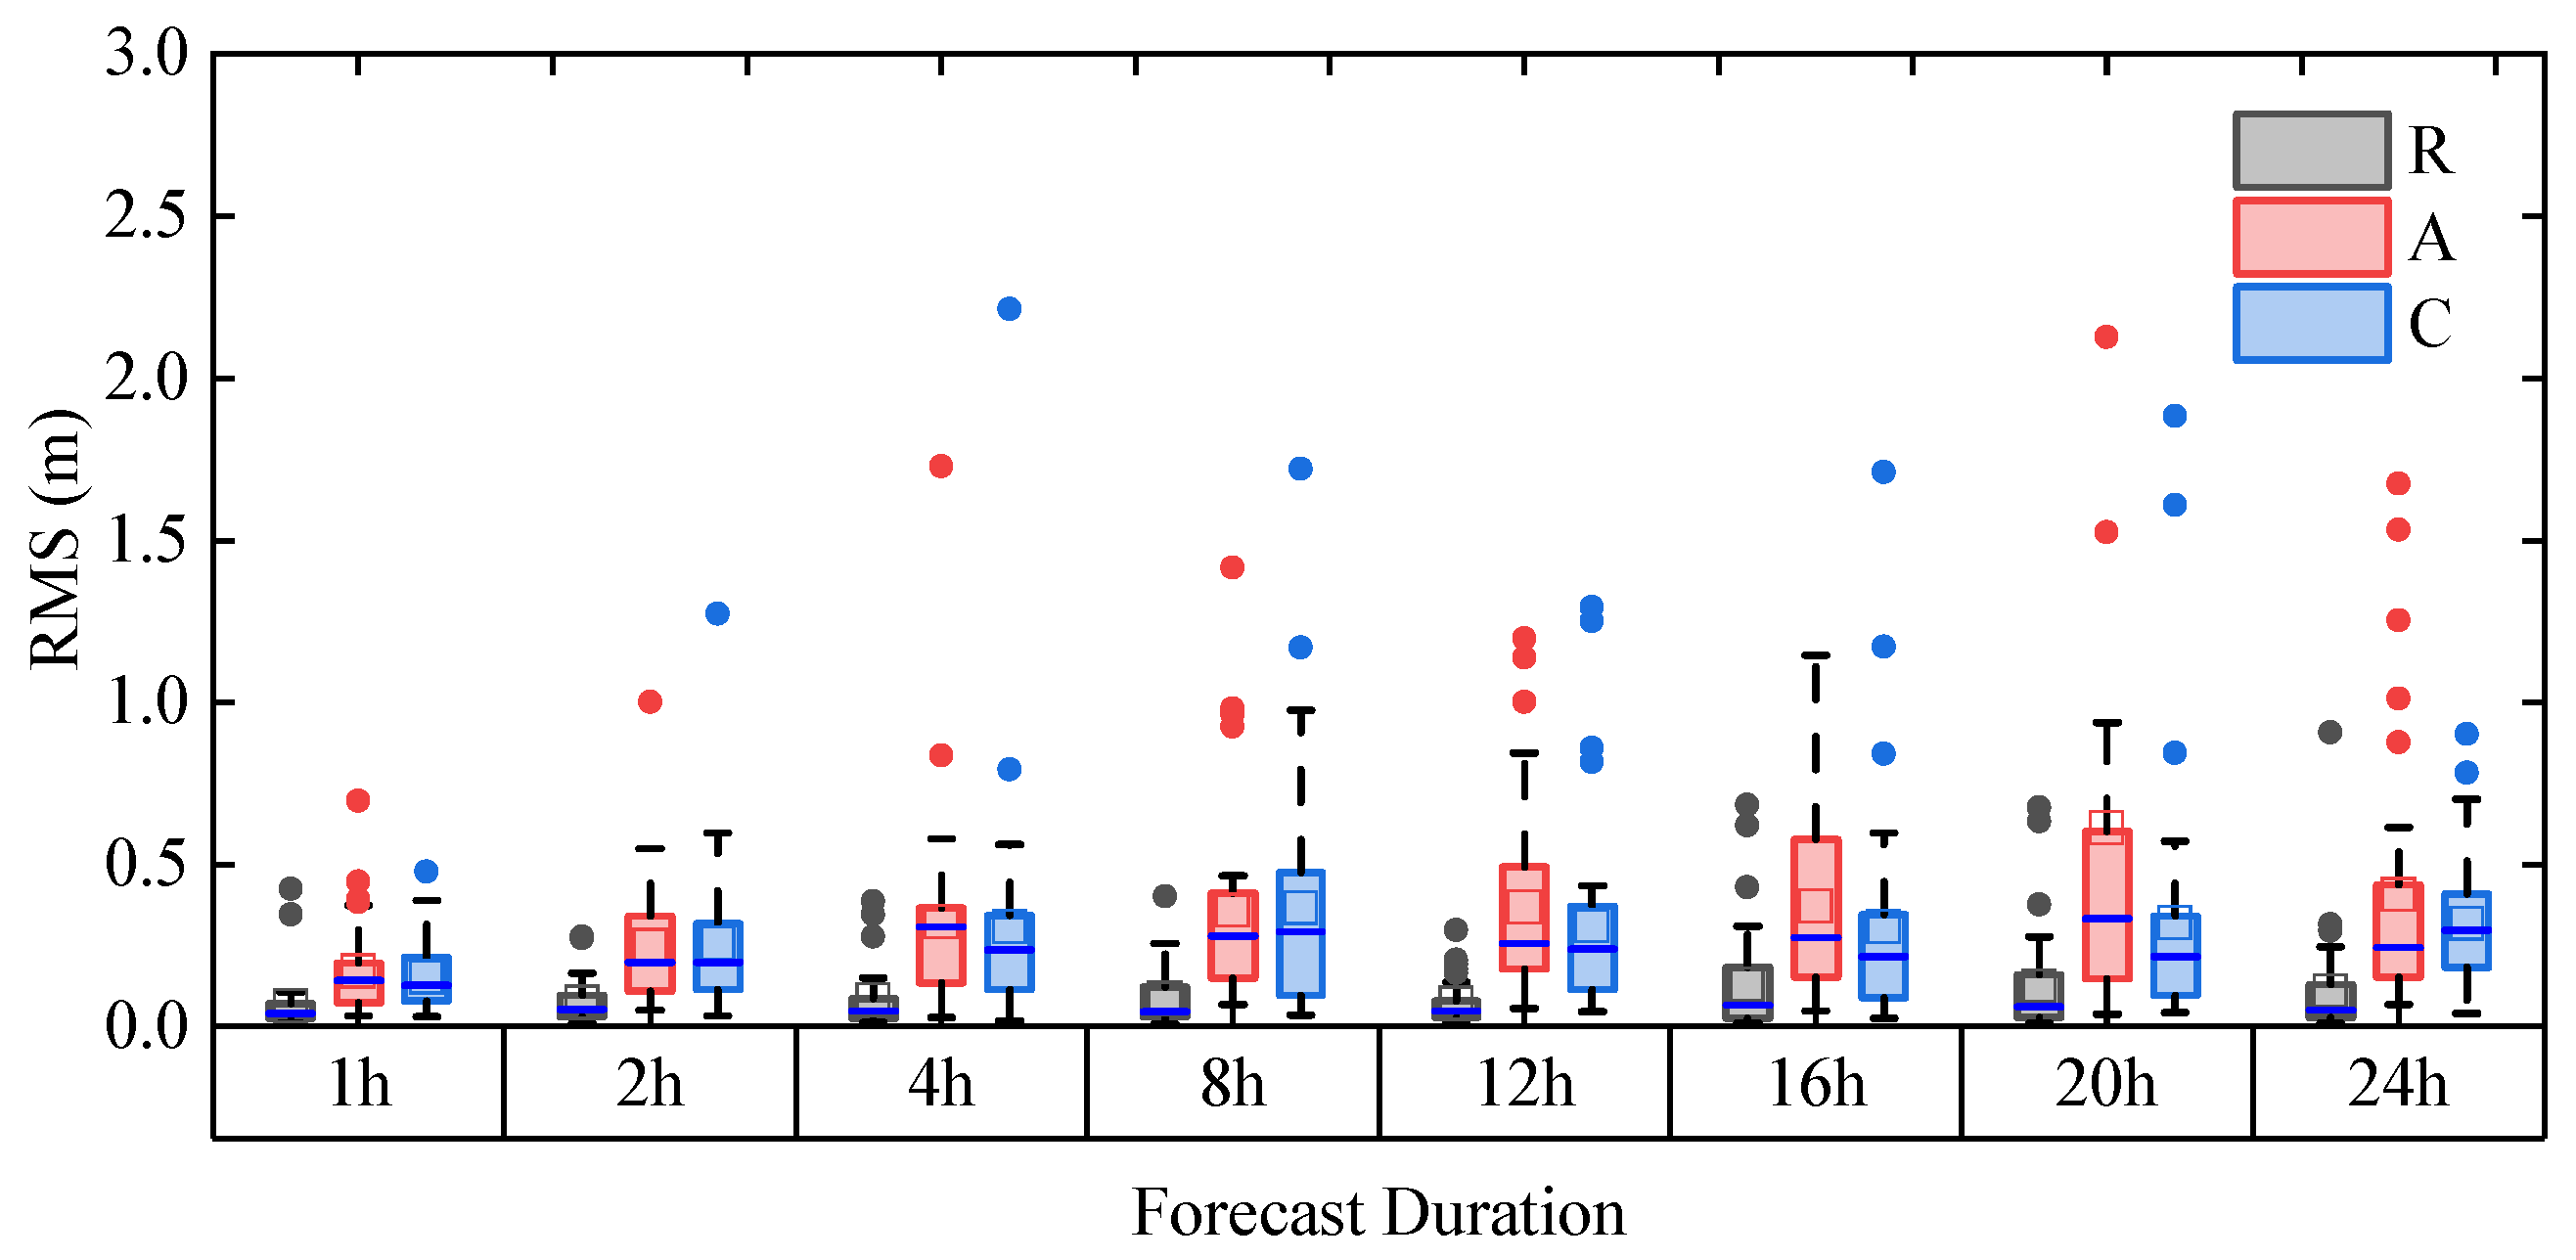
Figure 4.
Boxplot of orbit correction prediction accuracy over time.
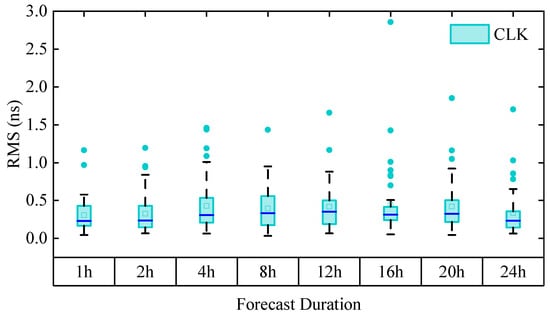
Figure 5.
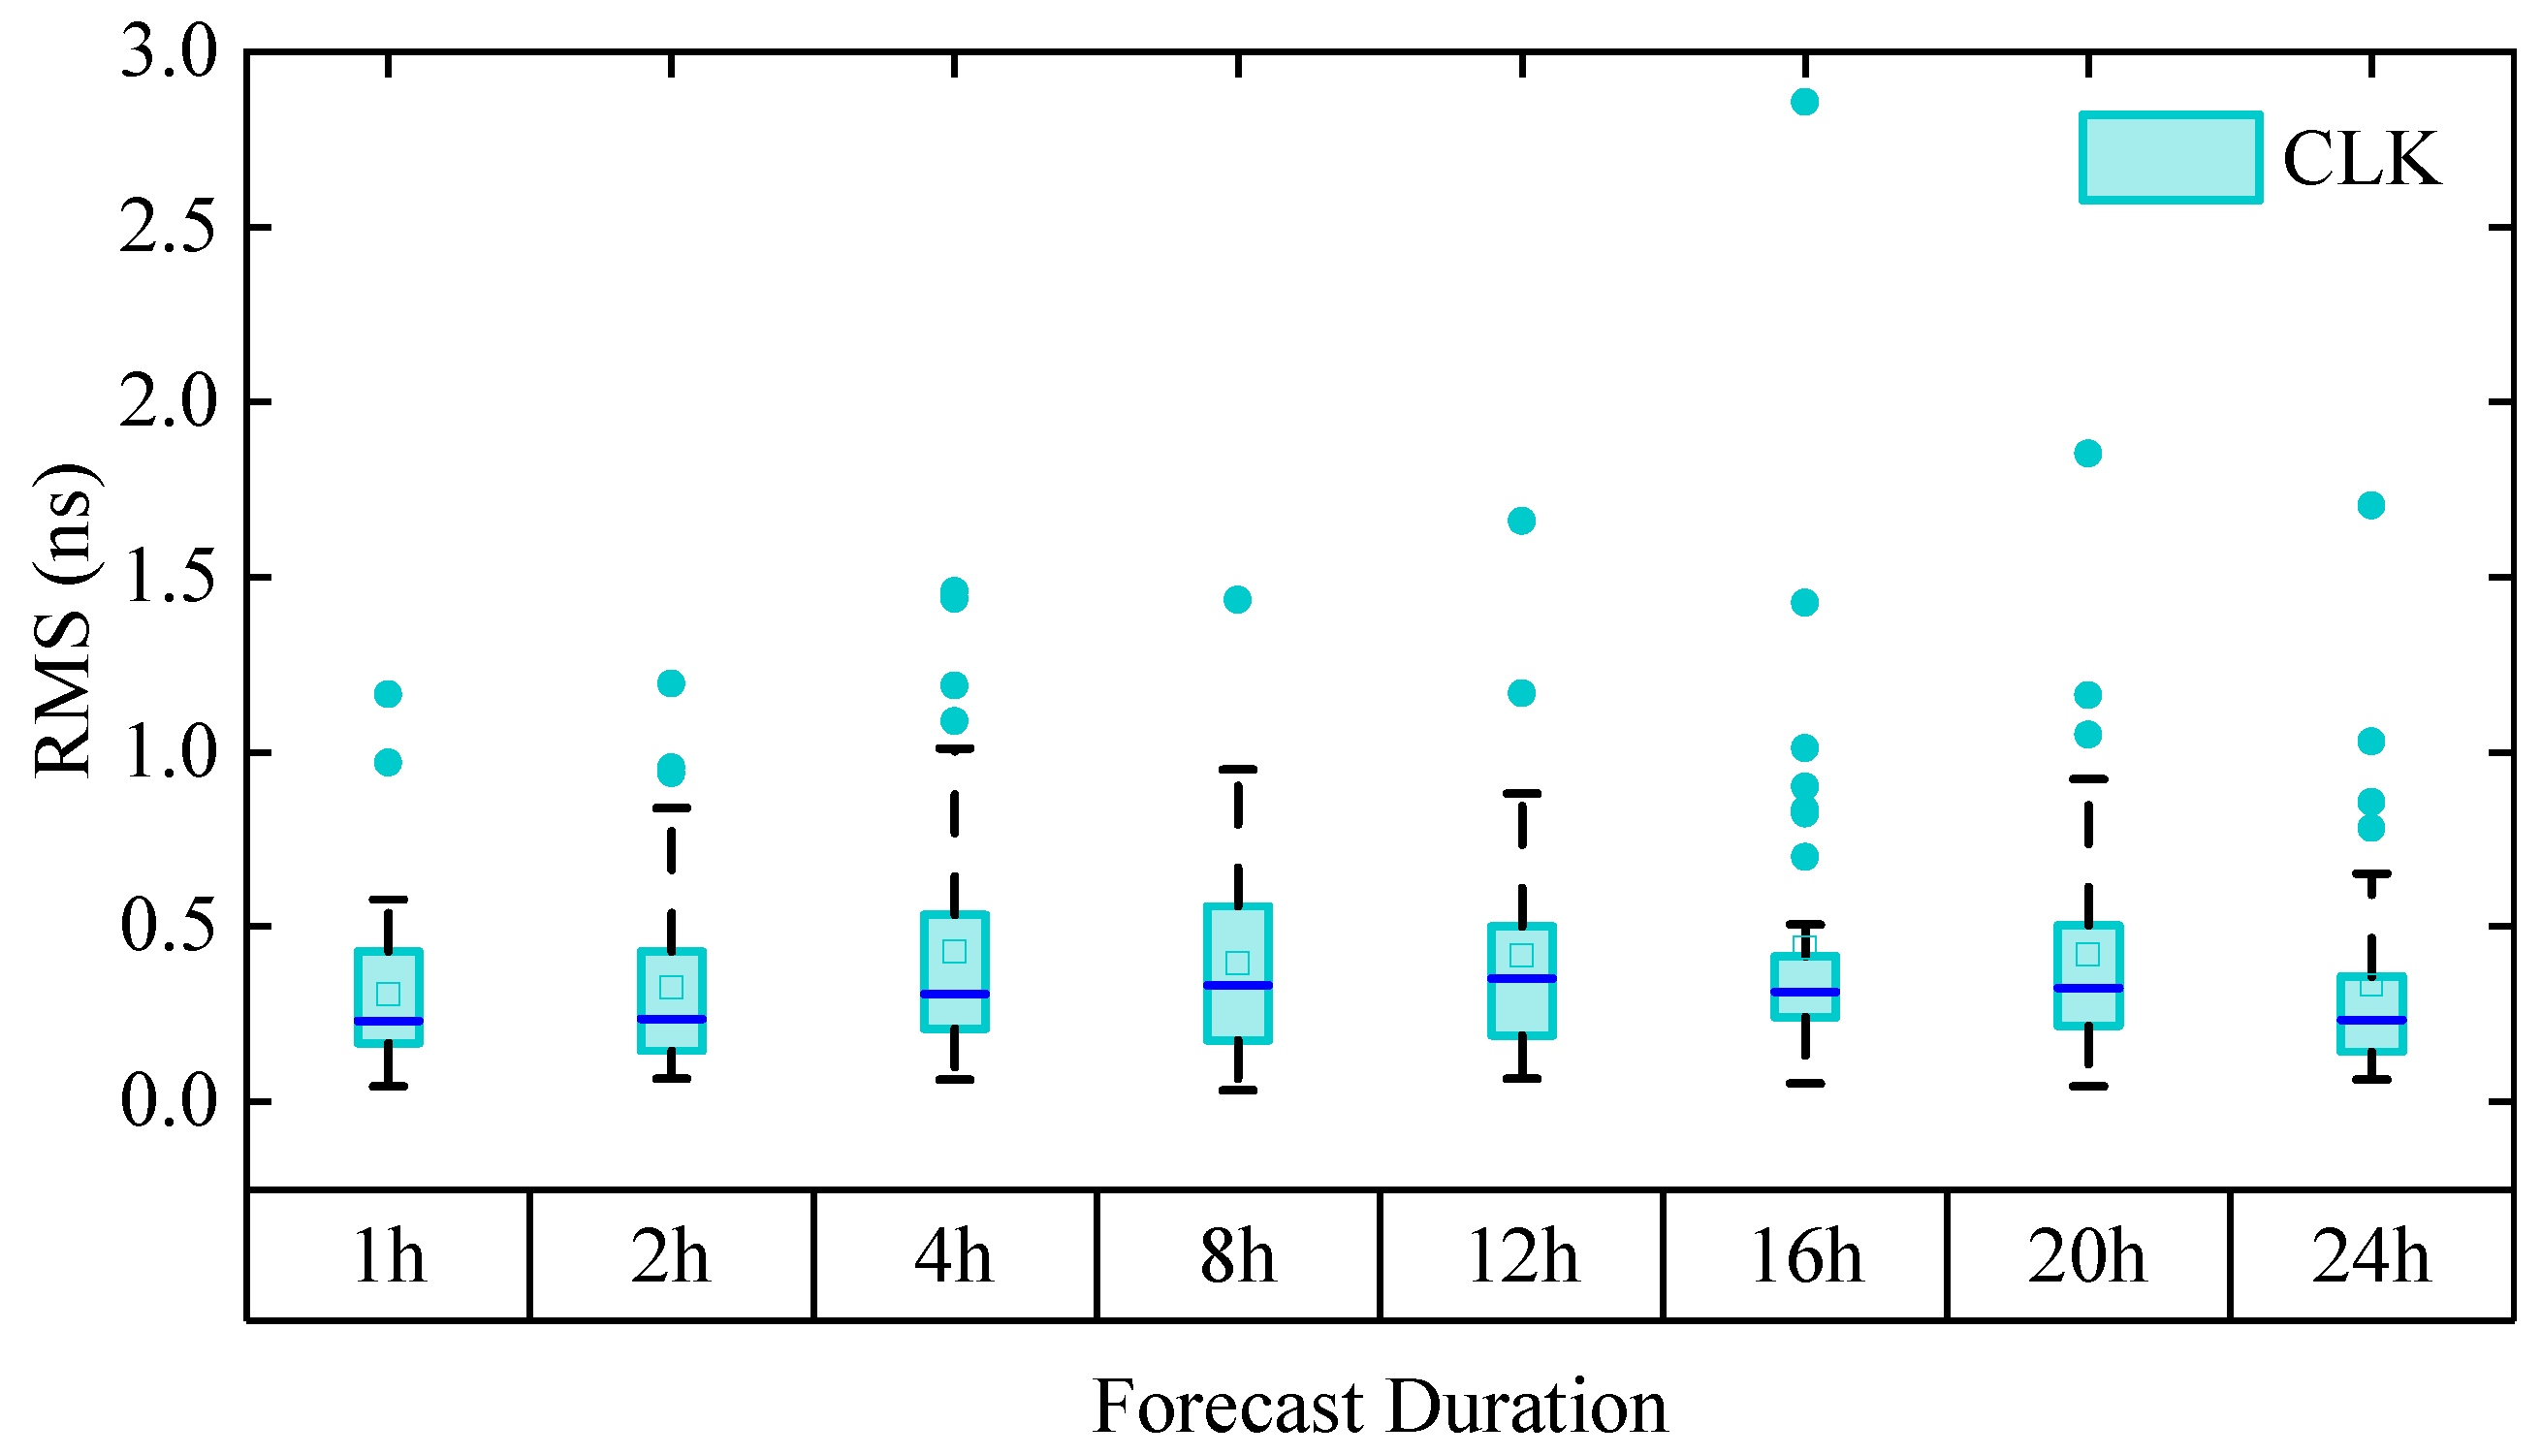
Boxplot of clock correction prediction accuracy over time.
Orbit Corrections: As shown in Figure 4, the model demonstrates strong short-term prediction capability for orbit corrections, with mean errors within m (R), m (A), and m (C) for horizons up to 2 h. Accuracy gradually decreases as the prediction window extends, with A and C component errors rising to m and m by 4 h. In medium to long-term predictions (≥8 h), error accumulation becomes evident, though the cross-track component shows a contracting error distribution during the 12–24 h interval, suggesting the model’s adaptation to orbital periodicities. Throughout all time spans, the radial component consistently maintains the highest accuracy, corresponding to its inherently smaller variation range.
Clock Corrections:Figure 5 illustrates the clock correction prediction performance over time. The model maintains stable sub- ns accuracy in short-term predictions (≤2 h). While errors show an upward trend with extended horizons, they remain generally controlled below 1 ns on average. Outliers are primarily observed around the 16 h mark, with maximum RMSE reaching 3 ns, likely associated with GEO satellite clock deviations. Despite increased dispersion in long-term predictions (≥12 h), the model’s short-term stability meets the requirements for real-time PPP applications.
3.1.4. Comparison with Traditional Prediction Models
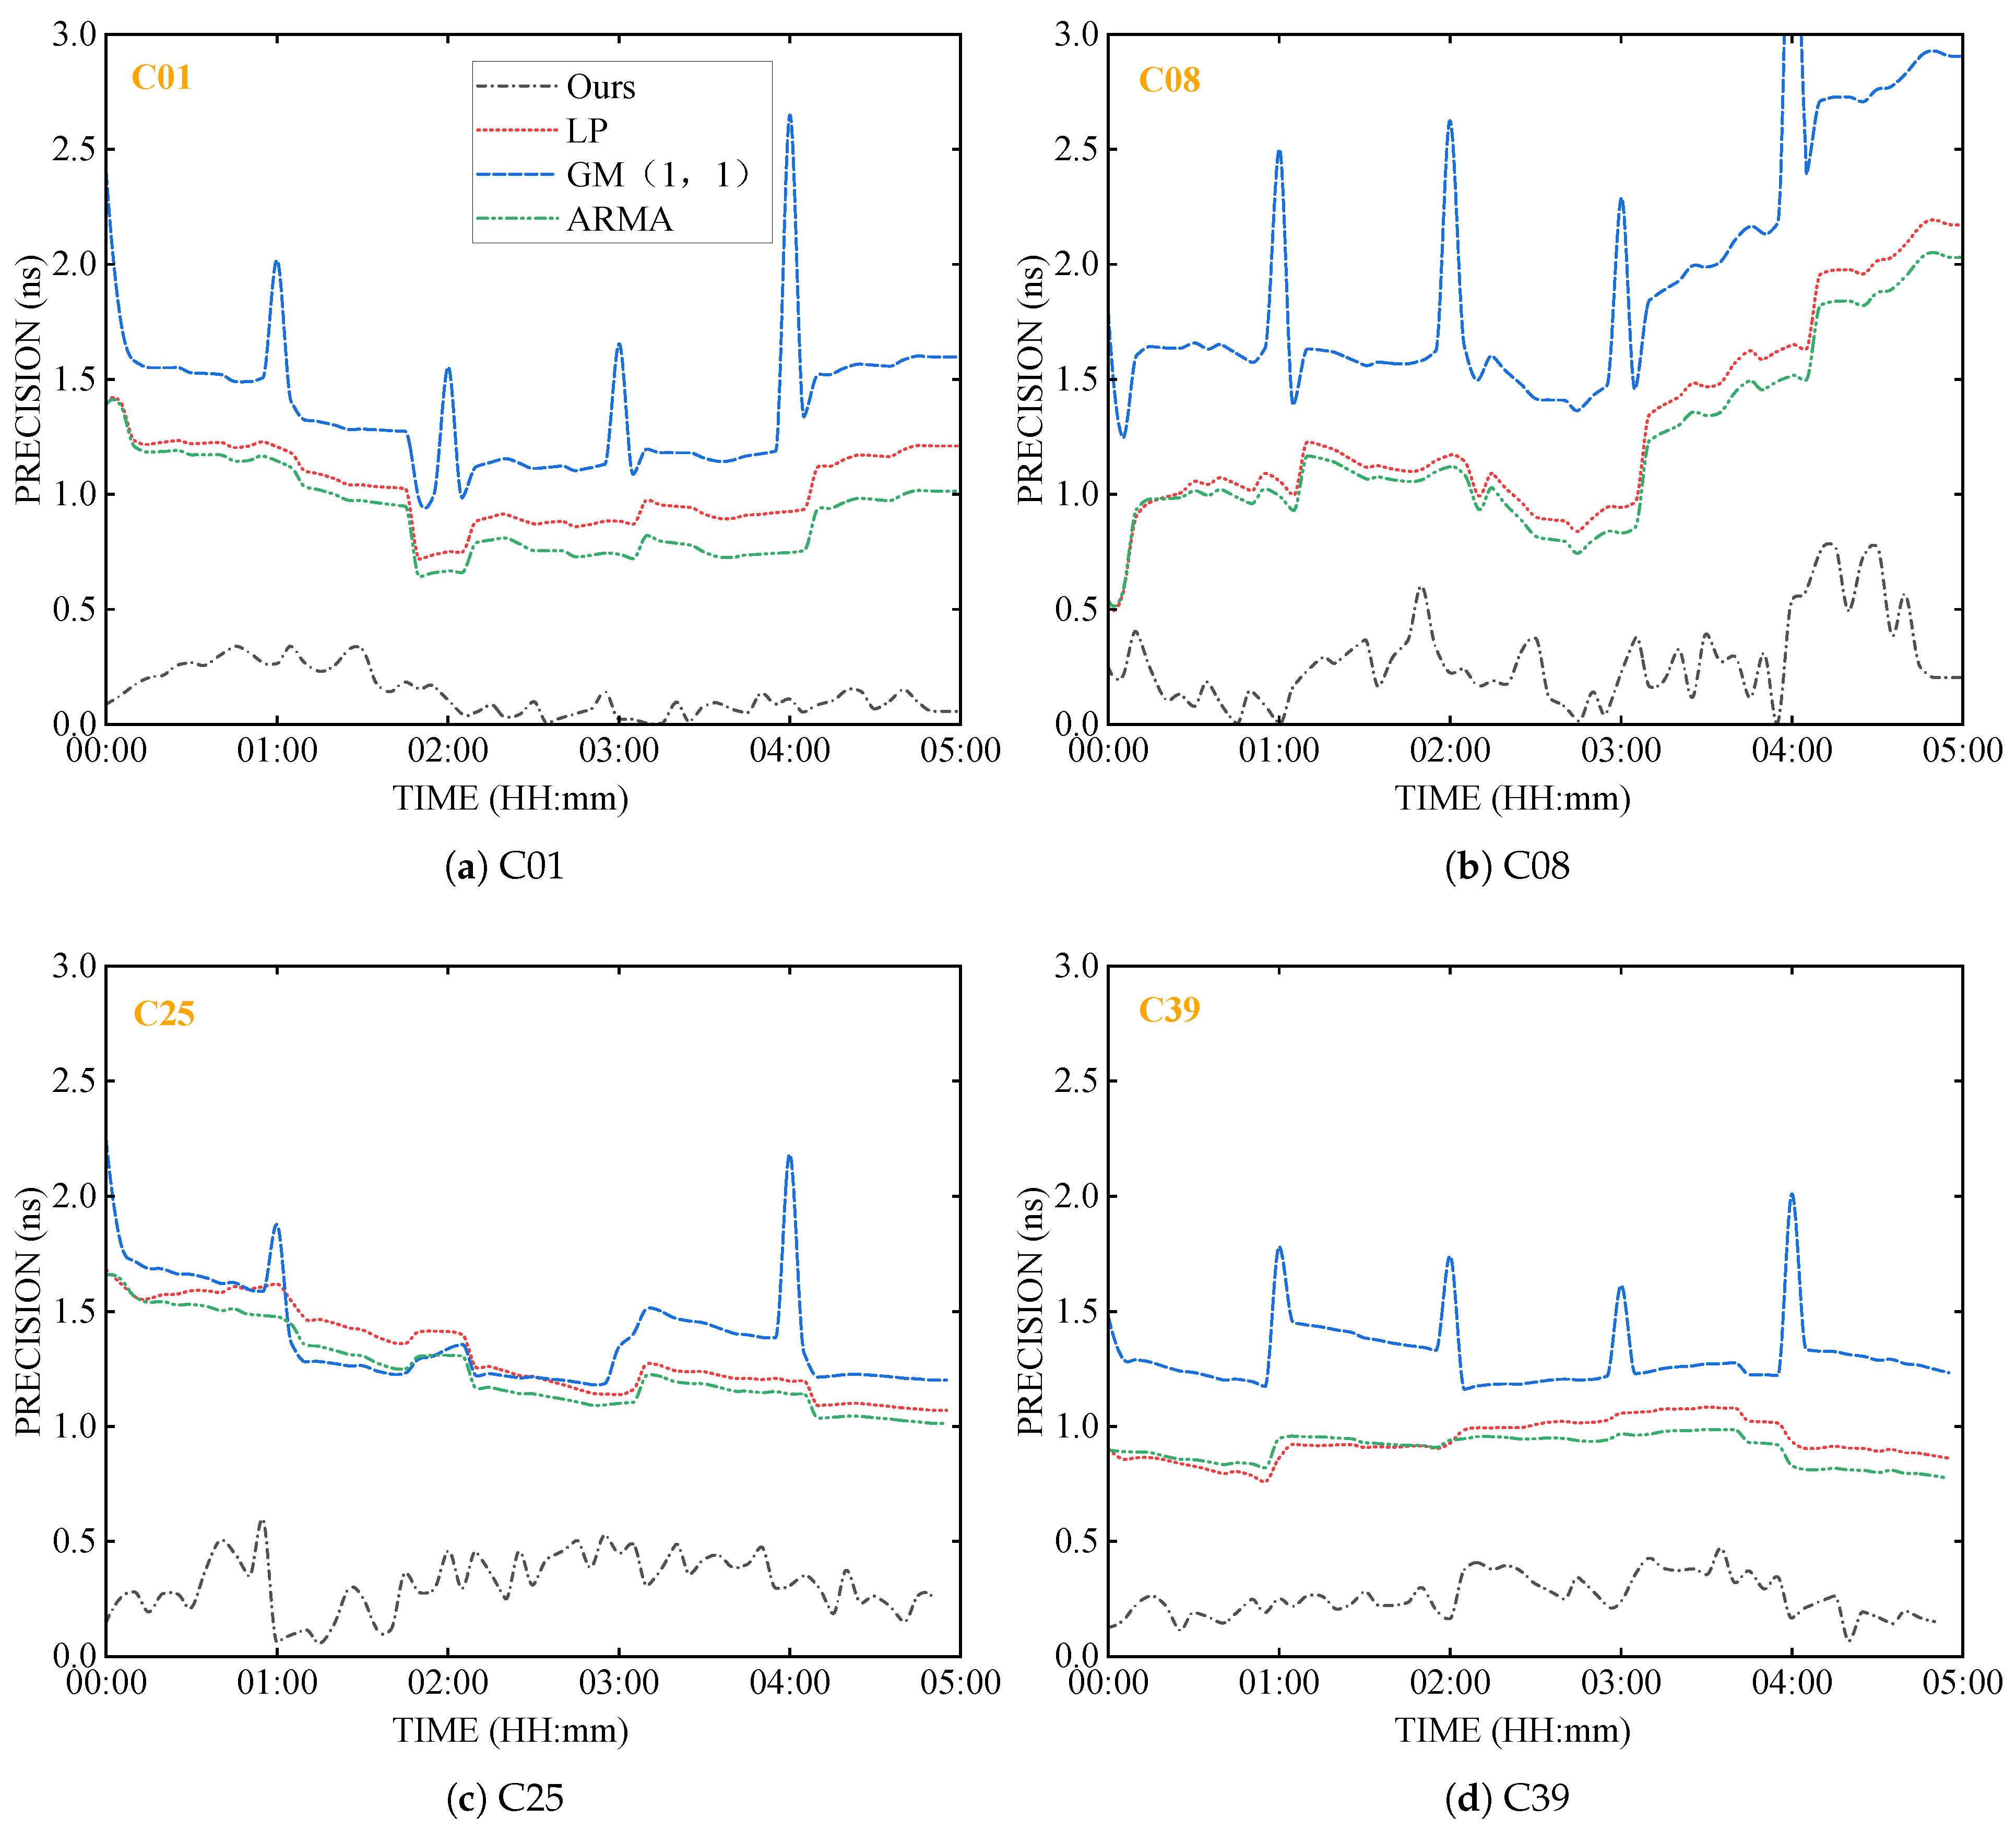
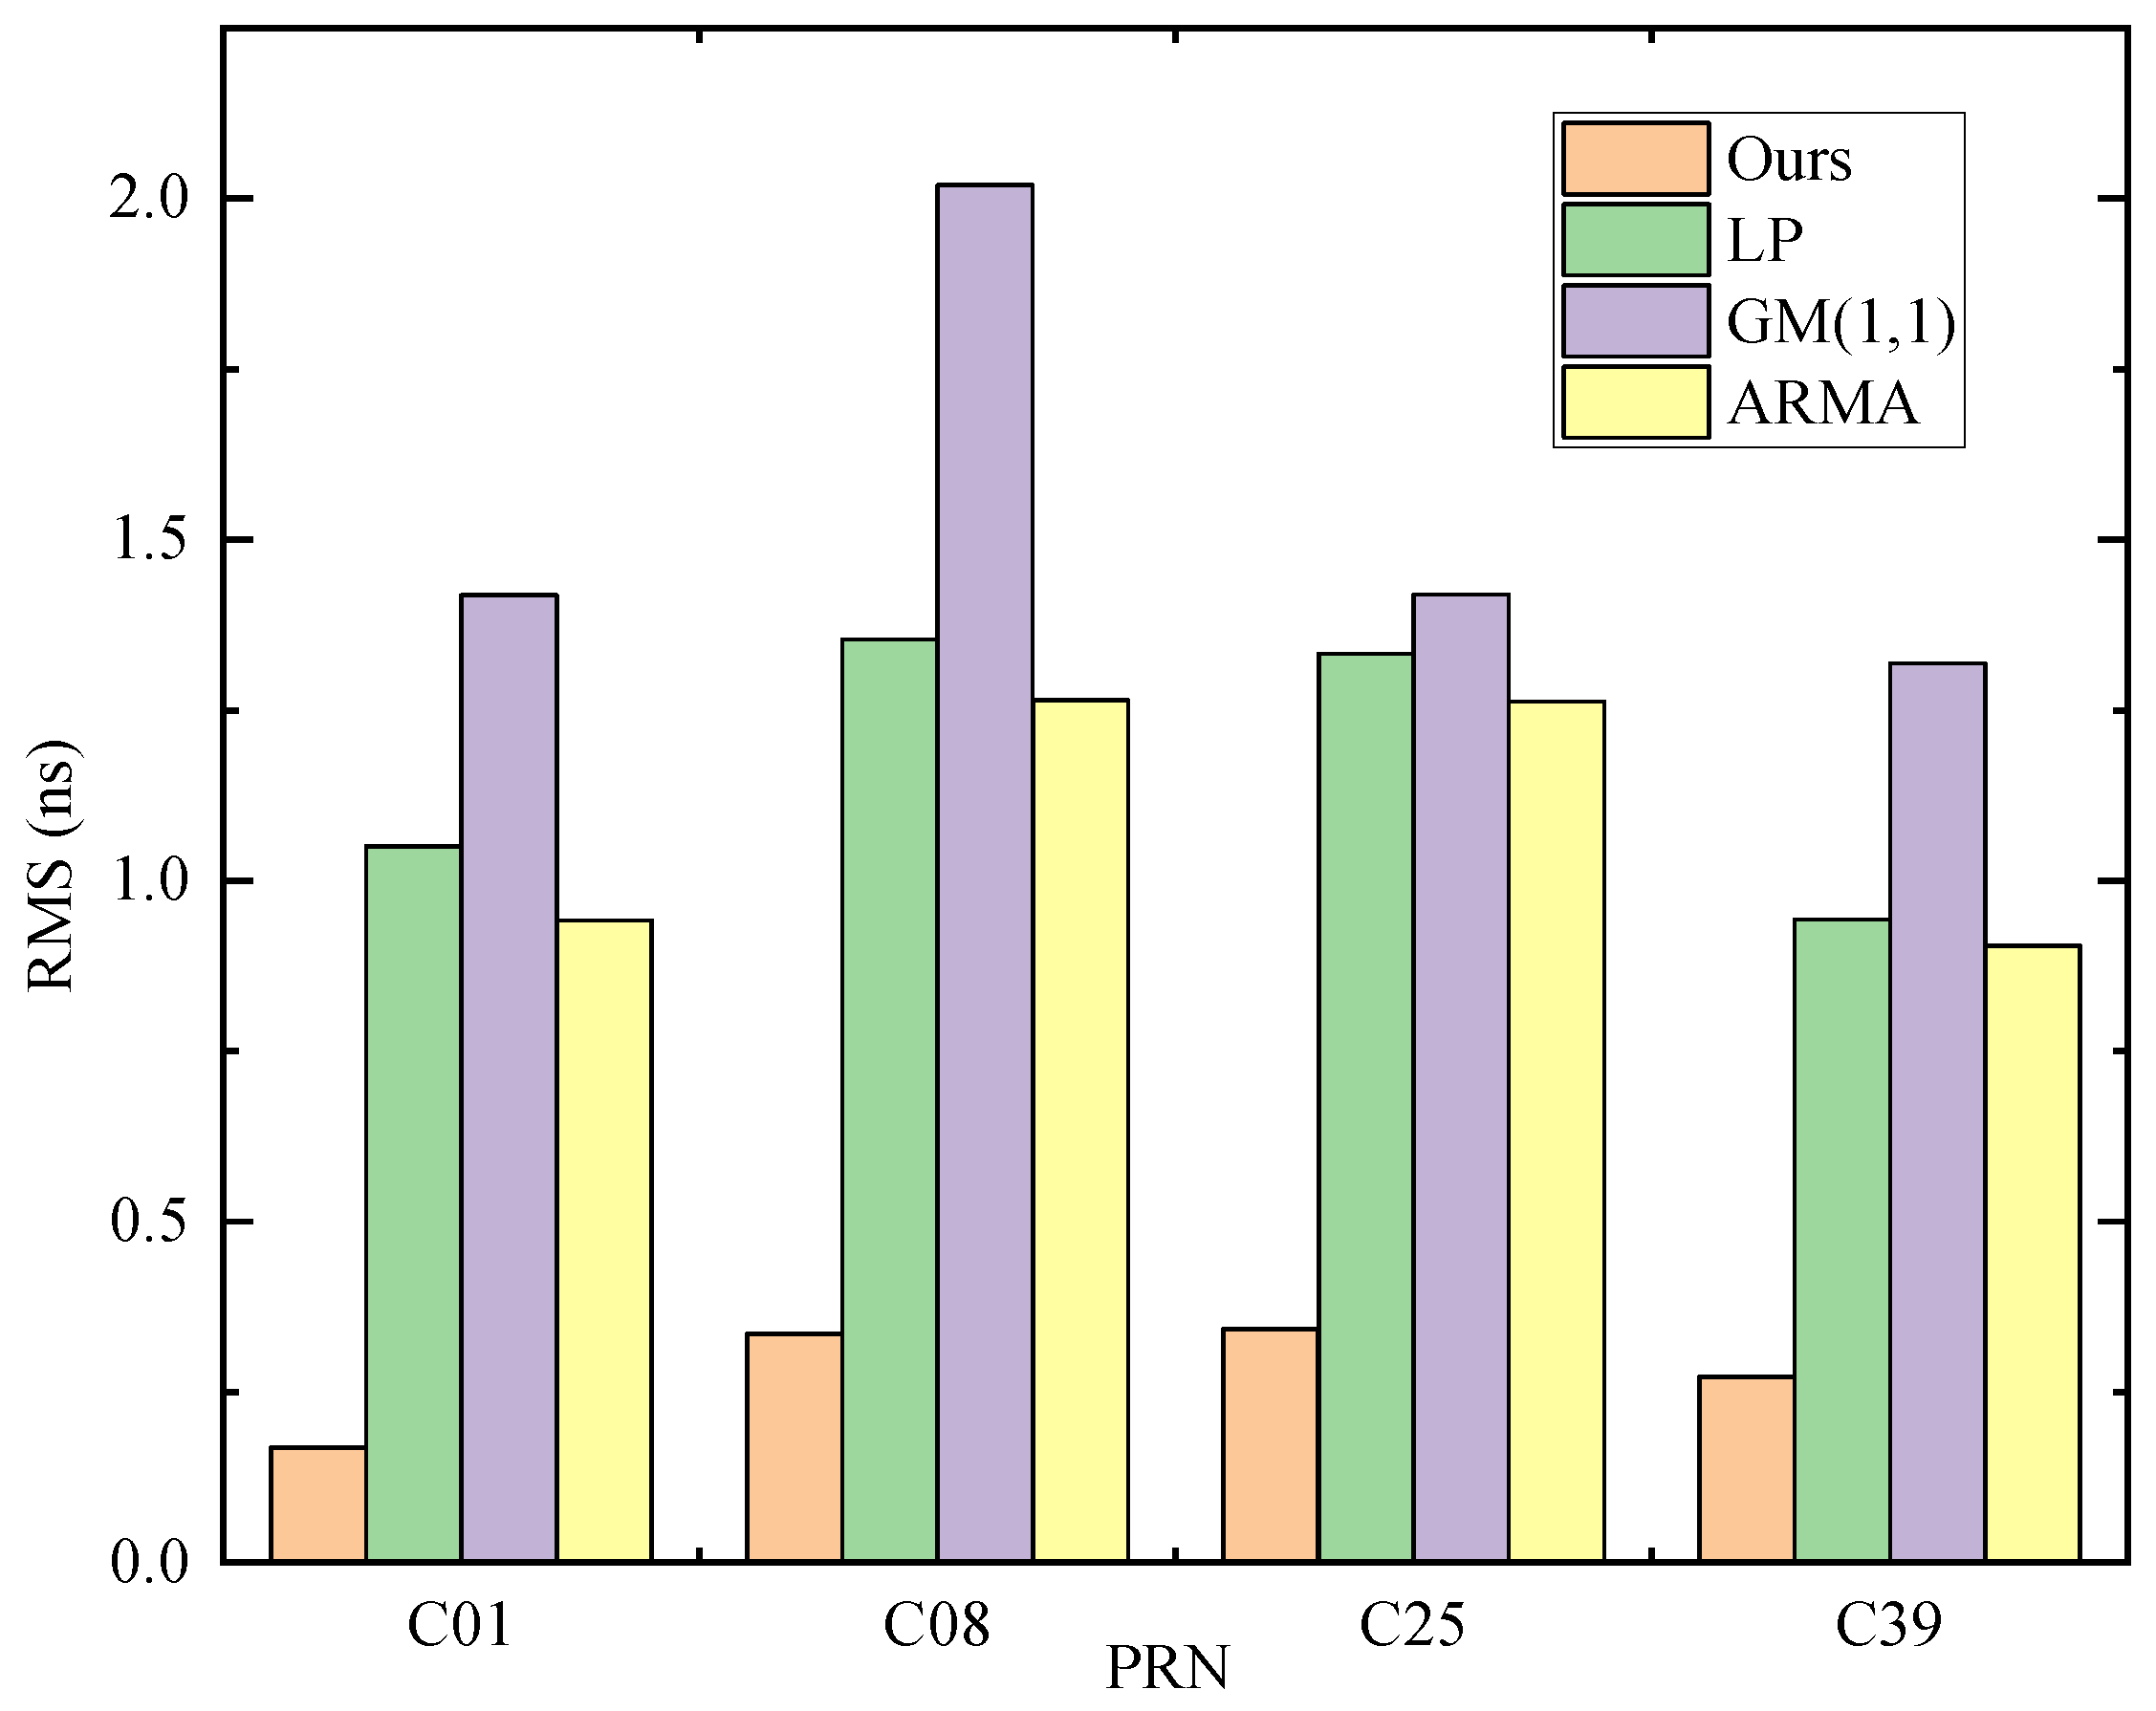
As consistently demonstrated by the absolute prediction errors over 5 h for four satellites (C01, C08, C25, C39) in Figure 6 and the RMS values in Figure 7, the improved model significantly outperforms all three traditional methods across all test satellites. Further observation of Figure 6 reveals that absolute errors remained below 0.5 ns for all satellites throughout the entire period, except for minor exceedances in individual periods for C08 and C25. The RMS results presented in Figure 7 further confirm that the deep learning model substantially outperforms traditional models in longer prediction scenarios.
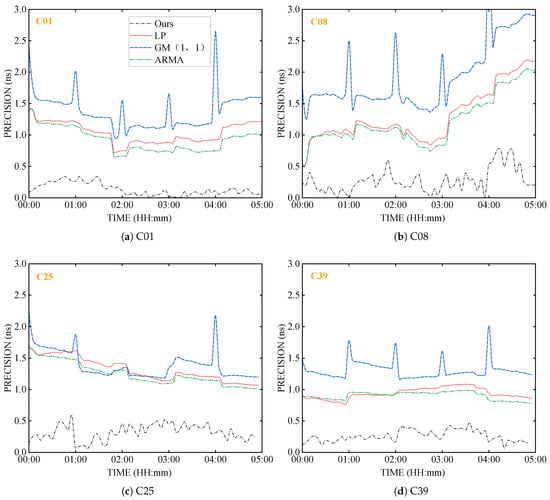
Figure 6.
Absolute prediction errors of the clock corrections for the four different models over a 5 h period.
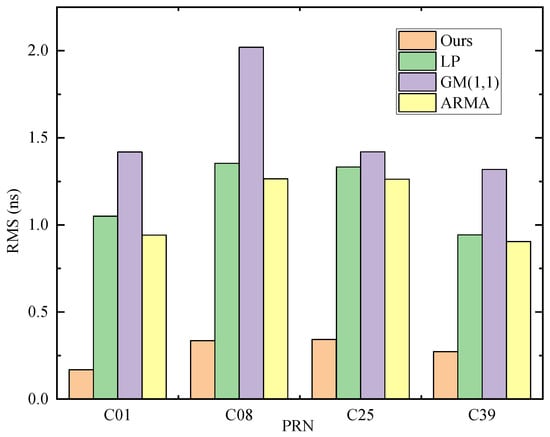
Figure 7.
RMS values of the clock-correction prediction results of the four different models over a 5 h period for different satellites.
Specifically, in the 30 min prediction (Table 4), the RMS values of the improved model remained consistently below 0.3 ns, comprehensively outperforming traditional models. Compared with the best traditional model (ARMA), the RMS values for Satellites C01, C08, C25, and C39 were reduced by 85%, 72%, 85%, and 78%, respectively. In the 3 h prediction (Table 5), the RMS values of the improved model remained consistently below 0.4 ns, with the maximum error increase effectively constrained within 40% compared with the 30 min prediction (for Satellite C25). These experimental results demonstrate that the proposed improved model can provide highly reliable support for decimeter-level real-time Precise Point Positioning, exhibiting particularly significant advantages during SSR outage scenarios.

Table 4.
RMS values of the 30 min clock-correction prediction results for different satellites (units: ns).

Table 5.
RMS values of the 3 h clock-correction prediction results for different satellites (units: ns).
3.2. PPP Positioning Performance
3.2.1. Performance at MGEX Stations
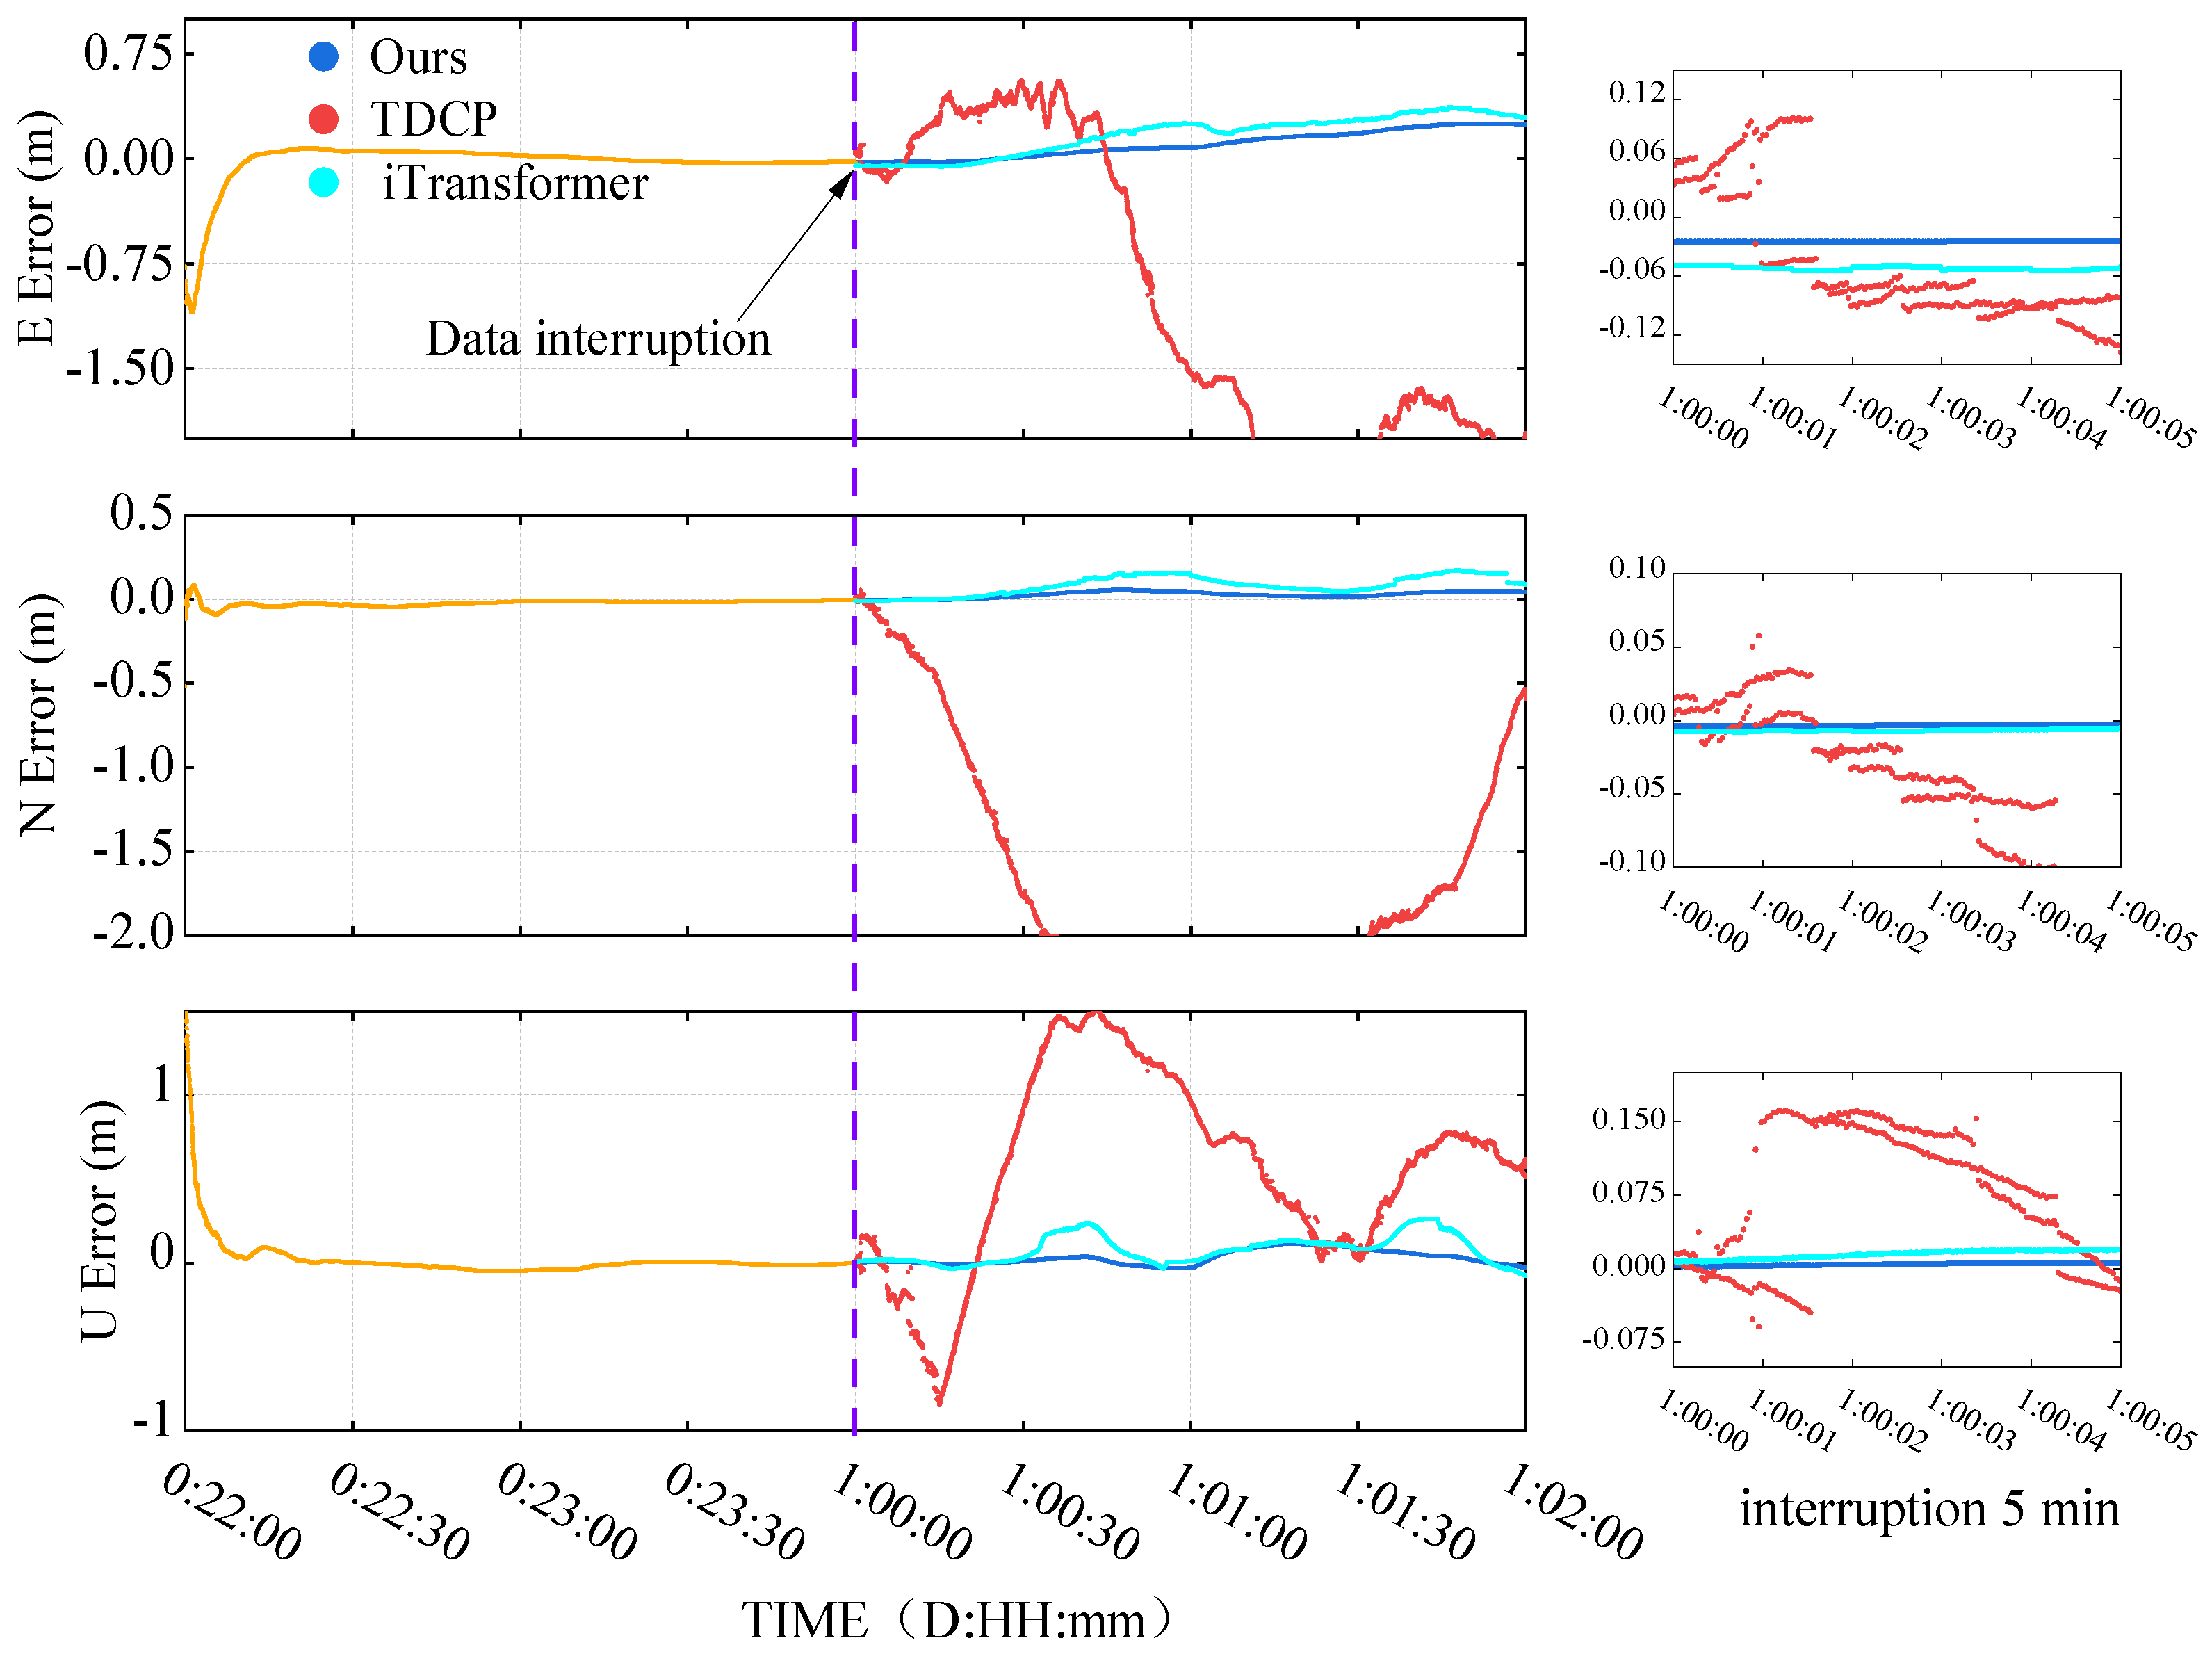
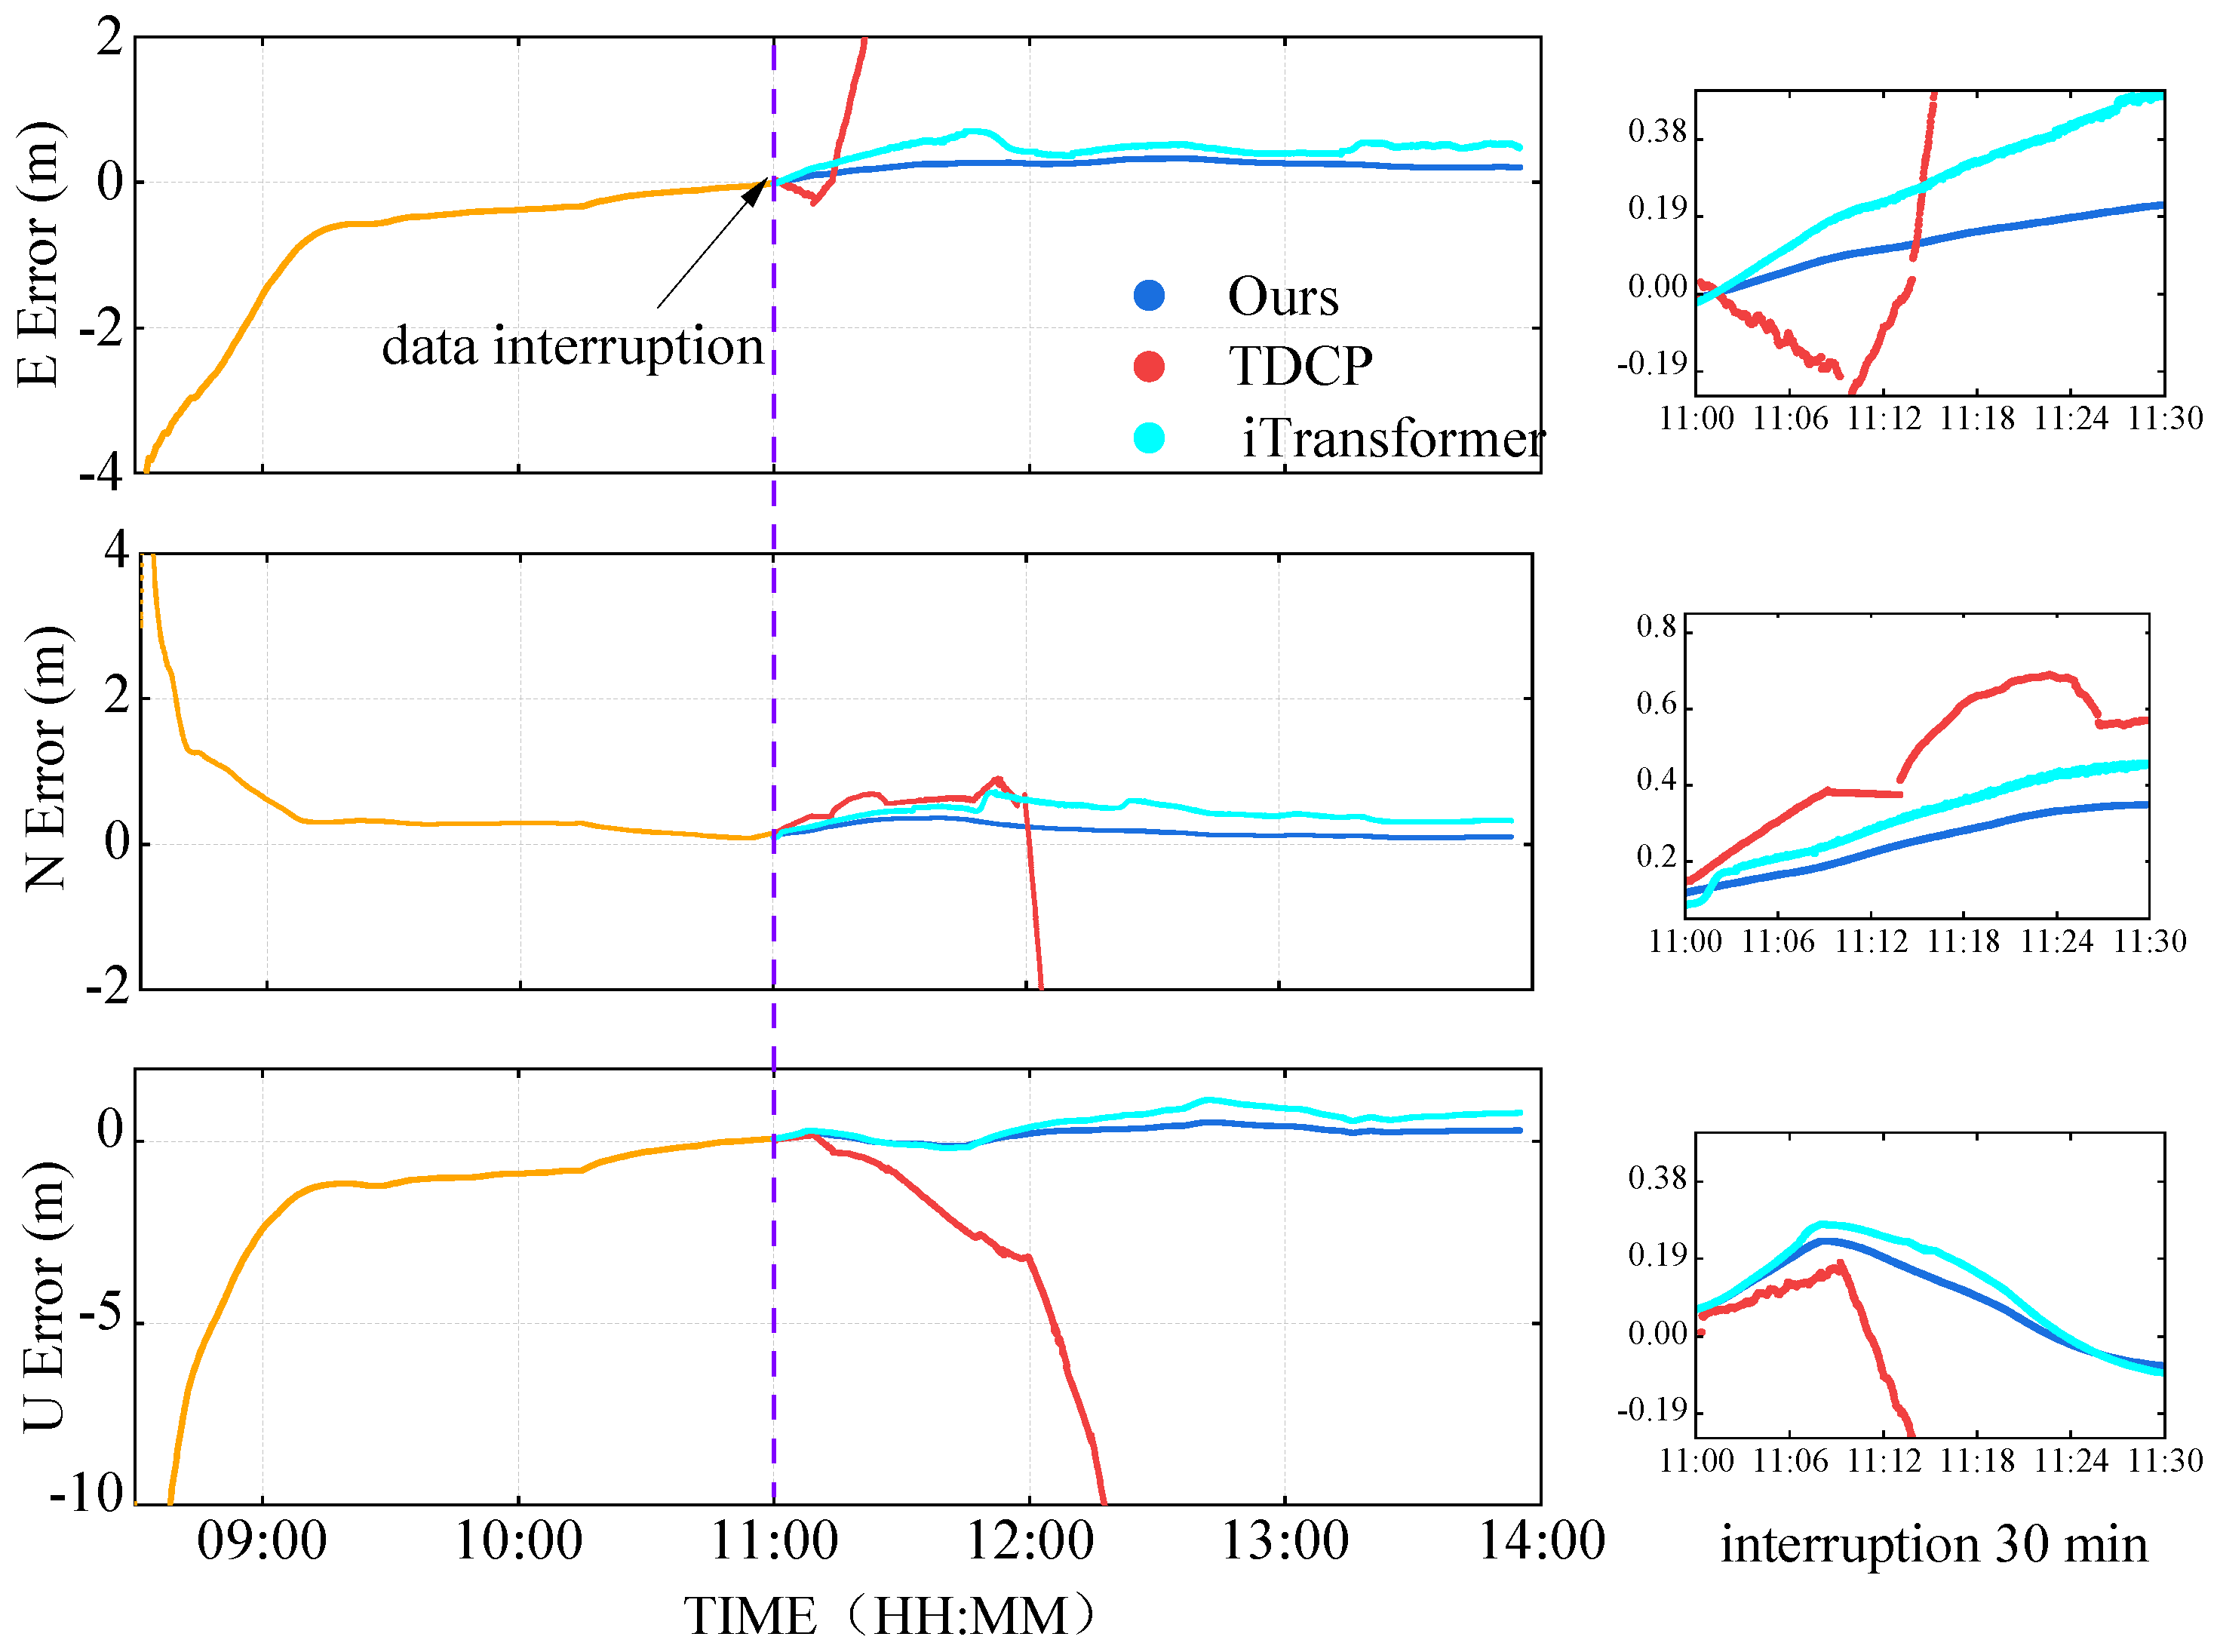
Figure 8 illustrates the positioning error comparison in the East (E), North (N), and Up (U) directions for the station CUSV before and after the SSR data interruption (from DOY 361 22:00 to DOY 362 02:00). The ionosphere-free combination PPP model was employed throughout the positioning process, demonstrating stable errors during the first 2 h. During the simulated SSR interruption lasting 2 h at DOY 362 00:00, the error sequences of the proposed method, the original iTransformer, and the TDCP model reveal the following performance differences. During the 2 h interruption period, the proposed method demonstrates excellent stability with relatively small error fluctuations in the E, N, and U directions, where the maximum errors are 0.10 m, 0.05 m, and 0.17 m, respectively. In comparison, although the error curve of the original iTransformer model is closely aligned with the overall trend of the proposed method, it exhibits significantly larger deviations, with peak errors reaching 0.39 m, 0.17 m, and 0.34 m in the three directions, respectively. The occasional anomalous fluctuations observed are likely attributed to satellite clock bias jumps. On the other hand, the TDCP model displays pronounced error divergence, particularly in the N direction where the positioning error exceeds 2.0 m, indicating its limited effectiveness during prolonged outage scenarios.
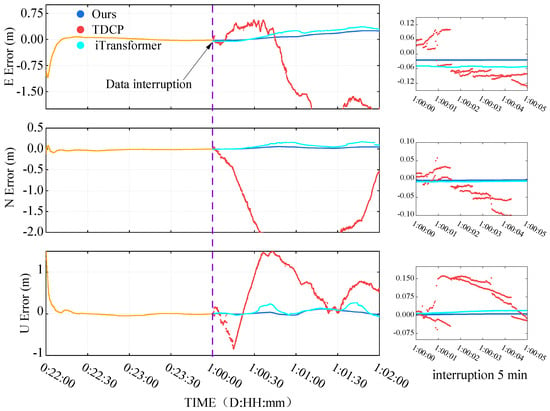
Figure 8.
Positioning error comparison during SSR data interruption at the CUSV station (The orange line represents the positioning accuracy curve before the SSR outage).
In addition to the positioning accuracy during outages, we also analyzed the convergence time of the PPP solution when initialized with the predicted SSR corrections. As observed in the data segment prior to the interruption in Figure 8, the PPP solution utilizing our predicted corrections achieved convergence (defined as the time for ENU errors to simultaneously fall and remain below 0.1 m) within approximately 10 min. This performance is comparable to the convergence time observed when using real-time SSR streams, demonstrating that the predicted corrections do not introduce significant initial biases and support a rapid transition to high-precision positioning.
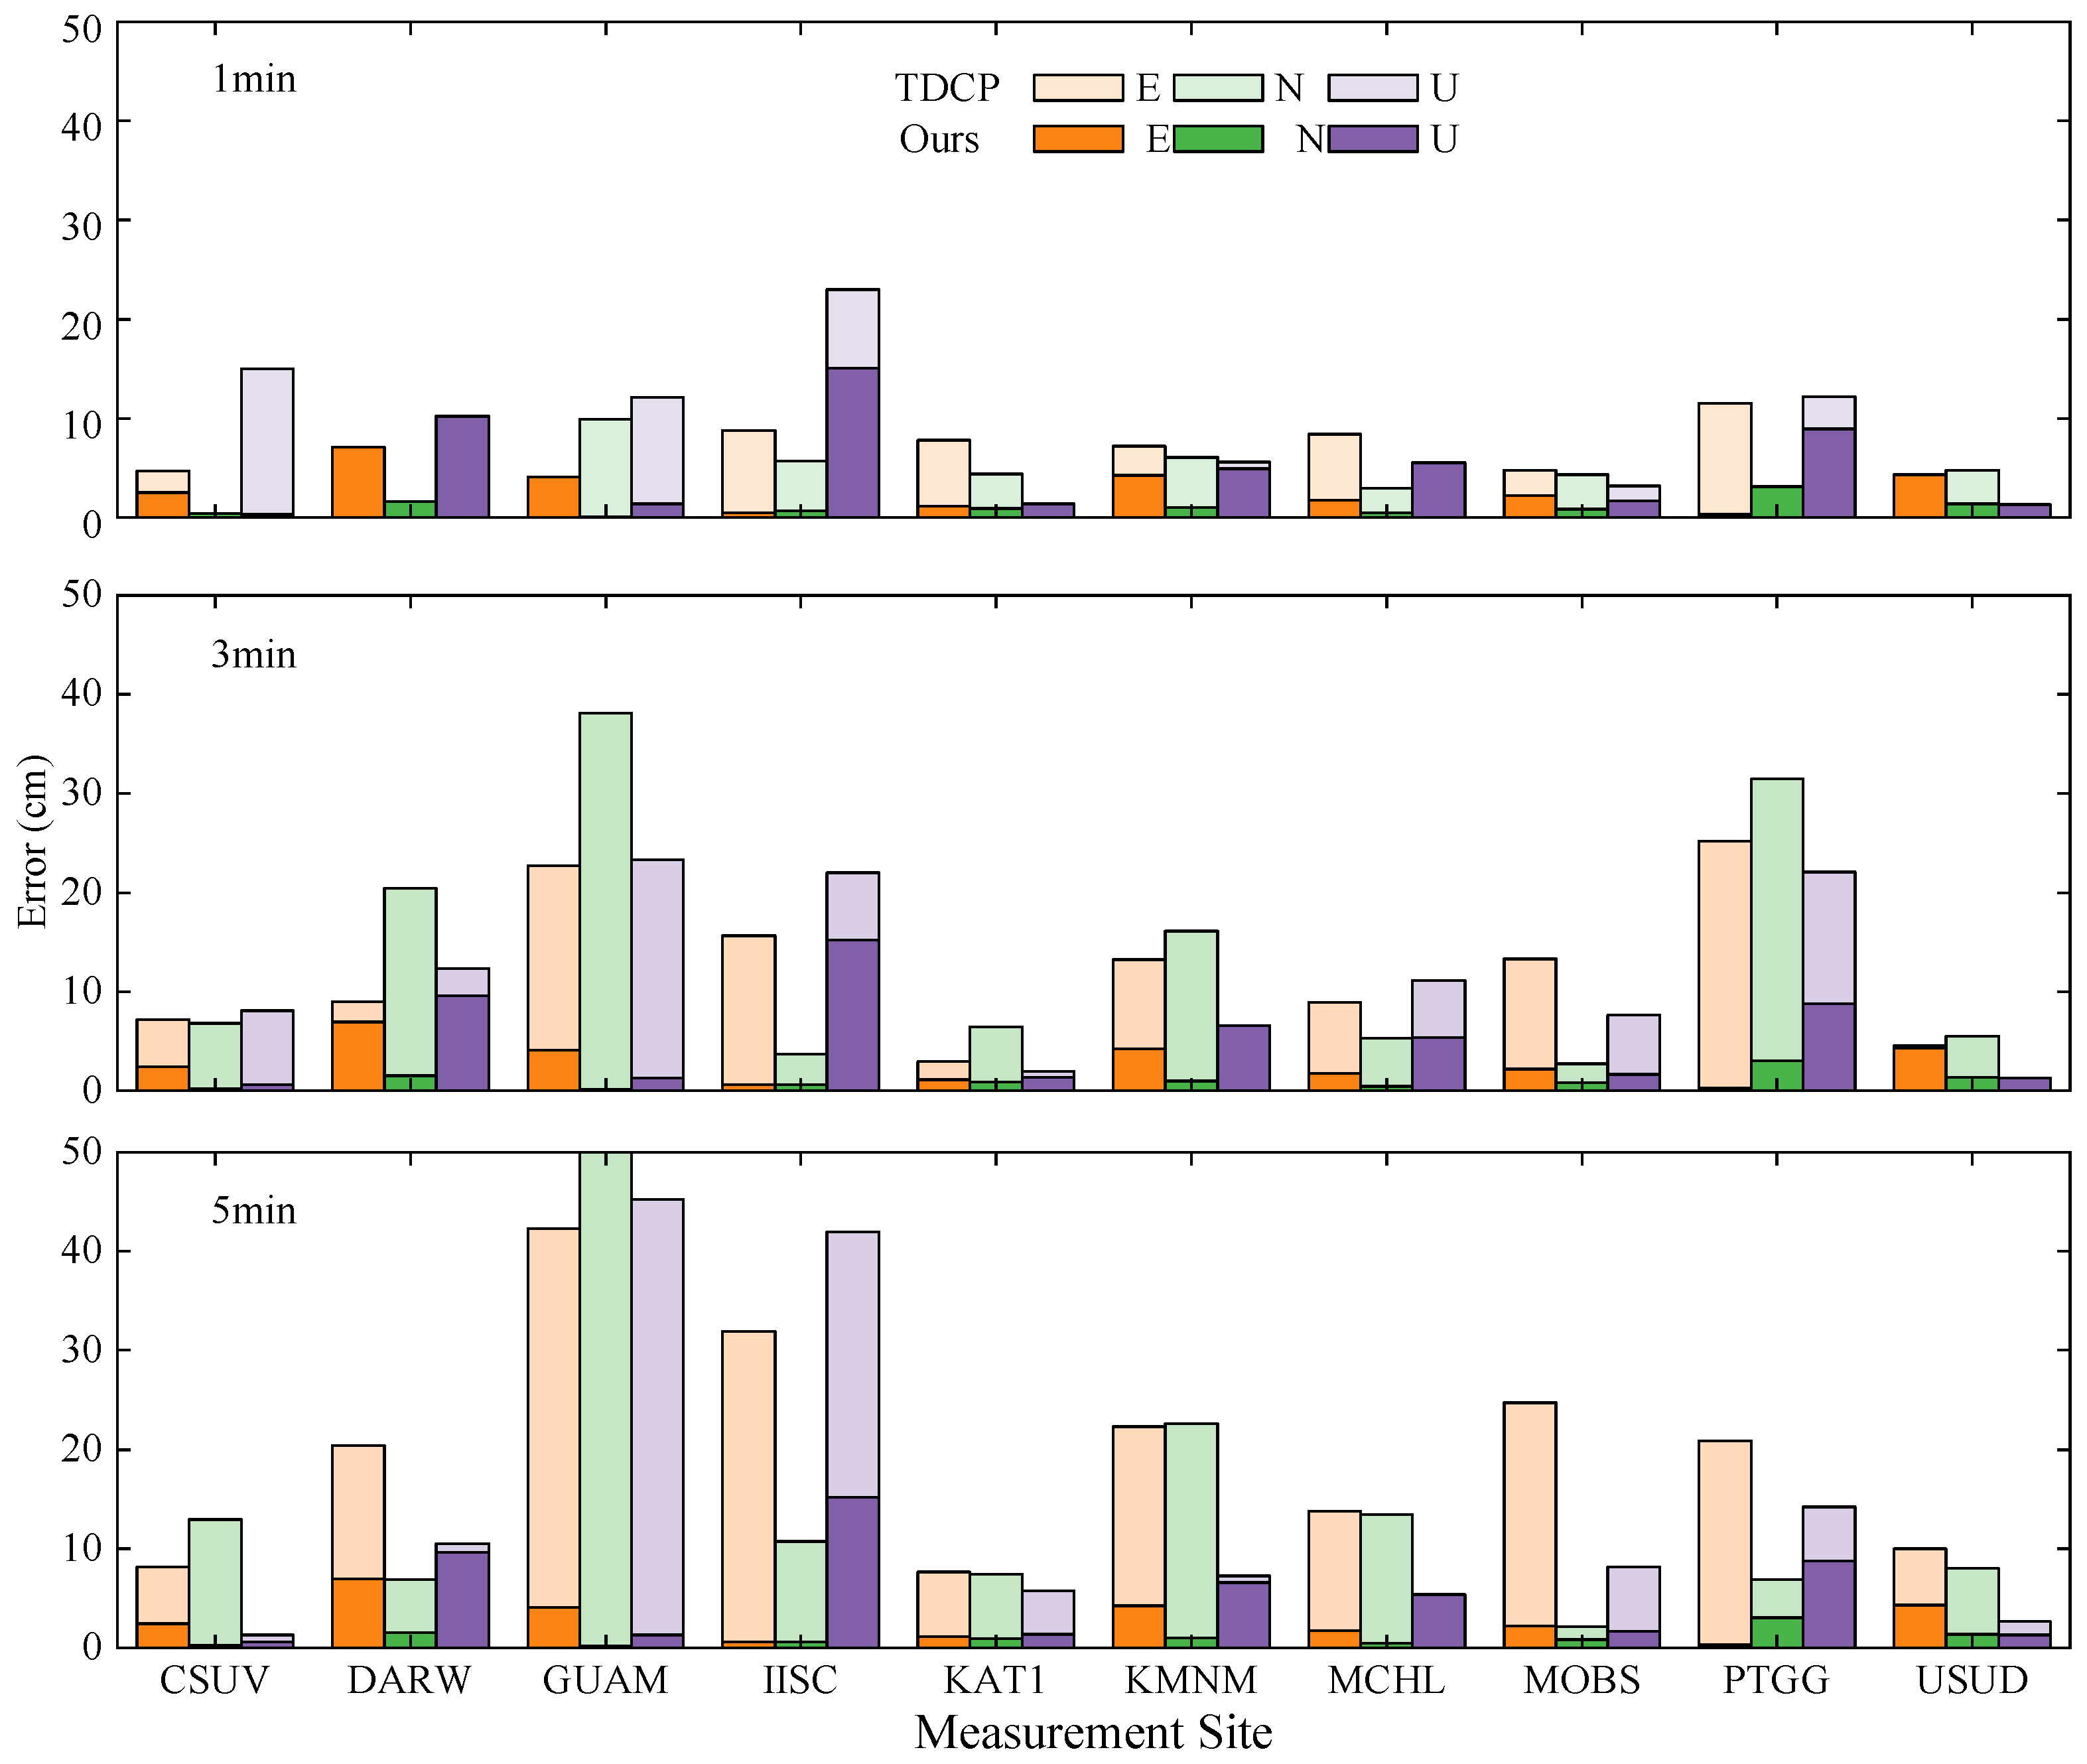
A multi-station analysis (Figure 9) under short outages of 1, 3, and 5 min confirmed the robustness of the proposed method. For the proposed method, the errors in the E, N, and U directions remained below 10 cm at 8 out of 10 stations. In contrast, the errors of the TDCP model exhibited linear growth with increasing interruption duration.
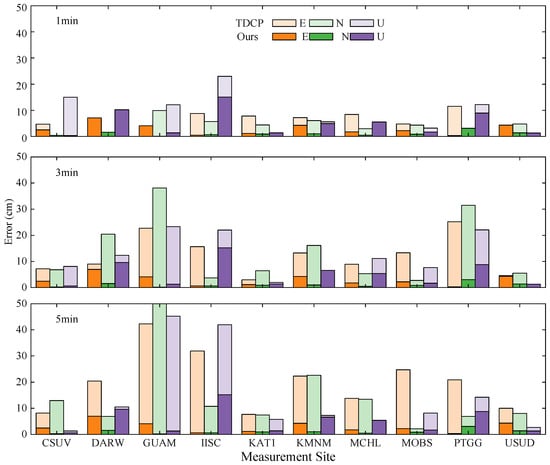
Figure 9.
Positioning error comparison of different stations.
Table 6 quantifies the average positioning errors under different outage durations. As the outage duration increased from 1 min to 2 h, the TDCP model errors exhibited exponential growth (e.g., E-direction error increased from 0.04 m to 1.54 m). In contrast, the errors of the proposed method increased only gradually (e.g., E-direction error rose from 0.02 m to 0.10 m).

Table 6.
Average positioning errors of TDCP and ours under different interruption durations.
3.2.2. Performance with Low-Cost Receiver
The positioning performance using the UM980 low-cost receiver during a 3 h outage is shown in Figure 10. The proposed method maintained decimeter-level positioning accuracy throughout the interruption period, with maximum errors across the entire period being 0.4 m (E), 0.4 m (N), and 0.6 m (U). The original iTransformer method followed a similar but less stable error trend, with full-period maximum errors of 0.7 m (E), 0.7 m (N), and 1.1 m (U). In contrast, the TDCP model exhibited rapidly diverging positioning errors after the interruption.
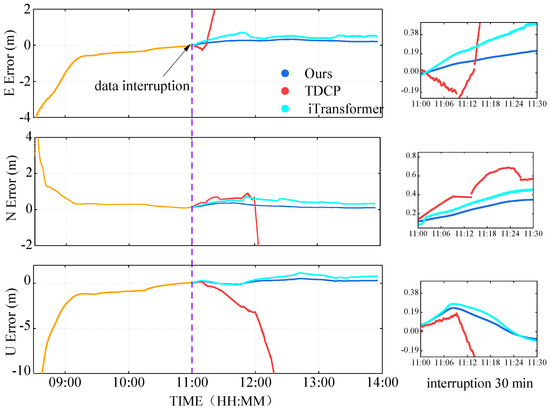
Figure 10.
Positioning error performance comparison of UM980 receiver during SSR outages (The orange line represents the positioning accuracy curve before the SSR outage).
4. Discussion
This study establishes a novel residual-enhanced iTransformer framework for predicting BDS SSR corrections and validates its efficacy in maintaining real-time PPP accuracy during data outages. The experimental results presented in the previous section prompt a detailed discussion on several key points.
4.1. High-Accuracy SSR Prediction
4.1.1. Performance in Orbit and Clock Prediction
The proposed residual-enhanced iTransformer model demonstrates remarkable advancements in SSR prediction accuracy across both orbit and clock corrections. For orbit predictions, the model maintains precision levels of 0.10 m (R), 0.20 m (A), and 0.20 m (C) within 2 h prediction windows, representing a significant improvement over traditional approaches. The R component consistently shows the highest accuracy, corresponding to its inherently smaller variation range in actual orbital dynamics.
The improved iTransformer demonstrates remarkable advantages over traditional methods including linear polynomial (LP), grey model (GM (1,1)), and ARMA models. While conventional approaches rely on manually designed features and fixed mathematical formulations that struggle to capture complex nonlinear dynamics, our model achieves a substantial 72–85% reduction in prediction errors for 30 min forecasts and maintains sub-0.4 ns accuracy even in 3 h scenarios. This performance breakthrough stems from the model’s ability to autonomously extract deep spatiotemporal features and effectively model long-range dependencies through its end-to-end learning mechanism. The results clearly demonstrate the superiority of the proposed architecture in handling the complex characteristics of satellite clock offsets, providing more accurate and stable predictions across various time horizons.
4.1.2. Cross-Satellite Compatibility and Generalization
The model exhibits distinct performance characteristics across different BDS satellite generations and orbital types. For BDS-3 satellites, the model shows optimal compatibility, achieving a 31.3% reduction in clock error for IGSO satellites while maintaining stable orbit corrections. This superior performance with newer-generation satellites suggests the model’s enhanced adaptability to modern satellite technologies with more stable behavioral patterns.
However, the limited effectiveness on BDS-2 GEO satellites reveals important insights into model limitations. The slight increase in clock error (from 0.6000 ns to 0.6292 ns) for these satellites indicates that the model’s performance is influenced by the unique orbital characteristics and potentially higher inherent uncertainties of GEO satellites. This observation underscores the importance of considering satellite-specific attributes in prediction model design.
4.1.3. Temporal Performance Characteristics
The temporal evolution of prediction accuracy reveals crucial patterns for practical applications. Short-term predictions (≤2 h) demonstrate exceptional stability with minimal error dispersion, making them particularly suitable for real-time PPP applications. The model’s ability to maintain <0.5 ns clock accuracy and <0.2 m orbit accuracy during this period directly supports continuous high-precision positioning during typical SSR interruption scenarios.
For medium- to long-term predictions (≥8 h), while error accumulation becomes evident, the model shows adaptive characteristics through the contracting error distribution in cross-track components during 12–24 h intervals. This phenomenon suggests the model’s capability to leverage orbital periodicities, particularly noticeable in the C direction where orbital repeat patterns are most pronounced.
4.1.4. Architectural Advantages and Limitations
The residual-enhanced iTransformer architecture addresses several critical challenges in SSR prediction. The integration of residual networks significantly improves the handling of clock noise and jumps, allowing the model to focus on differential features during anomalous periods. Meanwhile, the inverted transformer architecture enables effective modeling of cross-variable dependencies between orbital components and clock offsets, providing physically consistent predictions that are crucial for maintaining PPP solution stability.
However, the model shows limitations in predicting full magnitudes of sudden clock jumps, with maximum absolute errors reaching 2.5 ns during jump events. This limitation, combined with the observed performance variations across satellite types, suggests directions for future improvements, including the potential development of specialized processing branches for different satellite categories and enhanced anomaly detection mechanisms.
4.2. Positioning Experiment
The positioning experimental results validate the effectiveness of the SSR prediction model at the application level. In simulated SSR interruption experiments, the improved model maintained decimeter-level positioning accuracy at both MGEX stations and low-cost receivers, directly confirming the reliability of the SSR prediction accuracy discussed earlier.
Compared with the traditional TDCP method, our approach exhibits fundamentally different error characteristics. While the TDCP method can maintain positioning accuracy during short interruptions (1–5 min), its errors show exponential growth as the interruption duration extends, particularly exceeding 1.5 m in the horizontal direction during 2 h interruptions. This divergence stems from TDCP’s inherent relative positioning nature—while it eliminates errors through epoch differencing, it simultaneously loses the absolute position reference, leading to continuous error accumulation.
In contrast, the improved iTransformer model adopts a completely different technical approach. By providing continuous SSR correction predictions, it maintains the integrity of the PPP absolute positioning framework. This enables the method to keep horizontal errors within 10 cm and vertical errors below 17 cm during 30 min interruptions. This stable error growth pattern indicates that the method can provide reliable performance boundaries for real-time PPP applications.
Notably, the model demonstrates strong adaptability across different receiver types. At MGEX stations equipped with professional geodetic receivers, the improved model achieved approximately 50% enhancement in vertical accuracy compared with the original iTransformer over a 2 h period. When deployed with the low-cost UM980 receiver, although the absolute accuracy experienced some degradation, it still maintained decimeter-level positioning capability—a characteristic of significant importance for mass-market applications.
Vertical accuracy remains the most challenging aspect across all methods. Although the improved model achieved over 85% accuracy improvement in the vertical direction compared with TDCP, its errors remain 2–3 times those in the horizontal direction. This phenomenon aligns with the fundamental geometric characteristics of satellite navigation positioning, while also suggesting the need for special attention to vertical error suppression in future work.
Comprehensive positioning experimental results demonstrate that the deep learning-based SSR prediction method not only effectively handles short-term SSR interruptions but also shows significant advantages in long-term interruption scenarios, providing a viable technical solution for continuous high-precision positioning in critical application fields.
5. Conclusions
To address the degradation of PPP accuracy caused by interruptions in real-time BDS SSR data streams, this paper proposes a deep learning prediction method based on an improved iTransformer model.
First, continuous 20-day real-time BDS SSR data streams broadcast from the WHU mount point were collected, with the accuracy of a 10-day subset being analyzed to support subsequent data processing. Then, an enhanced iTransformer model incorporating residual networks was constructed according to SSR data characteristics. This model was employed to predict real-time orbit and clock corrections sequences for all BDS satellites. Analysis of prediction results across different orbital satellite types demonstrates that the model achieves stable orbit correction accuracies within R/A/C directions of 0.1 m/0.2 m/0.2 m for up to 2 h, with a clock offset correction accuracy below 0.5 ns.
Furthermore, the model exhibits remarkable generalization across different platforms, delivering reliable performance on both geodetic-grade MGEX stations and low-cost receivers, which underscores its potential for broad applicability in both professional and mass-market navigation services.
In summary, this study establishes a critical and effective linkage between deep learning-based time-series forecasting and the continuity of high-precision PPP services. The proposed framework provides a scalable and resilient solution for mitigating the impacts of SSR data stream discontinuities. Future work will focus on extending the model to multi-GNSS interoperability and exploring a lightweight dual-branch architecture to better decouple and handle the challenging issue of clock bias jumps.
Author Contributions
Conceptualization, M.G. and L.W.; methodology, M.G. and J.C.; software, M.G.; validation, M.G. and J.C.; formal analysis, M.G. and C.Y.; investigation, M.G. and J.C.; resources, J.C. and S.L.; data curation, S.L. and M.L.; writing—original draft preparation, M.G. and C.Y.; writing—review and editing, M.G., C.Y. and L.W.; visualization, M.L. and S.L.; supervision, L.W. and J.P.; project administration, L.W. and J.P.; funding acquisition, J.P. All authors have read and agreed to the published version of the manuscript.
Funding
This work was supported by the Qinchuangyuan “Scientist + Engineer” Team Construction Project of Shaanxi Province of China under Grant 2022KXJ-009.
Data Availability Statement
The raw data supporting the conclusions of this article will be made available by the authors on request.
Conflicts of Interest
The authors declare no conflicts of interest.
References
- Elsheikh, M.; Iqbal, U.; Noureldin, A.; Korenberg, M. The implementation of precise point positioning (PPP): A comprehensive review. Sensors 2023, 23, 8874. [Google Scholar] [CrossRef] [PubMed]
- Malys, S.; Jensen, P.A. Geodetic point positioning with GPS carrier beat phase data from the CASA UNO experiment. Geophys. Res. Lett. 1990, 17, 651–654. [Google Scholar] [CrossRef]
- Zumberge, J.F.; Heflin, M.B.; Jefferson, D.C.; Watkins, M.M.; Webb, F.H. Precise point positioning for the efficient and robust analysis of GPS data from large networks. J. Geophys. Res. Solid Earth 1997, 102, 5005–5017. [Google Scholar] [CrossRef]
- Hamza, V.; Stopar, B.; Sterle, O.; Pavlovčič-Prešeren, P. Recent advances and applications of low-cost GNSS receivers: A review. GPS Solut. 2025, 29, 56. [Google Scholar] [CrossRef]
- Jiao, G.; Song, S. High-rate one-hourly updated ultra-rapid multi-GNSS satellite clock offsets estimation and its application in real-time precise point positioning. Remote Sens. 2022, 14, 1257. [Google Scholar] [CrossRef]
- Yao, W.; Huang, H.; Ma, X.; Zhang, Q.; Yao, Y.; Lin, X.; Zhao, Q.; Huang, Y. Multi-global navigation satellite system (GNSS) real-time tropospheric delay retrieval based on state-space representation (SSR) products from different analysis centers. Adv. Space Res. 2024, 73, 4770–4785. [Google Scholar] [CrossRef]
- An, X.; Ziebold, R.; Lass, C. PPP-RTK with rapid convergence based on SSR corrections and its application in transportation. Remote Sens. 2023, 15, 4770. [Google Scholar] [CrossRef]
- Al-Shaery, A.; Lim, S.; Rizos, C. Investigation of different interpolation methods used in network-RTK for virtual reference station technique. J. Glob. Position. Syst. 2011, 10, 136–148. [Google Scholar] [CrossRef]
- Nie, Z.; Gao, Y.; Wang, Z.; Ji, S.; Yang, H. An approach to GPS clock prediction for real-time PPP during outages of RTS stream. GPS Solut. 2017, 22, 14. [Google Scholar] [CrossRef]
- Zhang, L.; Yang, H.; Yao, Y.; Gao, Y.; Xu, C. A new datum jump detection and mitigation method of real-time service (RTS) clock products. GPS Solut. 2019, 23, 67. [Google Scholar] [CrossRef]
- Ai, Q.; Xu, T.; Sun, D.; Ren, L. The prediction of BeiDou satellite clock bias based on periodic term and starting point deviation correction. Acta Geod. Cartogr. Sin. 2016, 45, 132–138. [Google Scholar]
- Huang, G.; Cui, B.; Zhang, Q.; Fu, W.; Li, P.; Lin, Y. Real-time clock offset prediction model with periodic and neural network corrections. J. Astronaut. 2018, 39, 83–88. [Google Scholar]
- Zhou, Y.; He, X.; Montillet, J.P.; Wang, S.; Hu, S.; Sun, X.; Huang, J.; Ma, X. An improved ICEEMDAN-MPA-GRU model for GNSS height time series prediction with weighted quality evaluation index. GPS Solut. 2025, 29, 113. [Google Scholar] [CrossRef]
- Hadas, T.; Bosy, J. IGS RTS precise orbits and clocks verification and quality degradation over time. GPS Solut. 2015, 19, 93–105. [Google Scholar] [CrossRef]
- El-Mowafy, A.; Deo, M.; Kubo, N. Maintaining real-time precise point positioning during outages of orbit and clock offsets. GPS Solut. 2017, 21, 937–947. [Google Scholar] [CrossRef]
- Yan, C.; Wang, Q.; Zhang, Y.; Ke, F.; Gao, W.; Yang, Y. Analysis of GNSS clock prediction performance with different interrupt intervals and application to real-time kinematic precise point positioning. Adv. Space Res. 2020, 65, 978–996. [Google Scholar] [CrossRef]
- Janicka, J.; Tomaszewski, D.; Rapinski, J.; Jagoda, M.; Rutkowska, M. The prediction of geocentric corrections during communication link outages in PPP. Sensors 2020, 20, 602. [Google Scholar] [CrossRef]
- Qafisheh, M.; Martín, A.; Capilla, R.M.; Anquela, A.B. SVR and ARIMA models as machine learning solutions for solving the latency problem in real-time clock offsets. GPS Solut. 2022, 26, 85. [Google Scholar] [CrossRef]
- Li, H.; Li, X.; Gong, X. Improved method for the GPS high-precision real-time satellite clock error service. GPS Solut. 2022, 26, 136. [Google Scholar] [CrossRef]
- Mu, X.; Wang, L.; Shu, B.; Tian, Y.; Li, X.; Lei, T.; Huang, G.; Zhang, Q. Performance analysis of Multi-GNSS real-time PPP-AR positioning considering SSR Delay. Remote Sens. 2024, 16, 1213. [Google Scholar] [CrossRef]
- Alkan, R.M.; Erol, S.; Mutlu, B. Real-time multi-GNSS precise point positioning using IGS-RTS products in antarctic region. Polar Sci. 2022, 32, 100844. [Google Scholar] [CrossRef]
- Geng, T.; Ma, Z.; Xie, X.; Tao, J.; Liu, T.; Zhao, Q.; Li, J. Multi-GNSS real-time precise point positioning using BDS-3 global short-message communication to broadcast corrections. GPS Solut. 2022, 26, 99. [Google Scholar] [CrossRef]
- Lv, D.; Liu, G.; Ou, J.; Wang, S.; Gao, M. Prediction of GPS satellite clock offset based on an improved particle swarm algorithm optimized BP neural network. Remote Sens. 2022, 14, 2407. [Google Scholar] [CrossRef]
- Yong, Y.; Si, X.; Hu, C.; Zhang, J. A review of recurrent neural networks: LSTM cells and network architectures. Neural Comput. 2019, 31, 1235–1270. [Google Scholar] [CrossRef] [PubMed]
- Xiang, G.; Zhou, Z.; Wang, G.; Wu, J. Particle swarm optimization LSTM neural network for navigation satellite clock bias forecasting. In Proceedings of the 2023 IEEE 6th International Conference on Pattern Recognition and Artificial Intelligence (PRAI), Haikou, China, 18–20 August 2023; pp. 1155–1159. [Google Scholar]
- Liu, Y.; Zhang, H.; Wu, H.; Wang, S.; Ma, L.; Long, M. iTransformer: Inverted transformers are effective for time series forecasting. In Proceedings of the Twelfth International Conference on Learning Representations (ICLR 2024), Vienna, Austria, 7–11 May 2024. [Google Scholar]
- Huang, Z.; Shi, X.; Zhang, C.; Wang, Q.; Cheung, K.C.; Qin, H.; Dai, J.; Li, H. FlowFormer: A Transformer architecture for optical flow. In Proceedings of the 17th European Conference, Tel Aviv, Israel, 23–27 October 2022; pp. 668–685. [Google Scholar]
- Zhou, H.; Zhang, S.; Peng, J.; Zhang, S.; Li, J.; Xiong, H.; Zhang, W. Informer: Beyond efficient Transformer for long sequence time-series forecasting. In Proceedings of the 35th AAAI Conference on Artificial Intelligence, Virtual Event, 2–9 February 2021; pp. 11106–11115. [Google Scholar]
- Xie, S.; Girshick, R.; Dollár, P.; Tu, Z.; He, K. Aggregated residual transformations for deep neural networks. In Proceedings of the 2017 IEEE Conference on Computer Vision and Pattern Recognition (CVPR), Honolulu, HI, USA, 21–26 July 2017; pp. 5987–5995. [Google Scholar]
- Takasu, T. RTKLIB: Open source program package for RTK-GPS. In Proceedings of the FOSS4G 2009, Tokyo, Japan, 20–23 October 2009. [Google Scholar]
Disclaimer/Publisher’s Note: The statements, opinions and data contained in all publications are solely those of the individual author(s) and contributor(s) and not of MDPI and/or the editor(s). MDPI and/or the editor(s) disclaim responsibility for any injury to people or property resulting from any ideas, methods, instructions or products referred to in the content. |
© 2025 by the authors. Licensee MDPI, Basel, Switzerland. This article is an open access article distributed under the terms and conditions of the Creative Commons Attribution (CC BY) license (https://creativecommons.org/licenses/by/4.0/).

