Article

Accurate Digital Reconstruction of High-Steep Rock Slope via Transformer-Based Multi-Sensor Data Fusion

1
School of Highway, Chang’an University, Xi’an 710064, China
2
International Research Institute of Disaster Science, Tohoku University, Sendai 980-8572, Japan
3
State Key Laboratory of Resources and Environmental Information System, Institute of Geographic Sciences and Natural Resources Research, Chinese Academy of Sciences, Beijing 100101, China
*
Author to whom correspondence should be addressed.
Remote Sens. 2025, 17(21), 3555; https://doi.org/10.3390/rs17213555
Submission received: 24 August 2025 / Revised: 9 October 2025 / Accepted: 25 October 2025 / Published: 28 October 2025

Highlights

What are the main findings?
  • Partial overlap, large outliers, and density heterogeneity in TLS–UAV data were revealed.
  • A Transformer-based fusion method was introduced for high-steep slope reconstruction.
What are the implications of the main findings?
  • Accurate digital modeling of complex mountainous terrains was enabled.
  • Reliable data support for disaster warning and risk mitigation was provided.

Abstract

Accurate and comprehensive characterization of high-steep slopes is crucial for real-time risk prediction, disaster assessment, and damage evolution monitoring. The study focused on a high-steep rocky slope along the Yanjiang Expressway in Sichuan Province, China. A novel digital reconstruction method was introduced, which integrates terrestrial laser scanning (TLS) and unmanned aerial vehicle (UAV) photogrammetry through a Transformer-based method combining GeoTransformer with the Maximal Cliques (MAC) algorithm. The results indicated that TLS excels in capturing fine-scale features, whereas UAV demonstrates superior performance in large-scale terrain reconstruction. However, multi-sensor data exhibit heterogeneity in terms of partial overlap, large outliers, and density differences. To address these challenges, the GeoTransformer-MAC framework extracts geometrically invariant features from cross-source point cloud (CSPC) to establish initial correspondences, followed by rigorous screening of high-quality locally consistent correspondences to optimize transformation parameters. This method achieves accurate digital reconstruction of the high-steep rock slope. Global and local error analyses verify the model’s superiority in both overall slope characterization and fine-scale feature representation. Compared with the TLS-only model and the conventional method, the Transformer-based method improves the slope model integrity by 85.58%, increases the data density by 9.71%, and improves the accuracy by nearly threefold. This study provides a novel approach for the digital modeling of complex terrains, which serves the refined identification and modeling of geohazards for high-steep slopes in complex mountainous regions.

1. Introduction

Throughout the lifecycle of transportation corridor projects in the complex mountainous region, the instability of high-steep rock slopes along the corridor frequently triggers hazards such as rockfalls and landslides [1,2,3]. As a typical disaster mode, sudden kinetic energy release from rock fractures not only damages linear engineering structures but also threatens the safety of entire transportation system [4,5,6]. Furthermore, high-steep rock slopes, characterized by complex topography, highly fractured rock masses, and severe spatial occlusion, pose substantial challenges for conventional monitoring and surveying techniques [7,8]. In response to these challenges, constructing high-precision, realistic 3D digital models of slopes is essential. Such models enhance the safety and reliability of mountainous transportation corridors while providing a foundation for scientific investigation, engineering optimization, and disaster monitoring.
In recent years, the application of remote sensing in geotechnical engineering and engineering geology provides a new way to realize comprehensive, accurate and efficient target model construction [9,10,11]. Remote sensing technologies such as terrestrial laser scanning, close-range photogrammetry, and UAV photogrammetry have been increasingly adopted for slope monitoring and topographic mapping due to their high precision, operational efficiency, and safety [12,13,14]. TLS, for instance, is widely recognized for generating high-resolution datasets that capture detailed slope morphology and provide reliable spatial information [15]. Its robustness to lighting variations and vegetation occlusion further improves its utility in practical scenarios. However, TLS has inherent drawbacks in rugged terrains, where line-of-sight restrictions often cause data gaps [16]. Furthermore, difficulties in positioning scanning stations on steep slopes constrain its practical deployment. Conversely, UAVs excel in maneuverability and coverage, enabling rapid topographic data collection in remote or inaccessible areas [17]. Integrating UAVs with real-time kinematic (RTK) positioning systems further enhances their suitability for continuous monitoring [18]. Nevertheless, the quality of UAV-collected data is highly sensitive to external factors, including meteorological conditions and vegetation interference. Its accuracy heavily depends on the placement and density of ground control points, which are labor-intensive and time-consuming to establish in challenging terrains [14]. While TLS and UAV-based methods each offer unique advantages for slope monitoring in mountainous and canyon environments, neither alone fully addresses the complexities of such terrains. Integrating these complementary remote sensing technologies can overcome individual limitations, improve data completeness and accuracy, and establish a robust foundation for digital modeling and hazard assessment of high-steep slopes.
Regarding the limitations of standalone techniques, researchers have increasingly focused on multi-sensor data fusion, emphasizing accuracy, coverage, and adaptability in complex environmental conditions. For example, ref. [19] combined UAV and TLS data to generate high-resolution digital terrain models under complicated geomorphological and surface-cover conditions. Similarly, ref. [13] reconstructed a high-precision 3D dam model using fused UAV-TLS point clouds. Point cloud clustering was employed to extract regional features and build models, successfully aligning high-precision TLS and UAV point clouds in the complex mountainous terrain [20]. These studies reveal the potential of integrated TLS and UAV to enhance data completeness and modeling accuracy in challenging terrain conditions. In particular, UAV photogrammetry, coupled with structure-from-motion (SfM) three-dimensional reconstruction, plays a crucial role in this integration by generating dense point clouds that complement TLS data [21]. These datasets are spatially aligned with TLS point cloud via cross-source registration, a process centered on estimating rigid transformation parameters for overlapping regions [22]. However, CSPC registration faces several challenges, such as a high proportion of outliers, significant differences in point cloud density, limited overlapping areas, large spatial rotations, and inconsistent scales [23]. Developing robust and efficient registration methods is essential for integrating CSPC data and building high-precision 3D models.
To address challenges of CSPC registration, researchers focus on exploring how to effectively complement data discrepancies and improve alignment accuracy and efficiency. The Iterative Closest Point (ICP) algorithm, together with its variants such as Generalized ICP and Point-to-Plane ICP, remain popular used due to their simplicity and scalability [24,25]. Such methods perform iterative optimization of rigid transformations to reduce the Euclidean distance between corresponding points. However, their performance is highly sensitive to initial alignment and frequently leading to local optima [26]. Additionally, repetitive or similar structures in large-scale scenes may induce mismatches [27]. These limitations are exacerbated in CSPC scenarios with significant density variations and sparse overlaps, rendering traditional methods inadequate for complex environments. Deep learning advancements offer viable alternatives for CSPC registration. Learning-based frameworks enhance registration efficiency and accuracy by learning feature extraction, correspondence inference, and global optimization [28,29,30]. For example, PointNetLK model integrates traditional registration algorithms with the neural network, converting point clouds into feature vectors and iteratively estimating rigid transformations, thereby reducing dependence on initial alignment [31]. Lu et al. [32] developed the Sparse-to-Dense Matching Network (SDMNet), which achieves both efficiency and accuracy in registering large-scale outdoor 3D scenes. Deep Closest Point approach enhances global feature correspondence awareness by incorporating self-attention mechanisms and dynamic graph convolutional networks, effectively mitigating the impact of point cloud density variations on registration accuracy [33]. Nevertheless, inherent disparities in sensor acquisition mechanisms and point cloud density distributions hinder endpoint matching precision and model generalization ability [34]. In contrast, the maximal cliques (MAC) algorithm based on geometric optimization achieves stable matching results in high-outlier rate and low-overlap scenarios without requiring training data [35,36]. The MAC method operates both as a standalone registration tool and as a hybrid module within deep learning pipelines, where it refines correspondence selection and transformation optimization [36]. Integrating geometric optimization with deep learning effectively reduces initialization sensitivity, enhances adaptability to heterogeneous data fusion, and provides methodological support for constructing high-precision 3D models.
Aiming at the complex terrain of high-steep slopes in the complex mountainous region and the challenges faced by traditional modeling technologies, this study proposes a novel digital modeling method integrating TLS-UAV fusion with GeoTransformer-MAC algorithms. The method extracts geometric feature points from CSPC using deep learning and improves the robustness and accuracy of feature extraction and registration. This study provides novel insights into the application of multi-sensors data in the complex mountainous region and offers critical technical support and practical references for high-precision slope modeling in transportation corridor engineering projects.

2. Study Sites

The study area is located in Liangshan Prefecture, Sichuan Province, China (Figure 1a). The terrain exhibits a general trend of higher elevation in the northwest and lower elevation in the southeast, characterized by a tectonic-denudation alpine landform. The intense downcutting by the Jinsha River system has formed a typical deep canyon (Figure 1b). Currently, a transportation corridor project is under construction in this area. The research focuses on a rock slope near the Xixi River Bridge, which serves as a critical geological unit of the transportation corridor. The studied slope has a height of approximately 400 m, with a predominant southeast orientation and a maximum gradient of 80° (Figure 1b). Geological investigation data indicate that the slope is primarily composed of Upper Ordovician dolomitic limestone, exhibiting slight surface weathering with a reddish hue and localized vegetation cover. Three dominant sets of joints are developed within the rock mass, intersecting to form unstable rock blocks that frequently undergo instability and collapse. Given the proximity of the slope to the transportation corridor, its potential instability could pose a serious threat to construction workers and infrastructure.
As depicted in Figure 1b, the rock slope is characterized by complex surrounding terrain, steep surfaces, and variable vegetation coverage. These conditions make traditional contact-based measurement methods difficult to implement, time-consuming, labor-intensive, and pose significant safety risks. Remote sensing technologies, such as TLS and UAVs, offer new approaches for acquiring topographic data. However, these methods also entail specific limitations and challenges when applied in practice. Specifically, TLS excels in high-precision data collection at close range but is susceptible to terrain occlusion, which can result in data gaps [16]. On the other hand, UAVs can rapidly capture large-scale data of complex terrains, yet the accuracy and data density are relatively lower, with limited capability to capture detailed features [14]. It is evident that a single technique cannot fully meet the multifaceted requirements of high-precision modeling for high-steep slopes, particularly in terms of data collection perspective, spatial resolution, and field of view.

3. Materials and Methods

To comprehensively acquire spatial information of high-steep slopes in the complex mountainous region, it is essential to integrate multi-source remote sensing technologies. TLS and UAVs operate under different data acquisition and processing mechanisms, resulting in TLS point clouds and UAV images belonging to cross-source point cloud. The registration of such heterogeneous datasets is considerably more complex than that of homogeneous data. Furthermore, the final accuracy of the model largely depends on the quality of CSPC registration. Traditional registration methods, constrained by their specific applicability conditions, often produce deviations when applied directly to cross-source data. Therefore, there is a critical need to develop a TLS-UAV fusion method that combines strong adaptability with high precision, thereby providing foundational data support for constructing digital models of high-steep slopes in the complex mountainous region.
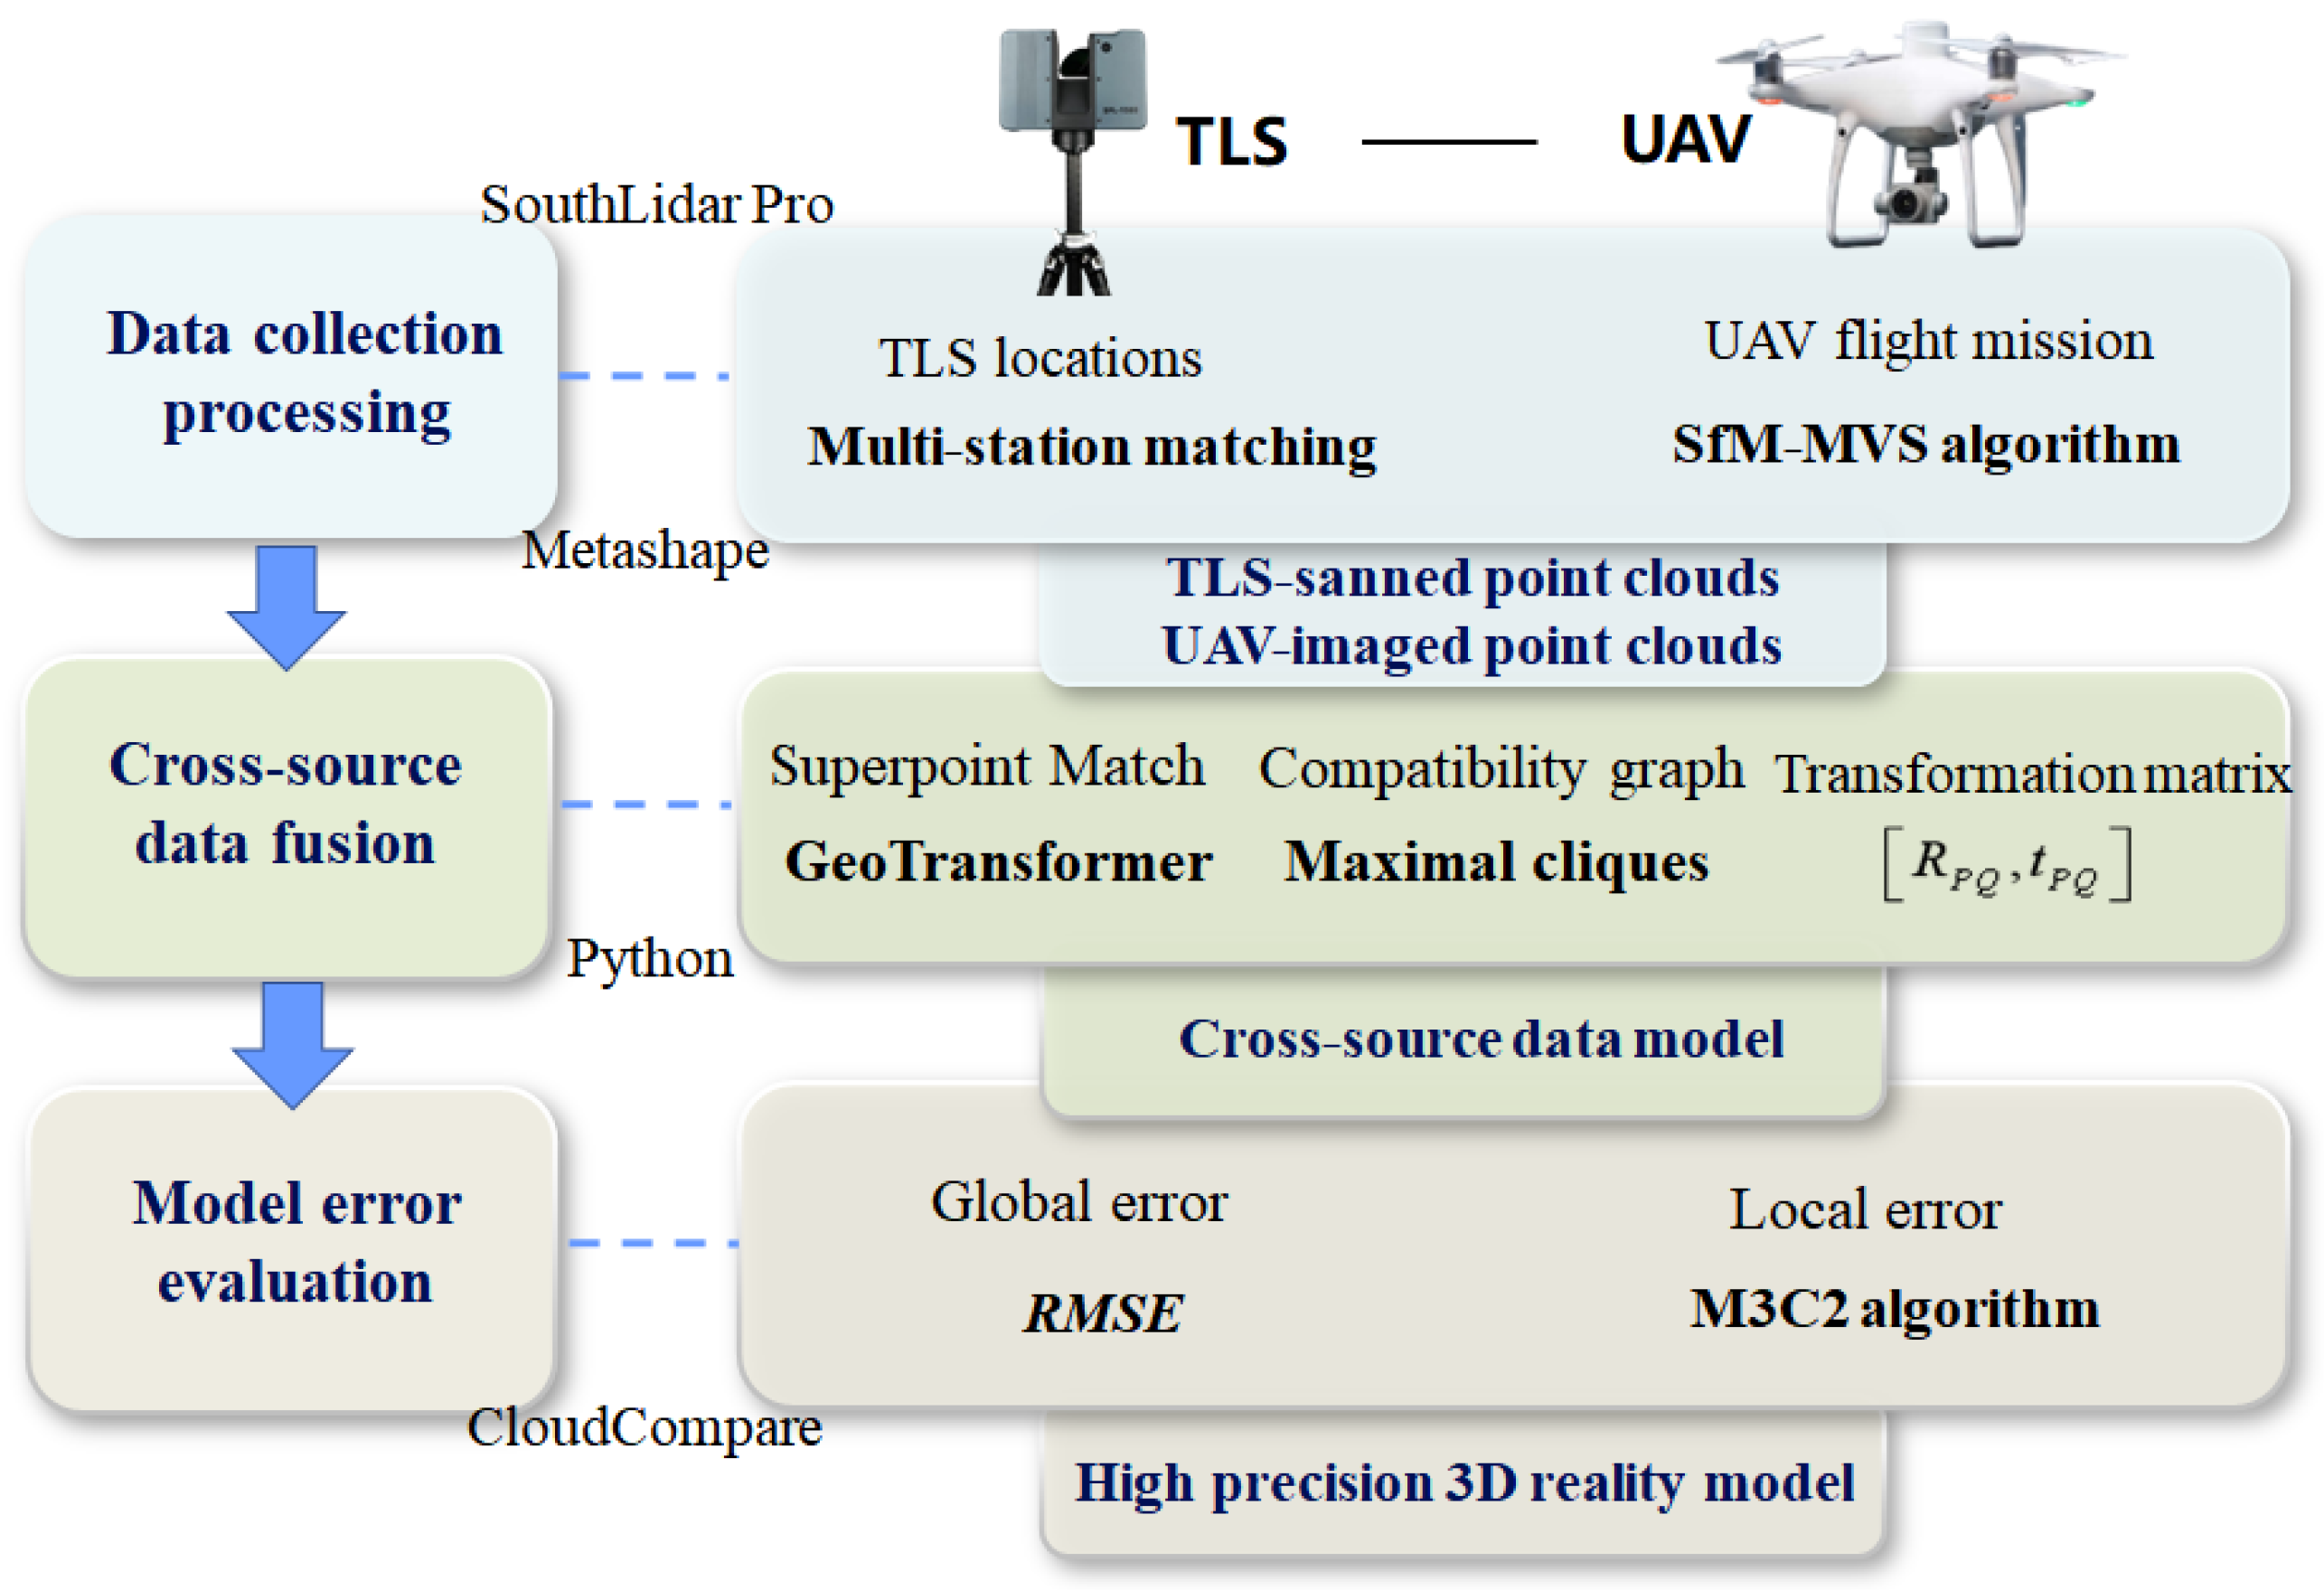
To overcome the challenges described above, this study introduces a high-precision digital modeling method for high-steep rock slopes using the multi-sensor data fusion and the optimization of Transformer-based method. The proposed methodology comprises three principal steps: data acquisition and processing, cross-source data fusion, and model error evaluation. The whole workflow is illustrated in Figure 2. (1) Field data collection for the high-steep slope is conducted using TLS and UAV. The TLS-scanned point cloud is generated through station-based measurement and stitching, while the UAV-imaged point cloud is derived using the Structure from Motion and Multi-View Stereo (SfM-MVS) algorithm applied to the image data. (2) The CSPC is precisely registered using the GeoTransformer-MAC algorithms, generating the slope’s digital model. (3) The accuracy of CSPC model is assessed based on global and local error evaluation methods, i.e., parametric testing and multi-scale model-to-model cloud comparison (M3C2) method [37]. The computational processing was performed on a workstation configured with 192 GB of RAM and an Intel Core i9-14900K @ 3.20 GHz CPU. Point cloud data were processed using CloudCompare V2.12 [38] and Python 3.8 environment [39], with the deep learning module implemented in PyTorch V2.1.

3.1. Data Collection and Processing

3.1.1. Terrestrial Laser Scanning

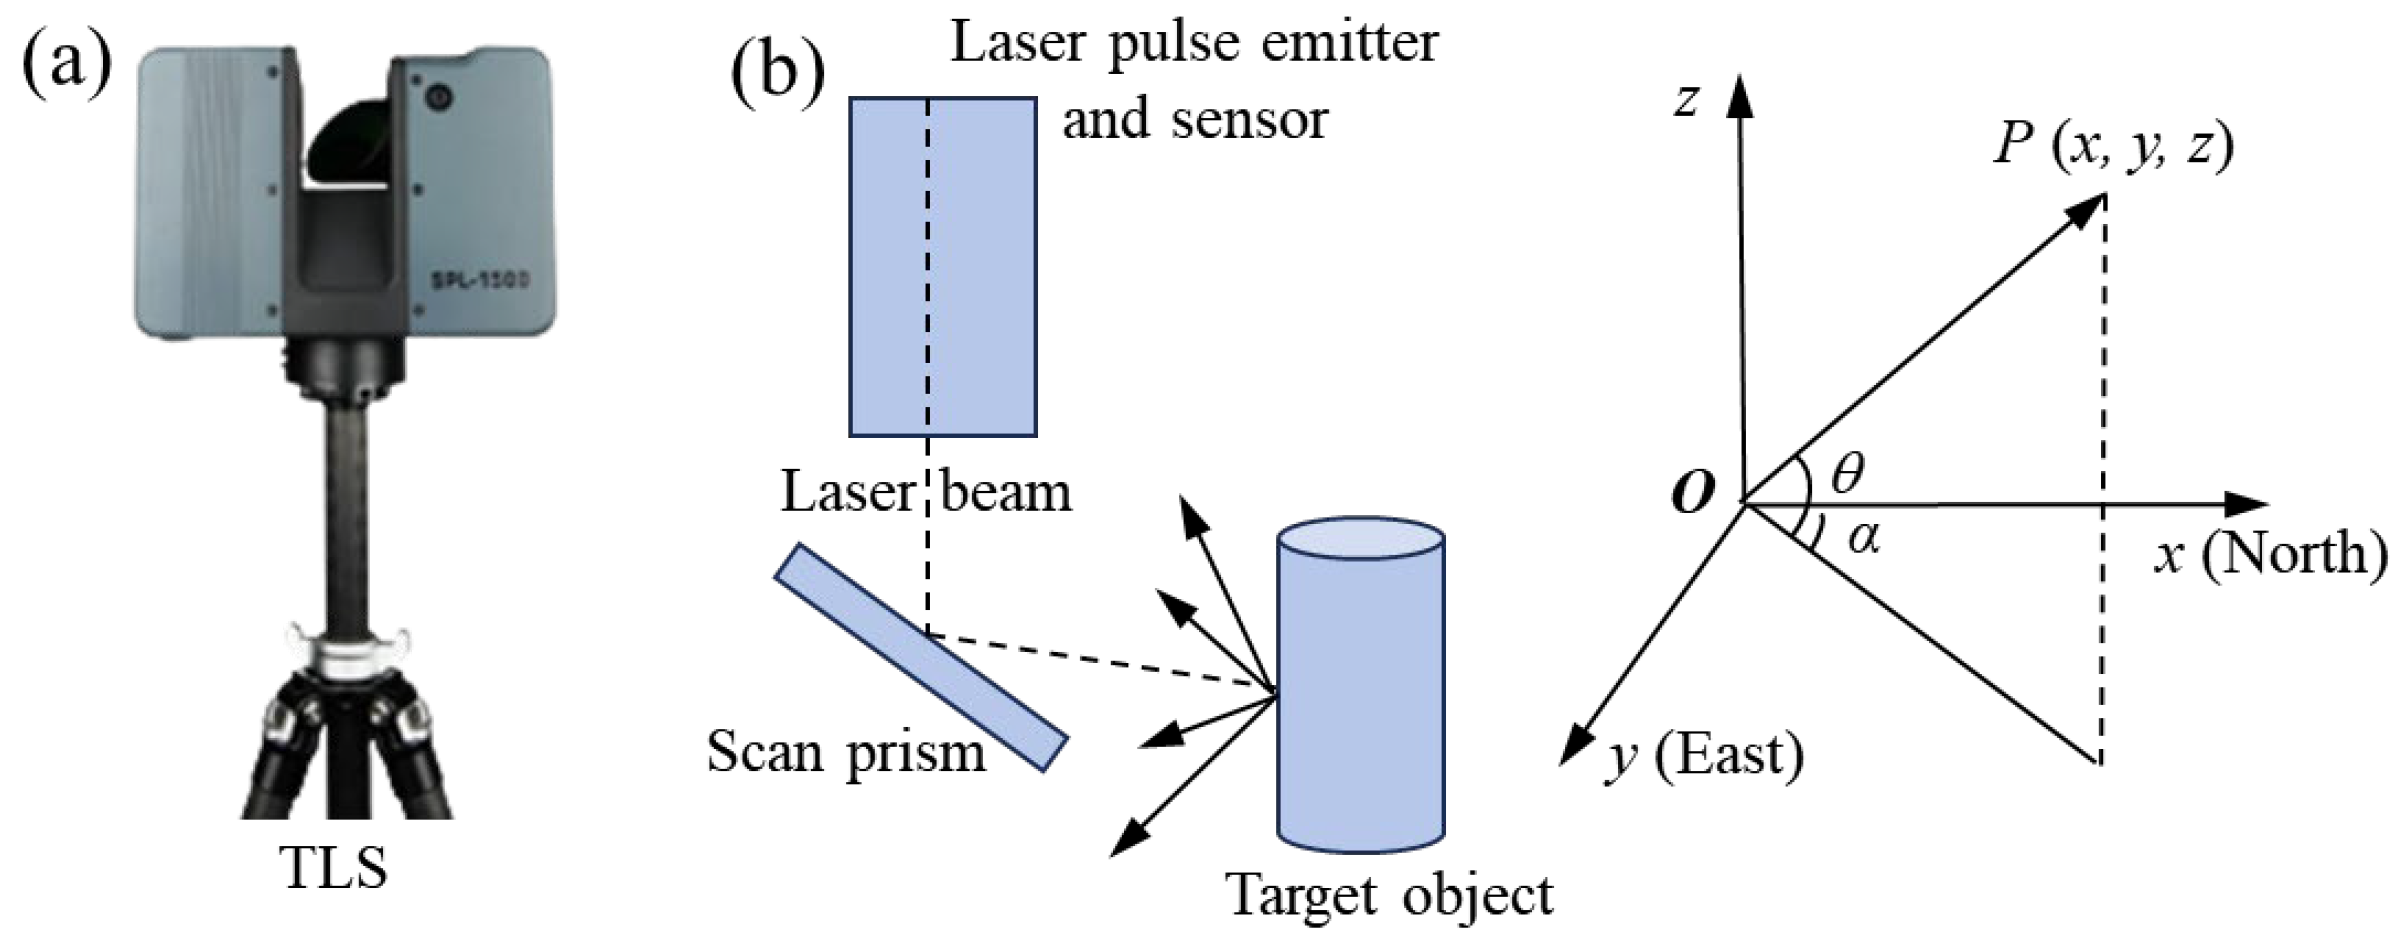
The SOUTH SPL-1500 pulsed TLS is employed in this study (Figure 3a), which is based on the time of flight ranging principle. The TLS is capable of rapidly acquiring high-density spatial coordinate points on target surfaces, generating high-resolution point clouds with an accuracy of 3 mm @ 100 m. The working principle of the TLS is as illustrated in Figure 3b. The laser pulse emitter transmits beam pulse signals at specific angles (horizontal angle α and elevation angle θ). These signals are reflected by a target surface point P (x, y, z) and captured by the receiver. By measuring the round-trip time t of the pulse at the speed of light C, the three-dimensional coordinates can be calculated using Equation (1). Table 1 presents the key technical parameters of the SOUTH SPL-1500 TLS system. This system features a maximum measurement range of 1500 m. A built-in 20-megapixel panoramic camera that automatically captures true-color images after each station scan, enabling RGB coloring of the point cloud. This TLS can effectively characterize the spatial distribution features and local structural details of high-steep slopes, thereby facilitating the construction of a corresponding digital surface model.
S = C × t 2 x = S cos θ cos α y = S cos θ sin α z = S sin θ
where S represents the distance from the target object’s surface to the laser scanner, x, y, and z denote the coordinates of the point cloud, and θ and α are the horizontal and vertical angles, respectively.

3.1.2. Unmanned Aerial Vehicle Photogrammetry

UAVs photogrammetry is a technique based on the principle of aerial photogrammetry, which generates 3D models of targets by processing and analyzing high-precision images captured by integrated cameras mounted on UAVs. UAV photogrammetry data were collected using a DJI Phantom 4 RTK in this study (Figure 4a). The UAV system was equipped with a high-precision Global Navigation Satellite System (GNSS) and a RTK module, providing real-time positional data with an accuracy reaching the sub-centimeter level. The technical parameters of the DJI Phantom 4 RTK are listed in Table 2. In order to represent the intricate geometry of the slope and achieve comprehensive spatial coverage, the UAV was operated manually to conduct multi-angle photography, which maintains a certain overlap rate in both horizontal and vertical directions. Additionally, for areas with steep and complex terrain or areas requiring focused attention, supplementary flights were conducted to enhance data collection. Each high-resolution photograph was synchronized with corresponding position and orientation data, facilitating subsequent data processing.
Based on 3D reconstruction techniques from photogrammetry and computer vision, the SfM algorithm can transform overlapping multi-view UAV images into 3D models [40]. Currently, various SfM-based software, such as Agisoft Metashape V2.0.2, Pix4D V4.4.12, and ContextCapture V10.2, have been developed for generating point cloud data. The generating dense matching point clouds generally follows these steps, as shown in Figure 4b. (1) adding photos to the software and importing relevant shooting information; (2) identifying and matching key image features using the Scale-Invariant Feature Transform (SIFT) algorithm; (3) generating a sparse point cloud via the SfM algorithm, which is subsequently created a denser point cloud with metric values using the MVS algorithm; (4) exporting point cloud data in standard formats (e.g., ASC or LAS) for further processing. Additionally, the dense point cloud can be transformed into a textured mesh, and digital surface models and digital elevation models can be extracted from orthophoto maps.

3.2. Multi-Sensor Data Fusion Method

3.2.1. Problems and Objectives of Multi-Sensor Data Registration

Point cloud derived from UAV images serves as a critical foundation for spatial registration between TLS and UAV. However, TLS-scanned point cloud and UAV-imaged point cloud constitute cross-source heterogeneous datasets, and their registration process may encounter issues such as outlier interference, density disparities, and low overlap in certain regions. These challenges can lead to incorrect point correspondences, significantly increasing the complexity of searching for the global optimal solution [23]. These limitations not only increase computational complexity but may also compromise transformation accuracy, propagating errors into subsequent modeling stages. For example, interference of local geometric features by noisy points can trigger feature extraction bias [41].
The TLS-scanned point cloud serves as the geospatial reference dataset, providing support for the positional calibration for the UAV-imaged point cloud. Specifically, the TLS-scanned point cloud is treated as the target, whereas the UAV-imaged point cloud acts as the source. The CSPC registration process spatially aligns these datasets by solving for the optimal rigid transformation parameters (R and t), which minimizes discrepancies in their overlapping regions [23]. Let P = p i R 3 i = 1 N and Q = q j R 3 j = 1 M denote the overlapping region point cloud datasets obtained from TLS and UAV techniques, respectively, where pi and qj represent corresponding points. The registration objective is formalized as Equation (2).
A r g   min R , t       P ( R Q + t )   2

3.2.2. Transformer-Based Method of CSPC Registration

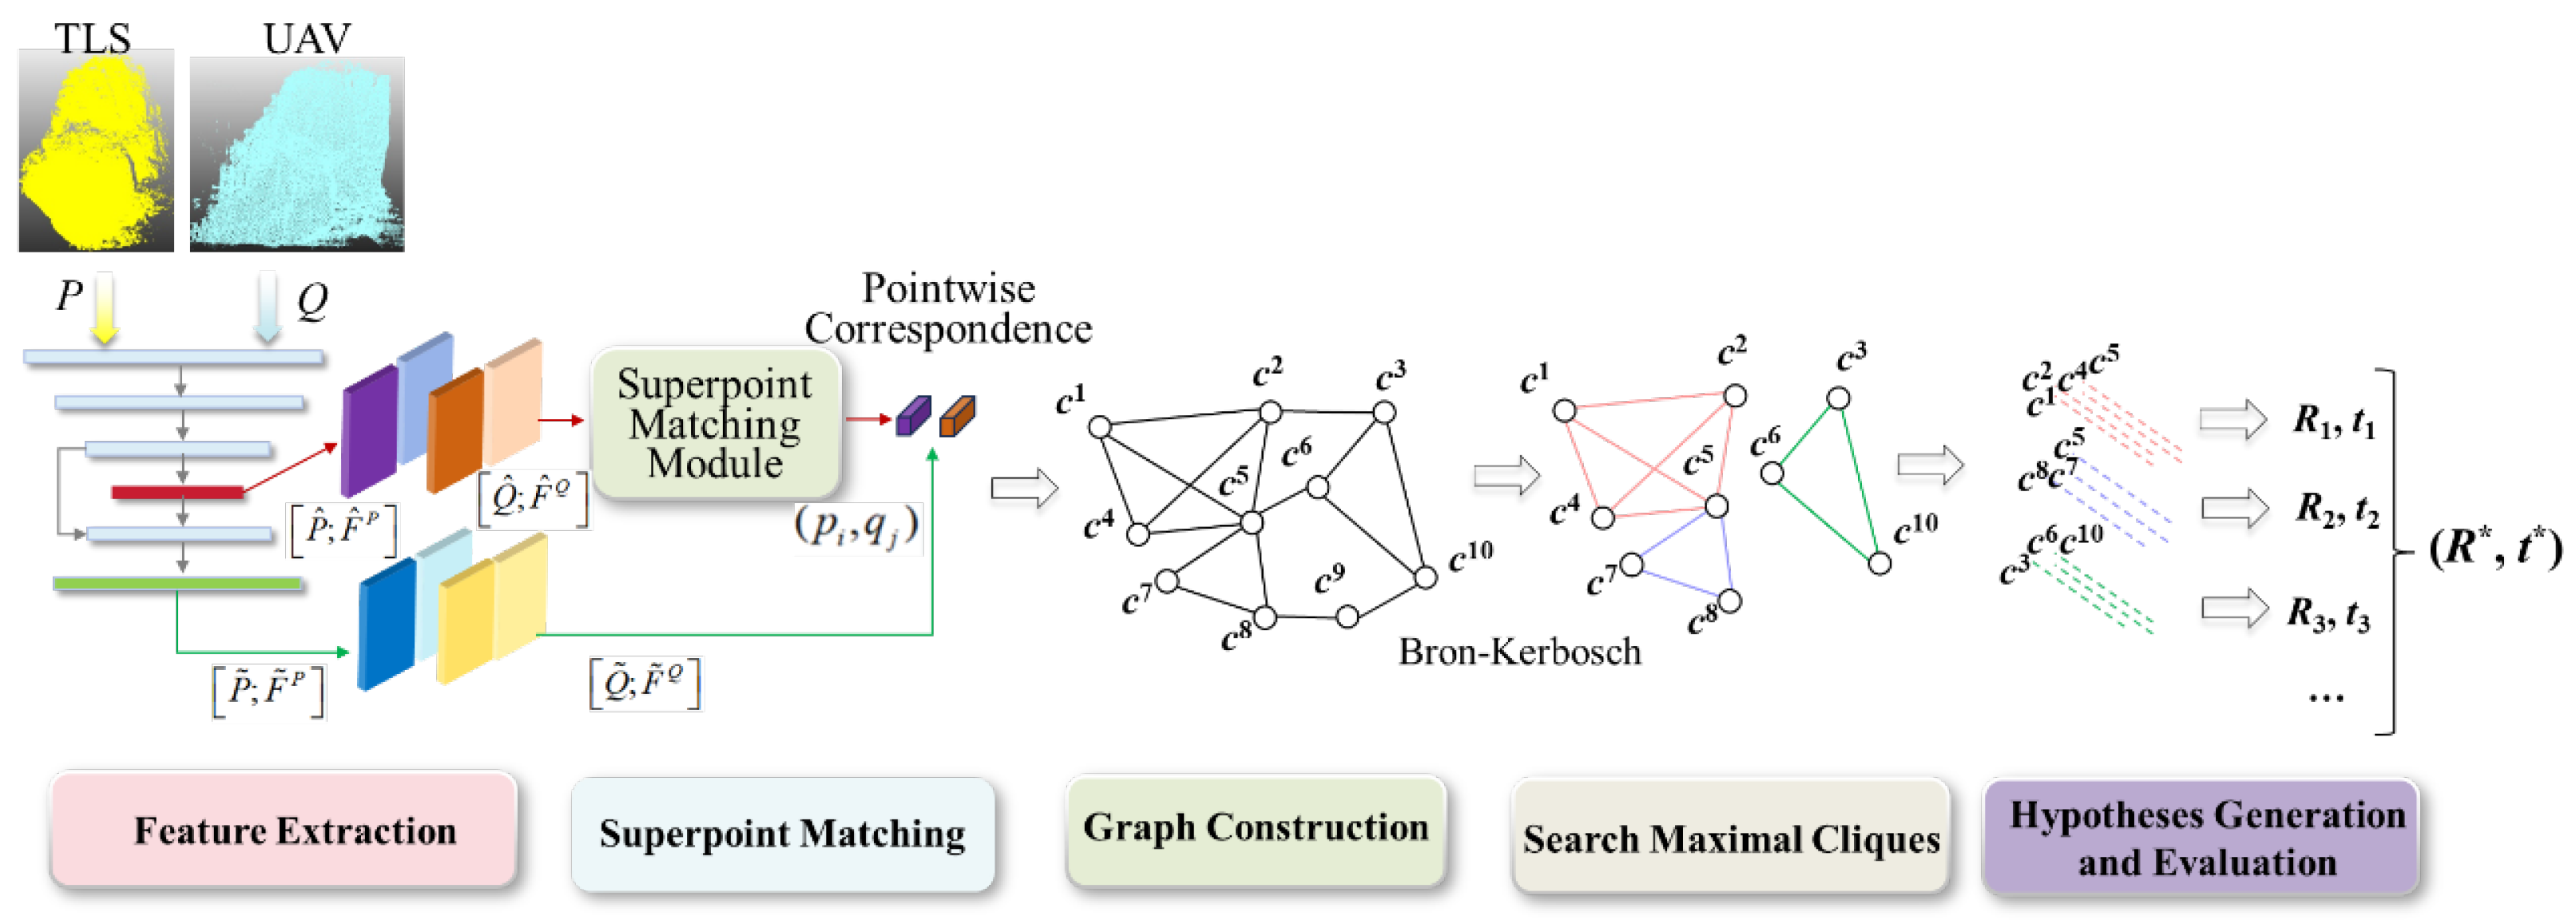
A Transformer-based method of CSPC registration is introduced in this study, which mainly consists of GeoTransformer and MAC algorithms [36,42]. It aims to realize accurate registration of TLS-scanned point cloud with UAV-imaged point cloud. GeoTransformer is a keypoint-free method, which is used to establish a CSPC association through superpoint matching. And MAC algorithm improves the registration accuracy by constructing a compatibility graph and searching for maximal cliques to filter a stable set of interior points. The network architecture of the Transformer-based method is illustrated in Figure 5.
To reduce computational complexity, multi-level features from TLS-scanned point cloud P and UAV-imaged point cloud Q are hierarchically extracted using a KPConv-FPN algorithm. Superpoint sets P ^ = p 1 , p 2 , ... , p n and Q ^ = q 1 , q 2 , ... , q m are obtained through downsampling, where each superpoint represents the characteristics of a local region. The corresponding learned features are denoted as F ^ p R | p ^ | × d and F ^ Q R | Q ^ | × d . The first-level downsampled points are expressed as P ˜ and Q ˜ , with their associated feature embeddings F ˜ P and F ˜ Q . The geometric self-attention module and the cross-attention module within GeoTransformer are utilized to extract features from P ^ and Q ^ , respectively.
The geometric self-attention module is employed to learn intrinsic features and global geometric correlations within P ^ and Q ^ . This process generates feature descriptors that exhibit geometric invariance. The input and output feature matrices are denoted as X R | P ^ | × d t and Z R | P ^ | × d t (Equation (3)), respectively, while the weight coefficients a i , j are computed based on the attention scores e i , j as follows.
Z i = j = 1 | P ^ | a i , j ( x j W V ) e i . j = ( x i W Q ) ( x j W K + r i , j W R ) T d t
where r i , j represents the geometric structure embedding, while WV, WQ, WK, and WR R d t × d t correspond to the projection matrices for the value, query, key, and geometric structure embedding, respectively.
Furthermore, the feature-based cross-attention module is implemented to learn the relationships between TLS and UAV point clouds, enhancing their consistency through interactive feature fusion. Given self-attention matrices XP and XQ for P ^ and Q ^ , the cross-attention matrix ZP for P ^ is derived through features of Q ^ , as defined in Equation (4).
Z i P = j = 1 | Q ^ | a i , j ( x j Q W V )
where ai,j represents the cross-attention weight, which quantifies the feature correlation between the TLS and UAV point clouds.
The Gaussian correlation matrix S for superpoint matching is computed and subjected to bidirectional normalization (Equation (5)). A Top-k selection strategy is subsequently adopted to extract high-confidence initial superpoint matching pairs (Equation (6)).
s ¯ i , j = s i , j k = 1 | Q ^ | s i , k s i , j k = 1 | P ^ | s k , j
C ^ = ( p i , q j ) | ( i , j ) top - k ( s ¯ )
The initial correspondence set is modeled as a compatibility graph G = ( V , E ) , where the nodes represent matching pairs c s = ( p i s , q j s ) . Edges est encode the geometric compatibility between two matching pairs c s and c t , quantified through a first-order geometric (FOG) metric derived from rigid-distance constraints. The compatibility score S c m p ( c s , c t ) for edge creation is computed as Equation (7).
S c m p ( c s , c t ) = e x p (   p i s p i t     q j s q j t   ) 2 2 d c m p 2
where dcmp represents the distance parameter. If the compatibility score exceeds the threshold tcmp, an edge est is established to connect the corresponding nodes and assigned a corresponding weight; otherwise, the weight is set to 0. This process results in the symmetric weighted matrix WFOG.
The weight matrix of the second-order compatibility graph WSOG is derived from WFOG (Equation (8)). Specifically, this is achieved through the element-wise multiplication of matrix components, further enhancing the global compatibility of adjacent nodes. Compared to FOG, SOG exhibits greater sparsity and geometric consistency, ensuring that the retained matching point pairs are more reliable.
W S O G = W F O G ( W F O G × W F O G )
where represents the element-wise matrix multiplication.
To mine the local consistency sets within the compatibility graph, a modified Bron-Kerbosch algorithm was employed to search for maximal cliques, i.e., subgraphs where all points are mutually connected. The lower bound for clique size is set to 3 in the process of searching. A multi-stage filtering strategy, including node-guided clique selection, normal vector consistency constraints, and clique sorting, is then applied to optimize the candidate set [36], with the goal of retaining locally optimal cliques while reducing redundant computations.
Each filtered maximal clique represents a locally consistent matching set, and transformation parameters are computed via weighted singular value decomposition (SVD). The principal eigenvalues of the WSOG are used to assign weights to the matching pairs, enhancing the contribution of pairs with strong geometric consistency. Since multiple maximal cliques may exist, mean squared error (MSE) is used as the filtering criterion to select the transformation parameters with the highest inlier support as the final registration result (Equation (9)).
( R , t ) = a r g   max R , t i = 1 N s ( c s )
where c s C i n i t i a l , N indicates the number of initial matching pairs, s ( c s ) is the scoring function for matching pairs.

3.3. Accuracy Analysis Method for Multi-Sensor Data Model

The global and local error analyses were used in this study, which rigorously evaluated the accuracy of the CSPC registration method. Global accuracy is assessed through the root mean square error (RMSE), which measures the Euclidean deviation between the registered TLS and UAV point clouds [43]. The RMSE is calculated as shown in Equation (10).
R M S E = i = 1 n d i 2 n d i = ( x p x q ) 2 + ( y p y q ) 2 + ( z p z q ) 2
where n denotes the total number of corresponding point pairs after registration; di represents the Euclidean distance between the i-th nearest neighbor pair pi from the target point cloud P and qi from the registered source point cloud Q.
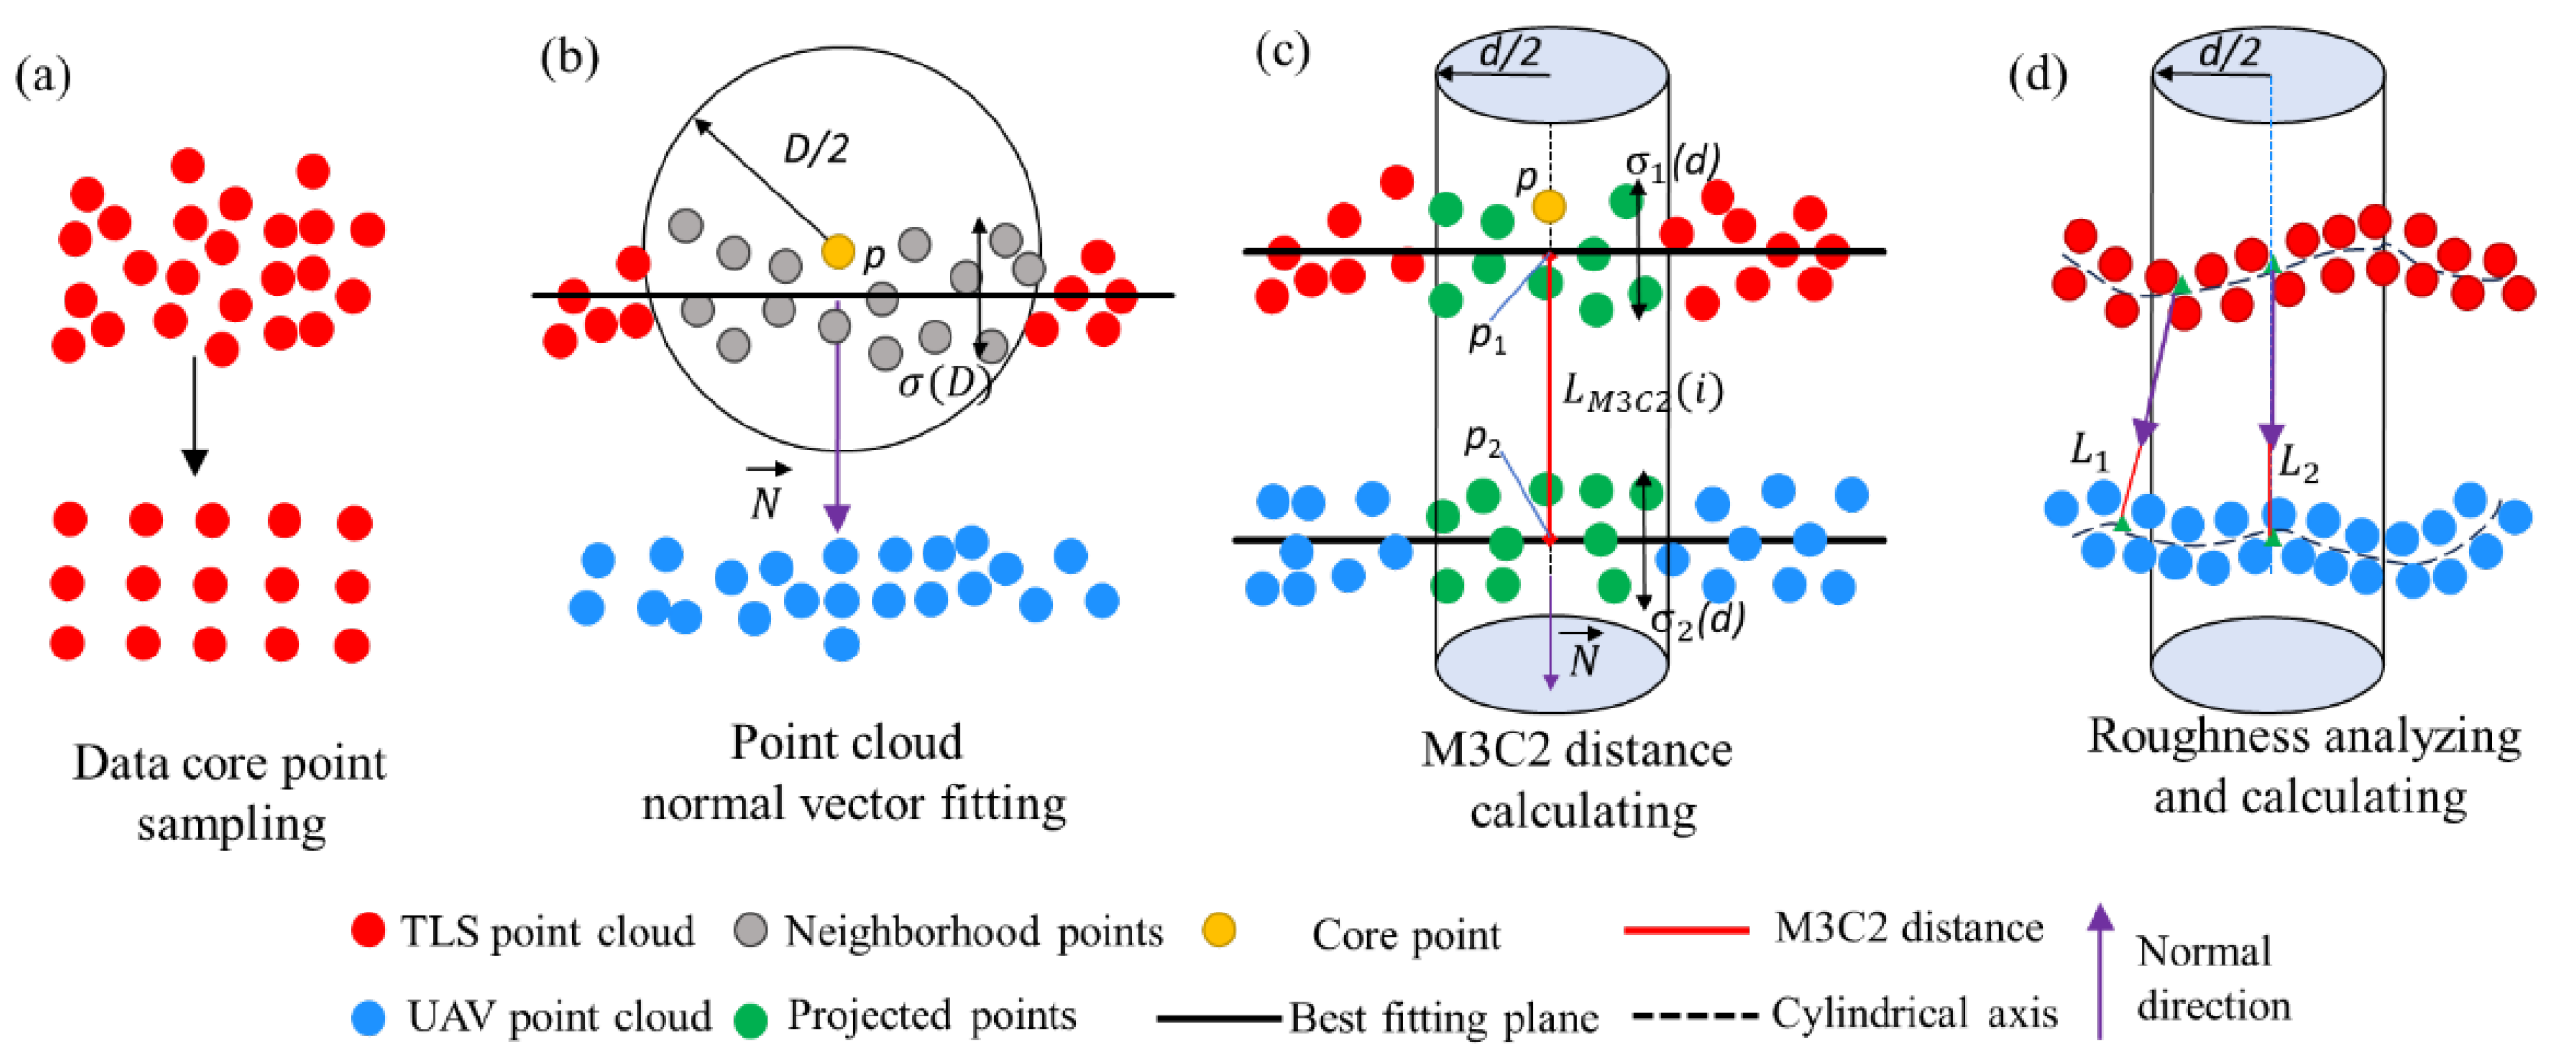
The M3C2 algorithm was further employed to analyze local geometric errors in the registered point clouds. This method quantifies spatial discrepancies between 3D datasets by computing point-to-cloud distances within locally oriented cylindrical neighborhoods [37]. The algorithm comprises four fundamental steps, with the corresponding workflow illustrated in Figure 6a–d.
(1)
Data core point sampling: A uniformly distributed and low-density core point set, which is a subset of the original point cloud data, is obtained through downsampling, as illustrated in Figure 6a. This process effectively reduces the complexity of data processing and enhances the computational efficiency of subsequent operations.
(2)
Point cloud normal vector fitting: For each core point p in Figure 6a, a neighborhood dataset is constructed from the original point cloud within a specified radius D/2. As shown in Figure 6b, a local normal vector N is derived by fitting a plane to the neighborhood data using the least squares method. The direction of N determines the reference for distance calculation. Additionally, the standard deviation of the neighborhood points from the fitted plane is defined as the roughness σ(D) (Equation (11)), which characterizes the local surface properties.
σ ( D ) = i = 1 N ( a i a ¯ ) 2 N
where ai denotes the distance from the i-th point to the fitted plane within a radius of D/2; a ¯ represents the average distance from all points to the fitted plane within the same radius D/2; N is the total number of points located within the radius D/2.
(3)
M3C2 distance Calculating: Along the direction of the normal vector N of the core point p, a cylinder with a radius of d/2 is constructed centered at p. This cylinder intersects the CSPC, forming two sets of intersection points, n1 and n2 (represented by green points in Figure 6c). The points in each intersection set are projected onto the cylinder axis, and the mean positions of the projected points, p1 and p2, are calculated. The Euclidean distance LM3C2 between p1 and p2 represents the variation distance of the CSPC at the core point p. By iterating through all core points, the distribution of point cloud variation distances across the entire target region can be obtained, which is then used to evaluate registration errors.
(4)
Roughness analyzing and calculating: To mitigate the influence of random errors, a confidence interval is established to determine the Least Significant Change Distance (LoD). Assuming that the errors follow an independent Gaussian distribution, the following formula can be applied for testing when the number of intersection points n1 and n2 is greater than or equal to 30 (Equation (12)):
L o D 95 % ( d ) = ± 1.96 ( σ 1 ( d ) 2 n 1 + σ 2 ( d ) 2 n 2 + r e g )
where LOD (d) represents the least significant change distance under the projection radius d/2; σ1 and σ2 denote the roughness of the TLS and UAV point clouds, respectively, under the projection radius d/2; n1 and n2 are the numbers of core points in the respective point clouds; reg represents the error of point cloud registration.

4. Results and Analysis

4.1. Analysis on TLS-UAV Heterogeneous Data

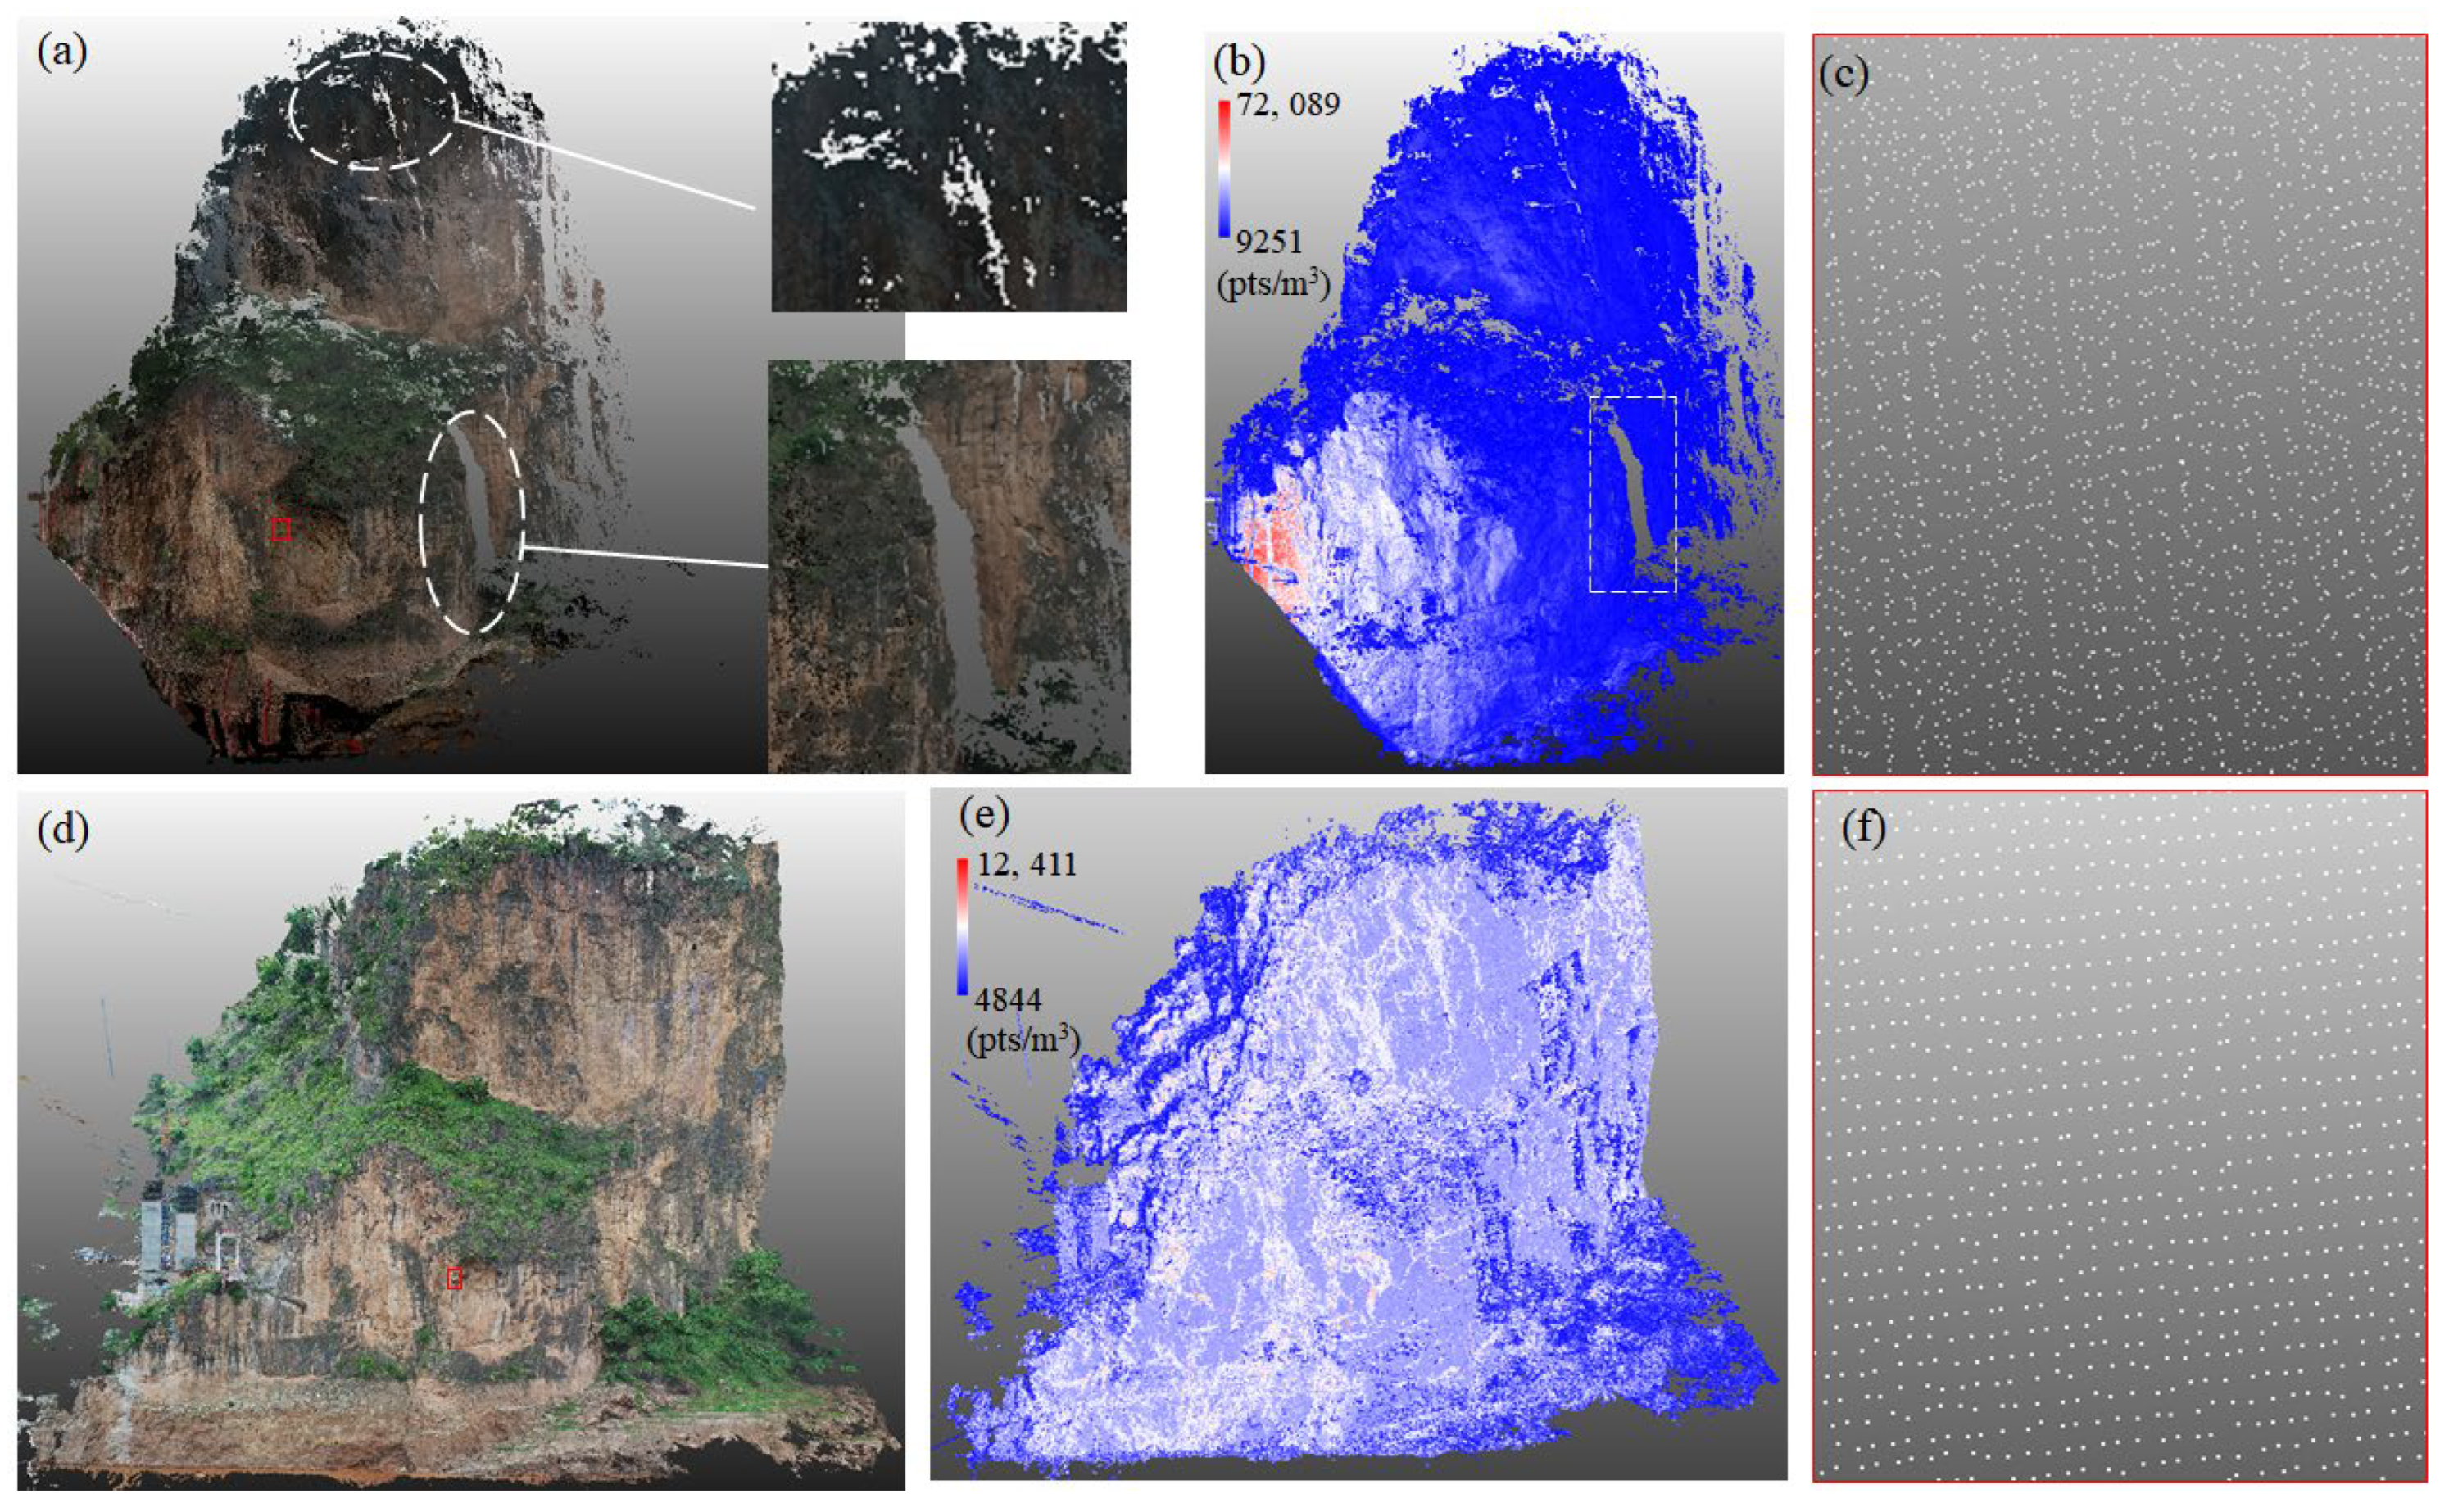
Point cloud data from the target slope were acquired using TLS and UAV technologies. Given the complex terrain and accessibility constraints of the rock slope in the mountainous region, three TLS stations were strategically positioned opposite the slope face. Each station utilized a scanning field of view of 360° × 300°, with a sampling rate of 2 × 10⁶ pts/s and an angular resolution of 0.03° to capture 3D point cloud. The entire measurement process took approximately 20 min. The point cloud datasets from each station contained 11 to 16 million points, with overlapping point clouds between adjacent stations. The station-based measurement module in SouthLidar Pro2.0 was employed to optimize point cloud stitching, resulting in a unified TLS model (Figure 7a). Meanwhile, UAV photogrammetry was conducted under the same environmental conditions, capturing 437 high-resolution images. Image acquisition maintained >70% overlap ratios in both along-track and cross-track directions. The SfM-MVS algorithm in Agisoft Metashape V2.0.2 was used to generate UAV-imaged point clouds (Figure 7d), which were spatially referenced in the WGS84 coordinate system and assigned RGB color values.
Comparative analysis of the TLS-scanned and UAV-imaged point clouds demonstrates both datasets effectively capture surface characteristics and positional-spectral information of the high-steep slope. However, inherent sensor and acquisition differences induce significant heterogeneity in data completeness, density distribution, and quality attributes. The high-density point cloud model generated by TLS contains 3.612 × 10⁷ points, with a maximum point density of 72,089 points/m3 and a millimeter-level resolution. However, affected by occlusion effects from the complex terrain, the TLS data exhibits progressive density attenuation or even gaps in the middle and upper parts of the slope, such as typical scanning blind zones in Figure 7a. In contrast, the UAV-imaged point cloud with 5.741 × 10⁷ points demonstrates superior spatial continuity and complete coverage across the entire slope. Its point density ranges from 4844 to 12,411 points/m3 and is distributed more uniformly. However, due to limitations in the placement of GCPs, the model may introduce localized positional errors. Notably, water surface reflections at the slope base induce geometric distortions in the bottom-right region of the model. Additionally, a localized sampling analysis (Figure 7c,d) further highlights their differences. The TLS data has a significantly higher density but exhibits a somewhat chaotic distribution in the selected area. Conversely, the UAV-imaged point cloud demonstrates a more uniform, linear arrangement, with similar point spacings along each line.
In summary, TLS excels in capturing micro-scale features of the target, while UAV is more suitable for large-scale terrain reconstruction. However, the comparative analysis also highlights several challenges, including data gaps in different areas, partial data overlap, large outliers, and density difference between the two datasets.

4.2. Fusion Effect of Multi-Sensor Data Model

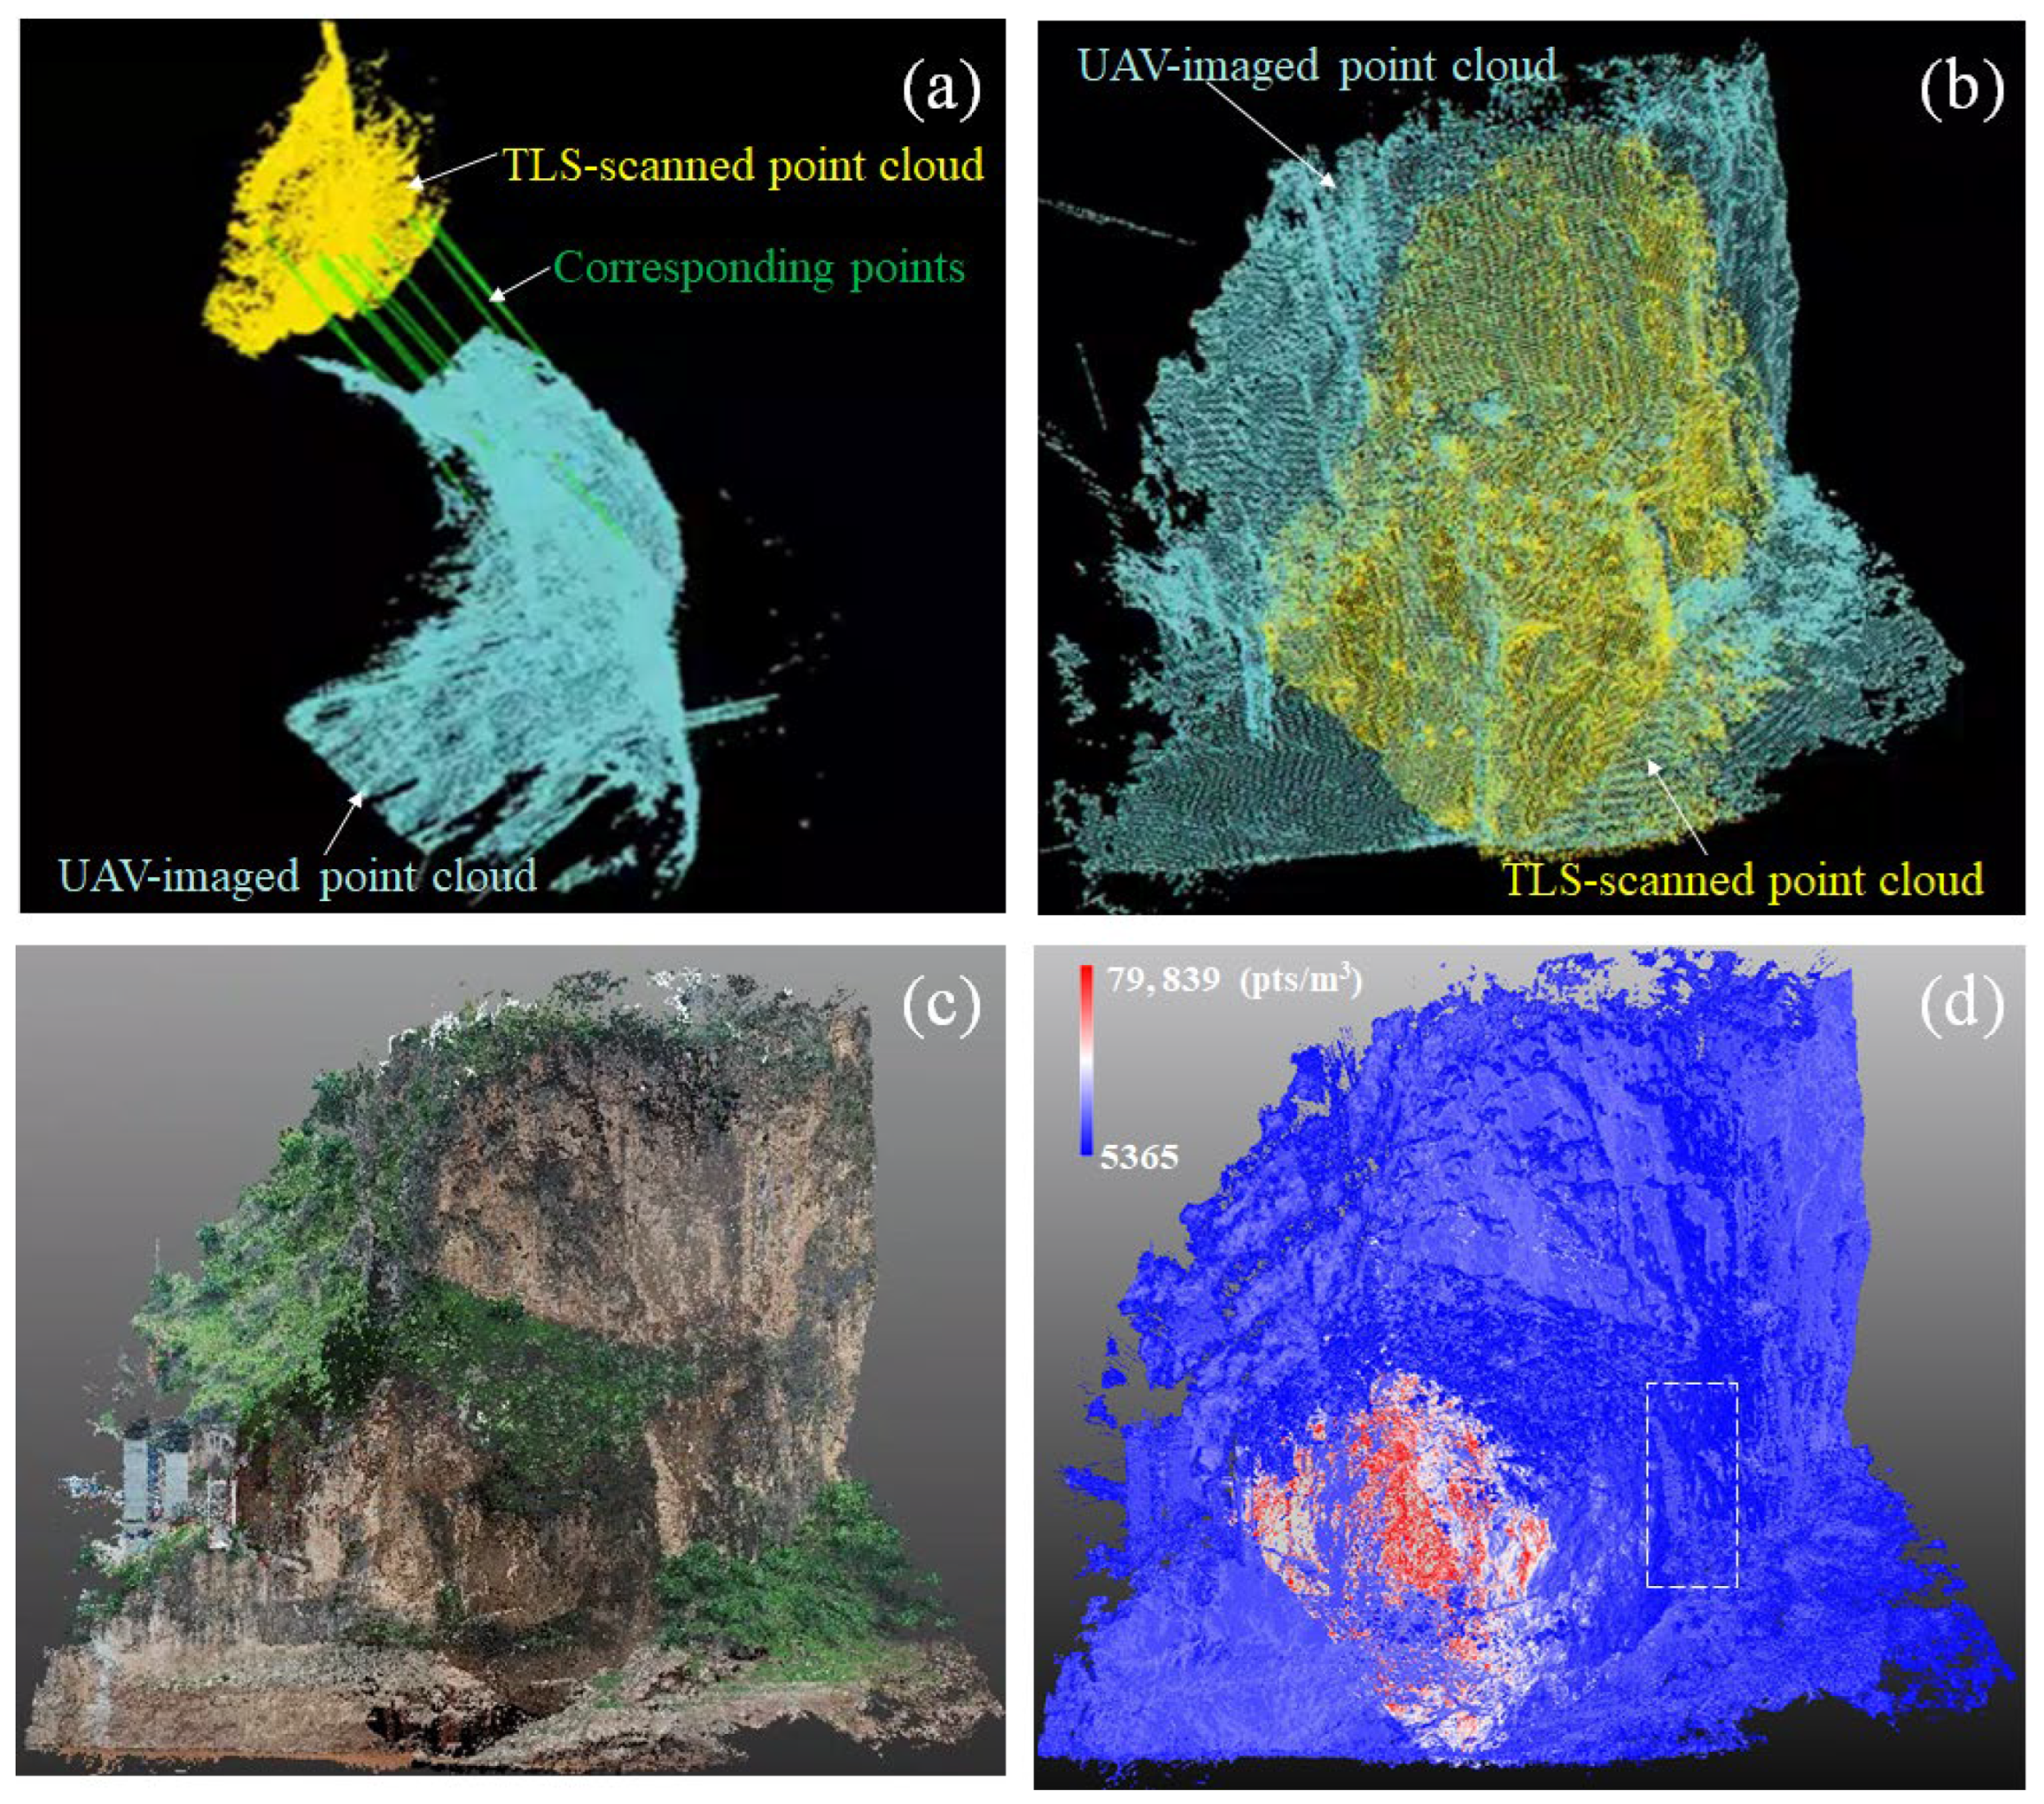
The TLS and UAV point clouds underwent standardized preprocessing and were uniformly converted to the ASC format. Following the Transformer-based method outlined in Section 3.2.2, initial correspondence pairs were identified (Figure 8a), and the rotation and translation matrices were computed during registration. This process yielded the registration results between TLS-scanned point cloud and UAV-imaged point cloud (Figure 8b). The integrated TLS-UAV dataset forms a comprehensive 3D model spanning 48,472 m2 of the high-steep slope, comprising 9.35 × 10⁷ discrete points with full spatial coverage (Figure 8c). In addition, the density distribution of slope is shown in Figure 8d.
The registered TLS-UAV point clouds exhibited substantial spatial congruence, with clearly delineated rock mass structures on the slope surface and significant improvements in model planarity and textural resolution. Comparative evaluation between the fused dataset and TLS-only data (Figure 7 and Figure 8) quantified an 85.58% improvement in spatial coverage and 9.71% increase in volumetric point density, substantially reducing data voids and blind zones. For instance, the blind zone area decreased by approximately 42% within a rectangular sampling zone on the slope flank, accompanied by a more homogeneous density distribution. These results not only underscore the method’s efficacy in outlier suppression but also highlight its capacity to refine matching precision and optimize spatial layout.
In summary, the CSPC fusion method proposed in this study, integrating TLS and UAV techniques, effectively enhances the quality of digital modeling for high-steep slopes. The CSPC model demonstrates superior scene completeness and geometric accuracy compared to models constructed using a single technique, confirming the synergistic effects of technological integration. The high precision of TLS-scanned point cloud provides a reliable spatial reference for UAV-imaged point cloud, while the extensive coverage capability of UAV data effectively compensates for TLS blind zones, forming a complementary system of technical advantages.

4.3. Accuracy Evaluation of Multi-Sensor Data Model

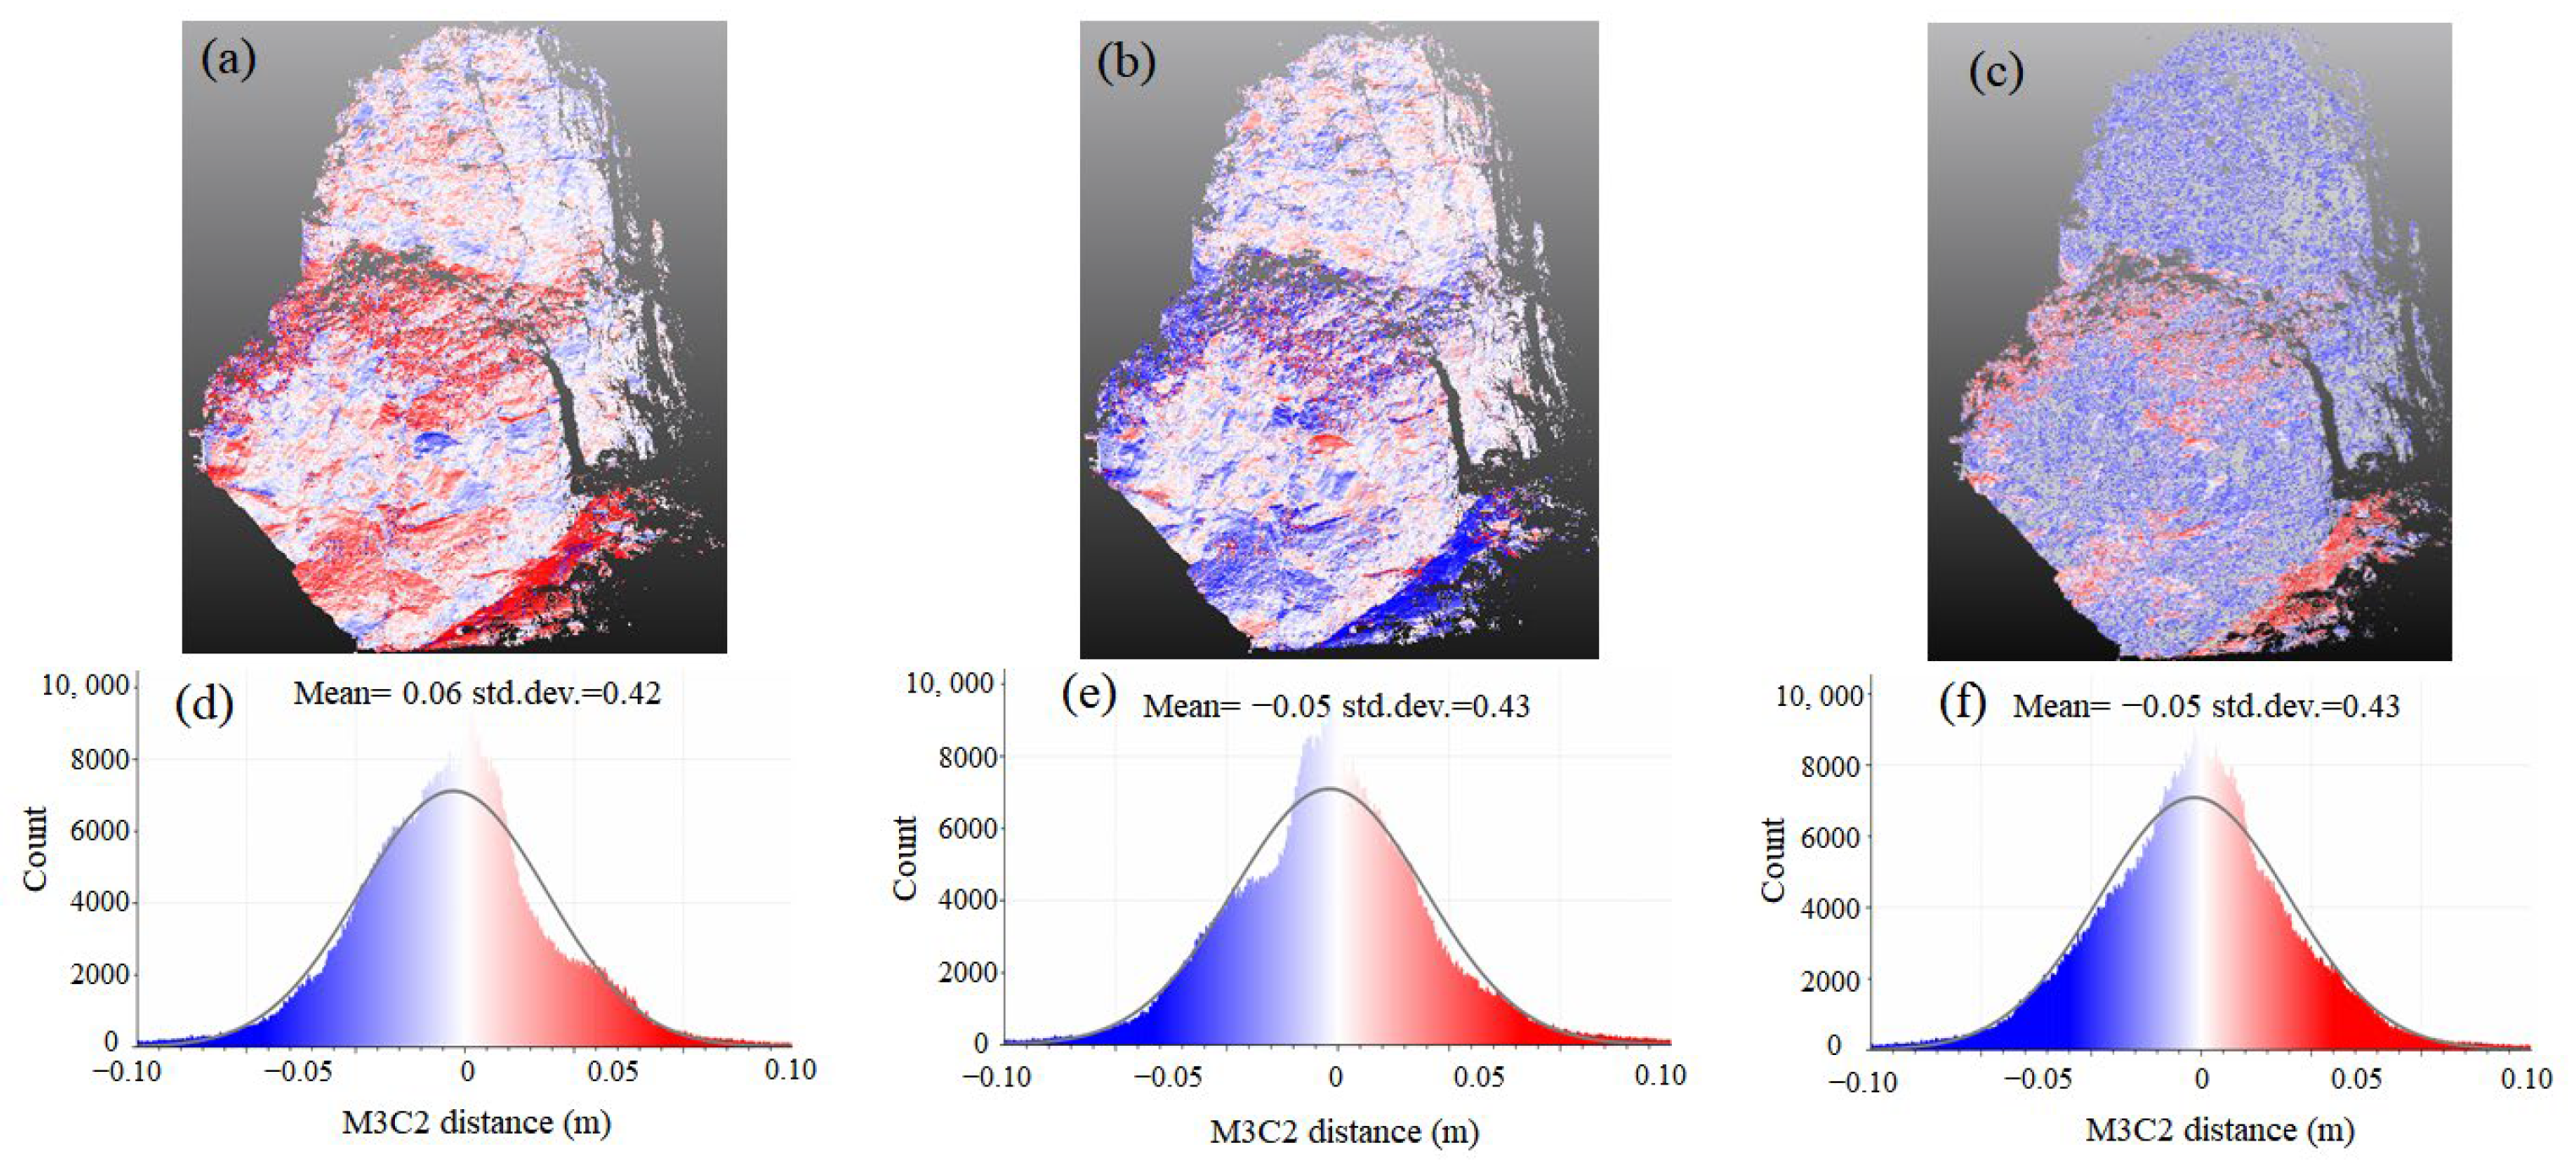
In addition to visual comparisons, the accuracy of the TLS-UAV model was quantitatively evaluated using corresponding point pairs. The RMSE of the distances between corresponding points was calculated, yielding a result of 0.08 m. This error falls within the acceptable range and meets the precision requirements for the relevant parameters [8,14]. The error of CSPC registration was analyzed using the M3C2 algorithm, where smaller calculated deviations indicate better alignment and higher registration quality. The results are visually represented by a scalar field map showing the spatial error distribution (Figure 9a) and a frequency histogram revealing the statistical characteristics of the errors (Figure 9b). The frequency histograms of registration errors in the X, Y, and Z directions exhibit approximately normal distributions, with most errors consistently constrained within ±0.1 m. The mean errors are 0.06 m, −0.05 m, and −0.05 m, respectively. The model’s registration accuracy meets the error requirement for large-scale modeling, with an exact registration error below 0.2 m [14]. Notably, spatially clustered errors observed in mid-slope and vegetated lower-right regions, which may result from the differing penetration abilities of TLS and UAV imaging in vegetation-covered areas. TLS can capture point cloud data beneath vegetation with laser beams, while UAV photogrammetry primarily acquires the object surface morphology based on stereo matching [29,44].
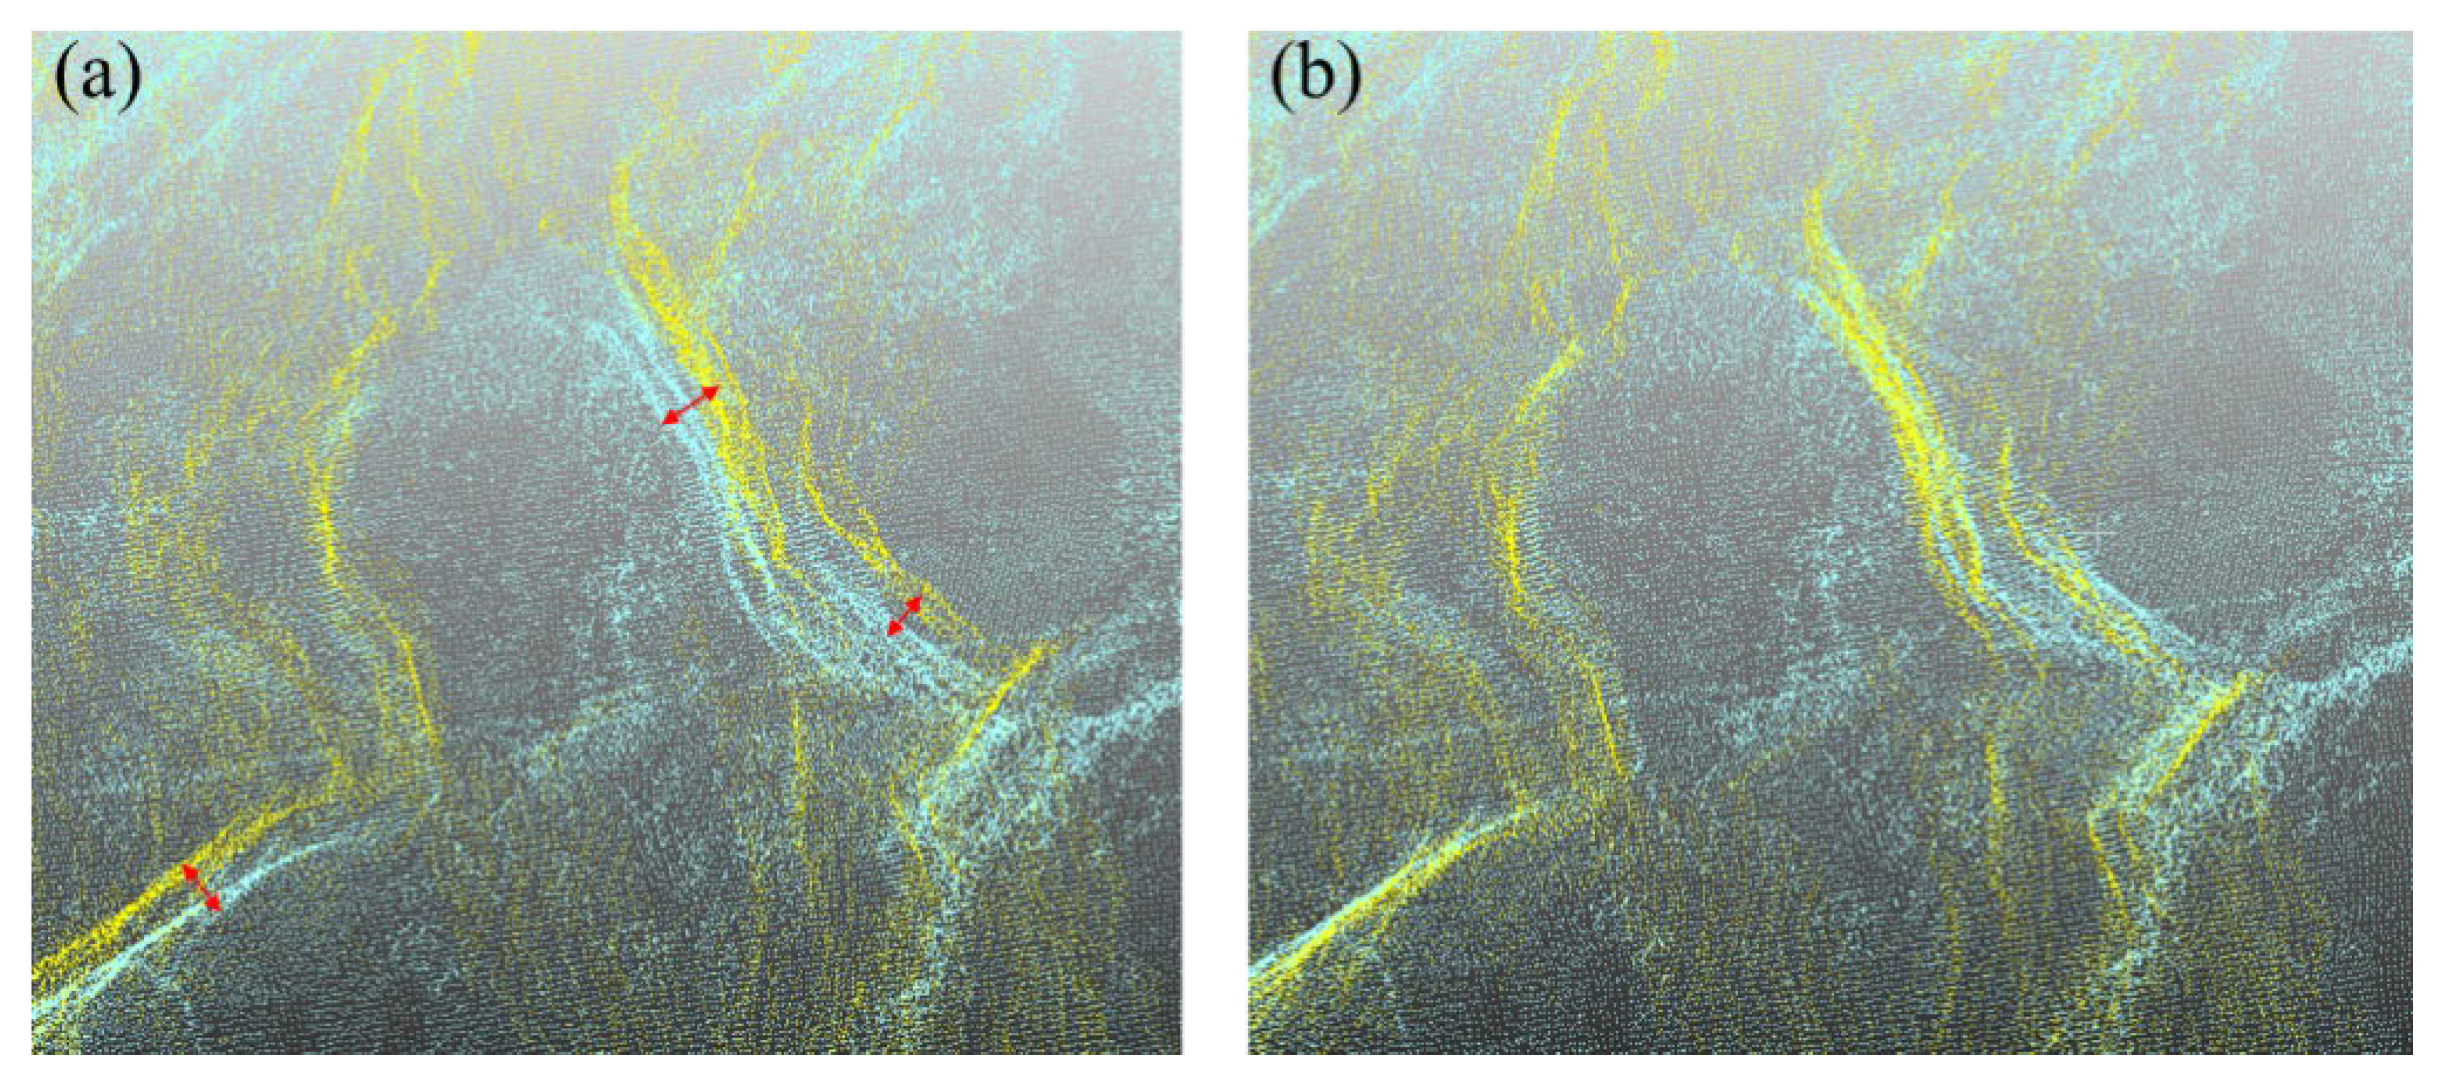
For the point cloud registration, the classical ICP method is usually performed [6,25]. To compare the accuracy differences between different methods, this study uses the same error assessment method to analyze the registration performance of the ICP-based method within the TLS-UAV fusion model [6]. As shown in Figure 10a,b, the registration result of the ICP presents local layering phenomenon in the complex terrain region, while the registration result of this study’s method shows better consistency in this location, and the performance of local detail registration is better. The efficiency and error calculation results of the two methods are listed in Table 3. Compared with the ICP-based method, the Transformer-based method proposed in this paper improves the computational efficiency by more than 2 times and the accuracy by nearly 3 times.
Overall, the model constructed using the proposed fusion method demonstrates high registration accuracy, achieving centimeter-level precision in all three orthogonal spatial dimensions. This validates the reliability of the Transformer-based method for achieving collaborative multi-sensors data fusion, particularly in complex geological environments. The proposed workflow is equally applicable to other contexts such as moderate rocky slopes, archaeological sites, and cultural heritage structures, where multi-sensor data fusion is also required for detailed geometric documentation.

5. Discussion

5.1. Advantages and Limitations of Methodology

High-steep slopes along transportation corridors are typically located in areas with complex terrain and rugged topography, such as high mountains and deep valleys. These slopes are characterized by steep gradients, dramatic undulations, and highly variable geological conditions, often accompanied by potential hazards such as landslides and rockfalls [45,46]. The integration of TLS and UAV technologies provides an effective solution to these challenges. The high-resolution TLS-scanned point cloud can serve as a benchmark for data fusion, enabling the correction of precision deficiencies in UAV-imaged point cloud [14]. Meanwhile, the aerial surveying capabilities of UAVs compensate for the limited coverage of TLS, enhancing the completeness of the model [6]. The synergy between these two techniques achieves a balance between accuracy and efficiency, offering a reliable technical foundation for precise modeling and hazard monitoring of high-steep slopes in the complex mountainous region.
TLS and UAV point clouds exhibit distinct resolution, density, and precision characteristics, necessitating precise coordinate system alignment and data fusion during registration [13]. Furthermore, the inherent complexity and computational intensity of CSPC registration algorithms often escalate post-processing time costs, demanding advanced algorithmic optimization [23]. To overcome these difficulties, a hybrid point cloud registration framework is proposed in this work, which combines deep learning techniques with graph-theoretical principles. Specifically, GeoTransformer employs geometric self-attention and cross-attention mechanisms to extract geometric features and generate high-quality initial correspondences. Concurrently, the MAC algorithm generates high-precision transformation assumptions via maximal clique constraints to effectively deal with the outlier problem in the initial correspondence. This synergistic framework achieves high precision while maintaining superior computational efficiency, rendering it applicable to complex registration scenarios. The TLS-scanned point cloud obtained by the fusion method matches well with the UAV-imaged point cloud, which optimizes the data quality, and also improves the accuracy and efficiency of modeling. In principle, the method can also be extended to other types of CSPC, such as mobile laser scanning, airborne LiDAR, or close-range photogrammetry, as long as adequate overlap and geometric correspondences are present.
It should be noted that the registration process and error analysis are constrained by the incomplete coverage of TLS-scanned point cloud, and the proposed method is difficult to realize the accurate alignment of each local part of the TLS-UAV datasets. Consequently, the final registration results represent only a global optimal solution. Additionally, the M3C2 algorithm calculates errors exclusively within the overlapping regions of UAV and TLS point clouds, which may limit the representativeness of the error analysis. Therefore, future research also needs to collect point cloud data from TLS-UAVs with different terrains and data quality and perform self-supervised fine-tuning and experimental validation to enhance the generalization and adaptation ability of the Transformer-based method in different scenarios. Meanwhile, multiple evaluation metrics are used to compare and analyze different algorithms to further improve the alignment accuracy and ensure the robustness of the algorithm.

5.2. Potential of High-Precision Digital Model

The high-precision digital model, constructed based on the TLS-UAV fusion and CSPC registration method, provides multi-dimensional and high-efficiency data support for geological hazard mechanism analysis and engineering prevention in high-steep slopes. Its potential in target detection, 3D reconstruction, and risk localization is demonstrated as follows.
(1) Interpretation of rock mass structural information: In the high-precision model of rock slopes, intelligent algorithms such as clustering and segmentation can rapidly identify and accurately extract rock mass structural information, including the spatial distribution, orientation, spacing, persistence, and roughness of discontinuities [40]. These structural features are critical factors influencing slope stability, particularly in steep and inaccessible areas [6]. The high-resolution characteristics of the model significantly enhance the accuracy and reliability of identification, providing essential data support for in-depth analysis of rock mass mechanics. (2) Optimization of slope stability assessment: By utilizing the geometric accuracy and completeness of the fused model, slope stability analysis can more effectively incorporate the irregularity and complexity of the rock mass. Using precise geometric data to construct realistic numerical models, combined with finite element method or discrete element method, enables the evaluation of potential risk zones, failure modes of unstable rock masses, and possible collapse scales [47]. Additionally, the model supports disaster scenario reconstruction and serves as a reliable input for runout modeling and kinematic analyses of potential instability events [48]. (3) Long-term and multi-phase dynamic monitoring capability: It should be emphasized that the precision of TLS-UAV data limits its ability to detect sub-centimeter deformations critical for real-time early warning. However, through the registration and comparison of multi-phase models, the workflow is highly effective in capturing larger-scale geometric changes and evolution trends. This includes monitoring progressive erosion, episodic rockfall events, and the accumulation of deformation over longer time scales [49]. While not suitable for precursor detection, this capability is invaluable for understanding the long-term geomorphic evolution of slopes under influences such as rainfall and earthquakes [50]. In this context, it can serve as a complementary tool to higher-precision monitoring systems like synthetic aperture radar (SAR).
The high-precision digital model significantly improves the refinement and intelligence of rock slope research, demonstrating broad application potential. Future studies will continue to improve the registration algorithm, optimize the data processing flow, and explore its adaptability for real-time monitoring and complex environments, to further expand its application scope and scientific value.

6. Conclusions

To address the limitation of traditional measurement techniques in complex mountainous terrains and the challenge of multi-sensor data fusion, this study introduces a novel Transformer-based framework integrating TLS and UAV techniques for digital modeling. TLS exhibits significant advantages in capturing microscale slope features, while UAV photogrammetry exhibits superior applicability for large-scale terrain reconstruction. The study reveals heterogeneous characteristics between these data sources, mainly characterized by partial overlap, large outliers, and density differences. CSPC registration and matching are achieved through the optimized GeoTransformer-MAC algorithms. This method extracts geometric invariant features from CSPC to establish initial correspondences, screens high-quality locally consistent correspondences, and optimizes transformation parameters, thereby improving the robustness, accuracy, and efficiency of CSPC registration.
The GeoTransformer-MAC algorithms compensate for occluded missing portions in TLS-scanned point cloud and improve the accuracy of UAV-imaged point cloud. For the investigated slope, the integrated TLS–UAV model increases spatial coverage by 85.58% and enhances data density by 9.71% compared with the TLS-only model. It demonstrates global and local registration accuracies are 0.08 m and 0.06 m, respectively, realizing the 3D fine modeling of high steep rock slopes. The high-precision 3D model establishes multi-dimensional, time-sensitive data support for disaster early warning and engineering mitigation of high-steep slopes in complex mountainous regions, highlighting its extensive application potential. This approach will improve the accuracy of rock mass parameter identification, enable more precise analysis of rock instability modes and collapse scales, and support the quantitative evaluation of long-term, large-scale geometric evolution of slopes.

Author Contributions

C.L.: Investigation, Methodology, Writing, Review & Editing, Formal analysis. H.B.: Conceptualization, Writing, Review & Editing, Funding acquisition. J.Z.: Visualization, Project administration. B.A.: Supervision. H.L.: Conceptualization. S.K.: Supervision. W.Y.: Visualization, Funding acquisition. All authors have read and agreed to the published version of the manuscript.

Funding

This study was financially supported by the National Natural Science Foundation of China (Grant Nos. 42177142 and 52378477), the JSPS Kakenhi (Grants-in-Aid for Scientific Research 23K13419), and the Co-Creation Center for Disaster Resilience, Tohoku University and the Cross-Ministerial Strategic Innovation Promotion Program (Grant No. JPJ012289).

Data Availability Statement

The data presented in this study are available on request from the corresponding author.

Conflicts of Interest

The authors declare no conflicts of interest.

References

  1. Li, B.; Gong, W.; Tang, H.; Wang, L. DEM Simulation of the Bridge Collapse under the Impact of Rock Avalanche: A Case Study of the 2020 Yaoheba Rock Avalanche in Southwest China. Bull. Eng. Geol. Environ. 2024, 83, 104. [Google Scholar] [CrossRef]
  2. Sun, J.; Wang, X.; Guo, S.; Liu, H.; Zou, Y.; Yao, X.; Huang, X.; Qi, S. Potential Rockfall Source Identification and Hazard Assessment in High Mountains (Maoyaba Basin) of the Tibetan Plateau. Remote Sens. 2023, 15, 3273. [Google Scholar] [CrossRef]
  3. Sun, H.; Sheng, L.; Dai, Y.; Li, X.; Rui, Y.; Lu, L. 3D Geological Modeling of Tunnel Alignment in the Complex Mountainous Region of Yongshan, China, Based on Multisource Data Fusion. Eng. Geol. 2025, 354, 108209. [Google Scholar] [CrossRef]
  4. Fei, L.; Jaboyedoff, M.; Guerin, A.; Noël, F.; Bertolo, D.; Derron, M.-H.; Thuegaz, P.; Troilo, F.; Ravanel, L. Assessing the Rock Failure Return Period on an Unstable Alpine Rock Wall Based on Volume-Frequency Relationships: The Brenva Spur (3916 m Asl, Aosta Valley, Italy). Eng. Geol. 2023, 323, 107239. [Google Scholar] [CrossRef]
  5. Lan, H.; Tian, N.; Li, L.; Wu, Y.; Macciotta, R.; Clague, J.J. Kinematic-Based Landslide Risk Management for the Sichuan-Tibet Grid Interconnection Project (STGIP) in China. Eng. Geol. 2022, 308, 106823. [Google Scholar] [CrossRef]
  6. Liu, C.; Bao, H.; Wang, T.; Zhang, J.; Lan, H.; Qi, S.; Yuan, W.; Koshimura, S. Intelligent Characterization of Discontinuities and Heterogeneity Evaluation of Potential Hazard Sources in High-Steep Rock Slope by TLS-UAV Technology. J. Rock Mech. Geotech. Eng. 2025; in press. [Google Scholar] [CrossRef]
  7. Jiang, N.; Li, H.-B.; Li, C.-J.; Xiao, H.-X.; Zhou, J.-W. A Fusion Method Using Terrestrial Laser Scanning and Unmanned Aerial Vehicle Photogrammetry for Landslide Deformation Monitoring under Complex Terrain Conditions. IEEE Trans. Geosci. Remote Sens. 2022, 60, 1–14. [Google Scholar] [CrossRef]
  8. Wang, S.; Yan, B.; Hu, W.; Liu, X.; Wang, W.; Chen, Y.; Ai, C.; Wang, J.; Xiong, J.; Qiu, S. Digital Reconstruction of Railway Steep Slope from UAV+TLS Using Geometric Transformer. Transp. Geotech. 2024, 48, 101343. [Google Scholar] [CrossRef]
  9. Francioni, M.; Salvini, R.; Stead, D.; Coggan, J. Improvements in the Integration of Remote Sensing and Rock Slope Modelling. Nat. Hazard. 2018, 90, 975–1004. [Google Scholar] [CrossRef]
  10. Battulwar, R.; Zare-Naghadehi, M.; Emami, E.; Sattarvand, J. A State-of-the-Art Review of Automated Extraction of Rock Mass Discontinuity Characteristics Using Three-Dimensional Surface Models. J. Rock Mech. Geotech. Eng. 2021, 13, 920–936. [Google Scholar] [CrossRef]
  11. Wu, F.; Wu, J.; Bao, H.; Li, B.; Shan, Z.; Kong, D. Advances in Statistical Mechanics of Rock Masses and Its Engineering Applications. J. Rock Mech. Geotech. Eng. 2021, 13, 22–45. [Google Scholar] [CrossRef]
  12. Ding, Q.; Wang, F.; Chen, J.; Wang, M.; Zhang, X. Research on Generalized RQD of Rock Mass Based on 3D Slope Model Established by Digital Close-Range Photogrammetry. Remote Sens. 2022, 14, 2275. [Google Scholar] [CrossRef]
  13. Kang, J.; Kim, D.; Lee, C.; Kang, J.; Kim, D. Efficiency Study of Combined UAS Photogrammetry and Terrestrial LiDAR in 3D Modeling for Maintenance and Management of Fill Dams. Remote Sens. 2023, 15, 2026. [Google Scholar] [CrossRef]
  14. Luo, X.-L.; Jiang, N.; Li, H.-B.; Xiao, H.-X.; Chen, X.-Z.; Zhou, J.-W. A High-Precision Modeling and Error Analysis Method for Mountainous and Canyon Areas Based on TLS and UAV Photogrammetry. IEEE J. Sel. Top. Appl. Earth Obs. Remote Sens. 2024, 17, 7710–7724. [Google Scholar] [CrossRef]
  15. Abellán, A.; Oppikofer, T.; Jaboyedoff, M.; Rosser, N.J.; Lim, M.; Lato, M.J. Terrestrial Laser Scanning of Rock Slope Instabilities. Earth Surf. Process. Landf. 2014, 39, 80–97. [Google Scholar] [CrossRef]
  16. O’banion, M.S.; Olsen, M.J.; Hollenbeck, J.P.; Wright, W.C. Data Gap Classification for Terrestrial Laser Scanning-Derived Digital Elevation Models. ISPRS Int. J. Geo-Inf. 2020, 9, 749. [Google Scholar] [CrossRef]
  17. Dadrass Javan, F.; Samadzadegan, F.; Toosi, A.; van der Meijde, M. Unmanned Aerial Geophysical Remote Sensing: A Systematic Review. Remote Sens. 2025, 17, 110. [Google Scholar] [CrossRef]
  18. Štroner, M.; Urban, R.; Seidl, J.; Reindl, T.; Brouček, J. Photogrammetry Using UAV-Mounted GNSS RTK: Georeferencing Strategies without GCPs. Remote Sens. 2021, 13, 1336. [Google Scholar] [CrossRef]
  19. Cucchiaro, S.; Fallu, D.J.; Zhang, H.; Walsh, K.; Oost, K.V.; Brown, A.G.; Tarolli, P. Multiplatform-SfM and TLS Data Fusion for Monitoring Agricultural Terraces in Complex Topographic and Landcover Conditions. Remote Sens. 2020, 12, 1946. [Google Scholar] [CrossRef]
  20. Zang, Y.; Yang, B.; Li, J.; Guan, H. An Accurate Tls and Uav Image Point Clouds Registration Method for Deformation Detection of Chaotic Hillside Areas. Remote Sens. 2019, 11, 647. [Google Scholar] [CrossRef]
  21. Šašak, J.; Gallay, M.; Kaňuk, J.; Hofierka, J.; Minár, J. Combined Use of Terrestrial Laser Scanning and UAV Photogrammetry in Mapping Alpine Terrain. Remote Sens. 2019, 11, 2154. [Google Scholar] [CrossRef]
  22. Yan, C.; Feng, M.; Wu, Z.; Guo, Y.; Dong, W.; Wang, Y.; Mian, A. Discriminative Correspondence Estimation for Unsupervised RGB-D Point Cloud Registration. IEEE Trans. Circuits Syst. Video Technol. 2025, 35, 1209–1223. [Google Scholar] [CrossRef]
  23. Huang, X.; Mei, G.; Zhang, J. Cross-Source Point Cloud Registration: Challenges, Progress and Prospects. Neurocomputing 2023, 548, 126383. [Google Scholar] [CrossRef]
  24. Besl, P.J.; McKay, N.D. A Method for Registration of 3-D Shapes. IEEE Trans. Pattern Anal. Mach. Intell. 1992, 14, 239–256. [Google Scholar] [CrossRef]
  25. Li, P.; Wang, R.; Wang, Y.; Tao, W. Evaluation of the ICP Algorithm in 3D Point Cloud Registration. IEEE Access 2020, 8, 68030–68048. [Google Scholar] [CrossRef]
  26. Han, J.; Shin, M.; Paik, J. Robust Point Cloud Registration Using Hough Voting-Based Correspondence Outlier Rejection. Eng. Appl. Artif. Intell. 2024, 133, 107985. [Google Scholar] [CrossRef]
  27. Li, R.; Gan, S.; Yuan, X.; Bi, R.; Luo, W.; Chen, C.; Zhu, Z. Automatic Registration of Large-Scale Building Point Clouds with High Outlier Rates. Autom. Constr. 2024, 168, 105870. [Google Scholar] [CrossRef]
  28. Dai, W.; Kan, H.; Tan, R.; Yang, B.; Guan, Q.; Zhu, N.; Xiao, W.; Dong, Z. Multisource Forest Point Cloud Registration with Semantic-Guided Keypoints and Robust RANSAC Mechanisms. Int. J. Appl. Earth Obs. Geoinf. 2022, 115, 103105. [Google Scholar] [CrossRef]
  29. Wang, C.; Gu, Y.; Li, X. LPRnet: A Self-Supervised Registration Network for LiDAR and Photogrammetric Point Clouds. IEEE Trans. Geosci. Remote Sens. 2025, 63, 4404012. [Google Scholar] [CrossRef]
  30. Zhang, Y.-X.; Gui, J.; Cong, X.; Gong, X.; Tao, W. A Comprehensive Survey and Taxonomy on Point Cloud Registration Based on Deep Learning. In Proceedings of the Thirty-Third International Joint Conference on Artificial Intelligence, Jeju Island, Republic of Korea, 3–9 August 2024; pp. 8344–8353. [Google Scholar]
  31. Aoki, Y.; Goforth, H.; Srivatsan, R.A.; Lucey, S. Pointnetlk: Robust & Efficient Point Cloud Registration Using Pointnet. In Proceedings of the 2019 IEEE/CVF Conference on Computer Vision and Pattern Recognition (CVPR), Long Beach, CA, USA, 15–20 June 2019; Volume 2019, pp. 7156–7165. [Google Scholar]
  32. Lu, F.; Chen, G.; Liu, Y.; Zhan, Y.; Li, Z.; Tao, D.; Jiang, C. Sparse-to-Dense Matching Network for Large-Scale LiDAR Point Cloud Registration. IEEE Trans. Pattern Anal. Mach. Intell. 2023, 45, 11270–11282. [Google Scholar] [CrossRef]
  33. Wang, Y.; Solomon, J.M. Deep Closest Point: Learning Representations for Point Cloud Registration. In Proceedings of the Proceedings of the IEEE/CVF International Conference on Computer Vision, Seoul, Republic of Korea, 27 October–2 November 2019; pp. 3523–3532. [Google Scholar]
  34. Li, G.; Wu, B.; Yang, L.; Pan, Z.; Dong, L.; Wu, S.; Shen, G.; Zhang, J.; Xiao, T.; Zhang, L.; et al. QuadrantSearch: A Novel Method for Registering UAV and Backpack LiDAR Point Clouds in Forested Areas. IEEE Trans. Geosci. Remote Sens. 2025, 63, 1–17. [Google Scholar] [CrossRef]
  35. Han, Z.; Liu, L. A 6D Object Pose Estimation Algorithm for Autonomous Docking with Improved Maximal Cliques. Sensors 2025, 25, 283. [Google Scholar] [CrossRef]
  36. Yang, J.; Zhang, X.; Wang, P.; Guo, Y.; Sun, K.; Wu, Q.; Zhang, S.; Zhang, Y. MAC: Maximal Cliques for 3D Registration. IEEE Trans. Pattern Anal. Mach. Intell. 2024, 46, 10645–10662. [Google Scholar] [CrossRef]
  37. Lague, D.; Brodu, N.; Leroux, J. Accurate 3D Comparison of Complex Topography with Terrestrial Laser Scanner: Application to the Rangitikei Canyon (N-Z). ISPRS J. Photogramm. Remote Sens. 2013, 82, 10–26. [Google Scholar] [CrossRef]
  38. CloudCompare; Version 2.12; EDF R&D, Télécom ParisTech: Paris, France, 2022; Available online: https://www.cloudcompare.org/ (accessed on 27 January 2025).
  39. Python Software Foundation. Python Language Reference, Version 3.10. Available online: https://docs.python.org/3 (accessed on 29 January 2025).
  40. Kong, D.; Saroglou, C.; Wu, F.; Sha, P.; Li, B. Development and Application of UAV-SfM Photogrammetry for Quantitative Characterization of Rock Mass Discontinuities. Int. J. Rock Mech. Min. Sci. 2021, 141, 104729. [Google Scholar] [CrossRef]
  41. Li, J.; Zhuang, Y.; Peng, Q.; Zhao, L. Pose Estimation of Non-Cooperative Space Targets Based on Cross-Source Point Cloud Fusion. Remote Sens. 2021, 13, 4239. [Google Scholar] [CrossRef]
  42. Qin, Z.; Yu, H.; Wang, C.; Guo, Y.; Peng, Y.; Ilic, S.; Hu, D.; Xu, K. GeoTransformer: Fast and Robust Point Cloud Registration With Geometric Transformer. IEEE Trans. Pattern Anal. Mach. Intell. 2023, 45, 9806–9821. [Google Scholar] [CrossRef]
  43. Peng, Y.; Lin, S.; Wu, H.; Cao, G. Point Cloud Registration Based on Fast Point Feature Histogram Descriptors for 3D Reconstruction of Trees. Remote Sens. 2023, 15, 3775. [Google Scholar] [CrossRef]
  44. Singh, S.K.; Raval, S.; Banerjee, B.P. Automated Structural Discontinuity Mapping in a Rock Face Occluded by Vegetation Using Mobile Laser Scanning. Eng. Geol. 2021, 285, 106040. [Google Scholar] [CrossRef]
  45. Cui, P.; Ge, Y.; Li, S.; Li, Z.; Xu, X.; Zhou, G.G.D.; Chen, H.; Wang, H.; Lei, Y.; Zhou, L.; et al. Scientific Challenges in Disaster Risk Reduction for the Sichuan–Tibet Railway. Eng. Geol. 2022, 309, 106837. [Google Scholar] [CrossRef]
  46. Liu, C.; Bao, H.; Lan, H.; Yan, C.; Li, C.; Liu, S. Failure Evaluation and Control Factor Analysis of Slope Block Instability along Traffic Corridor in Southeastern Tibet. J. Mt. Sci. 2024, 21, 1830–1848. [Google Scholar] [CrossRef]
  47. Xu, Q.; Ye, Z.; Liu, Q.; Dong, X.; Li, W.; Fang, S.; Guo, C. 3D Rock Structure Digital Characterization Using Airborne LiDAR and Unmanned Aerial Vehicle Techniques for Stability Analysis of a Blocky Rock Mass Slope. Remote Sens. 2022, 14, 3044. [Google Scholar] [CrossRef]
  48. Wang, M.; Zhou, J.; Chen, J.; Jiang, N.; Zhang, P.; Li, H. Automatic Identification of Rock Discontinuity and Stability Analysis of Tunnel Rock Blocks Using Terrestrial Laser Scanning. J. Rock Mech. Geotech. Eng. 2023, 15, 1810–1825. [Google Scholar] [CrossRef]
  49. Bao, H.; Liu, C.; Lan, H.; Yan, C.; Li, L.; Zheng, H.; Dong, Z. Time-Dependency Deterioration of Polypropylene Fiber Reinforced Soil and Guar Gum Mixed Soil in Loess Cut-Slope Protecting. Eng. Geol. 2022, 311, 106895. [Google Scholar] [CrossRef]
  50. Núñez-Andrés, M.A.; Prades-Valls, A.; Matas, G.; Buill, F.; Lantada, N. New Approach for Photogrammetric Rock Slope Premonitory Movements Monitoring. Remote Sens. 2023, 15, 293. [Google Scholar] [CrossRef]
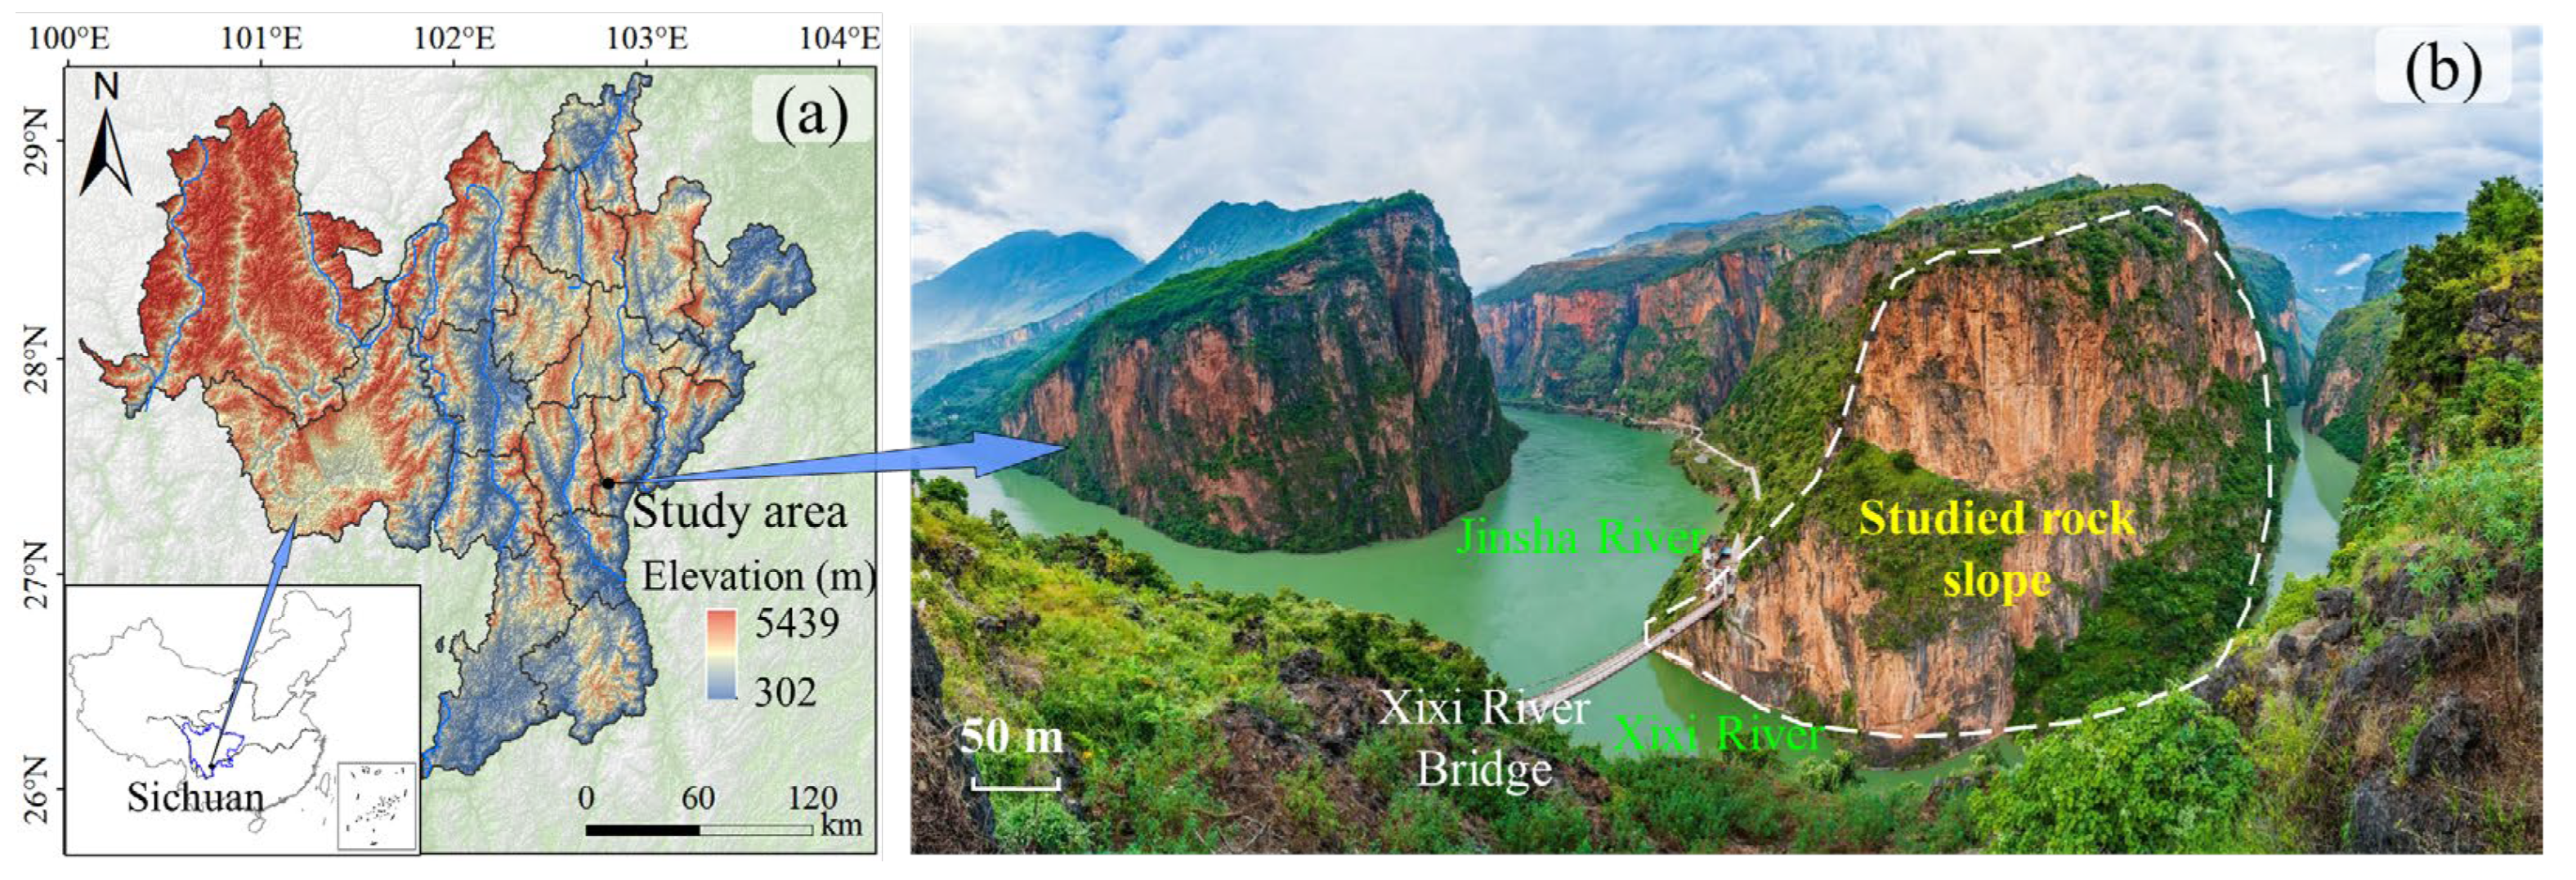
Figure 1. Overview of the study area and the studied rocky slope. (a) map showing the location of the study area in Liangshan Prefecture; (b) the studied rock slope along the complex mountainous region. Referred from Liu et al. [6].
Remotesensing 17 03555 g001
Figure 2. The method of accurate digital modeling for the high-steep rock slope based on TLS-UAV technologies fusion and Transformer-based method.
Remotesensing 17 03555 g002
Figure 3. Terrestrial 3D laser scanner used in this study and its ranging principle: (a) SOUTH SPL-1500 TLS; (b) ranging principle of TLS and the coordinate diagram of its internal system.
Remotesensing 17 03555 g003
Figure 4. (a) Unmanned aerial vehicle (DJI Phantom 4 RTK), and (b) the flow of generating dense matching point clouds using SfM-MVS algorithm.
Remotesensing 17 03555 g004
Figure 5. Network architecture of the Transformer-based method of cross-source point cloud registration.
Remotesensing 17 03555 g005
Figure 6. The schematic workflow of the M3C2 algorithm: (a) data core point sampling; (b) point cloud normal vector fitting; (c) M3C2 distance calculation; (d) roughness analysis and calculation. The distribution and distances of the point clouds in the figure are intended to demonstrate the algorithmic principles. Modified from Lague et al. [37].
Remotesensing 17 03555 g006
Figure 7. Characteristic differences in 3D point cloud models between TLS and UAV: (a) TLS-scanned point cloud and (b) its volumetric density distribution; (c) local features of TLS-scanned point cloud (corresponding to red rectangular areas in (a); (d) UAV-imaged point cloud and (e) its volumetric density distribution, (f) local features of UAV-imaged point cloud (corresponding to red rectangular areas in (d).
Remotesensing 17 03555 g007
Figure 8. (a) Corresponding points within the TLS-scanned point cloud and the UAV-imaged point cloud, (b) high-steep slope model after point cloud registration, (c) 3D reality model of high-steep slope, and (d) the corresponding volumetric density distribution, the dash line box represents the rectangular sampling zone.
Remotesensing 17 03555 g008
Figure 9. Scalar fields of registration errors for the TLS-UAV cross-source heterogeneous data model in (a) X, (b) Y, and (c) Z directions, along with the corresponding error statistics in the (d) X, (e) Y, and (f) Z directions.
Remotesensing 17 03555 g009
Figure 10. Local details of the CSPC registration effect between (a) the ICP-based method and (b) the Transformer-based method. The yellow and blue respectively represent the TLS-scanned point cloud and the UAV-imaged point cloud, and the red arrows represent the stratification distances of the TLS-UAV point cloud.
Remotesensing 17 03555 g010
Table 2. Technical parameters for DJI Phantom4 RTK unmanned aerial vehicle.
ParameterValue
Weight1391 g
Maximum flight height500 m
Max flight time30 min
GNSS modeGPS/BDS/Galileo
Image dimensions5472 × 3648 pixels
Focal length8.8–24 mm
Post-processingAgisoft Metashape V2.0.2
Table 1. Technical parameters for SOUTH SPL-1500 terrestrial laser scanning.
Critical ParametersValues
Max service time4 h
Ranging methodPulse-type
Max scanning distance1500 m
Distance resolution3 mm @ 100 m
Maximum field of view anglehorizontal 360°/vertical 300°
Angular resolution0.001°
Post-processingSouthLidar Pro2.0
Table 3. Comparison registration results of different methods.
MethodGlobal Error
RMSE (m)
Local Error
M3C2 (m)
Times (s)
ICP-based method0.230.19154
Transformer-based method0.080.0668
Disclaimer/Publisher’s Note: The statements, opinions and data contained in all publications are solely those of the individual author(s) and contributor(s) and not of MDPI and/or the editor(s). MDPI and/or the editor(s) disclaim responsibility for any injury to people or property resulting from any ideas, methods, instructions or products referred to in the content.