Article

IOPE-IPD: Water Properties Estimation Network Integrating Physical Model and Deep Learning for Hyperspectral Imagery

1
School of Electronics and Information, Northwestern Polytechnical University, Xi’an 710129, China
2
Science and Technology on Electromechanical Dynamic Control Laboratory, Xi’an 710065, China
*
Author to whom correspondence should be addressed.
Remote Sens. 2025, 17(21), 3546; https://doi.org/10.3390/rs17213546
Submission received: 19 August 2025 / Revised: 22 October 2025 / Accepted: 24 October 2025 / Published: 26 October 2025

Highlights

What are the main findings?
  • This study proposes IOPE-IPD, a network that integrates physical modeling with deep learning to achieve accurate estimation of water absorption and backscattering coefficients.
  • The method is validated on both real-world and Jerlov-simulated datasets, demonstrating robustness and superior performance compared with existing approaches.
What is the implication of the main finding?
  • IOPE-IPD enables physically meaningful and interpretable estimation of water optical properties in complex aquatic environments.
  • The framework provides a generalizable approach for reliable monitoring of water quality using hyperspectral data and supports future large-scale applications.

Abstract

Hyperspectral underwater target detection holds great potential for marine exploration and environmental monitoring. A key challenge lies in accurately estimating water inherent optical properties (IOPs) from hyperspectral imagery. To address these limitations, we propose a novel water IOP estimation network to support the interpretation of bathymetric models. We propose the IOPs physical model that focuses on the description of the water IOPs, describing how the concentrations of chlorophyll, colored dissolved organic matter, and detrital material influence the absorption and backscattering coefficients. Building on this foundation, we proposed an innovative IOP estimation network integrating a physical model and deep learning (IOPE-IPD). This approach enables precise and physically interpretable estimation of the IOPs. Specially, the IOPE-IPD network takes water spectra as input. The encoder extracts spectral features, while dual parallel decoders simultaneously estimate four key parameters. Based on these outputs, the absorption and backscattering coefficients of the water body are computed using the IOPs physical model. Subsequently, the bathymetric model is employed to reconstruct the water spectrum. Under the constraint of a consistency loss, the retrieved spectrum is encouraged to closely match the input spectrum. To ensure the IOPE-IPD’s applicability across various scenarios, multiple actual and Jerlov-simulated aquatic environments were used. Comprehensive experimental results demonstrate the robustness and effectiveness of our proposed IOPE-IPD over the compared method.

1. Introduction

Developing hyperspectral underwater target detection technology is critical in key fields such as marine resource exploration, environmental monitoring, and underwater operations [1,2,3,4,5,6]. Advancements in this technology enhance the theoretical framework of vision-based target detection and provide strong technical support for the accurate identification and efficient management of underwater environments. With its powerful learning and generalization capabilities in image recognition and processing, deep learning [7,8,9,10] has become a driving force in advancing hyperspectral underwater target detection [11,12,13]. However, the performance of deep learning models heavily relies on large-scale, high-quality training datasets [14]. In the domain of airborne passive remote sensing in shallow water environments, obtaining high-quality hyperspectral image data is highly challenging due to the complexity and variability of the underwater environment. Therefore, it is necessary to develop a framework to estimate water IOPs from hyperspectral imagery.
The key to constructing a synthetic dataset for hyperspectral underwater targets is obtaining essential water inherent optical properties (IOPs). Gillis et al. [15] used a semi-analytical model in combination with a look-up table strategy to derive the intrinsic optical properties. It estimated the water remote sensing reflectance by pre-computing many water spectra with known IOPs and retrieving the best-matching IOPs. Based on this, the Ecolight model is used to generate synthetic underwater target spectra, which are then embedded in the background of the dataset after adding noise. However, this method has several limitations, such as the lack of intelligence in estimating water column optical properties, computational inefficiency due to reliance on large spectral libraries, and limited applicability to complex and dynamic underwater environments.
There is a critical need for more efficient and intelligent methods for estimating the water IOPs. For this, Qi et al. proposed the IOPE-Net, a deep learning-based network designed for the intelligent estimation of the water IOPs [16]. IOPE-Net relies on an optical deep water bathymetric model. It employs a hybrid sequence structure to extract high-dimensional nonlinear features from water column spectra for the unsupervised inversion of absorption and backscattering coefficients. However, in the simplified bathymetric model for optically deep water, due to the inherently non-unique relationship between absorption and backscattering coefficients, the inversion results produced by this method may lack physical interpretability and may not yield unique solutions. In reality, the absorption and backscattering properties of the water column are closely tied to factors such as the concentrations of chlorophyll, colored dissolved organic matter (CDOM), and detrital material. Considering this issue, we combine the IOPs estimation network with the IOPs physical model, which provides a detailed description of the water column’s optical properties.
IOPs are key parameters that describe light’s absorption and backscattering behaviors as it propagates through water. Absorption properties precisely quantify the extent to which various substances in the water scenario absorb light. Major absorbing components in the water column include pure seawater, chlorophyll from phytoplankton, CDOM, and non-algal particles (NAP) [17,18,19,20]. For the absorption properties of pure seawater, Pope et al. used the integral cavity technique to measure the continuous absorption spectral profile of pure seawater over the wavelength range of 380–700 nm [21]. Lee et al. proposed a model to resolve the spectral properties of seawater across the visible to infrared ranges, considering factors such as bottom reflectivity, chlorophyll or CDOM absorption, and backscattering from the water column [22]. Additionally, Howard et al. demonstrated that the absorption coefficient of chlorophyll at 440 nm is closely correlated with chlorophyll concentration [23]. Regarding CDOM absorption characteristics, Kirk et al. have extensively studied the absorption coefficients of CDOM in offshore and inland water since 1994 [24]. Bricaud et al. expanded this research by focusing on CDOM absorption coefficients in marine water [25]. Furthermore, Babin et al. examined how four phytoplankton species, plant debris formed during phytoplankton cultivation, and natural combinations of mineral particles from various samples affect water absorption characteristics [26].
Among the water IOPs, the backscattering coefficient describes the extent to which light is deflected as it propagates through water. It is influenced by three primary components: pure seawater, detrital particles, and chlorophyll (an important component of phytoplankton) [27]. Morel [28] provided a continuous spectral profile on the backscattering of pure seawater in the wavelength range of 380–700 nm. Although these data are based on empirical formulas, their reliability and applicability have been extensively verified, making them widely used in seawater optics research. Lee et al. further investigated the relationship between water-leaving radiation and the water IOPs [29], focusing on the backscattering characteristics of detrital materials. These materials, composed of organic and inorganic fine particles, are major contributors to the backscattering properties of the water column. Furthermore, Howard et al. demonstrated that the backscattering coefficient of chlorophyll in phytoplankton at 440 nm is strongly correlated with its concentration, highlighting chlorophyll’s dual role in both absorption and backscattering properties of water [23].
Despite the remarkable progress achieved by IOPE-Net [16] in retrieving water IOPs through an unsupervised autoencoder framework, several limitations still persist. First, the model is primarily based on a simplified bathymetric assumption for optical deep water, which overlooks the complexity of real aquatic environments. Under this assumption, the relationship between the IOP coefficients and the deep-water reflectance often leads to non-unique or physically inconsistent inversion results. Consequently, the existing IOPE-Net framework may fail to obtain physically meaningful and uniquely determined IOP estimations. These limitations hinder the accurate characterization of the optical properties of natural waters.
In addition to IOPE-Net, traditional empirical and semi-analytical approaches for water IOPs retrieval typically depend on prior knowledge of water type or fixed analytical models, limiting their adaptability and robustness in diverse optical conditions. While recent deep learning-based methods have demonstrated strong nonlinear fitting capabilities, they often suffer from a lack of physical interpretability, which can lead to unrealistic or unstable parameter estimations. Considering these limitations, IOPE-Net serves as a representative baseline of unsupervised IOPs estimation, whereas our proposed IOPE-IPD network aims to further integrate physical constraints into the data-driven framework to achieve both accuracy and interpretability in IOPs estimation.
This paper proposes a novel framework that integrates physical modeling and deep learning to estimate water inherent optical properties with high accuracy and interpretability. Specifically, we construct an IOPs physical model that quantifies the influence of water constituents—chlorophyll, colored dissolved organic matter (CDOM), and detrital material—on absorption and backscattering coefficients. Building on this model, we develop the IOPE-IPD network, which consists of an encoder and dual decoders for estimating key water quality parameters from hyperspectral inputs. The estimated parameters are used to compute IOPs and retrieve the input water spectrum via a bathymetric model, guided by a consistency loss to ensure spectral fidelity. We validate our approach across diverse aquatic scenarios, including real-world and Jerlov-simulated water bodies, demonstrating the robustness and generalization capability of our proposed method. The key innovations of this paper include the following:
  • A novel IOPs estimation network integrating physical model and deep learning is proposed. It enables the accurate estimation of water column absorption and backscattering coefficients that are physically meaningful and interpretable.
  • The IOPs physical model is proposed, which represents the absorption and backscattering coefficients of the water column using four key parameters, facilitating the mathematical characterization of water properties.
  • To ensure the generalizability of IOPE-IPD, both real-world and Jerlov-simulated aquatic environments are used. Comprehensive experimental results demonstrate the robustness and superior performance of the proposed method compared with the existing method.
The remaining sections of the paper are organized as follows. In Section 2, a brief overview of related work is provided. Section 3 presents the detailed methodology proposed in this paper. Section 4 provides the experimental performance analysis. Section 5 discuss related analysis. Finally, a conclusion of the paper is provided in Section 6.

2. Related Work

2.1. Bathymetric Model

The airborne hyperspectral imaging process for underwater target generally involves three key components: the light source, the underwater target, and the airborne hyperspectral imaging system. The underwater target spectrum received by the UAV’s (Unmanned Aerial Vehicle) spectrometer sensor is influenced by factors such as the water IOPs, the reflective properties of the land-based target (or above-water target), the depth of the underwater target, solar intensity, the solar zenith angle, and atmospheric attenuation. Specifically, after removing atmospheric attenuation, the subsurface remote-sensing reflectance is a linear combination of two types of reflectance, with the weighting factor determined by water IOPs. As it varies with underwater target depth, this functional model is commonly called a bathymetric model [30,31]. The reflectance r ( λ ) of each pixel in an underwater hyperspectral imagery (HSI), adjusted by a calibrated whiteboard, can be described as follows:
r ( λ ) = r ( λ ) ( 1 e ( k d ( λ ) + k u c ( λ ) ) H ) + r B ( λ ) e ( k d ( λ ) + k u b ( λ ) ) H
where r ( λ ) is the reflectance of optically deep water, r B ( λ ) is the land-based target reflectance, H is the depth of the underwater target, k d ( λ ) is the downward attenuation coefficient of light in water, and k u c ( λ ) and k u b ( λ ) are the upward attenuation coefficients for the water column and the underwater target, respectively. These attenuation coefficients can be expressed nonlinearly as functions of the water absorption a ( λ ) and backscattering coefficients b ( λ ) [31,32,33]:
u ( λ ) = b b ( λ ) / ( a ( λ ) + b b ( λ ) ) k ( λ ) = a ( λ ) + b b ( λ ) r ( λ ) ( 0.084 + 0.17 u ( λ ) ) u ( λ ) k u c ( λ ) 1.03 ( 1 + 2.4 u ( λ ) ) 0.5 k ( λ ) k u b ( λ ) 1.04 ( 1 + 5.4 u ( λ ) ) 0.5 k ( λ ) k d ( λ ) = ( a ( λ ) + b b ( λ ) ) / cos θ
The bathymetric model indicates that the observed underwater target spectrum depends not only on the intrinsic reflectance spectrum of the target and its depth but also on the inherent optical properties (IOPs) of the surrounding water column. Given the target’s depth, reflectance spectrum, and the water column’s IOPs—specifically the absorption coefficient and backscattering coefficient—we can theoretically derive the underwater target’s observed spectral reflectance. This relationship forms the foundation for constructing synthetic datasets of hyperspectral underwater targets.
A primary focus in this context is the accurate retrieval of the water IOPs. The bathymetric model reveals that the target depth strongly modulates the observed reflectance spectrum, r ( λ ) . As the depth increases, the contribution of the bottom reflectance r B ( λ ) to the observed spectrum diminishes due to attenuation and scattering in the water column. When the water column is sufficiently deep such that minimal light reaches the target and returns, the observed spectrum r ( λ ) becomes dominated by the water column’s optical properties alone, and the influence of the target is negligible. Under such conditions, the bathymetric model reduces to the simplified form described in [31,32,33]:
r ( λ ) r ( λ ) r ( λ ) ( 0.084 + 0.17 u ( λ ) ) u ( λ ) u ( λ ) = b b ( λ ) / ( a ( λ ) + b b ( λ ) )
This scenario corresponds to the simplified bathymetric model for optically deep water, where the water column is considered optically deep. Under this assumption, the inversion of the water inherent optical properties (IOPs) is performed by treating the target as absent, consistent with the optically deep water condition. Furthermore, the spectral signal of an underwater target attenuates progressively with increasing depth. When a target composed of specific materials reaches a certain critical depth, its spectral signature becomes nearly indistinguishable from that of the surrounding water. This depth is defined as the target saturation depth. The value of the target saturation depth depends not only on the water’s IOPs but also on the optical and physical properties of the target material itself.
In summary, if the water column absorption coefficient a ( λ ) and backscattering coefficient b b ( λ ) are determined, the optically deep water spectrum r ( λ ) can be accurately reconstructed. Thus, we can also retrieve the absorption coefficient a ( λ ) and backscattering coefficient b b ( λ ) from the optically deep water spectrum r ( λ ) with the IOPs physical model. This process is known as the estimation or retrieval of the water IOPs.

2.2. IOPE-Net

Among the existing studies, the IOPE-Net [16] pioneered the design of an unsupervised estimation network to invert absorption a ( λ ) and backscattering coefficients b b ( λ ) . The network inputs water column spectral data, extracts high-level features through the encoder, and then passes these features into two decoders with identical structures to obtain the absorption a ( λ ) and backscattering b b ( λ ) . These obtained coefficients are then transformed into the reconstructed optically deep water spectra using the simplified bathymetric model for optical deep water in Equation (3). The loss function is calculated based on the input water column and reconstructed optically deep water spectra. Gradient updates are performed to optimize the autoencoder network parameters. After several iterations, when the network converges, the output of two decoders finally represents the estimated absorption a ( λ ) and backscattering b b ( λ ) of the water column.
Although the IOPE-Net retrieved water IOPs through the unsupervised autoencoder structure, some issues still need to be addressed. Analyzing the simplified bathymetric model for optical deep water in Equation (3), the intermediate variable u ( λ ) is determined from the absorption a ( λ ) and backscattering b b ( λ ) , which yields r ( λ ) . In this process, the mapping from u ( λ ) to r ( λ ) has a unique solution within the valid range of values, as u ( λ ) is greater than 0. However, there are multiple sets of solutions when mapping from a ( λ ) and b b ( λ ) to u ( λ ) . For instance, we set λ = 440 nm, when b b ( 440 ) = 0.01 and a ( 440 ) = 0.09 , the value of u ( 440 ) is 0.1. However, when b b ( 440 ) = 0.05 and a ( 440 ) = 0.45 , the value of u ( 440 ) is also 0.1. This suggests that, based solely on the simplified bathymetric model for optical deep water, the relationship between the IOPs coefficients and the optical deep water r ( λ ) results in an inversion that fails to make a unique solution or accurate physical sense. Therefore, physically unique and accurate water IOPs may not be obtained based on the existing IOPE-Net water IOPs estimation model. Thus, in this paper we design a water IOPs estimation network with the IOPs physical model.

3. Materials and Methods

In this section, we present the IOPs physical model and the IOPs estimation network integrating the physical model and deep learning IOPE-IPD. In particular, we explore the IOPs physical model which details the combination of the water IOPs. Since the water IOPs significantly influence the spectral characteristics of underwater targets, we propose the IOPE-IPD. This network aims to physically and accurately estimate four key parameters. The estimated parameters are used to compute water column absorption and backscattering coefficients. The retrieved water spectra are then obtained via the bathymetric model. The framework is illustrated in Figure 1.

3.1. IOPs Physical Model

The IOPs physical model describes the water IOPs, describing how the concentrations of chlorophyll, CDOM, and detrital material influence the IOPs. IOPs describe the light attenuation, including absorption and backscattering, as it propagates through the water column. They determine underwater targets’ visibility and spectral characteristics, which are mainly classified into water absorption and backscattering properties [34,35,36].

3.1.1. Absorption Properties of Water Column

The absorption properties of the water column primarily concern the extent to which various substances absorb light as they propagate through the water. Key factors influencing absorption properties include pure seawater, chlorophyll in phytoplankton, CDOM, and NAP, each characterized by its specific absorption coefficients [17,18,19,20]. Therefore, the spectral absorption properties a ( λ ) ( m 1 ) of the water column are typically divided into four additive components:
a ( λ ) = a w ( λ ) + a ϕ ( λ ) + a n a p ( λ ) + a c d o m ( λ )
where a w ( λ ) , a ϕ ( λ ) , a n a p ( λ ) , and a c d o m ( λ ) represent the absorption properties of pure seawater, chlorophyll, NAP, and CDOM, respectively.
The absorption properties of pure seawater primarily describe the absorption behavior of light at different wavelengths in the absence of dissolved or suspended substances. a w ( λ ) is an empirical coefficient [21], widely used in seawater studies.
Chlorophyll is a major light absorber in the water column, particularly in the visible blue-green (400–500 nm) and red (650–700 nm) bands. The absorption coefficient of chlorophyll is dependent on its concentration and influenced by environmental conditions in the water column. The absorption relationship of chlorophyll for different wavelength bands is calculated as [22]:
a ϕ ( λ ) = ( a 0 ( λ ) + a 1 ( λ ) l n [ a ϕ ( 440 ) ] ) a ϕ ( 440 )
where a 0 ( λ ) and a 1 ( λ ) are empirical coefficients. These empirical coefficients are widely studied and used, and their values apply to other seawater for similar studies. a ϕ ( 440 ) represents the value of a ϕ ( λ ) at the 440 nm band, which can be expressed as [23].
a ϕ ( 440 ) = 0.06 ( c h l a ) 0.65
where c h l a is the chlorophyll a concentration, the first parameter to be estimated, it takes on its range of values [ 0.07 , 50 ] .
CDOM usually originates from the decomposition of plant matter and other organic substances. The absorption of CDOM is primarily concentrated in the UV to blue wavelength band (300–450 nm), which is one of the main factors affecting the water column’s color and light penetration depth. According to Bricaud et al. [25], the absorption relationship of CDOM is calculated as:
a c d o m ( λ ) = a ^ c d o m ( 440 ) e s c d o m ( λ 440 ) a ^ c d o m ( 440 ) = a p ( 440 ) 0.3 + 5.7 s p 1 a p ( 440 ) 0.02 + a p ( 440 )
where s c d o m N ( 0.0176 , 0.002 ) , and s p 1 N ( 0 , 1 ) are two parameters that follow a normal distribution [17]. a p ( 440 ) is the second parameter to be estimated, and it takes on its range of values [ 0.011 , 0.021 ] .
The NAP consists mainly of organic matter and inorganic particulate matter debris, and its absorption properties are widely distributed in visible and near-infrared regions [26]. Its absorption intensity is weaker than that of chlorophyll and CDOM, and its absorption relation is calculated as:
a n a p ( λ ) = a ^ n a p ( 440 ) e s n a p ( λ 440 ) a ^ n a p ( 440 ) = a p ( 440 ) 0.1 + 0.5 s p 2 a p ( 440 ) 0.05 + a p ( 440 )
where s n a p N ( 0.0123 , 0.0013 ) , and s p 2 N ( 0 , 1 ) are two normally distributed parameters, and a ^ n a p ( 440 ) is also nonlinearly expressed by a p ( 440 ) [17].

3.1.2. Backscattering Properties of Water Column

In the water IOPs, the backscattering coefficient b b ( λ ) is primarily determined by three components: pure seawater, detrital matter (DM), and chlorophyll [27]. The backscattering properties of these components collectively influence the direction and intensity of light propagation in water, thereby affecting the visibility and spectral characteristics of underwater targets. The backscattering coefficient b b ( λ ) can be expressed as the sum of three additive components:
b b ( λ ) = b w ( λ ) + b ϕ ( λ ) + b d m ( λ )
where b w ( λ ) , b ϕ ( λ ) , and b d m ( λ ) represent the backscattering properties of pure seawater, chlorophyll, and detrital material, respectively.
The backscattering properties of pure seawater arise mainly from the thermal motion of water molecules and small density fluctuations. Due to the small size of water molecules relative to light wavelength, b w ( λ ) is typically low. It decreases with increasing wavelength in the visible range. b w ( λ ) is an empirical coefficient, widely used in seawater studies [28].
The DM consists of small organic and inorganic particles suspended in the water column. These particles can significantly influence the backscattering of underwater light. The backscattering coefficient of DM generally increases with rising particle concentration. Due to the diverse sizes and shapes of the particles, the backscattering of DM is typically intense, multidirectional, and less dependent on the wavelength of light. Its backscattering properties can be expressed as [29]:
b d m ( λ ) = m d b ^ d m ( 550 ) 550 λ n b ^ d m ( 550 ) = 0.014 × s p 3 × b u 0.766 n = 0.5 + 2 + 1.2 × s p 4 1 + b u 0.5
where s p 3 N ( 0.06 , 0.6 ) , and s p 4 N ( 0 , 1 ) are two parameters that follow a normal distribution. m d represents the mass of debris in the water column [37], the third parameter to be estimated. The parameter b u determines the backscattering properties of a unit mass of detrital material, which is the fourth parameter to be estimated.
Chlorophyll is also an important component of phytoplankton in the water column. Its backscattering coefficient b ϕ ( λ ) can be expressed as [23].
b ϕ ( λ ) = 0.30 550 λ ( c h l a ) 0.62
In an actual water column, the backscattering properties of pure seawater, DM, and chlorophyll typically interact. The backscattering coefficients of these different components are superimposed to form the total backscattering coefficient.
In summary, we can express the absorption coefficient a ( λ ) and the backscattering coefficient b b ( λ ) specifically through the combination of four parameters to be estimated: the chlorophyll a concentration c h l a , the CDOM-specific absorption estimate a p ( 440 ) , the mass of detrital material m d , and the parameter of the backscattering characteristics of a unit mass of detrital material b u .

3.2. IOPs Estimation Network Integrating Physical Model and Deep Learning

The water IOPs are critical for developing underwater hyperspectral target detection and synthetic datasets. Therefore, we will design the IOPE-IPD to accurately estimate the physically meaningful and interpretable absorption and backscattering coefficients, as illustrated in Figure 1.

3.2.1. Principles of Water IOPs Estimation

Based on the IOPs physical model described in the previous subsection, we represent the absorption coefficient a ( λ ) and backscattering coefficient b b ( λ ) specifically as a combination of four parameters to be estimated: the chlorophyll a concentration c h l a , the CDOM-specific absorption estimate a p ( 440 ) , the mass of detrital material m d , and the parameter of the backscattering characteristics of a unit mass of detrital material b u . We impose constraints on the representation of a ( λ ) and b b ( λ ) , grounded in the simplified bathymetric model for optical deep water.
Compared with IOPE-Net, our decoder first outputs the four parameters to be estimated, and then, based on the IOPs physical model, integrally represents the absorption coefficient a ( λ ) and the backscattering coefficient b b ( λ ) . The retrieved spectra are obtained using the bathymetric model to optimize the network training. This approach ensures that the absorption and backscattering coefficients derived from the retrieve process are numerically reasonable and physically meaningful, thus avoiding the potential for multiple or meaningless solutions.

3.2.2. Network Architecture

The IOPE-IPD is structured as an autoencoder, as shown in Figure 1. It takes optical deep water spectrum data as input, extracts high-level features through the encoder, and passes these to two decoders with identical structures. The dual parallel decoder generates four parameters: the chlorophyll a concentration c h l a , the CDOM-specific absorption a p ( 440 ) , the mass of detrital material m d , and the parameter of the backscattering characteristics of a unit mass of detrital material b u . Based on the IOPs physical model, the absorption coefficient a ( λ ) and the backscattering coefficient b b ( λ ) are then derived. These coefficients are used to reconstruct the optical deep water spectrum. Based on Equation (3), a hybrid loss function is calculated by comparing the reconstructed spectrum with the input water column spectrum. The network is optimized through gradient updating in an unsupervised way. After several iterations, when the network converges, the output of two decoders finally represents the estimated absorption coefficient a ( λ ) and backscattering coefficient b b ( λ ) of the water column.
The proposed network follows an encoder–decoder architecture designed to estimate the key inherent optical properties of water based on spectral reflectance inputs. The encoder compresses the spectral information into a compact feature representation, while two parallel decoders reconstruct the physical parameters of interest.
(a)
Encoder
The encoder transforms each input spectral profile (1 channel) into a 64-dimensional feature representation through one convolutional layer and two subsequent downsampling blocks. The initial convolutional layer employs a kernel size of 1 × 3 with stride 1 to expand the number of channels from 1 to 16. The following downsampling layers progressively increase the number of feature channels from 16 to 32 and from 32 to 64, respectively, each using a convolutional kernel of size 1 × 3 and stride 2.
After each convolutional operation, batch normalization and ReLU activation are applied to stabilize training and enhance nonlinearity. This hierarchical encoding structure enables the model to effectively capture multi-scale spectral features while maintaining computational efficiency.
(b)
Decoder
The decoder part consists of two independent but structurally identical branches, each responsible for estimating a distinct subset of water optical parameters.
Each decoder contains two upsampling layers, one output convolutional layer, a fully connected layer, and a sigmoid activation function. The upsampling layers progressively expand the feature dimensions from 64 to 32 and 32 to 16 channels, respectively. The output convolutional layer further reduces the channels from 16 to 1, restoring the spectral dimension.
Finally, a fully connected layer maps the output features to two scalar parameters, which are normalized to predefined physical ranges using a sigmoid activation. This design ensures physical consistency and numerical stability of the estimated parameters.
Specifically, the two decoders correspond to different estimated parameters: one for the backscattering characteristics of a unit mass of detrital material b u , and chlorophyll a concentration c h l a , and the other for the DM mass m d and CDOM-specific absorption a p ( 440 ) .
After obtaining the four parameters to be estimated through the autoencoder network, the second half of the IOPs estimation network takes the IOPs physical model to reconstruct the optical deep water spectrum. The absorption and backscattering coefficients of the water column are derived from the four parameters output by the network decoder. These coefficients are then used to reconstruct the optical deep water spectral profile based on the simplified bathymetric model in Equation (3). Additionally, a key contribution of our proposed IOPE-IPD is its ability to jointly integrate the physical model with deep learning.

3.2.3. Loss Function

Due to the challenges in obtaining labels for water column IOPs, we employ an unsupervised training approach based on reconstruction error. The spectral profiles of the water column serve both as input data and as training labels for the network. The reconstruction error is defined as the difference between the reconstructed spectral curve from the IOPE-IPD model output and the water column’s actual input spectra.
e r e c = L ( r ( λ ) , r ( λ ^ ) )
where r ( λ ) , and r ( λ ^ ) reconstructed represent the input water column spectrum and the reconstructed spectral curve, respectively. L ( · ) denotes the loss function.
The mean squared error loss, denoted as L M S E , is the fundamental metric for prediction and regression problems.
L M S E = r ( λ ) r ^ ( λ ) 2
where · 2 refers to the L2 norm. To emphasize the similarity in the shapes of the curves, we also employ the spectral angle loss function, denoted as L S , to measure the spectral similarity between the input and the reconstructed spectra.
L S = arccos r ( λ ) · r ^ ( λ ) r ( λ ) 2 r ^ ( λ ) 2
The specific composition of the total loss function is
L = L M S E + L S ,
Combining the spectral angle loss with the mean squared error loss simultaneously constrains the amplitude and trend of the reconstructed spectral curves, facilitating global optimization. Using the reconstruction error as the objective function for tuning the neural network parameters ensures that the physical model and deep learning collaboratively guide the IOPE-IPD to autonomously adapt to the training dataset and efficiently learn its parameters in an unsupervised manner.

4. Results

In this section, we systematically validate the effectiveness of the IOPs estimation network by integrating a physical model and deep learning. The experiment utilizes spectral data from both simulated and real-world water columns.

4.1. Experiment Setting

4.1.1. Experiment Dataset

We selected both actual and simulated water columns as the experiment datasets.
Pool dataset: We collected the dataset in the anechoic pool laboratory at the School of Marine Science and Technology, Northwestern Polytechnical University, China. The equipment used is the Gaia Field portable spectral imager (Dualix Spectral Imaging, Wuxi, Jiangsu, China), with a spectral resolution of 2.8 nm and a spectral range of 400–1000 nm, shown in Figure 2. We selected a band range of 400–700 nm, encompassing 120 bands. All collected hyperspectral data were calibrated using a standard whiteboard. The cropped image patches used in the experiments have a spatial size of 100 × 100 pixels. During field data acquisition, the standard whiteboard was placed within the hyperspectral sensor’s field of view and near the data collection area. The land-based target was measured in the same experimental environment used for collecting the pool dataset. The target used in our experiments is a rectangular iron plate with dimensions of 1 m by 2 m. Specifically, the target was placed beside the pool, and its spectral reflectance was obtained using a spectrometer, as shown in Figure 3d. For comparison, we also placed the same target underwater at varying depths (from 0.1 m to 3.1 m) to acquire realistic hyperspectral underwater target data.
Sea dataset: We collected the dataset from the sea near the Tokyo community in Sanya, Hainan Province, China, on 3 October 2021, between 8:00 and 17:00. The equipment used was also the GaiaField portable spectral imager used in the Pool dataset. In the subsequent analysis, we selected a band range of 400–700 nm. The dataset used for analysis consists of cropped hyperspectral patches with a spatial size of 50 × 50 pixels.
Daqing River dataset: This dataset was collected by a UAV equipped with a GaiaSky-mini2 spectral camera over the Daqing River in Xiongan New Area, China, on 10 January 2020, at 11:30 a.m. The flight altitude was 300 m, with clear weather conditions. The spectral range of this equipment is 398–1002 nm, with a spectral resolution of 3.45 nm. The 400–700 nm band range was selected for analysis. The experimental dataset consists of hyperspectral image patches with a spatial size of 50 × 50 pixels. The dataset used for experiments was cropped into image patches of 50 × 50 pixels in spatial size.
Taihu Lake dataset: It was collected by a UAV equipped with a GaiaSky-mini2 spectral camera over the bank of the Taihu Lake in Wuxi, Jiangsu Province, China, in March 2019, under clear weather conditions. The device has a spectral range of 404–1009 nm and a spectral resolution of 3.1 nm. We similarly selected the 404–700 nm band range for subsequent analysis. Each simulated sample has a spatial size of 200 × 200 pixels. The spectral curves of the four actual water datasets mentioned above are shown in Figure 2. To facilitate clearer visualization in the figures, we applied mild Gaussian smoothing during data presentation, which makes the displayed spectral curves appear smooth.
Jerlov dataset: The literature [38] classifies Jerlov water types into open ocean and coastal categories, where the open ocean includes types I, IA, IB, II, and III, and coastal water includes types 1C, 3C, 5C, 7C, and 9C. Type I represents the most transparent seawater, while Type III represents the most turbid open seawater. Coastal water has Type 1C as the clearest and Type 9C as the most turbid. Related studies have analyzed the absorption and backscattering coefficients of six Jerlov water column types (Jerlov IB, Jerlov II, Jerlov III, Jerlov 1C, Jerlov 3C, and Jerlov 5C) for these water types [38,39,40,41]. We selected these six Jerlov water column types as our Jerlov simulation dataset, with spectral bands ranging from 400–700 nm. Figure 3 shows the reflectance, absorption, and backscattering coefficients for different Jerlov types.

4.1.2. Experiment Setting

The experiments were performed on a hardware setup consisting of an Intel Core i9-12900KF CPU, GeForce RTX 3080 Ti GPU, 64 GB RAM, and the Windows 11 operating system. The code was implemented using Python 3.9 and the PyTorch 1.12.1 deep learning framework. The proposed method follows an unsupervised learning framework, and thus the entire dataset is used for both training and testing, with a batch size of 16 and 400 training epochs. The learning rate was set to 0.00001. The Adam optimizer was employed.

4.1.3. Evaluation Metrics

To quantify the variability between the original and reconstructed spectra, we used three metrics: Mean Squared Error (MSE), Relative Error Percentage (REP), and Spectral Angle Distance (SAD).
MSE measures the average difference in values between the reconstructed and original spectra.
M S E = 1 N i = 1 N ( x i x i ^ ) 2
where x i represents the original spectrum, x i ^ is the reconstructed spectrum, and N is the length of the spectral data. A smaller MSE value indicates that the reconstructed spectrum is closer to the original spectrum.
REP expresses the relative error ratio between the reconstructed and original spectra, presented as a percentage. A smaller value indicates a more minor relative error of the reconstructed spectrum.
R E P = 1 N i = 1 N x i x i ^ x i × 100 %
SAD evaluates similarity by calculating the angle between the original and reconstructed spectra. A smaller SAD value indicates that the directions of the original and reconstructed spectra are closer.
S A D = arccos i = 1 N x i x i ^ i = 1 N x i 2 · i = 1 N x i ^ 2

4.2. The Effectiveness of the IOPE-IPD

We evaluated the effectiveness of the IOPE-IPD. This includes validating the simulated water column, analyzing the similarity of original and retrieved water spectra, and assessing the accuracy of the predicted absorption and backscattering coefficients. Additionally, we confirmed the effectiveness of the actual water column to ensure the model’s practicality in real-world conditions.

4.2.1. Water IOPs Estimation for Jerlov Simulated Dataset

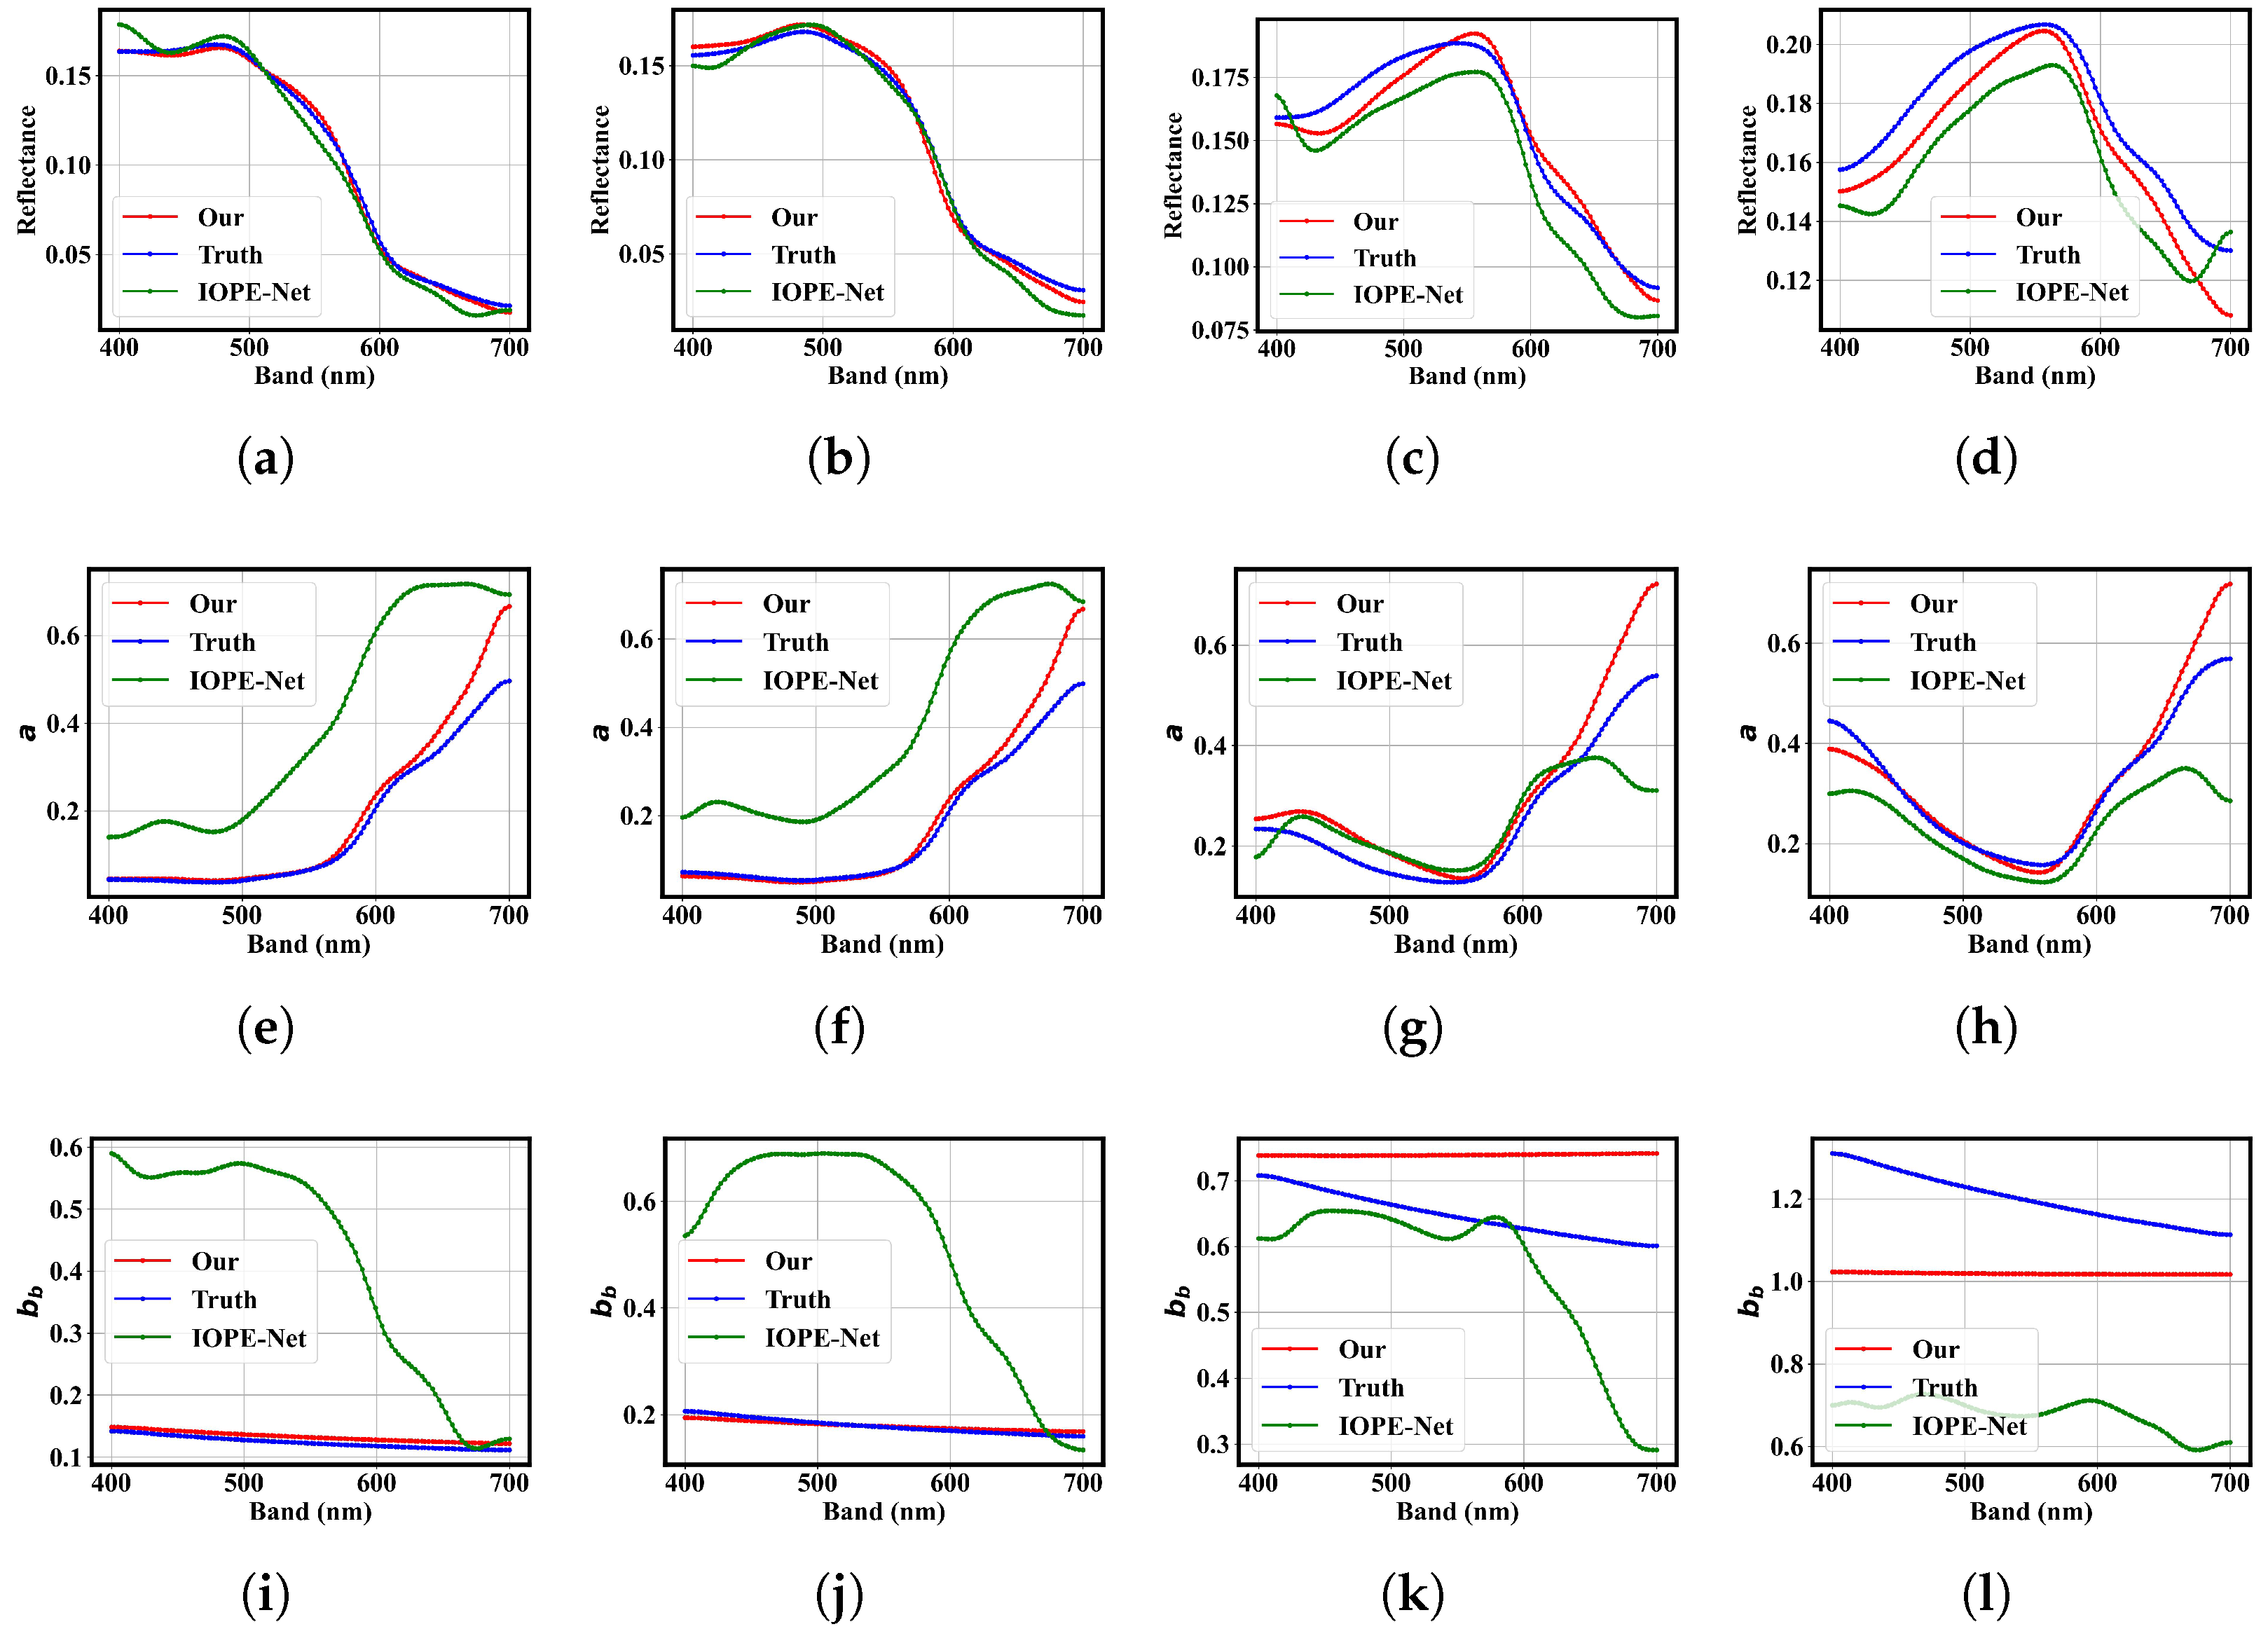
Using the IOPE-IPD proposed in this paper, we retrieved the spectra of six Jerlov water column types. The network takes the water column spectrum as input. The four key IOPs output by the network decoder generate the retrieved spectrum through the IOPs physical model, enabling the calculation of absorption and backscattering coefficients. Figure 4 displays the water IOPs estimation results for the proposed method and the IOPE-Net comparative method on the Jerlov IB, Jerlov II, Jerlov 3C, and Jerlov 5C. These include plots comparing the original and retrieved spectral curves, absorption, and backscattering coefficients. Table 1 presents the estimated results of the decoder outputs for four key IOPs using both Jerlov simulated and actual water datasets. Table 2 demonstrates the variability between the original water spectra, absorption coefficients, and backscattering coefficients and their corresponding retrieved results.
The results show that for the Jerlov simulated dataset, the chlorophyll a concentration c h l a , the CDOM-specific absorption a p ( 440 ) , the mass of detrital material m d , and the parameter of the backscattering characteristics of a unit mass of detrital material b u increase as the water column mass decreases. This aligns with actual water column conditions, demonstrating the effectiveness of the proposed method in estimating water IOPs. Additionally, the retrieved spectra for the six water types closely match the original spectra, particularly for the absorption coefficients. The retrieve errors of the backscattering coefficients increase as water quality deteriorates. Moreover, the REP of all water columns is kept below 0.149, indicating that the retrieve errors remain within a reasonable range.
Figure 4 illustrates that the comparative IOPE-Net method accurately retrieves spectra that closely match the original water column spectra for higher-quality water types, but the retrieve accuracy of IOPE-Net decreases significantly for lower-quality water types, showing a significant deviation between the retrieved absorption and backscattering coefficients and their actual values. This phenomenon aligns with the previous analysis, suggesting that IOPE-Net only relies on the Equation (3) for optical deep water, which lacks constraints on absorption and backscattering coefficients, resulting in multiple solutions and inaccurate retrieve results. In contrast, the method proposed in this paper produces results closer to the actual values and has clear physical significance by effectively constraining the absorption and backscattering coefficients. Table 3 presents the MSE differences between the retrieve spectra of our method and IOPE-Net for the Jerlov simulated dataset, demonstrating that our proposed method outperforms IOPE-Net. The absorption and backscattering coefficients obtained through our proposed method are constrained by the IOPs physical model, imparting greater physical significance to them.

4.2.2. Water IOPs Estimation for Actual Water Datasets

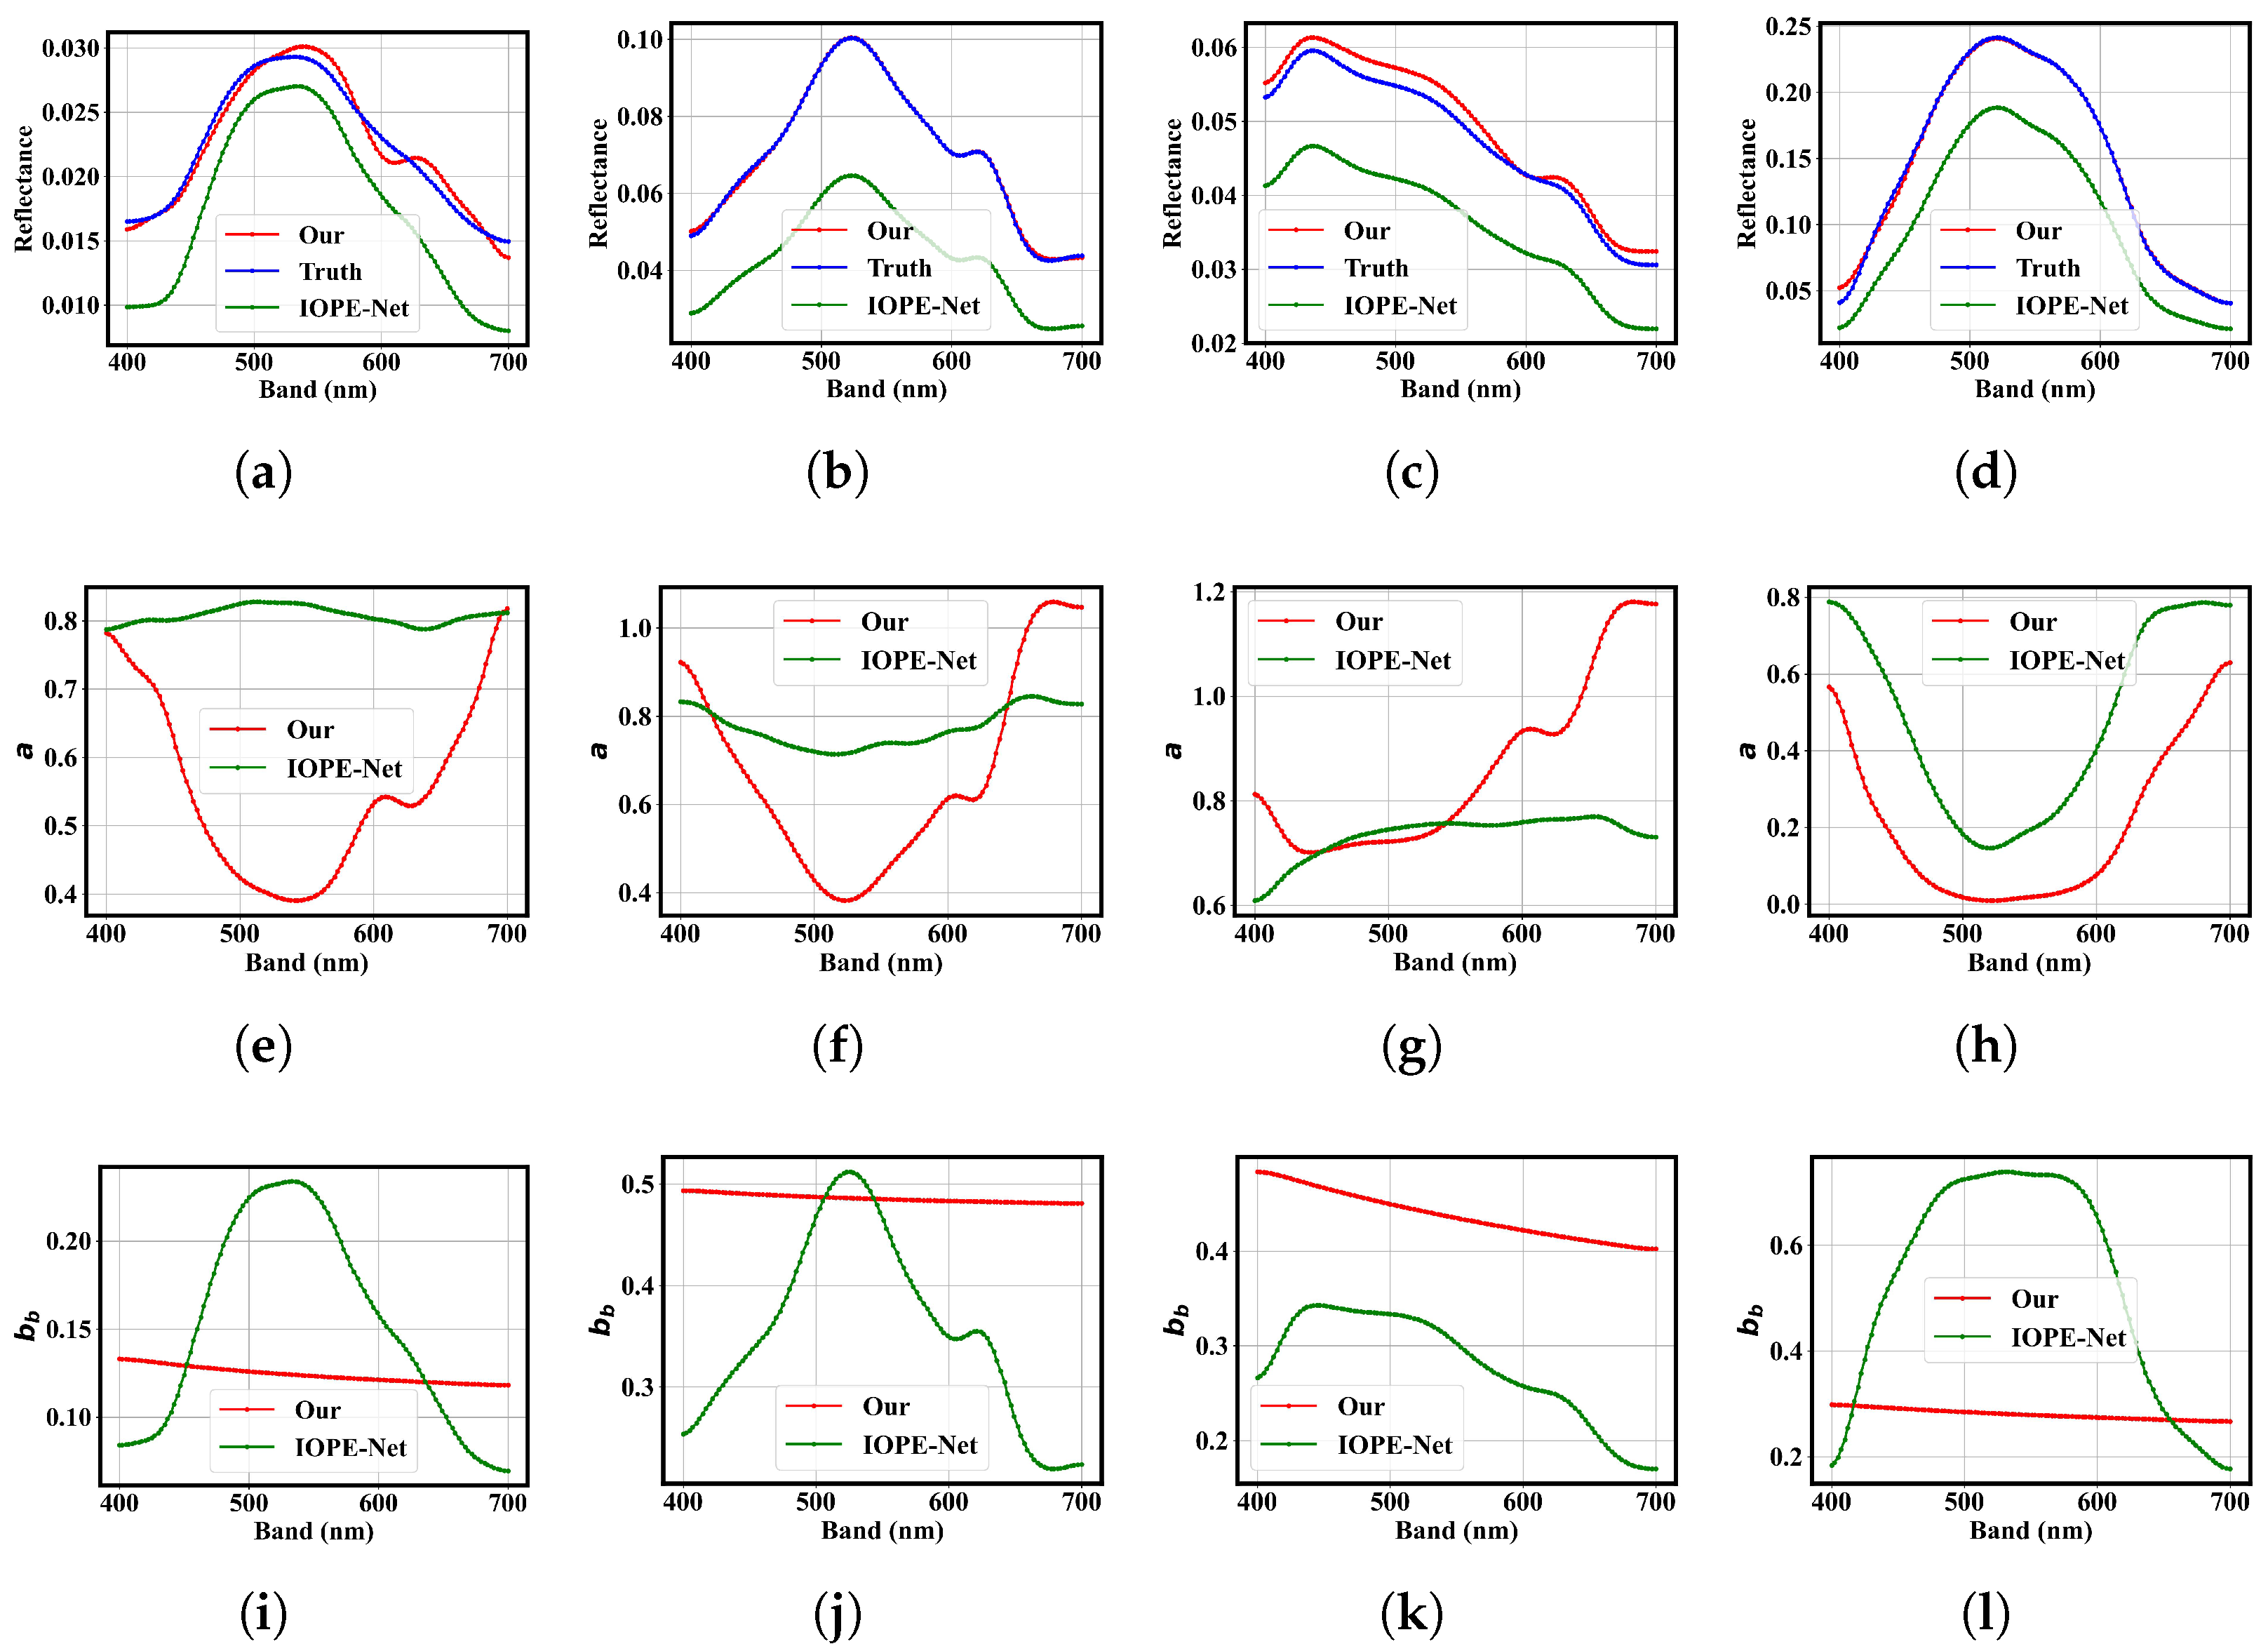
Similar to the process used for the Jerlov simulation dataset, the IOPE-IPD is employed to retrieve the spectra of four actual water datasets. Figure 5 illustrates the water IOPs estimation results for four actual water datasets using our proposed and IOPE-Net comparison methods. Due to the lack of the actual values of absorption and backscattering coefficients, it only provides comparison plots of the original and retrieved spectral curves. Table 4 summarizes the variability between the retrieved and original spectra in the actual water column dataset. The retrieved water spectra of the four actual water columns closely match the original spectra, demonstrating high retrieve accuracy. For instance, The Pool dataset achieves a SAD value of 0.0656 and a REP value of 0.0583. Although the Sea dataset shows a slightly higher MSE of 5.99 × 10 5 , its SAD value of 0.0469 and REP value of 0.0368 still indicate excellent retrieve accuracy.
Table 5 compares the MSE variability between the retrieved and true spectra for our proposed method and IOPE-Net in the actual water datasets. The results reveal that IOPE-Net exhibits poorer retrieve performance, with substantial deviations in the absorption and backscattering coefficients compared to our proposed method. These results underscore the model’s effectiveness in retrieving water IOPs of the actual water datasets. Our proposed method outperforms the IOPE-Net, benefiting from the physical constraints of the IOPs physical model, which enhance the physical meaning of the obtained absorption and backscattering coefficients.

5. Discussion

In this section, the reliability and validity of the estimated IOPs are rigorously validated through multi-level evaluation methods. We also discuss the ablation analysis and the time consumption analysis of the compared method with our proposed IOPE-IPD.

5.1. Synthesis of Underwater Target Data with Estimated IOPs

To validate the effectiveness of the estimated IOPs, we synthesized underwater target data using the bathymetric model and conducted a detailed analysis. In particular, we first compute the absorption coefficient a ( λ ) and backscattering coefficient b b ( λ ) using the IOPE-IPD. Then we calculate the attenuation coefficients k d ( λ ) , k u c ( λ ) , and k u b ( λ ) based on the Equation (2). Take the above-water target, shown in Figure 3d, and set the target depth H we can generate the corresponding underwater target spectra r ( λ ) using the bathymetric model on the Equation (1).

5.1.1. Comparison of Statistical Features Between Synthetic and Actual Underwater Target

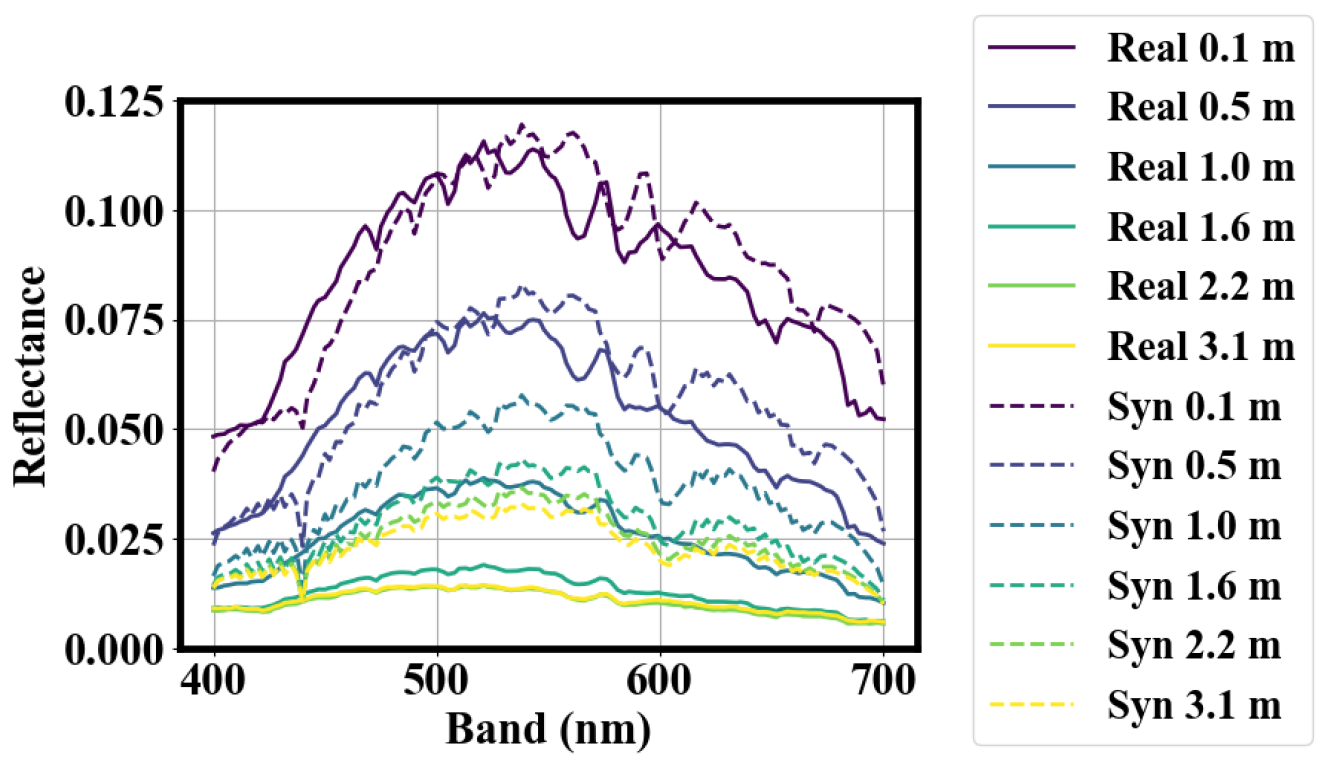
We compare the statistical features of the synthetic underwater targets with those of the actual underwater targets collected in the Pool dataset. This comparison ensures that the synthetic underwater targets are well aligned with the statistical characteristics of actual underwater targets.
Table 6 shows that MSE and SAD increase with depth, indicating that the synthetic data are more similar to the actual data in shallow water regions. In deeper water, the actual data are influenced by complex factors, leading to differences with the synthetic data. The Pearson correlation coefficient decreases with increasing depth, reaching a maximum of 0.8921 at 1.0 m and approaching 0.8008 at greater depths. It indicates the high correlation of spectral features between the synthetic and actual data. The cosine similarity remains close to 0.96 at deeper depths, e.g., 0.9646 at 3.1 m, indicating that the synthetic data retain an overall spectral shape similar to the actual data even in deeper water conditions. These highlight the similarity between the synthetic and actual data regarding spectral features.
In Figure 6 and Figure 7, the comparative analysis of the spectral curves, means, and variances of the synthetic and actual data at different depths demonstrates that the synthetic data effectively reflects the spectral features of the actual data under varying depth conditions. These results further demonstrate the reliability and effectiveness of the IOPs estimated by the proposed IOPE-IPD.

5.1.2. Trend of Spectral Distance with Depth

We analyze the trend of spectral distance with depth between land-based targets and underwater targets at various depths in different environments, aiming to assess the synthetic data’s applicability and realism in various scenarios.
In Figure 8, the “Real” curves represent the spectral distance between the land-based target and the real underwater target at different depths in the Pool dataset. The “Syn” curves represent the spectral distance between the land-based target and synthetic underwater targets generated for the Daqing River, Pool, and Taihu Lake environments. For both real and synthetic data, the spectral distance is generally smaller in shallow water and increases with depth until reaching saturation, reflecting the progressive attenuation and spectral distortion caused by the water column. Notably, while the absolute spectral distances for synthetic data are lower than those for real data in most cases—likely due to simplifications in the simulation process—the overall variation trends with depth are consistent across real and synthetic datasets. This consistency suggests that the synthetic data can capture the primary depth-dependent spectral distortion characteristics of real underwater targets. In particular, in the Pool environment, the synthetic data closely follows the real data in both trend and magnitude, further supporting its validity. The target saturation depths for the iron target in the Daqing River, Pool, and Taihu Lake environments are approximately 1.5 m, 3.0 m, and 1.2 m, respectively, beyond which the spectral signatures of the target converge with those of the surrounding water, making detection increasingly difficult.
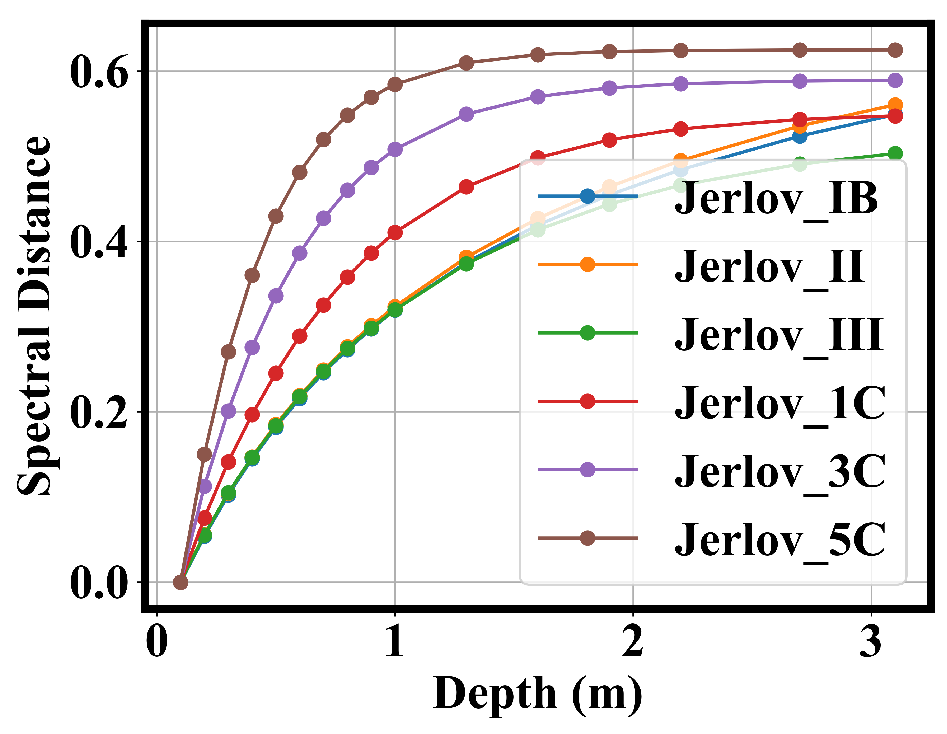
Figure 9 illustrates the trends of spectral distances of the synthetic data on the six Jerlov water datasets. It can be observed that the spectral distances of the synthetic data exhibit varying growth rates with increasing depth across different Jerlov water types. In shallow water regions, the spectral distances of clear water columns increase more slowly, while turbid water columns increase more rapidly. This result aligns with the characteristics of the Jerlov water types, indicating that the synthetic data effectively simulate spectral attenuation features consistent with the properties of the actual water column under varying water quality conditions. The target saturation depths for the iron target are 2.7 m, 2.2 m, and 1.6 m for Jerlov 1C, Jerlov 3C, and Jerlov 5C, respectively, at which point the underwater target spectra converge with the water column spectra. For Jerlov IB, Jerlov II, and Jerlov III, the target saturation depth exceeds 3.1 m. Beyond these depths, deeper targets become increasingly difficult to distinguish from the water column, reducing target detection accuracy.
In summary, the synthetic underwater targets effectively simulate actual underwater targets, as evidenced by comparing spectral distance trends across different environments. This indicates that the IOPs estimated by the proposed IOPE-IPD are highly effective.

5.1.3. Effect of Water Quality and Target Depth on Spectral Variation

To demonstrate the effectiveness of IOPE-IPD, we also examine the effects of water quality and target depth on the spectral changes of underwater targets. By comparing the trends of underwater target synthetic data across the Jerlov water type in Figure 10 and four actual water types in Figure 11, we first analyze the effect of water quality on spectral attenuation. As water quality deteriorates and the water column becomes more turbid, spectral attenuation increases. This phenomenon aligns with the backscattering and absorption effects of particles and dissolved matter in water. Under poorer water quality conditions, the light propagation distance is reduced, causing the underwater target spectra to converge with the water background spectra rapidly. For example, the synthetic dataset exhibits significant spectral attenuation in the Jerlov II, Jerlov IB, and Jerlov 3C. The model accurately simulates spectral variations under more transparent and turbid water conditions.
We then analyze the effect of underwater target depth on spectral attenuation. Figure 10 and Figure 11 show that as the target depth increases, the spectral intensity decreases. The spectral attenuation also becomes more significant. This trend is especially noticeable in the Daqing River, Taihu Lake, and Pool actual water environments shown in Figure 11. However, some anomalies warrant further explanation. For instance, in the Jerlov 3C and Jerlov 5C water environments, as well as the Sea dataset, the spectral reflectance of the underwater targets increases with depth. It occurs because the background spectral reflectance of these water columns is higher than that of the land-based target. As the depth increases, the underwater target spectra converge with the water column spectra, increasing spectral reflectance. A similar phenomenon is observed in the 400–550 nm bands of Jerlov II, Jerlov IB, where the water column reflectance exceeds that of the land-based target reflectance. Despite these anomalies, the overall trend remains consistent: the worse the water quality, the faster the spectral attenuation, and the deeper the target, the more significant the spectral attenuation.
By analyzing the spectral characteristics under varying water quality and depth conditions, we validate the IOPE-IPD’s performance in diverse scenarios. This analysis also highlights the spectral attenuation trend and the effects of depth changes in complex water environments.

5.2. Ablation Analysis

To further highlight the role of physical constraints in the proposed IOPE-IPD model, we discuss the comparison between IOPE-IPD and IOPE-Net as an implicit ablation study. When the physical model constraint is removed, the proposed framework degenerates into IOPE-Net, which functions as a purely data-driven model. The comparison results presented in Table 3 and Table 5, as well as Figure 4 and Figure 5, clearly demonstrate that incorporating physical priors effectively suppresses unrealistic estimations of IOPs. This integration constrains the inversion space to physically meaningful regions, thereby enhancing the stability and reliability of parameter retrieval. Consequently, the physical interpretability introduced by the model not only improves estimation accuracy but also ensures the physical consistency of the retrieved IOPs compared with conventional data-driven approaches.

5.3. Time Consumption

Table 7 presents the computational time consumption of the proposed model compared with IOPE-Net on five datasets. Although the inference time of our model is slightly higher than that of IOPE-Net, it remains within a reasonable range for practical applications. Specifically, the average processing times are 0.1823 s, 0.1925 s, 0.1963 s, 0.1871 s, and 0.1911 s for the Jerlov IB, Pool, Taihu Lake, Daqing River, and Sea datasets, respectively.
Combining these results with the accuracy performance reported in Table 3 and Table 5 and Figure 4 and Figure 5, it is evident that the proposed method achieves substantially higher estimation accuracy than IOPE-Net across all datasets. This trade-off indicates that a slight increase in computational time is well justified by the significant improvement in the precision of water IOP estimation. Therefore, the proposed method demonstrates both competitive efficiency and superior accuracy, supporting its applicability in near-real-time underwater spectral analysis.

6. Conclusions

In this paper, we propose IOPE-IPD, a novel network for estimating water inherent optical properties from hyperspectral data by combining physical modeling with deep learning. By introducing an IOPs physical model describing how chlorophyll concentrations, CDOM, NAP, and DM influence the absorption and backscattering coefficients, we enabled physically interpretable and accurate estimation of key parameters. The dual-decoder architecture of IOPE-IPD, together with a consistency-constrained retrieve process using a bathymetric model, ensures both precision and effectiveness. Extensive experiments across actual and simulated aquatic environments demonstrate the robustness, generalizability, and superior performance of our approach.
In future work, we aim to extend our method to estimate water inherent optical properties directly from satellite remote sensing data, enabling large-scale and efficient monitoring of aquatic environments. We also plan to further investigate the model’s performance in highly turbid and optically complex waters to enhance its robustness and applicability. Furthermore, we fully acknowledge the importance of extending this framework to stratified water conditions. Specifically, we plan to (1) incorporate depth-dependent IOP parameterization into the network to enable layer-wise estimation of absorption and backscattering coefficients, and (2) analyze the influence of the vertical distribution of chlorophyll and other optically active substances on spectral reflectance through simulated multi-layer radiative transfer modeling. These enhancements will further improve the physical interpretability and generalization ability of the proposed model under more complex aquatic environments.

Author Contributions

Conceptualization, Q.L.; methodology, Q.L. and M.G.; software, Q.L.; validation, Q.L., M.G., and M.Z.; formal analysis, Q.L., J.W. and M.Z.; investigation, Q.L., M.G. and M.Z.; resources, Q.L., M.G., and M.Z.; data curation, J.C., M.G., J.W. and M.Z.; writing—original draft preparation, Q.L.; writing—review and editing, J.C., Q.L., M.G. and J.L.; visualization, J.C.; supervision, J.L.; project administration, J.C.; funding acquisition, J.L. All authors have read and agreed to the published version of the manuscript.

Funding

This work was supported in part by the Science and Technology on Electromechanical Dynamic Control Laboratory under Grant 6142601240202.

Institutional Review Board Statement

Not applicable.

Informed Consent Statement

Not applicable.

Data Availability Statement

The synthetic dataset is available at: https://github.com/lq132069/HUTSD.git, accessed on 22 October 2025.

Conflicts of Interest

The authors declare no conflicts of interest.

References

  1. Mullen, A.D.; Treibitz, T.; Roberts, P.L.; Jaffe, J.S. An Underwater Microscope for In Situ Imaging of Seafloor Organism. In Novel Techniques in Microscopy; Optica Publishing Group: Washington, DC, USA, 2017. [Google Scholar]
  2. Wang, W.; Wang, Y. Underwater target detection system based on YOLO v4. In Proceedings of the 2021 2nd International Conference on Artificial Intelligence and Information Systems, Chongqing, China, 28–30 May 2021; pp. 1–5. [Google Scholar]
  3. Kang, K.K.K.; Hoekstra, M.; Foroutan, M.; Chegoonian, A.M.; Zolfaghari, K.; Duguay, C.R. Operating procedures and calibration of a hyperspectral sensor onboard a remotely piloted aircraft system for water and agriculture monitoring. In Proceedings of the IGARSS 2019—2019 IEEE International Geoscience and Remote Sensing Symposium, Yokohama, Japan, 28 July–2 August 2019; pp. 9200–9203. [Google Scholar]
  4. Li, Q.; Li, J.; Li, T.; Li, Z.; Zhang, P. Spectral–spatial depth-based framework for hyperspectral underwater target detection. IEEE Trans. Geosci. Remote Sens. 2023, 61, 4204615. [Google Scholar] [CrossRef]
  5. Li, Q.; Li, J.; Li, T.; Feng, Y. A Joint Framework for Underwater Hyperspectral Image Restoration and Target Detection with Conditional Diffusion Model. IEEE J. Sel. Top. Appl. Earth Obs. Remote Sens. 2024, 17, 17263–17277. [Google Scholar] [CrossRef]
  6. Fu, X.; Shang, X.; Sun, X.; Yu, H.; Song, M.; Chang, C.I. Underwater hyperspectral target detection with band selection. Remote Sens. 2020, 12, 1056. [Google Scholar] [CrossRef]
  7. Liu, T.; Zhang, M.; Gong, M.; Zhang, Q.; Jiang, F.; Zheng, H.; Lu, D. Commonality feature representation learning for unsupervised multimodal change detection. IEEE Trans. Image Process. 2025, 34, 1219–1233. [Google Scholar] [CrossRef]
  8. Li, J.; Zheng, K.; Liu, W.; Li, Z.; Yu, H.; Ni, L. Model-guided coarse-to-fine fusion network for unsupervised hyperspectral image super-resolution. IEEE Geosci. Remote Sens. Lett. 2023, 20, 5508605. [Google Scholar] [CrossRef]
  9. Liu, T.; Xu, J.; Lei, T.; Wang, Y.; Du, X.; Zhang, W.; Lv, Z.; Gong, M. AEKAN: Exploring Superpixel-based AutoEncoder Kolmogorov-Arnold Network for Unsupervised Multimodal Change Detection. IEEE Trans. Geosci. Remote Sens. 2024, 63, 5601114. [Google Scholar] [CrossRef]
  10. Li, J.; Zheng, K.; Gao, L.; Ni, L.; Huang, M.; Chanussot, J. Model-informed multistage unsupervised network for hyperspectral image super-resolution. IEEE Trans. Geosci. Remote Sens. 2024, 62, 5516117. [Google Scholar] [CrossRef]
  11. Li, S.; Song, W.; Fang, L.; Chen, Y.; Ghamisi, P.; Benediktsson, J.A. Deep learning for hyperspectral image classification: An overview. IEEE Trans. Geosci. Remote Sens. 2019, 57, 6690–6709. [Google Scholar] [CrossRef]
  12. Guerri, M.F.; Distante, C.; Spagnolo, P.; Bougourzi, F.; Taleb-Ahmed, A. Deep learning techniques for hyperspectral image analysis in agriculture: A review. ISPRS Open J. Photogramm. Remote Sens. 2024, 12, 100062. [Google Scholar] [CrossRef]
  13. Lv, Z.; Zhang, P.; Xie, L.; Benediktsson, J.A.; Lei, T. Iterative Sample Generation and Balance Approach for Improving Hyperspectral Remote Sensing Imagery Classification With Deep Learning Network. IEEE Trans. Geosci. Remote Sens. 2024, 62, 5524413. [Google Scholar] [CrossRef]
  14. LeCun, Y.; Bengio, Y.; Hinton, G. Deep learning. Nature 2015, 521, 436–444. [Google Scholar] [CrossRef] [PubMed]
  15. Gillis, D.B. An underwater target detection framework for hyperspectral imagery. IEEE J. Sel. Top. Appl. Earth Obs. Remote Sens. 2020, 13, 1798–1810. [Google Scholar] [CrossRef]
  16. Qi, J.; Xue, W.; Gong, Z.; Zhang, S.; Yao, A.; Zhong, P. Hybrid sequence networks for unsupervised water properties estimation from hyperspectral imagery. IEEE J. Sel. Top. Appl. Earth Obs. Remote Sens. 2021, 14, 3830–3845. [Google Scholar] [CrossRef]
  17. Babin, M.; Stramski, D.; Ferrari, G.M.; Claustre, H.; Bricaud, A.; Obolensky, G.; Hoepffner, N. Variations in the light absorption coefficients of phytoplankton, nonalgal particles, and dissolved organic matter in coastal waters around Europe. J. Geophys. Res. Oceans 2003, 108, 3211. [Google Scholar] [CrossRef]
  18. Prieur, L.; Sathyendranath, S. An optical classification of coastal and oceanic waters based on the specific spectral absorption curves of phytoplankton pigments, dissolved organic matter, and other particulate materials. Limnol. Oceanogr. 1981, 26, 671–689. [Google Scholar] [CrossRef]
  19. Roesler, C.S.; Perry, M.J.; Carder, K.L. Modeling in situ phytoplankton absorption from total absorption spectra in productive inland marine waters. Limnol. Oceanogr. 1989, 34, 1510–1523. [Google Scholar] [CrossRef]
  20. Carder, K.L.; Hawes, S.; Baker, K.; Smith, R.; Steward, R.; Mitchell, B. Reflectance model for quantifying chlorophyll a in the presence of productivity degradation products. J. Geophys. Res. Oceans 1991, 96, 20599–20611. [Google Scholar] [CrossRef]
  21. Pope, R.M.; Fry, E.S. Absorption spectrum (380–700 nm) of pure water. II. Integrating cavity measurements. Appl. Opt. 1997, 36, 8710–8723. [Google Scholar] [CrossRef]
  22. Lee, Z. Visible-Infrared Remote Sensing Model and Applications for Ocean Waters. Ph.D. Thesis, University of South Florida, Tampa, FL, USA, 1994. [Google Scholar]
  23. Gordon, H.R.; Morel, A.Y. Remote Assessment of Ocean Color for Interpretation of Satellite Visible Imagery: A Review; Springer: Berlin/Heidelberg, Germany, 2012. [Google Scholar]
  24. Kirk, J.T. Light and Photosynthesis in Aquatic Ecosystems; Cambridge University Press: Cambridge, UK, 1994. [Google Scholar]
  25. Bricaud, A.; Morel, A.; Prieur, L. Absorption by dissolved organic matter of the sea (yellow substance) in the UV and visible domains. Limnol. Ocean. 1981, 26, 43–53. [Google Scholar] [CrossRef]
  26. Babin, M.; Stramski, D. Light absorption by aquatic particles in the near-infrared spectral region. Limnol. Oceanogr. 2002, 47, 911–915. [Google Scholar] [CrossRef]
  27. Babin, M.; Morel, A.; Fournier-Sicre, V.; Fell, F.; Stramski, D. Light scattering properties of marine particles in coastal and open ocean waters as related to the particle mass concentration. Limnol. Oceanogr. 2003, 48, 843–859. [Google Scholar] [CrossRef]
  28. Morel, A. Optical properties of pure water and pure seawater. In Optical Aspects of Oceanography; University of Paris: Paris, France, 1974. [Google Scholar]
  29. IOCCG Working Group. Remote Sensing of Inherent Optical Properties: Fundamentals, Tests of Algorithms, and Applications; International Ocean Colour Coordinating Group (IOCCG): Dartmouth, NS, Canada, 2006. [Google Scholar]
  30. Werdell, P.J.; McKinna, L.I.; Boss, E.; Ackleson, S.G.; Craig, S.E.; Gregg, W.W.; Lee, Z.; Maritorena, S.; Roesler, C.S.; Rousseaux, C.S.; et al. An overview of approaches and challenges for retrieving marine inherent optical properties from ocean color remote sensing. Prog. Oceanogr. 2018, 160, 186–212. [Google Scholar] [CrossRef] [PubMed]
  31. Lee, Z.; Carder, K.L.; Mobley, C.D.; Steward, R.G.; Patch, J.S. Hyperspectral remote sensing for shallow waters: 2. Deriving bottom depths and water properties by optimization. Appl. Opt. 1999, 38, 3831–3843. [Google Scholar] [CrossRef] [PubMed]
  32. Chen, J.; Quan, W.; Cui, T.; Song, Q.; Lin, C. Remote sensing of absorption and scattering coefficient using neural network model: Development, validation, and application. Remote Sens. Environ. 2014, 149, 213–226. [Google Scholar] [CrossRef]
  33. Lee, Z.; Carder, K.L.; Mobley, C.D.; Steward, R.G.; Patch, J.S. Hyperspectral remote sensing for shallow waters: I. A semianalytical model. Appl. Opt. 1998, 37, 6329–6338. [Google Scholar] [CrossRef]
  34. Wu, Z.; Tao, B.; Mao, Z.; Huang, H. Bathymetry Retrieval Algorithm Based on Hyperspectral Features of Pure Water Absorption From 570 to 600 nm. IEEE Trans. Geosci. Remote Sens. 2023, 61, 5503219. [Google Scholar] [CrossRef]
  35. Gillis, D.B.; Bowles, J.H.; Montes, M.J.; Miller, W.D. Deriving bathymetry and water properties from hyperspectral imagery by spectral matching using a full radiative transfer model. Remote Sens. Lett. 2020, 11, 903–912. [Google Scholar] [CrossRef]
  36. Holtrop, T.; Van Der Woerd, H.J. HYDROPT: An Open-Source Framework for Fast Inverse Modelling of Multi- and Hyperspectral Observations from Oceans, Coastal and Inland Waters. Remote Sens. 2021, 13, 3006. [Google Scholar] [CrossRef]
  37. Loisel, H.; Nicolas, J.M.; Sciandra, A.; Stramski, D.; Poteau, A. Spectral dependency of optical backscattering by marine particles from satellite remote sensing of the global ocean. J. Geophys. Res. Oceans 2006, 111, C09024. [Google Scholar] [CrossRef]
  38. Jerlov, N.G. Marine Optics; Elsevier: Amsterdam, The Netherlands, 1976. [Google Scholar]
  39. Jerlov, N. Optical Studies of Ocean Waters; Reports of the Swedish Deep-Sea Expedition, 1947–1948; Volume 3: Physics and chemistry; Elanders boktryckeri: Mölndal, Sweden, 1957. [Google Scholar]
  40. Williamson, C.A.; Hollins, R.C. Measured IOPs of Jerlov water types. Appl. Opt. 2022, 61, 9951–9961. [Google Scholar] [CrossRef]
  41. Berman, D.; Treibitz, T.; Avidan, S. Diving into haze-lines: Color restoration of underwater images. In Proceedings of the 2017 British Machine Vision Conference (BMVC), London, UK, 4–7 September 2017; Volume 1, p. 2. [Google Scholar]
Figure 1. The framework of IOPE-IPD. First, the IOPE-IPD extracts high-level features from the optical deep water spectrum through the encoder. The two decoders then output four key IOPs to be estimated. Based on the IOPs physical model, the absorption coefficient a ( λ ) and the backscattering coefficient b b ( λ ) are represented. The retrieved spectra are obtained using the bathymetric model to optimize the network training.
Remotesensing 17 03546 g001
Figure 2. Spectral curves of the water column of the actual datasets. (a) Taihu Lake. (b) Pool. (c) Sea. (d) Daqing River.
Remotesensing 17 03546 g002
Figure 3. Spectral curves of the water column of the Jerlov dataset and land-based target. (a) Spectral profile. (b) absorption. (c) backscattering. (d) land-based target.
Remotesensing 17 03546 g003
Figure 4. Estimated water IOPs for the Jerlov dataset. (ad) Reflectance; (eh) absorption coefficients; (il) backscattering coefficients for Jerlov IB, Jerlov II, Jerlov 3C, and Jerlov 5C.
Remotesensing 17 03546 g004
Figure 5. Estimated water quality parameters for the actual water dataset. (ad) Reflectance; (eh) absorption coefficients; (il) backscattering coefficients for Pool, Taihu Lake, Daqing River, and Sea.
Remotesensing 17 03546 g005
Figure 6. Comparison of spectral curves of synthesized data and actual data at different depths.
Remotesensing 17 03546 g006
Figure 7. Comparison of statistical features. (a) mean of actual dataset. (b) mean of synthetic dataset. (c) variance of actual dataset. (d) variance of synthetic dataset at different depths.
Remotesensing 17 03546 g007
Figure 8. Trend of spectral distances on four actual datasets. (a) Daqing River. (b) Pool. (c) Taihu Lake. (d) Sea.
Remotesensing 17 03546 g008
Figure 9. Trends of spectral distances on six Jerlov water datasets.
Remotesensing 17 03546 g009
Figure 10. Trend of synthetic data with water quality and target depth on the Jerlov dataset. (a) Jerlov IB. (b) Jerlov II. (c) Jerlov 3C. (d) Jerlov 5C. In figure (a), at 400 nm, the brown line represents 3.1 m, and the blue line represents 0.1 m. From top to bottom, the remaining colored lines correspond to depths of 2.7 m, 2.2 m, 1.9 m, 1.6 m, 1.3 m, 1.0 m, and 0.1–1.0 m.
Remotesensing 17 03546 g010
Figure 11. Trend of synthetic data with target depth on four actual datasets (a) Pool. (b) Sea. (c) Daqing River. (d) Taihu Lake. In figure (a), at 550 nm, the brown line represents 3.1 m, and the blue line represents 0.1 m. From bottom to top, the remaining colored lines correspond to depths of 2.7 m, 2.2 m, 1.9 m, 1.6 m, 1.3 m, 1.0 m, and 0.1–1.0 m.
Remotesensing 17 03546 g011
Table 1. Retrieve of Water IOPs on Experimental Datasets.
Data b u chl a m d a p ( 440 )
Jerlov IB5.55970.308839.75100.0097
Jerlov II7.51680.410443.25540.0133
Jerlov III13.66592.396050.44910.0166
Jerlov 1C14.72614.519276.09420.0223
Jerlov 3C20.47917.476086.17400.0244
Jerlov 5C18.00526.6956131.44490.0520
Pool10.870150.001122.14010.1123
Taihu Lake16.236341.504367.21840.0707
Daqing River4.696252.0120155.51730.0263
Sea8.64546.678361.90410.1175
Table 2. Difference Between Retrieve Spectra and True Spectra on Jerlov Dataset.
DataMetricsSpectral ProfileAbsorptionBackscattering
Jerlov IBMSE0.000020.002730.00009
SAD0.03400.10920.0144
REP0.04760.11300.0752
Jerlov IIMSE0.000030.002650.00004
SAD0.04050.11840.0350
REP0.05380.11230.0299
Jerlov IIIMSE0.000030.003050.00128
SAD0.03970.10280.0433
REP0.04170.13770.1191
Jerlov 1CMSE0.000050.004080.00674
SAD0.04570.09450.0408
REP0.04360.21680.1895
Jerlov 3CMSE0.000050.004420.00944
SAD0.04340.09260.0520
REP0.03930.18340.1434
Jerlov 5CMSE0.000130.002300.03643
SAD0.03710.12360.0483
REP0.06040.07880.1493
Table 3. MSE of Retrieved Spectra and True Spectra for Different Methods on Jerlov Dataset. Bold Indicates the Best Values.
DataMethodSpectral ProfileAbsorptionBackscattering
Jerlov IBOur0.000020.002730.00009
IOPE-Net0.000300.076820.12550
Jerlov IIOur0.000030.002650.00004
IOPE-Net0.000390.067850.16518
Jerlov IIIOur0.000030.003050.00128
IOPE-Net0.000380.013760.05779
Jerlov 1COur0.000050.004080.00674
IOPE-Net0.000410.016550.06195
Jerlov 3COur0.000050.004420.00944
IOPE-Net0.000380.008100.02083
Jerlov 5COur0.000130.002300.03643
IOPE-Net0.000570.013380.28455
Table 4. Difference Between Retrieved Spectra and True Spectra on Actual Water Datasets.
DataMSESADREP
Pool 2.29 × 10 6 0.06560.0583
Taihu Lake 1.76 × 10 6 0.01820.0071
Daqing River 4.85 × 10 6 0.02460.0424
Sea 5.99 × 10 5 0.04690.0368
Table 5. MSE of Retrieved Spectra and True Spectra for Different Methods on Actual Water Datasets. Bold indicates the best values.
DataMethodSpectral Profile ( × 10 6 )
PoolOur2.29
IOPE-Net40.88
Taihu LakeOur1.76
IOPE-Net766.97
Daqing RiverOur4.85
IOPE-Net130.85
SeaOur59.9
IOPE-Net2177.57
Table 6. Average Spectral Analysis of Actual and Synthetic Data at Different Depths on Pool Dataset.
DepthMSESADREPPearsonCosine
0.1 m0.000100.11090.11520.88780.9760
0.5 m0.000060.14050.14030.87950.9725
1.0 m0.000150.14340.29600.89210.9754
1.6 m0.000240.14950.50180.85760.9684
2.2 m0.000200.16040.53220.80080.9597
3.1 m0.000150.14600.48610.80760.9646
Table 7. The time (s) Consumption of Compared Algorithm on the Experimental Datasets.
DataIOPE-NetOur
Jerlov IB0.12620.1823
Pool0.12210.1925
Taihu Lake0.12460.1963
Daqing River0.12130.1871
Sea0.12110.1911
Disclaimer/Publisher’s Note: The statements, opinions and data contained in all publications are solely those of the individual author(s) and contributor(s) and not of MDPI and/or the editor(s). MDPI and/or the editor(s) disclaim responsibility for any injury to people or property resulting from any ideas, methods, instructions or products referred to in the content.